


Bahasa
Halaman
Hukum

Journal of PathologyJ Pathol 2008; 214: 347–356Published online 8 November 2007 in Wiley InterScience(www.interscience.wiley.com) DOI: 10.1002/path.2267
Original Paper
Expression signatures in lung cancer reveal a profile forEGFR-mutant tumours and identify selective PIK3CAoverexpression by gene amplification
B Angulo,1† A Suarez-Gauthier,1,2† F Lopez-Rios,2 PP Medina,1 E Conde,2 M Tang,1 G Soler,3
A Lopez-Encuentra,4 JC Cigudosa3 and M Sanchez-Cespedes1*1Lung Cancer Group, Spanish National Cancer Centre (CNIO), 28029 Madrid, Spain2Pathology Department, Hospital Universitario 12 de Octubre, Madrid, Spain3Molecular Cytogenetics Group, Spanish National Cancer Centre (CNIO), 28029 Madrid, Spain4Pulmonary Department, Hospital Universitario 12 de Octubre, Madrid, Spain
*Correspondence to:M Sanchez-Cespedes, LungCancer Group, Spanish NationalCancer Centre (CNIO), 28029Madrid, Spain.E-mail: [email protected]
†These authors contributedequally to this work.
No conflicts of interest weredeclared.
Received: 26 July 2007Revised: 4 September 2007Accepted: 11 September 2007
AbstractThe development of targeted therapies creates a need to discriminate tumours accuratelyby their histological and genetic characteristics. Here, we aim to identify gene expressionprofiles and single markers that recapitulate the pathological and genetic background ofnon-small cell lung cancer (NSCLC). We performed cDNA microarray analysis on a seriesof 69 NSCLCs, with known mutation status for important genes, and six normal lung tissues.Unsupervised cluster analysis segregated normal lungs from lung tumours and lung tumoursaccording to their histopathology and the presence of EGFR mutations. Several transcriptswere highly overexpressed (by ∼20 times) in squamous cell carcinomas (SCCs) relative toadenocarcinomas (ACs) and confirmed by immunohistochemistry in an independent cohortof 75 lung tumours. Expression of 13 genes constituted the most prominent hallmarks ofEGFR-mutant tumours, including increased levels of proline dehydrogenase (PRODH ) anddown-regulation of X-box binding protein 1 (XBP1). No genes were differentially expressed,with a fold change ≥4 or ≤0.25 and a significance level of 5% false-discovery rate, intumours carrying mutations of TP53 or KRAS. In addition, we organized gene expressiondata by the position of each gene in the chromosome and observed a cluster of highlyexpressed genes in chromosome 3q, including PIK3CA, that was characteristic of SCCs.FISH analysis demonstrated a strong statistically significant association between increasedlevels of PIK3CA expression in these tumours and gene amplification (p < 0.0001; t -test). Inconclusion, histopathological phenotypes and, likely, the presence of EGFR mutations conferlung tumours with a marked pattern of gene expression. Moreover, our cDNA microarrayanalysis identified increased PIK3CA expression due to gene amplification in lung squamouscell carcinomas: this may represent a marker of sensitivity to therapy with PI3K inhibitors.Copyright 2007 Pathological Society of Great Britain and Ireland. Published by JohnWiley & Sons, Ltd.
Keywords: lung cancer; cDNA microarrays; PIK3CA; EGFR
Introduction
Current efforts are concentrated on developing drugsthat specifically target abnormal regulatory pathwaysof cancer cells, such as signal transduction, cell cycle,DNA repair, and apoptosis [1]. Alterations in thesecell processes are driven by the activation/inactivationof key genes, essential point controllers, which con-stitute the molecular targets for the design of suchspecific therapies. Therefore, it is becoming increas-ingly important to identify the complete catalogue ofgenes that are altered in cancer and to discriminatetumours accurately on the basis of their genetic back-ground.
Lung tumours carry alterations at known genes —some of them highly specific to the tumour histol-ogy — which are important for the pathogenesis ofthis type of cancer [1–6]. The recent identification ofactivating somatic mutations in the EGFR gene in lungadenocarcinomas and their proposed relevance in pre-dicting the response to tyrosine kinase inhibitors ofEGFR exemplify the impact of understanding all thechanges underlying tumour development.
On the other hand, high-throughput approaches forevaluating patterns of gene expression allow investiga-tors to categorize tumours sharing common character-istics (eg specific outcome, tumour histology). In thelung, expression profiling discriminates normal lung
Copyright 2007 Pathological Society of Great Britain and Ireland. Published by John Wiley & Sons, Ltd.www.pathsoc.org.uk
348 B Angulo et al
from lung tumours, as well as the distinct lung tumourhistologies and clinical entities [7–16]. Global anal-ysis of gene expression using microarrays or serialanalysis of gene expression (SAGE) may also serveto correlate gene-expression and gene-alteration pat-terns, thereby serving as a tool for the discrimina-tion of patients for targeted therapies. In lung cancer,there is little information regarding the comparison ofgene mutations and global patterns of gene expression[15,16].
In the work reported here, we performed global anal-ysis of gene expression to identify expression profilesand single markers that recapitulate the pathologicaland genetic background of non-small cell lung cancer(NSCLC).
Materials and methods
Patient selection and DNA/RNA extraction
Tissues were provided by the CNIO Tumour BankNetwork, in collaboration with Spanish hospitals. Thestudy was approved by the institutional review boardsand ethics committees, and informed consent wasobtained from each patient. Lung tumours from 69patients with available good-quality RNA were usedfor the cDNA microarray analysis. An additional set of75 lung tumours was used for immunohistochemicalvalidation of the microarray observations. Tumourswere reviewed by two pathologists (EC and FL-R)and histologically classified according to the 2004WHO criteria [17]. Pathological characteristics for thetumours included in the cDNA microarrays analysiswere as follows: 30 (44%) adenocarcinomas (ACs);36 (52%) squamous cell carcinomas (SCCs); and three(4%) large cell carcinomas (LCCs). For the validationset we included 75 NSCLCs: 39 (52%) ACs; 29(39%) SCCs; and seven (9%) LCCs. Clinical, smokinghabits, and gender characteristics of the tumours inthe cDNA microarray analysis are summarized inFigure 1. Representative sections from tissues usedfor DNA and RNA extraction were stained withhaematoxylin and eosin (H&E). Freshly frozen tissuefrom tumours was meticulously dissected to ensurethat specimens contained at least 75% tumour cells.The DNA, RNA extraction, and cDNA synthesisprotocols have been described previously [18–20].
cDNA microarray and data analysis
2.5 µg of amplified RNA from each sample was usedfor the cDNA microarray analysis using the CNIOOncoChip v.2 [18]. Universal Human Reference RNA(Stratagene, La Jolla, CA, USA) was used as a ref-erence. Hybridization, scanning of fluorescent signals,and quantification (GenePix 5.0 program) were per-formed as previously described [18,20]. Replicatedspots in the array were averaged and any gene withdata missing in more than 10% of the samples wasexcluded. The process yielded 7935 genes suitable for
bioinformatic analysis. The SOTARRAY Clusteringprogram was used for hierarchical clustering of sam-ples and the GeneCluster/TreeView program was usedto view gene expression. For unsupervised hierarchi-cal clustering, we used the complete-linkage methodto determine whether there was evidence for naturalgrouping samples based on similarity in gene expres-sion profiles. Genes whose expression levels variedby a factor of less than 3 across the samples wereeliminated, to leave only the most variably expressedtranscripts. We applied hierarchical clustering to clas-sify the 69 tumour samples and six normal lung tissuesusing the 1075 most variably expressed transcripts. Toidentify the genes that are important for distinguishingsubgroups defined by histological type or gene alter-ations, we carried out a t-test with 200000 random per-mutations to compute significance. To account for theeffect of multiple hypothesis testing on the identifica-tion of significance, adjusted p values were computedto control for the false-discovery rate (FDR) [21]. Thedifferentially expressed genes were functionally clas-sified manually on the basis of exhaustive searches inPubmed and in gene ontology databases.
Screening for gene mutations
For mutation screening at exons 9 and 20 of thePIK3CA gene, tumour DNA was amplified using thefollowing primers: exon 9, forward: 5′-GTTACTATT-CTGTGACTGGTG-3′ and reverse: 5′-GCTGAGAT-CAGCCAAATTCAG-3′; exon 20, forward: 5′-CTG-ACCAAACTGTTCTTATTAC-3′ and reverse: 5′-AA-ACATAGAACATTTGCAAGAC-3′. For mutationscreening at exons 11 and 15 of the BRAF gene,tumour DNA was amplified using the followingprimers: exon 11, forward: 5′-CTCTCAGGCATAA-GGTAATG-3′ and reverse: 5′-ACAGTGAATATTT-CCTTTGATG-3′; exon 15, forward: 5′-CATAATGC-TTGCTCTGATAGG-3′ and reverse: 5′-GGCCAA-AATTTAATCAGTGG-3′. The PCR reactions andautomatic sequencing were performed as previouslydescribed [18,19]. All variants were confirmed byre-sequencing independent PCR products. Mutationscreening for LKB1, KRAS (exon 1), TP53 (exons5–8), and EGFR (exons 18–21) was carried out usingPCR and direct automatic sequencing following stan-dard protocols [18,19].
Tissue microarray construction
Formalin-fixed, paraffin-embedded tissue blocks fromlung primary tumours were used for tissue microarray(TMA) construction, following a previously describedprotocol [19]. Slides were reviewed by two patholo-gists (EC and FL-R), who selected areas containingtumour cells, avoiding those with necrosis, inflamma-tion, and keratinization. Normal lung tissue and breastand renal carcinomas were included as control speci-mens.
J Pathol 2008; 214: 347–356 DOI: 10.1002/pathCopyright 2007 Pathological Society of Great Britain and Ireland. Published by John Wiley & Sons, Ltd.
Gene expression profile and lung tumour characteristics 349
Fluorescence in situ hybridization (FISH)
To assess the presence of PIK3CA gene amplifica-tion, we performed FISH analysis on TMAs. We usedtwo BAC clones (RP11-466H15 and RP11-245C23),labelled in Spectrum Orange (Vysis, Downer’s Grove,IL, USA), covering the PIK3CA gene and the adja-cent genomic area, and a reference BAC clone (RP11-165J16), labelled in Spectrum Green (Vysis), localizedpericentromerically to 3p. The BACs were obtainedfrom the BACPAC Resource Center (BPRC) at theChildren’s Hospital Oakland Research Institute (Oak-land, CA, USA). Dual-colour FISH was performedin 4-µm sections of the TMAs, using previouslydescribed protocols [19]. FISH was performed with noprevious knowledge of the genetic or clinical natureof the samples. Fluorescence signals were scored ineach sample by counting the number of single copygenes and control probe signals in an average of 180(100–210) well-defined nuclei. Increased gene copynumber and amplification were defined as the pres-ence of 5–7 (for increased gene copy number) and >7(for gene amplification) times as many gene signals aspericentromeric signals in the same chromosome.
Real-time quantitative RT-PCR
We used real-time RT-PCR to confirm the differen-tial expression of selected markers. The mRNA levelsof genes were measured by SYBR green real-timePCR. For analysis of the mRNA levels, DNAase-treated RNA was reverse-transcribed and subsequentlyamplified in triplicate using an ABI Prism 7900Sequence detector (Applied Biosystems). The humanTATA box-binding (TBP ) transcript was used forthe internal control to analyse the mRNA levels.The sequences of the primers used for quantitativeRT-PCR were as follows: for PIK3CA: PIK3CA-forward: 5′-AAGGCCACTGTGGTTGAATTG-3′ andPIK3CA-reverse: 5′-TCTTGCCGTAAATCATCCCC-3′; for CDH3: CDH3-forward: 5′-TATGAGCTCTTT-GGCCACGC-3′ and CDH3-reverse: 5′-TTGGGCTT-GTGGTCATTCTG-3′; for PRODH: PRODH-forward:5′-TAGTCCCCAACGCACAGACA-3′ and PRODH-reverse: 5′-GGACATCCATCCGCTGTAGC-3′; andfor TBP: TBP-forward: 5′-CACGCCAGCTTCGGA-GAGT-3′ and TBP-reverse: 5′-GGCACGAAGTGCA-ATGGTC-3′.
Immunohistochemistry
We performed immunohistochemical staining of DSC3(DSC3-U114 clone: 1 : 25 dilution; Research Diagnos-tics, Flanders, NJ, USA), EGFR (EGFR.113; 1 : 10dilution; Novocastra Laboratories Ltd, Newcastle-Upon-Tyne, UK), HER-2 (Herceptest; DAKO,Glostrup, Denmark), P53 (DO7; 1 : 50 dilution; Novo-castra), and P63 (4A4, 1 : 50 dilution; DAKO). Theprotocols used for immunostaining were those pre-viously described [19]. Sections were counterstainedwith haematoxylin and evaluated by two pathologists
(FL-R and AS), using uniform criteria. Criteria forevaluating EGFR and HER2 immunostaining were aspreviously described [19]. For the remaining proteins,we used the following criteria:
• P63: no staining was scored as 0 or negative, low-to-moderate intensity staining was scored as 1, andhigh intensity staining was scored as 2 [22].
• DSC3: no staining in less than 10% of tumour cellswas scored as 0 or negative and staining in ≥10%of tumour cells was scored as 1 or positive.
• P53: no staining in less than 10% of tumour cellswas scored as 0 or negative and staining in ≥10%of tumour cells was scored as 1 or positive [23].
Results
Unsupervised hierarchical cluster analysissegregated tumours by histology and the presenceof EGFR mutations
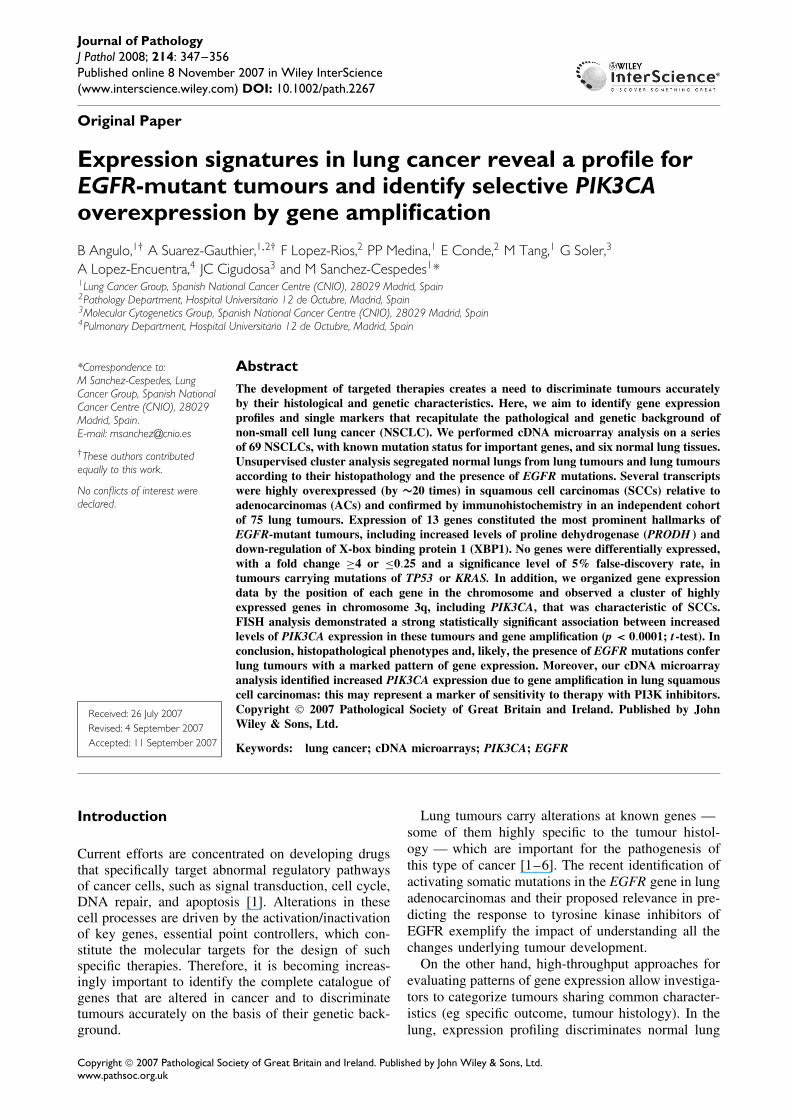
Gene expression profiles were determined for six nor-mal lungs and 69 lung tumours from patients diag-nosed with NSCLC. Figure 1A depicts the dendro-gram summarizing the similarity of gene expressionin the normal and tumour tissues obtained after unsu-pervised cluster analysis of the data. Patient andtumour characteristics such as gender, smoking sta-tus, lymph node involvement, tumour size, histology,degree of differentiation, and gene mutation back-ground are illustrated. Mutational analysis of BRAF,EGFR, KRAS, and LKB1 is provided only for ade-nocarcinomas. No mutations were detected in BRAF.The frequency of LKB1 mutations in the cohortused for cDNA microarray analysis was low becausemost LKB1-mutant tumours were included in a previ-ous study aimed at determining the expression pro-file characteristics of lung adenocarcinomas carry-ing LKB1 alterations [18]. Gene expression profilesdivided tumours into two main branches, discrimi-nating the AC and SCC subtypes. All normal lungtissues but one were clustered in the branch with theACs. The remaining case clustered separately withthe well-differentiated ACs. Microscopic characteriza-tion of this normal tissue revealed that the interstitiumbetween alveoli was enlarged by inflammatory infil-trate and hyperplasia due to the inflammatory process.The AC branch also contained three LCCs and eightscattered SCCs. The three EGFR-mutant tumours,which included two well-differentiated and one poorlydifferentiated adenocarcinomas, clustered together ina different sub-branch containing well-differentiatedlung adenocarcinomas. On the other hand, the branchcontaining the majority (28 of the 36; 78%) of theSCCs in the study was highly homogeneous. Therewas no clear prevalence, in any particular branch,of tumours with other common characteristics suchas gender, smoking status, tumour size, lymph nodemetastasis, or presence of gene alterations other thanEGFR mutations.
J Pathol 2008; 214: 347–356 DOI: 10.1002/pathCopyright 2007 Pathological Society of Great Britain and Ireland. Published by John Wiley & Sons, Ltd.
350 B Angulo et al
(A)
(B) (C)
Figure 1. Gene expression profiles in non-small cell lung tumours. (A) Dendrogram showing the unsupervised hierarchicalclustering of 69 lung tumour tissues and six non-malignant tissues using the 1075 most variably expressed genes. Normal lungtissues are indicated in red. Patient, clinicopathological, and genetic information of the tumours is also indicated. Grey boxesindicate no information or data. Dark blue indicates females, non-smokers, squamous cell carcinomas, poorly differentiatedtumours, tumour size T2–T3, node involvement (N1–N2), and presence of mutations at the indicated gene. Mid-blue indicateslarge cell carcinomas (LCCs), moderately differentiated tumours, and tumour size T4. (B) Two-dimensional hierarchical clusteringof the most differentially expressed genes between lung SCCs and ACs. The scale bar reflects the increased (red) or decreased(green) expression of any gene. (C) Representative examples of positive (+) and negative (−) immunostaining of DSC3 (originalmagnification 400×) in the validation set of lung tumours
Identification of markers that discriminate lungtumour histopathology
To extract markers that correlate with tumour his-tology, ACs and SCCs (n = 66), we performed asupervised analysis. We identified 192 known genesthat passed pre-filtering at a FDR ≤0.0005 after200 000 permutations (see Supplementary Table S1,available at http://www.interscience.wiley.com/jpages/0022-3417/suppmat/path.2267.html). After restrictingour selection to genes that showed homogenousexpression in SCCs and ACs and differences by afactor of ≥4 or ≤0.25 between their expression levelsin SCCs and ACs, we obtained 28 genes (Figure 1B
and Table 1). As indicated, 23 markers were consis-tently up-regulated in SCCs in comparison to ACs.The mean expression level in the normal lungs isalso shown. Overall, we found that SCCs exhibiteda high level of expression of genes involved in detox-ification and anti-oxidation, such as GPX2, UGT1A6,ALDH3A1, and components of the desmosomes, suchas DCS3 and PKP1.
We selected DCS3, P73L/P63, and HER2 proteins,for which commercial antibodies were available, tovalidate our observations with the cDNA microar-rays in an independent cohort of 75 lung tumours.We also tested for EGFR and P53 protein expression.The observations of immunostaining for each of
J Pathol 2008; 214: 347–356 DOI: 10.1002/pathCopyright 2007 Pathological Society of Great Britain and Ireland. Published by John Wiley & Sons, Ltd.
Gene expression profile and lung tumour characteristics 351
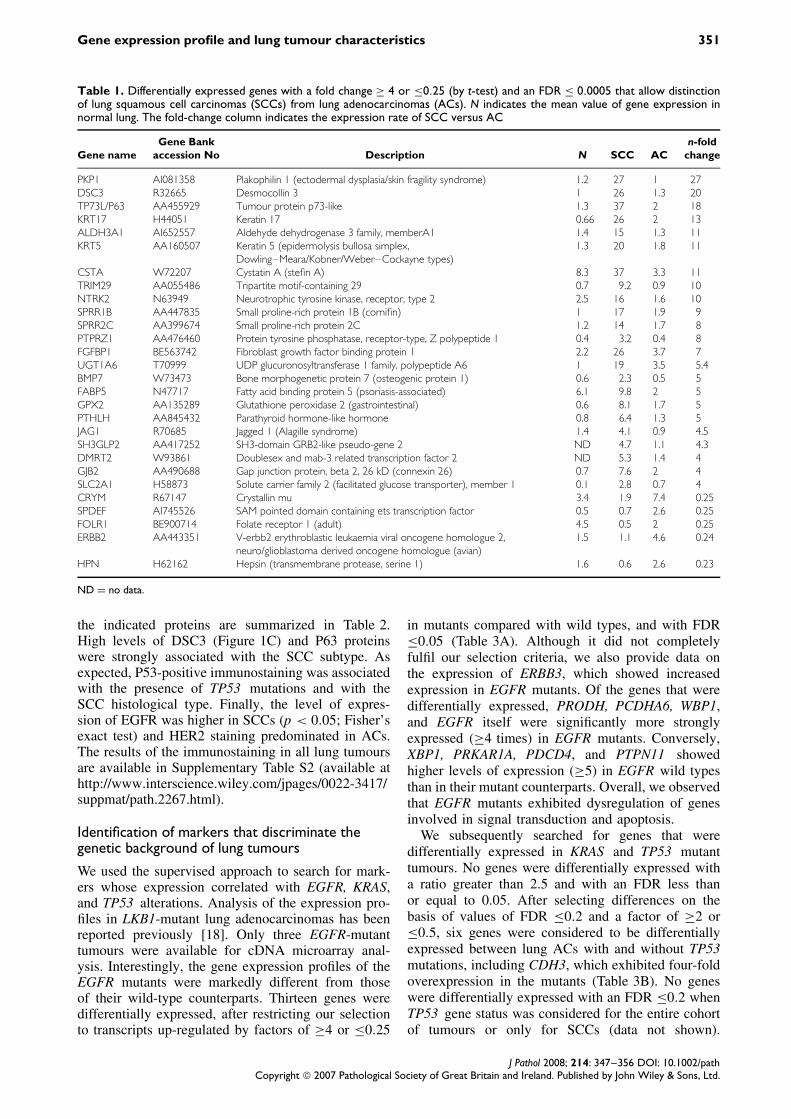
Table 1. Differentially expressed genes with a fold change ≥ 4 or ≤0.25 (by t-test) and an FDR ≤ 0.0005 that allow distinctionof lung squamous cell carcinomas (SCCs) from lung adenocarcinomas (ACs). N indicates the mean value of gene expression innormal lung. The fold-change column indicates the expression rate of SCC versus AC
Gene nameGene Bank
accession No Description N SCC ACn-fold
change
PKP1 AI081358 Plakophilin 1 (ectodermal dysplasia/skin fragility syndrome) 1.2 27 1 27DSC3 R32665 Desmocollin 3 1 26 1.3 20TP73L/P63 AA455929 Tumour protein p73-like 1.3 37 2 18KRT17 H44051 Keratin 17 0.66 26 2 13ALDH3A1 AI652557 Aldehyde dehydrogenase 3 family, memberA1 1.4 15 1.3 11KRT5 AA160507 Keratin 5 (epidermolysis bullosa simplex,
Dowling–Meara/Kobner/Weber–Cockayne types)1.3 20 1.8 11
CSTA W72207 Cystatin A (stefin A) 8.3 37 3.3 11TRIM29 AA055486 Tripartite motif-containing 29 0.7 9.2 0.9 10NTRK2 N63949 Neurotrophic tyrosine kinase, receptor, type 2 2.5 16 1.6 10SPRR1B AA447835 Small proline-rich protein 1B (cornifin) 1 17 1.9 9SPRR2C AA399674 Small proline-rich protein 2C 1.2 14 1.7 8PTPRZ1 AA476460 Protein tyrosine phosphatase, receptor-type, Z polypeptide 1 0.4 3.2 0.4 8FGFBP1 BE563742 Fibroblast growth factor binding protein 1 2.2 26 3.7 7UGT1A6 T70999 UDP glucuronosyltransferase 1 family, polypeptide A6 1 19 3.5 5.4BMP7 W73473 Bone morphogenetic protein 7 (osteogenic protein 1) 0.6 2.3 0.5 5FABP5 N47717 Fatty acid binding protein 5 (psoriasis-associated) 6.1 9.8 2 5GPX2 AA135289 Glutathione peroxidase 2 (gastrointestinal) 0.6 8.1 1.7 5PTHLH AA845432 Parathyroid hormone-like hormone 0.8 6.4 1.3 5JAG1 R70685 Jagged 1 (Alagille syndrome) 1.4 4.1 0.9 4.5SH3GLP2 AA417252 SH3-domain GRB2-like pseudo-gene 2 ND 4.7 1.1 4.3DMRT2 W93861 Doublesex and mab-3 related transcription factor 2 ND 5.3 1.4 4GJB2 AA490688 Gap junction protein, beta 2, 26 kD (connexin 26) 0.7 7.6 2 4SLC2A1 H58873 Solute carrier family 2 (facilitated glucose transporter), member 1 0.1 2.8 0.7 4CRYM R67147 Crystallin mu 3.4 1.9 7.4 0.25SPDEF AI745526 SAM pointed domain containing ets transcription factor 0.5 0.7 2.6 0.25FOLR1 BE900714 Folate receptor 1 (adult) 4.5 0.5 2 0.25ERBB2 AA443351 V-erbb2 erythroblastic leukaemia viral oncogene homologue 2,
neuro/glioblastoma derived oncogene homologue (avian)1.5 1.1 4.6 0.24
HPN H62162 Hepsin (transmembrane protease, serine 1) 1.6 0.6 2.6 0.23
ND = no data.
the indicated proteins are summarized in Table 2.High levels of DSC3 (Figure 1C) and P63 proteinswere strongly associated with the SCC subtype. Asexpected, P53-positive immunostaining was associatedwith the presence of TP53 mutations and with theSCC histological type. Finally, the level of expres-sion of EGFR was higher in SCCs (p < 0.05; Fisher’sexact test) and HER2 staining predominated in ACs.The results of the immunostaining in all lung tumoursare available in Supplementary Table S2 (available athttp://www.interscience.wiley.com/jpages/0022-3417/suppmat/path.2267.html).
Identification of markers that discriminate thegenetic background of lung tumours
We used the supervised approach to search for mark-ers whose expression correlated with EGFR, KRAS,and TP53 alterations. Analysis of the expression pro-files in LKB1-mutant lung adenocarcinomas has beenreported previously [18]. Only three EGFR-mutanttumours were available for cDNA microarray anal-ysis. Interestingly, the gene expression profiles of theEGFR mutants were markedly different from thoseof their wild-type counterparts. Thirteen genes weredifferentially expressed, after restricting our selectionto transcripts up-regulated by factors of ≥4 or ≤0.25
in mutants compared with wild types, and with FDR≤0.05 (Table 3A). Although it did not completelyfulfil our selection criteria, we also provide data onthe expression of ERBB3, which showed increasedexpression in EGFR mutants. Of the genes that weredifferentially expressed, PRODH, PCDHA6, WBP1,and EGFR itself were significantly more stronglyexpressed (≥4 times) in EGFR mutants. Conversely,XBP1, PRKAR1A, PDCD4, and PTPN11 showedhigher levels of expression (≥5) in EGFR wild typesthan in their mutant counterparts. Overall, we observedthat EGFR mutants exhibited dysregulation of genesinvolved in signal transduction and apoptosis.
We subsequently searched for genes that weredifferentially expressed in KRAS and TP53 mutanttumours. No genes were differentially expressed witha ratio greater than 2.5 and with an FDR less thanor equal to 0.05. After selecting differences on thebasis of values of FDR ≤0.2 and a factor of ≥2 or≤0.5, six genes were considered to be differentiallyexpressed between lung ACs with and without TP53mutations, including CDH3, which exhibited four-foldoverexpression in the mutants (Table 3B). No geneswere differentially expressed with an FDR ≤0.2 whenTP53 gene status was considered for the entire cohortof tumours or only for SCCs (data not shown).
J Pathol 2008; 214: 347–356 DOI: 10.1002/pathCopyright 2007 Pathological Society of Great Britain and Ireland. Published by John Wiley & Sons, Ltd.
352 B Angulo et al
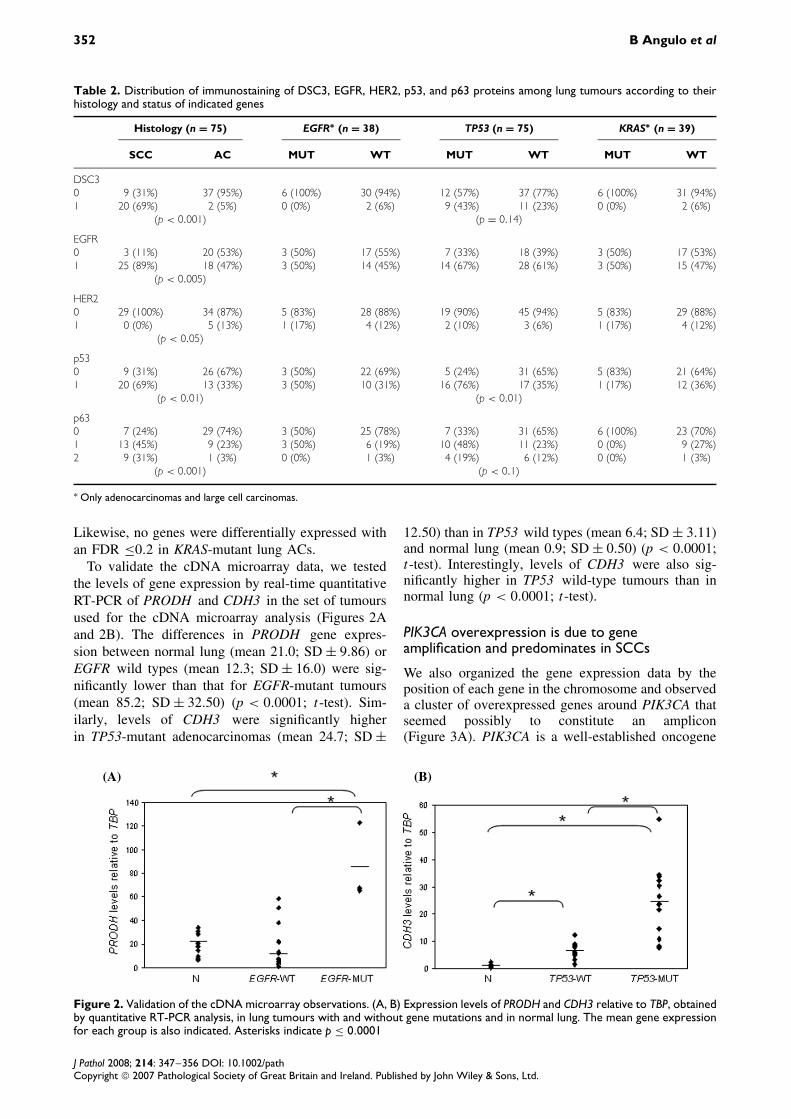
Table 2. Distribution of immunostaining of DSC3, EGFR, HER2, p53, and p63 proteins among lung tumours according to theirhistology and status of indicated genes
Histology (n = 75) EGFR∗ (n = 38) TP53 (n = 75) KRAS∗ (n = 39)
SCC AC MUT WT MUT WT MUT WT
DSC30 9 (31%) 37 (95%) 6 (100%) 30 (94%) 12 (57%) 37 (77%) 6 (100%) 31 (94%)1 20 (69%) 2 (5%) 0 (0%) 2 (6%) 9 (43%) 11 (23%) 0 (0%) 2 (6%)
(p < 0.001) (p = 0.14)
EGFR0 3 (11%) 20 (53%) 3 (50%) 17 (55%) 7 (33%) 18 (39%) 3 (50%) 17 (53%)1 25 (89%) 18 (47%) 3 (50%) 14 (45%) 14 (67%) 28 (61%) 3 (50%) 15 (47%)
(p < 0.005)
HER20 29 (100%) 34 (87%) 5 (83%) 28 (88%) 19 (90%) 45 (94%) 5 (83%) 29 (88%)1 0 (0%) 5 (13%) 1 (17%) 4 (12%) 2 (10%) 3 (6%) 1 (17%) 4 (12%)
(p < 0.05)
p530 9 (31%) 26 (67%) 3 (50%) 22 (69%) 5 (24%) 31 (65%) 5 (83%) 21 (64%)1 20 (69%) 13 (33%) 3 (50%) 10 (31%) 16 (76%) 17 (35%) 1 (17%) 12 (36%)
(p < 0.01) (p < 0.01)
p630 7 (24%) 29 (74%) 3 (50%) 25 (78%) 7 (33%) 31 (65%) 6 (100%) 23 (70%)1 13 (45%) 9 (23%) 3 (50%) 6 (19%) 10 (48%) 11 (23%) 0 (0%) 9 (27%)2 9 (31%) 1 (3%) 0 (0%) 1 (3%) 4 (19%) 6 (12%) 0 (0%) 1 (3%)
(p < 0.001) (p < 0.1)
∗ Only adenocarcinomas and large cell carcinomas.
Likewise, no genes were differentially expressed withan FDR ≤0.2 in KRAS-mutant lung ACs.
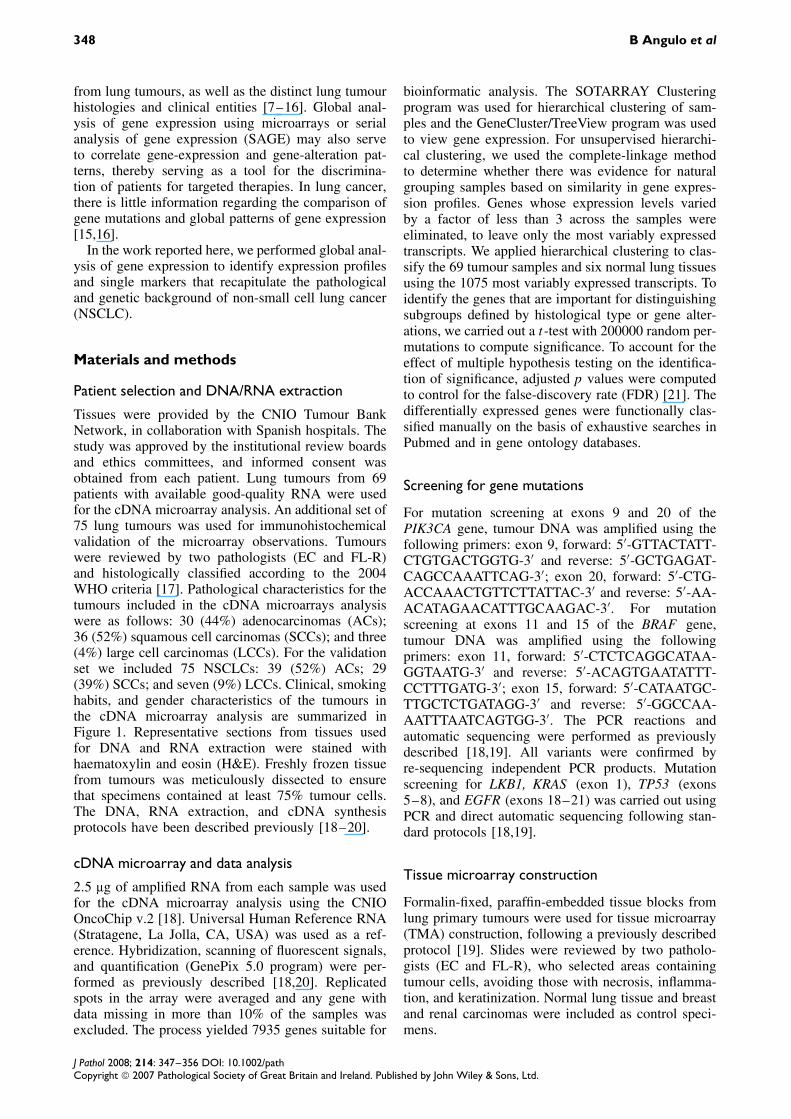
To validate the cDNA microarray data, we testedthe levels of gene expression by real-time quantitativeRT-PCR of PRODH and CDH3 in the set of tumoursused for the cDNA microarray analysis (Figures 2Aand 2B). The differences in PRODH gene expres-sion between normal lung (mean 21.0; SD ± 9.86) orEGFR wild types (mean 12.3; SD ± 16.0) were sig-nificantly lower than that for EGFR-mutant tumours(mean 85.2; SD ± 32.50) (p < 0.0001; t-test). Sim-ilarly, levels of CDH3 were significantly higherin TP53-mutant adenocarcinomas (mean 24.7; SD ±
12.50) than in TP53 wild types (mean 6.4; SD ± 3.11)and normal lung (mean 0.9; SD ± 0.50) (p < 0.0001;t-test). Interestingly, levels of CDH3 were also sig-nificantly higher in TP53 wild-type tumours than innormal lung (p < 0.0001; t-test).
PIK3CA overexpression is due to geneamplification and predominates in SCCs
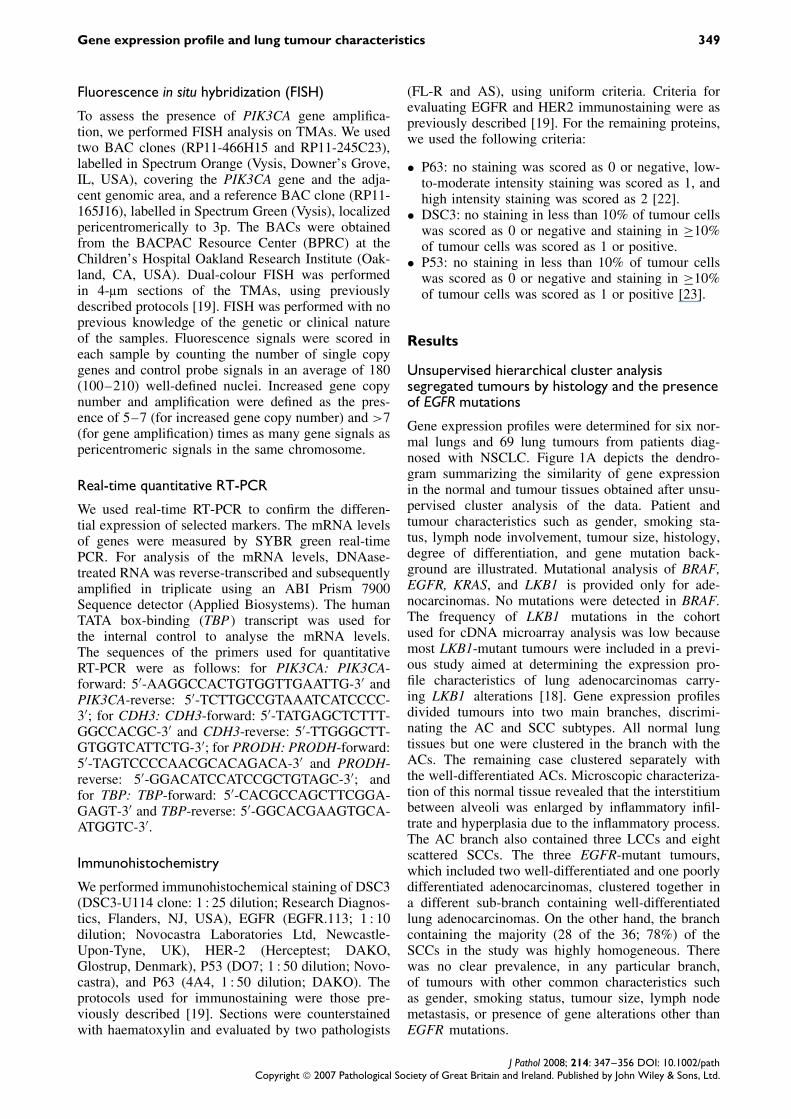
We also organized the gene expression data by theposition of each gene in the chromosome and observeda cluster of overexpressed genes around PIK3CA thatseemed possibly to constitute an amplicon(Figure 3A). PIK3CA is a well-established oncogene
(A) (B)
Figure 2. Validation of the cDNA microarray observations. (A, B) Expression levels of PRODH and CDH3 relative to TBP, obtainedby quantitative RT-PCR analysis, in lung tumours with and without gene mutations and in normal lung. The mean gene expressionfor each group is also indicated. Asterisks indicate p ≤ 0.0001
J Pathol 2008; 214: 347–356 DOI: 10.1002/pathCopyright 2007 Pathological Society of Great Britain and Ireland. Published by John Wiley & Sons, Ltd.
Gene expression profile and lung tumour characteristics 353
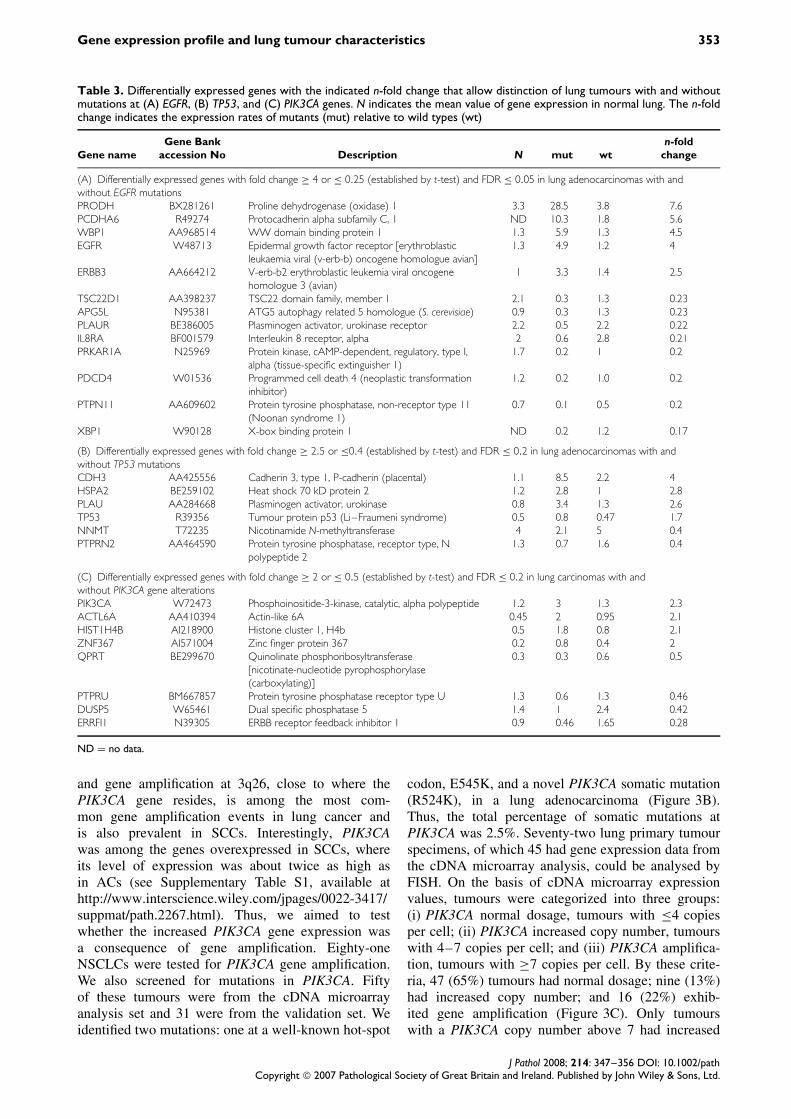
Table 3. Differentially expressed genes with the indicated n-fold change that allow distinction of lung tumours with and withoutmutations at (A) EGFR, (B) TP53, and (C) PIK3CA genes. N indicates the mean value of gene expression in normal lung. The n-foldchange indicates the expression rates of mutants (mut) relative to wild types (wt)
Gene nameGene Bank
accession No Description N mut wtn-fold
change
(A) Differentially expressed genes with fold change ≥ 4 or ≤ 0.25 (established by t-test) and FDR ≤ 0.05 in lung adenocarcinomas with andwithout EGFR mutationsPRODH BX281261 Proline dehydrogenase (oxidase) 1 3.3 28.5 3.8 7.6PCDHA6 R49274 Protocadherin alpha subfamily C, 1 ND 10.3 1.8 5.6WBP1 AA968514 WW domain binding protein 1 1.3 5.9 1.3 4.5EGFR W48713 Epidermal growth factor receptor [erythroblastic
leukaemia viral (v-erb-b) oncogene homologue avian]1.3 4.9 1.2 4
ERBB3 AA664212 V-erb-b2 erythroblastic leukemia viral oncogenehomologue 3 (avian)
1 3.3 1.4 2.5
TSC22D1 AA398237 TSC22 domain family, member 1 2.1 0.3 1.3 0.23APG5L N95381 ATG5 autophagy related 5 homologue (S. cerevisiae) 0.9 0.3 1.3 0.23PLAUR BE386005 Plasminogen activator, urokinase receptor 2.2 0.5 2.2 0.22IL8RA BF001579 Interleukin 8 receptor, alpha 2 0.6 2.8 0.21PRKAR1A N25969 Protein kinase, cAMP-dependent, regulatory, type I,
alpha (tissue-specific extinguisher 1)1.7 0.2 1 0.2
PDCD4 W01536 Programmed cell death 4 (neoplastic transformationinhibitor)
1.2 0.2 1.0 0.2
PTPN11 AA609602 Protein tyrosine phosphatase, non-receptor type 11(Noonan syndrome 1)
0.7 0.1 0.5 0.2
XBP1 W90128 X-box binding protein 1 ND 0.2 1.2 0.17
(B) Differentially expressed genes with fold change ≥ 2.5 or ≤0.4 (established by t-test) and FDR ≤ 0.2 in lung adenocarcinomas with andwithout TP53 mutationsCDH3 AA425556 Cadherin 3, type 1, P-cadherin (placental) 1.1 8.5 2.2 4HSPA2 BE259102 Heat shock 70 kD protein 2 1.2 2.8 1 2.8PLAU AA284668 Plasminogen activator, urokinase 0.8 3.4 1.3 2.6TP53 R39356 Tumour protein p53 (Li–Fraumeni syndrome) 0.5 0.8 0.47 1.7NNMT T72235 Nicotinamide N-methyltransferase 4 2.1 5 0.4PTPRN2 AA464590 Protein tyrosine phosphatase, receptor type, N
polypeptide 21.3 0.7 1.6 0.4
(C) Differentially expressed genes with fold change ≥ 2 or ≤ 0.5 (established by t-test) and FDR ≤ 0.2 in lung carcinomas with andwithout PIK3CA gene alterationsPIK3CA W72473 Phosphoinositide-3-kinase, catalytic, alpha polypeptide 1.2 3 1.3 2.3ACTL6A AA410394 Actin-like 6A 0.45 2 0.95 2.1HIST1H4B AI218900 Histone cluster 1, H4b 0.5 1.8 0.8 2.1ZNF367 AI571004 Zinc finger protein 367 0.2 0.8 0.4 2QPRT BE299670 Quinolinate phosphoribosyltransferase
[nicotinate-nucleotide pyrophosphorylase(carboxylating)]
0.3 0.3 0.6 0.5
PTPRU BM667857 Protein tyrosine phosphatase receptor type U 1.3 0.6 1.3 0.46DUSP5 W65461 Dual specific phosphatase 5 1.4 1 2.4 0.42ERRFI1 N39305 ERBB receptor feedback inhibitor 1 0.9 0.46 1.65 0.28
ND = no data.
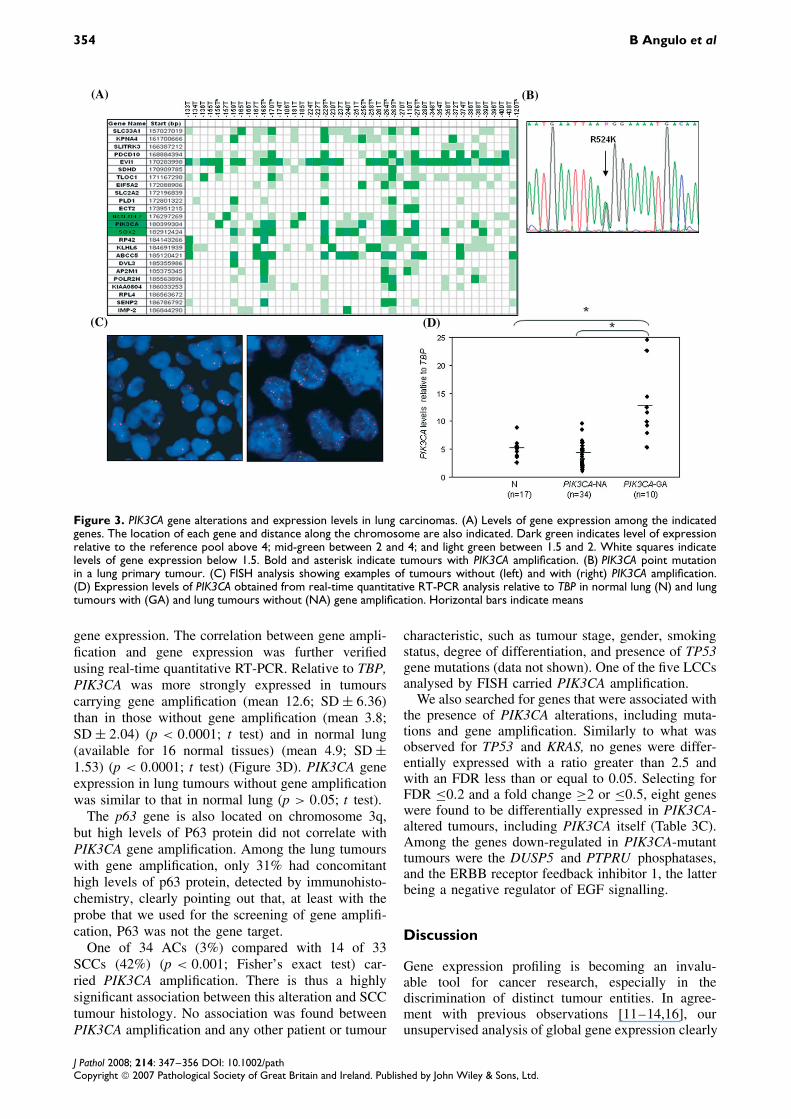
and gene amplification at 3q26, close to where thePIK3CA gene resides, is among the most com-mon gene amplification events in lung cancer andis also prevalent in SCCs. Interestingly, PIK3CAwas among the genes overexpressed in SCCs, whereits level of expression was about twice as high asin ACs (see Supplementary Table S1, available athttp://www.interscience.wiley.com/jpages/0022-3417/suppmat/path.2267.html). Thus, we aimed to testwhether the increased PIK3CA gene expression wasa consequence of gene amplification. Eighty-oneNSCLCs were tested for PIK3CA gene amplification.We also screened for mutations in PIK3CA. Fiftyof these tumours were from the cDNA microarrayanalysis set and 31 were from the validation set. Weidentified two mutations: one at a well-known hot-spot
codon, E545K, and a novel PIK3CA somatic mutation(R524K), in a lung adenocarcinoma (Figure 3B).Thus, the total percentage of somatic mutations atPIK3CA was 2.5%. Seventy-two lung primary tumourspecimens, of which 45 had gene expression data fromthe cDNA microarray analysis, could be analysed byFISH. On the basis of cDNA microarray expressionvalues, tumours were categorized into three groups:(i) PIK3CA normal dosage, tumours with ≤4 copiesper cell; (ii) PIK3CA increased copy number, tumourswith 4–7 copies per cell; and (iii) PIK3CA amplifica-tion, tumours with ≥7 copies per cell. By these crite-ria, 47 (65%) tumours had normal dosage; nine (13%)had increased copy number; and 16 (22%) exhib-ited gene amplification (Figure 3C). Only tumourswith a PIK3CA copy number above 7 had increased
J Pathol 2008; 214: 347–356 DOI: 10.1002/pathCopyright 2007 Pathological Society of Great Britain and Ireland. Published by John Wiley & Sons, Ltd.
354 B Angulo et al
(A) (B)
(C) (D)
Figure 3. PIK3CA gene alterations and expression levels in lung carcinomas. (A) Levels of gene expression among the indicatedgenes. The location of each gene and distance along the chromosome are also indicated. Dark green indicates level of expressionrelative to the reference pool above 4; mid-green between 2 and 4; and light green between 1.5 and 2. White squares indicatelevels of gene expression below 1.5. Bold and asterisk indicate tumours with PIK3CA amplification. (B) PIK3CA point mutationin a lung primary tumour. (C) FISH analysis showing examples of tumours without (left) and with (right) PIK3CA amplification.(D) Expression levels of PIK3CA obtained from real-time quantitative RT-PCR analysis relative to TBP in normal lung (N) and lungtumours with (GA) and lung tumours without (NA) gene amplification. Horizontal bars indicate means
gene expression. The correlation between gene ampli-fication and gene expression was further verifiedusing real-time quantitative RT-PCR. Relative to TBP,PIK3CA was more strongly expressed in tumourscarrying gene amplification (mean 12.6; SD ± 6.36)than in those without gene amplification (mean 3.8;SD ± 2.04) (p < 0.0001; t test) and in normal lung(available for 16 normal tissues) (mean 4.9; SD ±1.53) (p < 0.0001; t test) (Figure 3D). PIK3CA geneexpression in lung tumours without gene amplificationwas similar to that in normal lung (p > 0.05; t test).
The p63 gene is also located on chromosome 3q,but high levels of P63 protein did not correlate withPIK3CA gene amplification. Among the lung tumourswith gene amplification, only 31% had concomitanthigh levels of p63 protein, detected by immunohisto-chemistry, clearly pointing out that, at least with theprobe that we used for the screening of gene amplifi-cation, P63 was not the gene target.
One of 34 ACs (3%) compared with 14 of 33SCCs (42%) (p < 0.001; Fisher’s exact test) car-ried PIK3CA amplification. There is thus a highlysignificant association between this alteration and SCCtumour histology. No association was found betweenPIK3CA amplification and any other patient or tumour
characteristic, such as tumour stage, gender, smokingstatus, degree of differentiation, and presence of TP53gene mutations (data not shown). One of the five LCCsanalysed by FISH carried PIK3CA amplification.
We also searched for genes that were associated withthe presence of PIK3CA alterations, including muta-tions and gene amplification. Similarly to what wasobserved for TP53 and KRAS, no genes were differ-entially expressed with a ratio greater than 2.5 andwith an FDR less than or equal to 0.05. Selecting forFDR ≤0.2 and a fold change ≥2 or ≤0.5, eight geneswere found to be differentially expressed in PIK3CA-altered tumours, including PIK3CA itself (Table 3C).Among the genes down-regulated in PIK3CA-mutanttumours were the DUSP5 and PTPRU phosphatases,and the ERBB receptor feedback inhibitor 1, the latterbeing a negative regulator of EGF signalling.
Discussion
Gene expression profiling is becoming an invalu-able tool for cancer research, especially in thediscrimination of distinct tumour entities. In agree-ment with previous observations [11–14,16], ourunsupervised analysis of global gene expression clearly
J Pathol 2008; 214: 347–356 DOI: 10.1002/pathCopyright 2007 Pathological Society of Great Britain and Ireland. Published by John Wiley & Sons, Ltd.
Gene expression profile and lung tumour characteristics 355
segregated lung ACs from SCCs. That there is sucha consensus among laboratories even when differentmicroarray platforms are used underlines how dif-ferent these histologies are with respect to geneticchanges and, probably, the cell type of origin. Theidentification of novel markers for discriminating lungtumour histologies, especially when only small biop-sies are available for histopathological diagnosis, isincreasingly important because of the use of therapeu-tic agents such as gefitinib or erlotinib whose maxi-mum response occurs in tumours with EGFR muta-tions, which are restricted to lung adenocarcinomas.Overall, SCCs featured differentially higher levels ofexpression in more genes than did ACs, includingthose currently used by pathology departments fordifferential diagnosis, such as the keratins. We alsoconfirmed previous observations of increased expres-sion of SPRR, GPX2, CSTA, FABP, and TP73L/P63 inSCCs compared with ACs and normal lung [9–11,13]and the up-regulation of ERRB2 in ACs [10]. Remark-ably, DSC3 (desmocollin 3) and PKP1 (plakophilin1), components of the desmosomes, showed a 20-timesgreater level of expression in SCCs than in ACs andnormal lung and thus may be useful in histopathologi-cal diagnosis. Desmocollins are desmosomal cadherinsthat exhibit differentiation-specific patterns of expres-sion in the squamous epithelia [24].
EGFR-mutant tumours clustered together in anunsupervised analysis, indicating that the presenceof EGFR mutations confers very specific patterns ofgene expression. Thus, it is likely that EGFR-mutantlung tumours constitute a very closely defined diseaseentity. In fact, most EGFR-mutant lung adenocarcino-mas are aetiologically and histopathologically differ-ent from the EGFR wild types because they arise innon-smokers and have bronchioloalveolar or papillarycharacteristics [19–25]. Hayes et al defined novel lungAC subtypes using gene expression profiling [26]. Oneof the subtypes, the bronchioid, included most of theACs with BAC characteristics and EGFR mutations,which is consistent with our present observations.The gene PRODH (proline dehydrogenase oxidase 1),a mitochondrial inner-membrane enzyme that cataly-ses the first step in the proline degradation pathway,was highly up-regulated in EGFR mutants. PRODHexpression mediates apoptosis in lung cancer cellsinduced by p53 and contributes to the regulation of theMEK/ERK pathway [27]. Others did not find a simi-larity in gene expression in lung ACs carrying EGFRmutations in tumours from individuals of Asian origin[16]. For reasons that are still not well understood,lung tumours arising in East Asian individuals have ahigher frequency of EGFR mutations. These specificcharacteristics and the use of distinct microarray plat-forms in both analyses may contribute to explain thediscrepancies between our results and previous obser-vations. Supporting this, supervised analysis of geneexpression to extract markers that correlate with thepresence of EGFR mutations in individuals of Asianorigin identified a set of transcripts that differ from
those presented here [16]. Most of these transcriptswere not present in our cDNA microarray platform.
Similarities of gene expression profiles in tumourscarrying alterations at other cancer genes such asKRAS and TP53 were not so evident. Other authorswere also unable to observe common patterns ofgene expression in lung ACs with KRAS mutations[15,16,28]. Apart from the confounding influence ofthe underdetection of mutations in primary tumours(ie due to normal cell contamination or mutations out-side the hot-spot regions), alterations at functionallyequivalent genes may help to explain the absence ofspecific patterns of gene expression associated withgene mutations in TP53 or KRAS.
Global analysis of gene expression also allowedus to identify a cluster of overexpressed genes onchromosome 3q containing the well-known onco-gene PIK3CA. While PIK3CA-activating mutations areinfrequent in lung cancer [29], the gain of chromosome3q22–q26, which includes the PIK3CA gene, is com-mon in lung tumours, especially SCCs [30,31]. It isknown that PIK3CA-increased copy number confersoncogenic properties on the PI3K protein in ovar-ian cancer [32]. Our present data reveal that only anincrease in PIK3CA copy above 7 copies per nucleusresults in concomitant overexpression. Thus, theseobservations underscore the potential oncogenic natureof this alteration and offer a candidate marker of sensi-tivity to therapy with inhibitors of PI3K activity. Giventhe continuing debate about how to select patientsfor treatment with EGFR tyrosine kinase inhibitors[33], it is reasonable to speculate that the same con-siderations might apply to other genes. Other authorshave reported candidate additional oncogenes for the3q amplicon, such as EVI1 [30]. However, compar-ison of FISH analysis with the expression levels ofgenes within the region indicates that PIK3CA exhibitsthe closest correlation between gene amplificationand gene overexpression. Nevertheless, the remarkableincreased expression of EVI1 in most lung tumoursmay indicate an important role in lung carcinogenesis.
To our knowledge, this is the most complete anal-ysis of gene expression profiles and gene mutationsso far conducted in lung tumours. We have providedevidence that EGFR-mutant tumours have specific pat-terns of gene expression that may underlie their dif-ferent histology and clinical behaviour. Our work alsoshows that PIK3CA gene amplification in lung SCCsis common and is correlated with overexpression.
Acknowledgements
We thank our collaborators L Sanchez-Verde, A Dıez, RPajares, and MJ Acuna from the Histology and Immuno-histochemistry Unit of the CNIO, and M Morente and LCereceda of the CNIO Tumour Bank Network. This workwas supported by the Spanish Ministerio de Educacion yCiencia (SAF2005-00626 and SAF2005-04340), Fondo deInvestigaciones Sanitarias (03/0049-03/0046), and CIBER-Respiratorio (ISCIII-CB06-07-0016). The data discussed in this
J Pathol 2008; 214: 347–356 DOI: 10.1002/pathCopyright 2007 Pathological Society of Great Britain and Ireland. Published by John Wiley & Sons, Ltd.
356 B Angulo et al
publication have been deposited in the NCBIs Gene Expres-sion Omnibus (GEO, http://www.ncbi.nlm.nih.gov/geo/) andare accessible through GEO Series accession number GSE8569.
Supplementary material
Supplementary material may be found at the webaddress http://www.interscience.wiley.com/jpages/0022-3417/suppmat/path.2267.html
References
1. Sanchez-Cespedes M. Dissecting the genetic alterations involvedin lung carcinogenesis. Lung Cancer 2003;40:111–121.
2. Westra WH, Slebos RJ, Offerhaus GJ, Goodman SN, Evers SG,Kensler TW, et al. K-ras oncogene activation in lung adenocarci-nomas from former smokers. Evidence that K-ras mutations are anearly and irreversible event in the development of adenocarcinomaof the lung. Cancer 1993;72:432–438.
3. Lynch TJ, Bell DW, Sordella R, Gurubhagavatula S, OkimotoRA, Brannigan BW, et al. Activating mutations in the epidermalgrowth factor receptor underlying responsiveness of non-small-celllung cancer to gefitinib. N Engl J Med 2004;20:2129–2139.
4. Paez JG, Janne PA, Lee JC, Tracy S, Greulich H, Gabriel S, et al.EGFR mutations in lung cancer: correlation with clinical responseto gefitinib therapy. Science 2004;304:1497–1500.
5. Carretero J, Medina PP, Pio R, Montuenga LM, Sanchez-Cespedes M. Novel and natural knockout lung cancer celllines for the LKB1/STK11 tumor suppressor gene. Oncogene2004;23:4037–4040.
6. Kelley MJ, Nakagawa K, Steinberg SM, Mulshine JL, Kamb A,Johnson BE. Differential inactivation of CDKN2 and Rb protein innon-small-cell and small-cell lung cancer cell lines. J Natl CancerInst 1995;87:756–761.
7. Bhattacharjee A, Richards WG, Staunton J, Li C, Monti S,Vasa P, et al. Classification of human lung carcinomas by mRNAexpression profiling reveals distinct adenocarcinoma subclasses.Proc Natl Acad Sci U S A 2001;98:13790–13795.
8. Garber ME, Troyanskaya OG, Schluens K, Petersen S, Thaesler Z,Pacyna-Gengelbach M, et al. Diversity of gene expression inadenocarcinoma of the lung. Proc Natl Acad Sci U S A2001;98:13784–13789.
9. Nacht M, Dracheva T, Gao Y, Fujii T, Chen Y, Player A, et al.Molecular characteristics of non-small cell lung cancer. Proc NatlAcad Sci USA 2001;98:15203–15208.
10. Wigle DA, Jurisica I, Radulovich N, Pintilie M, Rossant J,Liu N, et al. Molecular profiling of non-small cell lungcancer and correlation with disease-free survival. Cancer Res2002;62:3005–3008.
11. Borczuk AC, Gorenstein L, Walter KL, Assaad AA, Wang L,Powell CA. Non-small-cell lung cancer molecular signaturesrecapitulate lung developmental pathways. Am J Pathol2003;163:1949–1960.
12. Kikuchi T, Daigo Y, Katagiri T, Tsunoda T, Okada K, Kaki-uchi S, et al. Expression profiles of non-small cell lung cancerson cDNA microarrays: identification of genes for prediction oflymph-node metastasis and sensitivity to anti-cancer drugs. Onco-gene 2003;22:2192–2205.
13. Parmigiani G, Garrett-Mayer ES, Anbazhagan R, Gabrielson E.A cross-study comparison of gene expression studies forthe molecular classification of lung cancer. Clin Cancer Res2004;10:2922–2927.
14. Nakamura N, Kobayashi K, Nakamoto M, Kohno T, Sasaki H,Matsumo Y, et al. Identification of tumor markers and differen-tiation markers for molecular diagnosis of lung adenocarcinoma.Oncogene 2006;25:4245–4255.
15. Beer DG, Kardia SL, Huang CC, Giordano TJ, Levin AM,Misek DE, et al. Gene-expression profiles predict survival ofpatients with lung adenocarcinoma Nature Med 2002;8:816–824.
16. Takeuchi T, Tomida S, Yatabe Y, Kosaka T, Osada H, Yanagi-sawa K, et al. Expression profile-defined classification of lungadenocarcinoma shows close relationship with underlying majorgenetic changes and clinicopathologic behaviors. J Clin Oncol2006;24:1679–1688.
17. Travis WD, Brambilla E, Muller-Hermelink HK, Harris CC (eds).World Health Organization Classification of Tumours. Pathologyand Genetics of Tumours of the Lung, Pleura, Thymus and Heart.IARC Press: Lyon, 2004.
18. Fernandez P, Carretero J, Medina PP, Jimenez AI, Rodriguez-Perales S, Paz MF, et al. Distinctive gene expression of humanlung adenocarcinomas carrying LKB1 mutations. Oncogene2004;23:5084–5091.
19. Conde E, Angulo B, Tang M, Morente M, Torres-Lanzas J,Lopez-Encuentra A, et al. Molecular context of the epidermalgrowth factor receptor mutations: evidence for the activation ofmTOR/S6K signaling. Clin Cancer Res 2006;12:710–717.
20. Tracey L, Villuendas R, Ortiz P, Dopazo A, Spiteri I, Lom-bardia L, et al. Identification of genes involved in resistanceto interferon-α in cutaneous T-cell lymphoma. Am J Pathol2002;161:1825–1837.
21. Qian HR, Huang S. Comparison of false discovery rate methodsin identifying genes with differential expression. Genomics2005;86:495–503.
22. Pelosi G, Pasini F, Olsen Stenholm C, Pastorino U, Maison-neuve P, Sonzogni A, et al. p63 immunoreactivity in lung cancer:yet another player in the development of squamous cell carcino-mas? J Pathol 2002;198:100–109.
23. Quinlan DC, Davidson AG, Summers CL, Warden HE, Doshi HM.Accumulation of p53 protein correlates with a poor prognosis inhuman lung cancer. Cancer Res 1992;52:4828–4831.
24. Boelens MC, van den Berg A, Vogelzang I, Wesseling J,Postma DS, Timens W, et al. Differential expression anddistribution of epithelial adhesion molecules in non-small cell lungcancer and normal bronchus. J Clin Pathol 2007;60:608–614.
25. Kim KS, Jeong JY, Kim YC, Na KJ, Kim YH, Ahn SJ, et al.Predictors of the response to gefitinib in refractory non-small celllung cancer. Clin Cancer Res 2005;11:2244–2251.
26. Hayes DN, Monti S, Parmigiani G, Gilks B, Naoki K, Bhattachar-jee A, et al. Gene expression profiling reveals reproducible inde-pendent patient cohorts. J Clin Oncol 2006;24:5079–5090.
27. Liu Y, Borchert GL, Surazynski A, Hu CA, Phang JM. Prolineoxidase activates both intrinsic and extrinsic pathways forapoptosis: the role of ROS/superoxides, NFAT and MEK/ERKsignaling. Oncogene 2006;25:5640–5647.
28. Sweet-Cordero A, Mukherjee S, Subramanian A, You H, Roix JJ,Ladd-Acosta C, et al. An oncogenic KRAS2 expression signatureidentified by cross-species gene-expression analysis. Nature Genet2005;37:48–55.
29. Samuels Y, Wang Z, Bardelli A, Silliman N, Ptak J, Szabo S,et al. High frequency of mutations of the PIK3CA gene in humancancers. Science 2004;304:554.
30. Yokoi S, Yasui K, Iizasa T, Imoto I, Fujisawa T, Inazawa J.TERC identified as a probable target within the 3q26 ampliconthat is detected frequently in non-small cell lung cancers. ClinCancer Res 2003;9:4705–4713.
31. Massion PP, Kuo WL, Stokoe D, Olshen AB, Treseler PA,Chin K, et al. Genomic copy number analysis of non-smallcell lung cancer using array comparative genomic hybridization:implications of the phosphatidylinositol 3-kinase pathway. CancerRes 2002;62:3636–3640.
32. Shayesteh L, Lu Y, Kuo W-L, Baldocchi R, Godfrey T, Collins C,et al. PIK3CA is implicated as an oncogene in ovarian cancer.Nature Genet 1999;21:99–102.
33. Johnson BE, Janne PA. Selecting patients for epidermal growthfactor receptor inhibitor treatment: a FISH story or a tale ofmutations? J Clin Oncol 2005;24:6813–6816.
J Pathol 2008; 214: 347–356 DOI: 10.1002/pathCopyright 2007 Pathological Society of Great Britain and Ireland. Published by John Wiley & Sons, Ltd.
Top Related
Copyright © 2022 FDOKUMEN

