


Bahasa
Halaman
Hukum


University of Pennsylvania University of Pennsylvania
ScholarlyCommons ScholarlyCommons
Accounting Papers Wharton Faculty Research
9-2009
Explicit Relative Performance Evaluation in Performance-Vested Explicit Relative Performance Evaluation in Performance-Vested
Equity Grants Equity Grants
Mary Ellen Carter
Christopher D. Ittner University of Pennsylvania
Sarah L. C. Zechman
Follow this and additional works at: https://repository.upenn.edu/accounting_papers
Part of the Accounting Commons
Recommended Citation Recommended Citation Carter, M., Ittner, C. D., & Zechman, S. C. (2009). Explicit Relative Performance Evaluation in Performance-Vested Equity Grants. Review of Accounting Studies, 14 (2), 269-306. http://dx.doi.org/10.1007/s11142-009-9085-8
This paper is posted at ScholarlyCommons. https://repository.upenn.edu/accounting_papers/88 For more information, please contact [email protected].
Explicit Relative Performance Evaluation in Performance-Vested Equity Grants Explicit Relative Performance Evaluation in Performance-Vested Equity Grants
Abstract Abstract Using data from FTSE 350 firms, we examine factors influencing explicit relative performance evaluation (RPE) conditions in performance-vested equity grants. We provide exploratory evidence on whether the use or characteristics of RPE are associated with efforts to improve incentives by removing common risk, other economic factors discussed in the RPE literature, or external pressure to implement RPE. We find that many of these economic factors, including common risk reduction, are more closely related to specific relative performance conditions than to the firm-level decision to use RPE in some or all of their equity grants. We also find that greater external monitoring by institutional investors or others is associated with plans with tougher overall RPE conditions. The relative performance conditions are binding in most RPE plans, with nearly two-thirds of the grants vesting only partially or not vesting at all. Further, we find evidence that vesting percentages vary in RPE and non-RPE plans.
Keywords Keywords restricted stock grant, equity plan, dividend playout ratio, stock option grant, compensation risk, RPE, equity-based pay, dividend yield, executive compensation contract, equity incentive, institutional investor, stock return volatility, London stock exchange, stock market performance, share price performance
Disciplines Disciplines Accounting
This journal article is available at ScholarlyCommons: https://repository.upenn.edu/accounting_papers/88

Explicit Relative Performance Evaluation in Performance-Vested Equity Grants
Mary Ellen Carter Christopher D. Ittner
Sarah L. Center Zechman
The Wharton School University of Pennsylvania
Current Version: June 2007
Abstract ______________________________________________________________________________ Using data from FTSE 350 firms, we examine the factors influencing the explicit use of relative performance evaluation (RPE) in performance-vested equity grants, and whether RPE is used to improve incentives or to opportunistically increase vesting and/or placate external parties calling for its use. We find little evidence that the simple decision to use or not use RPE is associated with the economic factors identified in RPE theories. Instead, these factors are associated with specific RPE performance conditions. The relative performance conditions are binding in most RPE plans, with nearly two-thirds of the grants vesting only partially or not vesting at all. However, we find no evidence that vesting percentages are higher in RPE plans than in non-RPE plans, and no evidence that RPE is used opportunistically to increase vesting and compensation. ______________________________________________________________________________ We thank Stan Baiman, Gavin Cassar, Dave Larcker, Rick Lambert, and seminar participants at the University of Pennsylvania for their comments. The financial support of The Wharton School, Ernst & Young, and the Deloitte Foundation is gratefully acknowledged.
1
Explicit Relative Performance Evaluation in Performance-Vested Equity Grants
1. Introduction
A major result in agency theory is that relative performance evaluation (RPE) can improve
incentive contracting by insulating managers’ compensation from random shocks that also affect the
performance of other managers in the same industry or market (Murphy, 1999; Prendergast, 1999).
Despite this result, empirical studies find relatively little explicit use of RPE in US executive
compensation contracts, and only mixed evidence on its implicit use (Murphy, 1999). The limited
evidence on the use of relative performance evaluation has led researchers to develop a variety of
theories to explain this limited use.1 A significant shortcoming of empirical tests of these theories is the
limited disclosure on the use of performance targets in US executive compensation contracts. As a
result, most studies have been forced to infer the use of RPE, causing a number of empirical
specification problems (Murphy, 1999; Bannister and Newman, 2003). In contrast, many companies in
the United Kingdom employ explicit RPE in their equity incentive plans (i.e., restricted stock and stock
option grants). These “performance-vested” equity plans link the vesting of equity grants to the firm’s
performance relative to a company-defined “comparator” group or market index. UK executive
compensation disclosure rules lead the vast majority of these firms’ Annual Reports to provide the
specific comparator groups used to evaluate relative performance, together with information on other
important vesting criteria and the extent to which the firms have met their performance targets.
Using information from the 2002 Annual Reports and Accounts of FTSE 350 firms, we examine
the use and strength of relative performance evaluation in UK firms. This information, together with
data on the achievement of performance targets reported in the firms’ 2005 Annual Reports, is used to
investigate three broad research questions: (1) Do the hypothesized determinants of RPE adoption
identified in theoretical models explain the use or non-use of RPE in performance-vested equity plans?;
1 See, for example, Dye (1984), Janikiraman, Lambert, and Larcker (1992), Aggarwal and Samwick, (1999), and Garvey and Milbourn (2003), among others.

2
(2) Do these same factors explain the use of specific relative vesting conditions (such as vesting hurdles
versus ranges, required performance rankings, and choice of comparator groups) that have received little
attention in RPE models?; and (3) Is the achievement of relative performance targets related to the
selective choice of comparator firms or other RPE plan characteristics?
In addition to allowing us to avoid the empirical problems encountered when inferring the use of
RPE, the UK sample offers a number of advantages for our study. First, the disclosures provide detailed
information on the specific relations between RPE and equity grant vesting. Although agency theory
predicts that companies using RPE will measure performance relative to a peer group mean or median,
many of the RPE relations in our sample are much more complex.2 For example, considerable variation
exists in the minimum percentile ranking needed for vesting, the use of performance hurdles versus
performance payout ranges, and the spread between the performance ranking needed for minimum and
maximum vesting. These variations are due (at least partially) to differences in RPE plans designed to
remove common risk versus plans designed to provide greater incentives to outperform competitors.
Indeed, the use of relative performance evaluation in these firms’ equity plans is significantly different
than the compensation elements examined in nearly all RPE models. Taking all of these factors into
account allows us to contribute to the limited research on compensation contract complexity (e.g., Kole,
1997) and target setting (e.g., Merchant and Manzoni, 1989; Indjejikian and Nanda, 1999, 2002;
Murphy, 2001; Leone and Rock, 2002).
Second, the detailed data on the specific comparator groups used for RPE and the subsequent
achievement of equity plan performance conditions provide the opportunity for more direct tests of
claims that firms selectively choose peer groups to enhance their relative standing and increase
compensation (e.g., Morgenson, 2006; Lewellen, Park, and Ro, 1996). Third, performance-vested equity
grants are already widely used by firms outside the United States and are being adopted by a growing
2 Murphy’s (1999) survey evidence identifies similar complexity in US firms using RPE in annual bonus plans. Also see Matsumura and Shin (2006) for a study of an RPE incentive plan in which bonus payouts increase the greater the organization’s ranking versus its peer group.

3
number of US firms (Towers Perrin, 2005). Consequently, our analyses investigate an increasingly
important compensation component and highlight opportunities for future research.
Finally, this research setting allows us to extend the literature on the influence of institutional
investors and external monitoring on compensation contract design. UK institutional investors are
among the strongest proponents of RPE use in performance-vested equity grants. Some argue that
external pressure such as this can improve governance and compensation practices. However, others
charge that firms respond to external pressure by implementing the external parties’ recommendations in
order minimize challenges to their compensation practices, while making performance targets easily
achievable in order to limit their actual effect on pay (e.g., Westphal and Zajac, 1994, 1998; Zajac and
Westphal, 1995). The available data allow us to provide further evidence on whether firms adopt
external parties’ recommended compensation components to improve incentives or to placate the
external parties while shielding actual compensation from the recommended components’ impact.
Our results suggest that examining the simple use or non-use of RPE provides relatively little
insight into the determinants of RPE in performance-vested equity grants. Instead, the hypothesized
determinants are more strongly associated with the specific characteristics of the relative performance
conditions. When RPE is used to remove common risk to evaluate executive performance, firms are
more likely to use performance hurdles rather than payout ranges and to require lower relative rankings
for minimum vesting to occur. The use of performance relative to market indices (rather than
performance relative to self-selected comparator groups) is more likely when the correlation between
firm and market returns is higher, consistent with economic theories which argue that the choice of RPE
targets should reflect the extent to which the relative peer group removes common noise from
performance measure. Equity grants to executives with greater firm-specific wealth are associated with
plans that do not use RPE or that use relative performance conditions that are less stringent. We also
find some evidence that more stringent relative performance conditions are used to increase risk-taking
incentives. However, we find little or no evidence that RPE use or performance conditions are associated
with past relative financial performance or competition.
4
Our results do not support claims that firms opportunistically use RPE to increase vesting
probabilities and/or to placate external monitors. In contrast to studies using peer group performance
graphs in US proxy statements (Lewellen et al., 1996; Porac et al., 1999), we find no evidence that firms
use self-selected comparator groups (rather than pre-defined indices) to provide easier performance
targets. Ex ante selection biases (based on prior firm returns relative to the chosen comparator group)
are not statistically different in plans using self-selected comparator groups and those using pre-defined
indices. In addition, the past returns of self-selected comparator groups are significantly greater than
those in the firms’ relevant FTSE market or industry indices, suggesting that self-selected groups
generally provide more difficult performance targets. Actual vesting percentages following the typical
three year vesting period provide further evidence that RPE use tends to be economically motivated.
Nearly 30% of the RPE plans do not vest after three years, and 38% of those that do vest do not vest
fully, indicating that the performance conditions are binding in most plans. Moreover, actual vesting
percentages are not statistically higher in RPE plans than in non-RPE plans, again suggesting that RPE
plans are not being used opportunistically to increase vesting probability and compensation.
Greater external monitoring is associated with plans having stringent RPE performance
conditions, consistent with external monitors providing better governance and increasing incentives to
improve firm performance. We find no evidence that greater external monitoring leads to greater use of
simple payout hurdles, lower relative rankings for minimum vesting, self-selected (and potentially
biased) comparator groups, or greater ex ante selection biases or actual vesting percentages. This
evidence suggests that RPE plans do not provide easily achievable “window-dressing” to placate
institutional investors and other external monitors.
The remainder of the paper is organized as follows. Section 2 provides an overview of
performance-vested option grants in the UK and develops our hypotheses. Section 3 discusses our
sample and variables. Empirical results are provided in Section 4. Section 5 offers our conclusions.
5
2. Background and Hypotheses
2.1 Performance Conditions in UK Equity Compensation Contracts
The vast majority of long-term incentive plans in large UK companies link the vesting of stock
option or restricted stock grants to performance relative to a chosen comparator group and/or other
performance targets. The increasing use of “performance-vested” equity grants dates from the issuance
of the UK government’s 1995 Greenbury Report on best practices for directors’ remuneration
(Greenbury, 1995). With respect to equity incentive plans, the Greenbury committee sought to prevent
executives from benefiting from upward movements in stock prices that related more to general market
gains than to improvements in firm performance. Their report recommended that vesting requirements
in equity plans include the achievement of “challenging performance criteria,” and encouraged
remuneration committees to consider “criteria which measure company performance relative to a group
of comparator companies in some variable, or set of variables, reflecting the company’s objective.” The
use of relative total shareholder returns was prominently recommended, with the use of absolute share
price or other absolute performance measures reflecting general inflation, market, or industry
movements strongly frowned upon. The recommendations in the Greenbury Report, together with
recommendations by other British corporate governance committees and pressure from institutional
investors such as the Association of British Insurers and the National Association of Pension Funds,
provided considerable impetus for the widespread, voluntary adoption of performance conditions in
equity incentive plans for UK executives.3
The performance conditions in these plans take a variety of forms. The two most common
performance targets are earnings per share (EPS) growth above the change in the retail price index
(thereby controlling for inflation), and total shareholder returns (TSR) relative to a comparator group.
3 Unlike the United States, where the accounting treatment of performance-vested options and traditional time-vested options differed until 2006 (with the value of performance-vested options required to be expensed), the accounting treatment of the two types of options does not differ in the UK. See Conyon, Peck, Read, and Sadler (2000), Chuhahary and Orszag (2003, 2005), and Main (2006) for empirical studies examining non-RPE performance targets in UK performance-vested option plans. Also see Bettis, Bizjak, Coles, and Kalpathy (2007) and Gerakos et al. (2007) for studies examining performance-vested equity grant adoption in the US.

6
When relative performance evaluation is used, the chosen comparator group can be a pre-defined index
(such as the FTSE 350 index or a FTSE industry index) or a group of competitors independently picked
by the firm. Vesting percentages can be based on a performance hurdle, where 100% of the equity grant
vests when the firm exceeds a performance threshold (e.g., achievement of a real EPS growth target or
median relative performance), or can vary within a performance range (e.g., a sliding scale from 50%
vesting at median relative performance to 100% vesting when the firm tops its comparator group). The
typical performance evaluation period is the three years following the grant. However, some plans
include “retesting” provisions that allow the achievement of performance conditions to be reevaluated in
subsequent years if they are not achieved in the initial three year period.4 The same performance
conditions cover the entire executive team in most companies, and the chosen targets generally remain in
effect over multiple years, minimizing any performance target “ratchet effect” (e.g., Indjejikian and
Nanda, 1999; Leone and Rock, 2002). Examples of the performance conditions used by firms in our
sample are provided in Appendix A.
2.2 Prior Literature on RPE Use
Principal-agent theory posits that RPE can improve incentive contracting by insulating the agent
from common uncertainty affecting the agent’s performance (e.g., Baiman and Demski, 1980;
Holmstrom, 1982). Despite this theoretical result, empirical studies find only limited use of RPE in US
executive compensation contracts.5 One limitation in these studies is the lack of explicit information on
the use of RPE. Instead, most researchers have been forced to infer RPE use by regressing executive pay
on firm and industry performance. Drawbacks of this approach include identifying the appropriate
performance measure (e.g., accounting results or market returns), comparator group (which can vary
significantly from firm-to-firm and need not be a pre-defined industry or market index), and
4 Common retesting provisions allow performance to be reevaluated over cumulative three year periods that incorporate the fourth and/or fifth years following the grant. Some firms increase the performance targets when retesting is employed. 5 See, for example, Antle and Smith (1986), Barro and Barro (1990), Gibbons and Murphy (1990), and Janakiraman et al. (1992).

7
compensation component covered by RPE (Bannister and Newman, 2003). In addition, the payoff
structure in RPE plans is frequently non-linear (Murphy, 1999), limiting the ability of standard
regression estimates that assume linear contracts to detect RPE. Zhou and Swan (2003), for example,
find that estimates of pay-performance sensitivities using regression models are downwardly biased
when incentive contracts include a performance hurdle, as they often do in RPE contracts.
A smaller number of studies have examined explicit RPE in US executive incentive contracts
using data from compensation consultant surveys (Murphy, 1999) or discretionary proxy statement
disclosures (Byrd, Johnson, and Porter, 1998; Bannister and Newman, 2003). These studies generally
find greater (though still modest) use of RPE compared to studies examining implicit RPE use. More
importantly, Murphy (1999) finds that inferences from implicit tests of RPE use at odds with survey data
on explicit use in the same firms, raising questions regarding the validity of tests employing indirect
measures of RPE. By focusing on explicit RPE in UK equity grants, we avoid the need to infer its use.
2.3 Hypotheses
2.3.1 Economic Determinants of RPE Use
Prior literature suggests a number of reasons why firms may or may not incorporate RPE into
compensation contracts. Agency theory indicates that RPE will be more beneficial in settings where a
risk-averse agent is subject to performance shocks unrelated to effort, and where these shocks are
common across peer groups (Holmstrom, 1982). In these settings, relative performance evaluation
allows the firm to improve contracting by filtering out this common risk when assessing performance.
The empirical implication is that the degree of RPE should increase in the extent of common risk
(Janakiraman et al., 1992; Murphy, 1999; Prendergast, 1999). Thus, our first hypothesis:
H1: The use of RPE in equity plans is positively related to the extent of common risk experienced by the firm and its peer group.
Two factors that may reduce the benefits from RPE are strategic competition and the ability of
executives to filter out market-wide shocks on their own by accessing capital markets. Aggrawal and

8
Samwick (1999) and Joh (1999), for example, argue that firms operating in concentrated industries may
limit the use of RPE to avoid aggressive competition or collusive behavior that harms shareholders.
Their studies provide empirical support for this theory, finding negative associations between implicit
RPE use and industry concentration in the US and Japan, respectively. Garvey and Milbourn's (2003)
model predicts that RPE is also less valuable when executives can hedge market risk on their own, which
they argue is associated with the executives’ wealth. RPE studies by Garvey and Milbourn (2003) and
Rajgopal, Shevlin and Zamora (2006) provide empirical support for this prediction. These results lead to
the following hypotheses:
H2: The use of RPE in equity plans is negatively related to industry concentration. H3: The use of RPE in equity plans is negatively related to executive wealth.
In one of the few theoretical models examining the use of RPE in performance-vested equity
plans, Câmara (2001) compares the valuation of equity grants with RPE-based performance conditions
to those with absolute performance conditions. Holding the Black-Scholes value of the grant constant,
he finds that plans that link vesting to a comparator group provide stronger incentives to increase risk
and dividend payouts, but do not provide stronger incentives for improving shareholder wealth. In
contrast, Johnson and Tian’s (2000) model indicates that performance-vested options also provide
stronger incentives to increase share price, but they do not examine the use of relative versus absolute
vesting conditions. Both the Johnson and Tian (2000) and Câmara (2001) studies focus on option
valuation, and neither addresses principal-agent problems. Hvide (2002), on the other hand, develops an
agency model that examines the impact of tournament rewards on risk-taking. He shows that
tournament-based RPE can lead executives to undertake overly risky investments to maximize their
chance of winning the tournament while minimizing effort levels. As a result, his model suggests that
RPE will be lower in situations where the firm does not want to promote greater risk-taking. The
implications of these results for our cross-sectional tests are unclear. If firms with lower than desired
risk-taking, dividend payouts, and stock returns in the past use RPE to increase these attributes in the

9
future, past risk-taking, dividend payouts, and stock returns should be negatively associated with current
RPE use. In contrast, if firms use RPE to provide incentives to maintain already high risk-taking,
dividends, and stock returns, the associations should be positive. Given these contrasting predictions, we
examine the following non-directional hypothesis:
H4: The use of RPE in equity plans is related to past risk-taking, dividend payout ratios, and
firm stock market performance.
2.3.2 Opportunistic RPE Use
The preceding hypotheses assume that firms adopt RPE to minimize principal-agent problems.
An alternative explanation is that firms opportunistically use RPE to increase the probability that the
equity grants will vest, thereby increasing compensation. Various academic researchers and business
writers contend that the ability of firms to choose their own comparator groups or to set low relative
performance hurdles allow executives to minimize RPE’s impact on compensation by making the
performance conditions easy to achieve (e.g., Dye, 1984; Morgenson, 2006; Lewellen et al., 1996; Porac
et al , 1999). Studies using the required peer group performance graphs in US proxy statements support
the contention that firms opportunistically select peer groups to enhance their relative performance.
Lewellen et al. (1996), for example, find that companies exploit reporting discretion allowed by the SEC
to choose peer groups that underperform the industry or broad market indices for the firm. The authors
interpret these results as reflecting a downward bias in the firms’ choice of performance benchmarks.
A limitation of these studies is that the peer groups disclosed in US proxy statements are not
required to be the firms used to make compensation decisions. As a result, Byrd et al. (1998) examine
the small subset of firms that report using the disclosed peer group for determining executive pay
(typically for benchmarking purposes rather than relative performance evaluation). They find that
compensation levels in the chosen peer groups exceed those of companies in the firms’ S&P industry
indices, but conclude that this difference reflects the self-chosen peer groups being more appropriate
10
compensation benchmarks than firms in the relevant industry indices, and is not due to peer groups being
selectively chosen to increase compensation.
The potential for opportunistic use of RPE leads to the following hypothesis:
H5: RPE plans are associated more easily achievable performance conditions and higher vesting percentages than non-RPE plans.
2.3.3 External Monitoring
UK institutional investors are among the strongest proponents of RPE conditions in executive
equity grants, and studies suggest that the widespread adoption of performance-vested equity plans in
UK firms is a direct result of this external pressure (e.g., Main, 2006). If true, we expect the use of RPE
to be positively associated with institutional holdings and external monitoring. Thus, the following
hypothesis:
H6: The use of RPE is positively associated with the extent of external monitoring.
Even if firms adopt RPE in response to external pressure, the form of the RPE conditions is
unclear. On one hand, greater external monitoring may improve corporate governance and thus improve
incentive contracting. Institutional investors contend that greater external pressure and improved
governance should lead firms to adopt relative performance conditions that are more stringent (e.g.,
Association of British Insurers, 2004). On the other hand, symbolic management and institutional
theories argue that firms often adopt token compensation elements (or “window-dressing”) that are
desired by external stakeholder groups such as institutional investors in order to protect the organization
from having its compensation decisions questioned while insulating managers’ compensation from the
recommended practices (e.g., Meyer and Rowan, 1977; Westphal and Zajac, 1994, 1998; Zajac and
Westphal, 1995).
Related studies provide some support for window-dressing claims. Gerakos et al. (2007) find
that US firms with greater institutional holdings are more likely to adopt performance-vested options
(which are actively promoted by US pension funds), but that in most cases these options are simply
11
“add-ons” to large traditional option grants, thereby limiting their influence on the firms’ compensation
practices. Porac et al. (1999) find that firms select more tailored (and potentially more biased) peer
groups when firms perform poorly, CEOs are highly paid, and shareholders are powerful and active.
If RPE represents opportunistic “window-dressing” in response to institutional pressure, we
expect RPE use to be greater in firms with more external pressure, but the RPE conditions to be less
binding due to the choice of weaker comparator firms and/or lower performance thresholds, thereby
increasing vesting probability. In contrast, if RPE adoption in response to external pressure represents
stronger governance, we expect RPE to be associated with greater external influence, but should not find
weaker performance conditions in these plans. We test whether RPE is used as window-dressing to
placate external parties by examining the following joint hypothesis:
H7: The use of RPE in equity plans is positively related both to the extent of external monitoring and to the inclusion of more easily achievable performance conditions.
3. Sample and Variables
3.1 Sample selection and data sources
Our initial sample consists of constituents of the Financial Times Stock Exchange (FTSE) 350
index as of December 2004. These companies represent the 350 largest firms by market capitalization
on the London Stock Exchange. We obtain each company’s Annual Reports and Accounts for the 2002
fiscal year from the company’s website or the Thompson Research database.6 Details on the executive
directors’ equity compensation plans are then obtained from the Remuneration Committee report and/or
the footnotes to the financial statements.7 Appendix A provides examples of these disclosures. If the
6 We use data from 2002 Annual Reports to allow comparisons of firms’ performance versus their chosen RPE comparator groups in the years following the equity grant. Most of the plans incorporate a three-year vesting schedule, giving us an interval long enough to obtain actual payout data. Annual Reports for a handful of companies could not be located from these sources. These companies are excluded from the sample. 7 The Directors’ Remuneration Report Regulations 2002 (DRRR) formally require each UK firm to include a detailed remuneration report in the Annual Report and Accounts for all fiscal years ending on or after December 31, 2002. Since some of the companies in our sample do not have December 31 fiscal year ends, their 2002 reports fell under the 1998 Combined Code, which contained similar compensation disclosure requirements as the DRRR. While compliance with the Combined Code was not mandatory, it was appended to the listing rules for the London Stock Exchange such that any instance of non-compliance was required to be justified to shareholders. Consequently, differences in disclosure requirements should not have a significant effect on our data.
12
company operates more than one equity plan, each plan is included in the sample since individual plan
characteristics tend to be significantly different. We exclude plans that were not active in 2002, plans
that involve share-save (i.e., savings plan) schemes, or plans that match executives’ equity purchases.
Our initial sample includes 391 equity plans offered by 272 companies. We subsequently exclude 21
plans where the performance conditions relate to the grant, 16 plans with no performance conditions, and
13 with undisclosed performance conditions. The final sample for our analyses consists of 341 plans in
252 firms.8
Sample selection criteria and descriptive statistics on RPE characteristics are provided in Table
1. Relative performance evaluation is used more frequently in long-term incentive plans (LTIPs) that
grant restricted stock than in stock option plans (73.5% of LTIPs vs. 27.3% of stock option plans). Most
firms have one (67.1%) or two (31.0%) equity compensation plans. Total shareholder returns (TSR)
relative to peers is the most common RPE target (91.7% of RPE plans use TSR), with the remainder
using earnings per share (EPS) or some other performance measure. Seventy-seven RPE plans include a
hand-selected comparator group, and 60 utilize a pre-defined market group such as a FTSE index
(Annual Reports did not provide details on the comparator groups used in the remaining 8 plans).9 Of
the RPE plans with available data, the vast majority (76.2%) set a payout range, within which greater
vesting is obtained with higher performance, while the remaining RPE plans set a minimum hurdle (e.g.,
performance at or above the industry median) to obtain full payout or vesting. Finally, 34 RPE plans
allow for performance to be “retested” over longer time periods if the company does not reach its
performance targets during the initial performance period.
We obtain data from a variety of sources to examine the hypothesized determinants of RPE use
and characteristics. Financial statement information, institutional holdings, and segment data are
obtained from Worldscope, board of directors’ information from the company’s Annual Reports and
8 One firm has an undisclosed contingency. We assume that this contingency is on vesting since vesting conditions dominate our sample. 9 We find no significant mean or median differences in our independent variables between firms disclosing their specific comparator groups and those not disclosing this information. We also find no significant differences in firms disclosing or not disclosing their performance conditions.

13
Accounts or 2003 Hemscott’s Directory of Directors, stock return information from Datastream, and
FTSE index returns from Bloomberg.
3.2 Research Design
3.2.1 Variables capturing economic determinants
We use the following variables to examine the hypothesized economic determinants of RPE use
and strength.
Common Risk. RPE use is expected to be greater when the common risk experienced by the
firm and its peers is higher (Hypothesis 1). We use two variables to proxy for common risk. Similar to
Janakiraman et al. (1992), our first variable uses coefficients from regressions of firm stock market
returns on broad market or industry returns over the prior four years, and captures the extent to which the
firm’s returns experience similar shocks as those of their peers. We focus on stock returns due to the
dominant use of shareholder returns as the performance target in UK RPE plans. Two separate measures
are employed to reflect the market or industry indices typically used in these plans. CORR_RET (BRD)
equals the absolute value of the coefficient on returns to the broad FTSE 350 index and CORR_RET
(IND) equals the absolute value of the coefficient on returns to the firm’s FTSE industry index.10 Each
variable is rescaled to range from 0 (lowest correlation) to 1 (highest correlation).
Our second variable captures settings where the correlation between firm and peer returns is
higher and there is more noise in performance measures that needs to be removed. Even if firm returns
are highly correlated with peers’ returns, RPE may provide few benefits if performance measures have
little noise. Consistent with prior compensation studies, we measure noise using the volatility in stock
return measures. We measure volatility using the standard deviation of monthly stock returns over the
24 months preceding fiscal year end 2001, rescaled to range from 0 (lowest volatility) to 1 (highest
10 An obvious limitation of using these two measures is the implicit assumption that pre-defined indices are the appropriate peer groups. We address this issue later in the paper by examining the determinants of whether a firm chooses a pre-defined index or a self-selected set of firms as its peer group.

14
volatility). The variable COMMONRISK equals the interaction between CORR_RET and the volatility
measure, with separate COMMONRISK measures computed using FTSE market and industry indices.
Market Concentration. We capture the extent to which the firm is a significant player in a
concentrated market (Hypothesis 2) using two variables: (1) the 2001 Herfindahl index (based on sales)
for the firm’s industry (an industry concentration measure), and (2) the firm’s 2001 share of sales by
companies in its FTSE industry group (a measure of the firm’s standing in the industry). The two
variables load on a single factor, with the construct CONCENT equal to the average standardized value
of the two.
Executive Wealth. Garvey and Milbourn’s (2003) model predicts that RPE is less valuable when
executives can hedge market risk on their own, which they argue is associated with executives’ wealth
(Hypothesis 3). RPE studies by Garvey and Milbourn (2003) and Rajgopal et al. (2006) proxy for CEO
wealth using data on compensation and equity holdings in the firm. Similarly, we proxy for the
executive team’s wealth using the log of the value of the executives’ equity holdings, calculated as the
number of shares held multiplied by share price at the end of 2001.11
RPE Incentives. Three variables are used to test whether equity grants with relative performance
conditions are associated with incentives to increase share price, dividends, and risk (Hypothesis 4).
ADJ_RET equals cumulative stock returns over the prior four years less cumulative returns over this
period for two peer groups: the FTSE 350 (ADJ_RET (BRD)) or the firm’s FTSE industry (ADJ_RET
(IND)).12 DIVYLD is annual dividend per share divided by price per share, averaged over the prior
three years. BOOKMKT is the prior ratio of the book value of equity to the market value of equity
(measured at the end of 2001), and proxies for the need for increased risk-taking (Gerakos et al., 2007). 11 Garvey and Milbourn (2003) and Rajgopal et al. (2006) use CEO equity holdings and CEO age to proxy for the executive’s ability to hedge market risk. We include a proxy for the wealth of the entire executive team because nearly all of the equity plans in our sample cover the whole executive team, not just the CEO. For similar reasons, we do not include the CEO’s age as a proxy for hedging ability. Clearly, firm-specific wealth is an imperfect proxy for total wealth, and may also reflect an undiversified portfolio (which may lead to greater need for RPE to protect undiversified executives from firm-specific risk) and the need for incentives to improve firm performance (which may already be high given extensive executive stock holdings, reducing the need for RPE). Results using LN_WLTH should be interpreted accordingly. 12 Although we use industry-adjusted returns to proxy for the need for RPE incentives, Rajgopal et al. (2006) use this measure to proxy for managerial quality, which they argue should be inversely related to the need for RPE.

15
3.2.1 Variables capturing opportunism
We use several proxies for greater ex-ante and ex-post vesting likelihood to examine whether the
use of RPE reflects opportunism and/or window-dressing. First, we consider whether the choice of
comparator groups is associated with economic factors or opportunism. Firms can pick a pre-defined
index (such as the FTSE 350 or FTSE industry group) as their comparator group or can choose their own
comparator group. Agency theory suggests that self-selected comparator groups are appropriate if pre-
defined indices do not adequately remove random shocks from performance measures. However, firms
may also opportunistically self-select a comparator group of under-performing firms in order to improve
relative performance comparisons. We begin examining this issue using an indicator variable (denoted
INDEX) that equals one if the firm selects a pre-defined index and zero if the firm selects its own group.
If the choice of comparator groups is driven by the peer groups’ ability to remove random shocks from
performance measures, then the correlation of the firms’ returns with those of pre-defined indices should
be positively related to the use of market or industry indices for performance comparisons.
Second, we consider whether firms pick comparator groups they expect to outperform based on
past performance. Similar to Lewellen et al. (1996), we examine whether firm stock returns in the three
years ending fiscal 2001 exceeded the chosen comparator groups’ returns over the same period
(PRE_BIAS). We also examine whether the market returns of self-selected comparator firms over these
three years are lower than the returns to the FTSE 350 or the firms’ FTSE industry index (denoted
BIAS_RET_350 and BIAS_RET_IND, respectively), under the assumption that lower returns in self-
selected comparators groups (relative to alternative pre-defined indices) are indicative of the biased
choice of peers that the firm expects to outperform in the future (Lewellen et al., 1996).13
Finally, we use two variables to examine the extent to which the plans actually met their
performance conditions and vested, with opportunism expected to be associated with higher actual
13 The most commonly used pre-defined indices in UK RPE plans are the FTSE 350, size-adjusted FTSE indices (FTSE 100 or FTSE 250), and FTSE industry indices. Correlations between the FTSE 350 returns and the FTSE size-adjusted indices exceed 0.90 and produce nearly identical results to those using the FTSE 350 index. Consequently, we do not report results using the size-adjusted indices to simplify presentation.
16
vesting and payouts. First, we use the variable %VEST to measure the percentage of the grant that
actually vested after three years (the performance evaluation period used in most of our sample).
Second, we multiply the vesting percentage by the maximum value of the grant as a percent of salary
(%PAYOUT). If firms use easily achievable performance conditions to increase compensation, then the
actual value of the vested grants (and not just the vesting percentage) should be higher. Where possible,
we use firm disclosures on actual vesting percentages to compute these variables. When these
percentages are not disclosed, we compute payoff percentages using information on the plans’
performance conditions and the firms’ actual performance with respect to these conditions.14
3.2.3 External Monitoring
To capture the influence of external pressure and monitoring on RPE use (Hypothesis 7), we use
three variables measured in fiscal year 2002: (1) the percent of shares held by institutions; (2) the
percent of board seats held by outside directors; and (3) an indicator for whether the board chairman is
an outside director. Principal components analysis reveals that the variables load on one underlying
factor. We therefore compute the construct EXT_MNTR as the equally-weighed standardized value for
these three variables.
3.2.3 Control Variables
We include three control variables in our tests. The first variable (LTIP) is an indicator that
equals one for long-term incentive plans that make restricted stock grants, and zero for stock option
plans. In contrast to non-tradable, at-the-money stock option grants that have no value if stock price
declines, restricted stock grants have value even if the company’s stock price falls. As a result, the need
for RPE (which is typically based on total shareholder returns) to ensure that executives are only
14 The actual equity grant vesting percentage was disclosed for 69.5% of the plans, and we were able to determine the payout for an additional 14.4% of the plans using publicly-available data. If firms had three year performance testing periods but allowed retesting if the performance conditions were not met after this period, we determine the extent to which the grants vested in the initial three year period. Some of the plans (12.0%) were operated by firms that ceased being publicly traded during the three year performance period (due to mergers or going private). Finally, vesting percentages for 4.1% of the plans could not be determined because the performance period was longer than three years, or information on the comparator group, pre-defined index, or performance measure was not publicly-available.

17
rewarded when firm stock market performance is superior to competitors may be greater in LTIPs than
in stock option plans.15
Second, we include the natural log of total firm sales (LN_SALES) to control for organizational
complexity (which can make the selection of a comparable peer group more difficult) and other potential
omitted factors related to firm size. Himmelberg and Hubbard’s (2000) model, for example, argues that
RPE use is less necessary when the CEO is more talented (due to labor market considerations). Their
empirical tests proxy for CEO talent with firm size. Bannister and Newman’s (2003) RPE study, in turn,
uses size as a proxy for external monitoring and stakeholder concerns about pay and performance.
Third, in tests examining ex ante and ex post vesting likelihood, we include the log of CEO
salary as a control variable. Choudhary and Orszag (2007) argue that target difficulty in performance-
vested option grants will be negatively related to CEO salary in order to protect the executive from the
compensation risk arising from tougher targets. Their examination of EPS vesting targets in non-RPE
option plans in the UK supports this hypothesis.
Definitions for all of the variables used in our tests are provided in Appendix B.
4. Results
4.1 The Use of RPE
We begin testing our hypotheses by examining the simple use or non-use of RPE in
performance-vested equity grants. Our dependent variable is PLAN_RPE, which equals one if the plan
utilizes relative performance evaluation, and zero otherwise. We estimate the model using logit, and use
Huber/White standard errors to compute test statistics because many firms have more than one executive
equity plan. Huber/White standard errors, which cluster observations within firms, allow us to relax the 15 For example, the BBA Group’s 2002 Remuneration Committee report notes that:
The Committee selected earnings per share as the measure for the [non-RPE] share option scheme as it is accepted as being a good indicator of long-term corporate performance. TSR is not used as a performance condition for the share option scheme, as it is with the [RPE-based] Long-Term Incentive Plan, as the Committee is of the view that options have an inherent share price performance measure, being the condition that before any reward is given the share price must increase.

18
assumption of independence among plans. Separate models are estimated using FTSE 350 stock market
returns (CORR_RET (BRD) and ADJ_RET (BRD)) and FTSE industry returns (CORR_RET (IND) and
ADJ_RET (IND)) since prior studies examining implicit RPE use find different results depending upon
whether an industry or broad market index is used as the peer group (e.g., Gibbons and Murphy, 1990).
The results from these tests are presented in Table 2. We find little evidence that the use or non-
use of RPE in performance-vested equity grants is associated with the economic factors discussed in the
RPE literature. Contrary to our hypotheses, the coefficients on the CORR_RET and COMMONRISK
variables are not significant. These results provide no evidence that the simple choice to include or not
include RPE is related to the ability of pre-defined market indices to remove noise from performance
measures. The associations between RPE use and industry concentration and executive wealth are also
insignificant, as are the coefficients on the RPE incentive variables. In contrast, we find that firms adopt
RPE in response to external pressure, with the coefficients on EXT_MNTR positive and significant. We
examine whether the external monitoring result reflects improved governance and contracting or
opportunism in subsequent tests.
The strongest determinant of RPE inclusion is whether the plan makes restricted stock or stock
option grants. The coefficients on LTIP are positive and significant in both models, indicating that
equity incentive plans that pay in restricted stock are more likely to include RPE features. This result is
consistent with claims by some British firms that relative performance conditions are more beneficial in
LTIPs because restricted stock always retains positive value for executives regardless of firm
performance, whereas stock options require stock price to increase above the exercise price. As a result,
the perceived need for relative performance conditions to ensure that the firm outperforms competitors
before executives receive equity payouts may be greater in LTIPs.
4.2 RPE Use and Payoff Structure
Although the results in Table 2 provide little evidence that the hypothesized economic factors
explain RPE use in this setting, the dichotomous PLAN_RPE variable ignores the considerable

19
differences in the extent to which firm performance must exceed that of the comparator group for vesting
to occur. As noted earlier, plans vary in the minimum ranking needed for vesting, whether full vesting
occurs when the firm reaches a minimum performance hurdle or continues to increase as the firm’s
relative performance ranking improves, and the spread between the relative ranking needed for minimum
and maximum vesting. For example, the minimum relative ranking needed for initial vesting to occur
ranges from the 25th percentile to the 100th percentile (median = 50th) and the spread between the
percentile rankings needed for minimum and full vesting ranges from 0 to 75 (median = 25). Ignoring
these differences provides a simplistic view of RPE use.
We begin examining the differences in payoff structures in Table 3. Existing RPE theories
provide little guidance on the determinants of these specific practices. Consequently, we estimate the
models using the independent variables from Table 2, and make no predictions regarding the signs of the
relations between these variables and the specific performance conditions. We first investigate the use
of vesting hurdles (rather than payout ranges) and the minimum percentile ranking needed for initial
vesting. Low performance hurdles have been highly controversial in the UK. Institutional investors
claim that low relative performance requirements and simple hurdles that allow all grants to vest when
meeting a low minimum performance hurdle break the link between performance and equity plan
payout, and call for the elimination of these characteristics. The Association of British Insurers’ (2004:
11) remuneration guidelines, for example, state that, “Sliding scales that correlate the reward potential
with a performance scale … are a useful way of ensuring that performance conditions are genuinely
stretching. They generally provide a better motivator for improving corporate performance than a
‘single hurdle’. ” The latter claim is consistent with theoretical work by Brisley (2007), which shows
that option vesting that is an increasing function of stock price can improve risk-taking incentives
relative to vesting at a single point, as well as Brennan’s (2001) comment that the use of hurdles in
relative performance-vested options is unlikely to be optimal.
Panels A and B of Table 3 report results for the use of performance hurdles and minimum
relative performance levels, respectively. Greater COMMONRISK is positively associated with the use

20
of hurdles and negatively associated with the minimum ranking needed for initial vesting to occur,
particularly using industry indices. These results suggest that firms facing greater common risk use RPE
to remove common industry shocks from performance evaluations, rather than to increase incentives to
achieve significantly higher performance rankings relative to competitors. In contrast, neither
CORR_RET measure is statistically significant, indicating that greater correlation in stock returns has
little effect on the use of RPE unless it is also accompanied by greater noise in performance measures.16
Performance hurdles are positively associated with dividend yield and executive wealth, and negatively
associated with book-to-market ratios and firm size. With the exception of COMMONRISK, executive
wealth is the only variable that is significant in the minimum performance rank model. The negative
coefficients on LN_WLTH in Panel B, together with the significant positive associations between this
variable and the use of hurdles in Panel A, indicate that RPE plans for executives with more firm-related
wealth incorporate performance conditions that critics charge are less challenging. External monitoring
is not significantly associated with the use of hurdles or minimum relative performance conditions,
indicating that external pressure has had little influence on either of these controversial choices. LTIPs
are less likely to include performance hurdles, but tend to incorporate minimum performance thresholds
that are not significantly different than stock option plans.
The various payout structure characteristics are not necessarily independent. We therefore draw
on discussions in the UK executive compensation literature to classify the RPE plans into three groups
based on the claimed strength of the relationship between vesting requirements and relative performance.
The first group (denoted WEAK) consists of 18 plans with low minimum ranking requirements (mean =
32nd percentile) and little or no spread between the percentiles need for minimum and maximum vesting
(mean = 5.11). The second group (denoted MID) contains 50 plans requiring median (50th percentile)
performance for initial vesting and having larger spreads between relative rankings for initial and
16 We estimate separate models using CORR_RET and COMMONRISK because these variables are highly correlated (r > 0.60), raising concerns about multicollinearity. We also estimated models using the CORR_RET and stock return volatility main effects as well as the COMMONRISK interaction. Despite the large correlations between the main and interaction effects, the signs and significance levels on COMMONRISK are similar to those reported in the tables, suggesting that the reported results for this variable are not driven by the main effects.

21
maximum vesting (mean = 18.5). The 26 plans in the third group (denoted STRONG) require
performance to exceed the comparator group median for minimum vesting (mean = 54th percentile) and
contain payout ranges with substantial spreads between the rankings needed for minimum and maximum
vesting (mean = 40.5).
We use these groupings to examine whether the hypothesized determinants of RPE use are
associated more with the stringency of the relative performance conditions than with the simple
inclusion or exclusion of RPE conditions. We estimate a multinomial logit model with four RPE
categories (none, WEAK, MID, and STRONG) to examine the choice to use or not use RPE, as well as
the choice to use one form of RPE payout structure over another. The exploratory results (not reported
in the tables) indicate that the correlation between firm and FTSE 350 market returns is positively
associated with the probability that the plan uses WEAK relative performance evaluation rather than not
using RPE. This result provides additional evidence that firms facing greater common risk use RPE to
remove noise in performance measures rather than to provide greater incentives to increase the firms’
relative performance ranking. In contrast, COMMONRISK increases the probability that the firm uses
WEAK or STRONG RPE instead of MID RPE conditions, suggesting that some firms facing greater
common risk use RPE to remove common noise while others use RPE to increase incentives to
outperform competitors.
LN_WLTH is negatively associated with the use of STRONG RPE relative to no RPE,
indicating that executives with greater firm-specific wealth are less likely to face stringent RPE
conditions. Firms with higher book-to-market ratios (an inverse measure of growth opportunities) tend
to use plans with STRONG RPE rather than no RPE or less stringent forms of RPE. Gerakos et al.
(2007) argue that firms with low growth opportunities are more likely to adopt performance-vested
options in order to increase risk-taking incentives. If true, this evidence suggests that these firms are
using plans with strong relative performance conditions to achieve this objective. External pressure and
monitoring is positively related to the use of STRONG (and to a lesser extent MID) RPE versus not
using RPE. These relations suggest that UK firms with stronger external monitoring have responded to

22
institutional investors’ and other external parties’ recommendations to adopt more stringent relative
performance conditions, but is inconsistent with firms adopting RPE conditions to placate these external
parties while incorporating payout structures that ex ante are more likely to be achievable. Larger firms
are also associated with the use of STRONG RPE, while plans without RPE are more likely in larger
firms than plans with WEAK RPE. LTIPs are more likely to incorporate all forms of RPE than to use
non-RPE conditions. Moreover, conditional on RPE being used, the probability of STRONG RPE is
higher in LTIPs than is the probability of less stringent forms of relative performance evaluation.
Overall, our analyses indicate that RPE is associated with at least some of the economic factors
discussed in the agency literature. However, these factors are primarily related to the specific
characteristics of the RPE plans, rather than to the simple decision to use or not use RPE. This evidence,
together with the nearly non-existent theoretical work addressing complex performance-vested RPE
contracts such as those seen in our sample, highlights an important opportunity for future theoretical
research. We find that RPE characteristics are associated with the removal of common risk as well as
the provision of incentives to outperform competitors. Though firms with greater external monitoring
are more likely to implement RPE, higher levels of external pressure are associated with more stringent
performance conditions, not weaker. This result is more consistent with external monitors providing
better governance than it is to opportunistic use of RPE to placate external parties.
4.3 Choice of Comparator Group
Another important, and controversial, RPE characteristic is the comparator group used to evaluate
relative performance. Critics charge that many firms use self-selected comparator groups, rather than
pre-defined indices, to opportunistically choose under-performing peers in order to improve relative
performance comparisons. We conduct a number of tests to examine these claims. Table 4, Panel A
begins by investigating the extent to which the choice between a pre-defined or self-selected comparator
group is driven by the factors examined earlier. The dependent variable in these logit models (denoted
INDEX) equals one if a pre-defined index is used for performance comparisons, and zero if a self-

23
selected comparator group is used. We find that equity plans are more likely to include a pre-defined
index if the firms’ stock returns are more highly correlated with that index or experience greater
common risk with other firms in the index. This evidence is consistent with theoretical predictions that
firms use pre-defined indices when these indices do a better job removing common shocks from
performance evaluations.17
The only other statistically significant variable is LTIP. The use of a pre-defined index is
negatively related to LTIPs, indicating that stock option plans that incorporate RPE are more likely to
use a self-selected comparator group. Even though the use of RPE is positively associated with external
pressure and monitoring, we find no evidence that external monitoring is related to the use of self-
selected comparator groups, which critics charge are more susceptible to opportunistic choice that allows
executives to maximize compensation. This result, together with the significant, positive coefficients on
CORR_RET and COMMONRISK, is more consistent with the choice between pre-defined and self-
selected comparator groups being driven (on average) by economic factors rather than opportunism.
Table 4, Panel B extends the analysis by providing univariate tests of differences between firm
stock returns in the three years ending fiscal 2001 and those of their chosen comparator groups over the
same period (PRE_BIAS). Both mean and median firm returns exceeded those in the firms’ chosen
comparator groups in previous years. However, there are no significant differences in mean or median
PRE_BIAS between firms using pre-defined indices and those choosing their own comparator groups.
While these results may reflect firms picking comparator groups they expect to outperform, the
performance differences do not appear to be related to the type of comparator group included in the
plan.18
17 To provide further evidence on this conclusion, we compared the correlations between stock returns in firms using self-selected comparator group and returns in these firms’ FTSE indices and the self-chosen comparators. Firm returns were statistically more correlated with those in their self-selected peer groups than with returns to the FTSE indices. These results again suggest that the choice between pre-defined and self-selected comparator groups in driven by the peer groups’ ability to remove common noise. 18 Since the same comparator group typically is used for multiple years, these results are also consistent with stickiness in the choice of peer firms. That is, the incentives provided by the RPE conditions may have motivated the firm to outperform its peer group.

24
Table 4, Panel C reports multivariate analyses of the determinants of PRE_BIAS. We examine
whether the choice of potentially easier comparator targets is related to firm characteristics (external
monitoring and firm size) or characteristics of the RPE plan. We find no evidence that the three firm-
level variables are associated with PRE_BIAS. Importantly, the insignificant relations do not support
the hypothesis that firms with greater external pressure implement RPE to placate the external parties
while making the performance conditions easy to achieve. When we estimate the model using four
specific RPE plan characteristics (the use of a pre-defined index, the minimum percentile ranking needed
for initial vesting, the use of a performance hurdle, and the presence of a retesting provision), only the
minimum ranking needed for initial vesting is statistically significant. The significant negative
coefficient on MIN indicates that plans with lower minimum percentile payout levels have larger bias in
prior returns relative to their comparator groups. Thus, firms that require low minimum rankings for
vesting to begin also tend to choose comparator firms they have outperformed in the past.
We also estimate the model after replacing minimum payout percentiles and the use of hurdles
with the variable STRENGTH_RPE, which ranges from 1 (WEAK RPE) to 3 (STRONG RPE) using the
classifcations defined earlier. STRENGTH_RPE is negatively associated with PRE_BIAS, implying
that plans with stronger performance conditions have lower prior bias in returns relative to their chosen
comparator groups.19 In no case is INDEX statistically significant, providing no support for claims that
firms self-select comparator groups that they expect to out-perform in the future.
Finally, we replicate Lewellen et al.’s (1996) analysis of whether the prior market returns of self-
selected comparator firms were lower than the returns to alternative pre-defined indices that the firm
could have chosen (in our case the FTSE 350 (BIAS_RET_350) or the firms’ FTSE industry
(BIAS_RET_IND)). Lewellen et al. (1996) argue that lower returns in self-selected comparator groups
(relative to alternative pre-defined indices) are indicative of the biased choice of peers that the firm
19 We also repeated the analysis using separate indicators for the MID and STRONG RPE groups. Only the coefficient on STRONG is statistically significant, implying that plans with more stringent performance conditions also have lower PRE_BIAS. This finding provides some validation that STRONG plans are less likely to be used for opportunistic purposes.
25
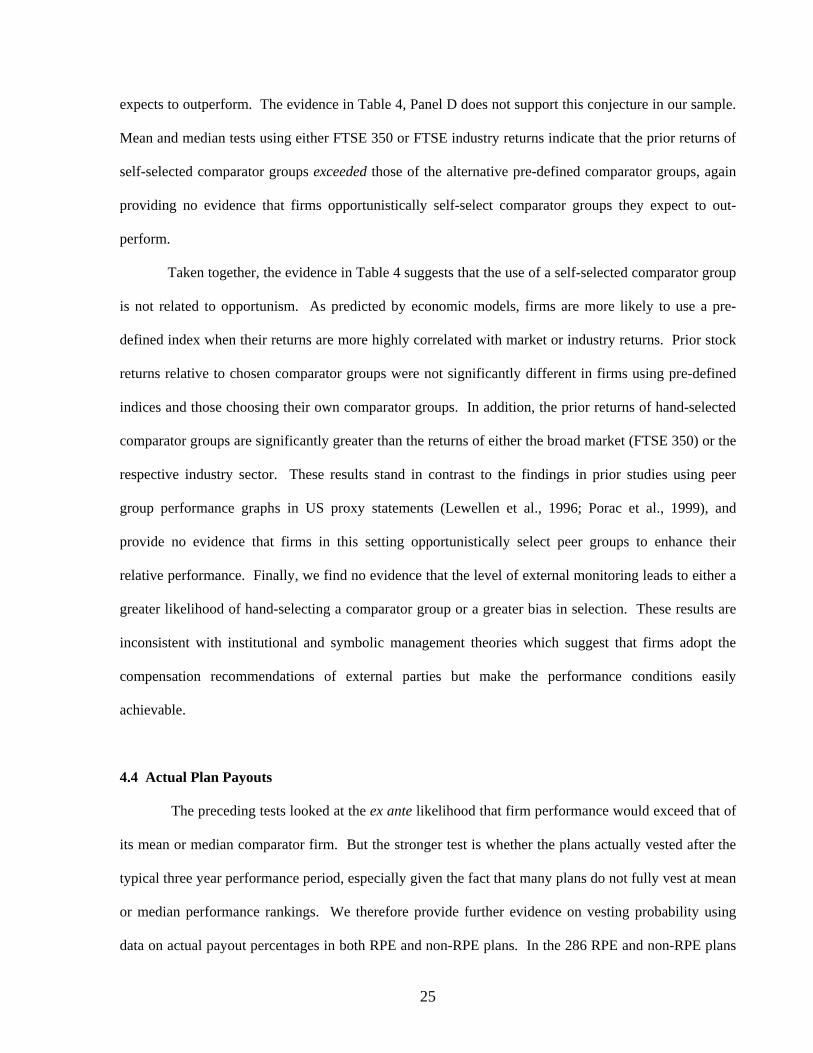
expects to outperform. The evidence in Table 4, Panel D does not support this conjecture in our sample.
Mean and median tests using either FTSE 350 or FTSE industry returns indicate that the prior returns of
self-selected comparator groups exceeded those of the alternative pre-defined comparator groups, again
providing no evidence that firms opportunistically self-select comparator groups they expect to out-
perform.
Taken together, the evidence in Table 4 suggests that the use of a self-selected comparator group
is not related to opportunism. As predicted by economic models, firms are more likely to use a pre-
defined index when their returns are more highly correlated with market or industry returns. Prior stock
returns relative to chosen comparator groups were not significantly different in firms using pre-defined
indices and those choosing their own comparator groups. In addition, the prior returns of hand-selected
comparator groups are significantly greater than the returns of either the broad market (FTSE 350) or the
respective industry sector. These results stand in contrast to the findings in prior studies using peer
group performance graphs in US proxy statements (Lewellen et al., 1996; Porac et al., 1999), and
provide no evidence that firms in this setting opportunistically select peer groups to enhance their
relative performance. Finally, we find no evidence that the level of external monitoring leads to either a
greater likelihood of hand-selecting a comparator group or a greater bias in selection. These results are
inconsistent with institutional and symbolic management theories which suggest that firms adopt the
compensation recommendations of external parties but make the performance conditions easily
achievable.
4.4 Actual Plan Payouts
The preceding tests looked at the ex ante likelihood that firm performance would exceed that of
its mean or median comparator firm. But the stronger test is whether the plans actually vested after the
typical three year performance period, especially given the fact that many plans do not fully vest at mean
or median performance rankings. We therefore provide further evidence on vesting probability using
data on actual payout percentages in both RPE and non-RPE plans. In the 286 RPE and non-RPE plans

26
with available vesting data (excluding the 41 plans that no longer have publicly disclosed information
and the 14 plans where the vesting percentage cannot be determined after three years), only 52.8% fully
vested and 30.8% made no payout. In the subset of RPE plans, 58.1% did not fully vest and 32.3% made
no payout. The mean (median) vesting percentage in plans making partial payouts is 60% (55%). The
relatively low vesting percentages indicate that firms are not selectively choosing performance
conditions to improve vesting probabilities in performance-vested equity grants.
Plans with RPE conditions have statistically lower payout percentages (mean = 57% in RPE
plans versus 67% in non-RPE plans), inconsistent with claims that firms (in general) use RPE instead of
absolute performance standards in order to enhance vesting percentages while appearing to set
challenging performance conditions. We also find no evidence that firms that outperformed their
comparator groups in the past have higher payout percentages. Although firms may have selected
comparator groups they expected to outperform during the subsequent performance evaluation period, in
most cases these expectations did not translate into greater vesting percentages.
Table 5 provides multivariate analyses of the determinants of actual payout percentages in both
RPE and non-RPE plans. Given the censored nature of the vesting percentages, we estimate the models
using Tobit. Since performance hurdles and retesting provisions can be used in both RPE and non-RPE
plans, we include these variables in our analyses to investigate whether these controversial
characteristics influence payouts. We also include a measure of volatility as a control variable since it
may affect ex-post payouts. We find no evidence that RPE plans have statistically different vesting
percentages than non-RPE plans using either the simple PLAN_RPE or the STRENGTH_RPE variables
(Panel A).20 External monitoring and other plan characteristics also have no significant association with
vesting percentages. The only significant variables are LN_SALARY and (in some model
specifications) LTIP and STD_RET. The significant negative coefficients on LN_SALARY indicate
that vesting percentages are lower when salary is higher, consistent with claims that firms offset the
20 For these tests, which include both RPE and non-RPE plans, STRENGTH_RPE is coded zero for non-RPE plans and 1 to 3 for RPE plans depending on their strength. Results are similar when we use separate indicators for the three RPE groupings.

27
compensation risk imposed by more stringent performance targets by increasing salary (Choudhary and
Orszag, 2007). Results are similar in Panel B of Table 5, which examines actual payouts as a percent of
salary (%PAYOUT). In general, the results in Table 5 indicate that vesting percentages tend to be
unrelated to firm and plan characteristics or to the use of RPE performance conditions, providing no
support for claims that RPE is used opportunistically to increase vesting percentages and compensation.
4.5 Payouts for Firms with Multiple Plans
Our final analysis considers whether plan vesting percentages are influenced by the presence of
other equity plans that compensate for the stringent nature of some relative performance targets. For
example, RPE plans with difficult performance conditions may lower payout percentages, but the
presence of other equity plans may be used to shield executives from the compensation risk caused by
the stringent RPE targets. We examine this possibility using 129 firms that have at least one RPE plan,
58 of which have multiple equity plans. In total, these firms operate 190 RPE and non-RPE equity plans.
Firm-level univariate tests indicate that companies operating a single RPE plan have higher vesting
percentages than the average vesting percentages in firms operating multiple plans (at least one of which
uses RPE). However, this difference is only statistically significant at the median. There are no
significant mean or median differences in vesting percentages between single plan firms and the highest
plan payout percentage in firms with more than one plan. Of the 58 firms with multiple plans, 44 have
both RPE and non-RPE plans, of which 5 have missing vesting or payout information. When we
compare mean and median vesting percentages in these firms’ RPE and non-RPE plans, the non-RPE
plans have statistically higher payouts. Similar results are found when we restrict the sample to the 37
firms with exactly one RPE and one non-RPE plan. These findings are consistent with firms using non-
RPE plans to offset the more stringent RPE plans. 21
21 We also examined payout percentages differences between firms with one plan and multiple plans using all of the firms in our sample (RPE and non-RPE users). Both mean and median payout percentages are statistically lower in firms with multiple plans, as is the payout in the plan with the lowest payout (versus the payout in the one plan of single plan firms. Payouts in the highest payout plans, however, are not significantly different.

28
Table 6 presents plan-level multivariate tests examining RPE payout percentages as a function of
the presence of other plans (denoted MULTI), firm-level characteristics (external monitoring, firm size,
and stock return volatility), RPE plan characteristics (the use of a pre-defined comparator index,
performance hurdles versus ranges, retesting provisions, and the minimum relative ranking required for
the plan to begin vesting), and our control variables. In contrast to the tests in Table 5 that included both
RPE and non-RPE plans, we limit these analyses to plans using RPE. A number of RPE plan
characteristics are significant using actual payout as a percent of salary, but not using actual vesting
percentages. Payout as a percent of salary tends to be higher in plans with self-selected comparator
groups. However, actual payouts in hurdle plans and plans with lower minimum rankings for initial
vesting are lower, implying that the use of these controversial features in RPE plans did not lead to
higher plan payouts. External monitoring is positively associated with payouts as a percent of salary,
while stock return volatility appears to have some influence on payout percentages. Importantly,
MULTI is negative and significant using either the actual payout percentage or actual payout as a
percent of salary (even after controlling for RPE plan characteristics), indicating that relative
performance targets, on average, are more difficult to achieve in firms with multiple plans. These results
provide considerable evidence that RPE payouts are lower when other equity plans are in place,
suggesting that firms compensate for difficult RPE targets through the use of other plans.
5. Conclusion
Using data on performance-vested equity grants in FTSE 350 firms, we examine the use and
strength of relative performance evaluation in equity-based compensation plans. We investigate three
research questions: (1) Do the hypothesized determinants of RPE adoption identified in theoretical
models explain the adoption of RPE in performance-vested equity plans?; (2) Do these same factors
explain the use of specific relative vesting conditions that have received little attention in RPE models?;
and (3) Is the achievement of relative performance targets related to the selective choice of comparator
firms or to other RPE plan characteristics?
29
Our results suggest that many of the economic determinants of RPE identified in analytical
models are associated with the specific characteristics and strength of the relative performance
conditions, but have little association with the simple use or non-use of RPE in these contracts. In fact,
RPE contract design in our sample firms is frequently structured to provide greater alignment of
shareholders’ and managers’ incentives rather than removing common risk since the payout to
executives is greater only when the firm performs well and increasingly better than the comparator
group. When RPE is used to remove common risk when evaluating executive performance, firms are
more likely to use performance hurdles rather than payout ranges and to require lower relative rankings
for minimum vesting to occur. Consistent with economic theory, the choice between self-selected and
pre-defined comparator groups tends to reflect the comparator group’s ability remove common noise
from performance measure. Equity grants to executives with greater firm-specific wealth are associated
with plans that do not use RPE or that use relative performance conditions that are less stringent. We
find some evidence that more stringent relative performance conditions are used to increase risk-taking
incentives, but no evidence that RPE use or characteristics are associated with competition or past
relative performance.
Our results do not support the opportunistic use of RPE to increase compensation and/or placate
external parties who are pushing for its adoption. Greater external monitoring is associated with stronger
RPE implementation (not weaker), and is not associated with a greater use of hand-selected comparator
groups (relative to pre-defined indices) or with greater ex ante bias in the comparator group selected
(based on the prior returns of the firm relative to its comparator group). There is also less ex ante
selection bias found in plans with strong RPE implementation or higher minimum performance
thresholds. Self-selection of a comparator group is related to more difficult relative performance targets,
both ex ante and ex post. Instead of being opportunistic, the evidence suggests that the use of a self-
selected comparator group is more likely to reflect economic factors. Actual plan vesting percentages
and payouts indicate that RPE plans do not provide greater payouts to executives than non-RPE plans,
again suggesting that RPE plans are not being used opportunistically to increase vesting probability and

30
compensation. Finally, RPE plan payouts are lower when firms operate multiple equity grant plans,
indicating that firms tend to couple more stringent RPE plans with other plans that compensate for the
RPE target difficulty.
Our findings have implications for the direction of future research on RPE and performance-
vested equity grants. First, the evidence suggests that RPE is implemented not only to remove common
risk from performance evaluations (as characterized in most RPE models), but also to create greater
effort and effort allocation incentives in equity contracts. Future modeling efforts can provide additional
insight into the latter uses of RPE. Second, we document the significant heterogeneity in how RPE
contracts are written, and show that research examining the simple use or non-use of RPE is likely to be
ineffective in capturing the economic factors related to RPE use. Third, we find that actual vesting
percentages in both RPE and non-RPE plans are substantially lower than the vesting percentages
assumed in prior research on performance-vested equity grants. Research that fails to consider more
realistic vesting percentages severely overstates the value of these grants. Finally, our evidence indicates
that many RPE plans include performance conditions that are difficult to achieve. Although we assume
that plans with more stringent relative performance conditions provide greater incentives to improve
performance, analytical studies (Kuang and Suijs, 2006) and simulation analyses (Main, 2006) indicate
that performance-vested equity grants with vesting conditions that are difficult to achieve impose
considerable compensation risk on executives and may not be optimal. Future empirical studies can
investigate the relation between the stringency of relative performance conditions and the achievement
of compensation plan objectives.

31
References
Aggarwal, R., Samwick, A., 1999. Executive compensation, strategic competition and relative performance evaluation: theory and evidence. The Journal of Finance LIV, 1999-2043.
Antle, R., Smith, A., 1986. An empirical investigation of the relative performance evaluation of
corporate executives. Journal of Accounting Research 24, 1-39. Association of British Insurers, 2004. Principles and Guidelines on Remuneration, December 7, 2004. Baiman, S., Demski, J., 1980. Economically optimal performance evaluation and control systems.
Journal of Accounting Research 18, 184–220. Bannister, J., Newman, H., 2003. Analysis of corporate disclosures on relative performance evaluation.
Accounting Horizons 17, 235-246. Barro, J., Barro, R., 1990. Pay, performance, and turnover of bank CEOs. Journal of Labor Economics
8, 448–481. Bettis, J., Bizjak, J., Coles, J., Kalpathy, S., 2007. Equity grants with performance-based vesting
conditions. Working paper, Washington State University. Brennan, M., 2001. Discussion of the pricing of relative performance based incentives for executive
compensation. Journal of Business Finance & Accounting 28, 1189-1191. Brisley, N., 2006. Executive stock options: Early exercise provisions and risk-taking incentives.
Journal of Finance, forthcoming. Byrd, J., Johnson, M., Porter, S., 1998. Discretion in financial reporting: the voluntary disclosure of
compensation peer groups in proxy statement performance graphs. Contemporary Accounting Research 15, 25-52.
Câmara, A., 2001. The pricing of relative performance based incentives for executive compensation.
Journal of Business Finance and Accounting 28, 1115-1139. Choudhary, J., Orszag, A., 2003. On target: Are performance conditions on executive options driven by
fundamentals? Watson Wyatt Technical Paper 2003-PB02. Choudhary, J., Orszag, A., 2005. On target: An examination of CEO stock option performance hurdles.
Watson Wyatt Technical Paper 2005-TR-6. Conyon M., Peck., S., Read, L., Sadler, G. 2000. The structure of executive compensation contracts: UK
evidence. Long Range Planning 33, 478-503. Dye, R., 1984. Inside trading and incentives. Journal of Business 57, 295-313. Garvey, G., Milbourn, T., 2003. Incentive compensation when executives can hedge the market:
evidence of relative performance evaluation in the cross section. The Journal of Finance LVIII, 1557-1581.

32
Gerakos, J., Ittner, C., Larcker, D., 2007. The structure of performance-vested stock option grants. In: Antle, R., Liang, P., Gjesdahl, F. (Eds.). Essays on Accounting Theory in Honour of Joel S. Demski. Springer.
Gibbons, R., Murphy, K., 1990. Relative performance evaluation for chief executive officers. Industrial
and Labor Relations Review 43, 30-51. Greenbury, R. 1995. Directors’ remuneration: Report of a study group chaired by Sir Richard
Greenbury. London: Gee Publishing. Himmelberg, C., Hubbard R., 2000. Incentive pay and market for CEOs: An analysis of pay-for-
performance sensitivity. Working paper, Columbia University. Holmstrom, B., 1982. Moral hazard in teams. Bell Journal of Economics 13, 324–340. Hvide, H., 2002. Tournament rewards and risk taking. Journal of Labor Economics 20, 877-898. Indjejikian, R., Nanda, D., 1999. Dynamic incentives and responsibility accounting. Journal of
Accounting and Economics 27, 177-201. Janakiraman, S., Lambert, R., Larcker, D., 1992. An empirical investigation of the relative performance
evaluation hypothesis. Journal of Accounting Research 30, 53–69. Joh, S., 1999. Strategic managerial incentive compensation in Japan: relative performance evaluation
and product market collusion. The Review of Economics and Statistics 81, 303-313. Johnson, S., Tian, Y., 2000. The value and incentive effects of nontraditional executive stock option
plans. Journal of Financial Economics 57, 3-34. Kole, S., 1997. The complexity of compensation contracts. Journal of Financial Economics 43, 79-104. Kuang, Y., Suijs, J., 2006. Incentive effects of performance-vested stock options. Working paper.
Erasmus University. Leone, A. Rock, S., 2002. Empirical tests of budget ratcheting and its effect on managers’ discretionary
accrual choice. Journal of Accounting and Economics 33, 43-68. Lewellen, W., Park, T., Ro, B., 1996. Self-serving behavior in managers’ discretionary information
disclosure decisions. Journal of Accounting and Economics 21, 227-251. Main, B., 2006. The ABI guidelines for share-based incentive schemes: setting the hurdle too high? Accounting and Business Research 36, 191-205. Matsumura, E. Shin, J., 2006. An empirical analysis of an incentive plan with relative performance
measures: Evidence from a postal service. The Accounting Review 81, 533-566. Merchant, K. Manzoni, J. 1989. The achievability of budget targets in profit centers: A field study. The
Accounting Review 64, 539-558.

33
Meyer, J., Rowan, B., 1977. Institutionalized organizations: formal structure as myth and ceremony. The American Journal of Sociology 83, 340-363.
Morgenson, G., 2006. Gilded paychecks: group think. The New York Times, late edition, November
26, 2006. Murphy, K., 1999. Executive compensation. In: Ashenfleter, O., Card, D., (Eds.). Handbook of Labor
Economics, Vol. 3. North-Holland, Amsterdam. Murphy, K. 2001. Performance standards in incentive contracts. Journal of Accounting and Economics
30, 245-278. Porac, J., Wade, J., Pollock, T., 1999. Industry categories and the politics of the comparable firm in
CEO compensation. Administrative Science Quarterly 44, 112-144. Prendergast, C., 1999. The provision of incentives in firms. Journal of Economic Literature XXXVII,
7-63. Rajgopal, S., Shevlin, T., Zamora, V., 2006. CEO’s outside employment opportunities and the lack of
relative performance evaluations in compensation contracts. The Journal of Finance 61, 1813-1844. Towers Perrin, 2005. Equity incentives around the world: the 2005 study. Westphal, J., Zajac, E., 1994. Substance and symbolism in CEO’s long-term incentives plans.
Administrative Science Quarterly 39, 267-390. Westphal, J., Zajac, E., 1998. The symbolic management of stockholders: corporate governance reforms
and shareholder reactions. Administrative Science Quarterly 43, 127-153. Zajac, E., Westphal, J., 1995. Accounting for the explanations of CEO compensation: substance and
symbolism. Administrative Science Quarterly 40, 283-308. Zhou, X., Swan, P., 2003. Performance thresholds in managerial incentive contracts. Journal of
Business 76, 665-696.

34
Appendix A Example Performance Requirements
Acambis: Share Option plan [choose own comparator, straight-line vesting, retesting] Grants to be made will be subject to performance conditions relating to the performance of Acambis’ total shareholder return (TSR) compared to a comparator group of other companies within the industry. These companies are: [19 companies listed]. The maximum allocation of shares would be achieved if Acambis is ranked in the upper quartile of the comparator group, being prorated down to a 30% allocation at a ranking at the median. No allocation will be made if Acambis’ ranking falls below the median. The performance condition is measured initially over a three-year period beginning at the date of grant and, if not initially achieved in full, can be further measured of a four-year period measured from the same fixed base point. Options granted from September 2001 until the end of 2002 also allow for re-testing over a five-year period. TBI: Executive Share Option Scheme [index comparator, hurdle, retesting] For grants during and since December 1998, The Company’s total shareholder return (TSR) must fall within the top 50% of those companies which made up the FTSE 250 index on the date of grant. The TSRs of the Company and its comparator group may be measured over any three year rolling period between the date of grant and ending on the tenth anniversary of the date of grant. Measurement of TSR performance may be done every three months after the initial three year period. Provided the performance criterion has been satisfied over any thee year period, an option may be exercised at any time during its life. Unilever: Long-term Incentive Plan [choose own comparator, step vesting, no retesting] Depending on the performance of Unilever’s Total Shareholder Return (TSR) over a three-year performance cycle compared with that if its defined peer group, the awards vest following the end of the three-year performance cycle in accordance with the following table: Ranking within TSR Peer Group Percentage of awards that vest Numbers 12-21 Nil Numbers 10-11 25% Numbers 8-9 50% Numbers 5-7 100% Numbers 3-4 150% Numbers 1-2 200% WPP Group: Performance Share Plan [choose own comparator, straight-line vesting, no retesting] … the number of shares vesting over each three-year performance period is dependent on the growth of WPP’s total share owner return (TSR) relative to the growth of TSR of a comparator group of major publicly traded marketing services companies on the basis that this is the best indicator of value creation for share owners. At median performance, 50% of the performance shares vest, with higher percentages vesting for superior performance up to 100% if WPP ranks at least equal to the second ranking peer company. The peer companies in respect of awards made in 2002 comprise Aegis, Cordiant, Grey Global, Havas Advertising, IPG, Omnicom, Publicis and Taylor Nelson Sofres.
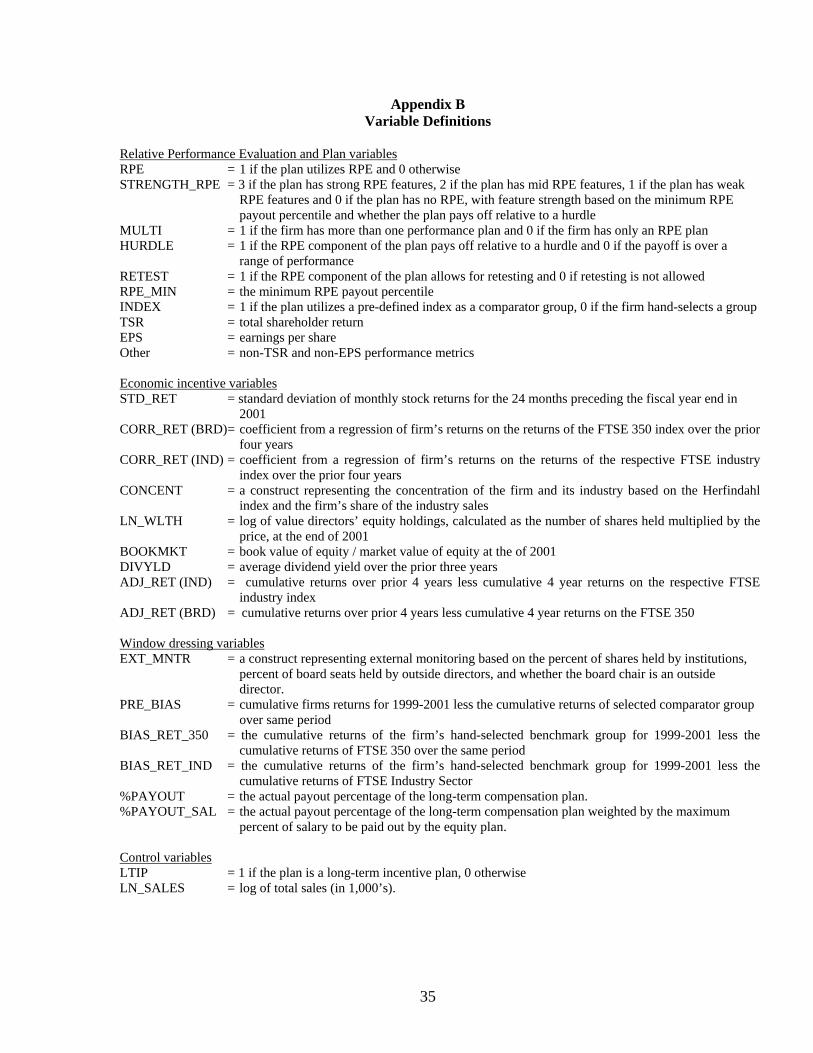
35
Appendix B Variable Definitions
Relative Performance Evaluation and Plan variables RPE = 1 if the plan utilizes RPE and 0 otherwise STRENGTH_RPE = 3 if the plan has strong RPE features, 2 if the plan has mid RPE features, 1 if the plan has weak
RPE features and 0 if the plan has no RPE, with feature strength based on the minimum RPE payout percentile and whether the plan pays off relative to a hurdle
MULTI = 1 if the firm has more than one performance plan and 0 if the firm has only an RPE plan HURDLE = 1 if the RPE component of the plan pays off relative to a hurdle and 0 if the payoff is over a
range of performance RETEST = 1 if the RPE component of the plan allows for retesting and 0 if retesting is not allowed RPE_MIN = the minimum RPE payout percentile INDEX = 1 if the plan utilizes a pre-defined index as a comparator group, 0 if the firm hand-selects a group TSR = total shareholder return EPS = earnings per share Other = non-TSR and non-EPS performance metrics Economic incentive variables STD_RET = standard deviation of monthly stock returns for the 24 months preceding the fiscal year end in
2001 CORR_RET (BRD) = coefficient from a regression of firm’s returns on the returns of the FTSE 350 index over the prior
four years CORR_RET (IND) = coefficient from a regression of firm’s returns on the returns of the respective FTSE industry
index over the prior four years CONCENT = a construct representing the concentration of the firm and its industry based on the Herfindahl
index and the firm’s share of the industry sales LN_WLTH = log of value directors’ equity holdings, calculated as the number of shares held multiplied by the
price, at the end of 2001 BOOKMKT = book value of equity / market value of equity at the of 2001 DIVYLD = average dividend yield over the prior three years ADJ_RET (IND) = cumulative returns over prior 4 years less cumulative 4 year returns on the respective FTSE
industry index ADJ_RET (BRD) = cumulative returns over prior 4 years less cumulative 4 year returns on the FTSE 350 Window dressing variables EXT_MNTR = a construct representing external monitoring based on the percent of shares held by institutions,
percent of board seats held by outside directors, and whether the board chair is an outside director.
PRE_BIAS = cumulative firms returns for 1999-2001 less the cumulative returns of selected comparator group over same period
BIAS_RET_350 = the cumulative returns of the firm’s hand-selected benchmark group for 1999-2001 less the cumulative returns of FTSE 350 over the same period
BIAS_RET_IND = the cumulative returns of the firm’s hand-selected benchmark group for 1999-2001 less the cumulative returns of FTSE Industry Sector
%PAYOUT = the actual payout percentage of the long-term compensation plan. %PAYOUT_SAL = the actual payout percentage of the long-term compensation plan weighted by the maximum
percent of salary to be paid out by the equity plan. Control variables LTIP = 1 if the plan is a long-term incentive plan, 0 otherwise LN_SALES = log of total sales (in 1,000’s).
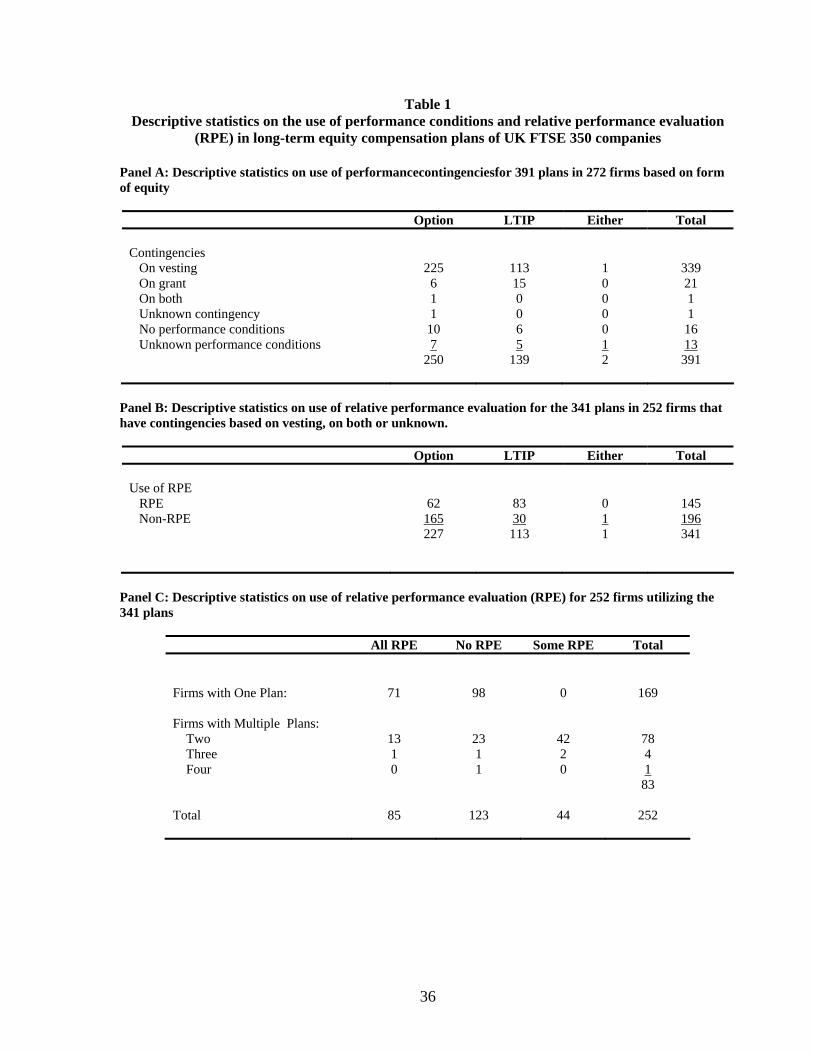
36
Table 1 Descriptive statistics on the use of performance conditions and relative performance evaluation
(RPE) in long-term equity compensation plans of UK FTSE 350 companies Panel A: Descriptive statistics on use of performancecontingenciesfor 391 plans in 272 firms based on form of equity
Option LTIP Either Total Contingencies On vesting 225 113 1 339 On grant 6 15 0 21 On both 1 0 0 1 Unknown contingency 1 0 0 1 No performance conditions 10 6 0 16 Unknown performance conditions 7 5 1 13 250 139 2 391
Panel B: Descriptive statistics on use of relative performance evaluation for the 341 plans in 252 firms that have contingencies based on vesting, on both or unknown.
Option LTIP Either Total Use of RPE RPE 62 83 0 145 Non-RPE 165 30 1 196 227 113 1 341
Panel C: Descriptive statistics on use of relative performance evaluation (RPE) for 252 firms utilizing the 341 plans
All RPE No RPE Some RPE Total Firms with One Plan: 71 98 0 169 Firms with Multiple Plans: Two 13 23 42 78 Three 1 1 2 4 Four 0 1 0 1 83 Total 85 123 44 252

37
Table 1 (continued) Descriptive statistics on the use of performance conditions and relative performance evaluation
(RPE) in long-term equity compensation plans of UK FTSE 350 companies Panel D: Descriptive statistics for 145 RPE plans based on form of equity
Option LTIP Total Choose own comparator group 23 54 77 Utilize a pre-defined market group 34 26 60 Unknown 5 3 8 62 83 145 Allow for retesting 24 10 34 No retesting (or no mention) 38 73 111 62 83 145 Hurdle 25 5 30 Performance payout range 26 70 96 Unknown 11 8 19 62 83 145 TSR only 53 79 132 EPS only 6 1 7 TSR/EPS 0 1 1 Other only 3 2 5 62 83 145
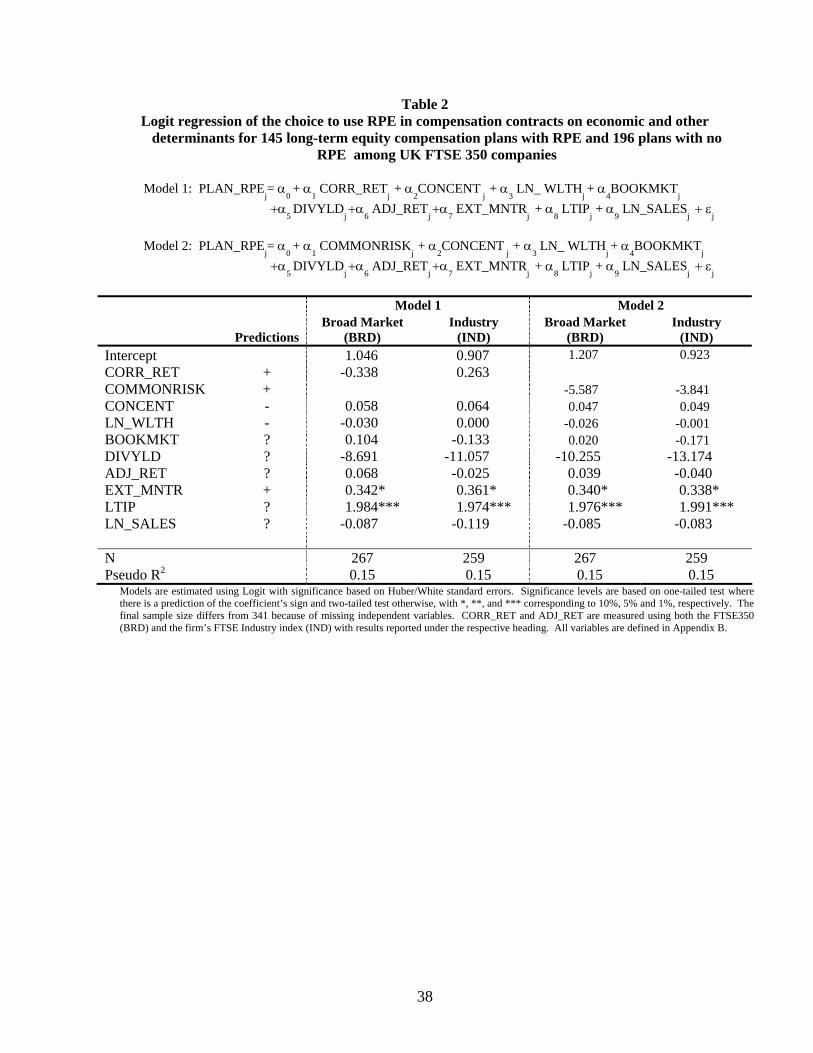
38
Table 2 Logit regression of the choice to use RPE in compensation contracts on economic and other
determinants for 145 long-term equity compensation plans with RPE and 196 plans with no RPE among UK FTSE 350 companies
Model 1: PLAN_RPE
j= α
0 + α
1 CORR_RET
j + α
2CONCENT
j + α
3 LN_ WLTH
j + α
4BOOKMKT
j
+α
5 DIVYLD
j +α
6 ADJ_RET
j +α
7 EXT_MNTR
j + α
8 LTIP
j + α
9 LN_SALES
j + ε
j Model 2: PLAN_RPE
j= α
0 + α
1 COMMONRISK
j + α
2CONCENT
j + α
3 LN_ WLTH
j + α
4BOOKMKT
j
+α
5 DIVYLD
j +α
6 ADJ_RET
j +α
7 EXT_MNTR
j + α
8 LTIP
j + α
9 LN_SALES
j + ε
j
Model 1 Model 2
Predictions Broad Market
(BRD) Industry
(IND) Broad Market
(BRD) Industry
(IND) Intercept 1.046 0.907 1.207 0.923 CORR_RET + -0.338 0.263 COMMONRISK + -5.587 -3.841 CONCENT - 0.058 0.064 0.047 0.049 LN_WLTH - -0.030 0.000 -0.026 -0.001 BOOKMKT ? 0.104 -0.133 0.020 -0.171 DIVYLD ? -8.691 -11.057 -10.255 -13.174 ADJ_RET ? 0.068 -0.025 0.039 -0.040 EXT_MNTR + 0.342* 0.361* 0.340* 0.338* LTIP ? 1.984*** 1.974*** 1.976*** 1.991*** LN_SALES ? -0.087 -0.119 -0.085 -0.083 N 267 259 267 259 Pseudo R2 0.15 0.15 0.15 0.15
Models are estimated using Logit with significance based on Huber/White standard errors. Significance levels are based on one-tailed test where there is a prediction of the coefficient’s sign and two-tailed test otherwise, with *, **, and *** corresponding to 10%, 5% and 1%, respectively. The final sample size differs from 341 because of missing independent variables. CORR_RET and ADJ_RET are measured using both the FTSE350 (BRD) and the firm’s FTSE Industry index (IND) with results reported under the respective heading. All variables are defined in Appendix B.

39
Table 3 Logit regression of the choices within RPE contracts on economic and other determinants for 145
long-term equity compensation plans with RPE among UK FTSE 350 companies
Model 1: RPE_CHOICE j = α0 + α
1 CORR_RET
j + α
2CONCENT
j + α
3 LN_ WLTH
j + α
4BOOKMKT
j
+α
5 DIVYLD
j +α
6 ADJ_RET
j +α
7 EXT_MNTR
j + α
8 LTIP
j + α
9 LN_SALES
j + ε
j Model 2: RPE_CHOICE j = α
0 + α
1 COMMONRISK
j + α
2CONCENT
j + α
3 LN_ WLTH
j + α
4BOOKMKT
j
+α
5 DIVYLD
j +α
6 ADJ_RET
j +α
7 EXT_MNTR
j + α
8 LTIP
j + α
9 LN_SALES
j + ε
j
Panel A: RPE_CHOICE is whether the RPE plan pays in a hurdle or over a spread (HURDLE)
Model 1 Model 2 Broad Market
(BRD) Industry
(IND) Broad Market
(BRD) Industry
(IND) Intercept 3.086 2.932 1.597 2.563 CORR_RET 1.240 2.149 COMMONRISK 19.015# 23.350*** CONCENT -0.346 -0.200 -0.447 -0.180 LN_WLTH 0.257# 0.324# 0.268# 0.318# BOOKMKT -2.074# -3.115** -1.847 -3.040** DIVYLD 94.059*** 86.212*** 106.409*** 97.002*** ADJ_RET -0.128 -0.133 -0.044 -0.126 EXT_MNTR -0.048 0.106 -0.117 -0.080 LTIP -3.538*** -4.482*** -3.563*** -4.746*** LN_SALES -0.678** -0.738** -0.654** -0.750** N 98 94 98 94 Pseudo R2 0.44 0.49 0.45 0.53
Panel B: RPE_CHOICE is minimum performance level required for payout in RPE plan (RPE_MIN)
Model 1 Model 2 Broad Market
(BRD) Industry
(IND) Broad Market
(BRD) Industry
(IND) Intercept 71.161*** 69.850*** 68.547*** 69.532***CORR_RET 0.974 -4.584 COMMONRISK -55.319# -66.000** CONCENT 0.715 0.751 0.666 0.851 LN_WLTH -1.239# -1.217# -1.172# -1.148# BOOKMKT 8.096 8.869 7.278 8.303 DIVYLD -40.321 0.559 -86.310 -20.826 ADJ_RET 1.205 0.877 0.915 0.839 EXT_MNTR -0.236 -1.042 0.099 -0.625 LTIP 0.655 1.113 0.157 1.015 LN_SALES -0.552 -0.342 -0.023 -0.211 N 71 67 71 67 R2 0.10 0.12 0.12 0.15
Models in Panels A and B are estimated using OLS with significance based on Huber/White standard errors. Significance levels are based on one-tailed test where there is a prediction of the coefficient’s sign and two-tailed test otherwise, with #,*, **, and *** corresponding to 15%, 10%, 5% and 1%, respectively. The final sample size differs from 146 because of missing data. CORR_RET and ADJ_RET are measured using both the FTSE350 (BRD) and the firm’s FTSE Industry index (IND) with results reported under the respective heading. All variables are defined in Appendix B.

40
Table 4 Tests of bias in selection of benchmark group at the time of contracting for 145 long-term equity
compensation plans with RPE in UK FTSE 350 companies
Panel A: Multivariate analysis of the choice of pre-defined index or hand-selected comparator group (INDEX)
Model 1: INDEX j = α
0 + α
1 CORR_RET
j + α
2CONCENT
j + α
3 LN_ WLTH
j + α
4BOOKMKT
j
+α
5 DIVYLD
j +α
6 ADJ_RET
j +α
7 EXT_MNTR
j + α
8 LTIP
j + α
9 LN_SALES
j + ε
j Model 2: INDEX j = α
0 + α
1 COMMONRISK
j + α
2CONCENT
j + α
3 LN_ WLTH
j + α
4BOOKMKT
j
+α
5 DIVYLD
j +α
6 ADJ_RET
j +α
7 EXT_MNTR
j + α
8 LTIP
j + α
9 LN_SALES
j + ε
j
Model 1 Model 2
Predictions Broad Market
(BRD) Industry
(IND) Broad Market
(BRD) Industry
(IND) Intercept -3.491 -1.893 -4.138 -3.258 CORR_RET + 2.948*** 3.356*** COMMONRISK + 16.384** 18.626*** EXT_MNTR - 0.304 0.319 0.236 0.240 CONCENT ? -0.129 -0.165 -0.135 -0.165 LN_WLTH ? 0.186 0.180 0.193 0.181 BOOKMKT ? -0.409 0.071 -0.238 0.259 DIVYLD ? 4.418 5.305 5.925 10.152 ADJ_RET ? -0.333 -0.559# -0.306 -0.436 LTIP ? -1.213*** -1.548*** -1.235*** -1.518*** LN_SALES ? -0.014 -0.162 0.053 -0.030 N 107 102 107 102 Pseudo R2 0.15 0.17 0.14 0.17
Models are estimated using Logit with significance based on Huber/White standard errors. Significance levels are based on one-tailed test where there is a prediction of the coefficient’s sign and two-tailed test otherwise, with #,*, **, and *** corresponding to 15%, 10%, 5% and 1%, respectively. The final sample size differs from 145 because of missing data. CORR_RET and ADJ_RET are measured using both the FTSE350 (BRD) and the firm’s FTSE Industry index (IND) with results reported under the respective heading. All variables are defined in Appendix B.
Panel B: Univariate analysis of ex-ante return bias in the choice of the comparator group
Count PRE_BIAS Mean
PRE_BIAS Median
All Plans 93 0.221*** 0.087*** Plans with Hand-selected comparator group
53 0.223* 0.087*
Plans using a Predefined index 40 0.218** 0.086** T-statistic and z-statistic from test of hand-selected bias vs. index bias
0.03 0.19
Significance levels are based on t-statistic difference in means and z-statistic Wilcoxon signed-rank test of difference in medians with *, **, and *** corresponding to 15%, 10%, 5% and 1%, respectively. The final sample size differs from 145 because of missing data. PRE_BIAS definined in Appendix B.

41
Table 4 (continued)
Tests of bias in selection of benchmark group at the time of contracting for 145 long-term equity compensation plans with RPE in UK FTSE 350 companies
Panel C: Multivariate analysis of ex-ante return bias in the choice of the comparator group (PRE_BIAS)
PRE_BIAS j = α0 + α
1EXT_MNTR
j +α
2 STRENGTH_RPE
j + α
3 HURDLE
j +α
4 RETEST
j
+α
5 RPE_MIN
j +α
6 INDEX
j + α
7 LTIP
j +α
8 LN_SALES
j +α
9 LN_SALARY
j + ε
j
Predictions Firm and Plan
Criteria
Firm Criteria and Plan Strength
Intercept 6.263 7.620 EXT_MNTR + 0.176 -0.036 STRENGTH_RPE - -0.322** HURDLE + -0.371 RETEST + 0.151 0.093 RPE_MIN - -0.022*** INDEX - -0.254 -0.245 LTIP ? 0.345 0.177 LN_SALES ? -0.025 0.023 LN_SALARY ? -0.367 -0.545 N 50 58 Pseudo R2 0.14 0.11
Model is estimated using OLS with significance based on Huber/White standard errors. Significance levels are based on one-tailed test where there is a prediction of the coefficient’s sign and two-tailed test otherwise, with #,*, **, and *** corresponding to 15%, 10%, 5% and 1%, respectively. The final sample size differs from 145 due to 52 firms missing PRE_BIAS and 54 missing RPE_MIN, in addition to other missing independent variables. All variables are defined in Appendix B.
Panel D: Univariate tests of means (median) of bias in returns at the time of contracting for 78 plans with hand-selected comparator group relative to two alternative benchmarks: FTSE 350 and FTSE Industry Sector
N Mean Median BIAS_RET_350 (FTSE 350)
58 0.606*** 0.442***
BIAS_RET_IND (Industry Sector)
54 0.460*** 0.290***
Significance levels are based on t-statistic difference in means and z-statistic Wilcoxon signed-rank test of difference in medians with *** corresponding to 1%. The final sample size differs from 78 because of missing data. BIAS_RET definined in Appendix B.

42
Table 5 Multivariate regressions of the actual payout on the choice to use RPE in compensation contracts
and on economic and other determinants within 286 long-term equity compensation plans of UK FTSE 350 companies
PAYOUT j = α
0 + α
1 PLAN_RPE
j +α
2 STRENGTH_RPE + α
3 HURDLE
j + α
4 RETEST
j
+ α5STD_RET
j +α
6EXT_MNTR
j +α
7 LTIP
j+ α
8LN_SALES
j + α
9LN_SALARY
j + ε
j
Panel A: Actual percent vesting (%VEST)
PredictionsFirm and Plan
Criteria
Firm Criteria and Plan Strength
Intercept 4.172** 3.723* PLAN_RPE ? 0.043 STRENGTH_RPE - 0.063 HURDLE + 0.037 0.026 RETEST + -0.012 -0.001 STD_RET ? -1.872# -1.588 EXT_MNTR + -0.021 -0.009 LTIP ? -0.137 -0.200* LN_SALES ? 0.061 0.050 LN_SALARY ? -0.330** -0.285# N 222 189
Panel B: Actual percent payout weighted by maximum percent of salary eligible to be paid out
(%PAYOUT)
Predictions
Firm and Plan Criteria
Firm Criteria and Plan Strength
Intercept 883.834* 906.051 PLAN_RPE ? -8.357 STRENGTH_RPE - -5.498 HURDLE + -52.254 -88.305 RETEST ? 0.109 8.093 STD_RET ? -865.626*** -879.185*** EXT_MNTR + 21.852 34.521 LTIP ? -62.132* -70.977** LN_SALES ? 10.011 7.756 LN_SALARY ? -62.786# -60.592 N 115 93
Model is estimated using Tobit with significance based on Huber/White standard errors. Significance levels are based on one-tailed test where there is a prediction of the coefficient’s sign and two-tailed test otherwise, with #,*, **, and *** corresponding to 15%, 10%, 5% and 1%, respectively. Final sample sizes are lower due to missing data. In particular, the sample size is lower in Panel B due to 131 firms missing salary eligible information. All variables are defined in Appendix B.
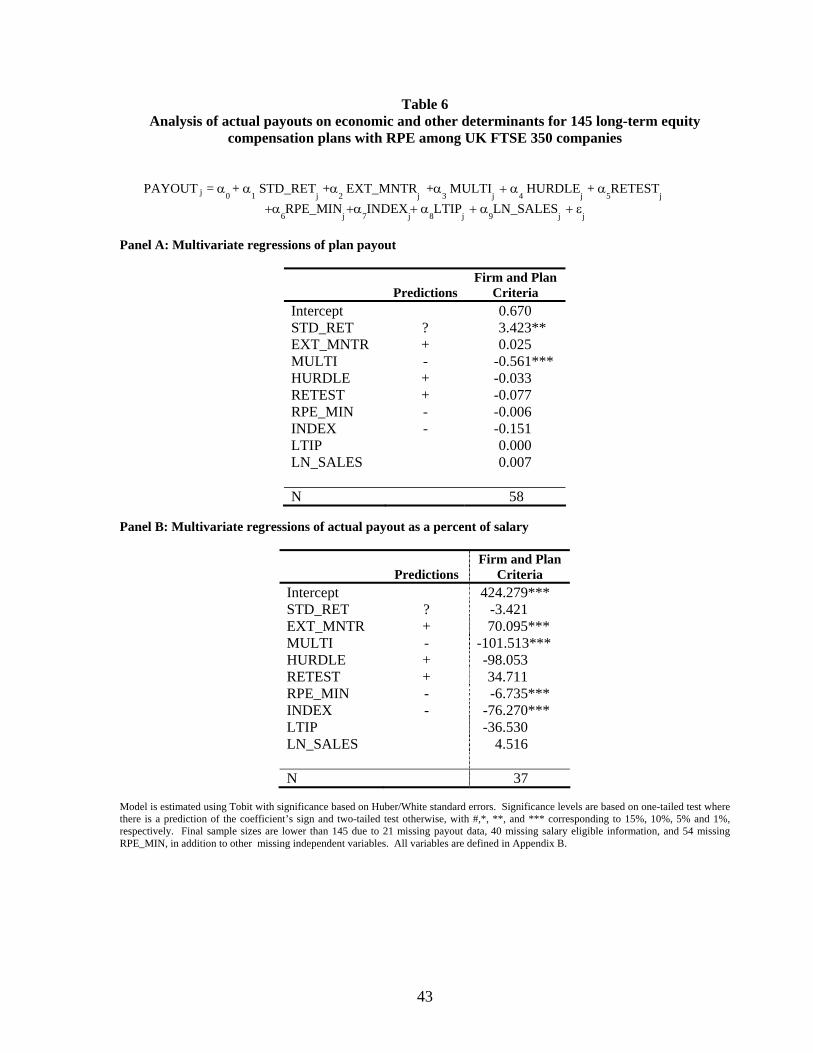
43
Table 6 Analysis of actual payouts on economic and other determinants for 145 long-term equity
compensation plans with RPE among UK FTSE 350 companies
PAYOUT j = α
0 + α
1 STD_RET
j +α
2 EXT_MNTR
j +α
3 MULTI
j + α
4 HURDLE
j + α
5RETEST
j
+α6RPE_MIN
j +α
7INDEX
j+ α
8LTIP
j + α
9LN_SALES
j + εj
Panel A: Multivariate regressions of plan payout
Predictions
Firm and Plan Criteria
Intercept 0.670 STD_RET ? 3.423** EXT_MNTR + 0.025 MULTI - -0.561*** HURDLE + -0.033 RETEST + -0.077 RPE_MIN - -0.006 INDEX - -0.151 LTIP 0.000 LN_SALES 0.007 N 58
Panel B: Multivariate regressions of actual payout as a percent of salary
Predictions
Firm and Plan Criteria
Intercept 424.279*** STD_RET ? -3.421 EXT_MNTR + 70.095*** MULTI - -101.513*** HURDLE + -98.053 RETEST + 34.711 RPE_MIN - -6.735*** INDEX - -76.270*** LTIP -36.530 LN_SALES 4.516 N 37
Model is estimated using Tobit with significance based on Huber/White standard errors. Significance levels are based on one-tailed test where there is a prediction of the coefficient’s sign and two-tailed test otherwise, with #,*, **, and *** corresponding to 15%, 10%, 5% and 1%, respectively. Final sample sizes are lower than 145 due to 21 missing payout data, 40 missing salary eligible information, and 54 missing RPE_MIN, in addition to other missing independent variables. All variables are defined in Appendix B.
Top Related
Copyright © 2022 FDOKUMEN

