


Bahasa
Halaman
Hukum

Geophys. J. Int. (2009) 177, 1265–1278 doi: 10.1111/j.1365-246X.2009.04096.x
GJI
Tec
toni
csan
dge
ody
nam
ics
Evolution of the Late Cretaceous crust in the equatorial regionof the Northern Indian Ocean and its implication in understandingthe plate kinematics
M. Desa, M. V. Ramana and T. RamprasadNational Institute of Oceanography, Dona Paula, Goa 403 004, India. E-mail: [email protected]
Accepted 2009 January 9. Received 2008 October 6; in original form 2008 May 9
S U M M A R Y
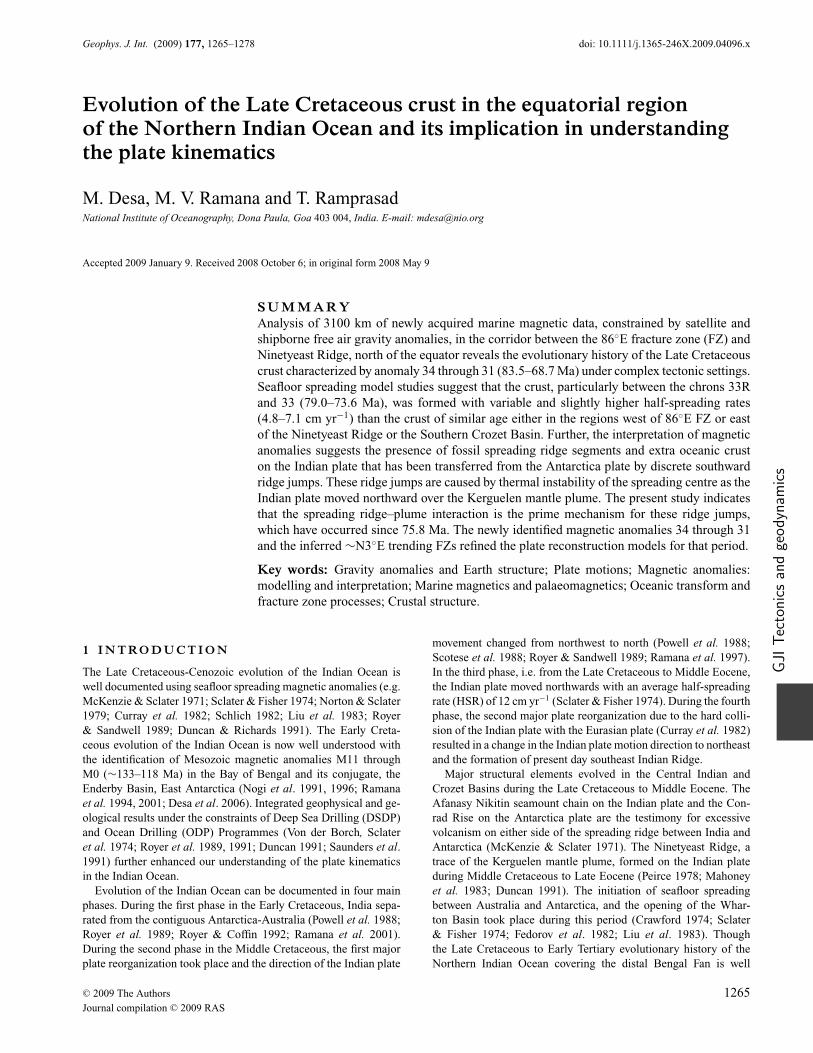
Analysis of 3100 km of newly acquired marine magnetic data, constrained by satellite andshipborne free air gravity anomalies, in the corridor between the 86◦E fracture zone (FZ) andNinetyeast Ridge, north of the equator reveals the evolutionary history of the Late Cretaceouscrust characterized by anomaly 34 through 31 (83.5–68.7 Ma) under complex tectonic settings.Seafloor spreading model studies suggest that the crust, particularly between the chrons 33Rand 33 (79.0–73.6 Ma), was formed with variable and slightly higher half-spreading rates(4.8–7.1 cm yr−1) than the crust of similar age either in the regions west of 86◦E FZ or eastof the Ninetyeast Ridge or the Southern Crozet Basin. Further, the interpretation of magneticanomalies suggests the presence of fossil spreading ridge segments and extra oceanic cruston the Indian plate that has been transferred from the Antarctica plate by discrete southwardridge jumps. These ridge jumps are caused by thermal instability of the spreading centre as theIndian plate moved northward over the Kerguelen mantle plume. The present study indicatesthat the spreading ridge–plume interaction is the prime mechanism for these ridge jumps,which have occurred since 75.8 Ma. The newly identified magnetic anomalies 34 through 31and the inferred ∼N3◦E trending FZs refined the plate reconstruction models for that period.
Key words: Gravity anomalies and Earth structure; Plate motions; Magnetic anomalies:modelling and interpretation; Marine magnetics and palaeomagnetics; Oceanic transform andfracture zone processes; Crustal structure.
1 I N T RO D U C T I O N
The Late Cretaceous-Cenozoic evolution of the Indian Ocean iswell documented using seafloor spreading magnetic anomalies (e.g.McKenzie & Sclater 1971; Sclater & Fisher 1974; Norton & Sclater1979; Curray et al. 1982; Schlich 1982; Liu et al. 1983; Royer& Sandwell 1989; Duncan & Richards 1991). The Early Creta-ceous evolution of the Indian Ocean is now well understood withthe identification of Mesozoic magnetic anomalies M11 throughM0 (∼133–118 Ma) in the Bay of Bengal and its conjugate, theEnderby Basin, East Antarctica (Nogi et al. 1991, 1996; Ramanaet al. 1994, 2001; Desa et al. 2006). Integrated geophysical and ge-ological results under the constraints of Deep Sea Drilling (DSDP)and Ocean Drilling (ODP) Programmes (Von der Borch, Sclateret al. 1974; Royer et al. 1989, 1991; Duncan 1991; Saunders et al.1991) further enhanced our understanding of the plate kinematicsin the Indian Ocean.
Evolution of the Indian Ocean can be documented in four mainphases. During the first phase in the Early Cretaceous, India sepa-rated from the contiguous Antarctica-Australia (Powell et al. 1988;Royer et al. 1989; Royer & Coffin 1992; Ramana et al. 2001).During the second phase in the Middle Cretaceous, the first majorplate reorganization took place and the direction of the Indian plate
movement changed from northwest to north (Powell et al. 1988;Scotese et al. 1988; Royer & Sandwell 1989; Ramana et al. 1997).In the third phase, i.e. from the Late Cretaceous to Middle Eocene,the Indian plate moved northwards with an average half-spreadingrate (HSR) of 12 cm yr−1 (Sclater & Fisher 1974). During the fourthphase, the second major plate reorganization due to the hard colli-sion of the Indian plate with the Eurasian plate (Curray et al. 1982)resulted in a change in the Indian plate motion direction to northeastand the formation of present day southeast Indian Ridge.
Major structural elements evolved in the Central Indian andCrozet Basins during the Late Cretaceous to Middle Eocene. TheAfanasy Nikitin seamount chain on the Indian plate and the Con-rad Rise on the Antarctica plate are the testimony for excessivevolcanism on either side of the spreading ridge between India andAntarctica (McKenzie & Sclater 1971). The Ninetyeast Ridge, atrace of the Kerguelen mantle plume, formed on the Indian plateduring Middle Cretaceous to Late Eocene (Peirce 1978; Mahoneyet al. 1983; Duncan 1991). The initiation of seafloor spreadingbetween Australia and Antarctica, and the opening of the Whar-ton Basin took place during this period (Crawford 1974; Sclater& Fisher 1974; Fedorov et al. 1982; Liu et al. 1983). Thoughthe Late Cretaceous to Early Tertiary evolutionary history of theNorthern Indian Ocean covering the distal Bengal Fan is well
C© 2009 The Authors 1265Journal compilation C© 2009 RAS
1266 M. Desa, M. V. Ramana and T. Ramprasad
established with the identification of magnetic anomaly isochrons34 through 31 (83.5–68.7 Ma) by earlier workers (McKenzie &Sclater 1971; Sclater & Fisher 1974; Norton & Sclater 1979; Schlich1982; Royer et al. 1991), there still exists a large data gap in theregion, particularly between 86◦E fracture zone (FZ) and Nine-tyeast Ridge, north of the equator. The magnetic anomalies westof the 86◦E FZ are offset right-laterally by several N–S trendingFZs; however, along the 86◦E FZ, a left-lateral offset of about900 km is reported by Sclater & Fisher (1974). East of the Nine-tyeast Ridge, in the Wharton Basin, left-laterally offset magneticanomalies (isochrons 32 and younger) are interpreted (Liu et al.1983). Interpretation of magnetic data collected in the corridor10–20◦S latitudes and 80–100◦E longitudes under the Trans In-dian Ocean Geotraverse (TIOG) Programme brought out the spa-tial distribution of magnetic anomaly isochrons 32A through 19and several FZs, in addition to a chain of fossil spreading ridge(FSR) segments which ceased their activity around Early Eocene(Krishna et al. 1995). The data gap, west of Ninetyeast Ridge inthe equatorial region of the Northern Indian Ocean, has limited ourunderstanding about the evolution of oceanic crust adjacent to theNinetyeast Ridge, and thereby the relative plate motions betweenIndia, Antarctica and Australia.
To establish the continuity of the structural fabric in the North-ern Indian Ocean, particularly west and east of Ninetyeast Ridge,additional magnetic data has been acquired in the region north ofthe equator, between the 86◦E FZ and the Ninetyeast Ridge. In thispaper, we report the analysis of this data after its integration withthe publicly available shipborne data (National Geophysical DataCenter, NGDC, Colorado). We have identified magnetic anomalyisochrons 34 through 31 in this corridor, and proposed new oceanicFZs based on the observed offsets of successive isochrons. Fur-ther, we have inferred the presence of FSR segments and about 62–85 km long extra crust between the chrons 33R and 31. These FSRsegments are associated with magnetic anomalies symmetric abouta central anomaly and a broad negative gravity field. Finally, we pro-posed refined plate reconstruction models for the Late Cretaceousperiod (chrons 34 and 31 time) using the newly identified magneticanomalies, FZs and extra oceanic crust.
2 S T U DY A R E A
The principal study area (Block A) lies between 86◦ and 93◦Elongitudes and 1◦S to 9◦N latitudes in the equatorial region of theNorthern Indian Ocean. This block includes the distal Bengal Fan,the northern part of the Ninetyeast Ridge and the northwestern partof the Wharton Basin (Fig. 1). Late Cretaceous magnetic anomalies34 through 31 were identified along the 86◦E meridian (McKenzie &Sclater 1971; Sclater & Fisher 1974; Royer et al. 1989). The oceaniccrust of Wharton Basin, situated east of the Ninetyeast Ridge, ischaracterized by magnetic anomaly sequence 32 and younger withage increasing towards north (Sclater & Fisher 1974; Liu et al.1983). The corridor between the 86◦E FZ and Ninetyeast Ridgelacks any magnetic anomaly identification.
Blocks B and C have been included in the present study to under-stand the evolutionary history of different provinces of similar agein the Indian Ocean (Fig. 1). Late Cretaceous magnetic anomalies34 and younger, and their right lateral offset by several N–S trend-ing FZs are well established in Block B (e.g. McKenzie & Sclater1971; Sclater & Fisher 1974; Schlich 1982; Royer et al. 1989). TheN–S trending Afanasy Nikitin seamount chain lies in this region.Block C lies in the Southern Crozet Basin between Ob, Lena andMarion Dufresne seamount chain in the west and Kerguelen plateau
in the east. Late Cretaceous to Tertiary magnetic anomalies (chrons34 through 27) were identified by Schlich (1975, 1982) and Patriat(1987). The conjugate nature of the Northern Indian Ocean withthe Southern Crozet Basin has been inferred from the plate recon-struction models for the Indian-Antarctic-Australian plates (Royer& Sandwell 1989). We have re-examined the existing data in thesetwo blocks to strengthen our inferences on the evolution of the LateCretaceous crust in Block A.
3 S T RU C T U R E A N D T E C T O N I C
S E T T I N G
The seabed topography of the distal Bengal Fan in Block A is smoothand depth to the seabed increases from 3400 to 4500 m towards south(Udintsev et al. 1975). The ocean floor is carpeted by <3 km thicksediments of Ganges and Brahmaputra rivers and pelagics (Curray1994). The Ninetyeast Ridge, a submarine linear feature extendsin an approximately north–south direction for more than 4500 kmbetween 31◦S and 9◦N latitudes and is surmised to extend severalhundred kilometres farther north beneath the Bengal Fan sediments.The ridge has a relief of about 2000 m from the adjacent seafloorand about 300- to 500-m thick sediments are entrapped within itsen-echelon segments (Sclater & Fisher 1974; Peirce 1978; Currayet al. 1982). It separates the Central Indian Basin from the WhartonBasin, and is bordered by a FZ consisting of a complex of ridgesand graben-like troughs on its eastern side. Scientific drilling onthe Ninetyeast Ridge during the Legs 22 and 26 of DSDP andLeg 121 of ODP (Luyendyk et al. 1973; Von der Borch, Sclateret al. 1974; Duncan 1991; Klootwijk et al. 1991) indicated that theridge is volcanic in origin, and becomes progressively older to thenorth from the Oligocene to Late Cretaceous as do the magneticanomaly isochrons observed to the west in the Central Indian Basin(McKenzie & Sclater 1971). Further, the ridge was always attachedto the Indian Plate, and formed in shallow water environment, sub-aerially exposed at times, and subsided along with the adjacentocean floor according to the plate models of age–depth relationship(Von der Borch, Sclater et al. 1974; Stein & Stein 1992). Thenorthern part of the ridge (north of 2◦S) was emplaced as a resultof intraplate volcanism on the Indian plate, and the ages alongthe ridge may not decrease monotonously from N to S becauseparts of the Antarctica plate were transferred to the Indian plate atdifferent times (Royer et al. 1991). Further, the ridge is inferredto have evolved at a more southerly location and migrated northsubsequently (Sclater & Fisher 1974). The Ninetyeast FZ, whichmarks the thermal barrier limiting the extrusion of the plume inthe Wharton Basin, kept progressing as the spreading centre in theWharton Basin migrated northward, while the frequent ridge jumpskept the spreading centre almost at a constant position west of theNinetyeast Ridge (Royer & Sandwell 1989).
The Wharton Basin, situated east of the Ninetyeast Ridge, isassociated with E–W trending left-laterally offset Tertiary magneticanomaly sequence (Sclater & Fisher 1974). A FSR has been inferredbased on the symmetric sets of magnetic anomalies 32 through 20in this basin (Liu et al. 1983). This fossil ridge had been a partof the boundary between Indian and Australian plates, along whichspreading activity ceased shortly after chron 20 (46 Ma), suggestingthat the northwestern Wharton Basin was a part of the Indian platefrom the Late Cretaceous to Eocene time (Liu et al. 1983).
The Central Indian Ocean Basin, including Block B (Fig. 1),is dominated by E–W trending magnetic anomaly isochrons 34through 22 offset right laterally by approximately N–S trending FZs,such as Indrani, Indira, 86◦, etc. (McKenzie & Sclater 1971; Sclater
C© 2009 The Authors, GJI, 177, 1265–1278
Journal compilation C© 2009 RAS
Evolution of the Late Cretaceous crust 1267
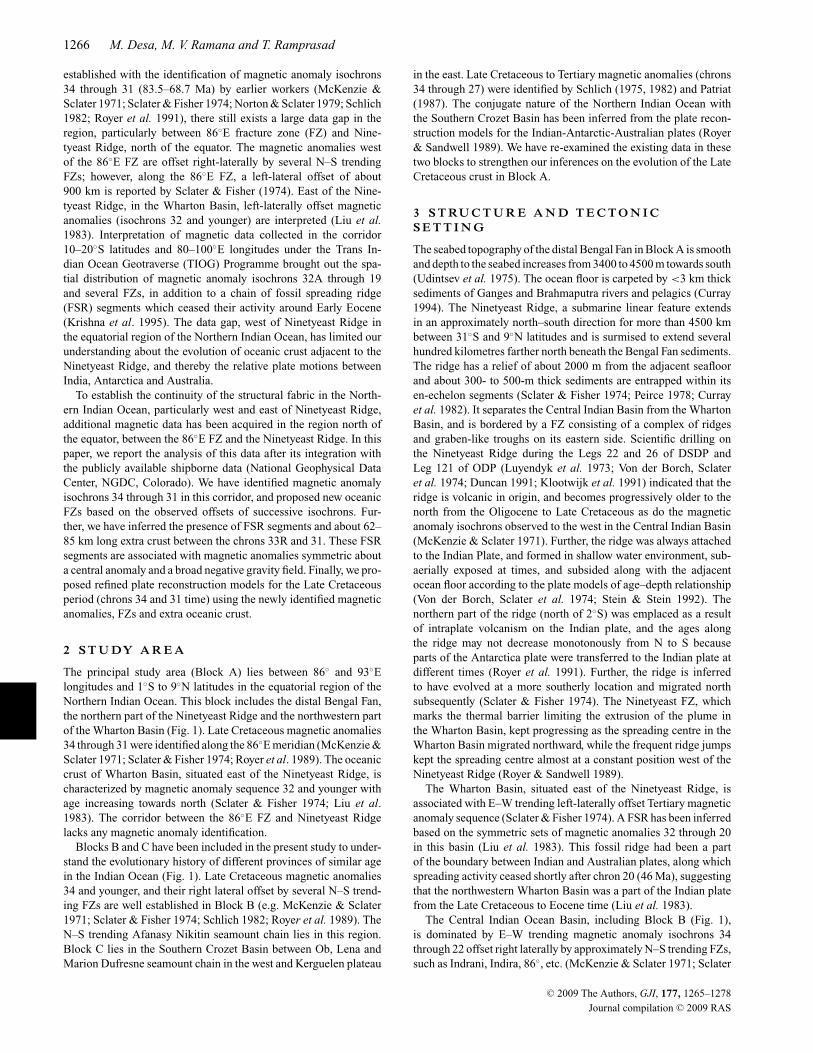
Figure 1. Generalized tectonic map of the Indian Ocean (Royer et al. 1989). The Blocks A, B and C represent the study areas. Fracture zones (dashed lines)and magnetic lineations (solid red lines, a few of which are labelled with magnetic anomaly numbers) are from earlier works (Royer et al. 1989; Ramana et al.2001; Desa et al. 2006). DSDP and ODP sites are indicated as small, open circles. Thick continuous lines represent fossil spreading ridges (Royer et al. 1989;Krishna et al. 1995). Blue enclosures represent large igneous provinces. NER, Ninetyeast Ridge; CLR, Chagos-Laccadive Ridge; SL, Sri Lanka; CB, CrozetBasin; EB, Elan Bank; ST, Sunda Trench; 85ER, 85◦E Ridge; OB, Ob, Lena & Marion Dufresne seamount chain; BR, Broken Ridge; KP, Kerguelen Plateau;MDG, Madagascar; CR, Comorin Ridge; CBR, Carlsberg Ridge; CIR, Central Indian Ridge; SWIR, Southwest Indian Ridge; SEIR, Southeast Indian Ridge;WB, Wharton Basin; KFZ, Kerguelen Fracture Zone; KI, Kerguelen Island; DBF, Distal Bengal Fan; 86FZ, 86◦ FZ; ANS, Afanasy Nikitin seamount chain.
& Fisher 1974; Krishna et al. 1995; Kamesh Raju & Ramprasad1989). The magnetic anomalies are left-laterally offset by about900 km along the 86◦E FZ. At the axis of the Southeast Indian Ridge,the southward projection of this FZ offsets the ridge axis right-laterally by about 200 km. To make these two situations compatible,Sclater & Fisher (1974) suggested that: (1) the ridge axis might havejumped at least 11◦ towards south and (2) the ridge jumps occurredany time since formation of anomaly 30.
Block C in the Southern Crozet Basin (Fig. 1) is associated withmagnetic anomalies 34 and younger, with age decreasing towardsnorth. These anomalies are right-laterally offset by several N28◦Etrending FZs. A major NNE–SSW trending FZ (Kerguelen FZ),west of Kerguelen Plateau, offsets the Late Cretaceous-Tertiarymagnetic anomaly sequence left-laterally by about 700 km (Schlich1982). The Ob, Lena and Marion Dufresne seamount chain alignsapproximately in WNW–ESE direction and rises to ∼250 m from
C© 2009 The Authors, GJI, 177, 1265–1278
Journal compilation C© 2009 RAS
1268 M. Desa, M. V. Ramana and T. Ramprasad
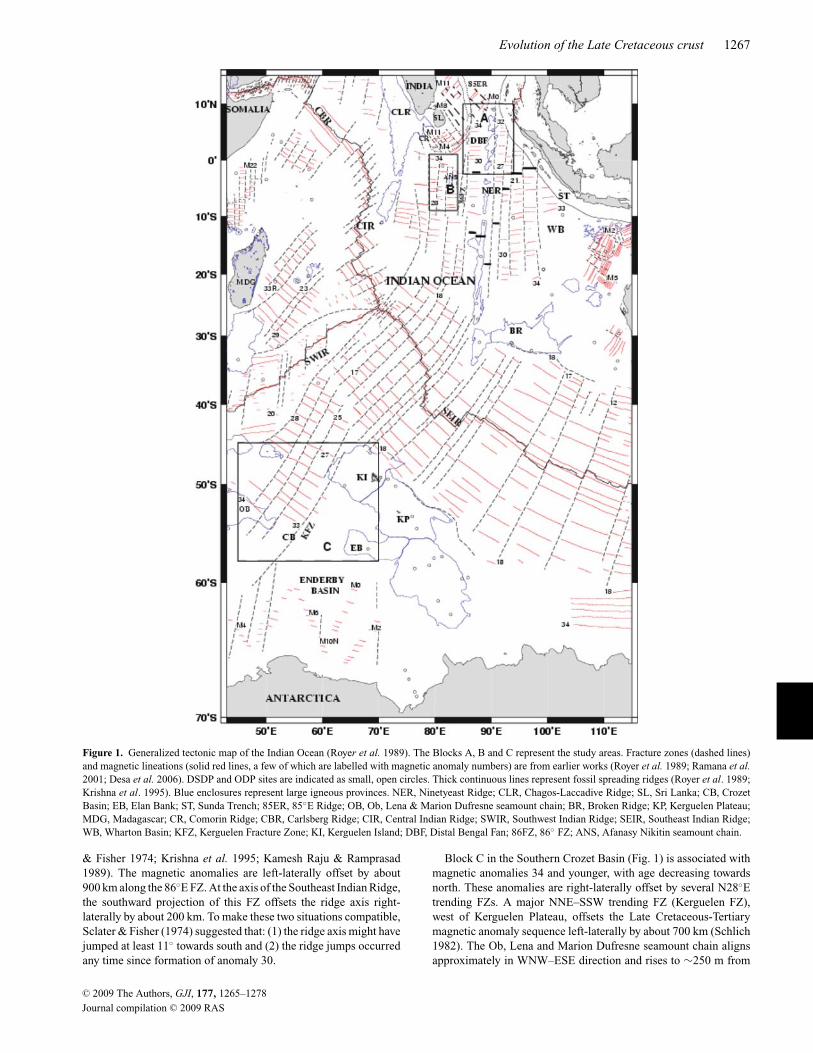
Figure 2. Residual magnetic anomalies plotted perpendicular to the cruise tracks superimposed on the satellite derived free-air gravity mosaic (Sandwell &Smith 1997) for the Blocks A and B. Positive magnetic anomalies are shaded white and projected towards right. Previously identified magnetic anomalies andfracture zones are indicated as continuous and dashed lines, respectively (Royer et al. 1991; Desa et al. 2006). Magnetic anomaly isochrons are indicated withnumbers. Drill sites that did not reach basement are indicated as red solid circles, while those that recovered basement rocks are indicated as black solid circles.
the surrounding water depth of about 4500 m. Goslin & Schlich(1982) suggested that the Afanasy Nikitin seamount chain in theCentral Indian Basin and the Marion Dufresne seamount chain inthe Crozet Basin were emplaced during an episode of anomalousvolcanism in the vicinity of a spreading centre.
4 DATA A N D M E T H O D O L O G Y
About 3100 km of new magnetic, gravity and bathymetry dataacquired on board ORV Sagar Kanya during the cruises SK82 andSK124 are used in the present study (Fig. 1, Block A). The datacomprises of three N–S profiles Sk124–06, Sk124–08, Sk124–10each about 500-km long that run roughly along 91, 89 and 88◦Elongitudes, respectively; two short profiles Sk124–11 and Sk124–12each about 200-km long and a 1100-km long profile Sk82–02 along86.5◦E longitude (Fig. 2A). In addition, about 5100 km of magneticand bathymetry data retrieved from the archives of the NGDC,Colorado, has been used in the present study to achieve good datacoverage. Two N–S trending profiles (Inmd7mv and Circ05ar about1200 km each from NGDC) are used in Block B (Fig. 2B). About5800 km of magnetic data has been used in the conjugate SouthernCrozet Basin to support and strengthen our interpretation (Fig. 3).Profiles Line1, Line2, Line4 and Line5 were digitized with due carefrom the published magnetic anomaly maps (Sclater et al. 1996),while the profiles C1705 and Inmd05mv were extracted from theNGDC. The processed magnetic data are plotted perpendicular tothe cruise tracks and superimposed on the satellite derived free-airgravity mosaic (Sandwell & Smith 1997).
Late Cretaceous to Tertiary magnetic anomalies have been in-ferred in the Central Indian Ocean Basin, west of 86◦E FZ(McKenzie & Sclater 1971; Sclater & Fisher 1974) and Wharton
Basin, east of Ninetyeast Ridge (Liu et al. 1983). Similar magneticanomalies are also reported in the Southern Crozet Basin (Schlich1982; Patriat 1987; Royer & Sandwell 1989; Sclater et al. 1996)which is a conjugate of the Northern Indian Ocean. Since the studyarea (Block A) lies between the 86◦E FZ and Ninetyeast Ridge,we presume the occurrence of similar magnetic anomalies in thiscorridor also. We therefore analysed the newly acquired magneticdata in Block A using the seafloor spreading modelling techniqueand estimated the HSRs. The magnetic profiles in Blocks B and Cwere also modelled.
5 R E S U LT S A N D I N T E R P R E TAT I O N
The amplitude of the magnetic anomalies in the prime study area(Block A) varies between −600 and 400 nT (Fig. 2A). The patternof the magnetic anomalies observed west of the 88◦E longitude, i.e.along the profiles Sk82–02, Sk124–12 and Inmd6mv, is compara-ble with that observed along the profiles Inmd7mv in Block B, andIioecgs-b, 84001211 and Odp121jr on the eastern side of the Nine-tyeast Ridge (Fig. 2), and exhibit typical seafloor spreading mag-netic anomaly characteristics. Though the magnetic anomaly patternobserved along the profiles SK124–10, SK124–08 and Dsdp22gc issomewhat disturbed, the anomalies along the profiles can still beinterpreted in terms of seafloor spreading. The profile Sk124–06traverses along the eastern flank of the Ninetyeast Ridge, and themagnetic signature along this profile seems to be influenced by therugged topography.
5.1 Magnetic model studies
The magnetic data in the Northern Indian Ocean and SouthernCrozet Basin were modelled using the geomagnetic polarity time
C© 2009 The Authors, GJI, 177, 1265–1278
Journal compilation C© 2009 RAS
Evolution of the Late Cretaceous crust 1269
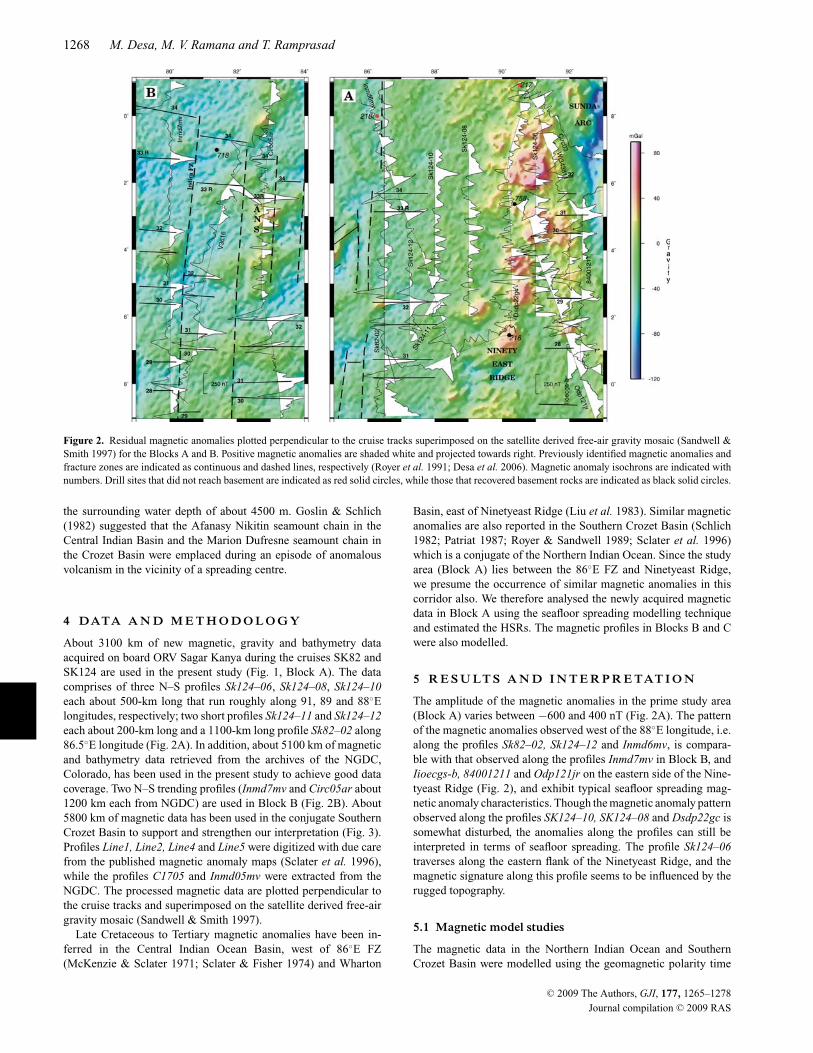
Figure 3. Residual magnetic anomalies plotted perpendicular to the cruise tracks superimposed on the satellite derived free-air gravity mosaic (Sandwell &Smith 1997) for the Southern Crozet Basin (Block C). Positive magnetic anomalies are shaded white and projected towards left. Fracture zones and magneticlineations are indicated as dashed lines and continuous lines, respectively (Schlich 1975, 1982). Magnetic anomaly isochrons are indicated with numbers. Drillsites that did not reach basement are indicated as red solid circles, while those that recovered basement rocks are indicated as black solid circles. Age in Myr ofthe basement rocks is indicated in brackets. CFZ1 to CFZ4 are the newly inferred fracture zones. CKP, Central Kerguelen Plateau; NKP, Northern KerguelenPlateau; KFZ, Kerguelen Fracture zone; KI, Kerguelen Island.
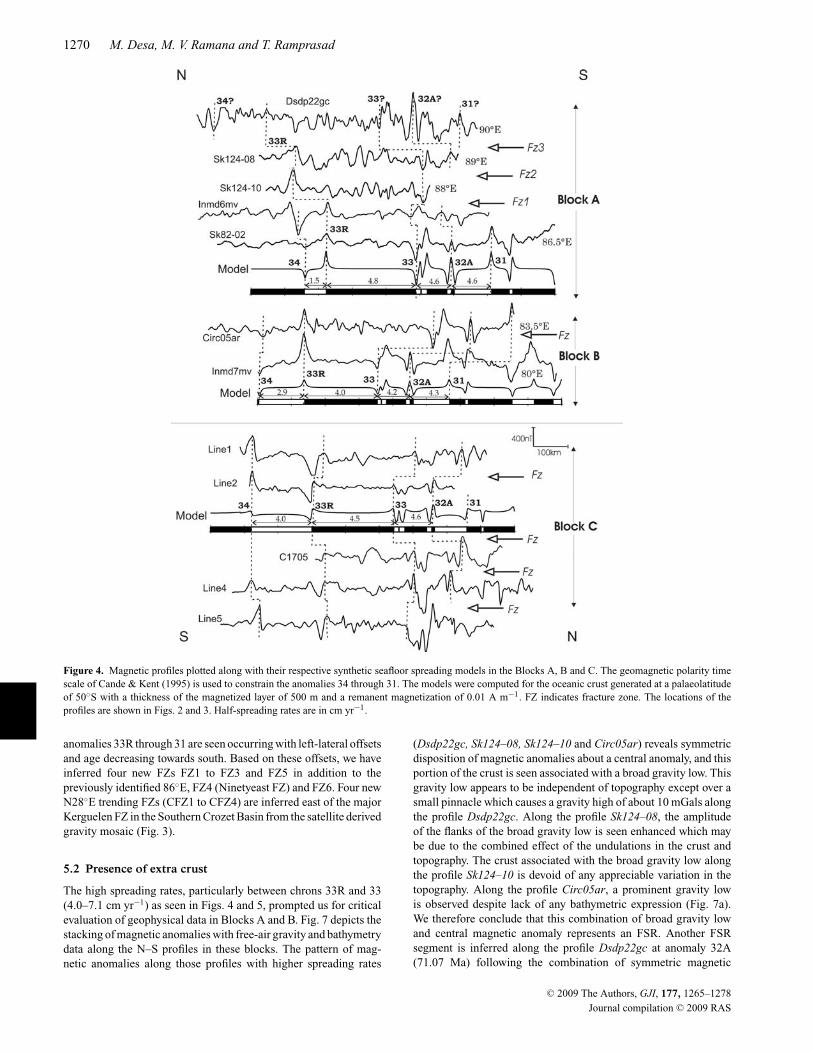
scale of Cande & Kent (1995). Synthetic seafloor spreading modelshave been generated by assuming uniformly magnetized blocks ofoceanic crust with an average thickness of 500 m and a remnantmagnetization of 0.01 A m−1. The best-fit models are obtained withthe palaeo-spreading centre located at 50◦S latitude (Royer et al.1991). Fig. 4 depicts the synthetic seafloor spreading models andinter-profile anomaly correlation in the three blocks. In Block A,anomalies 34 through 32A are confidently identified on profilesSk82–02 and Inmd6mv. Anomaly 33R is conspicuous on the pro-files Sk124–10 and Sk124–08. The profile Sk124–10 intersects theprofile Inmd6mv at the exact location where anomaly 33 has beenidentified. Thus, the location of anomaly 33 along the profile Sk124–10 is established and based on the correlation of anomalies, theanomalies 33 and 32A are identified on profile Sk124–08. Themagnetic anomalies 34 through 31 are tentatively identified alongthe profile Dsdp22gc based on their correlation with the syntheticmodel.
Model studies facilitated in reconfirming the magnetic anomalyidentifications 34 through 31 by earlier researchers in Blocks B andC (Fig. 4). Further, our model studies suggest that the oceanic crustin the three blocks has evolved with variable HSRs (Fig. 5). Thevariation in spreading rates is seen between successive isochronsas well as within the same isochrons along adjacent profiles, morespecifically between the anomaly isochrons 33R and 33 (e.g. profiles
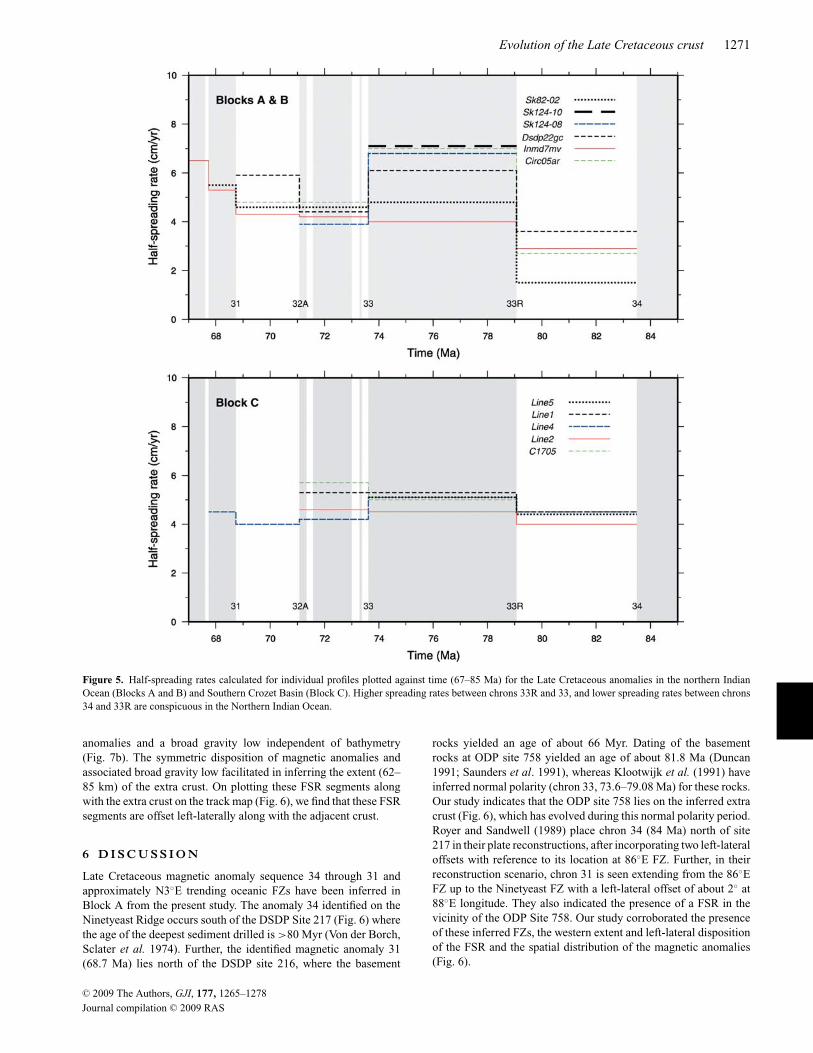
Inmd7mv and Circ05ar). The HSR between magnetic anomalies 34and 33R varies between 1.5 (Sk82–02) and 3.6 cm yr−1 (Dsdp22gc)in Block A and is about 2.8 cm yr−1 in Block B (Inmd7mv andCirc05ar). Between the anomalies 33R and 33, the HSR varies be-tween 4.8 (Sk82–02) and 7.1 cm yr−1 (Sk124–10) in Block A, whileit is about 4.0 cm yr−1 along profile Inmd7mv and 7.0 cm yr−1 alongprofile Circ05ar on the Afanasy Nikitin Seamount chain in Block B.The HSR stabilizes between 4 and 5 cm yr−1 for the younger anoma-lies 32 and 32A. However, along the profile Dsdp22gc betweenanomalies 32A and 31, the HSR is about 6 cm yr−1. In Block C,the crust between the chrons 34 to 33R has evolved with variableHSR of 4.0–4.7 cm yr−1, while between the chrons 33R to 33,the HSR is between 4.5 and 5.3 cm yr−1. It is conspicuous that thespreading rates between the chrons 34 and 33R are relatively high inthis region when compared with the crust of similar age in Block A.At the same time, the spreading rates are relatively low betweenthe chrons 33R and 33 in Block C when compared with that inBlock A (Fig. 5).
The inferred magnetic anomaly isochrons are plotted along thetracks to map the spatial distribution of the Late Cretaceous crustin Block A (Fig. 6). Anomaly 34 lies around 5.7◦N latitude and86.5–86.9◦E longitudes along the profiles Sk82–02 and Inmd6mv,while it is located between 8.5–8.7◦N latitudes and 90.5–91.15◦Elongitudes along the profiles Dsdp22gc, Wi343811 and Circ03. The
C© 2009 The Authors, GJI, 177, 1265–1278
Journal compilation C© 2009 RAS
1270 M. Desa, M. V. Ramana and T. Ramprasad
Figure 4. Magnetic profiles plotted along with their respective synthetic seafloor spreading models in the Blocks A, B and C. The geomagnetic polarity timescale of Cande & Kent (1995) is used to constrain the anomalies 34 through 31. The models were computed for the oceanic crust generated at a palaeolatitudeof 50◦S with a thickness of the magnetized layer of 500 m and a remanent magnetization of 0.01 A m−1. FZ indicates fracture zone. The locations of theprofiles are shown in Figs. 2 and 3. Half-spreading rates are in cm yr−1.
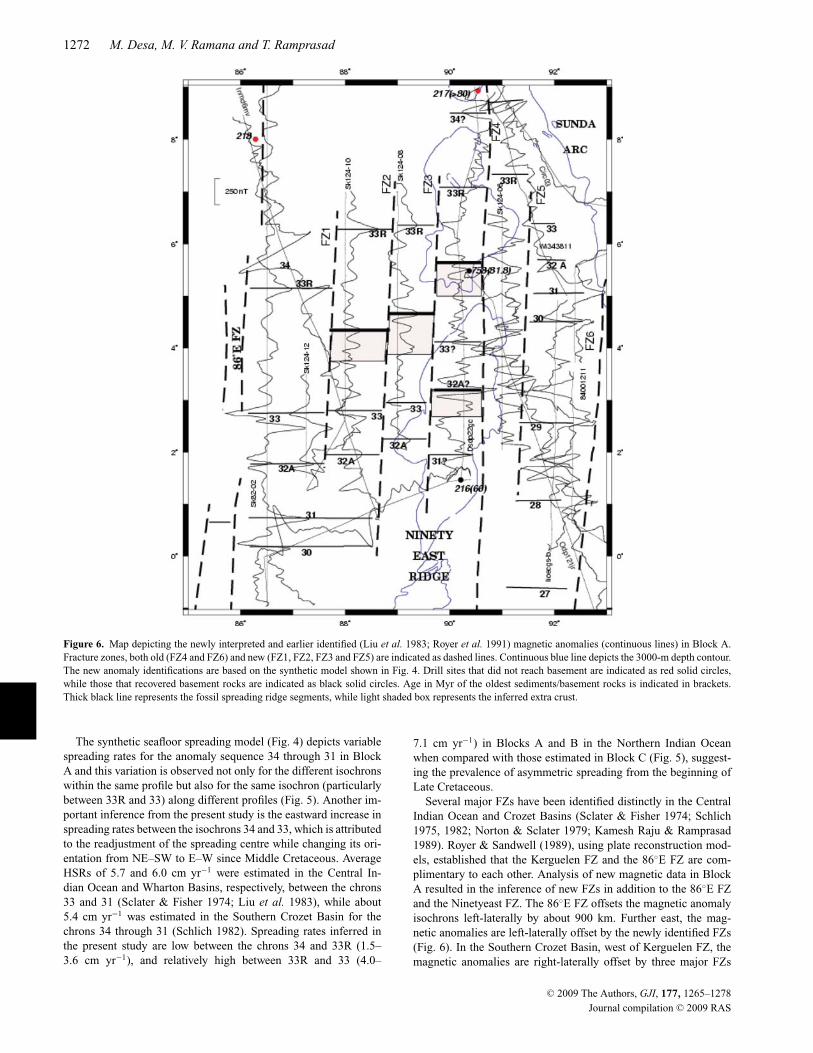
anomalies 33R through 31 are seen occurring with left-lateral offsetsand age decreasing towards south. Based on these offsets, we haveinferred four new FZs FZ1 to FZ3 and FZ5 in addition to thepreviously identified 86◦E, FZ4 (Ninetyeast FZ) and FZ6. Four newN28◦E trending FZs (CFZ1 to CFZ4) are inferred east of the majorKerguelen FZ in the Southern Crozet Basin from the satellite derivedgravity mosaic (Fig. 3).
5.2 Presence of extra crust
The high spreading rates, particularly between chrons 33R and 33(4.0–7.1 cm yr−1) as seen in Figs. 4 and 5, prompted us for criticalevaluation of geophysical data in Blocks A and B. Fig. 7 depicts thestacking of magnetic anomalies with free-air gravity and bathymetrydata along the N–S profiles in these blocks. The pattern of mag-netic anomalies along those profiles with higher spreading rates
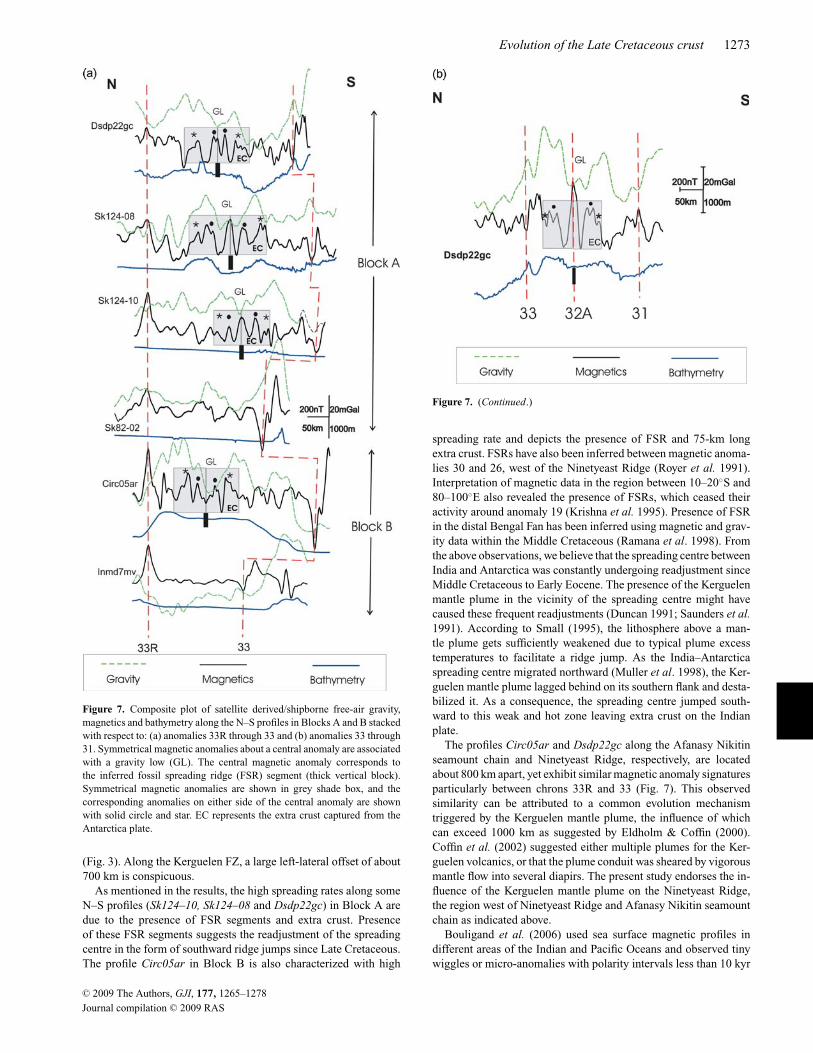
(Dsdp22gc, Sk124–08, Sk124–10 and Circ05ar) reveals symmetricdisposition of magnetic anomalies about a central anomaly, and thisportion of the crust is seen associated with a broad gravity low. Thisgravity low appears to be independent of topography except over asmall pinnacle which causes a gravity high of about 10 mGals alongthe profile Dsdp22gc. Along the profile Sk124–08, the amplitudeof the flanks of the broad gravity low is seen enhanced which maybe due to the combined effect of the undulations in the crust andtopography. The crust associated with the broad gravity low alongthe profile Sk124–10 is devoid of any appreciable variation in thetopography. Along the profile Circ05ar, a prominent gravity lowis observed despite lack of any bathymetric expression (Fig. 7a).We therefore conclude that this combination of broad gravity lowand central magnetic anomaly represents an FSR. Another FSRsegment is inferred along the profile Dsdp22gc at anomaly 32A(71.07 Ma) following the combination of symmetric magnetic
C© 2009 The Authors, GJI, 177, 1265–1278
Journal compilation C© 2009 RAS
Evolution of the Late Cretaceous crust 1271
Figure 5. Half-spreading rates calculated for individual profiles plotted against time (67–85 Ma) for the Late Cretaceous anomalies in the northern IndianOcean (Blocks A and B) and Southern Crozet Basin (Block C). Higher spreading rates between chrons 33R and 33, and lower spreading rates between chrons34 and 33R are conspicuous in the Northern Indian Ocean.
anomalies and a broad gravity low independent of bathymetry(Fig. 7b). The symmetric disposition of magnetic anomalies andassociated broad gravity low facilitated in inferring the extent (62–85 km) of the extra crust. On plotting these FSR segments alongwith the extra crust on the track map (Fig. 6), we find that these FSRsegments are offset left-laterally along with the adjacent crust.
6 D I S C U S S I O N
Late Cretaceous magnetic anomaly sequence 34 through 31 andapproximately N3◦E trending oceanic FZs have been inferred inBlock A from the present study. The anomaly 34 identified on theNinetyeast Ridge occurs south of the DSDP Site 217 (Fig. 6) wherethe age of the deepest sediment drilled is >80 Myr (Von der Borch,Sclater et al. 1974). Further, the identified magnetic anomaly 31(68.7 Ma) lies north of the DSDP site 216, where the basement
rocks yielded an age of about 66 Myr. Dating of the basementrocks at ODP site 758 yielded an age of about 81.8 Ma (Duncan1991; Saunders et al. 1991), whereas Klootwijk et al. (1991) haveinferred normal polarity (chron 33, 73.6–79.08 Ma) for these rocks.Our study indicates that the ODP site 758 lies on the inferred extracrust (Fig. 6), which has evolved during this normal polarity period.Royer and Sandwell (1989) place chron 34 (84 Ma) north of site217 in their plate reconstructions, after incorporating two left-lateraloffsets with reference to its location at 86◦E FZ. Further, in theirreconstruction scenario, chron 31 is seen extending from the 86◦EFZ up to the Ninetyeast FZ with a left-lateral offset of about 2◦ at88◦E longitude. They also indicated the presence of a FSR in thevicinity of the ODP Site 758. Our study corroborated the presenceof these inferred FZs, the western extent and left-lateral dispositionof the FSR and the spatial distribution of the magnetic anomalies(Fig. 6).
C© 2009 The Authors, GJI, 177, 1265–1278
Journal compilation C© 2009 RAS
1272 M. Desa, M. V. Ramana and T. Ramprasad
Figure 6. Map depicting the newly interpreted and earlier identified (Liu et al. 1983; Royer et al. 1991) magnetic anomalies (continuous lines) in Block A.Fracture zones, both old (FZ4 and FZ6) and new (FZ1, FZ2, FZ3 and FZ5) are indicated as dashed lines. Continuous blue line depicts the 3000-m depth contour.The new anomaly identifications are based on the synthetic model shown in Fig. 4. Drill sites that did not reach basement are indicated as red solid circles,while those that recovered basement rocks are indicated as black solid circles. Age in Myr of the oldest sediments/basement rocks is indicated in brackets.Thick black line represents the fossil spreading ridge segments, while light shaded box represents the inferred extra crust.
The synthetic seafloor spreading model (Fig. 4) depicts variablespreading rates for the anomaly sequence 34 through 31 in BlockA and this variation is observed not only for the different isochronswithin the same profile but also for the same isochron (particularlybetween 33R and 33) along different profiles (Fig. 5). Another im-portant inference from the present study is the eastward increase inspreading rates between the isochrons 34 and 33, which is attributedto the readjustment of the spreading centre while changing its ori-entation from NE–SW to E–W since Middle Cretaceous. AverageHSRs of 5.7 and 6.0 cm yr−1 were estimated in the Central In-dian Ocean and Wharton Basins, respectively, between the chrons33 and 31 (Sclater & Fisher 1974; Liu et al. 1983), while about5.4 cm yr−1 was estimated in the Southern Crozet Basin for thechrons 34 through 31 (Schlich 1982). Spreading rates inferred inthe present study are low between the chrons 34 and 33R (1.5–3.6 cm yr−1), and relatively high between 33R and 33 (4.0–
7.1 cm yr−1) in Blocks A and B in the Northern Indian Oceanwhen compared with those estimated in Block C (Fig. 5), suggest-ing the prevalence of asymmetric spreading from the beginning ofLate Cretaceous.
Several major FZs have been identified distinctly in the CentralIndian Ocean and Crozet Basins (Sclater & Fisher 1974; Schlich1975, 1982; Norton & Sclater 1979; Kamesh Raju & Ramprasad1989). Royer & Sandwell (1989), using plate reconstruction mod-els, established that the Kerguelen FZ and the 86◦E FZ are com-plimentary to each other. Analysis of new magnetic data in BlockA resulted in the inference of new FZs in addition to the 86◦E FZand the Ninetyeast FZ. The 86◦E FZ offsets the magnetic anomalyisochrons left-laterally by about 900 km. Further east, the mag-netic anomalies are left-laterally offset by the newly identified FZs(Fig. 6). In the Southern Crozet Basin, west of Kerguelen FZ, themagnetic anomalies are right-laterally offset by three major FZs
C© 2009 The Authors, GJI, 177, 1265–1278
Journal compilation C© 2009 RAS
Evolution of the Late Cretaceous crust 1273
Figure 7. Composite plot of satellite derived/shipborne free-air gravity,magnetics and bathymetry along the N–S profiles in Blocks A and B stackedwith respect to: (a) anomalies 33R through 33 and (b) anomalies 33 through31. Symmetrical magnetic anomalies about a central anomaly are associatedwith a gravity low (GL). The central magnetic anomaly corresponds tothe inferred fossil spreading ridge (FSR) segment (thick vertical block).Symmetrical magnetic anomalies are shown in grey shade box, and thecorresponding anomalies on either side of the central anomaly are shownwith solid circle and star. EC represents the extra crust captured from theAntarctica plate.
(Fig. 3). Along the Kerguelen FZ, a large left-lateral offset of about700 km is conspicuous.
As mentioned in the results, the high spreading rates along someN–S profiles (Sk124–10, Sk124–08 and Dsdp22gc) in Block A aredue to the presence of FSR segments and extra crust. Presenceof these FSR segments suggests the readjustment of the spreadingcentre in the form of southward ridge jumps since Late Cretaceous.The profile Circ05ar in Block B is also characterized with high
Figure 7. (Continued.)
spreading rate and depicts the presence of FSR and 75-km longextra crust. FSRs have also been inferred between magnetic anoma-lies 30 and 26, west of the Ninetyeast Ridge (Royer et al. 1991).Interpretation of magnetic data in the region between 10–20◦S and80–100◦E also revealed the presence of FSRs, which ceased theiractivity around anomaly 19 (Krishna et al. 1995). Presence of FSRin the distal Bengal Fan has been inferred using magnetic and grav-ity data within the Middle Cretaceous (Ramana et al. 1998). Fromthe above observations, we believe that the spreading centre betweenIndia and Antarctica was constantly undergoing readjustment sinceMiddle Cretaceous to Early Eocene. The presence of the Kerguelenmantle plume in the vicinity of the spreading centre might havecaused these frequent readjustments (Duncan 1991; Saunders et al.1991). According to Small (1995), the lithosphere above a man-tle plume gets sufficiently weakened due to typical plume excesstemperatures to facilitate a ridge jump. As the India–Antarcticaspreading centre migrated northward (Muller et al. 1998), the Ker-guelen mantle plume lagged behind on its southern flank and desta-bilized it. As a consequence, the spreading centre jumped south-ward to this weak and hot zone leaving extra crust on the Indianplate.
The profiles Circ05ar and Dsdp22gc along the Afanasy Nikitinseamount chain and Ninetyeast Ridge, respectively, are locatedabout 800 km apart, yet exhibit similar magnetic anomaly signaturesparticularly between chrons 33R and 33 (Fig. 7). This observedsimilarity can be attributed to a common evolution mechanismtriggered by the Kerguelen mantle plume, the influence of whichcan exceed 1000 km as suggested by Eldholm & Coffin (2000).Coffin et al. (2002) suggested either multiple plumes for the Ker-guelen volcanics, or that the plume conduit was sheared by vigorousmantle flow into several diapirs. The present study endorses the in-fluence of the Kerguelen mantle plume on the Ninetyeast Ridge,the region west of Ninetyeast Ridge and Afanasy Nikitin seamountchain as indicated above.
Bouligand et al. (2006) used sea surface magnetic profiles indifferent areas of the Indian and Pacific Oceans and observed tinywiggles or micro-anomalies with polarity intervals less than 10 kyr
C© 2009 The Authors, GJI, 177, 1265–1278
Journal compilation C© 2009 RAS
1274 M. Desa, M. V. Ramana and T. Ramprasad
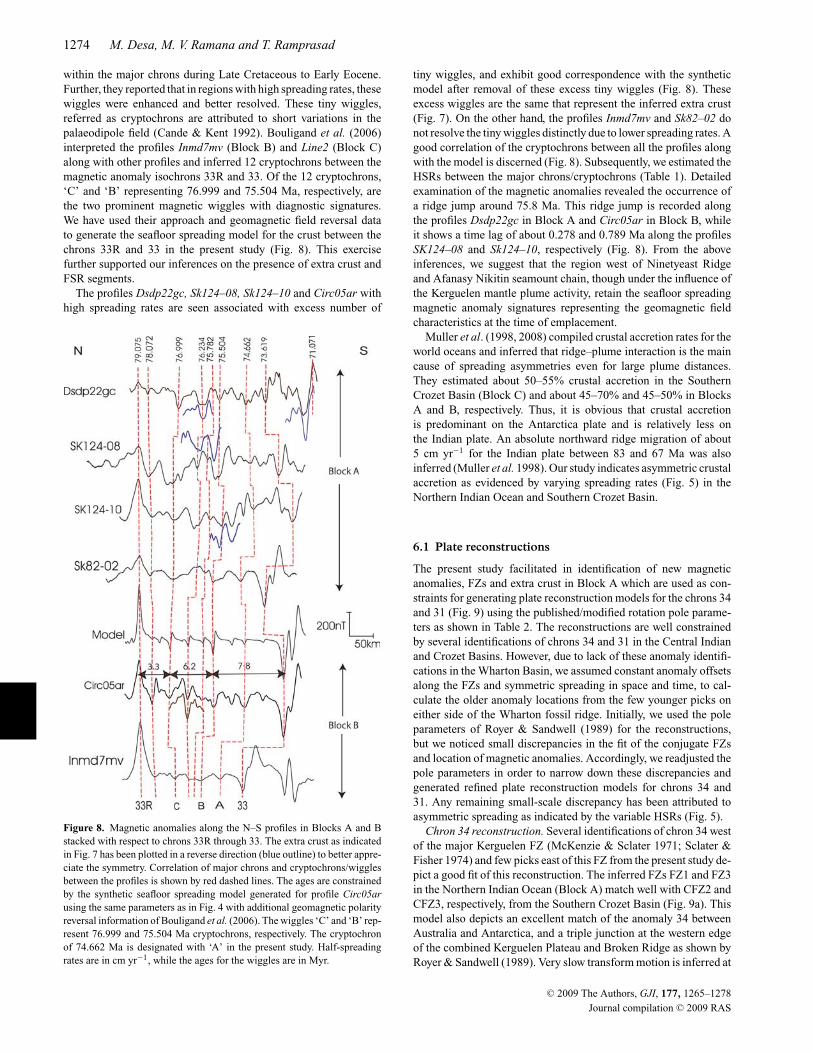
within the major chrons during Late Cretaceous to Early Eocene.Further, they reported that in regions with high spreading rates, thesewiggles were enhanced and better resolved. These tiny wiggles,referred as cryptochrons are attributed to short variations in thepalaeodipole field (Cande & Kent 1992). Bouligand et al. (2006)interpreted the profiles Inmd7mv (Block B) and Line2 (Block C)along with other profiles and inferred 12 cryptochrons between themagnetic anomaly isochrons 33R and 33. Of the 12 cryptochrons,‘C’ and ‘B’ representing 76.999 and 75.504 Ma, respectively, arethe two prominent magnetic wiggles with diagnostic signatures.We have used their approach and geomagnetic field reversal datato generate the seafloor spreading model for the crust between thechrons 33R and 33 in the present study (Fig. 8). This exercisefurther supported our inferences on the presence of extra crust andFSR segments.
The profiles Dsdp22gc, Sk124–08, Sk124–10 and Circ05ar withhigh spreading rates are seen associated with excess number of
Figure 8. Magnetic anomalies along the N–S profiles in Blocks A and Bstacked with respect to chrons 33R through 33. The extra crust as indicatedin Fig. 7 has been plotted in a reverse direction (blue outline) to better appre-ciate the symmetry. Correlation of major chrons and cryptochrons/wigglesbetween the profiles is shown by red dashed lines. The ages are constrainedby the synthetic seafloor spreading model generated for profile Circ05arusing the same parameters as in Fig. 4 with additional geomagnetic polarityreversal information of Bouligand et al. (2006). The wiggles ‘C’ and ‘B’ rep-resent 76.999 and 75.504 Ma cryptochrons, respectively. The cryptochronof 74.662 Ma is designated with ‘A’ in the present study. Half-spreadingrates are in cm yr−1, while the ages for the wiggles are in Myr.
tiny wiggles, and exhibit good correspondence with the syntheticmodel after removal of these excess tiny wiggles (Fig. 8). Theseexcess wiggles are the same that represent the inferred extra crust(Fig. 7). On the other hand, the profiles Inmd7mv and Sk82–02 donot resolve the tiny wiggles distinctly due to lower spreading rates. Agood correlation of the cryptochrons between all the profiles alongwith the model is discerned (Fig. 8). Subsequently, we estimated theHSRs between the major chrons/cryptochrons (Table 1). Detailedexamination of the magnetic anomalies revealed the occurrence ofa ridge jump around 75.8 Ma. This ridge jump is recorded alongthe profiles Dsdp22gc in Block A and Circ05ar in Block B, whileit shows a time lag of about 0.278 and 0.789 Ma along the profilesSK124–08 and Sk124–10, respectively (Fig. 8). From the aboveinferences, we suggest that the region west of Ninetyeast Ridgeand Afanasy Nikitin seamount chain, though under the influence ofthe Kerguelen mantle plume activity, retain the seafloor spreadingmagnetic anomaly signatures representing the geomagnetic fieldcharacteristics at the time of emplacement.
Muller et al. (1998, 2008) compiled crustal accretion rates for theworld oceans and inferred that ridge–plume interaction is the maincause of spreading asymmetries even for large plume distances.They estimated about 50–55% crustal accretion in the SouthernCrozet Basin (Block C) and about 45–70% and 45–50% in BlocksA and B, respectively. Thus, it is obvious that crustal accretionis predominant on the Antarctica plate and is relatively less onthe Indian plate. An absolute northward ridge migration of about5 cm yr−1 for the Indian plate between 83 and 67 Ma was alsoinferred (Muller et al. 1998). Our study indicates asymmetric crustalaccretion as evidenced by varying spreading rates (Fig. 5) in theNorthern Indian Ocean and Southern Crozet Basin.
6.1 Plate reconstructions
The present study facilitated in identification of new magneticanomalies, FZs and extra crust in Block A which are used as con-straints for generating plate reconstruction models for the chrons 34and 31 (Fig. 9) using the published/modified rotation pole parame-ters as shown in Table 2. The reconstructions are well constrainedby several identifications of chrons 34 and 31 in the Central Indianand Crozet Basins. However, due to lack of these anomaly identifi-cations in the Wharton Basin, we assumed constant anomaly offsetsalong the FZs and symmetric spreading in space and time, to cal-culate the older anomaly locations from the few younger picks oneither side of the Wharton fossil ridge. Initially, we used the poleparameters of Royer & Sandwell (1989) for the reconstructions,but we noticed small discrepancies in the fit of the conjugate FZsand location of magnetic anomalies. Accordingly, we readjusted thepole parameters in order to narrow down these discrepancies andgenerated refined plate reconstruction models for chrons 34 and31. Any remaining small-scale discrepancy has been attributed toasymmetric spreading as indicated by the variable HSRs (Fig. 5).
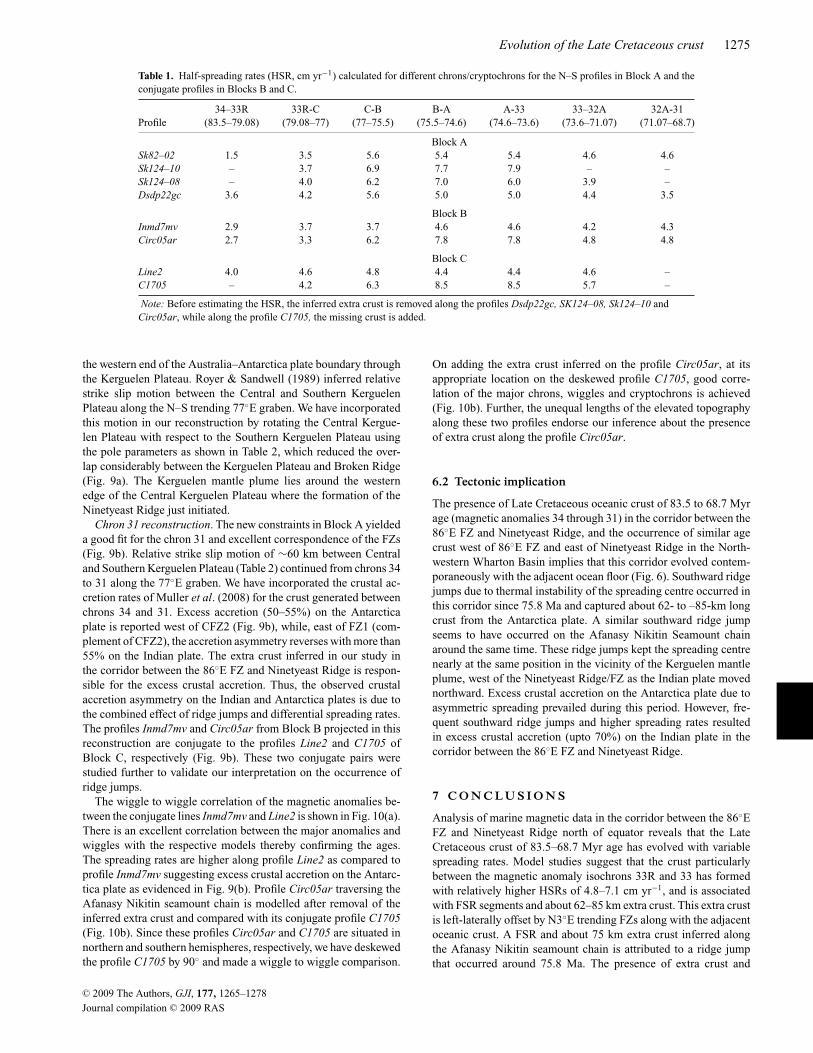
Chron 34 reconstruction. Several identifications of chron 34 westof the major Kerguelen FZ (McKenzie & Sclater 1971; Sclater &Fisher 1974) and few picks east of this FZ from the present study de-pict a good fit of this reconstruction. The inferred FZs FZ1 and FZ3in the Northern Indian Ocean (Block A) match well with CFZ2 andCFZ3, respectively, from the Southern Crozet Basin (Fig. 9a). Thismodel also depicts an excellent match of the anomaly 34 betweenAustralia and Antarctica, and a triple junction at the western edgeof the combined Kerguelen Plateau and Broken Ridge as shown byRoyer & Sandwell (1989). Very slow transform motion is inferred at
C© 2009 The Authors, GJI, 177, 1265–1278
Journal compilation C© 2009 RAS
Evolution of the Late Cretaceous crust 1275
Table 1. Half-spreading rates (HSR, cm yr−1) calculated for different chrons/cryptochrons for the N–S profiles in Block A and theconjugate profiles in Blocks B and C.
34–33R 33R-C C-B B-A A-33 33–32A 32A-31Profile (83.5–79.08) (79.08–77) (77–75.5) (75.5–74.6) (74.6–73.6) (73.6–71.07) (71.07–68.7)
Block ASk82–02 1.5 3.5 5.6 5.4 5.4 4.6 4.6Sk124–10 – 3.7 6.9 7.7 7.9 – –Sk124–08 – 4.0 6.2 7.0 6.0 3.9 –Dsdp22gc 3.6 4.2 5.6 5.0 5.0 4.4 3.5
Block BInmd7mv 2.9 3.7 3.7 4.6 4.6 4.2 4.3Circ05ar 2.7 3.3 6.2 7.8 7.8 4.8 4.8
Block CLine2 4.0 4.6 4.8 4.4 4.4 4.6 –C1705 – 4.2 6.3 8.5 8.5 5.7 –
Note: Before estimating the HSR, the inferred extra crust is removed along the profiles Dsdp22gc, SK124–08, Sk124–10 andCirc05ar, while along the profile C1705, the missing crust is added.
the western end of the Australia–Antarctica plate boundary throughthe Kerguelen Plateau. Royer & Sandwell (1989) inferred relativestrike slip motion between the Central and Southern KerguelenPlateau along the N–S trending 77◦E graben. We have incorporatedthis motion in our reconstruction by rotating the Central Kergue-len Plateau with respect to the Southern Kerguelen Plateau usingthe pole parameters as shown in Table 2, which reduced the over-lap considerably between the Kerguelen Plateau and Broken Ridge(Fig. 9a). The Kerguelen mantle plume lies around the westernedge of the Central Kerguelen Plateau where the formation of theNinetyeast Ridge just initiated.
Chron 31 reconstruction. The new constraints in Block A yieldeda good fit for the chron 31 and excellent correspondence of the FZs(Fig. 9b). Relative strike slip motion of ∼60 km between Centraland Southern Kerguelen Plateau (Table 2) continued from chrons 34to 31 along the 77◦E graben. We have incorporated the crustal ac-cretion rates of Muller et al. (2008) for the crust generated betweenchrons 34 and 31. Excess accretion (50–55%) on the Antarcticaplate is reported west of CFZ2 (Fig. 9b), while, east of FZ1 (com-plement of CFZ2), the accretion asymmetry reverses with more than55% on the Indian plate. The extra crust inferred in our study inthe corridor between the 86◦E FZ and Ninetyeast Ridge is respon-sible for the excess crustal accretion. Thus, the observed crustalaccretion asymmetry on the Indian and Antarctica plates is due tothe combined effect of ridge jumps and differential spreading rates.The profiles Inmd7mv and Circ05ar from Block B projected in thisreconstruction are conjugate to the profiles Line2 and C1705 ofBlock C, respectively (Fig. 9b). These two conjugate pairs werestudied further to validate our interpretation on the occurrence ofridge jumps.
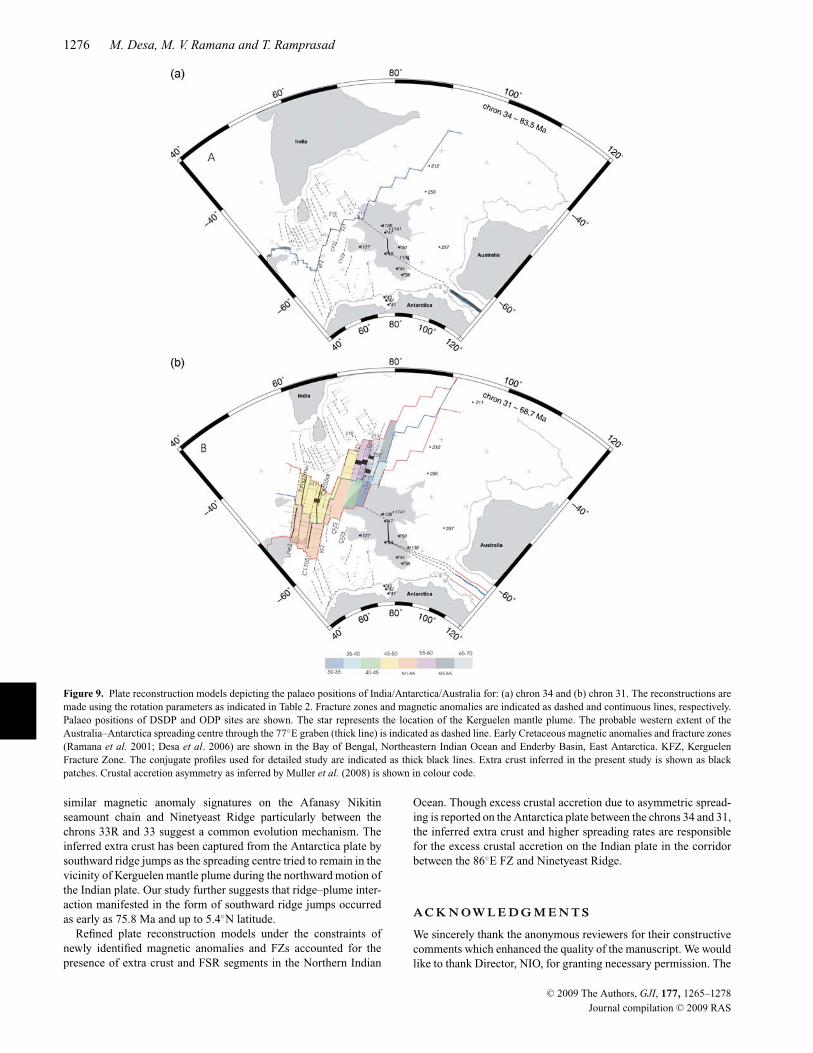
The wiggle to wiggle correlation of the magnetic anomalies be-tween the conjugate lines Inmd7mv and Line2 is shown in Fig. 10(a).There is an excellent correlation between the major anomalies andwiggles with the respective models thereby confirming the ages.The spreading rates are higher along profile Line2 as compared toprofile Inmd7mv suggesting excess crustal accretion on the Antarc-tica plate as evidenced in Fig. 9(b). Profile Circ05ar traversing theAfanasy Nikitin seamount chain is modelled after removal of theinferred extra crust and compared with its conjugate profile C1705(Fig. 10b). Since these profiles Circ05ar and C1705 are situated innorthern and southern hemispheres, respectively, we have deskewedthe profile C1705 by 90◦ and made a wiggle to wiggle comparison.
On adding the extra crust inferred on the profile Circ05ar, at itsappropriate location on the deskewed profile C1705, good corre-lation of the major chrons, wiggles and cryptochrons is achieved(Fig. 10b). Further, the unequal lengths of the elevated topographyalong these two profiles endorse our inference about the presenceof extra crust along the profile Circ05ar.
6.2 Tectonic implication
The presence of Late Cretaceous oceanic crust of 83.5 to 68.7 Myrage (magnetic anomalies 34 through 31) in the corridor between the86◦E FZ and Ninetyeast Ridge, and the occurrence of similar agecrust west of 86◦E FZ and east of Ninetyeast Ridge in the North-western Wharton Basin implies that this corridor evolved contem-poraneously with the adjacent ocean floor (Fig. 6). Southward ridgejumps due to thermal instability of the spreading centre occurred inthis corridor since 75.8 Ma and captured about 62- to –85-km longcrust from the Antarctica plate. A similar southward ridge jumpseems to have occurred on the Afanasy Nikitin Seamount chainaround the same time. These ridge jumps kept the spreading centrenearly at the same position in the vicinity of the Kerguelen mantleplume, west of the Ninetyeast Ridge/FZ as the Indian plate movednorthward. Excess crustal accretion on the Antarctica plate due toasymmetric spreading prevailed during this period. However, fre-quent southward ridge jumps and higher spreading rates resultedin excess crustal accretion (upto 70%) on the Indian plate in thecorridor between the 86◦E FZ and Ninetyeast Ridge.
7 C O N C LU S I O N S
Analysis of marine magnetic data in the corridor between the 86◦EFZ and Ninetyeast Ridge north of equator reveals that the LateCretaceous crust of 83.5–68.7 Myr age has evolved with variablespreading rates. Model studies suggest that the crust particularlybetween the magnetic anomaly isochrons 33R and 33 has formedwith relatively higher HSRs of 4.8–7.1 cm yr−1, and is associatedwith FSR segments and about 62–85 km extra crust. This extra crustis left-laterally offset by N3◦E trending FZs along with the adjacentoceanic crust. A FSR and about 75 km extra crust inferred alongthe Afanasy Nikitin seamount chain is attributed to a ridge jumpthat occurred around 75.8 Ma. The presence of extra crust and
C© 2009 The Authors, GJI, 177, 1265–1278
Journal compilation C© 2009 RAS
1276 M. Desa, M. V. Ramana and T. Ramprasad
Figure 9. Plate reconstruction models depicting the palaeo positions of India/Antarctica/Australia for: (a) chron 34 and (b) chron 31. The reconstructions aremade using the rotation parameters as indicated in Table 2. Fracture zones and magnetic anomalies are indicated as dashed and continuous lines, respectively.Palaeo positions of DSDP and ODP sites are shown. The star represents the location of the Kerguelen mantle plume. The probable western extent of theAustralia–Antarctica spreading centre through the 77◦E graben (thick line) is indicated as dashed line. Early Cretaceous magnetic anomalies and fracture zones(Ramana et al. 2001; Desa et al. 2006) are shown in the Bay of Bengal, Northeastern Indian Ocean and Enderby Basin, East Antarctica. KFZ, KerguelenFracture Zone. The conjugate profiles used for detailed study are indicated as thick black lines. Extra crust inferred in the present study is shown as blackpatches. Crustal accretion asymmetry as inferred by Muller et al. (2008) is shown in colour code.
similar magnetic anomaly signatures on the Afanasy Nikitinseamount chain and Ninetyeast Ridge particularly between thechrons 33R and 33 suggest a common evolution mechanism. Theinferred extra crust has been captured from the Antarctica plate bysouthward ridge jumps as the spreading centre tried to remain in thevicinity of Kerguelen mantle plume during the northward motion ofthe Indian plate. Our study further suggests that ridge–plume inter-action manifested in the form of southward ridge jumps occurredas early as 75.8 Ma and up to 5.4◦N latitude.
Refined plate reconstruction models under the constraints ofnewly identified magnetic anomalies and FZs accounted for thepresence of extra crust and FSR segments in the Northern Indian
Ocean. Though excess crustal accretion due to asymmetric spread-ing is reported on the Antarctica plate between the chrons 34 and 31,the inferred extra crust and higher spreading rates are responsiblefor the excess crustal accretion on the Indian plate in the corridorbetween the 86◦E FZ and Ninetyeast Ridge.
A C K N OW L E D G M E N T S
We sincerely thank the anonymous reviewers for their constructivecomments which enhanced the quality of the manuscript. We wouldlike to thank Director, NIO, for granting necessary permission. The
C© 2009 The Authors, GJI, 177, 1265–1278
Journal compilation C© 2009 RAS
Evolution of the Late Cretaceous crust 1277
Table 2. Finite rotation parameters used for generating plate reconstructions at chrons 34 and 31.
Chron Age (Ma) Latitude (+◦N) Longitude (+◦E) Angle (◦) Reference
India relative to Antarctica34 83.5 8.8 11.2 −64.5 Modified from Royer & Sandwell (1989)31 68.7 8.8 13.8 −52.5 Modified from Royer & Sandwell (1989)
Australia relative to Antarctica34 83.5 4.9 35.8 −27.81 Modified from Royer & Sandwell (1989)31 68.7 8.7 33.2 −25.83 Royer & Sandwell (1989)
Central Kerguelen Plateau relative to Southern Kerguelen Plateau34 83.5 −54.4 50.4 −5.41 Royer & Sandwell (1989)31 68.7 −55.0 38.1 −3.16 Royer & Sandwell (1989)
Note: Antarctica is kept in its present day position. Angles are positive counterclockwise.
Figure 10. (A) Magnetic anomalies along the conjugate profiles Line2 andInmd7mv with their synthetic models. Excellent correlation between themagnetic anomalies is depicted. Higher spreading rates (cm yr−1) pre-vail along Line2 as compared to Inmd7mv. (B) Magnetic anomalies andbathymetry (thick blue) along the conjugate profiles C1705 and Circ05ar(inferred extra crust plotted reversed) with their synthetic models. The vari-able extent of elevated topography along these profiles indicates the pres-ence/absence of crust. The deskewed profile C1705 is plotted along with theextra crust inferred on profile Circ05ar to validate our inference of ridgejump. A good correlation is now seen between the wiggles/cryptochrons onthe deskewed profile C1705 and Circ05ar (dashed lines). Half-spreadingrates are indicated in cm yr−1, while the ages corresponding to the wigglesare in Myr.
officers, crew, scientific and supporting staff who participated in theORV Sagar Kanya cruises SK82 and SK124 are duly acknowledged.GMT software (Wessel & Smith 1998) was used to generate themaps in this paper. This is NIO contribution No. 4494.
R E F E R E N C E S
Bouligand, C., Dyment, J., Gallet, Y. & Hulot, G., 2006. Geomagneticfield variations between chrons 33r and 19r (83–41 Ma) from sea-surfacemagnetic anomaly profiles, Earth Planet. Sci. Lett., 250, 541–560.
Cande, S.C. & Kent, D.V., 1992. Ultrahigh resolution marine magneticanomaly profiles: a record of continuous paleointensity variations? J.Geophys. Res., 97, 15 075–15 083.
Cande, S.C. & Kent, D.V., 1995. Revised calibration of the geomagneticpolarity time scale for the Late Cretaceous and Cenozoic, J. Geophys.Res., 100, 6093–6095.
Coffin, M.F., Pringle, M.S., Duncan, R.A., Gladczenko, T.P., Storey, M.,Muller, R.D. & Gahagan, L.A., 2002. Kerguelen hotspot magma outputsince 130 Ma, J. Petrol., 43, 1121–1139.
Crawford, A.R., 1974. Indo-Antarctica, Gondwanaland, and the distortionof a granulite belt, Tectonophysics, 22, 141–157.
Curray, J.R., 1994. Sediment volume and mass beneath the Bay of Bengal,Earth Planet. Sci. Lett., 125, 371–383.
Curray, J.R., Emmel, F.J., Moore, D.G. & Raitt, R.W., 1982. Structure,tectonics and geological history of the Northeastern Indian Ocean, in TheOcean Basins and Margins, Vol.6, pp. 399–450, eds Nairn, A.E. & Stehli,F.G., Plenum, New York.
Desa, M., Ramana, M.V. & Ramprasad, T., 2006. Seafloor spreading mag-netic anomalies south off Sri Lanka, Mar. Geol., 229, 227–240.
Duncan, R.A., 1991. Age distribution of volcanism along aseismic ridgesin the eastern Indian Ocean, in Proceedings of ODP, Scientific Results,Vol.121, pp. 507–517, eds Weissel, J.K., Peirce, J. et al., College DrillingProgram, College Station.
Duncan, R.A. & Richards, M.A., 1991. Hotspots, mantle plumes, floodbasalts and true polar wander, Rev. Geophys., 29, 31–50.
Eldholm, O. & Coffin, M.F., 2000. Large igneous provinces and plate tec-tonics, in The History and Dynamics of Global Plate Motions, Vol.121,pp. 309–326, eds Richards, M.A., Gordon, R.G. & van der Hilst, R.D.,Geophysical Monograph, American Geophysical Union, Washington.
Fedorov, L.V., Grikurov, G.E., Kurinin, R.G. & Masolov, V.N., 1982. Crustalstructure of the Lambert Glacier Area from geophysical data, in AntarcticaGeoscience, pp. 931–936, eds Craddock, C., Loveless, J.K., Vierima, T.L.& Crawford, K., University of Wisconsin Press, Madison, WI.
Goslin, J. & Schlich, R., 1982. Structural limits of the South Crozet Basin –Relations to Enderby Basin and the Kerguelen-Heard Plateau, in Antarc-tica Geoscience, pp. 79–85, eds Craddock, C., Loveless, J.K., Vierima,T.L. & Crawford, K., University of Wisconsin Press, Madison, WI.
Kamesh Raju, K.A. & Ramprasad, T., 1989. Magnetic lineations in theCentral Indian Basin for the period A24-A21: a study in relation tothe Indian Ocean triple junction trace, Earth Planet. Sci. Lett., 95,395–402.
Klootwijk, C.T., Gee, J.S., Pierce, J.W. & Smith, G.M., 1991. Constraintson the India – Asia convergence: paleomagnetic results from NinetyeastRidge, in Proceedings of ODP, Scientific Results, Vol.121, pp. 777–882,eds Weissel, J.K., Peirce, J. et al., College Drilling Program, CollegeStation.
C© 2009 The Authors, GJI, 177, 1265–1278
Journal compilation C© 2009 RAS
1278 M. Desa, M. V. Ramana and T. Ramprasad
Krishna, K.S., Gopala Rao, D., Ramana, M.V., Subrahmanyam, V., Sarma,K.V.L.N.S., Pilipenko, A.I., Shcherbakov, V.S. & Murthy, I.V.R., 1995.Tectonic model for the evolution of oceanic crust in the northeasternIndian Ocean from the Late Cretaceous to the Early Tertiary, J. Geophys.Res., 100, 20 011–20 024.
Liu, C.S., Curray, J.R. & McDonald, J.M., 1983. New constraints on thetectonic evolution of eastern Indian Ocean, Earth Planet. Sci. Lett., 65,331–342.
Luyendyk, B.P. et al., 1973. Leg 26, Deep Sea Drilling Project: acrossthe Southern Indian Ocean aboard Glomar Challenger, Geotimes, 18,16–19.
Mahoney, J.J., Macdougall, J.D., Lugmair, G.W. & Gopalan, K., 1983. Ker-gulen hotspot source for Rajmahal Traps and Ninetyeast Ridge? Nature,303, 385–389.
McKenzie, D. & Sclater, J.G., 1971. The evolution of the Indian Ocean sincethe Late Cretaceous, Geophys. J. R. Astron. Soc., 25, 437–528.
Muller, R.D., Roest, W.R. & Royer, J.-Y., 1998. Asymmetric sea-floor spreading caused by ridge-plume interactions, Nature, 396, 455–459.
Muller, R.D., Sdrolias, M., Gaina, C. & Roest, W.R., 2008. Age, spreadingrates, and spreading asymmetry of the world’s ocean crust, Geochem.Geophys. Geosyst., 9, Q04006, doi:10.1029/2007GC001743.
Nogi, Y., Seama, N., Isezaki, N., Hayashi, T., Funaki, M. & Kaminuma, K.,1991. Geomagnetic anomaly lineations and fracture zones in the basinwest of Kerguelen Plateau, EOS Trans. Am. geophys. Un., 72, 445.
Nogi, Y., Seama, N., Isezaki, N. & Fukuda, Y., 1996. Magnetic anomalylineation and fracture zone formations deduced from vector data of thegeomagnetic anomaly field in the west Enderby Basin adjacent to theWeddell Sea, in Weddell Sea Tectonics and Gondwana Breakup, Vol.108,pp. 265–273, eds Storey, B.C., King, E.C. & Livermore, R.A., Geol. Soc.Spec. Publ., The Geological Society Publishing House, Bath.
Norton, I.O. & Sclater, J.G., 1979. A model for the evolution of the IndianOcean and the break up of Gondwanaland, J. Geophys. Res., 84, 6803–6830.
Patriat, P., 1987. Reconstitution de l’evolution du systeme de dorsales del’Ocean Indien par les methods de la cinematique des plaques, Territoiresdes Terres Australes et Antarctique Francaises, Paris.
Peirce, J.W., 1978. The northward motion of India since the Late Cretaceous,Geophys. J. R. Astron. Soc., 52, 277–311.
Powell, C.M., Roots, S.R. & Veevers, J.J., 1988. Pre-breakup continentalextension in East Gondwanaland and the early opening of the easternIndian Ocean, Tectonophysics, 155, 261–283.
Ramana, M.V. et al., 1994. Mesozoic anomalies in the Bay of Bengal, EarthPlanet. Sci. Lett., 121, 469–475.
Ramana, M.V., Subrahmanyam, V., Sarma, K.V.L.N.S., Desa, M.,Malleswara Rao, M.M. & Subrahmanyam, C., 1997. Record of the Cre-taceous Magnetic Quiet Zone: a precursor to the understanding of theevolutionary history of the Bay of Bengal, Curr. Sci., 72, 669–673.
Ramana, M.V., Subrahmanyam, V., Sarma, K.V.L.N.S., Desa, M. &Ramprasad, T., 1998. Boundary of magnetic anomaly isochron A34 (∼84Ma) in the southern Bay of Bengal. 35th Annual Convention and Meetingon Continental Margins of India – Evolution, Processes and Potentials,Abstract volume, p. 12, Indian Geophysical Union, Hyderabad.
Ramana, M.V., Ramprasad, T. & Desa, M., 2001. Seafloor spreading mag-netic anomalies in the Enderby Basin, East Antarctica, Earth Planet. Sci.Lett., 191, 241–255.
Royer, J.-Y. & Sandwell, D.T., 1989. Evolution of the eastern Indian Oceansince the Late Cretaceous: constraints from GEOSAT altimetry, J. Geo-phys. Res., 94, 13 755–13 782.
Royer, J.-Y., Sclater, J.G. & Sandwell, D.T., 1989. A preliminary tectonicfabric chart of the Indian Ocean, Proc. Ind. Acad. Sci., Earth Planet. Sci.,98, 7–24.
Royer, J.-Y., Peirce, J.W. & Weissel, J.K., 1991. Tectonic constraints on thehot-spot formation of Ninetyeast Ridge, in Proceedings of ODP, ScientificResults, Vol.121, pp. 763–776, eds Weissel, J.K., Peirce, J., et al., OceanDrilling Program, College Station.
Royer, J.Y. & Coffin, M.F., 1992. Jurassic to Eocene plate tectonic recon-structions in the Kerguelen plateau region, in Proceedings of ODP, Scien-tific Results, Vol.120, pp. 917–928, eds Wise, Jr. S.W., Schlich, R., et al,Ocean Driling Program, College Station.
Sandwell, D.T. & Smith, W.H.F., 1997. Marine gravity anomaly fromGEOSAT and ERS-1 satellite altimetry, J. Geophys. Res., 102, 10 039–10 054.
Saunders, A.D., Storey, M., Gibson, I.L., Leat, P., Hergt, J. & Thompson,R.N., 1991. Chemical and isotopic constraints on the origin of basaltsfrom Ninetyeast Ridge, Indian Ocean: results from DSDP Legs 22 and26 and ODP Leg 121, in Proceedings of ODP, Scientific Results, Vol.121,pp. 559–590, eds Weissel, J.K., Peirce, J. et al., Ocean Drilling Program,College Station.
Schlich, R., 1975. Structure et age de l’ocean Indien occidental, Mem. Hors.Ser. Soc. Geol. Fr., 6, 103 pp.
Schlich, R., 1982. The Indian Ocean: aseismic ridges, spreading centers andocean basins, in The Ocean Basins and Margins, Vol.6, pp. 51–147, edsNairn, A.E., & Stehli, F.G., Plenum, New York.
Sclater, J.G. & Fisher, R.L., 1974. Evolution of the east Central Indian Oceanwith emphasis on the tectonic setting of the Ninetyeast Ridge, Geol. Soc.Am. Bull., 85, 683–702.
Sclater, J.G., Munschy, M., Fisher, R.L., Weatherall, P.A., Cande, S.C.,Schlich, R., Patriat, P. & Bergh, H., 1996. Geophysical synthesis of theIndian/Southern Oceans: part 1, The southwest Indian Ocean, SIO Ref.Series, No. 97–06, 45 pp, University of California, San Diego, CA.
Scotese, C.R., Gahagan, L.M. & Larson, R.L., 1988. Plate tectonic recon-structions of the Cretaceous and Cenozoic ocean basins, Tectonophysics,155, 27–48.
Small, C., 1995. Observations of ridge-hotspot interactions in the SouthernOcean, J. Geophys. Res., 100, 17 931–17 946.
Stein, C.A. & Stein, S., 1992. A model for the global variation in oceanicdepth and heat flow with lithospheric age, Nature, 359, 123–129.
Udintsev, G.B., Fisher, R.L., Kanaev, V.F., Laughton, A.S., Simpson, E.S.W.& Zhiv, D.I., 1975. Geological-Geophysical Atlas of the Indian Ocean,Academy of Sciences of the U.S.S.R., Moscow, 151 pp.
Von der Borch, C.C., Sclater, J.G. et al., 1974. Initial Reports of the DeepSea Drilling Project, Vol.22, U. S. Govt. Printing Office, Washington,890 pp.
Wessel, P. & Smith, W.H.F., 1998. New improved version of Generic Map-ping Tools released, EOS Trans. Am. geophys. Un., 79, 579.
C© 2009 The Authors, GJI, 177, 1265–1278
Journal compilation C© 2009 RAS
Top Related
Copyright © 2022 FDOKUMEN

