


Bahasa
Halaman
Hukum

www.elsevier.com/locate/ynimg
NeuroImage 24 (2005) 118–131
Estimation of the cortical functional connectivity with the multimodal
integration of high-resolution EEG and fMRI data by directed
transfer function
F. Babiloni,a,b,* F. Cincotti,b C. Babiloni,a,c,d F. Carducci,a,c,d D. Mattia,b L. Astolfi,b,e
A. Basilisco,a P.M. Rossini,c,d,f L. Ding,g,h Y. Ni,g J. Cheng,g K. Christine,g
J. Sweeney,g and B. Heg,h
aDepartment of Human Physiology and Pharmacology, University bLa SapienzaQ, Rome, ItalybIRCCS Fondazione Santa Lucia, Rome, ItalycAFAR-Department of Neuroscience, Ospedale Isola Tiberina, Rome, ItalydIRCCS bCentro S. Giovanni di Dio-Fatebenefratelli Q, Brescia, ItalyeDepartment of Informatics and Systems, University bLa SapienzaQ, Rome, ItalyfDepartment of Neurology, University Campus Bio-Medico, Rome, ItalygUniversity of Illinois, Chicago, IL 60607, USAhUniversity of Minnesota, Minneapolis, MN 55455, USA
Received 2 March 2004; revised 17 May 2004; accepted 23 September 2004
Available online 13 November 2004
Nowadays, several types of brain imaging device are available to
provide images of the functional activity of the cerebral cortex based on
hemodynamic, metabolic, or electromagnetic measurements. However,
static images of brain regions activated during particular tasks do not
convey the information of how these regions communicate with each
other. In this study, advanced methods for the estimation of cortical
connectivity from combined high-resolution electroencephalography
(EEG) and functional magnetic resonance imaging (fMRI) data are
presented. These methods include a subject’s multicompartment head
model (scalp, skull, dura mater, cortex) constructed from individual
magnetic resonance images, multidipole source model, and regularized
linear inverse source estimates of cortical current density. Determi-
nation of the priors in the resolution of the linear inverse problem was
performed with the use of information from the hemodynamic
responses of the cortical areas as revealed by block-designed (strength
of activated voxels) fMRI. We estimate functional cortical connectivity
by computing the directed transfer function (DTF) on the estimated
cortical current density waveforms in regions of interest (ROIs) on the
modeled cortical mantle. The proposed method was able to unveil the
direction of the information flow between the cortical regions of
interest, as it is directional in nature. Furthermore, this method allows
to detect changes in the time course of information flow between
cortical regions in different frequency bands. The reliability of these
techniques was further demonstrated by elaboration of high-resolution
1053-8119/$ - see front matter D 2004 Elsevier Inc. All rights reserved.
doi:10.1016/j.neuroimage.2004.09.036
* Corresponding author. Dipartimento di Fisiologia Umana e Farma-
cologia, Universita di Roma bLa SapienzaQ, P.le A. Moro 5, 00185 Roma,
Italy. Fax: +39 6 49910917.
E-mail address: [email protected] (F. Babiloni).
Available online on ScienceDirect (www.sciencedirect.com.)
EEG and fMRI signals collected during visually triggered finger
movements in four healthy subjects. Connectivity patterns estimated
for this task reveal an involvement of right parietal and bilateral
premotor and prefrontal cortical areas. This cortical region involve-
ment resembles that revealed in previous studies where visually
triggered finger movements were analyzed with the use of separate
EEG or fMRI measurements.
D 2004 Elsevier Inc. All rights reserved.
Keywords: Linear inverse source estimate; EEG and fMRI integration;
Movement-related potentials; DTF; Finger tapping
Introduction
Nowadays, there are several types of brain imaging device that
are able to provide images of the functional activity of the cerebral
cortex based on hemodynamic, metabolic, or electromagnetic
measurements. However, static images of brain regions activated
during particular tasks do not convey a sufficient amount of
information with respect to the central issue of how these regions
communicated with each other. The concept of brain connectivity
now plays a central role in neuroscience as a way to understand
one possible dcode T of the functioning brain, as well as the
organized behavior of cortical regions beyond the simple mapping
of their activity (David et al., 2004; Horwitz, 2003; Lee et al.,
2003). Different approaches for the estimate of cortical connectiv-
ity have already been exploited in the literature based on
F. Babiloni et al. / NeuroImage 24 (2005) 118–131 119
hemodynamic or metabolic measurements (Buchel and Friston,
1997), electroencephalography (EEG) scalp potentials (Brovelli et
al., 2002; Gevins et al., 1989; Urbano et al., 1998), and magneto-
encephalographic (MEG) fields (Taniguchi et al., 2000).
Structural equation models have been used to investigate
cortical connectivity in the human brain by means of functional
magnetic resonance imaging (fMRI, Buchel and Friston, 1997;
McIntosh and Gonzalez-Lima, 1994; Schlosser et al., 2003).
However, the temporal dynamics of the hemodynamic process
(on the scale of seconds) makes it problematic to follow the
transient activity of the neural populations that develops in the
order of tens of milliseconds. Indeed, EEG and MEG are known
as useful techniques for the study of brain dynamics due to their
high temporal resolution (milliseconds; Nunez, 1981, 1995).
However, in the EEG case, the different electrical conductivities
of the brain, skull, and scalp markedly blur the EEG potential
distributions and render the localization of the underlying
cortical generators problematic. In last decade, techniques known
as high-resolution EEG had allowed to estimate precisely the
cortical activity from noninvasive EEG measurements (Babiloni
et al., 1997; Gevins, 1989, 1991, 1999; He and Lian, 2002; He
et al., 2002; Nunez, 1995). This body of EEG techniques
includes the use of a large number of scalp electrodes, realistic
models of the head derived from structural magnetic resonance
images (MRIs), and advanced processing methodologies related
to the solution of the linear inverse problem. These method-
ologies allow the estimation of cortical current density from
sensor measurements (Babiloni et al., 2000; Grave de Peralta
Menendez and Gonzalez Andino, 1999; Pascual-Marqui, 1995).
Nowadays, all the connectivity estimations performed on
cerebral electromagnetic signals have been computed between
the signals gathered from the electric or magnetic sensors
(Gevins et al., 1989; Urbano et al., 1998). On the other hand,
the relation between the observed spatial patterns in the sensor
space and those in the source space is complicated by the
spreading of the potential from the cortex to the sensors.
Recently, a methodology being able to compute the coherence
between cortical areas has been introduced, and applications to
MEG data gathered from normal and Parkinson’s disease
patients were provided (Gross et al., 2001, 2003). This
methodology was applied to cortical signals estimated from
MEG measurements, thus improving the spatial details available
with respect to the computation of coherence from signals
derived directly from the sensors. However, in this case, the
direction of the information flow between the cortical areas was
not available due to the nondirectional nature of coherence
computation.
Here, we present a novel computational approach for the
estimation of cortical connectivity based on directed transfer
function (DTF), a technique used to estimate the direction of
information flow between signals gathered from EEG sensors
(Kaminski and Blinowska, 1991; Kaminski et al., 2001). We
applied the DTF approach on the cortical signals estimated
from high-resolution EEG recordings by using realistic head
models and a cortical reconstruction algorithm on an average of
5000 dipoles uniformly disposed along the cortical surface. The
estimation of the cortical activity was obtained by application
of the linear inverse procedure (Grave de Peralta Menendez and
Gonzalez Andino, 1999; Pascual-Marqui, 1995). In this
estimation procedure, several a priori information were used
in order to increase the quality of the cortical current density
estimates. The first a priori information used was the
anatomical constraints by placing the current dipoles orthogo-
nally to the reconstructed cortical surface. An additional
constraint was to force the dipoles to explain the recorded
data with a minimum or a low amount of energy (minimum-
norm solutions; Dale and Sereno, 1993; Hamalainen and
Ilmoniemi, 1984).
The solution space can be further reduced by using
information derived from hemodynamic measures (i.e., fMRI–
BOLD phenomenon) recorded during the same task. The
rationale of this multimodal approach is that neural activity,
modulating neuronal firing and generating synchronized and
coherent EEG potentials, increases glucose and oxygen demands
(Dale et al., 2000; Liu et al., 1998; Magistretti et al., 1999).
This results in an increase in the local hemodynamic response
that can be measured by fMRI (Grinvald et al., 1986; Puce et
al., 1997). Hence, fMRI responses and cortical sources of EEG
data can be spatially related (Logothetis et al., 2001).
Furthermore, numerical simulations have shown that the use of
fMRI priors increases the quality of the cortical current
estimations (Babiloni et al., 2003; Liu, 2000, 1998). In the
present study, this integrated approach is proposed for the
estimation of cortical connectivity from combined electromag-
netic and hemodynamic measurements in humans, and tested by
analyzing visually paced finger movements executed by four
healthy subjects.
Methods
Subject and experimental design
Four normal right-handed subjects (one male, three females;
mean age 23 F 0.2 years) participated in the study after informed
consent was obtained, according to the Institutional Review
Board at the University of Illinois at Chicago. Subjects were
seated comfortably in an armchair with both arms relaxed and
resting on pillows and were requested to perform fast repetitive
right finger movements that were cued by visual stimuli. Ten to
fifteen blocks of 2-Hz thumb oppositions for right hands were
recorded with each 30-s blocks of finger movement and rest.
During the movement, subjects were instructed to avoid eye
blinks, swallowing, or any movement other than the required
finger movements.
High-resolution EEG recordings
Event-related potential (ERP) data were recorded with 96
electrodes; data were recorded with a left ear reference and
submitted to the artifact removal processing. Six hundred ERP
trials of 600 ms of duration were acquired. A/D sampling rate was
250 Hz. The surface electromyographic (EMG) activity of the
muscle was also collected. The onset of EMG response served as
zero time. All data were visually inspected, and trials containing
artifacts were rejected. We use semiautomatic supervised threshold
criteria for the rejection of trials contaminated by ocular and EMG
artifacts, as described in details elsewhere (Moretti et al., 2003).
After the EEG recording, the electrode positions were digitized
using a three-dimensional localization device with respect to the
anatomic landmarks of the head (nasion and two preauricular
points). The MRIs of each subject’s head were also acquired. These
F. Babiloni et al. / NeuroImage 24 (2005) 118–131120
images were used for the construction of the individual realistic
geometry head model. The realistic head models are necessary for
the estimation of cortical activity in the appropriate region of
interest (ROIs) by using the linear inverse procedure algorithms
from the scalp-recorded ERP data. The time-varying spectral
values of the estimated cortical activity in the theta (4–7 Hz), alpha
(8–12 Hz), beta (13–30 Hz), and gamma (30–45 Hz) frequency
bands were also computed in each defined ROI. The analysis
period for the potentials time locked to the movement execution
was set from 300 ms before to 300 ms after the EMG trigger (0
time); the ERP time course was divided in two phases relative to
the EMG onset; the first, labeled as bPREQ period, marked the 300
ms before the EMG onset and was intended as a generic
preparation period; the second labeled as bPOSTQ lasted up to
300 ms after the EMG onset and was intended to signal the arrival
of the movement somatosensory feedback. We maintained the
same PRE and POST nomenclature for the signals estimated at the
cortical level.
fMRI data acquisition
All fMRI studies were performed on a 3.0-T scanner (General
Electric Medical Systems, Milwaukee, WI) with BOLD echo
planar imaging (EPI) capability (Advanced NMR Systems Inc.,
Wilmington, MA). Gradient echo EPI, sensitive to the BOLD
effects, was performed using a commercial quadrature birdcage
radio frequency coil.
Subjects’ heads were laid comfortably within the head coil
and firm cushions were used to minimize the head motion. Forty
axial (horizontal) slices with coverage of the whole brain were
acquired. Acquisition parameters used in the functional scans
were TE = 25 ms, TR = 3 s, flip angle = 908; 3 mm slice
thickness with 0 mm gap; 64 � 64 acquisition matrix with a
field of view (FOV) of 20 � 20 cm. The subjects were asked to
perform the fast repetitive finger movement in the following
sequence within one scan session: fixation (30 s), right hand
finger movements (30 s). The sequence was repeated five times
during a single scan session. High-resolution structural images
were also acquired in the axial plane [three-dimensional spoiled
gradient recalled imaging (SPGR)] with 1.9 mm thick contiguous
slices for two subjects; 2 and 1.8 mm thick were used for the
remaining two subjects, respectively.
Head and cortical models
Subjects’ realistic geometry head models reconstructed from
T1-weighted MRIs were employed. The scalp, skull, and dura
mater compartments were segmented from MRIs and triangu-
lated with about 1000 triangles for each surface. The source
model was built with the following procedure: (i) the cortex
compartment was segmented from MRIs and triangulated
obtaining a fine mesh with about 100,000 triangles; (ii) a
coarser mesh was obtained by resampling the fine mesh
previously described to about 5000 triangles. This was done
by preserving the general features of the neocortical envelope,
especially in correspondence of pre- and post-central gyri and
frontal mesial area; (iii) an orthogonal unitary equivalent current
dipole was placed in each node of the triangulated surface, with
direction parallel to the vector sum of the normals to the
surrounding triangles.
Estimation of cortical source current density
The solution of the following linear system
Ax ¼ bþ n ð1Þ
provides an estimation of the dipole source configuration x that
generated the measured EEG potential distribution b. The system
also includes the measurement noise n, supposed normally
distributed.
Also, in Eq. (1), A is the lead field matrix, in which each jth
column describing the potential distribution generated on the scalp
electrodes by the jth unitary dipole. The current density solution
vector x was obtained as (Grave de Peralta Menendez and
Gonzalez Andino, 1999):
x ¼ argminx
jj Ax� bjj2M þ k2jj xjj2N� �
ð2Þ
where M and N are the matrices associated to the metrics of the
data and of the source space, respectively, k is the regularization
parameter, and t x tM represents the M norm of the vector x. The
solution of Eq. (2) is given by the inverse operator G as follows:
x ¼ Gb;G ¼ N�1AVAN�1AV þ kM�1� ��1 ð3Þ
An optimal regularization of this linear system was obtained by the
L-curve approach (Hansen, 1992a,b). As a metric in the data space
we used the identity matrix, while as a norm in the source space we
used the following metric that takes into account the hemodynamic
information offered by the recorded fMRI data
N�1� �
ii¼ g að Þ2jjAdijj�2 ð4Þ
where (N-1)ii is the ith element of the inverse of the diagonal matrix
N and all the other matrix elements Nij are set to 0. The L2 norm of
the ith column of the lead field matrix A is denoted by tA.it. Theg(ai) is a function of the statistically significant percentage
increase of the fMRI signal during the task compared to the rest
state. Such function has values greater than 1 for positive ai, while
takes values lower than 1 for negative ai. In particular, such
function is defined as
g að Þ ¼ max 1þ K � 1ð Þ aimaxifaig
; 1=K
�; K z 1; 8a
�ð5Þ
where the value of the parameter K tunes the strength of the
inclusion of the fMRI constraints in the source space and the
function max(a,b) takes the maximum of the two arguments for
each a. Here, we used the value of K = 10 that resulted from a
previous simulation study, as a value returning optimal
estimation of source current density with fMRI priors for a
large range of SNR values of the gathered EEG signals
(Babiloni et al., 2003).
Regions of interest
Several cortical regions of interest (ROIs) were drawn by two
independent and expert neuroradiologists on the computer-based
cortical reconstruction of the head models obtained for the four
experimental subjects. In particular, the ROIs representing the left
and right primary somatosensory cortex (S1) included the
Brodmann areas (BA) 3, 2, 1, whereas the ROIs representing the
left and right primary motor cortex (MI) included the BA 4. The
ROIs representing the supplementary motor area (SMA) were
F. Babiloni et al. / NeuroImage 24 (2005) 118–131 121
obtained from the cortical voxels belonging to BA 6. We further
separated the proper and anterior SMA indicated with BA 6P and
6A, respectively. Furthermore, ROIs from the right and the left
parietal associative areas, including BA 5 and 7, and the bilateral
occipital area (BA 19), were also considered. In the frontal regions,
BA 46, 8, and 9 were bilaterally selected.
Cortical-estimated waveforms
By using the relations described in Eqs. (1)–(4), at each time
point of the gathered ERP data, an estimate of the signed
magnitude of the dipolar moment for each one of the 5000 cortical
dipoles was obtained. In fact, since the orientation of the dipole
was already defined to be perpendicular to the local cortical surface
of the model, the estimation process returned a scalar rather than a
vector field. In order to obtain the cortical current waveforms for
all the time points of the recorded EEG time series, we used a
unique bquasi-optimalQ regularization k value for all the analyzed
EEG potential distributions. Such quasi-optimal regularization
value was computed as an average of the several k values obtained
by solving the linear inverse problem for a series of EEG potential
distributions. These distributions are characterized by an average
global field power (GFP) with respect to the higher and lower GFP
values obtained during all the recorded waveforms. The instanta-
neous average of the dipole’s signed magnitude belonging to a
particular ROI generates the representative time value of the
cortical activity in that given ROI. By iterating this procedure on
all the time instants of the gathered ERP, the cortical ROI current
density waveforms were obtained, and they could be taken as
representative of the average activity of the ROI during the task
performed by the experimental subjects. These waveforms could
then be subjected to the following processing in order to estimate
the connectivity pattern between ROIs.
Statistical parametric mapping
What is often missing in EEG linear inverse solutions is the
level of reliability of the solution itself. Not all modeled sources
have the same degree of sensitivity to the measurement noise, so
we cannot say whether a source has a high strength because it is the
most probable source of that potential distribution, or just because
that source accounts well for the noise superimposed to the
potential. Even in the ideal case of the absence of noise, some
sources seem more inclined to explain a large set of data, just
because of their geometrical properties (i.e., sources positioned on
a gyrus close to a cortical convexity, rather than deep in a sulcus).
A statistical approach to the problem and a measure of the signal to
noise ratio in the modeled cortical activity are then required. The
level of noise in the EEG linear inverse solutions can be addressed
by estimating the bprojectionQ of the EEG noise n(t) onto the
cortical surface by means of the computed pseudoinverse operator
G; the standard error of the noise on the estimated source strength
x j is given by
hGjdn tð Þi ¼ GjdC Gjd
� �V ð6Þ
where Gj. is the jth row of the pseudoinverse matrix, C is the EEG
noise covariance matrix (Cij = hni(t), nj(t)i). This allows to
quantitatively assess the ratio between the estimated cortical
activity x and the amount of noise at the cortical level, quantified
through the standard deviation of its estimate (Dale et al., 2000). It
can be demonstrated that under the hypothesis of a normal estimate
for the noise n(t) obtained with more than 50 time points, the
following normally distributed z score estimator can be obtained
for each jth cortical location and for each time point t considered
zj tð Þ ¼Gj:d b tð ÞffiffiffiffiffiffiffiffiffiffiffiffiffiffiffiffiffiffiffiffiffiffiffiGjdC Gjd
� �V
q ð7Þ
where C is the estimated noise covariance matrix. The uncorrected
threshold for the z score level at 5% is 1.96. Values of z exceeding
such threshold represent levels of estimated cortical activity that
are unlikely due to the chance alone but are related to the task
performed by the experimental subject. However, to avoid the
effects of the increase of the Type I error due to the multiple z tests
performed, the results will be presented after the application of the
Bonferroni correction (Zar, 1984).
Directed transfer function
The directed transfer function (DTF) technique (Kaminski and
Blinowska, 1991) is a full multivariate spectral measure used to
determine directional influences between any given pair of signals
in a multivariate data set. It is computed on a multivariate
autoregressive model (MVAR) that simultaneously models the
whole set of signals. DTF has been demonstrated (Kaminski et al.,
2001) to be based on the concept of Granger causality, according to
which an observed time series s1(n) can be said to cause another
time series s2(n) if the prediction error for s2(n) at the present time
is reduced by the knowledge of s1(n)’s past measurements. This
kind of relation is not reciprocal, thus allowing to determine the
direction of information flow between the time series.
In this study, the DTF technique was then applied to the set of
cortical estimated waveforms S
S ¼ s1 tð Þ; s2 tð Þ; N ; sN tð Þ½ �T ð8Þ
obtained for the N ROIs considered. The following MVAR process
is an adequate description of the data set S:
Xpk¼0
K kð ÞS t � kð Þ ¼ E tð Þ with K 0ð Þ ¼ 1 ð9Þ
under the condition in which E(t) is a vector of multivariate zero-
mean uncorrelated white noise process. In Eq. (9), K1, K2,. . .,Kp
are the N � N matrices of model coefficients while p is the model
order chosen with the Akaike information criteria (AIC) for MVAR
process (Kaminski et al., 2001). In order to investigate the spectral
properties of the examined process, Eq. (9) is transformed to the
frequency domain:
K fð ÞS fð Þ ¼ E fð Þ ð10Þ
where
K fð Þ ¼Xpk¼0
K kð Þe�j2pf Dtk : ð11Þ
Eq. (10) can be then rewritten as
S fð Þ ¼ K�1 fð ÞE fð Þ ¼ H fð ÞE fð Þ: ð12Þ
H( f) is the transfer matrix of the system, whose element Hij
represents the connection between the jth input and the ith output
of the system. With these definitions, the causal influence of the

F. Babiloni et al. / NeuroImage 24 (2005) 118–131122
cortical waveform estimated in the jth ROI on that estimated in the
ith ROI (the directed transfer function h2ij( f)) is defined as:
h2ij fð Þ ¼ jHij fð Þj2: ð13Þ
In order to be able to compare the results obtained for cortical
waveforms with different power spectra, a normalization was
performed by dividing each estimated DTF by the squared sums of
all elements of the relevant row, thus obtaining the so-called
normalized DTF (Kaminski and Blinowska, 1991):
c2ij fð Þ ¼ jHij fð Þj2
PNm¼1
jHim fð Þj2ð14Þ
cij( f ) expresses the ratio of influence of the cortical waveform
estimated in the jth ROI on the cortical waveform estimated on the
ith ROI with respect to the influence of all the estimated cortical
waveforms. Normalized DTF values are in the interval [0,1] when
the normalization condition
XNn¼1
c2in fð Þ ¼ 1 ð15Þ
is applied.
Statistical evaluation of connectivity measurements
As DTF functions have a highly nonlinear relation to the
time series data from which they are derived, the distribution of
their estimators is not well established. This makes tests of
significance difficult to perform. A possible solution to this
problem was recently proposed in Kaminski et al. (2001). It
consists of the use of a surrogate data technique (Theiler et al.,
1992), in which one generates an empirical distribution for a
given estimator when interactions between signals are removed.
Significance tests based on this empirical distribution can then
be performed. Specifically, one randomly and independently
shuffles the time series data from each ROI to create a
surrogate data set. A bivariate autoregressive model is then fit
to the shuffled data and the DTF functions are computed from
such model. Carrying out this process many times, each time
performed on an independently shuffled data set, it is possible
to construct an empirical distribution for the DTF functions.
Since the shuffling procedure destroys all the temporal structure
in the data, this empirical distribution gives the variability for
the DTF functions for the null hypothesis case. Using this
distribution, one can then assess the significance of the causal
measures evaluated from the actual data. Without having an
explicit formulation for the shape of this distribution, one can
thus compute an empirical threshold for a given significance
level. A limit of this method is due to the fact that it destroys
interdependency among time series as well as the temporal
structure within a time series. In fact, in the above-mentioned
procedure, samples from all the frequencies are combined into a
single distribution, which is independent from frequency and
gives a single threshold for all the DTF values. In order to
randomize the sequential order while preserving the correlation
structure, we adopted a variation of this method. The surrogate
data set was created by shuffling the trials within each series,
without shuffling single samples within a trial. In this way, we
preserved the spectral properties of the time series, thus being
able to obtain a distribution for each frequency value and a
consequently threshold dependent from frequency. The shuffling
procedure was performed for 1000 times and the statistical
significance level was set to 0.01%.
Connectivity inflow–outflow relationships
The connectivity patterns in the different frequency bands
between the different cortical regions were summarized by using
appropriate indexes representing the total flow from and toward the
selected cortical area. In particular, we defined the total inflow in a
particular cortical region as the sum of the statistically significant
connections (with their values) from all the other cortical regions
toward the selected area. The total inflow for each ROI is
represented by a sphere centered on the cortical region, whose
radius is linearly related to the magnitude of all the incoming
statistically significant links from the other regions. Such
information is also coded through a color scale. Such information
depicts the ROI as target of functional connections from the other
ROIs. Same conventions are used to represent the total outflow
from a cortical region toward the others, generated by the sum of
all the statistical significant links obtained by application of the
DTF to the cortical waveforms (with their values).
Results
A selection of the gathered ERPs related to the visually paced
right finger tapping task performed by Subject #1 is shown on the
upper panel of Fig. 1. These waveforms are relative to the signals
gathered from the standard electrode leads of the augmented 10–20
international system that are represented on the realistic geometry
scalp reconstruction of the subject (center of the figure). The
waveforms shown resulted from the average of the artifact-free trials
aligned on the EMG onset. Hemodynamic fMRI data collected from
all the subjects served as a priori information to constrain the
solution of the linear inverse problem, in the way described above
by Eqs. (1)–(5). Using the linear inverse procedure, the estimation
of the current density waveforms for the selected ROIs was then
obtained. In order to define the statistical significance of these
cortical estimated waveforms, the z score transformation was
applied following Eqs. (6) and (7). The estimated z score
waveforms are represented for some selected ROIs in the bottom
panel of Fig. 1 (Subject #1). Note that the z score scale of the
waveforms ranges from 0 (the baseline) to 10; this latter value
corresponding to a level of statistical significance equal to P b 10�7.
The use of a high values of z score is appropriate, since the
uncorrected level for statistical significance of the estimated
waveforms is only equal to 1.96 (P b 5 � 10�2). However, we
used an increased level of statistical significance to discuss the
obtained data (z = 5, P b 10�5) in order to avoid the risks of the
so-called alpha inflation (Abt, 1983). This alpha inflation is
related to the increase of the probability to get significant results
by chance alone, due to the execution of multiple univariate tests.
Cortical activity was significantly different from baseline in the
left ROIs representing parietal (BA 5), premotor (BA 6A),
sensorimotor (BA 3, 2, 1, BA 4), and prefrontal (BA 8 and BA 9)
cortical areas, whereas a similar statistical engage has been
observed on the right hemisphere only for the ROIs correspond-
ing to premotor (BA 6A) and prefrontal (BA 8) cortical areas.
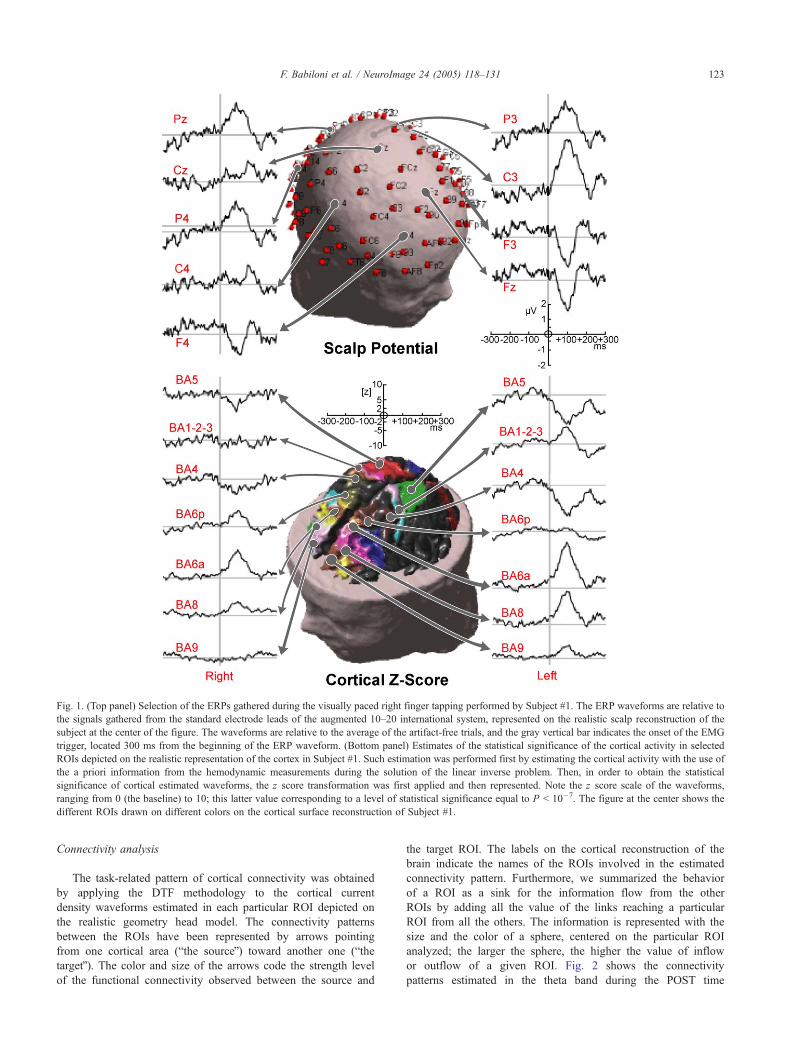
Fig. 1. (Top panel) Selection of the ERPs gathered during the visually paced right finger tapping performed by Subject #1. The ERP waveforms are relative to
the signals gathered from the standard electrode leads of the augmented 10–20 international system, represented on the realistic scalp reconstruction of the
subject at the center of the figure. The waveforms are relative to the average of the artifact-free trials, and the gray vertical bar indicates the onset of the EMG
trigger, located 300 ms from the beginning of the ERP waveform. (Bottom panel) Estimates of the statistical significance of the cortical activity in selected
ROIs depicted on the realistic representation of the cortex in Subject #1. Such estimation was performed first by estimating the cortical activity with the use of
the a priori information from the hemodynamic measurements during the solution of the linear inverse problem. Then, in order to obtain the statistical
significance of cortical estimated waveforms, the z score transformation was first applied and then represented. Note the z score scale of the waveforms,
ranging from 0 (the baseline) to 10; this latter value corresponding to a level of statistical significance equal to P b 10�7. The figure at the center shows the
different ROIs drawn on different colors on the cortical surface reconstruction of Subject #1.
F. Babiloni et al. / NeuroImage 24 (2005) 118–131 123
Connectivity analysis
The task-related pattern of cortical connectivity was obtained
by applying the DTF methodology to the cortical current
density waveforms estimated in each particular ROI depicted on
the realistic geometry head model. The connectivity patterns
between the ROIs have been represented by arrows pointing
from one cortical area (bthe sourceQ) toward another one (bthetargetQ). The color and size of the arrows code the strength level
of the functional connectivity observed between the source and
the target ROI. The labels on the cortical reconstruction of the
brain indicate the names of the ROIs involved in the estimated
connectivity pattern. Furthermore, we summarized the behavior
of a ROI as a sink for the information flow from the other
ROIs by adding all the value of the links reaching a particular
ROI from all the others. The information is represented with the
size and the color of a sphere, centered on the particular ROI
analyzed; the larger the sphere, the higher the value of inflow
or outflow of a given ROI. Fig. 2 shows the connectivity
patterns estimated in the theta band during the POST time
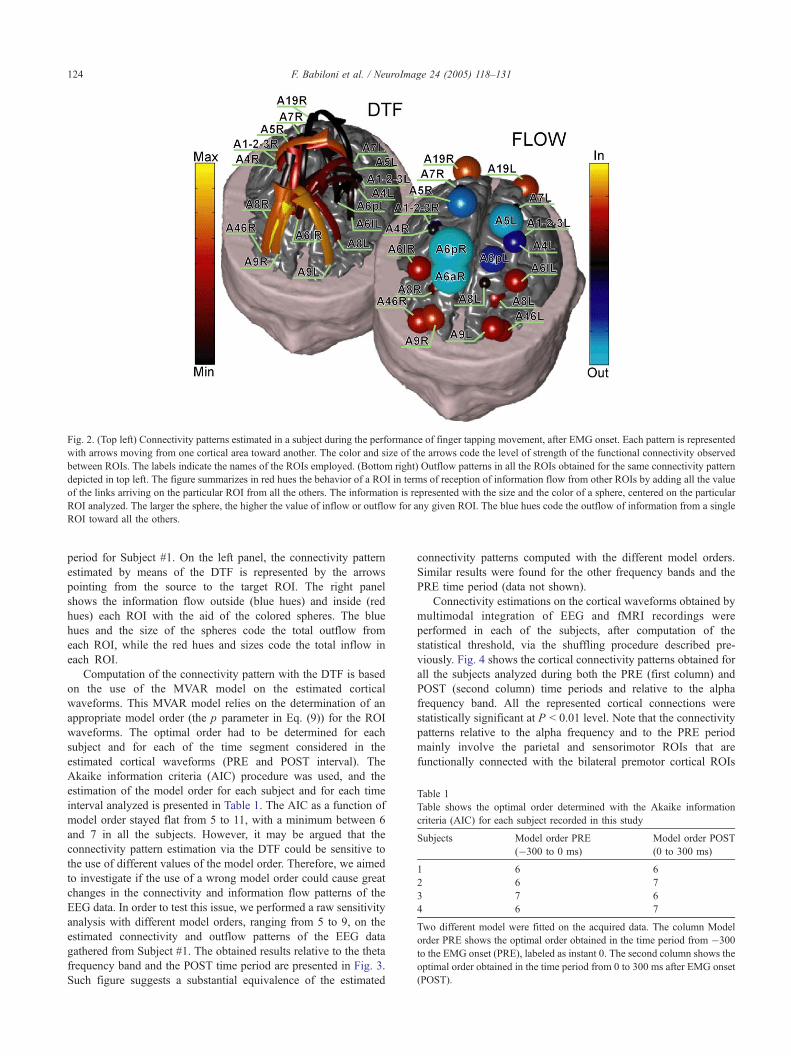
Fig. 2. (Top left) Connectivity patterns estimated in a subject during the performance of finger tapping movement, after EMG onset. Each pattern is represented
with arrows moving from one cortical area toward another. The color and size of the arrows code the level of strength of the functional connectivity observed
between ROIs. The labels indicate the names of the ROIs employed. (Bottom right) Outflow patterns in all the ROIs obtained for the same connectivity pattern
depicted in top left. The figure summarizes in red hues the behavior of a ROI in terms of reception of information flow from other ROIs by adding all the value
of the links arriving on the particular ROI from all the others. The information is represented with the size and the color of a sphere, centered on the particular
ROI analyzed. The larger the sphere, the higher the value of inflow or outflow for any given ROI. The blue hues code the outflow of information from a single
ROI toward all the others.
Table 1
Table shows the optimal order determined with the Akaike information
criteria (AIC) for each subject recorded in this study
Subjects Model order PRE
(�300 to 0 ms)
Model order POST
(0 to 300 ms)
1 6 6
2 6 7
3 7 6
4 6 7
Two different model were fitted on the acquired data. The column Model
order PRE shows the optimal order obtained in the time period from �300
to the EMG onset (PRE), labeled as instant 0. The second column shows the
optimal order obtained in the time period from 0 to 300 ms after EMG onset
(POST).
F. Babiloni et al. / NeuroImage 24 (2005) 118–131124
period for Subject #1. On the left panel, the connectivity pattern
estimated by means of the DTF is represented by the arrows
pointing from the source to the target ROI. The right panel
shows the information flow outside (blue hues) and inside (red
hues) each ROI with the aid of the colored spheres. The blue
hues and the size of the spheres code the total outflow from
each ROI, while the red hues and sizes code the total inflow in
each ROI.
Computation of the connectivity pattern with the DTF is based
on the use of the MVAR model on the estimated cortical
waveforms. This MVAR model relies on the determination of an
appropriate model order (the p parameter in Eq. (9)) for the ROI
waveforms. The optimal order had to be determined for each
subject and for each of the time segment considered in the
estimated cortical waveforms (PRE and POST interval). The
Akaike information criteria (AIC) procedure was used, and the
estimation of the model order for each subject and for each time
interval analyzed is presented in Table 1. The AIC as a function of
model order stayed flat from 5 to 11, with a minimum between 6
and 7 in all the subjects. However, it may be argued that the
connectivity pattern estimation via the DTF could be sensitive to
the use of different values of the model order. Therefore, we aimed
to investigate if the use of a wrong model order could cause great
changes in the connectivity and information flow patterns of the
EEG data. In order to test this issue, we performed a raw sensitivity
analysis with different model orders, ranging from 5 to 9, on the
estimated connectivity and outflow patterns of the EEG data
gathered from Subject #1. The obtained results relative to the theta
frequency band and the POST time period are presented in Fig. 3.
Such figure suggests a substantial equivalence of the estimated
connectivity patterns computed with the different model orders.
Similar results were found for the other frequency bands and the
PRE time period (data not shown).
Connectivity estimations on the cortical waveforms obtained by
multimodal integration of EEG and fMRI recordings were
performed in each of the subjects, after computation of the
statistical threshold, via the shuffling procedure described pre-
viously. Fig. 4 shows the cortical connectivity patterns obtained for
all the subjects analyzed during both the PRE (first column) and
POST (second column) time periods and relative to the alpha
frequency band. All the represented cortical connections were
statistically significant at P b 0.01 level. Note that the connectivity
patterns relative to the alpha frequency and to the PRE period
mainly involve the parietal and sensorimotor ROIs that are
functionally connected with the bilateral premotor cortical ROIs
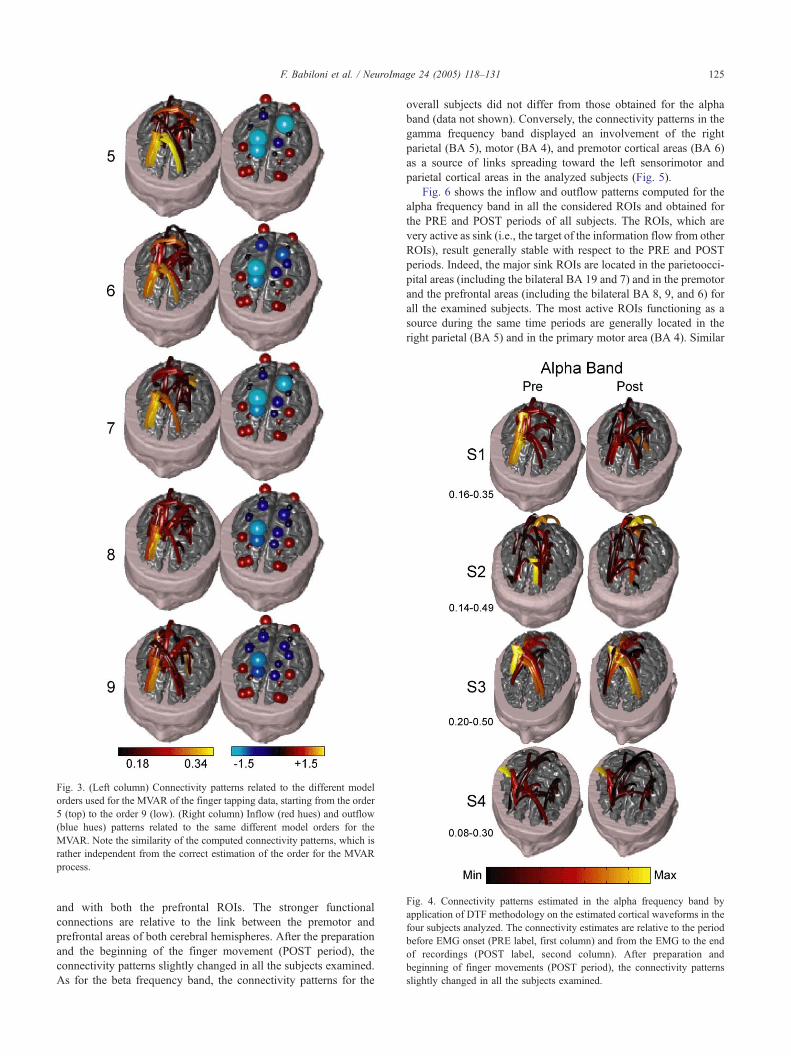
Fig. 3. (Left column) Connectivity patterns related to the different model
orders used for the MVAR of the finger tapping data, starting from the order
5 (top) to the order 9 (low). (Right column) Inflow (red hues) and outflow
(blue hues) patterns related to the same different model orders for the
MVAR. Note the similarity of the computed connectivity patterns, which is
rather independent from the correct estimation of the order for the MVAR
process.
Fig. 4. Connectivity patterns estimated in the alpha frequency band by
application of DTF methodology on the estimated cortical waveforms in the
four subjects analyzed. The connectivity estimates are relative to the period
before EMG onset (PRE label, first column) and from the EMG to the end
of recordings (POST label, second column). After preparation and
beginning of finger movements (POST period), the connectivity patterns
slightly changed in all the subjects examined.
F. Babiloni et al. / NeuroImage 24 (2005) 118–131 125
and with both the prefrontal ROIs. The stronger functional
connections are relative to the link between the premotor and
prefrontal areas of both cerebral hemispheres. After the preparation
and the beginning of the finger movement (POST period), the
connectivity patterns slightly changed in all the subjects examined.
As for the beta frequency band, the connectivity patterns for the
overall subjects did not differ from those obtained for the alpha
band (data not shown). Conversely, the connectivity patterns in the
gamma frequency band displayed an involvement of the right
parietal (BA 5), motor (BA 4), and premotor cortical areas (BA 6)
as a source of links spreading toward the left sensorimotor and
parietal cortical areas in the analyzed subjects (Fig. 5).
Fig. 6 shows the inflow and outflow patterns computed for the
alpha frequency band in all the considered ROIs and obtained for
the PRE and POST periods of all subjects. The ROIs, which are
very active as sink (i.e., the target of the information flow from other
ROIs), result generally stable with respect to the PRE and POST
periods. Indeed, the major sink ROIs are located in the parietoocci-
pital areas (including the bilateral BA 19 and 7) and in the premotor
and the prefrontal areas (including the bilateral BA 8, 9, and 6) for
all the examined subjects. The most active ROIs functioning as a
source during the same time periods are generally located in the
right parietal (BA 5) and in the primary motor area (BA 4). Similar
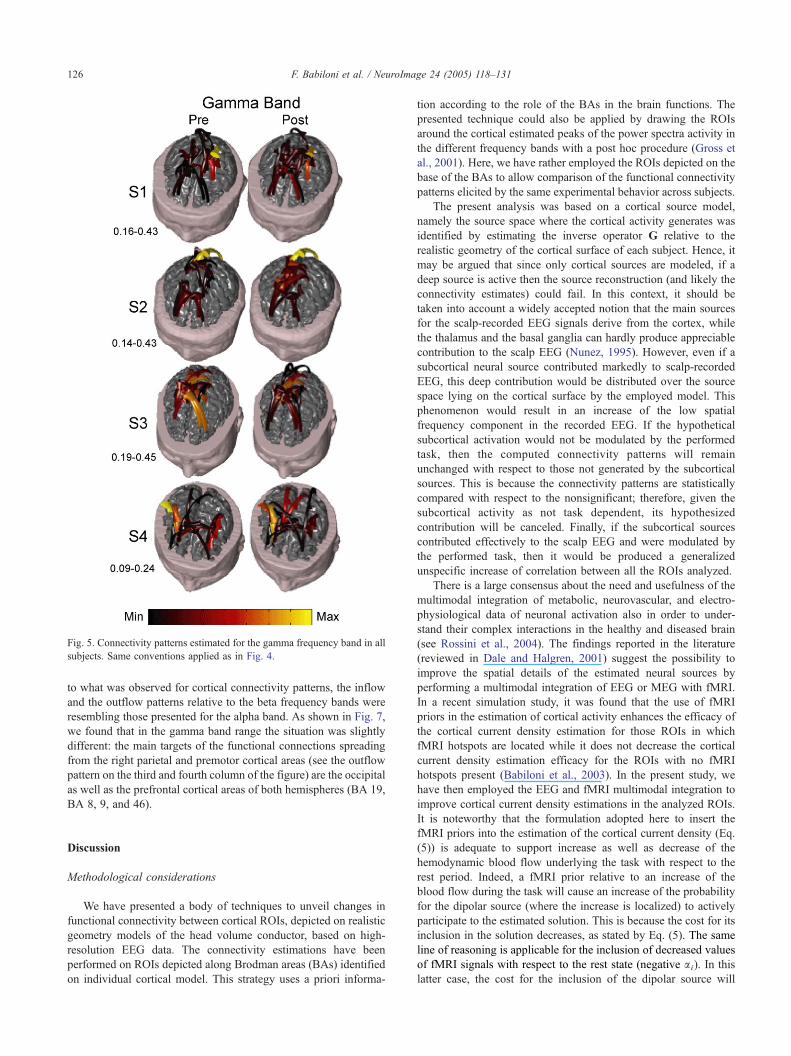
Fig. 5. Connectivity patterns estimated for the gamma frequency band in all
subjects. Same conventions applied as in Fig. 4.
F. Babiloni et al. / NeuroImage 24 (2005) 118–131126
to what was observed for cortical connectivity patterns, the inflow
and the outflow patterns relative to the beta frequency bands were
resembling those presented for the alpha band. As shown in Fig. 7,
we found that in the gamma band range the situation was slightly
different: the main targets of the functional connections spreading
from the right parietal and premotor cortical areas (see the outflow
pattern on the third and fourth column of the figure) are the occipital
as well as the prefrontal cortical areas of both hemispheres (BA 19,
BA 8, 9, and 46).
Discussion
Methodological considerations
We have presented a body of techniques to unveil changes in
functional connectivity between cortical ROIs, depicted on realistic
geometry models of the head volume conductor, based on high-
resolution EEG data. The connectivity estimations have been
performed on ROIs depicted along Brodman areas (BAs) identified
on individual cortical model. This strategy uses a priori informa-
tion according to the role of the BAs in the brain functions. The
presented technique could also be applied by drawing the ROIs
around the cortical estimated peaks of the power spectra activity in
the different frequency bands with a post hoc procedure (Gross et
al., 2001). Here, we have rather employed the ROIs depicted on the
base of the BAs to allow comparison of the functional connectivity
patterns elicited by the same experimental behavior across subjects.
The present analysis was based on a cortical source model,
namely the source space where the cortical activity generates was
identified by estimating the inverse operator G relative to the
realistic geometry of the cortical surface of each subject. Hence, it
may be argued that since only cortical sources are modeled, if a
deep source is active then the source reconstruction (and likely the
connectivity estimates) could fail. In this context, it should be
taken into account a widely accepted notion that the main sources
for the scalp-recorded EEG signals derive from the cortex, while
the thalamus and the basal ganglia can hardly produce appreciable
contribution to the scalp EEG (Nunez, 1995). However, even if a
subcortical neural source contributed markedly to scalp-recorded
EEG, this deep contribution would be distributed over the source
space lying on the cortical surface by the employed model. This
phenomenon would result in an increase of the low spatial
frequency component in the recorded EEG. If the hypothetical
subcortical activation would not be modulated by the performed
task, then the computed connectivity patterns will remain
unchanged with respect to those not generated by the subcortical
sources. This is because the connectivity patterns are statistically
compared with respect to the nonsignificant; therefore, given the
subcortical activity as not task dependent, its hypothesized
contribution will be canceled. Finally, if the subcortical sources
contributed effectively to the scalp EEG and were modulated by
the performed task, then it would be produced a generalized
unspecific increase of correlation between all the ROIs analyzed.
There is a large consensus about the need and usefulness of the
multimodal integration of metabolic, neurovascular, and electro-
physiological data of neuronal activation also in order to under-
stand their complex interactions in the healthy and diseased brain
(see Rossini et al., 2004). The findings reported in the literature
(reviewed in Dale and Halgren, 2001) suggest the possibility to
improve the spatial details of the estimated neural sources by
performing a multimodal integration of EEG or MEG with fMRI.
In a recent simulation study, it was found that the use of fMRI
priors in the estimation of cortical activity enhances the efficacy of
the cortical current density estimation for those ROIs in which
fMRI hotspots are located while it does not decrease the cortical
current density estimation efficacy for the ROIs with no fMRI
hotspots present (Babiloni et al., 2003). In the present study, we
have then employed the EEG and fMRI multimodal integration to
improve cortical current density estimations in the analyzed ROIs.
It is noteworthy that the formulation adopted here to insert the
fMRI priors into the estimation of the cortical current density (Eq.
(5)) is adequate to support increase as well as decrease of the
hemodynamic blood flow underlying the task with respect to the
rest period. Indeed, a fMRI prior relative to an increase of the
blood flow during the task will cause an increase of the probability
for the dipolar source (where the increase is localized) to actively
participate to the estimated solution. This is because the cost for its
inclusion in the solution decreases, as stated by Eq. (5). The same
line of reasoning is applicable for the inclusion of decreased values
of fMRI signals with respect to the rest state (negative ai). In this
latter case, the cost for the inclusion of the dipolar source will
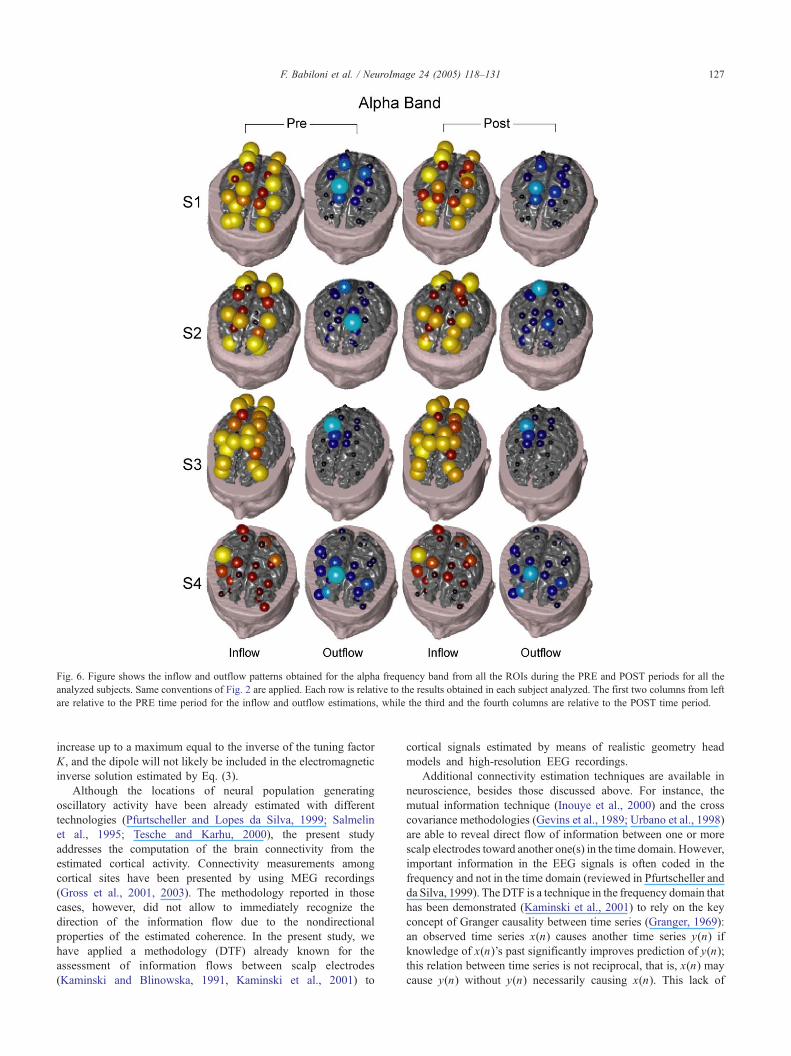
Fig. 6. Figure shows the inflow and outflow patterns obtained for the alpha frequency band from all the ROIs during the PRE and POST periods for all the
analyzed subjects. Same conventions of Fig. 2 are applied. Each row is relative to the results obtained in each subject analyzed. The first two columns from left
are relative to the PRE time period for the inflow and outflow estimations, while the third and the fourth columns are relative to the POST time period.
F. Babiloni et al. / NeuroImage 24 (2005) 118–131 127
increase up to a maximum equal to the inverse of the tuning factor
K, and the dipole will not likely be included in the electromagnetic
inverse solution estimated by Eq. (3).
Although the locations of neural population generating
oscillatory activity have been already estimated with different
technologies (Pfurtscheller and Lopes da Silva, 1999; Salmelin
et al., 1995; Tesche and Karhu, 2000), the present study
addresses the computation of the brain connectivity from the
estimated cortical activity. Connectivity measurements among
cortical sites have been presented by using MEG recordings
(Gross et al., 2001, 2003). The methodology reported in those
cases, however, did not allow to immediately recognize the
direction of the information flow due to the nondirectional
properties of the estimated coherence. In the present study, we
have applied a methodology (DTF) already known for the
assessment of information flows between scalp electrodes
(Kaminski and Blinowska, 1991, Kaminski et al., 2001) to
cortical signals estimated by means of realistic geometry head
models and high-resolution EEG recordings.
Additional connectivity estimation techniques are available in
neuroscience, besides those discussed above. For instance, the
mutual information technique (Inouye et al., 2000) and the cross
covariance methodologies (Gevins et al., 1989; Urbano et al., 1998)
are able to reveal direct flow of information between one or more
scalp electrodes toward another one(s) in the time domain. However,
important information in the EEG signals is often coded in the
frequency and not in the time domain (reviewed in Pfurtscheller and
da Silva, 1999). The DTF is a technique in the frequency domain that
has been demonstrated (Kaminski et al., 2001) to rely on the key
concept of Granger causality between time series (Granger, 1969):
an observed time series x(n) causes another time series y(n) if
knowledge of x(n)’s past significantly improves prediction of y(n);
this relation between time series is not reciprocal, that is, x(n) may
cause y(n) without y(n) necessarily causing x(n). This lack of
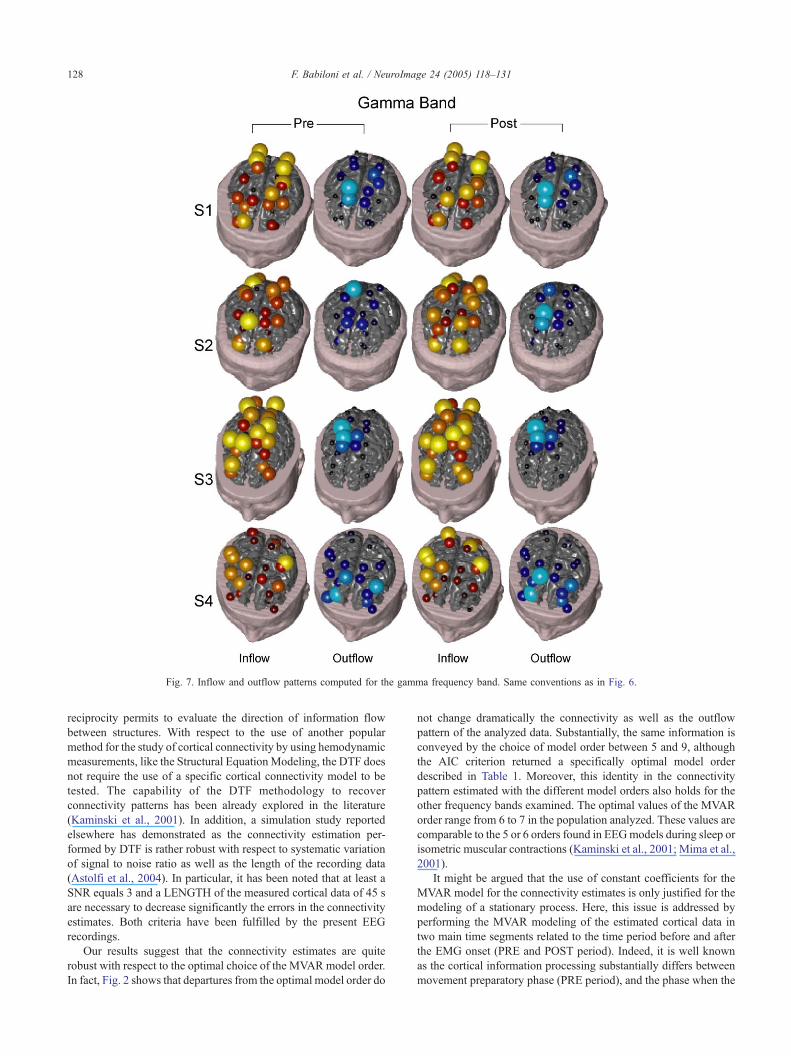
Fig. 7. Inflow and outflow patterns computed for the gamma frequency band. Same conventions as in Fig. 6.
F. Babiloni et al. / NeuroImage 24 (2005) 118–131128
reciprocity permits to evaluate the direction of information flow
between structures. With respect to the use of another popular
method for the study of cortical connectivity by using hemodynamic
measurements, like the Structural EquationModeling, the DTF does
not require the use of a specific cortical connectivity model to be
tested. The capability of the DTF methodology to recover
connectivity patterns has been already explored in the literature
(Kaminski et al., 2001). In addition, a simulation study reported
elsewhere has demonstrated as the connectivity estimation per-
formed by DTF is rather robust with respect to systematic variation
of signal to noise ratio as well as the length of the recording data
(Astolfi et al., 2004). In particular, it has been noted that at least a
SNR equals 3 and a LENGTH of the measured cortical data of 45 s
are necessary to decrease significantly the errors in the connectivity
estimates. Both criteria have been fulfilled by the present EEG
recordings.
Our results suggest that the connectivity estimates are quite
robust with respect to the optimal choice of the MVARmodel order.
In fact, Fig. 2 shows that departures from the optimal model order do
not change dramatically the connectivity as well as the outflow
pattern of the analyzed data. Substantially, the same information is
conveyed by the choice of model order between 5 and 9, although
the AIC criterion returned a specifically optimal model order
described in Table 1. Moreover, this identity in the connectivity
pattern estimated with the different model orders also holds for the
other frequency bands examined. The optimal values of the MVAR
order range from 6 to 7 in the population analyzed. These values are
comparable to the 5 or 6 orders found in EEGmodels during sleep or
isometric muscular contractions (Kaminski et al., 2001; Mima et al.,
2001).
It might be argued that the use of constant coefficients for the
MVAR model for the connectivity estimates is only justified for the
modeling of a stationary process. Here, this issue is addressed by
performing the MVAR modeling of the estimated cortical data in
two main time segments related to the time period before and after
the EMG onset (PRE and POST period). Indeed, it is well known
as the cortical information processing substantially differs between
movement preparatory phase (PRE period), and the phase when the
F. Babiloni et al. / NeuroImage 24 (2005) 118–131 129
somatic feedback from the finger joints is received by the cortex, in
the POST period. This difference in the logical information
processed by the brain during movement preparation and execution
could be reflected by possible variations of the statistical properties
of the estimated cortical waveforms. These variations could be
viewed as a nonstationarity of the cortical waveforms along the
entire time course of the acquired data. We have explicitly tackled
this issue by modeling and analyzing separately the data acquired
before and after the EMG onset (the PRE and POST time period).
We observed minimal changes of the connectivity patterns during
the PRE and POST period, as well as a substantial coincidence of
the estimated model order was observed for all the subjects in the
two time periods, as shown in Table 1.
Application to the real EEG/fMRI data
The described technique has been applied to the ERP data
gathered during visually guided finger tapping movements. The
main findings obtained with the multimodal integration of ERP and
fMRI data are related to the activation of a network involving the
right frontoparietal cortical structures. The flow of the connections
moves from the parietal and premotor areas toward the right and left
prefrontal areas. These results have also been corroborated by the
inflow–outflow analysis, indicating how the ROIs located at the
parietal (BA 5) and premotor areas (BA 6) could be the source of an
activity that spreads and reaches virtually all the other ROIs
considered, from the occipital (BA 19) to the prefrontal (BA 9,
46) areas of both hemispheres. No remarkable variations of the
inflow–outflow characteristics are noted in both PRE and POST
time periods; rather, the same connectivity patterns underlying these
two time phases increase or decrease just the strength of the
connections.
Beside the highlight on the technology potential, the physio-
logical features of the reported findings are consistent with and
further integrate those already known in the literature on finger
tapping movements, expressed by both neuroelectric and hemody-
namic measurements. In a previous fMRI study, it has been found
that the right-sided dorsal premotor cortex was preferentially
activated during finger tapping movements together with the
bilateral visual cortex, where the visual pacing stimulus was
processed (J7ncke et al., 2000). In addition, the same study described
a significant activation of the ventral premotor cortex in conjunction
with the parietal cortices. These findings yielded to the hypothesis
that the bilateral visual activation could trigger the timing of finger
movements by transferring the sensory pacing codes via the left and
right ddorsalT pathways to the prefrontal cortex, where stimulus
response are matched. Of special interest is our observation of the
involvement of the occipital area (BA 19) that received information
from the ROIs more directly involved in the motor task processing,
namely those depicting the premotor and parietal areas. A network
including the primary sensorimotor as well as the supplementary
motor areas is involved in the execution of visually triggered finger
tapping movements, as previously demonstrated by fMRI and PET
technologies (Salmelin et al., 1995; Volkmann et al., 1996). These
latter studies also underlined the role of cerebellum, a role which was
not possible to investigate with our noninvasive electrophysiological
techniques, due to the large generation of closed potential fields by
the cerebellum’s stellate cells that are not detectable by the scalp
electrodes. Gerloff et al. (1998) have further underlined the role of
the primary sensorimotor and supplementary motor areas in the
processing of movement execution based on ERP measurements
from scalp electrodes and the assessment of connectivity with the
nondirectional coherence methods.
The connectivity patterns of the premotor and prefrontal ROIs
reported here are in agreement with earlier electromagnetic findings,
suggesting that the dorsolateral and the ventral premotor cortices are
the specific candidate for movement execution guided by sensory
information as opposed to movements carried out with no sensory
control (Classen et al., 1998; Rothwell et al., 1991; Sekihara and
Scholz, 1996). Finally, the present activity noted in the parietal area
(BA 5) could reflect the role that such area has in the somatosensory-
motor integration formotor actions. Indeed, it has been hypothesized
that such area could be regarded as a higher-order somatosensory
zone devoted to the analysis of proprioceptive information from
joints for the appropriate motor control (Rizzolatti et al., 1998).
In conclusion, we have presented here an integrated approach to
estimate brain cortical connectivity information by using non-
invasive methodologies involving the multimodal integration of
electrophysiological and hemodynamic measurements. These meth-
odologies enable us to detect the level of statistical significance of
the estimated cortical activations in the selected ROIs and to follow
the time-varying pattern of connectivity eventually developing
during simple motor tasks in humans. This body of methodologies
can be suitable for the analysis of simple as well as complex
movements or cognitive tasks in humans.
Acknowledgments
This work was partially supported by grant NSF BES-0218736
and by a grant from the IRIB Program.
References
Abt, K., 1983. Significance testing of many variables. Problems and
solutions. Neuropsychobiology 9 (1), 47–51.
Astolfi, L., Babiloni, F., Babiloni, C., Carducci, F., Cincotti, F., Basilisco,
A., Rossini, P.M., Salinari, S.,. Ding, L., Ni, Y., He, B., 2004. Assessing
time-varying cortical connectivity by high resolution EEG and directed
transfer function: simulations and application to finger tapping data.
26th IEEE-EMBS International Conference, San Francisco, pp. 1–4
(September).
Babiloni, F., Babiloni, C., Carducci, F., Fattorini, L., Anello, C., Onorati,
P., Urbano, A., 1997. High resolution EEG: a new model-dependent
spatial deblurring method using a realistically shaped MR-constructed
subject’s head model. Electroencephalogr. Clin. Neurophysiol. 102 (2),
69–80.
Babiloni, F., Babiloni, C., Locche, L., Cincotti, F., Rossini, P.M., Carducci,
F., 2000. High-resolution electroencephalogram: source estimates of
Laplacian-transformed somatosensory-evoked potentials using a real-
istic subject head model constructed from magnetic resonance images.
Med. Biol. Eng. Comput. 38 (5), 512–519.
Babiloni, F., Babiloni, C., Carducci, F., Romani, G.L., Rossini, P.M.,
Angelone, L.M., Cincotti, F., 2003. Multimodal integration of high-
resolution EEG and functional magnetic resonance imaging data: a
simulation study. NeuroImage 19 (1), 1–15.
Brovelli, P., Battaglini, J., Naranjo, R., 2002. Medium-range oscillatory
network and the 20-hz sensorimotor induced potential. NeuroImage 16
(1), 130–141.
Buchel, C., Friston, K.J., 1997. Modulation of connectivity in visual
pathways by attention: cortical interactions evaluated with structural
equation modelling and fMRI. Cereb. Cortex 7 (8), 768–778.
Classen, J., Gerloff, C., Honda, M., Hallett, M., 1998. Integrative visuomotor
F. Babiloni et al. / NeuroImage 24 (2005) 118–131130
behavior is associated with interregionally coherent oscillations in the
human brain. J. Neurophysiol. 3, 1567–1573.
Dale, A.M., Sereno, M., 1993. Improved localization of cortical activity by
combining EEG and MEG with MRI cortical surface reconstruction: a
linear approach. J. Cogn. Neurosci. 5, 162–176.
Dale, A.M., Halgren, E., 2001. Spatiotemporal mapping of brain activity by
integration of multiple imaging modalities. Curr. Opin. Neurobiol. 11
(2), 202–208.
Dale, A., Liu, A., Fischl, B., Buckner, R., Belliveau, J.W., Lewine, J.,
Halgren, E., 2000. Dynamic statistical parametric mapping: combining
fMRI and MEG for high-resolution imaging of cortical activity. Neuron.
26, 55–67.
David, O., Cosmelli, D., Friston, K.J., 2004. Evaluation of different measures
of functional connectivity using a neural mass model. NeuroImage 21,
659–673.
Gerloff, Richard, C.J., Hadley, J., Schulman, A. E., Honda, M., Hallett, M.,
1998. Functional coupling and regional activation of human cortical
motor areas during simple, internally paced and externally paced finger
movements. Brain 121, 1513–1531.
Gevins, A., 1989. Dynamic functional topography of cognitive task. Brain
Topogr. 2, 37–56.
Gevins, A.S., Cutillo, B.A., Bressler, S.L., Morgan, N.H., White, R.M.,
Illes, J., Greer, D.S., 1989. Event-related covariances during a bimanual
visuomotor task II. Preparation and feedback. Electroencephalogr. Clin.
Neurophysiol. 74, 147–160.
Gevins, A., Brickett, P., Reutter, B., Desmond, J., 1991. Seeing through the
skull: advanced EEGs use MRIs to accurately measure cortical activity
from the scalp. Brain Topogr. 4, 125–131.
Gevins, A., Le, J., Leong, H., McEvoy, L.K., Smith, M.E., 1999.
Deblurring. J. Clin. Neurophysiol. 16 (3), 204–213.
Granger, C.W.J., 1969. Investigating causal relations by econometric models
and cross-spectral methods. Econometrica 37, 424–428.
Grave de Peralta Menendez, R., Gonzalez Andino, S.L, 1999. Distributed
source models: standard solutions and new developments. In: Uhl, C.
(Ed.), Analysis of Neurophysiological Brain Functioning. Springer,
pp. 176–201.
Grinvald, A., Lieke, E., Frostig, R.D., Gilbert, C.D., Wiesel, T.N., 1986.
Functional architecture of cortex revealed by optical imaging of
intrinsic signals. Nature 324 (6095), 361–364.
Gross, Kujala, J., H7m7l7inen, M., Timmermann, L., Schnitzler, A.,
Salmelin, R., 2001. Dynamic imaging of coherent sources: studying
neural interactions in the human brain. Proc. Natl. Acad. Sci. U. S. A.
98 (2), 694–699.
Gross, J., Timmermann, L., Kujala, J., Salmelin, R., Schnitzler, A., 2003.
Properties of MEG tomographic maps obtained with spatial filtering.
NeuroImage 19 (4), 1329–1336.
H7m7l7inen, M., Ilmoniemi, R., 1984. Interpreting Measured Magnetic
Field of the Brain: Estimates of the Current Distributions. Technical
Report TKK-F-A559, Helsinki University of Technology.
Hansen, P.C., 1992a. Analysis of discrete ill-posed problems by means of
the L-curve. SIAM Rev. 34, 561–580.
Hansen, P.C., 1992b. Numerical tools for the analysis and solution of
Fredholm integral equations of the first kind. Inverse Probl. 8, 849–872.
He, B., Lian, J., 2002. Spatio-temporal functional neuroimaging of brain
electric activity. Crit. Rev. Biomed. Eng. 30, 283–306.
He, B., Zhang, Z., Lian, J., Sasaki, H., Wu, S., Towle, V.L., 2002. Boundary
element method based cortical potential imaging of somatosensory
evoked potentials using subjects’ magnetic resonance images. Neuro-
Image 16, 564–576.
Horwitz, B., 2003. The elusive concept of brain connectivity. NeuroImage
19, 466–470.
Inouye, T., Iyama, A., Shinosaki, K., Toi, S., Matsumoto, Y., 1995. Inter-
site EEG relationships before widespread epileptiform discharges. Int. J.
Neurosci. 82, 143–153.
J7ncke, R., Loose, K., Luta, K., Specht, N., Shah, J., 2000. Cortical
activations during paced finger-tapping applying visual and auditory
pacing stimuli. Cogn. Brain Res. 10 (1–2), 51–66.
Kaminski, Blinowska, K.J., 1991. A new method of the description
of the information flow in the brain structures. Biol. Cybern. 65,
203–210.
Kaminski, M., Ding, M., Truccolo, W.A., Bressler, S., 2001. Evaluating
causal relations in neural systems: granger causality, directed transfer
function and statistical assessment of significance. Biol. Cybern. 85,
145–157.
Lee, L., Harrison, L.M., Mechelli, A., 2003. The functional brain
connectivity workshop: report and commentary. NeuroImage 19,
457–465.
Liu, A.K., 2000. Spatiotemporal Brain Imaging, PhD dissertation.
Massachusetts Institute of Technology, Cambridge, MA.
Liu, A.K., Belliveau, J.W., Dale, A.M., 1998. Spatiotemporal imaging of
human brain activity using functional MRI constrained magnetoence-
phalography data: Monte Carlo simulations. Proc. Natl. Acad. Sci. 95
(15), 8945–8950.
Logothetis, N.K., Pauls, J., Augath, M., Trinath, T., Oeltermann, A., 2001.
Neurophysiological investigation of the basis of the fMRI signal.
Nature 412 (6843), 150–157.
Magistretti, P.J., Pellerin, L., Rothman, D.L., Shulman, R.G., 1999. Energy
on demand. Science 283 (5401), 496–497.
McIntosh, A.R., Gonzalez-Lima, F., 1994. Structural equation modelling
and its application to network analysis in functional brain imaging.
Brain Mapp. 2, 2–22.
Mima, T., Matsuoka, T., Hallett, M., 2001. Information flow from the
sensorimotor cortex to muscle in humans. Clin. Neurophysiol. 112 (1),
122–126.
Moretti, D.V., Babiloni, F., Carducci, F., Cincotti, F., Remondini, E.,
Rossini, PM, Salinari, S., Babiloni, C., 2003. Computerized process-
ing of EEG-EOG-EMG artifacts for multi-centric studies in EEG
oscillations and event-related potentials. Int. J. Psychophysiol. 47 (3),
199–216.
Nunez, P., 1981. Electric Fields of the Brain. Oxford Univ. Press, New York.
Nunez, P.L., 1995. Neocortical Dynamics and Human EEG Rhythms.
Oxford Univ. Press, New York.
Pascual-Marqui, R.D., 1995. Reply to comments by Hamalainen, IlmoQ
niemi and Nunez. Skrandies, W. ISBET Newsl., vol. 6., pp. 16–28.
December.
Pfurtscheller, G., Lopes da Silva, F.H., 1999. Event-related EEG/MEG
synchronization and desynchronization: basic principles. Clin. Neuro-
physiol. 110 (11), 1842–1857.
Puce, A., Allison, T., Spencer, S.S., Spencer, D.D., McCarthy, G., 1997.
Comparison of cortical activation evoked by faces measured by
intracranial field potentials and functional MRI: two case studies.
Hum. Brain Mapp. 5 (4), 298–305.
Rizzolatti, G., Luppino, G., Matelli, M., 1998. The organization of the
cortical motor system: new concepts. Electroencephalogr. Clin. Neuro-
physiol. 106, 283–296.
Rossini, P.M., Altamura, C., Feretti, A., Vernieri, F., Zappasodi, F., Caulo,
M., Pizzella, V., Del Gratta, C., Romani, G.-L., Tecchio, F., 2004. Does
cerebrovascular disease affect the coupling between neuronal activity
and local haemodynamics? Brain 127, 99–110 (Jan).
Rothwell, J., Thompson, P., Day, B., Boyd, S., Marsden, C., 1991.
Stimulation of the human motor cortex through the scalp. Exp. Physiol.
76, 159–200.
Salmelin, R., H7m7l7inen, M., Kajola, M., Hari, R., 1995. Functional
segregation of movement-related rhythmic activity in the human brain.
NeuroImage 2, 237–243.
Schlosser, R., Gesierich, T., Kaufmann, B., Vucurevic, G., Hunsche, S.,
Gawehn, J., Stoeter, P., 2003. Altered effective connectivity during
working memory performance in schizophrenia: a study with fMRI and
structural equation modeling. NeuroImage 19 (3), 751–763.
Sekihara, K., Scholz, B., 1996. Generalized Wiener estimation of three-
dimensional current distribution from biomagnetic measurements. IEEE
Trans. Biomed. Eng. 43 (3), 281–291.
Taniguchi, M., Kato, A., Fujita, N., Hirata, M., Tanaka, H., Kihara, T.,
Ninomiya, H., Hirabuki, N., Nakamura, H., Robinson, S.E., Cheyne,

F. Babiloni et al. / NeuroImage 24 (2005) 118–131 131
D., Yoshimine, T., 2000. Movement-related desynchronization of the
cerebral cortex studied with spatially filtered magnetoencephalography.
NeuroImage 12 (3), 298–306.
Tesche, C., Karhu, J., 2000. Theta oscillations index human hippocampal
activation during aworkingmemory task. Proc. Natl. Acad. Sci. U. S. A.
97, 919–924.
Theiler, J., Eubank, S., Longtin, A., Galdrikian, B., Farmer, J.D., 1992.
Testing for nonlinearity in time series: the method of surrogate data.
Physica D 58, 77–94.
Urbano, A., Babiloni, C., Onorati, P., Babiloni, F., 1998. Dynamic
functional coupling of high resolution EEG potentials related to
unilateral internally triggered one-digit movements. Electroencephalogr.
Clin. Neurophysiol. 106 (6), 477–487.
Volkmann, J., Joliot, M., Mogilner, A., Ioannides, A., Lado, F., Fazzini, E.,
Ribary, U., Llinas, R., 1996. Central motor loop oscillations in
parkinsonian resting tremor revealed by magnetoencephalography.
Neurology 46, 1359–1370.
Zar, J., 1984. Biostatistical Analysis. Prentice-Hall.
Top Related
Copyright © 2022 FDOKUMEN

