


Bahasa
Halaman
Hukum


THÈSE DE DOCTORAT DE L’UNIVERSITÉ PIERRE ET MARIE CURIE
Spécialité Épidémiologie
École Doctorale Pierre Louis de Santé Publique à Paris :
Épidémiologie et Sciences de l’Information Biomédicale
Présentée par
Juliette PAIREAU
ÉPIDÉMIOLOGIE SPATIALE DE LA
MÉNINGITE À MÉNINGOCOQUE AU NIGER
Influence des facteurs climatiques, épidémiologiques et socio-démographiques
sur la dynamique spatio-temporelle des épidémies
Thèse dirigée par le Pr. Arnaud Fontanet
Préparée au sein de l’Unité d’Épidémiologie des Maladies Émergentes, Institut Pasteur, Paris
Soutenue publiquement le 16 juillet 2014 devant le jury composé de :
Pr. Arnaud FONTANET, Institut Pasteur, Paris Directeur de thèse
Pr. Philippe DE WALS, Université de Laval, Québec Rapporteur
Dr. Cécile VIBOUD, Fogarty International Center, Bethesda Rapporteur
Pr. Pierre-Yves BOËLLE, Institut Pierre Louis d’Épidémiologie et de Santé Publique, Paris Examinateur
Dr. Hélène BROUTIN, CNRS/IRD/Université de Montpellier Examinateur
Dr. Isabelle PARENT DU CHÂTELET, Institut de Veille Sanitaire, Paris Examinateur

i

À Françoise
ii

iii

Remerciements
Je tiens à remercier sincèrement tous ceux qui, d’une manière ou d’une autre, ont
contribué à faire de cette thèse une expérience unique.
Merci à Arnaud Fontanet d’avoir été au commencement de tout : de l'entrée dans le
monde de la santé publique d'abord, avec ce coup de fil décisif au Mexique alors que je
faisais encore l'apprentie chimiste, du stage au Niger ensuite, et de la thèse enfin, après
m’avoir fait boire pour que je dise oui... ;-) Merci pour ton soutien inconditionnel et ton
immense confiance, que ce soit pour la thèse, les projets aux quatre coins du monde, ou
encore ton premier MOOC. La suite reste à écrire…
Merci à tous les membres du jury : à Cécile Viboud et Philippe De Wals de m’avoir
fait l’honneur d’accepter d'être rapporteurs, et à Hélène Broutin, Isabelle Parent du
Châtelet et Pierre-Yves Boëlle de m’avoir fait l’honneur d’accepter d'être examinateurs.
Merci aux différents organismes qui ont permis de financer ces recherches :
l'Université Pierre et Marie Curie, la Fondation Pierre Ledoux Jeunesse Internationale, la
Direction de la Coopération Internationale de la Principauté de Monaco, l'Institut Pasteur
et l'École Doctorale Pierre Louis de Santé Publique pour l’attribution d’un contrat doctoral.
Merci à Judith Mueller pour ses conseils toujours éclairants, ses questionnements
toujours bienveillants et nos échanges toujours passionnants. J’espère que nous aurons
d’autres occasions de travailler ensemble.
Merci à tous mes collègues du CERMES de m'avoir accueillie en stage puis de
m'avoir permis de continuer la collaboration à travers cette thèse, en particulier : Jean-
François Jusot, Florian Girond, Halima Boubacar Maïnassara, Issa Idi, Jean-Marc Collard,
Jean-Paul Moulia-Pelat et Odile Ouwe Missi Oukem. Une pensée également à tous ceux, au
Niger, à qui j'ai dit « à bientôt » en pensant revenir et que la situation sécuritaire ne m’a pas
permis de revoir. On est ensemble.
Merci à tous les membres de l'Unité d'Épidémiologie des Maladies Émergentes, les
« anciens » comme les « nouveaux », d’avoir fait de mon passage à l’Institut Pasteur quatre
années inoubliables. Ce fut un réel plaisir de travailler parmi vous. Cette montée des
marches va finalement bien me manquer ! Merci à Sylvana pour son sourire à toute
épreuve, à Catherine pour ses petites attentions, à Tamara, parce qu’elle fut une collègue de
bureau idéale, à Charlotte pour nos fous rires incontrôlables, à Jordi, mon compagnon de
galère, et à Loïc, je te souhaite beaucoup de bonheur pour la suite, que ce soit dans la boue
iv

ou les bouchons lyonnais... Merci à mes relectrices de choc, Laura et Clotilde. Les filles,
vous assurez !! Mes remerciements vont bien au-delà des points virgules et des
conjonctions de coordination. Clo, merci pour ton esprit d’initiative (pour l’organisation de
déjeuners filles, d’apéros-quizz, de week-ends au soleil…), tes conseils en tous genres, tes
deadlines, en un mot ton amitié. Laura, quelle belle rencontre, j’espère qu’on ne se perdra
pas de vue (et je ne dis pas ça uniquement pour ta jolie plume teintée de lyrisme !).
Merci à Estelle d’avoir été une première stagiaire exemplaire.
Merci à la communauté méningite de MAMEMA et de MERIT. Ce fut très
enrichissant d’échanger avec vous tous. Special thanks to Lydiane (je m’entraîne pour notre
prochain raid !), Adrien, Tom, Michelle and Oumy for the great time spent with you in
conferences/hotels/bars/buses/tro-tros/markets/beaches/rainforests in Ethiopia and
Ghana… it was veryyy goodyyyy!
Merci à tous ceux qui m'ont chaleureusement accueillie lors de mes missions de
terrain « annexes » et m'ont fait découvrir un petit bout de leur pays, d’origine ou
d’adoption : Tuan, Loan, Nghia et Nga au Vietnam, Johanna, Marilena et Vera au Cap-
Vert, ainsi que Paul Reiter pour m'avoir emmenée traquer les moustiques (merci aussi au
volcan islandais, dont je n’essaierai pas d’écrire le nom, d’être entré en éruption au moment
opportun !).
Merci à Meriadeg de m'avoir fait découvrir la chasse aux chauves-souris au cœur
des plantations de litchis… quelle aventure ! Merci pour nos déjeuners shakespeariens à la
cantine de Pasteur.
Merci à Patrick et aux guitaristes en herbe pour la pause musicale du vendredi midi,
un peu d’émotion et de légèreté dans mon monde de statistiques et d’algorithmes…
Merci aux handballeuses et handballeurs d'IPH pour les bons moments, nécessaires
et libérateurs, de défoulement sur le terrain, dans les tribunes ou dans les mini-bus...
Merci à la promo alpha de pastacam, cette année avec vous était tout simplement
exceptionnelle ! Merci à Myriam de m’avoir montré la voie ;) Merci à Margaux, parce que tu
es géniale et que tu ne le sais pas, et que nos apéros du vendredi m’ont terriblement
manqué après ton exil !!
Merci à Éloïse d’avoir vu "mes yeux qui pétillent" à un tournant décisif de mes
études et de me l'avoir dit.
Merci à tous mes amis CPéens, parisiens, lyonnais, expatriés plus ou moins
lointains… S’il fallait que je passe par la synthèse de la N-benzyl-3-(1-
v

hydroxyéthyl)azetidin-2-one via la réaction de Baylis-Hillman pour vous rencontrer, alors je
ne regrette rien !
Merci à mes Filles Épicées, les Super Dark Girls, Géraldine, Jessica, Eugénie et
Ondine !! « Friendship never ends » (je me devais de citer ce texte fondateur)… ça va faire déjà
9 ans qu’on se connaît ! GG, dès le premier jour où j’ai vu ta houppette, j’ai su que tu serais
importante dans ma vie. Je ne m’étais pas trompée :) Merci d’être toujours là.
Merci enfin à ma famille. Merci à mes parents pour leur amour et leurs
encouragements de chaque instant. Merci de m’avoir laissée libre de mes choix, tout en me
permettant de faire ce que j’aimais dans les meilleures conditions. Tout cela n’aurait pas été
possible sans vous et sans votre soutien. Oui, ça y est, j'ai enfin fini mes études ! Merci à ma
sœur Cécile, que j’admire… pointure 41 !! Merci à mes grands-parents qui, tous, m’ont
montré un jour qu’ils étaient fiers de moi.
vi

Résumé
La méningite à méningocoque représente un problème de santé publique majeur en
Afrique, et en particulier au Niger, où des épidémies récurrentes surviennent pendant la
saison sèche. L’objectif de la thèse est de contribuer à une meilleure compréhension de la
dynamique spatio-temporelle de ces épidémies et des facteurs qui régissent leur émergence
et leur diffusion à une échelle spatiale fine, afin d’améliorer les stratégies de prévention et
de contrôle. Des méthodes statistiques d’épidémiologie spatiale sont appliquées aux
données de surveillance des méningites à méningocoque au Niger entre 2003 et 2010 dans
le but de décrire, expliquer, puis prédire les épidémies, à l’échelle des aires de santé.
Dans un premier article, les agrégats spatio-temporels de cas sont détectés par des
méthodes d’autocorrélation spatiale et de scan spatial. D’importantes caractéristiques de la
distribution spatio-temporelle sont ainsi mises en évidence, telles que la faible étendue des
agrégats, l’hétérogénéité spatiale et la variabilité inter-annuelle des zones touchées et des
schémas de diffusion. L’analyse suggère également que l’échelle des aires de santé pourrait
être plus efficace pour la réponse aux épidémies.
Dans un deuxième article, un modèle explicatif hiérarchique bayésien est développé
afin d’étudier l’influence de facteurs environnementaux, épidémiologiques et socio-
démographiques sur l’incidence annuelle du méningocoque A à l’échelle des aires de santé.
Le modèle suggère que la variabilité spatio-temporelle de l’incidence résulte de variations
dans l’intensité et la durée des effets de la saison sèche sur le risque de maladie, et est de
plus impactée par des facteurs de contacts spatiaux représentant une transmission du
pathogène favorisée.
Le troisième volet de la thèse concerne l’élaboration d’un système d’alerte précoce
pour améliorer la détection des épidémies et les stratégies vaccinales réactives. Un modèle
prédictif est développé en s’appuyant sur les conditions climatiques, les interactions de
voisinage et la précocité des cas, afin d’estimer la probabilité qu’une épidémie localisée
survienne au cours de la saison sèche dans une aire de santé ayant dépassé un seuil d’alerte.
Nos résultats offrent un nouvel éclairage sur la dynamique spatio-temporelle et les
facteurs de risque des épidémies de méningite à méningocoque au Niger à une échelle
spatiale fine. Ils permettent de formuler des recommandations en santé publique qui
pourraient contribuer à l’élaboration de stratégies efficaces de contrôle et de prévention des
épidémies.
vii

Abstract
Meningococcal meningitis is a major public health problem in Africa, and in
particular in Niger, where recurrent epidemics occur during the dry season. The objective
of the thesis is to contribute to a better understanding of the spatio-temporal dynamics of
these epidemics and the factors driving their emergence and spread at a fine spatial scale, in
order to improve prevention and control strategies. Statistical methods of spatial
epidemiology are applied to surveillance data of meningococcal meningitis in Niger
between 2003 and 2010 in order to describe, explain, and finally predict the epidemics, at
the scale of health centre catchment areas (HCCAs).
In a first article, spatio-temporal clusters of cases are detected by methods of spatial
autocorrelation and spatial scan. Important features of the spatio-temporal distribution are
thus highlighted, such as the low extent of the clusters, the spatial heterogeneity, and the
inter-annual variability in the affected areas and the diffusion patterns. The analysis also
suggests that the HCCA scale could be more efficient for epidemic response.
In a second article, an explanatory Bayesian hierarchical model is developed to
study the influence of environmental, epidemiologic and socio-demographic factors on
annual incidence of meningococcus A at the HCCA level. The models suggests that spatio-
temporal variability of incidence results from variations in the intensity or duration of the
dry season climatic effects on disease risk, and is further impacted by factors of spatial
contacts, representing facilitated pathogen transmission.
The third part of the thesis presents the elaboration of an early warning system to
improve outbreak detection and reactive vaccination strategies. A predictive model is
developed, based on climatic conditions, neighbourhood interactions and early cases, in
order to estimate the probability of occurrence of a localized epidemic during the dry
season in an HCCA exceeding an alert threshold.
Our results bring new insights into the spatio-temporal dynamics and risk factors of
meningococcal meningitis epidemics in Niger at a fine spatial scale. They allow the
formulation of public health recommendations that could contribute to the elaboration of
effective strategies for control and prevention of epidemics.
viii

Liste des publications
Publications et communications associées à la thèse
Articles publiés
• Paireau J, Girond F, Collard JM, Maïnassara HB, Jusot JF, 2012. Analysing Spatio-
Temporal Clustering of Meningococcal Meningitis Outbreaks in Niger Reveals
Opportunities for Improved Disease Control. PLoS Neglected Tropical Diseases 6(3):e1577.
doi:10.1371/journal.pntd.0001577 (Article I)
• Paireau J, Maïnassara HB, Jusot J-F, Collard J-M, Idi I, Moulia-Pelat JP, Mueller J,
Fontanet A, 2014. Spatio-Temporal Factors Associated with Meningococcal Meningitis
Annual Incidence at the Health Center Level in Niger, 2004-2010. PLoS Neglected Tropical
Diseases 8(5):e2899. doi:10.1371/journal.pntd.0002899 (Article II)
Communications orales
• Spatio-temporal cluster analyses of meningococcal meningitis epidemics in Niger 2003-
2009, Scientific International Meeting of the Young Researchers from the Institut
Pasteur International Network, Paris, November 2011
• Risk factor analysis of inter-annual incidence variation of meningococcal meningitis at
the health centre level in Niger, MAMEMA (Multi-disciplinary Approach for Meningitis
Epidemiology and Modeling in Africa) workshop, Paris, June 2013
Posters
• Spatio-temporal cluster analyses of meningococcal meningitis epidemics in Niger 2003-
2009, 4th International MERIT (Meningitis Environmental Risk Information
Technologies) Meeting, Addis Ababa, Ethiopia, November 2010
• Bayesian spatio-temporal modelling of serogroup A Neisseria meningitidis annual
incidence at the health centre level in Niger, Annual Congress of Pierre Louis Doctoral
School of Public Health, Saint Malo, France, October 2013
ix

Autres publications hors sujet de thèse
Articles publiés
• Paireau J, Tuan NH, Lefrançois R, Buckwalter MR, Nghia ND, Hien NT, Lortholary
O, Poirée S, Manuguerra JC, Gessain A, Albert ML, Brey PT, Nga PT and Fontanet A,
2012. Litchi–associated Acute Encephalitis in Children, Northern Vietnam, 2004–2009.
Emerging Infectious Diseases 18(11):1817-1824. (en annexe 8.3)
• Hamelin E, Pinson M, Montaut L, Paireau J, 2013. Spatial distribution study of
Salmonella Enteritidis infection in laying flocks between 2005 and 2009 in France.
Bulletin Epidémiologique Santé Animale – Alimentation 57:19-21.
• Rachas A, Nakouné E, Bouscaillou J, Paireau J, Selekon B, Senekian D, Fontanet A,
Kazanji M, 2014. Timeliness of yellow fever surveillance, Central African Republic.
Emerg Infect Dis 20(6):1004-1008.
Article soumis
• Ribadeau Dumas F, N’Diaye D S, Paireau J, Gautret P, Bourhy H, Le Pen C,
Yazdanpanah Y. The cost-effectiveness of rabies post-exposure prophylaxis in the
context of low rabies risk: A decision-tree model based on the experience of France.
x

Table des matières
Remerciements ........................................................................................................... iv
Résumé ...................................................................................................................... vii
Abstract ..................................................................................................................... viii
Liste des publications ................................................................................................. ix
Table des matières ..................................................................................................... xi
Liste des abréviations ............................................................................................... xiv
Liste des figures ........................................................................................................ xv
Liste des tables ......................................................................................................... xvi
1 Introduction ............................................................................................................. 1
1.1 Problématique ...................................................................................................................... 2
1.2 Objectifs ................................................................................................................................ 5
1.3 Plan de la thèse ..................................................................................................................... 6
2 État de l’art ............................................................................................................. 8
2.1 La méningite à méningocoque en Afrique subsaharienne ............................................. 9
2.1.1 La ceinture de la méningite ......................................................................................... 9
2.1.2 La bactérie Neisseria meningitidis ................................................................................. 11
2.1.3 L’infection à méningocoque : processus et spectre clinique ................................ 12
2.1.4 Diagnostic et traitement ............................................................................................ 15
2.1.5 Stratégies vaccinales ................................................................................................... 16
2.1.6 Facteurs de risque et modèles hypothétiques......................................................... 19
2.1.7 Cas du Niger : contexte général et épidémiologie de la méningite ..................... 25
2.2 Les méthodes statistiques en épidémiologie spatiale .................................................... 31
2.2.1 Présentation générale ................................................................................................. 31
2.2.2 Types de données ....................................................................................................... 33
2.2.3 Catégories d’études .................................................................................................... 35
2.2.4 Agrégation et détection d’agrégats ........................................................................... 37
2.2.5 Études de corrélation écologique............................................................................. 41
3 Analyse des agrégats spatio-temporels ................................................................ 47
3.1 Résumé de l’Article I ......................................................................................................... 48
3.2 Article I : Analysing Spatio-Temporal Clustering of Meningococcal Meningitis
Outbreaks in Niger Reveals Opportunities for Improved Disease Control. ..................... 49
xi

3.2.1 Abstract ....................................................................................................................... 50
3.2.2 Introduction ................................................................................................................ 50
3.2.3 Methods ....................................................................................................................... 53
3.2.4 Results .......................................................................................................................... 55
3.2.5 Discussion ................................................................................................................... 62
3.2.6 Acknowledgments ...................................................................................................... 66
3.2.7 Supporting information ............................................................................................. 66
4 Modèle spatio-temporel explicatif ........................................................................ 70
4.1 Résumé de l’Article II ....................................................................................................... 71
4.2 Article II : Spatio-Temporal Factors Associated with Meningococcal Meningitis
Annual Incidence at the Health Centre Level in Niger, 2004-2010. ................................... 73
4.2.1 Abstract ....................................................................................................................... 73
4.2.2 Introduction ................................................................................................................ 74
4.2.3 Methods ....................................................................................................................... 76
4.2.4 Results .......................................................................................................................... 82
4.2.5 Discussion ................................................................................................................... 86
4.2.6 Acknowkledgments .................................................................................................... 92
4.2.7 Supporting information ............................................................................................. 93
5 Modèle spatio-temporel prédictif ......................................................................... 98
5.1 Introduction ........................................................................................................................ 99
5.2 Données ............................................................................................................................ 102
5.3 Méthodes ........................................................................................................................... 104
5.4 Résultats préliminaires..................................................................................................... 109
5.5 Discussion ......................................................................................................................... 110
6 Conclusions ......................................................................................................... 114
6.1 Synthèse des travaux........................................................................................................ 115
6.2 Recommandations opérationnelles ............................................................................... 117
6.3 Perspectives de recherche ............................................................................................... 121
6.4 Conclusion générale ........................................................................................................ 128
7 Bibliographie ....................................................................................................... 130
8 Annexes ................................................................................................................ 147
8.1 Article I : Paireau J et al. Analysing Spatio-Temporal Clustering of Meningococcal
Meningitis Outbreaks in Niger Reveals Opportunities for Improved Disease Control.
PLoS Neglected Tropical Diseases 2012 .............................................................................. 148
xii

8.2 Article II : Paireau J et al. Spatio-Temporal Factors Associated with Meningococcal
Meningitis Annual Incidence at the Health Centre Level in Niger, 2004-2010. PLoS
Neglected Tropical Diseases 2014 ......................................................................................... 149
8.3 Article hors sujet de thèse : Paireau J et al. Litchi-associated acute encephalitis in
children, Northern Vietnam, 2004-2009. Emerging Infectious Diseases 2012 ............... 150
xiii

Liste des abréviations
AAI Absorbing Aerosol Index BHM barrière hémato-méningée
CERMES Centre de Recherche Médicale et Sanitaire
CI confidence/credible interval CSF cerebrospinal fluid
CSI centre de santé intégré
DSRE Direction de la Surveillance et la Réponse aux Épidémies GIC Groupe International de Coordination pour l’approvisionnement en
vaccin méningococcique GIS geographic information system
GL[M]M generalized linear [mixed] model
HCCA health centre catchment area Hib Haemophilus influenzae b
INS Institut National de la Statistique
IR[R] incidence rate [ratio] LCR liquide céphalo-rachidien
MAMEMA Multi-disciplinary Approach for Meningitis Epidemiology and Modeling in Africa
MCMC Markov chain Monte Carlo
MERIT Meningitis Environmental Risk Information Technologies MLST multilocus sequence typing
MM méningite à méningocoque ; meningococcal meningitis
MSP Ministère de la Santé Publique Nm Neisseria meningitidis
OMS Organisation mondiale de la Santé PATH Program for Appropriate Technology in Health
PEV Programme élargi de vaccination
PCR réaction en chaîne par polymérase ; polymerase chain reaction SIG système d’information géographique
RSM ratio standardisé de morbidité/mortalité
SD standard deviation Sp Streptococcus pneumoniae
ST sequence type UTM Universal Transverse Mercator
VPN valeur prédictive négative
VPP valeur prédictive positive WGS World Geodetic System
WHO World Health Organization xiv

Liste des figures
Figure 1. La ceinture de la méningite ........................................................................................... 10
Figure 2. Seuils d’incidence pour la détection et le contrôle des épidémies de méningite à méningocoque dans les pays à forte endémicité en Afrique ..................................................... 18
Figure 3. Cartographie du Niger et principales zones agro-climatiques ................................. 26
Figure 4. Séries temporelles (nombre de cas, incidence et taux de létalité) des cas suspects de méningite notifiés par an, Niger, 1949-2010 .......................................................................... 29
Figure 5. Surveillance épidémiologique des cas suspects de méningite au Niger. ................. 31
Figure 6. Cumulative incidence rates of meningitis in Niger from July 2002 to June 2009. 57
Figure 7. Annual spatial clusters of meningococcal meningitis cases identified in Niger
from 2003 to 2009. ......................................................................................................................... 58
Figure 8. Frequency of cluster occurrence in Niger from 2003 to 2009. ............................... 59
Figure 9. Spatio-temporal clusters of meningococcal meningitis cases identified in Niger
from 2003 to 2009. ......................................................................................................................... 61
Figure 10. Spatial distribution of meningococcal meningitis A in Niger from July 2003 to
June 2010. ......................................................................................................................................... 77
Figure 11. Seasonality of climate and aerosols. ........................................................................... 79
Figure 12. Temporal distribution of meningococcal meningitis (MM) A in Niger from July
2003 to June 2010. .......................................................................................................................... 82
Figure 13. Epidemiological characteristics related to annual incidence. ................................. 83
Figure 14. Multivariate model goodness of fit. ........................................................................... 85
Figure 15. Schématisation du système d’alerte précoce. .......................................................... 102
Figure 16. Séries temporelles des cas hebdomadaires par aire de santé (bleu clair) et dans la
zone d’étude (bleu foncé)............................................................................................................. 105
xv

Liste des tables
Table 1. Profil du Niger, 2012. ...................................................................................................... 27
Table 2. Results of microbiological analyses of CSF samples by epidemiological year. ....... 56
Table 3. Results from the Bayesian hierarchical model of meningococcal meningitis (MM)
A annual incidence at the health centre catchment area (HCCA) level over the study region,
Niger 2004-2010. ............................................................................................................................. 84
Table 4. Tahoua model results. Results from the Bayesian hierarchical model of
meningococcal meningitis (MM) A annual incidence at the health centre catchment area (HCCA) level over Tahoua subset, Niger 2004-2010. ............................................................... 86
Table 5. AICs and components of submodels ........................................................................... 95
Table 6. Performance d’une sélection de seuils d’alerte à l’échelle des aires de santé. ....... 107
Table 7. Résultats préliminaires du modèle logistique multivarié. ......................................... 110
Table 8. Performances du système d’alerte précoce pour différentes valeurs de c. ............. 110
xvi

1 Introduction
1

Ce premier chapitre présente la problématique à laquelle nous nous sommes
intéressés dans cette thèse, les objectifs des travaux réalisés et l’organisation du manuscrit.
1.1 Problématique
La méningite à méningocoque (MM) est une inflammation des méninges causée par
Neisseria meningitidis (Nm), une bactérie commensale du nasopharynx humain (Tzeng and
Stephens, 2000), qui se transmet par les sécrétions nasopharyngées émises par les individus
porteurs. Cette infection bactérienne est une cause importante de morbidité et de mortalité
dans le monde : environ 500 000 cas sont rapportés par an, avec un taux de létalité de
l’ordre de 10 % (Maiden and Caugant, 2006). La moitié des cas survient en Afrique
subsaharienne pendant la saison sèche, dans une zone baptisée « ceinture de la méningite »
où la méningite à méningocoque sévit sous un mode « endémo-épidémique »
(Lapeyssonnie, 1963). Le Niger, situé au cœur de la ceinture, est l’un des pays les plus
touchés par ces recrudescences saisonnières qui prennent parfois une ampleur épidémique.
Entre 453 et 43 203 cas suspects ont été notifiés au Niger chaque année entre 1960 et 2010
(WHO, 2013a), concernant en premier lieu les enfants et les jeunes adultes. Les épidémies
sont majoritairement causées par le sérogroupe A mais d’autres sérogroupes entrent en jeu,
comme les sérogroupes W et X (Boisier et al., 2007, 2005).
D’un point de vue de santé publique, la problématique qui se pose au Niger et dans
les pays de la ceinture en général, est d’apporter une réponse adaptée aux épidémies via des
stratégies d’intervention efficaces, en tenant compte des ressources limitées. En premier
lieu, la mise en place d’un système de surveillance performant est nécessaire. Au Niger, la
surveillance des méningites (maladie à déclaration obligatoire) se fait sur la base des cas
suspects notifiés par les formations sanitaires et transmis au niveau central sous forme de
données agrégées à l’échelle des districts (au nombre de 42). L’agrégation de ces données
facilite leur traitement au niveau central mais entraîne une perte d’information en renvoyant
une image homogène du risque, qui ne reflète pas toujours la situation épidémique
potentiellement disparate au sein d’un district.
Cette même échelle des districts est utilisée pour la prise de décision en matière de
vaccination. Les vaccins polyosidiques disponibles pour les pays de la ceinture sont
coûteux, produits en quantité insuffisante, inefficaces contre le portage et de durée de
protection limitée, ne permettant pas de réaliser des campagnes de vaccination préventive à
2

large échelle étant donné le caractère imprévisible des épidémies. L’Organisation mondiale
de la Santé (OMS) a donc retenu une stratégie réactive pour l’utilisation de ces vaccins, qui
consiste à vacciner un district une fois que celui-ci a dépassé un seuil d’incidence défini
(OMS, 2000). Néanmoins, en raison de délais trop longs entre la détection du seuil et la
campagne de vaccination comparés à l’évolution rapide de l’épidémie, la vaccination est
souvent trop tardive pour être réellement efficace (Cuevas et al., 2007; Woods et al., 2000).
Il serait donc intéressant d’étudier dans quelle mesure une surveillance à une échelle spatiale
plus fine permettrait de mieux capturer l’hétérogénéité au sein des districts, donner l’alerte
plus tôt et mieux cibler les populations à vacciner. Outre les quantités limitées de vaccins, le
Niger doit faire face à des ressources limitées en termes d’antibiotiques, de tests de
diagnostic rapides et de personnel médical. Une connaissance plus précise de la distribution
spatio-temporelle des cas pourrait donc également aider les autorités sanitaires à répondre
aux problématiques d’allocation des ressources.
Un nouveau vaccin conjugué contre le méningocoque A, accessible à un prix
abordable, a été récemment introduit en masse dans plusieurs pays de la ceinture, et en
particulier au Niger entre décembre 2010 et décembre 2011(Caini et al., 2013). Ce nouveau
vaccin apporte beaucoup d’espoir dans la lutte contre la méningite à méningocoque A.
Cependant, de nombreuses incertitudes, liées à une compréhension limitée du processus
épidémique, pèsent sur l’évolution de l’épidémiologie des méningites en Afrique
subsaharienne. Malgré l’avancée incontestable que constitue ce vaccin, il reste nécessaire,
dans le contexte sanitaire que nous venons de décrire, d’améliorer les stratégies de
prévention et de contrôle pour les rendre plus efficaces.
D’un point de vue scientifique, beaucoup de mystères restent encore à élucider.
Plus de cent ans après la première épidémie majeure décrite dans la ceinture de la
méningite, l’épidémiologie particulière de la méningite à méningocoque en Afrique est
encore mal expliquée (Greenwood, 2006). De nombreux facteurs semblent intervenir dans
la survenue de ces épidémies. Une combinaison de facteurs de risque, impliquant à la fois le
micro-organisme (e.g. virulence et transmissibilité de la souche), l’hôte (e.g. immunité et
susceptibilité) et l’environnement au sens large (climat sec, vents d’Harmattan chargés en
poussières, conditions de vie, regroupements de population…), est probablement
nécessaire pour déclencher une épidémie en un lieu et à un temps donnés. Cependant, la
majorité des études se sont jusqu’ici focalisées sur une seule catégorie de facteurs (climat,
biologie ou démographie par exemple). Peu d’études ont étudié les facteurs climatiques en
3

association avec d’autres facteurs épidémiologiques et socio-démographiques, pourtant
susceptibles d’interagir.
La plupart des auteurs s’accordent à dire que la saisonnalité des épidémies est
principalement déterminée par la dynamique temporelle du climat subsaharien (e.g. Agier et
al., 2013; Martiny and Chiapello, 2013; Sultan et al., 2005). Cependant, au-delà de la
saisonnalité, la localisation spatiale des épidémies et l’hétérogénéité de leur intensité sont,
elles, toujours mal expliquées. Les études ayant abordé cette question l’ont fait
principalement à l’échelle des districts, des régions ou des pays, principalement en raison de
la disponibilité des données de notification à cette échelle. Peu d’études ont pu décrire la
dynamique spatio-temporelle des épidémies ou expliquer les variations d’incidence d’une
saison à l’autre à une échelle spatiale plus fine, alors que cela apporterait incontestablement
un nouvel éclairage sur la dynamique spatio-temporelle des épidémies et les facteurs
impliqués.
L’épidémiologie spatiale peut être définie comme la description des variations
spatiales des maladies dans une population donnée, et l’analyse et la compréhension de ces
variations en relation avec des facteurs de risque. La disponibilité de données de
télédétection et les progrès récents des méthodes statistiques et des outils informatiques
(systèmes d’information géographique (SIG)) ont créé pour les épidémiologistes de
nouvelles opportunités pour prendre en compte la dimension spatiale des maladies,
identifier les zones à risque ou encore étudier le rôle des facteurs environnementaux. Face
aux questions soulevées par les épidémies de méningite en Afrique subsaharienne, il nous
paraissait judicieux d’appliquer ces méthodes statistiques d’épidémiologie spatiale aux
données de surveillance du Niger afin d’apporter notre contribution à la fois dans le champ
des stratégies de santé publique et dans celui de l’amélioration des connaissances
scientifiques.
Ce travail de thèse a été réalisé en étroite collaboration avec les équipes du Centre
de Recherche Médicale et Sanitaire (CERMES), laboratoire national responsable de la
surveillance microbiologique des méningites au Niger, sous l’autorité du Ministère de la
Santé Publique. Le système de surveillance microbiologique nigérien est unique dans la
ceinture de la méningite, couvrant l’ensemble du pays depuis le transfert des techniques de
diagnostic moléculaire par l’Institut Pasteur en 2002. La base de données issue de cette
surveillance nous a permis de travailler sur des cas de méningite à méningocoque confirmés
biologiquement, et à une échelle spatiale particulièrement fine, celle des aires de santé
4

(zones géographiques regroupant les villages desservis par un même centre de santé). En
complément, les données de notification obligatoire (cas suspects non confirmés) ont
également été collectées rétrospectivement à l’échelle des aires de santé pour une partie des
analyses réalisées.
1.2 Objectifs
L’objectif global de ce travail de thèse est de contribuer à une meilleure
compréhension de la dynamique spatio-temporelle des épidémies de méningite à
méningocoque au Niger et des facteurs qui régissent leur émergence et leur diffusion à une
échelle spatiale fine, afin d’aider à l’élaboration de stratégies de prévention et de contrôle
efficaces.
Les trois objectifs spécifiques de la thèse sont les suivants :
• DÉCRIRE : Explorer la distribution spatio-temporelle des épidémies de méningite
à méningocoque à l’échelle des aires de santé
en analysant l’agrégation spatiale et spatio-temporelle des cas et en identifiant les zones les
plus fréquemment touchées
• EXPLIQUER : Mieux comprendre les facteurs influençant l’émergence et la
diffusion des épidémies de méningite à méningocoque à l’échelle des aires de santé
en recherchant des corrélations significatives entre incidence de la maladie et facteurs
climatiques, épidémiologiques et socio-démographiques via un modèle de régression spatio-
temporel
• PRÉDIRE : Améliorer les stratégies de prévention et de contrôle des épidémies de
méningite à méningocoque au Niger,
en développant un système d’alerte précoce pour aider à la prise de décision en matière de
vaccination réactive et d’allocation des ressources dans les zones prédites comme à risque.
5

1.3 Plan de la thèse
Cette thèse se compose de 6 chapitres principaux, dont le présent chapitre
d’introduction. Le chapitre 2 (État de l’art) présente le contexte épidémiologique de la
méningite à méningocoque en Afrique subsaharienne et au Niger plus spécifiquement, et le
contexte méthodologique de l’épidémiologie spatiale. Les chapitres 3 à 5 présentent les
analyses effectuées pour répondre aux trois objectifs spécifiques.
Dans le chapitre 3, nous étudions la distribution spatio-temporelle des cas
confirmés de méningite à méningocoque à une échelle spatiale fine (aires de santé), en
termes d’agrégation spatiale et spatio-temporelle. Pour cela, nous employons des méthodes
de statistique spatiale : calcul des indices d’autocorrélation spatiale de Moran (tests globaux
et locaux) et utilisation du scan spatial de Kulldorff (méthode de fenêtre mobile). Nous
cherchons à savoir d’une part si les caractéristiques spatio-temporelles de la distribution des
cas pourraient aider à identifier les zones les plus à risque pour cibler l’allocation des
ressources et à détecter des schémas de diffusion récurrents, et d’autre part si l’utilisation de
l’échelle des aires de santé pourrait permettre une meilleure surveillance et un meilleur
contrôle des épidémies, comparée à l’échelle des districts. Les analyses du chapitre 3 sont
présentées sous forme d’un article publié en langue anglaise (Article I), précédé d’un
résumé en français.
Dans le chapitre 4, nous développons un modèle explicatif hiérarchique bayésien
afin d’étudier l’influence des facteurs climatiques, socio-démographiques et
épidémiologiques sur l’incidence annuelle du méningocoque A à l’échelle des aires de santé.
Les facteurs étudiés pour expliquer les variations spatio-temporelles d’incidence
incluent notamment la vaccination, le réseau routier, le climat, la couverture végétale, les
effets de voisinage, l’historique des épidémies, la densité de population ou encore les
interactions avec les autres sérogroupes. La stratégie de modélisation employée nous
permet de prendre en compte la sur-dispersion et les corrélations spatiales et temporelles
rencontrées dans les données, et de contrôler pour les facteurs de confusion inconnus ou
non mesurés. Les analyses du chapitre 4 sont également présentées sous forme d’un article
publié en langue anglaise (Article II), précédé d’un résumé en français.
Dans le chapitre 5, nous élaborons un modèle prédictif des épidémies dans
l’optique de développer un système d’alerte précoce qui pourrait améliorer les stratégies
vaccinales. Le modèle s’appuie notamment sur les conditions climatiques, les interactions
de voisinage et la précocité des cas, pour estimer le risque qu’une épidémie se déclenche au
6

cours de la saison sèche dans une aire de santé ayant dépassé un seuil d’alerte. Les données
utilisées pour cette analyse sont les données de notification des cas suspects disponibles en
temps réel. Ce chapitre présente les objectifs et la méthodologie suivie pour le
développement de ce système d’alerte, ainsi que des résultats préliminaires encourageants,
qui sont discutés en fin de chapitre.
Enfin, le chapitre 6 conclut cette thèse en synthétisant les principaux résultats
obtenus, en formulant des recommandations opérationnelles puis en proposant des
perspectives de recherche pour améliorer la compréhension et la prévention des épidémies
de méningite à méningocoque en Afrique subsaharienne.
7

2 État de l’art
8

Ce chapitre se consacre dans une première partie au contexte épidémiologique
général dans lequel s’inscrit cette thèse, celui de la méningite à méningocoque sous l’angle
subsaharien, et présente en particulier le cas du Niger auquel nos travaux se sont intéressés.
Dans une seconde partie, le contexte méthodologique de l’épidémiologie spatiale est
exposé, avec une présentation des principales méthodes statistiques qui seront utilisées
dans les chapitres suivants.
2.1 La méningite à méningocoque en Afrique subsaharienne
2.1.1 La ceinture de la méningite
La méningite à méningocoque est une inflammation des méninges causée par la
bactérie Neisseria meningitidis. Cette maladie infectieuse, à la fois dans ses formes endémiques
comme épidémiques, est une cause importante de morbidité et de mortalité dans le monde.
Environ 500 000 cas sont rapportés par an, dont la moitié en Afrique subsaharienne. Alors
que dans les pays industrialisés, les taux d’incidence annuels de la maladie endémique sont
d’environ 1 à 2 cas pour 100 000 individus, des épidémies explosives ont lieu en Afrique,
avec des taux d’incidence annuels pouvant aller jusqu’à 800 pour 100 000 à l’échelle d’un
pays (Maiden and Caugant, 2006; OMS, 1998).
Les premiers rapports d’épidémie de méningite à méningocoque en Afrique
remontent à la fin du XIXème siècle, d’abord en Afrique du Nord (Algérie et Égypte) puis en
Afrique du Sud et au Soudan, probablement suite à l’introduction de la bactérie par les
Européens (Greenwood, 1999). L’Afrique de l’Ouest connait sa première épidémie majeure
au Nigéria en 1905 (McGahey, 1905), sans doute causée par une souche venant du Soudan,
avant que la maladie ne se diffuse dans toute l’Afrique de l’Ouest (Greenwood, 2006).
En Afrique, la méningite à méningocoque sévit sous un mode « endémo-
épidémique » caractéristique, au sein d’une zone géographique baptisée « ceinture de la
méningite » (Lapeyssonnie, 1963). Décrite initialement comme allant du Mali à l’ouest au
Soudan à l’est, la ceinture est aujourd’hui définie par une région plus large, s’étendant du
Sénégal à l’Éthiopie (Greenwood, 1999) (Figure 1). Située au sud du Sahara, la ceinture
présente un profil climatique particulier puisqu’elle coïncide relativement bien avec une
zone de pluviométrie limitée au nord par l’isohyète 300 mm et au sud par l’isohyète 1 100
mm de pluies cumulées annuelles (Lapeyssonnie, 1963). Depuis quelques années, les
9

épidémies semblent toucher occasionnellement des pays situés plus au sud tels que le
Mozambique ou l’Angola. Cette extension au-delà des limites traditionnelles de la ceinture
pourrait être liée au changement climatique, à la déforestation et à la désertification de ces
régions (Molesworth et al., 2002).
Figure 1. La ceinture de la méningite (CDC, 2014).
La ceinture de la méningite se caractérise par une dynamique épidémiologique bien
spécifique, formalisée notamment par le modèle de Mueller et Gessner (2010), avec une
incidence endémo-sporadique en saison humide à laquelle s’ajoute une recrudescence
systématique des cas en saison sèche et des vagues épidémiques de plus grande ampleur
apparaissant sous forme de cycles pluri-annuels plus ou moins réguliers.
La saisonnalité est une des caractéristiques fortes des épidémies de méningite à
méningocoque dans la ceinture. En saison humide, le niveau endémique d’incidence se
situe autour de 0-0,5 pour 100 000 par semaine dans la plupart des districts sanitaires
(Mueller and Gessner, 2010). À chaque début de saison sèche, on observe une
augmentation progressive du nombre de cas, jusqu’au début des pluies où l’incidence
revient brutalement à son niveau endémique (Greenwood, 1999). L’incidence pendant cette
période d’hyper-endémicité est de l’ordre de 10-100 fois l’incidence endémique (Mueller
and Gessner, 2010).
Au sein d’un pays, toutes les régions ne sont pas touchées avec la même ampleur
lors de la saison sèche : une grande hétérogénéité spatiale existe, avec la survenue 10

d’épidémies très localisées géographiquement (Paireau et al., 2012 [Article I]; Tall et al.,
2012). La saison de la méningite observée à l’échelle d’un pays est en fait constituée d’une
hyper-endémicité générale sur laquelle s’ajoutent localement ces foyers épidémiques.
Certaines années, le nombre, l’expansion géographique et/ou l’intensité de ces
foyers épidémiques localisés augmentent avec une ampleur telle qu’il se forme une
épidémie à l’échelle du pays, dont l’incidence peut dépasser de 3 à 10 fois l’incidence
observée lors des années dites « non-épidémiques » (Mueller and Gessner, 2010). Ces
grandes épidémies à l’échelle d’un pays reviennent de façon cyclique tous les 8 à 14 ans,
sous forme de vagues d’une durée de 1 à 3 ans (Moore, 1992) (cf. l’exemple du Niger en
Figure 4, section 2.1.7). La périodicité de ces vagues épidémiques varie selon les pays et les
époques. Un certain synchronisme a été observé entre pays voisins, sans être systématique
ou commun à l’ensemble des pays de la ceinture (Broutin et al., 2007).
2.1.2 La bactérie Neisseria meningitidis
La première description clinique d’une épidémie de méningite à méningocoque est
généralement attribuée au Docteur Vieussieux, suite à une épidémie survenue en 1805 à
Genève (Vieusseux, 1805). Mais ce n’est qu’à la fin du siècle qu’Anton Weichselbaum
identifie pour la première fois l’agent causal, le méningocoque, à partir du liquide céphalo-
rachidien (LCR) de patients (Weichselbaum, 1887). Le méningocoque, Neisseria meningitidis,
est une bactérie diplocoque à Gram négatif encapsulée appartenant au genre Neisseria de la
famille des Neisseriaceae. Cette bactérie strictement humaine est commensale du
nasopharynx de l’Homme, son unique réservoir naturel connu (Tzeng and Stephens, 2000).
Elle colonise la muqueuse nasopharyngée sans affecter l’hôte, phénomène connu sous le
nom de portage asymptomatique (Yazdankhah and Caugant, 2004), l’infection invasive
étant un événement occasionnel.
Les méningocoques sont traditionnellement classés par typage phénotypique basé
sur les structures antigéniques exprimées à la surface de la bactérie (Frasch et al., 1985) :
• les polyosides capsulaires déterminent le sérogroupe
• les protéines PorB de la membrane externe déterminent le sérotype
• les protéines PorA de la membrane externe déterminent le sous-type.
Une souche méningococcique peut ainsi être désignée par sa formule antigénique
(sérogroupe : sérotype : sous-type), par exemple B:15:P1.7,16 (P1 pour protéine de classe
11

P1 ou PorA) (Taha, 2001). À ce jour, 13 sérogroupes de méningocoque ont été décrits (A,
B, C, D, 29E, H, I, K, L, W, X, Y et Z). Six d’entre eux, les sérogroupes A, B, C, W, X et
Y, sont les plus répandus chez les cas d’infections invasives à méningocoque dans le monde
(Stephens et al., 2007). En Afrique subsaharienne, les principales épidémies de méningite à
méningocoque ont été causées par le sérogroupe A (Leimkugel et al., 2009). Le sérogroupe
C (Broome et al., 1983), et plus récemment les sérogroupes X (Boisier et al., 2007) et W
(Decosas and Koama, 2002), ont également été impliqués dans des épidémies. Chez les
porteurs asymptomatiques, les isolats identifiés sont plus diversifiés et incluent, outre les
sérogroupes pathogènes, les sérogroupes B, Y, 29E, Z et des souches non groupables (non
encapsulées) (Trotter and Greenwood, 2007).
En complément du typage phénotypique, l'utilisation des approches génétiques,
telles que le typage par séquençage multiple de gènes (MLST : multilocus sequence typing),
permet d'analyser directement le génome bactérien (Maiden et al., 1998). Ces méthodes
sont utilisées pour grouper les souches de méningocoque en complexes clonaux (lignées
génétiques), à des fins de surveillance et de recherche. Dans le cas d’un génotypage par
MLST, les complexes clonaux sont désignés par leurs « séquence-types » (STs), définis par
le profil allélique de sept gènes (Taha et al., 2002; Caugant, 2002). Certaines souches
particulièrement virulentes ont ainsi pu être suivies dans le monde entier. La progression du
complexe clonal ST5/sous-groupe III-1 a pu être retracée de l’Asie du Sud en 1983 à
l’Afrique subsaharienne en 1988, en passant par le Moyen-Orient à l’occasion du pèlerinage
à La Mecque de 1987 (Moore et al., 1989).
2.1.3 L’infection à méningocoque : processus et spectre clinique
Le processus de l’infection à méningocoque peut être décomposé en une séquence
de trois événements : tout d’abord la transmission du germe, suivie de l’acquisition plus ou
moins longue du méningocoque dans le tractus respiratoire supérieur (portage), auquel
succède occasionnellement le développement de la maladie invasive.
La transmission du méningocoque se fait par contact étroit avec les sécrétions
nasopharyngées émises par les individus porteurs, soit par contact direct (baiser) soit par les
gouttelettes de Pflügge (éternuement, toux…). La bactérie ne survivant pas longtemps dans
les gouttelettes, hors de l’environnement humide du rhinopharynx, la transmission de
personne à personne requiert un contact fréquent ou proche (Mc Leod Griffiss, 1995).
12

Après transmission, l’acquisition du méningocoque dans le tractus respiratoire
supérieur peut être fugace ou conduire dans certains cas à l’adhésion de la bactérie aux
cellules de l’épithélium rhinopharyngé, suivie de la colonisation de la muqueuse. Le plus
souvent, cette colonisation résume l’infection méningococcique, le patient est alors dit
porteur sain. Les mécanismes qui président à l’établissement de la colonisation sont mal
connus (Bingen, 2001). La durée de ce portage peut varier de quelques jours à plusieurs
mois (Cartwright, 1995a). En Afrique subsaharienne, la prévalence du portage du
méningocoque en population générale varie selon les études de 3 % à 35 %, en fonction
notamment des sérogroupes incriminés et des situations épidémiques ou non épidémiques
(Trotter and Greenwood, 2007).
Dans de rares cas, une dissémination septicémique (passage de la bactérie dans le
sang) peut survenir après la colonisation. La survie et la multiplication du méningocoque
pendant la phase septicémique sont d'une part liées à la disponibilité de certains nutriments
qui jouent un rôle primordial dans les fonctions métaboliques de la bactérie, et d'autre part,
à sa capacité à échapper aux systèmes de défenses immunitaires, essentiellement grâce à sa
capsule (Deghmane and Taha, 2010). Au cours de cette phase bactériémique, Nm a la
capacité peu commune de franchir la barrière hémato-méningée (BHM) pour envahir le
LCR et induire une inflammation des méninges. Les conditions de franchissement des
barrières (épithélium rhinopharyngée et BHM) sont encore mal connues (Bingen, 2001).
Cette phase invasive est un événement rare. Une étude au Ghana a estimé la proportion du
nombre de cas de méningite causés par le sérogroupe A parmi les individus porteurs entre
0,04 et 4,23 % (Leimkugel et al., 2007). L’infection invasive survient en quelques jours, en
général entre 1 et 14 jours après l’acquisition (Stephens, 2007).
L’immunité naturelle peut se développer suite à la maladie invasive ou au portage
rhinopharyngé du méningocoque, qui peut stimuler la production d’anticorps bactéricides
contre la souche portée, voire induire une certaine protection croisée avec d’autres souches
de méningocoque (Goldschneider et al., 1969a; Mueller et al., 2011; Reller et al., 1973).
L’augmentation des taux de séroprévalence d’anticorps avec l’âge pourrait ainsi s’expliquer
par l’exposition répétée à des épisodes de portage (Trotter et al., 2013). Le portage de
micro-organismes non pathogènes, tels que Neisseria lactamica, qui induisent une immunité
contre le méningocoque, pourraient aussi jouer un rôle dans le développement de
l’immunité naturelle (Pollard and Frasch, 2001).
13

Nm peut causer une palette de présentations cliniques différentes. L’infection
invasive provoquée par le méningocoque se présente le plus couramment sous la forme
d’une méningite aigüe, mais peut aussi se présenter sous la forme d’une septicémie avec un
rash cutané caractéristique, ou d’une association de ces deux formes cliniques. Une
méningococcémie légère peut également être observée, accompagnée de fièvre et
éventuellement de rash, sans évolution vers un choc septique ni une méningite aiguë
(Steven and Wood, 1995). Plus rarement, la maladie invasive peut se présenter sous forme
d’arthrite, de pneumonie, de conjonctivite, de péricardite ou d’endophthalmite (Pollard and
Nadel, 2006).
Chez les patients avec méningite aiguë, les symptômes suivants prédominent : maux
de tête, fièvre, vomissements, photophobie, raideur de la nuque, signes de Kernig, létargie
et parfois convulsions. Les signes cliniques chez les nourrissons sont plus difficiles à
reconnaître et peuvent inclure, en plus de la fièvre, une irritabilité et des cris aigus, un refus
de s’alimenter et un bombement de la fontanelle (Pollard and Nadel, 2006).
Les patients avec septicémie peuvent présenter une fièvre, un rash caractéristique
(purpura), des maux de tête, des symptômes grippaux (en particulier myalgie), des
vomissements et des douleurs abdominales. Les signes cliniques de choc septique incluent
tachycardie, hypoperfusion périphérique, tachypnée, oligurie, confusion et parfois
hypotension (Pollard and Nadel, 2006).
Les proportions des différentes formes cliniques peuvent varier d’une situation
épidémiologique à l’autre. Il semble cependant que la méningite aiguë sans choc septique
soit la présentation clinique dominante en Afrique subsaharienne, où l’on trouve moins de
septicémies seules que dans les pays industrialisés (Brandtzaeg and van Deuren, 2012;
Stephens et al., 2007).
La sévérité de l’infection méningococcique varie selon les présentations cliniques.
Les taux de létalité peuvent aller de moins de 5 % chez les patients avec méningite seule, à
10-25 % chez les patients avec méningite et septicémie et 25-55 % chez les patients atteints
de septicémie fulminante (Brandtzaeg, 2006).
Parmi les survivants, la fréquence médiane des séquelles neuropsychologiques dues
à Nm a été estimée entre 7 et 9,5 % par des revues de littérature systématiques, avec des
écarts observés allant de 3 à 21 % (Edmond et al., 2010; Ramakrishnan et al., 2009), ce taux
pouvant s’élever à 37 % selon une étude récente menée au Niger (Jusot et al., 2013). Les
séquelles observées incluent surdité, baisse de l’acuité visuelle, retard mental, troubles du
langage, troubles du comportement, atteintes motrices, hémiplégie, paralysie faciale et
14

épilepsie (Ramakrishnan et al., 2009). Elles représentent un problème majeur et un poids
économique pour la famille, en particulier en Afrique subsaharienne où il n’existe que très
peu de structures de soins de suite et de rééducation fonctionnelle.
2.1.4 Diagnostic et traitement
La première étape du diagnostic est la reconnaissance des signes cliniques, sur la
base desquels les centres de santé notifient les cas suspects de méningite au système de
surveillance national, selon la définition de cas de l’Organisation mondiale de la Santé
(OMS, 1998, 2009) :
• toute personne adulte avec apparition brutale d’une fièvre (température rectale >
38,5°C ou axillaire > 38,0°C) et un des signes suivants : raideur de la nuque, trouble
neurologique ou tout autre signe méningé.
• tout nourrisson avec apparition brutale d’une fièvre (température rectale > 38,5°C
ou axillaire > 38,0°C) et un des signes suivants : raideur de la nuque ou nuque
molle, bombement de la fontanelle, plafonnement du regard, convulsion ou tout
autre signe méningé.
En cas de suspicion d’une méningite au vu des signes cliniques, une ponction
lombaire (prélèvement de LCR) est ensuite nécessaire pour confirmer le diagnostic et
mettre en évidence le méningocoque, et ainsi exclure les autres agents étiologiques
communs, tels que Streptococcus pneumoniae (Sp) et Haemophilus influenzae b (Hib), qui peuvent
être à l’origine des mêmes symptômes. Dans un premier temps, un examen macroscopique
qui révèle un LCR d’aspect trouble ou purulent indique un cas probable de méningite
bactérienne. Dans un second temps, un examen microscopique du LCR permet d’attribuer
de façon plus certaine le cas au méningocoque si une coloration de Gram met en évidence
des diplocoques Gram-négatifs en grain de café. L’observation de pétéchies ou purpura
indique également l’implication probable du méningocoque. À noter que lorsqu’une
épidémie est en cours (prévalence élevée des méningites à méningocoque), la valeur
prédictive des signes cliniques et de l’aspect visuel du LCR augmente et permet de
conforter le diagnostic de méningite à méningocoque sans examen microscopique du LCR
(souvent impossible à réaliser dans les centres de santé périphériques).
Enfin, seule la mise en évidence de l’agent bactérien dans le LCR au niveau des
laboratoires nationaux permet de définir un cas confirmé de méningite à méningocoque.
15

Plusieurs techniques sont utilisées pour confirmer le diagnostic et déterminer le sérogroupe
du méningocoque le cas échéant (WHO, 1999) :
• la culture bactérienne, considérée comme la méthode de référence, qui ne peut être
utilisée que sur les échantillons de LCR frais ou inoculés sur milieu Trans Isolate
(TI), acheminés rapidement au laboratoire et conservés à température ambiante, en
raison de la fragilité des micro-organismes.
• la détection antigénique par des méthodes de diagnostic rapide (agglutination au
latex, co-agglutination, contre-immunoélectrophorèse et ELISA)
• la réaction en chaîne par polymérase (PCR), qui peut être réalisée sur tous types
d’échantillons de LCR (frais, inoculés sur TI, conservés au réfrigérateur ou
congelés).
La méningite à méningocoque est potentiellement fatale et doit donc être
considérée comme une urgence médicale. L’admission dans un centre de santé est
nécessaire au diagnostic ainsi qu’au traitement. La contagiosité étant modérée et
disparaissant rapidement sous traitement antibiotique, l’isolement des malades n’est pas
nécessaire (MSF, 2008). Le traitement antimicrobien doit être démarré aussi rapidement
que possible, dès que la ponction lombaire a été pratiquée, sans attendre les résultats de
laboratoire.
Dans la plupart des pays d’Afrique subsaharienne, les structures sanitaires
manquent de matériel, de médicaments et de laboratoires équipés. De plus, lorsque survient
une épidémie, l’afflux des malades aggrave les difficultés et submerge le personnel et les
ressources disponibles. Aussi, la prise en charge des cas doit être simplifiée, pour obtenir le
maximum de résultats avec un coût minimum. Une antibiothérapie de courte durée,
d'efficacité démontrée, est ainsi particulièrement utile en cas d'épidémie. Dans leur grande
majorité, les patients peuvent être traités par une dose unique de chloramphénicol huileux
ou de céftriaxone. Chez les malades dont l'état ne s'améliore pas rapidement, une dose
supplémentaire du même antibiotique est recommandée 48 heures après la première dose
(OMS, 1998).
2.1.5 Stratégies vaccinales
Jusqu’en 2010, les vaccins utilisés dans la ceinture de la méningite étaient
exclusivement des vaccins polyosidiques, utilisés lors de campagnes de vaccination réactive.
16

Les premiers vaccins polyosidiques sont disponibles depuis les années 1970 (Gold et al.,
1975; Gotschlich et al., 1969; Lapeyssonnie, 1974; Saliou et al., 1978) et existent aujourd’hui
sous forme de diverses associations contre les sérogroupes A, C, Y et W. Le plus utilisé en
Afrique est le vaccin bivalent A/C, le sérogroupe A étant majoritairement responsable des
épidémies. L’émergence du sérogroupe W en tant que souche épidémique au Burkina Faso
en 2002 a également conduit à l’utilisation du vaccin quadrivalent A/C/Y/W. Cependant,
son prix élevé et sa disponibilité limitée en restreignent l’usage dans le contexte africain.
Ces vaccins polyosidiques offrent une durée de protection limitée, de 3 à 5 ans (Stephens et
al., 2007) et leur efficacité diminue avec le temps, passant de 87 % après un an à 70 % et
54 % après deux et trois ans, respectivement ; cette protection diminue encore plus
rapidement chez les enfants de moins de quatre ans (Reingold, 1985). Autre inconvénient
de ces vaccins, ils ne protègent pas contre le portage mais uniquement contre la maladie
invasive, et par conséquent n’ont aucun ou peu d’effet sur la transmission (Hassan-King et
al., 1988).
Pour plusieurs raisons, ces vaccins polyosidiques sont distribués dans les pays de la
ceinture en réponse à des épidémies, dans le cadre d’une stratégie de vaccination réactive, et
non préventive. D’une part, ces vaccins ne peuvent pas être utilisés en routine au cours de
la première enfance à cause de leur inefficacité à cet âge. D’autre part, des vaccinations
préventives de masse sont irréalisables en raison de la quantité insuffisante de vaccins
polyosidiques produits (20 millions de doses par an pour 350 millions de personnes à
risque dans la ceinture). La stratégie retenue par l’OMS pour l’utilisation de ces vaccins est
donc la vaccination réactive, dont le principe est de vacciner la population d’un district en
riposte à une épidémie, c’est-à-dire une fois que celui-ci a dépassé un certain seuil
épidémique (OMS, 2000) (Figure 2). Le Groupe International de Coordination pour
l’approvisionnement en vaccin méningococcique (GIC) est responsable de la gestion du
stock de vaccins polyosidiques utilisés en cas d’épidémie. Malheureusement, le temps que le
pays détecte le dépassement du seuil épidémique, confirme l’étiologie, commande les
vaccins auprès du GIC, les reçoive (parfois en quantités insuffisantes) et organise la
campagne de vaccination, la vaccination arrive souvent après le pic naturel de l’épidémie
(Cuevas et al., 2007; Woods et al., 2000).
17

Figure 2. Seuils d’incidence pour la détection et le contrôle des épidémies de méningite à
méningocoque dans les pays à forte endémicité en Afrique (modifié d’après (OMS, 2000)).
Face aux limites de cette stratégie vaccinale réactive, le Projet Vaccins Méningite
s’est donné pour mission de développer un vaccin conjugué contre le sérogroupe A,
spécifiquement pour l’Afrique, pour une utilisation dans le cadre d’une approche vaccinale
préventive. Ce projet est né en 2001 d’un partenariat entre l’OMS et PATH (Program for
Appropriate Technology in Health), financé par la Fondation Bill & Melinda Gates. Le Serum
Institute of India a été chargé de la production de ce vaccin, pour un prix final de 0,5$ par
dose. Le vaccin ainsi développé, appelé MenAfriVacTM, a obtenu l’autorisation de mise sur
le marché par les autorités indiennes et a été pré-qualifié par l’OMS en 2010, sur la base des
essais cliniques de phase 2 (innocuité et immunogénicité) (LaForce et al., 2009). Par rapport
aux vaccins polyosidiques, MenAfriVacTM a pour avantages attendus de conférer une
protection plus durable et plus précoce (utilisation possible avant l’âge de deux ans) (Sow et
al., 2011), ainsi qu’une meilleure immunité de groupe via son effet sur le portage (Daugla et
al., 2014; Greenwood, 2013; Kristiansen et al., 2013)
Les premières campagnes de vaccination de masse, ciblant toutes les personnes
âgées de 1 à 29 ans (dose unique), ont démarré au Burkina Faso, au Niger et au Mali fin
2010, suivies par des campagnes d’introduction dans neuf autres pays (Cameroun, Nigéria
18

et Tchad en 2011, Bénin, Ghana, Sénégal et Soudan en 2012, Gambie et Éthiopie en 2013).
D’ici 2016, les 26 pays concernés devraient avoir introduit MenAfriVacTM. Une fois que
toutes les campagnes de vaccination de masse auront été menées, le principal défi à venir
sera de protéger les cohortes de naissance pendant la petite enfance, en intégrant le vaccin
dans le Programme élargi de vaccination (PEV) des pays ou en organisant tous les cinq ans
des campagnes ciblant les enfants de 1 à 4 ans (LaForce et al., 2009). La vaccination
réactive continue aujourd’hui à être utilisée dans les zones non vaccinées ou dans les zones
où des épidémies dues à d’autres sérogroupes que le A surviennent.
2.1.6 Facteurs de risque et modèles hypothétiques
Plus de cent ans après la première épidémie majeure rapportée dans la ceinture de la
méningite, l’épidémiologie particulière de la méningite à méningocoque en Afrique est
encore mal expliquée (Greenwood, 2006). Elle résulte probablement de l’interaction
complexe entre de multiples facteurs impliquant à la fois l’organisme, l’hôte et
l’environnement. Au niveau individuel, les facteurs de risque peuvent jouer (spécifiquement
ou simultanément) sur les trois grandes phases de la maladie décrites au 2.1.3, et ainsi
impacter les risques de transmission, d’acquisition et d’invasion. Au niveau des populations,
une combinaison de facteurs concomitants est probablement nécessaire pour qu’une
épidémie se déclenche à un endroit et un moment donnés (Greenwood, 1999; Moore,
1992). Quatre grands types de facteurs peuvent être décrits.
Facteurs relatifs au micro-organisme
Tout d’abord, la transmissibilité (capacité de la bactérie à diffuser entre les hôtes) et
la virulence (capacité de la bactérie à se multiplier dans l’hôte et envahir les sites stériles tels
que le sang ou le LCR) peuvent varier d’une souche de méningocoque à l’autre. Les
structures surfaciques bactériennes telles que le pili, les protéines Opa, les porines et la
capsule polysaccharidique, sont les facteurs majeurs impliqués dans ces deux processus
(Taha et al., 2002; Tzeng and Stephens, 2000). En conséquence, il existe de grandes
différences entre sérogroupes de méningocoque au regard de leur potentiel à causer des
épidémies (Schwartz et al., 1989). Ainsi, le sérogroupe A est majoritairement responsable
des épidémies en Afrique, alors que d’autres sérogroupes fréquemment retrouvés chez les
porteurs asymptomatiques causent peu d’infections, et a fortiori d’épidémies (Cartwright,
1995a). De surcroit, à l’intérieur d’un même sérogroupe, certains clones sont plus
19

fréquemment impliqués dans des épidémies, alors que d’autres, identifiés chez les porteurs,
ne sont reliés à aucune épidémie (Schwartz et al., 1989). Cela a notamment été montré pour
les sérogroupes A (Olyhoek et al., 1987) et B (Caugant et al., 1988).
Facteurs relatifs à l’hôte
Le risque de maladie invasive est plus élevé chez les enfants (1-14 ans) et décroît
avec l'âge, la maladie devenant rare après 30 ans (Campagne et al., 1999; Mainassara et al.,
2014). En situation inter-épidémique, les jeunes enfants (<5 ans) sont les plus touchés par
la méningite à méningocoque. Pendant les épidémies, on observerait un élargissement de la
tranche d'âge la plus affectée aux enfants plus âgés, aux adolescents, voire aux jeunes
adultes (Moore, 1992; Peltola et al., 1982).
Le statut immunitaire de l’hôte est évidemment un facteur déterminant dans le
développement de la maladie. L’immunité de l’hôte peut être naturelle (cf. 2.1.3), ou
acquise par la vaccination. Le rôle de l’immunité humorale dans la prévention de la maladie
a été largement déterminé par les travaux fondateurs de Goldschneider et al. dans les
années 1960 (Goldschneider et al., 1969a, 1969b). Ces auteurs ont montré une corrélation
inverse entre les titres d’anticorps sériques bactéricides et le risque de maladie chez l’hôte.
Ce corrélat de protection ne semble cependant pas directement transférable au NmA dans
la ceinture de la méningite, où la relation entre immunité humorale et incidence de la
maladie y est moins évidente (Trotter et al., 2013). Par ailleurs, les anticorps présents dans
les secrétions nasopharyngées (immunité mucosale) jouent probablement un rôle important
dans la prévention de la colonisation et de l’invasion par la bactérie (Pollard and Frasch,
2001). À l’échelle d’une région, la susceptibilité de la population à une épidémie est liée
directement au niveau de l’immunité de groupe dans cette population (Moore, 1992).
L’accumulation, depuis l’épidémie précédente, d’individus non-exposés et donc non
immuns via les naissances et les migrations, associée à la perte d’immunité chez les
individus précédemment exposés, contribuent probablement de façon importante au risque
épidémique au sein d’une population (Greenwood, 1999).
La susceptibilité d’un hôte à l’infection à méningocoque peut ensuite être affectée
par des infections concomitantes. Des infections virales respiratoires telles que la grippe
pourraient ainsi favoriser la transmission de la bactérie par la toux ou l’éternuement
(Moore, 1992). De telles infections semblent également favoriser le portage rhinopharyngé
(Mueller et al., 2008; Raghunathan et al., 2006) et le développement de la maladie invasive
(Moore et al., 1990; Mutonga et al., 2009), probablement par l’induction de modifications
20

de la muqueuse pharyngée et/ou par la réduction des défenses immunitaires de l’hôte
(Alonso and Taha, 2003; Moore, 1992; Mueller and Gessner, 2010; Schwartz et al., 1989).
Plusieurs études ont ainsi montré, dans différents contextes, une corrélation temporelle
entre épidémies d’infections respiratoires, en particulier la grippe, et épidémies de
méningite à méningocoque (Cartwright et al., 1991; Harrison et al., 1991; Hubert et al.,
1992; Young et al., 1972) au sein d’une même population.
Facteurs climatiques
L’étendue exacte du rôle des facteurs climatiques dans l’épidémiologie de la
méningite dans la ceinture est toujours discutée par les scientifiques. La suspicion du lien
entre méningite et climat vient d’une part de la forte saisonnalité des épidémies, qui n’ont
lieu qu’en saison sèche et s’arrêtent avec le début des pluies, et d’autre part du profil
climatique particulier de la ceinture de la méningite, qui coïncide avec une zone de
pluviométrie située entre l’isohyète 300 au nord et l’isohyète 1 100 au sud (Lapeyssonnie,
1963). Différentes hypothèses ont été formulées pour expliquer le mécanisme de ce
phénomène « climato-pathologique ». L’hypothèse principale stipule que les conditions
climatiques particulières de la saison sèche dans la ceinture (humidité relative très faible et
vents d’Harmattan secs et chargés en poussières désertiques) fragiliseraient la muqueuse
nasopharyngée et augmenteraient ainsi le risque d’invasion chez un individu colonisé par le
méningocoque (Moore, 1992). Ce phénomène est biologiquement plausible mais n’a jamais
été prouvé. Alternativement, le climat pourrait jouer directement ou indirectement sur le
risque de transmission, via différents mécanismes biologiques ou comportementaux. D’une
part, la transmission des gouttelettes infectantes dans l’air pourrait être éventuellement
favorisée par des conditions d’humidité faible (Ghipponi et al., 1971) mais cela reste à
prouver. D’autre part, la propagation du méningocoque pendant la saison sèche pourrait
être facilitée par un taux de contacts plus élevé entre individus pendant cette période, en
raison de regroupements sociaux plus fréquents, de migrations saisonnières de la campagne
vers la ville liées à la baisse des travaux agricoles, ou de conditions climatiques défavorables
(températures nocturnes plus basses et vents de poussières) qui inciteraient les gens à
s'entasser dans des habitations mal ventilées (Greenwood, 1999; Waddy, 1952). Cependant,
le fait que le portage ne semble pas saisonnier (Trotter and Greenwood, 2007) et que de
hauts niveaux de portage, non associés à une épidémie de cas symptomatiques, soient
détectés pendant la saison des pluies, est en faveur de la première hypothèse d’impact du
21

climat sur l’invasion plutôt que sur la transmission (Blakebrough et al., 1982; Greenwood,
1999).
Plusieurs études quantitatives ont abordé cette question du lien entre méningite et
climat, sous différents angles d’attaque. Ces études ont recherché des déterminants
climatiques : (i) de la localisation géographique des épidémies, (ii) de la saisonnalité de la
méningite à méningocoque (démarrage, pic et fin de la saison) ou (iii) des variations inter-
annuelles de l’incidence. En raison de la disponibilité des données climatiques à des échelles
spatiales et temporelles agrégées, ces études ont pour la plupart été réalisées au niveau
populationnel plutôt qu’individuel. Molesworth et al. ont montré que la localisation
géographique des épidémies de méningite à méningocoque en Afrique sur l’ensemble de la
période 1841-1999 était corrélée au profil saisonnier de l’humidité absolue et au type de
couverture végétale à l’échelle des districts (Molesworth et al., 2003). La plupart des auteurs
s’accordent également à dire que la saisonnalité des épidémies de méningite à
méningocoque est principalement déterminée par la dynamique temporelle du climat
subsaharien, même si les variables climatiques impliquées varient d’une étude à l’autre.
Jackou-Boulama et al. ont montré, au Niger, que les mois de pluviométrie élevée étaient
ceux ayant eu les incidences les plus faibles entre 1996 et 2002 (Jackou-Boulama et al.,
2005). Sultan et al. ont montré, sur huit années, que la semaine de démarrage des épidémies
au Mali était corrélée avec la semaine du « maximum de l’hiver », un indice défini par les
auteurs et basé sur la vitesse du vent (Sultan et al., 2005). Agier et al. ont démontré un lien
fort entre la saisonnalité des poussières atmosphériques et celle des méningites à l’échelle
des districts, avec une différence de phase moyenne de 11 jours (Agier et al., 2013). Martiny
et Chiapello ont observé au Niger et au Mali une coïncidence entre le démarrage de la
saison des méningites et l’arrivée des poussières dans les couches basses de l’atmosphère
d’une part, et entre la fin de la saison des méningites et la remontée de l’humidité liée à
l’arrivée de la mousson d’autre part (Martiny and Chiapello, 2013). L’humidité, les pluies, le
vent et les poussières atmosphériques subissent tous des changements marqués au moment
de ces transitions climatiques d’une saison à l’autre, de même que les comportements
sociaux, rendant très difficile d’identifier, s’il existe, le facteur environnemental clé de la
saisonnalité (Cartwright, 1995b). Au-delà de ces effets sur la localisation géographique des
épidémies et sur leur saisonnalité, le rôle des conditions climatiques sur les variations
d’amplitude de l’incidence d’une saison à une autre dans une région à risque, et par
prolongement, sur le risque et l’intensité des épidémies localisées, partage encore plus la
communauté scientifique en raison d’associations faibles et variables d’un modèle à un
22

autre. Au Niger, Yaka et al. ont partiellement relié les variations de l’incidence annuelle à
l’échelle du pays aux variations de la composante nord-sud du vent en novembre et
décembre (Yaka et al., 2008). L’incidence annuelle dans quatre pays africains à l’échelle des
districts, était notamment corrélée avec un déficit de pluies en janvier et un excès de
poussières en octobre avant le démarrage de la saison des méningites (Thomson et al.,
2006). Par ailleurs, l’évolution de l’incidence mensuelle dans un district du Ghana a pu être
modélisée par une combinaison de plusieurs variables climatiques (dont la température) et
non-climatiques (Dukic et al., 2012) sur une période de 10 ans. Ces résultats ambigus, voire
discordants, s’expliquent probablement en partie par la corrélation entre les variables
climatiques et par la diversité des modèles statistiques, des échelles spatio-temporelles, des
covariables et des pays étudiés.
Facteurs socio-démographiques
Enfin, différents facteurs socio-démographiques semblent jouer un rôle dans
l’épidémiologie des méningites, et en particulier sur le risque de transmission. Les
mouvements et rassemblements de population à grande échelle, tels que les pèlerinages et
les migrations, facilitent la circulation de souches virulentes à l’intérieur d’un pays ou d’un
pays à l’autre, comme la diffusion d’une souche W en 2000 parmi les pèlerins revenant de la
Mecque (Wilder-Smith et al., 2003). Des épidémies sont également observées dans des
contextes particuliers de milieux fermés et de grande densité humaine, tels que des camps
militaires (Cartwright, 1995a; Yazdankhah and Caugant, 2004) ou des camps de réfugiés
(Santaniello-Newton and Hunter, 2000). Dans une étude menée au Niger, les taux de
réapparition des cas de méningite étaient plus élevés dans les districts les plus peuplés et le
long des routes principales (Bharti et al., 2012), probablement en raison d’un taux plus
élevé de contact humain. À l’échelle individuelle, l’acquisition de l’infection dépend aussi
de la probabilité d’être exposé et d’inhaler des gouttelettes infectieuses, et donc de la
proximité avec un porteur ou un cas de méningite. Ainsi, dans des études menées dans des
contextes africains, aller à l’école (Raghunathan et al., 2006), partager un repas avec plus de
7 personnes, participer à une réunion de plus de 10 personnes, ou avoir dans sa famille un
cas récent de méningite (Mueller et al., 2008) a été associé avec le risque de portage.
Partager sa chambre (Hodgson et al., 2001) ou son habitation (Mutonga et al., 2009) avec
un cas de méningite a été associé avec le risque d’infection. La surpopulation du foyer
pourrait, de façon similaire, augmenter le risque d’exposition à une co-infection virale
respiratoire (Moore et al., 1990). Dans deux études menées au Ghana et au Kenya,
23

l’exposition aux fumées de cuisine (poêles à bois) a été retrouvée comme facteur de risque
de la maladie, mais pas l’exposition à la fumée de tabac (Hodgson et al., 2001; Mutonga et
al., 2009), contrairement à des études européennes (Haneberg et al., 1983; Stuart et al.,
1989). Un statut économique bas pourrait augmenter le risque d’infection via différents
mécanismes (Cartwright, 1995a) mais, probablement en raison d’une pauvreté très
répandue, aucune étude menée en Afrique subsaharienne n’a montré d’association
significative avec le statut socio-économique (Moore, 1992).
Modèles hypothétiques du processus épidémique
Au final, comment l’interaction entre tous ces facteurs de risque, nombreux et
variés, peut-elle créer la dynamique épidémiologique caractéristique observée dans la
ceinture de la méningite ? Ce processus épidémique est encore très mal compris : comment
expliquer de tels contrastes d’incidence entre la saison sèche et la saison des pluies, de telles
vagues épidémiques irrégulières et imprévisibles, et des foyers hautement localisés ? Notre
compréhension de l’épidémiologie de la méningite est entravée notamment par une
connaissance limitée des mécanismes immunitaires et par le fait qu’une partie entière de
l’iceberg de la méningite, à savoir les porteurs, échappe aux systèmes de surveillance
classiques basés sur les cas symptomatiques. Une augmentation d’incidence observée peut
en effet être causée par des facteurs de risque ayant un effet sur le nombre de porteurs
(augmentation de transmission et colonisation) ou sur le ratio cas-porteurs (augmentation
du risque d’invasion étant donnée la colonisation), voire les deux simultanément. Deux
modèles hypothétiques principaux ont été proposés pour expliquer le processus
épidémique.
En 1992, Moore propose comme condition nécessaire au déclenchement d’une
épidémie l’introduction d’un nouveau clone dans une population susceptible, sans
immunité de groupe dirigée contre ce clone (Moore, 1992). Une combinaison de facteurs
supplémentaires à l’arrivée d’un nouveau clone, tels qu’une humidité faible et des infections
respiratoires concomitantes, sont nécessaires pour accroître la probabilité d’invasion chez
les porteurs et ainsi créer une épidémie. L’épidémie s’éteint lorsque l’augmentation du
portage liée à la diffusion du clone dans la population conduit à une immunité de groupe
suffisante. Quelques années plus tard, un nouveau clone arrive, répétant le cycle. Les
changements dans le taux d’invasion entre la saison sèche et la saison des pluies sont
responsables de la saisonnalité des épidémies. Ces facteurs saisonniers (humidité faible et
infections respiratoires concomitantes) découpent la vague épidémique pluri-annuelle en
24

une succession de pics épidémiques annuels. Moore rejette la possibilité que des épidémies
répétées soient causées par un même clone, affirmant que cela nécessiterait des intervalles
de temps entre vagues épidémiques plus longs que ceux que l’on observe, pour que
l’immunité de groupe envers ce clone baisse suffisamment.
Mueller et Gessner suggèrent un autre « modèle explicatif hypothétique », formalisé
par quatre états d’incidence : une incidence endémique faible pendant la saison des pluies,
une hyper-endémicité systématique pendant la saison sèche, sur laquelle s’ajoutent des
épidémies occasionnelles géographiquement restreintes, et enfin des vagues épidémiques,
constituées d’épidémies localisées plus nombreuses ou plus intenses, s’étalant sur plusieurs
années au niveau régional (Mueller and Gessner, 2010). La transition de l’état endémique à
l’état hyper-endémique (saisonnalité) est causée par l’augmentation du risque d’invasion due
aux conditions climatiques irritant la muqueuse pharyngée. Localement, à l’échelle d’une
communauté, la transition de l’état hyper-endémique à l’état épidémique est causée par
l’augmentation de la colonisation pharyngée et de la transmission, potentiellement due à
des épidémies d’infections virales respiratoires. Les vagues épidémiques peuvent être
observées si les épidémies de co-infections virales ont une diffusion géographique plus
étendue, ou si une nouvelle souche de méningocoque, échappant à l’immunité préexistante
ou démontrant une plus grande virulence ou transmissibilité, est introduite dans la
population.
2.1.7 Cas du Niger : contexte général et épidémiologie de la méningite
Afin de bien saisir le contexte local dans lequel se situe cette thèse, nous donnons
ici une présentation générale du Niger d’un point de vue géographique, socio-
démographique et sanitaire, puis une présentation de la situation du pays vis-à-vis des
épidémies de méningite à méningocoque.
Contexte géographique, socio-démographique et sanitaire
Le Niger est un état enclavé au cœur du Sahel et du Sahara (Figure 3), le plus vaste
d’Afrique de l’Ouest (Table 1). À l’exception du massif de l’Aïr culminant à 2 000 m
d’altitude et des hauts plateaux du Djado, le Niger est une vaste pénéplaine, au relief peu
contrasté, dont l’altitude moyenne est de 350 m. Un seul grand cours d’eau permanent, le
fleuve Niger, traverse l’ouest du pays sur 500 km.
25

Le climat du Niger est un climat tropical semi-aride caractérisé par deux saisons
principales : une saison des pluies de juin à septembre et une longue saison sèche qui peut
être subdivisée en une saison chaude (octobre à mi-novembre, température moyenne de
35°), une saison « fraîche » (fin novembre à février) où les températures nocturnes peuvent
descendre en dessous de 10°C, et une saison très chaude (mars à mai) où la température
peut atteindre 46°C à l’ombre. L’alternance des saisons est causée par le mouvement nord-
sud du front intertropical : pendant la saison humide, les pluies sont apportées par les vents
de mousson soufflant du sud-ouest alors qu’à l’inverse, les vents secs et chargés en
poussières (« Harmattan »), soufflent en provenance du Sahara pendant la saison sèche. Il
existe quatre zones agro-climatiques principales, avec du nord au sud (Figure 3): la zone
saharienne caractérisée par une pluviométrie annuelle inférieure à 150 mm, la zone sahélo-
saharienne, qui convient très bien au nomadisme et où la principale activité est l’élevage
itinérant, la zone sahélienne, majoritairement à vocation agricole, caractérisée par une
pluviométrie annuelle comprise entre 300 et 600 mm et la zone sahélo-soudanienne, la
mieux adaptée à l’agriculture.
Figure 3. Cartographie du Niger et principales zones agro-climatiques (créé d’après (Gazibo et
al., n.d.) et (SWAC and OECD, 2009)).
26

Table 1. Profil du Niger, 2012.
Indicateurs clés Valeur
Superficie* 1 267 000 km²
Population* 17,16 millions
Densité de population* 13,5 habitant/km²
Proportion de population rurale* 83 %
Taux de croissance démographique* 3,9 %
Croissance économique* 6,1 %
Revenu national brut par habitant† 760 $
Taux de fécondité* 7,6
Espérance de vie à la naissance† 59 ans
Mortalité infanto-juvénile (< 5 ans)* 127/1 000
Mortalité maternelle* 535/100 000
Sources : * (INS, 2013) ; † (WHO, 2014)
Handicapé par son enclavement, le Niger est classé parmi les pays les moins
avancés (UN CDP, 2013). Son économie, qui repose sur l’agriculture vivrière et l’élevage,
est tributaire des phénomènes de sécheresse qui caractérisent la région du Sahel (Olivier de
Sardan, 2011). Le Niger comprend les plus importantes réserves d’uranium du monde, dans
la région d’Arlit, dont il tire la plupart de ses revenus liés à l’exportation. Son économie
reste fragile et le gouvernement dépend largement de l’aide bilatérale et internationale pour
ses dépenses de fonctionnement et les investissements publics. La population du Niger est
inégalement répartie sur le territoire, les trois quarts étant concentrés au sud du 16ème
parallèle, dans les régions sahéliennes. Ainsi, la densité de population varie de 114,5
habitants/km² dans la région de Maradi à moins de 5 habitants/km² dans les départements
d’Agadez et Diffa. Cette population est marquée par son extrême jeunesse, les moins de 15
ans représentant la moitié de la population totale (WHO, 2013a). Les indicateurs sociaux
sont parmi les plus faibles du monde ; le Niger est au dernier rang du classement 2012 de
l’Indice de Développement Humain (UNDP, 2012). Carrefour d’échanges entre l’Afrique
du Nord et l’Afrique subsaharienne, le pays abrite différentes ethnies, parmi lesquelles les
Haoussas (53 %), les Djermas-Songhaïs (19 %), les Touaregs (11 %), les Peuls (10 %) et les
Kanouris (5 %) (Gouvernement du Niger, 2013). La population nigérienne est dans sa
grande majorité musulmane (99 %) (INS, 2013).
Les quelques indicateurs sanitaires présentés dans la Table 1 montrent que la
situation sanitaire du pays est fragile. Cependant, on peut noter certains progrès réalisés
depuis quelques années. Par exemple, la couverture vaccinale s’est améliorée au cours des
27
dernières années avec l’intensification des campagnes de vaccination. Ainsi, une baisse
sensible de la mortalité infanto-juvénile a été enregistrée : en 2012, environ un enfant sur
huit (127 ‰) n’atteint pas son cinquième anniversaire contre un enfant sur trois (318 ‰)
en 1992. Parmi les enfants de 12-23 mois, 52 % sont complètement vaccinés aujourd’hui,
proportion également en nette augmentation depuis 2006 où elle n’était que de 29 % (INS,
2013). Les maladies infectieuses demeurent les principales causes de décès (90 % des
années de vie perdues) (WHO, 2013b). La population est exposée à une grande variété de
maladies infectieuses à la fois pendant la saison sèche (méningite, rougeole, infections
respiratoires aiguës dont pneumonie…) et pendant la saison des pluies (paludisme,
choléra…). En particulier, le paludisme est la première cause de morbidité et de mortalité
au Niger. La malnutrition demeure également un problème de santé publique ; elle varie
traditionnellement avec la période de soudure et résulte également de maladies infectieuses
comme les diarrhées, fréquentes chez l’enfant, dans un contexte de système de soins
déficient et de connaissances insuffisantes des besoins nutritionnels du jeune enfant (INS,
2013). Le nombre de médecins par habitant est très faible (1 pour 22 000 habitants, soit la
moitié de la norme OMS) avec une concentration dans la capitale Niamey au détriment des
zones rurales. Selon les régions, le taux d’accessibilité des services de santé dans un rayon
de 5 km varie de 36 % à Zinder à 79 % à Niamey (INS, 2012).
L’organisation du système de santé est calquée sur le découpage administratif du
pays, avec trois niveaux :
• l’administration centrale constituée par le cabinet du Ministre, le Secrétariat
Général, les Directions Générales et les Directions Nationales
• les huit Directions Régionales de la Santé Publique, au sein des huit régions
administratives (dont 6 possèdent un centre hospitalier régional)
• les 42 Districts Sanitaires répartis dans les 36 départements administratifs, les quatre
communautés urbaines de Zinder, Maradi, Agadez et les trois communes de
Niamey.
Au sein d’un district, on trouve principalement trois types de formations sanitaires : un
hôpital de district, des centres de santé intégrés (CSI) et des cases de santé, auxquels
s’ajoutent des cabinets et salles de soins privés. La Carte Nationale Sanitaire, créée en 2008
par le CERMES pour le compte du Ministère de la Santé Publique (MSP), a pour échelle de
base les aires de santé, zones géographiques qui regroupent les villages rattachés à un même
CSI.
28

Les épidémies de méningite à méningocoque au Niger
Le Niger se situe au cœur de la ceinture de la méningite. Il en possède donc les
principales caractéristiques épidémiologiques précédemment décrites et la méningite à
méningocoque y est une cause importante de morbidité et de mortalité. Plusieurs centaines
ou milliers de cas suspects sont notifiés chaque année : entre 453 et 43 203 sur la période
1960-2010, avec un taux de létalité rapporté moyen de 8,4 % (WHO, 2013a). Les épidémies
durent en général cinq mois, de janvier à mai, au cours de la deuxième moitié de la saison
sèche.
Depuis le début du 20ème siècle, le Niger a été traversé par des vagues successives de
méningite à méninogocoque (Campagne et al., 1999; Collard et al., 2011; Lapeyssonnie,
1963). Lapeyssonnie a observé que, de 1907 à 1962, les épidémies procédaient par cycle,
évoluant le plus souvent en trois ans, séparées par des périodes d’accalmie (cas
sporadiques) de durées variables (de 2 à 8 ans). Aujourd’hui, ce schéma classique tend à
s’estomper (Figure 4). La plus grande vague épidémique connue date des années 1993-
1996.
Figure 4. Séries temporelles (nombre de cas, incidence et taux de létalité) des cas suspects de
méningite notifiés par an, Niger, 1949-2010 (Sources : CERMES et (WHO, 2013a)).
Les épidémies sont majoritairement causées par le sérogroupe A, les souches
analysées par MLST depuis les 10 dernières années appartenant principalement au
séquence-type ST-7 (Collard et al., 2013a), mais d’autres sérogroupes entrent
progressivement en jeu. Le sérogroupe W, observé dans le pays depuis le début des années
1980 (Denis et al., 1982) a révélé son potentiel épidémiogène en 2002, lors d’une épidémie
de grande ampleur qui a éclaté au Burkina Faso (environ 13 000 cas suspects) et touché
29

également le Niger dans une moindre mesure (Boisier et al., 2005; Parent du Châtelet et al.,
2002). De petits foyers épidémiques causés par le sérogroupe X ont également été observés
à Niamey en 1990 (Campagne et al., 1999) et de 1995 à 2000 (Djibo et al., 2003). Lors de
l’épidémie de 2006, le sérogroupe X a été responsable de la moitié des cas de méningite à
méningocoque, constituant la plus grande incidence jamais observée de NmX dans le
monde (Boisier et al., 2007).
La vaccination de la population âgée de 1 à 29 ans par le vaccin conjugué contre le
sérogroupe A, MenAfriVacTM, a commencé au Niger fin 2010 et s’est achevée un an plus
tard (Caini et al., 2013). L’impact de cette vaccination sur les autres sérogroupes est
inconnu. Depuis 2010, le sérogroupe W est le sérogroupe de méningocoque
majoritairement identifié au Niger (Collard et al., 2013a).
Il faut également noter que d’autres agents pathogènes sont incriminés dans les
méningites d’origine bactérienne, tels que Sp et Hib, qui représentaient respectivement
13,1 % et 4,7 % des cas confirmés de méningite bactérienne aigüe sur la période 2003-2009
au Niger (Article I).
Les données quantitatives sur la morbidité et la mortalité des méningites sont
collectées de façon hebdomadaire par un réseau national coordonné par la Direction de la
Surveillance et la Riposte aux Épidémies (DSRE) rattachée au MSP. Le signalement des cas
se fait sur la base de cas suspects cliniquement. Les données sont recueillies suivant une
remontée de l’information du niveau local (formations sanitaires) au niveau national : les
cas suspects sont notifiés par les CSI aux districts sanitaires, qui compilent les données et
les transmettent aux Directions Régionales de Santé Publique, qui les transmettent à la
DSRE (Figure 5).
En complément de cette surveillance épidémiologique, le CERMES est le
laboratoire national responsable de la surveillance microbiologique des méningites au
Niger, surveillance étendue à tout le pays depuis 2002, à la suite du transfert des techniques
de diagnostic moléculaire des méningites par l’Institut Pasteur (Sidikou et al., 2003). Les
données issues de cette surveillance renforcée sont mises à profit dans deux domaines : (i)
la recherche, dans l’objectif de mieux comprendre l’épidémiologie de Nm et ses évolutions
dans la ceinture de la méningite, (ii) la santé publique, en mettant à la disposition des
autorités sanitaires des informations valides pour l’ensemble du pays, notamment sur les
sérogroupes en circulation pour aider au choix du vaccin en cas d’épidémie. Ce système de
30
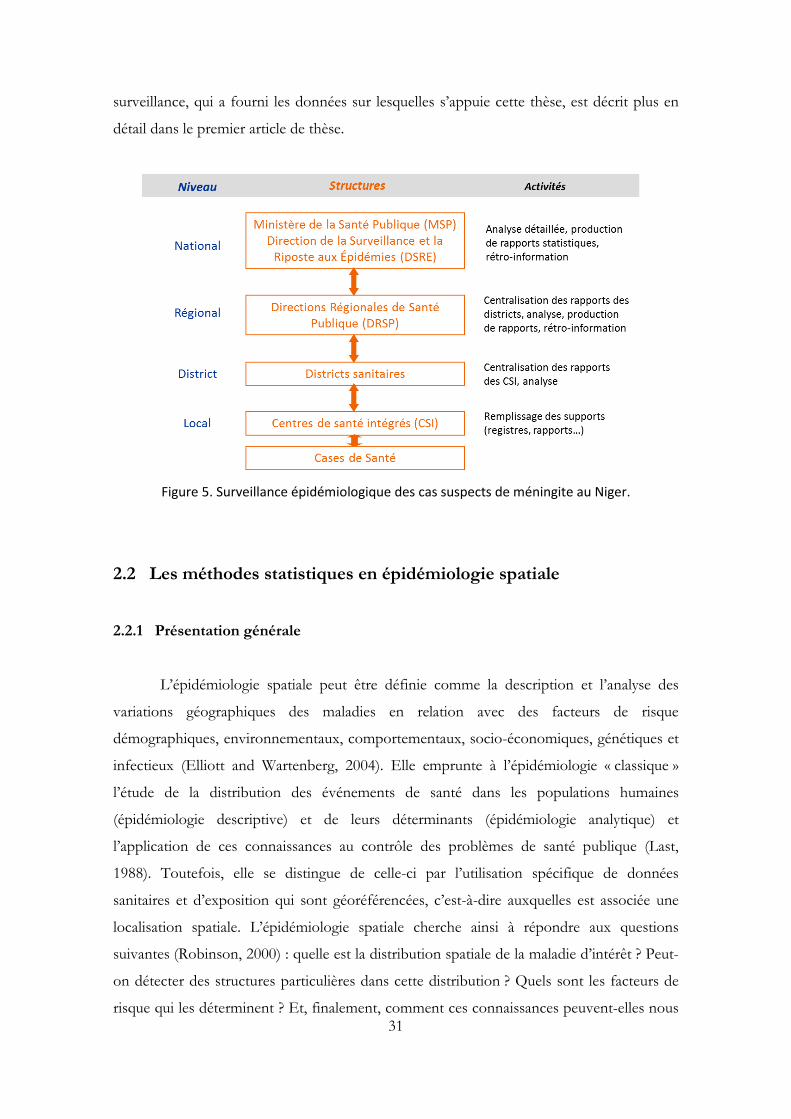
surveillance, qui a fourni les données sur lesquelles s’appuie cette thèse, est décrit plus en
détail dans le premier article de thèse.
Figure 5. Surveillance épidémiologique des cas suspects de méningite au Niger.
2.2 Les méthodes statistiques en épidémiologie spatiale
2.2.1 Présentation générale
L’épidémiologie spatiale peut être définie comme la description et l’analyse des
variations géographiques des maladies en relation avec des facteurs de risque
démographiques, environnementaux, comportementaux, socio-économiques, génétiques et
infectieux (Elliott and Wartenberg, 2004). Elle emprunte à l’épidémiologie « classique »
l’étude de la distribution des événements de santé dans les populations humaines
(épidémiologie descriptive) et de leurs déterminants (épidémiologie analytique) et
l’application de ces connaissances au contrôle des problèmes de santé publique (Last,
1988). Toutefois, elle se distingue de celle-ci par l’utilisation spécifique de données
sanitaires et d’exposition qui sont géoréférencées, c’est-à-dire auxquelles est associée une
localisation spatiale. L’épidémiologie spatiale cherche ainsi à répondre aux questions
suivantes (Robinson, 2000) : quelle est la distribution spatiale de la maladie d’intérêt ? Peut-
on détecter des structures particulières dans cette distribution ? Quels sont les facteurs de
risque qui les déterminent ? Et, finalement, comment ces connaissances peuvent-elles nous 31

servir à améliorer la santé des populations en développant des stratégies d’intervention
efficaces ?
L’épidémiologie spatiale fait partie d’une longue tradition d’analyses géographiques
datant des années 1800 où des cartes de maladies ont commencé à émerger dans différents
pays (Walter, 2000), pour caractériser la distribution géographique des maladies et les
facteurs de risque qui pourraient l’expliquer. Les premiers travaux ont souvent concerné
des maladies infectieuses, telles que la fièvre jaune à New-York avant 1800 (exemple
rapporté par Stevenson ( 1965)) et le choléra en Europe (Petermann, 1852). L’un des
exemples « historiques » les plus célèbres est l’analyse de l’épidémie de choléra à Londres au
XIXe siècle par John Snow (Snow, 1855). Le simple fait de reporter les cas sur un plan de
quartier permit à celui-ci d’identifier le lieu de contamination, d’améliorer les connaissances,
d’identifier le mode de transmission de la maladie et, surtout, d’intervenir pour arrêter
l’épidémie (Guégan and Choisy, 2009). Au cours des siècles suivants, la discipline a gagné
en complexité, en sophistication et en utilité, en faisant notamment appel à des méthodes
de statistique spatiale développées dans d’autres disciplines telles que l’industrie minière, la
géologie, l’agronomie, la météorologie… (Cressie, 1993).
Actuellement, l’intérêt croissant des épidémiologistes et statisticiens pour cette
discipline reflète en partie l’intérêt de la société pour les questions environnementales et
leurs liens avec la santé des populations (Lawson, 2006). De telles études d’épidémiologie
spatiale nécessitent des données précises sur les populations, les états de santé et les
expositions environnementales combinées à des méthodes statistiques adaptées (Beale et
al., 2008). L’essor récent des outils informatiques, et notamment des systèmes
d’information géographique (SIG), depuis une vingtaine d’années, a grandement simplifié la
manipulation de données spatialisées (recueil, stockage, analyse, visualisation, etc.),
permettant de prendre en compte plus facilement la dimension spatiale dans l’étude des
maladies (Gattrell and Loytonen, 1998). En particulier, l’utilisation des SIG facilite l’analyse
des relations entre environnement et santé grâce aux possibilités d’analyse spatiale (calcul
de distance, de superficie, etc.) et d’intégration d’objets géographiques de nature variée,
ainsi que la mise à disposition de résultats sous forme de cartes de risque. Outils de
communication, les SIG sont également employés de manière opérationnelle pour la
surveillance épidémiologique (Nuttall et al., 1998). Un autre développement récent, celui
des satellites d’observation de la Terre, a eu un impact considérable sur la façon dont nous
32

pouvons aujourd’hui explorer les problèmes épidémiologiques. Un grand nombre de
données environnementales de résolution temporelle et spatiale fine est rendu accessible
par la télédétection. De nombreux paramètres environnementaux (indice de végétation,
température, occupation du sol, etc.) peuvent ainsi être extraits à partir d’images de
télédétection et reliés à la distribution des cas ou des vecteurs de maladies (Hay, 2000). Un
des premiers articles en la matière, datant de 1970, qualifie d’ailleurs ces outils de
« nouveaux yeux pour les épidémiologistes » (Cline, 1970). Depuis, l'utilisation des SIG et
des images satellites dans les problèmes de santé publique a suscité un intérêt croissant
(AvRuskin et al., 2004; Beck et al., 2000; Hugh-Jones, 1989; Washino and Wood, 1994), et
ce pour des maladies très différentes d’un point de vue épidémiologique : le choléra au
Bangladesh (Lobitz et al., 2000), le paludisme au Kenya (Hay et al., 1998), la
trypanosomiase humaine ou animale en Afrique (De La Rocque et al., 2001; Rogers, 2000),
la maladie de Lyme aux États-Unis (Dister et al., 1997) ou encore la schistosomiase en
Égypte (Malone et al., 1994).
L’analyse de données spatiales diffère de l’analyse de données classiques par la
nécessité d’inclure explicitement l’information spatiale dans les modèles (Robinson, 2000).
L’une des raisons principales vient du fait que « chaque phénomène est relié à tous les
autres, mais des phénomènes proches dans l’espace auront tendance à être davantage liés
que des phénomènes éloignés ». Cette notion de dépendance spatiale, dans toutes les
directions, que Tobler appelle en 1970 la « première loi de la géographie » (Tobler, 1970)
peut être moins intuitive que la dépendance temporelle, qui est fondée sur la notion de
passé (relation d’ordre naturel) et dans laquelle l’antériorité implique souvent la causalité.
Néanmoins, nombreux sont les processus écologiques (tels que des facteurs
environnementaux) et épidémiologiques (tels que la transmission locale d’un agent
infectieux) qui peuvent être à l’origine de l’existence d’une structure spatiale dans les
données de santé (Ostfeld et al., 2005). La valeur d’une variable en une position
géographique donnée est ainsi souvent corrélée à celles dans les positions voisines ; c’est ce
qui fait que « spatial is special » (Banos, 2001).
2.2.2 Types de données
En statistique spatiale, trois grands types de données peuvent être définis, faisant
appel à des méthodes d’analyse différentes : les données ponctuelles, les données agrégées
33

et les données géostatistiques (Cressie, 1993; Elliott et al., 2000a; Guyon, 2007; Lawson,
2006). Ces données se distinguent par la répartition des sites où sont collectées les
observations et la nature de l’ensemble spatial S étudié, S appartenant à un espace euclidien ℝd de dimension d généralement égale à 2 (espace bi-dimensionnel).
Les données ponctuelles
On parle de données ponctuelles lorsque la répartition spatiale des sites où ont lieu
les observations est la réalisation d’un processus ponctuel spatial observé dans la fenêtre S.
Un processus ponctuel spatial fait référence à un processus stochastique qui génère un jeu
de localisations à l’intérieur d’une région d’étude. En épidémiologie, ces données
concernent généralement les résidences des patients ayant la maladie d’intérêt, dont la
localisation spatiale exacte est définie par leurs coordonnées géographiques (latitude-
longitude ou coordonnées cartésiennes) ou leur adresse postale. Les modèles de base pour
ce type de données sont les processus ponctuels de Poisson. Ces données sont souvent
difficiles à obtenir, en raison des coûts associés à leur collecte, des difficultés liées à
l’échantillonnage aléatoire et des problèmes de confidentialité qui peuvent en découler.
Les données agrégées
Dans ce cas, S est un sous-ensemble discret et fixé, contenant une collection
dénombrable de localisations de ℝ² qui représentent en général des unités géographiques
d’un réseau structuré (régulier ou irrégulier). C’est le cas le plus couramment rencontré en
épidémiologie, lorsque les données de santé sont disponibles sous forme de résumé agrégé
(nombre de cas, nombre de décès…) par unité géographique. Ces données sont mesurées à
l’échelle de régions contiguës dont les frontières sont le plus souvent définies
administrativement (e.g. commune, département, pays…). Ces données posent moins de
problème de confidentialité et sont plus facilement accessibles que les données
individuelles car elles constituent la majorité des données collectées en routine par les
systèmes de surveillance.
Les données géostatistiques
Les données sont de type géostatistique si S est un sous-ensemble continu de ℝ² et
la variable d’intérêt est observée uniquement en un nombre fixé de localisations spatiales
choisies a priori. Cette approche, qui tire son origine de la géologie (Matheron, 1963), est
principalement utilisée en sciences environnementales (données de stations
34

météorologiques, données de porosité d’un sol…) mais commence à être appliquée plus
fréquemment en épidémiologie (Diggle et al., 2002; Goovaerts, 2006). Des méthodes
d’interpolation telles que le krigeage, basées notamment sur l’estimation d’un variogramme,
sont alors utilisées pour estimer le risque dans les localisations non échantillonnées
(Cressie, 1993).
2.2.3 Catégories d’études
L’épidémiologie spatiale peut être divisée en trois branches principales, qui reflètent
les différents besoins des épidémiologistes et spécialistes de santé publique, mais qui sont
bien souvent étroitement liées (Lawson, 2006) : la représentation cartographique des
maladies, l’analyse d’agrégation et la détection d’agrégats, et les études de corrélation
écologique.
La représentation cartographique des maladies
Cette branche de l’épidémiologie spatiale permet de décrire les variations spatiales
et spatio-temporelles du risque sur une carte. Elle fournit un résumé visuel d’informations
géographiques complexes et permet d’identifier dans les données des structures spatiales
qui pourraient être manquées par des présentations tabulaires. Les cartes de risque peuvent
être utilisées pour mettre en évidence des zones de risque élevé, pour aider les autorités de
santé publique à identifier les besoins des populations et cibler l’allocation des ressources,
ou pour générer des hypothèses sur l’étiologie d’une maladie en les comparant avec des
cartes de facteurs d’exposition (Elliott and Wartenberg, 2004). Le choix de l’échelle spatiale,
de la méthode de discrétisation des données ou encore de la façon de les représenter
(couleurs, symboles, etc.) sont des questions importantes à considérer lors de la création
d’une carte pour en faciliter la lecture sans biaiser l’interprétation (Lawson, 2006; Rezaeian
et al., 2007).
Lorsque l’on dispose de données agrégées par région, il est commun de représenter
sur ces cartes des ratios standardisés de morbidité ou mortalité (RSM) introduits par Howe
(1963), qui correspondent au nombre de cas observés dans chaque région divisé par le
nombre de cas attendu. Ce dernier est calculé en appliquant à la population de la région les
taux spécifiques par âge ou par sexe de la population générale (standardisation indirecte).
Ces ratios, estimations du « vrai » risque relatif dans chaque région, constituent souvent la
base des atlas de maladies (Cliff and Haggett, 1989; Pickle et al., 1999).
35

Au-delà d’une simple représentation des taux de maladies, la cartographie consiste
souvent à éliminer de la carte les variations aléatoires pour révéler la structure sous-jacente
du risque (Lawson, 2006). Notamment, lorsque les unités spatiales sont faiblement
peuplées et que la maladie d’intérêt est relativement rare, les taux estimés peuvent être
particulièrement instables. Des méthodes basées sur les statistiques bayésiennes (Clayton
and Bernardinelli, 1992) ont été développées pour produire des estimations plus fiables.
Ces méthodes consistent en un « lissage » plus ou moins important des taux les plus
instables en « empruntant de l’information » aux régions plus peuplées. Le RSM lissé est
alors un compromis entre le RSM brut et la moyenne globale (sur toute la carte) ou locale
(sur les régions voisines). Cependant, même si les taux bruts peuvent produire des cartes
« bruitées » difficiles à interpréter, des cartes trop lissées peuvent produire une surface de
risque homogène et masquer la vraie distribution du risque (Beale et al., 2008). Les mêmes
modèles statistiques sont utilisés dans les études de corrélation géographique mais avec des
objectifs différents (Elliott et al., 2000b).
L’analyse d’agrégation et la détection d’agrégats
Ces méthodes consistent à identifier les caractéristiques de la distribution spatiale
d’une maladie en évaluant d’une part la tendance globale à l’agrégation spatiale des cas
d’une pathologie dans une région d’étude, et d’autre part en identifiant la localisation
d’éventuels agrégats spatiaux significatifs (Wakefield et al., 2000). Ces méthodes sont
présentées plus en détail au 2.2.4.
Les études de corrélation écologique
Ces études ont pour objectif d’examiner, au niveau de groupes d’individus définis
sur une base géographique, la relation entre les variations géographiques d’un indicateur de
santé et l’exposition à des facteurs de risque environnementaux, socio-économiques,
démographiques ou encore comportementaux (Richardson and Monfort, 2000). Les
méthodes associées à ce type d’études sont exposées au 2.2.5.
Comme on le verra par la suite, la seule dimension spatiale est souvent insuffisante
pour décrire et expliquer un phénomène de santé ; la dimension temporelle doit alors
également être prise en compte. Les méthodes d’épidémiologie spatiale peuvent pour la
plupart être étendues au domaine spatio-temporel.
36

Les travaux de cette thèse s’appuient sur une base de données de cas de méningite
agrégés à l’échelle des aires de santé. Par la suite, nous développons donc uniquement les
méthodes statistiques adaptées à l’analyse de ce type de données agrégées. Nous présentons
d’une part les méthodes de détection d’agrégats (utilisées dans l’Article I), et d’autre part les
méthodes de corrélation écologique (utilisées dans l’Article II).
2.2.4 Agrégation et détection d’agrégats
En épidémiologie spatiale, un agrégat (« cluster ») se définit comme « un
regroupement géographiquement délimité de cas, d’une taille et d’une concentration
suffisante pour rendre improbable qu’il se soit produit aléatoirement » (Knox, 1989). Cette
définition peut également être élargie aux agrégats spatio-temporels qui désignent des cas
« anormalement » regroupés à la fois dans l’espace et dans le temps, par exemple lors de
pics épidémiques localisés (Kulldorff and Nagarwalla, 1995).
L’objectif de l’analyse de l’agrégation et des agrégats est de mieux comprendre la
distribution géographique des maladies et d’en étudier l’hétérogénéité spatiale afin de
détecter les zones à risque et de générer des hypothèses étiologiques. L’agrégation des cas
peut ainsi suggérer une étiologie infectieuse comme ce fut le cas pour la maladie de
Hodgkin (Alexander, 1992), une source d’infection ou de contamination commune, ou la
présence de facteurs de risque localisés (environnementaux, sociologiques, etc.)
Les premiers développements de cette branche de l’épidémiologie spatiale sont nés
de l’application des tests statistiques pour l’agrégation spatio-temporelle. Les travaux
fondateurs de Knox et Bartlett (1964) et de Mantel (1967) dans le champ des tests spatio-
temporels d’agrégation ont précédé la plupart des développements en matière de tests
purement spatiaux (Lawson, 2006). Ensuite, de nombreuses méthodes statistiques ont été
développées pour explorer les propriétés de la distribution spatiale d’une maladie et tester si
la distribution des cas est uniquement due au hasard (e.g. Besag and Newell, 1991; Cliff and
Ord, 1973; Cuzick and Edwards, 1990; Kulldorff, 1997; Tango, 1995). Il convient dans un
premier temps de distinguer deux types de tests : les tests globaux, ou non spécifiques
(« tests for clustering »), et les tests locaux, ou spécifiques (« tests for clusters »).
Les tests globaux d’agrégation
Les tests globaux permettent d’évaluer la tendance globale à l’agrégation des cas
d’une pathologie dans une région d’étude et de rejeter l’hypothèse nulle de distribution
37

aléatoire pour le jeu de données dans son ensemble. Ce type d’analyse peut prendre une
variété de formes. Kulldorff liste plus d’une centaine de méthodes globales (Kulldorff,
2006). Parmi les tests globaux, certains consistent à tester l’existence d’une hétérogénéité
spatiale globale en termes de sur-dispersion des données (hétérogénéité non corrélée), tel
que le test de Potthoff et Whittinghill (1966), tandis que d’autres évaluent l’existence d’une
hétérogénéité spatiale globale en termes de dépendance spatiale (hétérogénéité corrélée),
tels que les tests de Moran (1950), Geary (1954), Tango (1995) ou Whittemore (1987).
Le test de Moran mesure le degré d’autocorrélation spatiale du jeu de données dans
son ensemble. C’est l’indice d’autocorrélation spatiale le plus utilisé en santé publique
(Robinson, 2000). L’autocorrélation spatiale mesure l’intensité de la relation entre la
proximité des lieux et leur degré de ressemblance, ou plus simplement la ressemblance
entre unités géographiques voisines (Pumain and Saint-Julien, 2004). La statistique de
Moran, notée I, se présente sous la forme d’un rapport entre la covariance des valeurs de la
variable d’intérêt dans les unités spatiales voisines et la variance globale de cette variable,
selon la formule suivante :
où N est le nombre d’unités spatiales, Xi est la valeur de la variable d’intérêt dans l’unité i,
X est la moyenne des Xi et wij sont les poids spatiaux spécifiant la relation de proximité
entre deux unités voisines. Une première définition de la matrice de voisinage peut utiliser
l’approche topologique, où deux unités sont considérées comme voisines (wij = 1) si elles
sont contiguës (partage d’un point ou d’une frontière commune). Une deuxième approche,
basée sur la distance entre unités, permet d’introduire la notion d’échelle dans la
dépendance spatiale. Dans le calcul de l’indice de Moran, la relation entre chaque unité
voisine est par exemple pondérée par l’inverse de la distance entre leurs centroïdes. On
peut également introduire une distance critique au-delà de laquelle deux unités n’ont plus
d’influence l’une sur l’autre. L’avantage de cette approche est de pouvoir calculer l’indice
global de Moran pour différentes distances critiques et ainsi déterminer, si une structure
spatiale est détectée, à quelle échelle spatiale elle est la plus significative. Pour cela, un
corrélogramme représentant l’indice global de Moran en fonction de différentes distances
critiques permet d’identifier l’échelle d’organisation de la structure spatiale détectée dans le
jeu de données (Zaninetti, 2005). Cette information peut se révéler primordiale dans la
∑∑∑
−
−−=
i iij ij
jij iij
XXw
XXXXwNI
)²()(
))((
38

localisation ultérieure des agrégats : elle va permettre de sélectionner objectivement l’échelle
optimale pour rechercher la localisation des agrégats par les tests locaux.
Les tests locaux d’agrégation
Les tests locaux permettent d’identifier précisément la localisation des agrégats
spatiaux potentiels et de tester si ces derniers sont statistiquement significatifs. Lorsque
l’investigateur cherche à examiner l’existence d’un agrégat spatial en une localisation
particulière, où l’élévation supposée du risque est liée à une source pré-spécifiée (usine,
lignes électriques…), on parle de tests « focalisés » (Morris and Wakefield, 2000). Notre
travail s’inscrit dans le contexte des tests dits « non focalisés », où la localisation des
agrégats est inconnue a priori.
Prolongement direct des tests globaux d’autocorrélation spatiale, une première
catégorie de tests locaux non focalisés regroupe les indices locaux d’autocorrélation spatiale
(ou LISA, pour « Local Indicators of Spatial Association »), introduits par Anselin (1995). En
particulier, l’indice local de Moran (utilisé dans l’Article I) résulte de la décomposition de
l’indice global en ses composantes locales, mesurant ainsi l’autocorrélation spatiale d’une
unité donnée avec ses voisines, et permet d’identifier et de localiser les agrégats spatiaux sur
une carte. Si on étudie la répartition spatiale des taux d’incidence d’une pathologie, l’indice
local de Moran permet alors d’identifier quatre types de structures spatiales :
• Une aire à taux d’incidence élevé entourée d’aires à taux d’incidence élevé
également (autocorrélation spatiale positive), aire qualifiée de high-high dans la
littérature anglosaxonne
• Une aire high-low à taux d’incidence élevé dans un voisinage à taux d’incidence faible
(autocorrélation spatiale négative)
• Une aire low-low à taux d’incidence faible entourée d’aires à taux d’incidence faible
également (autocorrélation spatiale positive)
• Une aire low-high à taux d’incidence faible dans un voisinage à taux d’incidence élevé
(autocorrélation spatiale négative).
Dans l’optique de la détection d’agrégats spatiaux, l’intérêt des chercheurs se porte
principalement sur les deux premiers cas : des cas regroupés dans une unité spatiale
(agrégat formé d’une seule unité, aussi appelé singularité locale) ou des cas regroupés dans
plusieurs unités voisines (agrégat formé de plusieurs aires, aussi appelé point chaud).
Une seconde catégorie de tests locaux non focalisés regroupe les méthodes de
fenêtre mobile ou balayage spatial. Ces tests consistent à superposer un nombre de fenêtres
39

circulaires sur la zone d’étude et déterminer la significativité du nombre de cas contenus à
l’intérieur de chaque cercle pour détecter les zones de risque élevé (Wakefield et al., 2000).
Différentes méthodes existent, se distinguant entre autres par la construction de la fenêtre
qu’elles utilisent : la « geographical analysis machine » (GAM) développée par Openshaw (1987),
qui fut l’un des premiers algorithmes de balayage spatial, définit ces cercles en termes de
distance ; la méthode de Besag et Newell rectifie certains problèmes de la méthode
d’Openshaw et définit les cercles en termes de nombre de cas (Besag and Newell, 1991) ;
les statistiques de scan spatial développées par Turnbull (1990) et Kuldorff (1997) les
définissent en termes de taille de population. Des développements plus récents s’intéressent
à la détection d’agrégats de forme arbitraire et non plus seulement circulaire (Assunção et
al., 2006; Tango and Takahashi, 2005). Mais la méthode de balayage spatiale de Kulldorff
(utilisée dans l’Article I) reste l’un des outils les plus utilisés pour l’identification d’agrégats,
en partie grâce au logiciel libre SaTScan développé spécifiquement pour l’application de
cette méthode aux études épidémiologiques.
L’algorithme de scan spatial de Kulldorff réalise un balayage de toute la zone
d’étude grâce une fenêtre circulaire, placée successivement au centroïde de chaque unité
spatiale, et dont le diamètre varie de façon continue entre zéro et une valeur limite fixée par
l’utilisateur. Pour chaque fenêtre, le logiciel calcule la fonction du rapport de vraisemblance
selon un modèle de distribution choisi (loi de Poisson le plus couramment), pour tester si le
risque est plus élevé à l’intérieur de la fenêtre comparé à l’extérieur, sous l’hypothèse nulle
que le risque est uniforme dans la zone d’étude. L’agrégat le plus probable correspond à la
fenêtre pour laquelle on obtient le maximum du rapport de vraisemblance et le programme
classe les agrégats secondaires selon leur degré de significativité, obtenu par réplications de
Monte Carlo. La dimension temporelle peut également être prise en compte pour détecter
des agrégats spatio-temporels. L’algorithme fonctionne alors de la même manière que pour
le scan spatial, à la différence près que la fenêtre de balayage circulaire est remplacée par
une fenêtre cylindrique, de base circulaire et dont la hauteur correspond à la période de
temps de l’agrégation potentielle.
Plusieurs auteurs ont montré que les paramètres par défaut de SaTScan, qui fixent
la taille maximale des agrégats à 50 % de la population à risque, pouvaient être inappropriés
(e.g. Ball et al., 2008; Chen et al., 2008). Il est donc préférable d’utiliser une méthode pour
déterminer objectivement l’échelle optimale pour la recherche d’agrégats, telle que l’analyse
préalable des corrélogrammes de l’indice global de Moran. Au final, Zaninetti recommande
de suivre les trois étapes suivantes pour analyser la distribution spatiale des cas : étude de la
40

configuration spatiale par un indice d’autocorrélation spatiale globale, détermination de
l’échelle d’organisation de la structure spatiale observée par les corrélogrammes, puis
localisation des agrégats pour des méthodes de statistique spatiale locale (Zaninetti, 2005).
Par ailleurs, Anselin a comparé les différentes techniques d’analyse spatiale locale (Anselin,
2004) et a suggéré que le scan spatial de Kulldorff (1997) et l’indice local de Moran
(Anselin, 1995) soient utilisés conjointement pour l’analyse des agrégats spatiaux. D’autres
auteurs ont appliqué cette combinaison de méthodes avec succès pour analyser les
distributions spatiales de différentes maladies (Jacquez and Greiling, 2003; Rainey et al.,
2007; Sugumaran et al., 2009).
2.2.5 Études de corrélation écologique
Après la cartographie de la distribution d’une maladie et la caractérisation de ses
structures spatiales, la dernière finalité de l’analyse spatiale est de rechercher les facteurs de
risque de la maladie et de sa distribution spatiale. Les études dites « écologiques »
permettent de mettre en parallèle les variations géographiques d’une pathologie et de
variables d’exposition, à l’échelle de groupes (unités géographiques telles que commune,
district, région…) et ainsi d'examiner les éventuelles corrélations entre ces variations
(Guihenneuc-Jouyaux, 2002). Les mesures écologiques peuvent être de trois sortes : (i) des
données agrégées qui sont des résumés (e.g. moyennes ou proportions) d'observations
individuelles dans chaque groupe, (ii) des données environnementales qui sont des
caractéristiques physiques (e.g. niveau de pollution ou température), mais qui ont leur
analogue, plus rarement mesuré, au niveau individuel (e.g. dose individuelle d'exposition à
la pollution), et (iii) des données globales qui sont des attributs de chaque groupe et qui
n'ont pas d'analogue individuel (e.g. densité de population, système de soins…)
(Morgenstern, 2008).
Avantages et limites
Cette approche écologique tire son avantage de l’utilisation de données agrégées qui
sont souvent plus facilement disponibles et accessibles que des données individuelles :
données de mortalité ou morbidité via les bases de données de surveillance ou les registres,
données démographiques via les recensements de la population et données
environnementales via les stations météorologiques ou les images satellites notamment. Les
données individuelles requièrent, elles, des investigations épidémiologiques plus poussées
41

(telles que les études cas-témoins ou de cohorte) et certaines expositions
environnementales sont difficilement mesurables sur les individus. De plus, ces études
écologiques sont moins sensibles aux erreurs aléatoires dans la mesure de l’exposition que
les études individuelles et les contrastes d’exposition sont potentiellement plus grands qu’au
niveau individuel, induisant une meilleure puissance (Richardson and Monfort, 2000).
Cependant, ces études doivent être interprétées avec prudence car elles peuvent
conduire au phénomène d’« erreur écologique » (« ecological fallacy ») (Selvin, 1958) lorsque
les associations mesurées à l’échelle d’un groupe ne sont pas nécessairement transférables à
l’échelle individuelle, en raison notamment de la variabilité intra-unité de l’exposition et des
facteurs de risque. Cette erreur écologique peut survenir pour plusieurs raisons, dont un
biais de spécification (non prise en compte au niveau du groupe de relations exposition-
risque individuelles non linéaires) ou un biais de confusion (non-prise en compte de
facteurs de confusion) (Greenland, 1992). Ces biais peuvent être réduits en introduisant les
facteurs de confusion potentiels, en prenant en compte l’influence de facteurs non mesurés
avec des modèles adaptés (voir plus loin) et en réduisant le taille des unités spatiales :
l’analyse est ainsi plus proche du niveau individuel (mais est limitée par le problème de
l’instabilité des taux cité plus haut) et les populations des unités spatiales sont plus
homogènes quant à l’exposition (minimisation de la variance intra-unité) (Rezaeian et al.,
2007).
Néanmoins, de telles études écologiques ont été cruciales pour développer des
hypothèses étiologiques majeures, comme l’établissement d’un lien entre le carcinome
hépatocellulaire et l’infection par le virus de l’hépatite B (Beasley, 1988). Ces études
fournissent des pistes solides mais les associations mises en évidence à l’échelle écologique
nécessitent d’être confirmées et répliquées à l’échelle individuelle pour aller vers
l’établissement d’une relation de causalité entre un facteur d’exposition et une maladie
(Cuzick and Elliott, 1994).
Modèles statistiques
Dans une analyse de corrélation écologique, pour estimer l’association entre les
variations géographiques d’un indicateur de santé et celles de variables d’exposition, les
outils statistiques typiquement utilisés sont les modèles de régression écologique, qui
peuvent être de complexité variable (Guihenneuc-Jouyaux, 2002). Pour des données
agrégées (e.g. nombre de cas par unités spatiales), et en particulier lorsque la maladie
étudiée est rare, l’approche classique est le modèle de régression de Poisson, qui fait partie
42

de la classe des modèles linéaires généralisés (Langford and Day, 2001). Dans ce cas, on
suppose que le nombre de cas Yi observés dans chaque unité spatiale i suit une distribution
de Poisson de moyenne µi = λiEi où Ei est le nombre de cas attendus et λi est le risque
relatif de l’unité i :
Yi ~ Poisson(λiEi)
Le nombre de cas attendus est calculé en fonction de la population à risque et du taux
d’incidence dans la population générale, suivant éventuellement une procédure de
standardisation si des taux spécifiques par âge et sexe sont disponibles. Le risque relatif λi
est ensuite modélisé, via un modèle log-linéaire, en fonction de variables d’exposition Xk et
d’un terme α qui représente le risque moyen dans toutes les unités spatiales, de sorte que le
logarithme de µi s’écrive :
∑++=k
kikii XE βαµ )log()log(
Le nombre de cas attendus est traité comme un offset dans le modèle et les βk sont des effets
fixes à estimer. Pour chaque covariable, le ratio des taux d’incidence, mesure
épidémiologique utilisée pour comparer les risques entre les catégories d’exposition, est
alors donné par exp(βk). Dans ce modèle de Poisson, la variance de la distribution est égale à
la moyenne. Ce modèle de base peut s’avérer inadapté en cas de sur-dispersion, ou
variation extra-poissonnienne, dans les données. La distribution de Poisson peut alors être
remplacée par une distribution binomiale négative, qui autorise une variance supérieure à la
moyenne en introduisant un paramètre de sur-dispersion (Rezaeian et al., 2007).
Il est ensuite possible d’étendre ce modèle standard à un modèle linéaire mixte
généralisé en introduisant différents types d’effets aléatoires au niveau des unités spatiales,
pour prendre en compte une variabilité supplémentaire dans les observations dérivant de
sources non-spatiales ou spatiales. Cela peut être réalisé dans le cadre d’une formulation
hiérarchique bayésienne. Les modèles de régression hiérarchique bayésienne se sont avérés
utiles pour analyser les dynamiques spatio-temporelles de maladies infectieuses dans
différents contextes épidémiologiques, telles que la dengue au Brésil (Lowe et al., 2013), les
géohelminthiases au Kenya (Pullan et al., 2011) ou la schistosomiase en Chine (Wang et al.,
2008). L’utilisation d’une approche hiérarchique bayésienne pour tenir compte de la
variabilité spatialement structurée et non structurée dans les études écologiques a d’abord
été introduite par Clayton et Kaldor (1987), puis développée par Besag et al (1991).
43

Comme évoqué plus haut, certains facteurs de confusion non mesurés ou non
identifiés peuvent modifier la relation écologique entre un facteur d’exposition et le risque
de maladie. Il est donc nécessaire de prendre en compte ces facteurs de confusion, en
introduisant dans l’équation du prédicteur des effets aléatoires Vi au niveau des unités
spatiales. Ces effets vont permettre de capturer l’influence de facteurs spécifiques à chaque
unité spatiale et d’introduire une source supplémentaire de variabilité dans le modèle :
iki
k
ki VX ++= ∑βαλ )log(
où la distribution a priori des Vi est généralement spécifiée par une loi normale de variance
inter-unités σv² :
iV ~ ),0( 2
vN σ
Cependant, ces effets aléatoires gaussiens indépendants ignorent la possibilité d’une
dépendance spatiale entre les observations. Or, l’hypothèse qu’il existe une forme
d’autocorrélation spatiale est plus réaliste, d’autant plus si les unités spatiales sont petites
(Richardson and Monfort, 2000). Ignorer l’autocorrélation spatiale entre les observations
peut conduire à une sous-estimation des erreurs standards associées aux paramètres de
régression estimés par le modèle, créant des intervalles de confiance faussement étroits et
des niveaux de significativité sur-estimés (Beale et al., 2008; Bithell, 1998). Pour faire face à
ce problème, il est nécessaire d’inclure une structure spatiale dans les effets aléatoires des
unités spatiales, en considérant que le risque relatif d’une unité est influencé par le risque
relatif des unités voisines. Ces effets notés Ui représentent la corrélation spatiale entre
unités voisines (variabilité structurée spatialement) due à des facteurs de risque inconnus :
iki
k
ki UX ++= ∑βαλ )log(
Les effets aléatoires Ui sont spécifiés par un modèle conditionnel auto-régressif (CAR), qui
implique que la distribution conditionnelle de chaque Ui est une distribution normale
centrée sur la moyenne pondérée des effets dans les unités voisines, ui, et de variance 2
iσ
inversement proportionnelle au nombre de voisins ; les poids wij représentent la relation de
voisinage entre deux unités i et j :
ijji UU ≠, ~ ),( 2
iiuN σ , ∑∑
=j ij
j jij
iw
Uwu ,
∑=
j ij
ui
w
22 σσ
44

Pour plus de flexibilité, Besag, York et Mollié (Besag et al., 1991) ont proposé de
combiner ces deux types d’effets aléatoires via le modèle baptisé « modèle BYM » du nom
de ses trois auteurs. Au final, ce modèle complet, qui est le plus couramment utilisé
aujourd’hui, s’écrit (Richardson and Monfort, 2000) :
• Premier niveau :
Yi ~ Poisson(λiEi)
• Deuxième niveau :
iiki
k
ki UVX +++= ∑βαλ )log(
iV ~ ),0( 2
vN σ
ijji UU ≠, ~ ),( 2
iiuN σ , ∑∑
=j ij
j jij
iw
Uwu ,
∑=
j ij
ui
w
22 σσ
Dans l’approche bayésienne, des distributions a priori doivent également être
spécifiées pour α, les coefficients de régression βk et les (hyper-)paramètres σv² et σu² des
effets aléatoires (troisième niveau du modèle hiérarchique). L’estimation des paramètres de
ce modèle hiérarchique bayésien requiert des techniques de simulation stochastiques
appartenant à la famille des méthodes de Monte Carlo par chaînes de Markov (MCMC),
dont la mise en œuvre a été relativement facilitée par le développement du logiciel
WinBUGS (Lunn et al., 2000).
Dans de nombreuses situations, les données spatiales sont également indexées dans
le temps. Ces données spatio-temporelles (e.g. nombres de cas par unité spatiale mesurés
sur plusieurs années consécutives) doivent être analysées par un modèle qui prend à la fois
en compte la dépendance spatiale et la dépendance temporelle. Le modèle BYM purement
spatial peut alors être étendu à une structure spatio-temporelle additive (modèle développé
dans l’Article II). Les effets aléatoires au niveau des unités spatiales décrits plus haut
permettent notamment d’exprimer ce que les mesures répétées sur une même unité ont en
commun. À ces effets spatiaux sont ajoutés des effets aléatoires temporels non structurés
et/ou structurés (e.g. sous la forme d’une marche aléatoire d’ordre 1 (Knorr-Held and
Besag, 1998)), permettant respectivement d’exprimer ce que les risques relatifs au même
temps t ont en commun et de modéliser la dépendance des risques relatifs entre temps t
consécutifs. Ce modèle additif peut finalement être étendu en incluant un paramètre
d’interaction spatio-temporelle qui permet de capturer les écarts à la structure additive, sous
45

différentes formes possibles (Knorr-Held, 2000). L’estimation de ces modèles complexes
peut également être réalisée dans le logiciel WinBUGS via les méthodes MCMC, qui sont
souvent très coûteuses en temps de calcul afin d’atteindre un niveau de convergence
satisfaisant.
46
3 Analyse des agrégats spatio-temporels
47

Dans ce chapitre, nous présentons tout d’abord un résumé de l’Article I, puis le
reste du chapitre est constitué de l’article lui-même (en anglais). Seuls le format des
références bibliographiques et la numérotation des figures ont été modifiés afin de
s’intégrer de façon cohérente dans ce manuscrit de thèse. Le PDF de l’article tel qu’il a été
publié en 2012 dans la revue PLoS Neglected Tropical Diseases (Paireau et al., 2012) est
disponible en annexe selon les préférences de lecture.
3.1 Résumé de l’Article I
Avant d’étudier l’association entre la méningite à méningocoque et divers facteurs
de risque, il nous paraissait essentiel d’analyser en premier lieu la distribution spatio-
temporelle de la maladie seule, d’autant plus que les connaissances sur la dynamique des
épidémies à une échelle spatiale plus fine que le district sont limitées. Les objectifs de
départ étaient, en termes scientifiques, de mieux décrire et saisir les caractéristiques spatio-
temporelles de la distribution des cas à l’échelle des aires de santé et, en termes de santé
publique, d’identifier les éventuelles zones à risque où concentrer les efforts thérapeutiques
et préventifs.
Pour cela, nous avons choisi d’utiliser conjointement deux méthodes locales de
détection d’agrégats spatiaux présentées au 2.2.4 : l’indice local d’autocorrélation spatiale de
Moran et la statistique de scan spatial de Kulldorff, la distance optimale de détection des
agrégats ayant été préalablement déterminée par des corrélogrammes de l’indice global de
Moran. Nous avons montré que des agrégats spatiaux (définis sur une année) sont détectés
chaque année sans exception et que la majorité d’entre eux n’englobent qu’un petit nombre
d’aires de santé (deux en médiane) sans s’étendre à un district entier, alors que le district
constitue l’échelle privilégiée pour la surveillance et l’étude des méningites au Niger. Nous
avons également observé une forte variabilité inter-annuelle dans les aires de santé
touchées, avec cependant une plus grande fréquence d’occurrence des agrégats dans neuf
districts situés au sud du Niger. Cette variabilité inter-annuelle dans les schémas
épidémiques s’est également retrouvée dans l’étude des agrégats spatio-temporels (définis
sur une semaine maximum) par le scan spatio-temporel de Kulldorff. En effet, l’analyse
de la succession d’agrégats spatio-temporels au sein de chaque année épidémique n’a pas
permis de mettre en évidence une source fixe d’où partiraient les épidémies ni une direction
géographique systématique dans la propagation des agrégats.
48

Il s’agit de la première étude utilisant les aires de santé comme unité spatiale
d’analyse de la méningite à méningocoque au niveau d’un pays subsaharien. Il nous a donc
paru intéressant d’évaluer l’avantage éventuel à utiliser cette échelle spatiale pour la
surveillance des épidémies, comparée à l’échelle des districts. Nous avons ainsi montré que
la détection des épidémies à partir de seuils d’incidence calculés à l’échelle des aires de santé
pourrait conduire à donner l’alerte plus précocement que les seuils à l’échelle des districts
utilisés actuellement, et permettrait ainsi d’apporter une réponse potentiellement plus
efficace et plus ciblée.
Ce travail démontre le caractère localisé des épidémies de méningite à
méningocoque et la grande variabilité spatiale et temporelle dans les schémas d’émergence
et de diffusion. Il suggère des pistes sérieuses pour améliorer les politiques de santé
publique, notamment en termes d’allocation des ressources diagnostiques et thérapeutiques
et de contrôle des épidémies par la vaccination réactive. D’une manière générale, ce travail
met en évidence la pertinence de l’utilisation de l’échelle des aires de santé pour l’étude et la
surveillance des méningites à méningocoque dans les pays de la ceinture. Il s’agira ensuite,
dans le chapitre suivant, d’élucider le rôle des différents facteurs de risque dans
l’hétérogénéité spatio-temporelle de l’incidence annuelle à l’échelle des aires de santé, mise
en lumière par ces premières analyses.
3.2 Article I : Analysing Spatio-Temporal Clustering of Meningococcal
Meningitis Outbreaks in Niger Reveals Opportunities for Improved
Disease Control.
Juliette Paireau1, Florian Girond2, Jean-Marc Collard3, Halima B Maïnassara2 and Jean-
François Jusot2, 2012. Analysing Spatio-Temporal Clustering of Meningococcal Meningitis
Outbreaks in Niger Reveals Opportunities for Improved Disease Control. PLoS Neglected
Tropical Diseases 6(3):e1577. doi:10.1371/journal.pntd.0001577
1 Unité d’Épidémiologie des Maladies Émergentes, Institut Pasteur, Paris, France 2 Unité Épidémiologie/Santé-Environnement-Climat, Centre de Recherche Médicale et
Sanitaire (CERMES)/Réseau International des Instituts Pasteur, Niamey, Niger 3 Unité de Biologie, Centre de Recherche Médicale et Sanitaire (CERMES)/Réseau
International des Instituts Pasteur, Niamey, Niger 49

3.2.1 Abstract
Background: Meningococcal meningitis is a major health problem in the “African
Meningitis Belt” where recurrent epidemics occur during the hot, dry season. In Niger, a
central country belonging to the Meningitis Belt, reported meningitis cases varied between
1,000 and 13,000 from 2003 to 2009, with a case-fatality rate of 5-15%.
Methodology/Principal findings: In order to gain insight in the epidemiology of
meningococcal meningitis in Niger and to improve control strategies, the emergence of the
epidemics and their diffusion patterns at a fine spatial scale have been investigated. A
statistical analysis of the spatio-temporal distribution of confirmed meningococcal
meningitis cases was performed between 2002 and 2009, based on health centre catchment
areas (HCCAs) as spatial units. Anselin’s local Moran’s I test for spatial autocorrelation and
Kulldorff’s spatial scan statistic were used to identify spatial and spatio-temporal clusters of
cases. Spatial clusters were detected every year and most frequently occurred within nine
southern districts. Clusters most often encompassed few HCCAs within a district, without
expanding to the entire district. Besides, strong intra-district heterogeneity and inter-annual
variability in the spatio-temporal epidemic patterns were observed. To further investigate
the benefit of using a finer spatial scale for surveillance and disease control, we compared
timeliness of epidemic detection at the HCCA level versus district level and showed that a
decision based on threshold estimated at the HCCA level may lead to earlier detection of
outbreaks.
Conclusions/Significance: Our findings provide an evidence-based approach to improve
control of meningitis in sub-Saharan Africa. First, they can assist public health authorities
in Niger to better adjust allocation of resources (antibiotics, rapid diagnostic tests and
medical staff). Then, this spatio-temporal analysis showed that surveillance at a finer spatial
scale (HCCA) would be more efficient for public health response: outbreaks would be
detected earlier and reactive vaccination would be better targeted.
3.2.2 Introduction
Background
Meningococcal meningitis (MM), caused by the bacterium Neisseria meningitidis (Nm),
is a major health problem in sub-Saharan Africa. The highest incidences of the disease are
observed in the so-called “African Meningitis Belt” where annual recurrent epidemics
50

occur during the very hot, dry season (Lapeyssonnie, 1963). In Niger, reported meningitis
cases varied between 1,000 and 13,000 from 2003 to 2009, with case-fatality rates of 5–
15%. The factors involved in the spatio-temporal occurrence of meningococcal epidemics
are only suspected and still poorly understood.
Surveillance and reactive vaccination are the predominant strategies for managing
meningococcal meningitis outbreaks in the Belt, recently completed with a conjugate
vaccine to prevent the carriage of Nm serogroup A. In Niger like in most sub-Saharan
countries, surveillance is performed at the district level. Quantitative morbidity and
mortality data on meningitis are collected within a reporting network managed by the
Direction for Statistics, Surveillance and Response to Epidemics (DSSRE) from the
Ministry of Public Health. Data from all health care facilities covering the entire Niger
population are collected on a weekly basis by the district health authorities, which aggregate
and forward their data to the regions and subsequently to the DSSRE. These reported data
include all suspected and probable cases, according to the standard clinical definition of
meningococcal meningitis (World Health Organization, 1998): A suspected case is any
person with sudden onset of fever (>38.5°C rectal or 38.0°C axillary) and one or more of
the following signs: stiff neck, altered consciousness or other meningeal sign; in patients
under one year of age, a suspected case occurs when fever is accompanied by a bulging
fontanelle. A probable case is defined as a suspected case with turbid CSF or Gram stain
showing Gram-negative diplococcus or petechial/purpural rash or ongoing epidemic.
Laboratory confirmation of meningitis is not required to report a case. In parallel to this
epidemiologic surveillance and in close collaboration with DSSRE, the Centre de
Recherche Médicale et Sanitaire (CERMES) is in charge of the national microbiological
surveillance of meningitis. The CERMES collects the cerebrospinal fluid (CSF) samples
taken from suspected cases of meningitis by health care workers or physicians and carries
out the etiological diagnosis (see Methods).
Based on this national surveillance system, the strategy applied in Niger to respond
to meningitis outbreaks with limited amounts of available polysaccharide vaccines, is to
initiate reactive vaccination in a district once weekly incidence exceeds the epidemic
threshold defined by WHO (see (World Health Organization, 2000) and Methods for
definitions). Thus, early detection of epidemics is essential for an effective operational
response.
51

Spatio-temporal analysis
Analysing spatio-temporal patterns of epidemics at a fine geographic scale could
lead to a better understanding of the underlying causes of the disease and potential future
prediction of outbreaks (Sugumaran et al., 2009). One of the techniques to uncover spatial
patterns of disease is cluster detection. In epidemiology, a cluster is a number of health
events situated close together in space and/or time (Moore and Carpenter, 1999).
Identifying spatial and spatio-temporal clusters of cases could help: (i) to generate new
information for further etiologic studies; (ii) to identify risk areas where to focus the
surveillance and allocate the resources (antibiotics, rapid diagnostic tests…); (iii) to develop
cost-efficient vaccination strategies.
In sub-Saharan Africa, data from national disease notification have already been
used at country, regional or district levels to study the geographical and temporal dynamics
of epidemics and their correlation with environmental factors (Broutin et al., 2007; Jackou-
Boulama et al., 2005; Molesworth et al., 2003; Philippon et al., 2009; Sultan et al., 2005;
Thomson et al., 2006; Yaka et al., 2008). However, little is known about MM emergence
and distribution at a sub-district level. Using a finer spatial scale such as health centre
catchment areas (HCCAs) would have several advantages: (i) it would capture heterogeneity
in MM incidence at sub-district level; (ii) epidemic thresholds would be studied at a more
accurate scale, allowing for a more rapid and targeted public health response; (iii)
monitoring of the impact of the intervention would be performed at the same level as the
intervention itself.
Therefore, we aimed to investigate the spatio-temporal distribution of MM
epidemics in Niger at the health centre catchment area level, to identify the most frequently
affected HCCAs requiring a particular attention from public health authorities. The
national microbiological surveillance database was used to perform two cluster detection
methods in order to uncover spatial and spatio-temporal clustering of MM incidence from
July 2002 to June 2009. Then, as a preliminary analysis to a more thorough etiologic study,
we searched for ecologic correlation of MM incidence with human density and roads at the
HCCA level. Finally, to further investigate the benefit of using a finer spatial scale for
surveillance and disease control, we compared timeliness of epidemic detection at the
HCCA level versus district level. This paper provides new insights into the spatio-temporal
dynamics of MM epidemics and discusses the potential implications of our findings for
meningitis control in sub-Saharan Africa.
52

3.2.3 Methods
Data collection and laboratory analyses
The CERMES is the national laboratory in charge of the microbiological
surveillance of meningitis in Niger. This surveillance has been reinforced since 2002
(Suzanne Chanteau et al., 2006; Sidikou et al., 2003) by its extension to the whole country
(it was only effective in the capital city before 2002) and by the inclusion of a Polymerase
Chain Reaction (PCR) assay for etiological diagnosis of meningitis to the DSSRE routine
surveillance. CSF samples were collected by health care workers or physicians from
suspected cases of acute meningitis. Each CSF was documented with an epidemiological
form that included date of sample collection, clinical information and general
characteristics about the patient (age, sex, geographic origin such as region, district, HCCA
and village). The samples were kept either refrigerated or frozen in health facilities, or
inoculated into a trans-Isolate (TI) medium. The more remote health centres sent CSF
samples (frozen in a cool box) on a voluntary basis to CERMES by mandated transport
companies. Additionally, CERMES carried out active collection of samples twice a day in
Niamey, so that the samples remained suitable for culture, and every month within a radius
of about 300 kilometres around Niamey, in the regions of Tillabery and Dosso. Etiological
diagnosis of MM was carried out by PCR for all CSF as described in (Sidikou et al., 2003)
and (Suzanne Chanteau et al., 2006) and by culture (WHO, 1999) for suitable CSF received
promptly at CERMES (fresh CSF and CSF inoculated into TI medium). Questionnaire
data and microbiological results were entered in a database managed by CERMES. The
data were used for a retrospective study on meningococcal meningitis cases between July 1,
2002 and June 30, 2009.
Ethics statement
All data were collected through the national routine surveillance system. Therefore,
written consent was not asked and approval from the national ethics committee was not
needed. However, patients were informed of the reason why their cerebrospinal fluid was
sampled and confidentiality on patients’ identity was guaranteed.
Geographic and demographic data
In 2008, in order to create a digitized National Health Map of Niger, CERMES
mapped the country’s HCCAs, each of which included all villages served by the same
53

health centre. As projected data were required for the spatial statistics, all analyses were
carried out with a projected version of the National Health Map, using the WGS84 –
UTM32N projection. The number of inhabitants per village was extracted from the 2001
census database of the Institut National de la Statistique (INS) and an annual population
growth rate of 3% was applied. A shapefile of primary roads was retrieved from the
HealthMapper application of the World Health Organization (WHO).
Statistical analyses
Detection of spatial clusters and frequency of occurrence. To identify high risk
areas on which to concentrate therapeutic and preventive efforts, we searched for annual
spatial clusters, defined as groups of MM cases occurring during the same epidemiological
year and situated closer together in space than would be expected from the variation in
population density and chance fluctuations. Two cluster detection methods were used to
uncover spatial clustering of MM incidence at the HCCA level in Niger for each
epidemiological year between 2003 and 2009. An epidemiological year n was defined as
running from July 1 of the year n-1 to June 30 of the year n. The first method was the
Anselin’s Local Moran’s I test (Anselin, 1995; Sugumaran et al., 2009), implemented in the
ArcGIS software (version 9.3, ESRI Inc. Redlands, CA), which provided a measure of the
spatial autocorrelation for a given HCCA with its neighbours. Spatial clusters of MM cases
were identified by mapping the significant high-high HCCAs (i.e. high incidence rate HCCA
surrounded by high incidence rate HCCAs) and high-low HCCAs (i.e. high incidence rate
HCCA surrounded by low incidence rate HCCAs). The second method was the Kulldorff’s
spatial scan statistic (Kulldorff, 1997; Sugumaran et al., 2009) implemented in the SaTScan
software (version 8.0, Kulldorff and Information Management Services, Inc.), which used a
circular moving window to identify single HCCAs or groups of HCCAs of significantly
high risk. To determine beforehand the optimal scale for cluster detection by both
methods, i.e. the distance where spatial effects were maximized (Moore and Carpenter,
1999), the Global Moran’s I test was used in ArcGIS and correlograms of I against
different threshold distances were plotted in R (version 2.9.1, R Development Core Team,
R Foundation for Statistical Computing, Vienna, Austria). More details regarding the
cluster detection methods can be found in Supporting information (Text S1).
The frequency of spatial cluster occurrence was calculated for each HCCA and each
health district, respectively defined as the number of years during which the HCCA
contributed to a cluster, and as the number of years during which the district contained at
54

least one HCCA contributing to a cluster. The frequencies were calculated taking into
account either (i) clusters detected by one of the two methods (weaker evidence of
clustering) or (ii) clusters detected by both methods (stronger evidence of clustering).
Detection of spatio-temporal clusters. To analyse the emergence and diffusion
patterns of MM cases within each epidemic season, we then searched for spatio-temporal
clusters, groups of MM cases situated close together in space and time. The Kulldorff’s
space-time scan (Kulldorff et al., 1998) implemented in SaTScan was performed to identify
spatio-temporal clusters of maximum one-week duration. More details regarding the
method can be found in Supporting information (Text S1).
Ecological correlation. To investigate if the highlighted spatio-temporal patterns
could be related to host density and movement, correlations of MM incidence at the
HCCA level with human density and distance to primary road were explored using Pearson
correlation coefficient.
Timeliness of epidemic detection. Finally, to evaluate the potential gain in
timeliness of epidemic detection at the HCCA level compared to the district-level
surveillance, we applied to our HCCA-level data the two thresholds currently used for
detection of outbreaks (World Health Organization, 2000). The alert threshold was defined
as 5 cases per 100,000 inhabitants per week for population >30,000 inhabitants or 2 cases
in one week for population <30,000 inhabitants. The epidemic threshold was defined as 10
cases per 100,000 inhabitants for population >30,000 inhabitants (under appropriate
conditions (World Health Organization, 2000), otherwise 15 per 100,000) or 5 cases in one
week for population <30,000 inhabitants. If there was an epidemic in a neighbouring area,
the alert threshold became the epidemic threshold.
3.2.4 Results
Description of the data
From July 1, 2002 to June 30, 2009, a total of 15 801 CSF specimens from
meningitis suspected cases were analysed at the CERMES laboratory (Table 2). 112 CSF
(0.7%) could not be tested (depleted, broken tubes…) and 79 (0.5%) did not give
conclusive results because of contamination. Overall, biological specimens originated from
416 (61%) of the 682 HCCAs mapped in 2009. Among these CSF, 6556 (41.5%) were
confirmed as bacterial meningitis cases, 82.2% of which were positive for Neisseria
meningitidis. Serogroup A was the predominant serogroup every year, except in 2006. The
55

mean (SD) age of the MM cases was 9.6 (7.5) years and 58.8% were male. Over the study
period, MM cases were detected in 349 HCCAs (51.2%) in all regions of Niger (Figure 6),
with contrasting incidence rates within districts. The highest incidence rates were found in
HCCAs of Niamey, Tillabery, Dosso, Tahoua, Maradi and Zinder regions. As for the
temporal distribution, 82.5% of the MM cases occurred from February to April.
Table 2. Results of microbiological analyses of CSF samples by epidemiological year.
Year 2003 2004 2005 2006 2007 2008 2009 Total
Collected CSF 2073 1324 1273 3135 1150 2819 4027 15801
Meningitis positive CSF in number of cases (% of the collected CSF)
Positive CSF 945 (45.6) 487(36.8) 370 (29.1) 1336 (42.6) 329 (28.6) 1218 (43.2) 1872 (46.5) 6557 (41.5)
Bacteria in number of cases (% of the positive results)
N.meningitidis 793 (83.9) 333 (68.4) 166 (44.9) 1143 (85.6) 137 (41.6) 1060 (87.0) 1756 (93.8) 5388 (82.2)
S.pneumoniae 103 (10.9) 123 (25.2) 165 (44.6) 131 (9.8) 128 (38.9) 116 (9.5) 96 (5.1) 862 (13.1)
H.influenzae 49 (5.2) 31 (6.4) 39 (10.5) 62 (4.6) 64 (19.5) 42 (3.5) 18 (1.0) 305 (4.7)
Others 0 (0.0) 0 (0.0) 0 (0.0) 0 (0.0) 0 (0.0) 0 (0.0) 2 (0.1) 2 (<0.1)
Serogroups of N. meningitidis in number of cases (% of the meningococci)
A 715 (90.1) 280 (84.1) 92 (55.4) 539 (47.2) 119 (86.9) 993 (93.7) 1705 (97.1) 4443 (82.5)
X 3 (0.4) 12 (3.6) 41 (24.7) 559 (48.9) 11 (8.0) 5 (0.5) 10 (0.6) 641 (11.9)
W135 64 (8.1) 31 (9.3) 19 (11.5) 24 (2.1) 5 (3.6) 0 (0.0) 10 (0.6) 153 (2.8)
C 0 (0.0) 1 (0.3) 0 (0.0) 0 (0.0) 0 (0.0) 0 (0.0) 0 (0.0) 1 (<0.1)
Y 4 (0.5) 2 (0.6) 0 (0.0) 1 (0.1) 0 (0.0) 0 (0.0) 1 (<0.1) 8 (0.1)
Undetermined 7 (0.9) 7 (2.1) 14 (8.4) 20 (1.7) 2 (1.5) 62 (5.8) 30 (1.7) 142 (2.6)
Detection of spatial clusters and frequency of occurrence
Figure 7 depicts for each year the Kulldorff’s spatial scan statistic results overlain
on the Anselin’s Local Moran’s I results. Over the seven years, the Local Moran’s I method
identified 140 high-risk HCCAs (130 high-high and 10 high-low), with an annual number
ranging from 11 (in 2003 and 2007) to 31 (in 2008 and 2009). The spatial scan method
identified 58 significant spatial clusters altogether, with an annual number ranging from 3
(in 2003) to 16 (in 2009). The median number of HCCAs per cluster was 2 (IQ range = 1 –
5) and the median annual incidence rate of the clusters was 34.9 (IQ range = 20.5 – 72.3)
cases per 100,000. Almost 80% of the high-risk HCCAs identified with the Local Moran’s I
were included in clusters detected by SaTScan and 62% of the SaTScan clusters
encompassed high-high or high-low HCCAs.
56

Figure 6. Cumulative incidence rates of meningitis in Niger from July 2002 to June 2009. A:
Incidence of laboratory-confirmed cases of meningococcal meningitis (MM) at the health
centre catchment area level. B: Incidence of suspected cases of meningitis reported to the
DSSRE at the district level.
57

Figure 7. Annual spatial clusters of meningococcal meningitis cases identified in Niger from
2003 to 2009. Each panel shows the results of both methods, the Anselin’s Local Moran’s I test
and the Kulldorff’s spatial scan statistic, for a single epidemiological year.
Spatial clusters generally occurred in different HCCAs from year to year over the
study period, as shown by the low frequencies observed at the HCCA level (Figure 8).
Among the HCCAs contributing to a cluster at least once over the study period, the
median frequency was 1 (range = 1 – 4) for clusters detected by at least one method, and 1
(range = 1 – 3) for clusters detected by both methods. Only four HCCAs were detected
58

three or more times by at least one method and two or more times by both methods. They
were: Chare Zamna (in Zinder urban community), Gazaoua, Doumega and Loudou.
Spatial clusters most frequently occurred within nine districts out of 42, containing
three or more times a cluster detected by at least one method, and two or more times a
cluster detected by both methods. These districts were: Tera and Say (bordering Burkina
Faso), Keita, Zinder and five districts bordering Nigeria, Doutchi, Madaoua, Guidan
Roumji, Madarounfa and Aguie. The median time interval between two clusters occurring
in the same district was one year. When a district contained a cluster detected by at least
one method, only 13.3% (median) of its HCCAs contributed to that cluster, and 9.7%
when a district contained a cluster detected by both methods.
Figure 8. Frequency of cluster occurrence in Niger from 2003 to 2009.
A, B: Frequencies of occurrence of spatial clusters detected by one of the two methods
(Anselin’s Local Moran’s I test or Kulldorff’s spatial scan statistic). C, D: Frequencies of
occurrence of spatial clusters detected by both methods.
59

Detection of spatio-temporal clusters
No systematic spatio-temporal pattern for cluster emergence and epidemic spread
was observed within the seven years of the study period. Figure 9 shows the 66 significant
spatio-temporal clusters detected with the SaTScan space-time scan (except a 2009
northeast cluster in Dirkou, Bilma district, which is outside the displayed zone) and the
incidence rate observed for each HCCA of a spatio-temporal cluster during the time period
associated to that cluster. They essentially occurred between February and April, with an
additional few at the beginning (November-January) and the end (May) of the epidemics.
In 2003, the epidemic could be summarized in two western and eastern poles, with the
western pole occurring before the eastern one. In 2004, the first cluster was detected in the
west; then all clusters appeared in the east, ending with the northernmost one in Tanout
district. In 2005, clusters were detected only in the eastern part. In 2006, two spatio-
temporal poles were clearly distinguished, first in the east and then in the west. In 2007, the
first three clusters were detected in the west, followed by one in the east, still another one
in the west and a final northernmost one in Keita district. In 2008, between the eastern
clusters at the beginning and the end of the epidemic season, other clusters essentially
appeared in the centre (Tahoua region) and the west (Tillabery and Dosso regions) without
a clear order, concluding again the northernmost cluster in Keita district. In 2009, from the
first cluster in the east to the final one in the west, clusters appeared in all regions in
between, but followed no clear geographical direction.
Correlation with population density and roads
No significant correlation was found between MM incidence at the HCCA level
and human density (r = 0.02) or distance to primary roads (r = -0.07).
Timeliness of epidemic detection
Between 2003 and 2009, 88 districts crossed the alert threshold. For 42 (47.7%) of
them, the alert threshold was crossed earlier (4 weeks early in median) in at least one
HCCA of these districts.
Between 2003 and 2009, 46 districts crossed the epidemic threshold. For 15
(32.6%) of them, the epidemic threshold was crossed earlier (3 weeks early in median) in at
least one HCCA of these districts.
60

Figure 9. Spatio-temporal clusters of meningococcal meningitis cases identified in Niger from
2003 to 2009. Each panel shows the results of the Kulldorff’s space-time scan statistic for a
single epidemiological year and the incidence rate observed for each HCCA of a spatio-
temporal cluster during the time period associated to that cluster (maximum one week).
Spatio-temporal clusters are numbered in chronological order of occurrence.
61

3.2.5 Discussion
To our knowledge, this is the first study using health centre catchment areas as
spatial units for the spatio-temporal analysis of MM over a whole sub-Saharan country. The
study’s first finding was the more frequent detection of spatial clusters within nine southern
districts, mainly on the southern border with Nigeria. Second, clusters most often
encompassed only a few HCCAs within a district, without expanding to the entire district.
In addition, no consistent annual spatio-temporal pattern for cluster emergence and
epidemic spread could be observed, thus precluding the capacity to predict where the next
epidemic would break out, and what geographical direction it would follow. These findings
rely on laboratory-based data and have important public health implications as discussed
hereafter.
The first asset of this study was the quality of the microbiological data. We used
laboratory-confirmed N. meningitidis cases data, coming from a surveillance system managed
by CERMES and DSSRE throughout the country. Most other spatio-temporal studies on
meningitis epidemics in sub-Saharan Africa (Broutin et al., 2007; Cuevas et al., 2007;
Jackou-Boulama et al., 2005; Molesworth et al., 2003; Philippon et al., 2009; Sultan et al.,
2005; Thomson et al., 2006; Yaka et al., 2008) are based instead on suspected cases
reported in the framework of the national surveillance systems. In our dataset, none of the
three typical bacterial aetiologies (N. meningitidis, S. pneumoniae and H. influenzae) could be
identified in almost 60% of the CSF analysed by CERMES over the study period (see Table
2). Relying only on suspected cases would therefore introduce a large number of
misclassified cases. However, our system may suffer from underreporting from areas where
performing a lumbar puncture and shipping the samples to CERMES may represent
logistical difficulties. Further analyses (not shown here) have documented that indeed the
districts the most remote from CERMES (in Maradi and Zinder regions) were sending less
CSF specimens than the closer ones, for a similar number of suspected cases notified to
DSSRE. However, the proportion of negative cases among the received CSF specimens
was fairly similar among the healthcare centres (outside the capital Niamey). This suggested
that the decision to take or not a CSF sample from a patient based on clinical criteria had
no significant spatial variability. Moreover, our cluster analyses enabled us to detect the
importance of remote regions in the epidemic dynamics according to the recurrent clusters
identified there. Like in many other settings, the surveillance system may not cover the
entire population of Niger affected by meningitis. However, we can reasonably assume that
62

most meningitis cases, because of their severity, end up reaching the healthcare centres,
with or without prior self-treatment or consultation of a tradi-practitioner. Moreover, free
healthcare offered to all people suffering from meningitis in Niger probably reduces social
and spatial disparities in care-seeking behaviours. Thus, for all the reasons above, we are
confident that the surveillance system is representative enough and that underreporting did
not substantially affect the validity of our results, which are more likely to reflect the
dynamism peculiar to meningitis than the spatial disparities in the surveillance system
efficiency. Incidence estimates were based on the 2001 census and constant population
growth rates were applied. We could not take into account possible variations of
population growth rate over time and space, due to the difficulty in quantifying population
migrations.
The second asset of this study was the use of HCCAs as spatial units for the spatio-
temporal analysis of MM. They represent a more accurate spatial unit of analysis than the
district level on which reactive vaccination strategies and spatio-temporal studies are usually
based (Cuevas et al., 2007; Molesworth et al., 2003; Thomson et al., 2006; World Health
Organization, 2000). Analysing data at the HCCA level has greater relevance for
understanding the epidemic dynamics, for making decisions in response to starting
epidemics and for assessing control strategies.
Indeed, this study has shown that clusters most often included only a few HCCAs
within a district. This finding, previously suggested by (Mueller and Gessner, 2010), is
important for understanding meningitis epidemics and should encourage surveillance at the
health centre level. Clusters occurred in different HCCAs within the same districts in
consecutive years, demonstrating strong intra-district heterogeneity and year-to-year
variability of the affected HCCAs. This could result from outbreaks limited to HCCAs
without exceeding the threshold at the district level: the district is not vaccinated and may
be affected by a large outbreak the following year. Besides, waiting for the threshold to be
reached at the district level to initiate reactive vaccination may incur unnecessary delays: we
showed that a decision based on threshold estimated at the health centre level might lead to
earlier detection of outbreaks, so more reactive and possibly more cost-effective
vaccination strategies. Thus, adding HCCA-level surveillance to the current district-level
surveillance would improve the timeliness of epidemic detection.
With the introduction of a new meningococcal A conjugate vaccine
(MenAfriVacTM) in the meningitis belt over the next few years, the use of the health centre
catchment areas as spatial units can also help to monitor more accurately the vaccine
63

supply at a finer spatial scale, saving doses that could be given inadequately, and to evaluate
its impact and protective efficacy in the population (herd immunity) at the same level.
Although this vaccine brings new hope to the control of meningitis epidemics, reactive
vaccination with polysaccharide vaccines and research to improve control strategies will
still be needed in the coming years, since it will take several years to immunize against the
A the vulnerable population across the belt and since other serogroups like W135 may
replace meningitis A as the dominant serogroup (The Lancet Infectious Diseases, 2011).
New decision criteria will have to be found for reactive vaccination. With the additional use
of a finer spatial scale like the HCCAs, an interesting strategy would be real-time cluster
detection, with prospective space-time scan statistic (Kulldorff, 2001) or other existing
methods (Watkins et al., 2006).
In the context of a resource-limited country, this study can also assist public health
authorities in their decision-making regarding resource allocation. The spatial clusters
detected in our study were located in different HCCAs from year to year, but nine of the
42 districts were more recurrently affected by clustering of MM cases. Thus, these findings
provide approaches to better adjust allocation of resources, including a ready supply of
antibiotics and rapid diagnostic tests (S. Chanteau et al., 2006; Hamidou et al., 2008), as
well as additional health care personnel. In order to reduce the reaction time of the
vaccination, one may consider allocating vaccines to these districts’ hospitals prior to the
meningitis season, provided the cold chain can be maintained. Given cost and
organizational constraints, further cost-effectiveness and feasibility analyses are needed to
evaluate this strategy, before any policy recommendation.
Clusters were more often found in nine districts, including five bordering Nigeria
within a 500 km distance between Doutchi and Aguie, most likely because of intense
mobility of border populations (Mainassara et al., 2010). However, no consistent annual
spatio-temporal pattern could be found over the study period; hence, no spread in a
systematic geographical direction from a fixed source could be identified. This is contrary
to a study carried out in Mali, which highlighted a potential south-north spread, with
Bamako and Mopti as probable sources (Philippon et al., 2009). Instead, our results suggest
the emergence of scattered sources, likely from a pool of carriers when conditions are
favorable to the occurrence of the invasive disease. Favorable conditions may include
climatic conditions occurring during the dry season (low absolute humidity and dust-laden
Harmattan wind), which would damage the nasopharyngeal mucous membrane and
increase the risk of bloodstream invasion by a colonizing meningococcus (Greenwood,
64

1999). In this study, we observed that the latest spatio-temporal clusters during the
epidemic season were often the northernmost ones, which could be correlated with the
northward advance of the Intertropical Front preceding the arrival of rains from the south,
thus raising relative humidity. However, climatic factors do not entirely explain these
spatio-temporal epidemic patterns. As suggested by Mueller’s hypothetical explanatory
model (Mueller and Gessner, 2010), their role may be limited to the hyperendemic increase
during the dry season, while transition from a hyperendemic state to highly localized
epidemics may be due to increased transmission, possibly caused by viral respiratory co-
infections. Moreover, in equivalent climatic conditions, an area in which the proportion of
susceptible individuals is higher due to waning immunity (acquired by infection or
vaccination) would be more prone to outbreaks (Pascual and Dobson, 2005). Recently,
Irving et al (Irving et al., 2012a) suggested that population immunity may be a key factor in
causing the unusual epidemiology of meningitis in the Belt. Although density and distance
to primary roads were not individually correlated with MM incidence at the HCCA level,
other socio-demographic factors (poverty, overcrowded housing, migrations, markets…)
may also have an influence on local transmission of the bacteria and carriage and
contribute to the risk of micro-epidemics of co-infections (Mueller and Gessner, 2010). Of
note, one spatio-temporal cluster of four adult cases was detected in February 2009 in
Bilma district (see Figure 6), in the oasis town of Dirkou, located on an important south-
north route of trans-Saharan trade and transit migration. Meningococcal strain variations
most likely play a role in the occurrence of epidemic waves (Leimkugel et al., 2007; Mueller
and Gessner, 2010; Taha et al., 2002). In this study, the spatio-temporal distribution of all
N. meningitidis cases was analysed irrespective of the serogroups. A subsequent analysis will
differentiate serogroups of meningococci as their spatio-temporal patterns may significantly
vary (Boisier et al., 2007, 2005). Further etiologic studies are needed to explore causality of
the spatio-temporal patterns highlighted in this paper.
Finally, our findings provide an evidence-based approach to reflect on public health
policies and indicate a promising strategy to improve prevention and control of meningitis
in sub-Saharan Africa. They can serve as an example for other meningitis belt countries,
illustrating what finer scale surveillance and spatial analyses can offer for prevention and
control of meningitis. Research efforts should now focus on investigating the role of dust,
socio-demographic factors, co-infections and vaccination strategies on cluster occurrence
at the HCCA level, and on developing an operational decision support tool to respond
better to meningitis outbreaks with the introduction of the new conjugate vaccine.
65
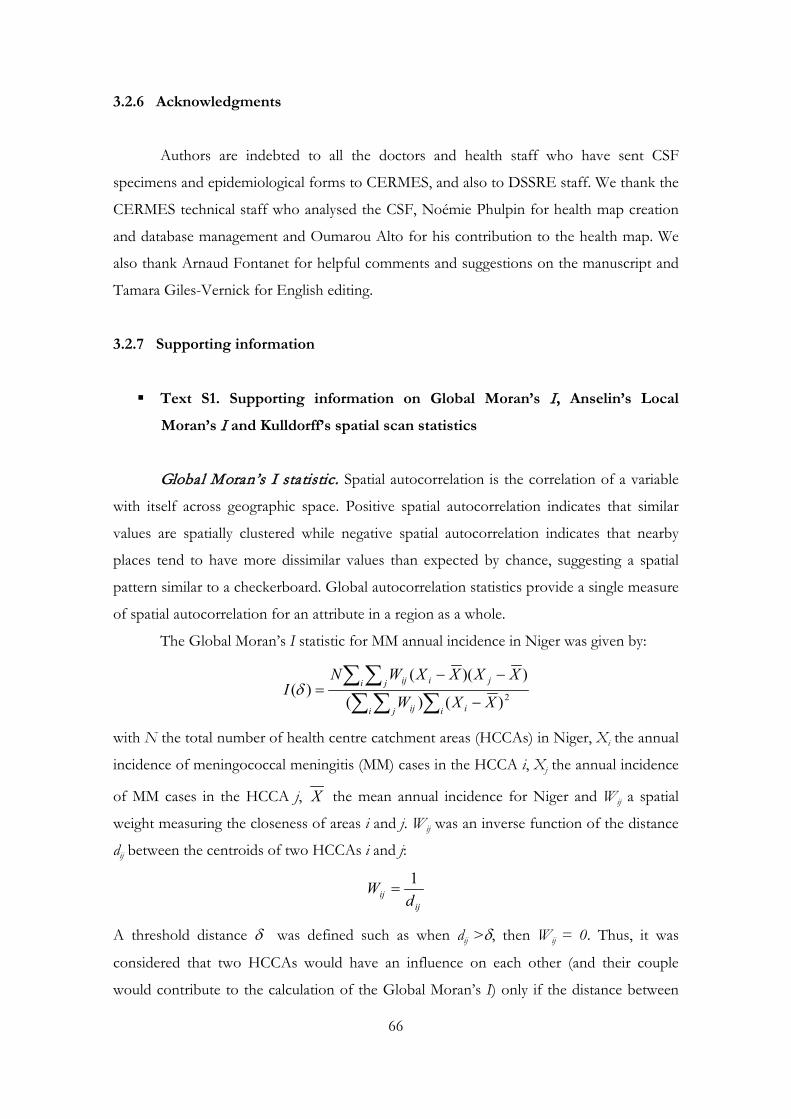
3.2.6 Acknowledgments
Authors are indebted to all the doctors and health staff who have sent CSF
specimens and epidemiological forms to CERMES, and also to DSSRE staff. We thank the
CERMES technical staff who analysed the CSF, Noémie Phulpin for health map creation
and database management and Oumarou Alto for his contribution to the health map. We
also thank Arnaud Fontanet for helpful comments and suggestions on the manuscript and
Tamara Giles-Vernick for English editing.
3.2.7 Supporting information
Text S1. Supporting information on Global Moran’s I, Anselin’s Local
Moran’s I and Kulldorff’s spatial scan statistics
Global Moran’s I statistic. Spatial autocorrelation is the correlation of a variable
with itself across geographic space. Positive spatial autocorrelation indicates that similar
values are spatially clustered while negative spatial autocorrelation indicates that nearby
places tend to have more dissimilar values than expected by chance, suggesting a spatial
pattern similar to a checkerboard. Global autocorrelation statistics provide a single measure
of spatial autocorrelation for an attribute in a region as a whole.
The Global Moran’s I statistic for MM annual incidence in Niger was given by:
with N the total number of health centre catchment areas (HCCAs) in Niger, Xi the annual
incidence of meningococcal meningitis (MM) cases in the HCCA i, Xj the annual incidence
of MM cases in the HCCA j, X the mean annual incidence for Niger and Wij a spatial
weight measuring the closeness of areas i and j. Wij was an inverse function of the distance
dij between the centroids of two HCCAs i and j:
ij
ijd
W1
=
A threshold distance δ was defined such as when dij >δ, then Wij = 0. Thus, it was
considered that two HCCAs would have an influence on each other (and their couple
would contribute to the calculation of the Global Moran’s I) only if the distance between
∑∑ ∑∑∑
−
−−=
i j i iij
i j jiij
XXW
XXXXWNI
2)()(
))(()(δ
66

their centroids was inferior to this defined threshold distance and that this influence
decreased with the distance.
To measure the distance where spatial effects were maximized, Global Moran tests
were carried out for each year using different threshold distances δ with the Spatial
Autocorrelation (Moran’s I) tool in ArcGIS Spatial Statistics toolbox (version 9.2, ESRI
Inc. Redlands, CA). A range of threshold distances was investigated from 20 km (the mean
distance between the centroids of two neighbouring HCCAs) to 200 km. Correlograms I =
f(δ) were plotted in R (version 2.9.1, R Development Core Team, R Foundation for
Statistical Computing, Vienna, Austria) and the 95 % confidence interval of the null
hypothesis around the expected value was computed at each distance, to identify the
distance at which autocorrelation was the most significant for each year. This optimal
distance for cluster detection was used to define the distance parameter of both cluster
detection methods described below.
Anselin’s Local Moran’s I statistic. The Anselin’s Local Moran statistics (Local
Indicators of Spatial Association or LISA) (Anselin, 1995; Sugumaran et al., 2009) allowed
for the decomposition of the Global Moran’s I into the contribution of each individual
observation. It provided a measure of the spatial autocorrelation for a given HCCA with its
neighbours. The null hypothesis was that there was no association between MM incidence
rates in nearby HCCAs (no spatial autocorrelation). The alternative hypothesis was that
spatial clustering existed (nearby HCCAs did have similar MM incidence rates).
The Local Moran’s I in a HCCA i was given by:
)()(
)(2
XXWXXi
XXI j
j
ij
i
i
i −−
−= ∑∑
δ
with Xi the annual incidence of MM cases in the HCCA i, Xj the annual incidence of MM
cases in the HCCA j, X the mean annual incidence of MM cases for Niger and Wij the
spatial weight matrix previously defined as the inverse function of the distance dij between
the centroids of two HCCAs i and j when dij is less than the threshold distance δ, null
otherwise.
The Cluster and Outlier Analysis tool in ArcGIS Spatial Statistics toolbox was used
to generate Anselin’s Local Moran statistics. For each year, the threshold distance was set at
the optimal scale previously found with the correlograms of Global Moran’s I. The
statistical significance was assessed by Z Scores with an alpha level of 5 %. A statistically
67

significant positive value of the Local Moran’s I for a HCCA indicated that the surrounding
HCCAs had similar incidence rates (IR). It could be either a HCCA with a high IR in a
neighbourhood that had high IR too (area described as high-high) or a HCCA with a low IR
in a neighbourhood that had low IR too (area described as low-low). A statistically significant
negative value of the Local Moran’s I for a HCCA indicated that this HCCA had a different
IR from its neighbours. It could be either a HCCA with a high IR in a neighbourhood that
had low IR (high-low area) or a HCCA with a low IR in a neighbourhood that had high IR
(low-high area). As the point was to identify high-risk areas, only high-high and high-low
HCCAs were mapped.
Kulldorff’s spatial scan statistic. The Kulldorff’s spatial scan statistic was used in
the SaTScan software (version 8.0, Kulldorff and Information Management Services, Inc.)
to test whether MM cases were distributed randomly over space during each year, and if
not, to statistically identify significant clusters of cases (Kulldorff, 1997; Sugumaran et al.,
2009). This method used a circular window which moved throughout the study area. This
window was centred on the centroid of each spatial unit and its radius varies from 0 to a
user-defined upper limit (the maximum spatial cluster size). For each location and size of
the scanning window, the software calculated a likelihood ratio function to test for elevated
risk within the window as compared to outside. The null hypothesis was that the risk was
the same throughout the study area. The window with the maximum likelihood was
defined as the “most likely” cluster (i.e. the cluster least likely to have occurred by chance).
The programme also identified secondary clusters and ordered them according to their
likelihood ratio test statistic. A cluster of disease cases could be constituted by either a
high-risk single HCCA or a high-risk group of HCCAs.
The analyses were conducted for each year separately like in the first method. A
data file containing MM cases and population data for the centroid (X and Y coordinates)
of each healthcare centre area in Niger was imported into SaTScan assuming a Poisson
probability disease model (case and at-risk population data). The maximum spatial cluster
size was set at the optimum distance identified with the correlograms of Global Moran’s I.
Only non-overlapping high-risk clusters were reported. P-values for maximum likelihood
ratios were based on 999 Monte Carlo replications of the data set. An alpha level of 5 %
was used to assess statistical significance.
To introduce the temporal component and test whether MM cases were distributed
randomly over space and time, a space-time scan (Kulldorff et al., 1998) was also
68

performed, by defining a cylindrical window with a circular geographic base and with
height corresponding to time. The radius of the base was varying between zero and the
same maximum spatial cluster size as in the purely spatial scan, while the height of the
cylinder, reflecting the time period of the potential clusters, was varying between zero and
one week. This maximum temporal cluster size of one week was chosen to be consistent
with the epidemiological surveillance based on weekly counts of cases.
69
4 Modèle spatio-temporel explicatif
70

Dans ce chapitre, nous présentons tout d’abord un résumé de l’Article II, puis le
reste du chapitre est constitué de l’article lui-même (en anglais). Seuls le format des
références bibliographiques et la numérotation des figures ont été modifiés afin de
s’intégrer de façon cohérente dans ce manuscrit de thèse. Les figures initialement en annexe
ont été réintégrées au fil du texte pour faciliter la lecture. Le PDF de l’article tel qu’il a été
publié en 2014 dans la revue PLoS Neglected Tropical Diseases (Paireau et al., 2014) est
disponible en annexe selon les préférences de lecture.
4.1 Résumé de l’Article II
Après avoir mis en évidence le caractère localisé des agrégats de méningite à
méningocoque et la grande variabilité intra-district et inter-annuelle dans la distribution de
l’incidence à l’échelle des aires de santé, notre deuxième objectif était d’identifier les
facteurs de risque, encore mal connus, pouvant expliquer ces augmentations locales
d’incidence dans une aire de santé et une année données. Pour ce travail de modélisation
statistique, nous nous sommes concentrés sur le principal agent étiologique identifié sur la
période d’étude, à savoir le méningocoque de sérogroupe A.
Ce travail a dans un premier temps nécessité d’importants efforts de collecte de
données qui ont pu être réalisés avec l’aide du CERMES et de ses partenaires locaux, et en
tirant profit de bases de données environnementales accessibles en ligne sous différents
formats. Les facteurs étudiés incluent notamment des facteurs environnementaux
(humidité, vent, poussières atmosphériques, couverture végétale…), épidémiologiques
(vaccination, épidémies dans les aires voisines, historique des épidémies des années
précédentes, interactions avec les autres sérogroupes…) et socio-démographiques (densité
de population, réseau routier, populations frontalières…). Il s’agit de la première étude
combinant à la fois des facteurs climatiques et non climatiques, réalisée à une échelle
spatiale aussi fine, et sur des cas confirmés de Nm A.
La stratégie de modélisation choisie est un modèle de régression hiérarchique
bayésien au niveau de l’aire-année, qui nous a permis de prendre en compte la sur-
dispersion et les corrélations spatiales et temporelles rencontrées dans les données
d’incidence et de contrôler pour les facteurs de confusion inconnus ou non mesurés. Ce
modèle a été développé sur deux zones géographiques : une zone de 669 aires de santé
dans la partie peuplée au sud du Niger, pour lesquelles les données de vaccination étaient
71

inutilisables car incomplètes, puis une zone de 59 aires de santé dans la région de Tahoua
pour lesquelles les données de vaccination étaient complètes.
Les deux modèles ont donné des résultats similaires et ont montré que des facteurs
à la fois climatiques et non-climatiques sont importants pour expliquer les variations spatio-
temporelles d’incidence : l’humidité relative moyenne entre novembre et juin sur toute la
zone d’étude et l’arrivée précoce des pluies en mars dans une aire de santé (uniquement
dans le premier modèle) sont des facteurs protecteurs ; un risque plus élevé est associé avec
le pourcentage d’aires de santé voisines ayant au moins un cas pendant la même année, la
présence d’une route traversant l’aire de santé et la détection de cas précoces avant fin
décembre dans une aire de santé. En parallèle, nous avons également montré, sur les sept
années d’étude, que l’incidence annuelle à l’échelle du pays augmente avec le nombre
d’épidémies localisées, le nombre d’aires ayant des cas précoces et, dans une moindre
mesure, avec l’intensité de ces épidémies localisées.
Ces résultats offrent un nouvel éclairage sur la dynamique spatio-temporelle des
épidémies de méningite en Afrique subsaharienne et permettent de mieux en comprendre
les facteurs de risque. Nous suggérons ainsi que la variabilité spatio-temporelle de
l’incidence de Nm A entre les années et les aires de santé résulte de variations dans
l’intensité et la durée des effets climatiques de la saison sèche sur le risque de maladie, et est
de plus impactée par des facteurs de contacts spatiaux représentant une transmission du
pathogène favorisée. Il reste cependant des facteurs à élucider, qui permettraient
d’expliquer les variations spatio-temporelles résiduelles observées dans le modèle
statistique.
Nous nous attacherons dans le chapitre suivant à développer une application
concrète en termes de santé publique, via l’élaboration d’un système d’alerte précoce pour
prédire la survenue d’épidémies localisées. Un tel modèle prédictif semble en effet réalisable
au vu des enseignements fournis par le modèle explicatif (importance des cas précoces dans
l’aire comme dans le pays, des interactions de voisinage et des conditions climatiques dès le
mois de novembre).
72

4.2 Article II : Spatio-Temporal Factors Associated with
Meningococcal Meningitis Annual Incidence at the Health Centre
Level in Niger, 2004-2010.
Juliette Paireau1, Halima B Maïnassara2, Jean-François Jusot2, Jean-Marc Collard3, Issa
Idi2, Jean-Paul Moulia-Pelat2, Judith E Mueller1,4 and Arnaud Fontanet1,5, 2014. Spatio-
Temporal Factors Associated with Meningococcal Meningitis Annual Incidence at the
Health Centre Level in Niger, 2004-2010. PLoS Neglected Tropical Diseases 8(5):e2899.
doi:10.1371/journal.pntd.0002899
1 Unité d’Épidémiologie des Maladies Émergentes, Institut Pasteur, Paris, France 2 Unité d’Épidémiologie/Santé-Environnement-Climat, Centre de Recherche Médicale et
Sanitaire (CERMES)/Réseau International des Instituts Pasteur, Niamey, Niger 3 Unité de Biologie, Centre de Recherche Médicale et Sanitaire (CERMES)/Réseau
International des Instituts Pasteur, Niamey, Niger 4 EHESP French School of Public Health, Sorbonne Paris Cité, Rennes, France 5 Conservatoire National des Arts et Métiers, Chaire Santé et Développement, Paris, France These authors contributed equally to this work.
4.2.1 Abstract
Background: Epidemics of meningococcal meningitis (MM) recurrently strike the African
Meningitis Belt. This study aimed at investigating factors, still poorly understood, that
influence annual incidence of MM serogroup A, the main etiologic agent over 2004-2010,
at a fine spatial scale in Niger.
Methodology/Principal Findings: To take into account data dependencies over space
and time and control for unobserved confounding factors, we developed an explanatory
Bayesian hierarchical model over 2004-2010 at the health centre catchment area (HCCA)
level. The multivariate model revealed that both climatic and non-climatic factors were
important for explaining spatio-temporal variations in incidence: mean relative humidity
during November–June over the study region (posterior mean Incidence Rate Ratio (IRR)
= 0.656, 95% Credible Interval (CI) 0.405–0.949) and occurrence of early rains in March in
a HCCA (IRR = 0.353, 95% CI 0.239–0.502) were protective factors; a higher risk was
associated with the percentage of neighbouring HCCAs having at least one MM A case 73

during the same year (IRR = 2.365, 95% CI 2.078–2.695), the presence of a road crossing
the HCCA (IRR = 1.743, 95% CI 1.173–2.474) and the occurrence of cases before 31
December in a HCCA (IRR = 6.801, 95% CI 4.004–10.910). At the study region level,
higher annual incidence correlated with greater geographic spread and, to a lesser extent,
with higher intensity of localized outbreaks.
Conclusions: Based on these findings, we hypothesize that spatio-temporal variability of
MM A incidence between years and HCCAs result from variations in the intensity or
duration of the dry season climatic effects on disease risk, and is further impacted by
factors of spatial contacts, representing facilitated pathogen transmission. Additional
unexplained factors may contribute to the observed incidence patterns and should be
further investigated.
4.2.2 Introduction
Meningococcal meningitis (MM) is caused by Neisseria meningitidis (Nm), a
commensal bacterium of the human nasopharynx transmitted by direct contact with
respiratory droplets from carriers and causing meningitis after crossing the nasopharyngeal
mucosa. Epidemics of meningococcal meningitis recurrently strike countries of the African
Meningitis Belt (Lapeyssonnie, 1963). In this sub-Saharan area, MM dynamics is
characterized by seasonality and spatio-temporal heterogeneity: the disease is endemic all
year round but every dry season, a hyper-endemic or epidemic increase in incidence is
observed, the magnitude of which varies between years and regions (Greenwood, 1999;
Mueller and Gessner, 2010). Within a country, localized outbreaks are reported at sub-
district scales (Paireau et al., 2012; Mainassara et al., 2010; Tall et al., 2012). Most epidemics
have been caused by meningococci of serogroup A but C, W or X outbreaks have also
been reported (Boisier et al., 2007; Broome et al., 1983; Decosas and Koama, 2002). Niger,
a landlocked country of the Belt, reported between 1000 and 13500 suspected meningitis
cases annually during 2004-2010, with case-fatality rates of 4–12% (WHO, 2013a). Over
the study period (2004-2010), the surveillance-based control strategy applied in Niger was
to launch reactive vaccination campaigns with A/C or A/C/W polysaccharide vaccines
once an outbreak has exceeded a threshold defined at the district level by the World Health
Organization (WHO) (World Health Organization, 2000).
More than 100 years after the first major epidemic reported in the Belt, the reasons
for the peculiar epidemiology of MM in Africa are still poorly understood (Greenwood,
74

2006). A combination of concomitant factors is probably necessary to trigger an epidemic
in a particular place at a particular time, involving the organism (e.g. strain virulence and
transmissibility (Taha et al., 2002)), the host (e.g. immune status and susceptibility (Tzeng
and Stephens, 2000; Moore, 1992)) and the environment (e.g. dry climate and dusty winds
(Palmgren, 2009)).
Previous statistical ecologic studies aiming at explaining the spatio-temporal
dynamics of MM epidemics in the Belt were mainly focused on climatic risk factors. These
studies sought for drivers of either the seasonality of epidemics (i.e. when the
onset/peak/end of the meningitis season occur) or their intensity (i.e. magnitude of
incidence over a chosen time period) at different spatial scales. According to most authors,
the temporal dynamics of sub-Saharan climate is the major driver of MM seasonality in the
Belt (Greenwood, 1999; Mueller and Gessner, 2010; Agier et al., 2013; Sultan et al., 2005;
Martiny and Chiapello, 2013). The suspected contribution of climatic factors to the
intensity of epidemics is still under debate. At the country level, Yaka et al partly related
annual incidence in Niger to the northern component of wind during November to
December (Yaka et al., 2008). At the district level, annual incidence in four African
countries was correlated to rainfall amount and dust load in the pre-, post- and epidemic
season (Thomson et al., 2006) and monthly incidence in one district of Ghana was
modelled by a combination of various climatic and non-climatic variables (Dukic et al.,
2012).
However, to our best knowledge, none of the published statistical models tried to
explain intensity of meningitis outbreaks at a finer spatial scale than the district, whereas
recent studies in Niger and Burkina Faso demonstrated that outbreaks occur at sub-district
scales in highly localized clusters (Mainassara et al., 2010; Paireau et al., 2012; Tall et al.,
2012). Besides, whereas two neighbouring areas (sharing similar climatic conditions) can
have different epidemic behaviours (Paireau et al., 2012; Tall et al., 2012), few models
combined climatic factors with other types of risk factors suspected to interact, such as
previous epidemics, vaccination campaigns, population density or proximity to infected
regions.
The objective of our paper was therefore to study the influence of climatic and
non-climatic factors on the spatio-temporal variations of annual incidence of MM
serogroup A, the main etiologic agent over the study period, at the health centre catchment
area (HCCA) scale in Niger, using a database of laboratory-confirmed cases and developing
an explanatory Bayesian hierarchical model from 2004 to 2010 at the HCCA-year level.
75

4.2.3 Methods
Ethics statement
This study was approved by the Clinical Research Committee of Institut Pasteur
and authorized by the National Consultative Ethics Committee of Niger and the two
French data protection competent authorities: CCTIRS (Comité Consultatif sur le
Traitement de l'Information en matière de Recherche dans le domaine de la Santé) and
CNIL (Commission Nationale de l’Informatique et des Libertés). The data collected
involving patients were anonymized.
Cartographic data
Spatial analyses were based on the National Health Map of Niger, created by the
Centre de Recherche Médicale et Sanitaire (CERMES) in 2008, at the level of the HCCAs,
areas which include all villages served by the same integrated health centre. We used the
2010 updated version of this National Health Map of 732 HCCAs, in the WGS84 geodetic
system with UTM 32N projection. On average, a HCCA covers a 40 × 40 km² area.
Study region
The study region comprised the 669 HCCAs of the southern most populated part
of Niger, located roughly to the south of the 16th parallel (Figure 10). It represents 96% of
the national population of 11 060 291 inhabitants (2001 national census). The semi-arid
tropical climate of this Sahelian region is characterized by a long dry season from October
to May and a rainy season from June to September. In the North lies the Sahara desert,
with less than one inhabitant per km².
Meningitis data
The CERMES is the national reference laboratory in charge of the microbiological
surveillance of bacterial meningitis in Niger. Basically, cerebrospinal fluid (CSF) samples
taken from suspected cases of meningitis by health care workers are routinely collected
throughout Niger and the etiological diagnosis is carried out by Polymerase Chain Reaction
(PCR) for all CSF. This enhanced surveillance system is active in the whole country since
2002, and has been described in detail elsewhere (Paireau et al., 2012). We used the
CERMES database for a retrospective study on confirmed MM A cases between 1 July
2003 and 30 June 2010. We aggregated MM A cases by HCCA and epidemiological year,
76

defined as running from 1 July of the year n–1 to 30 June of the year n, in order to cover an
entire meningitis season.
Figure 10. Spatial distribution of meningococcal meningitis A in Niger from July 2003 to June
2010. Cumulative incidence rates in each health centre catchment area (cases per 100000
inhabitants).
Vaccination data
Health districts were contacted to obtain data on polysaccharide vaccines (number
of delivered vaccine doses and/or vaccine coverage) at the HCCA level over the study
period and the previous two years. Full vaccination records could be collected only for
Tahoua region over 2002-2010. Missing data in records from other regions did not enable
us to use them in our analyses. We thus studied the effect of previous vaccination
campaigns conducted in Tahoua region during the years n-1 and n-2 on MM incidence of
year n. We considered different forms for the vaccination covariate: either the coverage rate
(as a continuous or categorized variable), the vaccination status (vaccinated: yes/no), or the
exceedance of several coverage thresholds (above threshold: yes/no). The cumulative
effect of successive vaccination campaigns could not be studied as only one HCCA was
vaccinated two years in a row.
77

Demographic data
The Institut National de la Statistique (INS) provided the number of inhabitants
per village according to the 2001 national census. We aggregated the villages’ populations at
the HCCA level and applied a mean annual population growth rate of 3.3% (provided by
the INS). We computed the population density covariate as the number of inhabitants per
HCCA divided by the HCCA surface area calculated in ArcGIS software (version 10.0,
ESRI Inc. Redlands, CA).
Road network
We retrieved a shapefile of primary roads from the HealthMapper application of
the WHO. This shapefile was superimposed to the National Health Map in ArcGIS. For
each HCCA, we computed its minimum distance to the closest primary road and expressed
it as a binary covariate (road versus no road) or a categorical covariate (classes of distance).
Landcover data
The landcover classification for Niger was obtained at a 1 km² resolution, from the
Land Cover Map of Africa from the Global Land Cover 2000 Project (Mayaux et al., 2003).
The main vegetation types represented in our geographical subset were different classes of
shrublands, grasslands and croplands.
Climate and aerosol data
Gridded climate data from 2003 to 2010 were extracted from ERA-Interim
reanalysis, produced by the European Centre for Medium-Range Weather Forecasts
(ECMWF) (Dee et al., 2011). We retrieved relative humidity, temperature, total
precipitation, U (west-east) and V (south-north) wind components at a 0.75° spatial
resolution at a daily time-step. To characterize the wind-blown mineral dust emission from
the Sahara, we used the Absorbing Aerosol Index (AAI), a dimensionless quantity which
indicates the presence of ultraviolet-absorbing aerosols in the Earth’s atmosphere (Torres
et al., 1998). The AAI used in this study is derived from the reflectances measured by
SCIAMACHY (Scanning Imaging Absorption Spectrometer for Atmospheric
Chartography) satellite instrument in the ultraviolet wavelength range (Tilstra et al., 2012).
We retrieved monthly gridded data (1.00° × 1.25° latitude-longitude grid) from 2003 to
2010 (www.temis.nl/airpollution/absaai/). As we were interested in how the climate of a
given year or season can influence the annual epidemic magnitude, we calculated multi-
78

monthly means of each climatic variable, averaged over periods relevant to the meningitis
season or the seasonal cycles of each climatic variable, both for each HCCA and for the
whole study region (see Figure 11 and Text S1 for further details).
Figure 11. Seasonality of climate and aerosols. Annual cycles of daily meteorological variables
(temperature, relative humidity, precipitation, U wind and V wind) and monthly Absorbing
Aerosol Index (AAI) averaged over the study region between 2004 and 2010.
79

Altitude data
Shuttle Radar Topography Mission (SRTM) elevation data were obtained from the
processed CGIAR-CSI (Consortium for Spatial Information) SRTM 90m Digital Elevation
Dataset version 4.1 (Jarvis et al., 2008), available as 5° × 5° tiles at a 3 arc second resolution
(approximately 90m). Six tiles were downloaded and combined in ArcGIS to cover the
whole study region.
Database preparation
Finally, we collated these multi-source and multi-format spatio-temporal datasets
and reconciled data at the HCCA level (i.e. cartographic, epidemiological, vaccination and
demographic data) and gridded data (i.e. landcover, climate, AAI and altitude data) by
averaging the gridded values over each HCCA using the statistical computing software R
(version 2.15.3, R Core Team, R Foundation for Statistical Computing, Vienna, Austria).
Then, in addition to the covariates described above, we created supplementary variables to
include in the statistical analyses. To take into account potential interactions with bordering
countries, we calculated in ArcGIS the minimum distance of each HCCA to the closest
border and expressed it as a binary variable (border versus no border) or a categorical
variable (classes of distance and classes of bordering countries). The five bordering
countries of our geographical subset are shown in Figure 10. To account for potential
geographic disparities in accessibility to health centres, we computed for each HCCA the
mean distance (weighted by the villages’ population) from villages to their health centre. To
represent the tendency of meningitis to occur in spatio-temporal clusters of neighbouring
infected HCCAs, we computed “neighbourhood” variables, using various definitions for
this spatio-temporal interaction (presence/total number of MM A cases in neighbours,
mean/maximum incidence and number/percentage of neighbours with MM A cases, over
an epidemiological year). Neighbours were defined as adjacent HCCAs (first order
neighbours), since a previous analysis showed that the median size of spatial clusters was of
two neighbouring HCCAs (Paireau et al., 2012). We also computed « historical » variables
describing what happened the previous year in terms of presence/number of MM A cases
and incidence, in each HCCA, in its neighbours and in its district (upper administrative
level) as potential proxies for natural immunity. We computed similar variables for other
Nm serogroups at the HCCA level in order to explore potential interactions between
serogroups. Finally, we included in the analyses the presence of early cases in each HCCA,
80

defined as cases occurring before 31 December following (Yaka et al., 2008), as an early
start of the hyper-endemic increase could indicate a higher epidemic risk.
Statistical Analysis
First, for descriptive purposes, we explored whether the annual epidemic
magnitude in the study region could be related to the annual and early geographical
distribution of MM A cases and localized outbreaks, using Pearson correlation coefficient.
We defined localized outbreaks as HCCAs exceeding an annual incidence threshold of
20/100000, corresponding to the 95th percentile of incidence, following the primary
reference used in (Tall et al., 2012).
Then, to investigate the spatio-temporal association of MM A annual incidence at
the HCCA level with climatic and non-climatic factors, we developed a retrospective
hierarchical model in Niger for 2004-2010, over two geographical subsets: (i) over the
whole study region of 669 HCCAs and (ii) over a subset of 95 HCCAs (located in Tahoua
region) for which vaccination data were fully available.
The modelling approach we adopted was a Bayesian negative binomial generalized
linear mixed model (GLMM). We assumed that the number of observed MM A cases in
each HCCA i and year t followed a negative binomial distribution with an unknown scale
parameter κ and mean µit. We modelled log(µit) as a function of covariates as described
above and appropriate random effects. Basically, we included spatial random effects at the
HCCA level, separated into a spatially unstructured component to capture the influence of
unknown factors that are independent across areas and a spatially structured component to
capture the influence of spatially correlated effects. The temporal structure was modelled
by yearly random intercepts. We included the expected number of cases in each HCCA i
and year t as an offset in the model to estimate the incidence rate ratios (IRRs) associated
with a unit increase in exposure, by exponentiating the regression coefficients.
A preliminary forward stepwise covariate selection was performed in R software,
estimating parameters by maximum likelihood. The Bayesian multivariate model was
subsequently developed in WinBUGS (Lunn et al., 2000), using Markov chain Monte Carlo
(MCMC) simulation methods. Further details on the modelling approach are given in Text
S2.
81

4.2.4 Results
Description of the data
In Niger, from 1 July 2003 to 30 June 2010, 5512 cases of Nm were biologically
confirmed. Other aetiologies included Streptococcus pneumoniae (N=850) and Haemophilus
influenzae (N=277). Serogroup A accounted for 72.4% (N=3988) of Nm cases and was
largely predominant every year, except during 2006 and 2010 when serogroups X and W
represented 48.9% and 71.6% of Nm cases, respectively. The median age of Nm A cases
was 8.3 years (interquartile range (IQR) 5–13). Among all Nm A cases, 97.0% originated
from our study region and 28.0% from our Tahoua subset (Figure 10). Nm A cases
essentially occurred over a six-month period: 98.1% of them were observed between
December and May, with a peak during February-April (80.4%). MM A temporal evolution
during July 2003-June 2010 (Figure 12) was characterized by considerable between-year
variations (17-fold increase between the lowest annual incidence of 0.7 per 100000 in 2005
and the highest annual incidence of 11.3 per 100000 in 2009).
Figure 12. Temporal distribution of meningococcal meningitis (MM) A in Niger from July 2003
to June 2010. Time series of daily cases smoothed by cubic spline.
Among the seven years of the study period, the annual MM A incidence across the
whole study region was correlated to the number of HCCAs having at least one MM A
82

case (r = 0.95, p < 0.01), to the number of localized outbreaks (r = 0.99, p < 0.01), to the
maximum annual incidence of the localized outbreaks (r = 0.80, p = 0.03), to the number
of HCCAs with at least one early case (r = 0.96, p < 0.01) and to the early incidence across
the study region (r = 0.93, p < 0.01). The corresponding graphs are displayed in Figure 13.
The median duration of the localized outbreaks (time between first and last cases) was 45
days (IQR 24-75).
Figure 13. Epidemiological characteristics related to annual incidence. Correlation between the
annual meningococcal meningitis (MM) serogroup A incidence in the study region and
epidemiological features of the MM A cases distribution (annual in dark blue and early in light
blue) in health centre catchment areas (HCCAs) over the seven years of the study period.
83

Bayesian multivariate model over the study region
In the Bayesian multivariate model over the whole study region, the overdispersion
parameter of the negative binomial (κ-1) had a posterior mean value of 2.586 (95% CI =
2.223–2.998) (Table 3). This was significantly different from zero, which confirmed that the
negative binomial formulation was necessary to account for extra-Poisson variation in the
dataset.
Regarding fixed effects, five covariates were significantly associated with MM A
incidence (the 95% CI of their associated IRR did not contain 1). A reduced risk was
associated with higher average relative humidity during the meningitis season (November-
June) over the study region (posterior mean IRR = 0.656, 95% CI 0.405–0.949). Early rains
in March in an HCCA represented a protective spatio-temporal factor (IRR = 0.353, 95%
CI 0.239–0.502). The analyses identified three non-climatic factors; a positive association
was found between disease incidence and percentage of neighbouring HCCAs having at
least one MM A case during the same epidemiological year (IRR = 2.365, 95% CI 2.078–
2.695), as well as presence of a road crossing the HCCA (IRR = 1.743, 95% CI 1.173–
2.474) and occurrence of early cases before 31 December in a HCCA (IRR = 6.801, 95%
CI 4.004–10.910).
Table 3. Results from the Bayesian hierarchical model of meningococcal meningitis (MM) A
annual incidence at the health centre catchment area (HCCA) level over the study region, Niger
2004-2010. Posterior mean parameter estimates and their 95% credible intervals (CIs) for the
“null” model (no covariates included) and the multivariate model.
Null Model Multivariate model
Parameters Posterior mean 95% CI* Posterior mean 95% CI*
Fixed effects (IRR†)
Early cases (yes vs. no) 6.801 (4.004,10.910)
Neighbouring HCCAs with MM A cases‡ (%) 2.365 (2.078,2.695)
Road (yes vs. no) 1.743 (1.173,2.474)
Early rains (yes vs. no) 0.353 (0.239,0.502)
Mean seasonal humidity‡ (%) 0.656 (0.405,0.949)
Random effects
Spatial structured hyperparameter (σu²) 1.470 (0.799,2.295) 0.174 (0.010,0.488)
Spatial unstructured hyperparameter (σv²) 1.965 (1.278,2.761) 2.579 (1.974,3.294)
Temporal hyperparameter (σφ²) 1.755 (0.539,5.154) 0.303 (0.073,0.978)
Overdispersion parameter (κ-1) 4.009 (3.485,4.601) 2.586 (2.223,2.998)
* CI: Bayesian credible interval † IRR: Incidence rate ratio
‡ Standardized variables
84

The variances of the spatially structured and unstructured random effects were
respectively 0.174 (95% CI 0.010–0.488) and 2.579 (95% CI 1.974–3.294) (Table 3). The
posterior mean estimate of the spatial fraction was 0.062 (95% CI 0.004–0.166), meaning
that most of the residual area-specific variability was spatially unstructured. Spatial
correlation was almost totally captured by the multivariate model. The year-specific random
effects also significantly contributed to the model (Table 3) and the inclusion of covariates
helped to decrease the temporal random effects variance compared to the null model.
A scatter plot of the 4683 fitted posterior mean MM A cases versus the observed
MM A cases shows the overall goodness of fit of the model (Figure 14.A). The inter-annual
variations of incidence at the study region level were correctly captured by the model
(Figure 14.B).
Figure 14. Multivariate model goodness of fit. (A) Scatter plot of the fitted posterior mean
numbers of meningococcal meningitis A cases per year and health centre catchment area and
their 95% credible intervals (CIs) (light-blue shaded region) versus the observed numbers. (B)
Observed incidence rates (horizontal blue lines) per year over the study region and their
corresponding fitted posterior mean annual incidence rates (filled dark-blue circles) and their
95%CIs (vertical dark-blue lines).
Bayesian multivariate model over Tahoua subset
In Tahoua subset during 2002-2010, mass campaigns of A/C or A/C/W
polysaccharide vaccination have been conducted in 53 HCCAs-years out of 665; the
median reported vaccination coverage was 80.0% (IQR 53.5-89.2%).
85

The final multivariate model over Tahoua subset yielded similar results as the
model over the whole study region (Table 4). The same covariates were independently
associated to disease incidence, except that early rains were no longer significant over this
smaller geographical subset. No vaccination covariates were significant.
Table 4. Tahoua model results. Results from the Bayesian hierarchical model of meningococcal
meningitis (MM) A annual incidence at the health centre catchment area (HCCA) level over
Tahoua subset, Niger 2004-2010. Posterior mean parameter estimates and their 95% credible
intervals (CIs) for the “null” model (no covariates included) and the multivariate model.
Tahoua null model Tahoua multivariate model
Parameters Posterior mean 95% CI* Posterior mean 95% CI*
Fixed effects (IRR†)
Early cases (yes vs. no) 6.087 (2.113,14.920)
Neighbouring HCCAs with MM A cases‡ (%) 2.834 (1.845,4.319)
Road (yes vs. no) 2.471 (1.067,5.000)
Mean seasonal humidity‡ (%) 0.530 (0.276,0.845)
Random effects
Spatial structured hyperparameter (σu²) 0.110 (0.001,0.905) 0.022 (0.001,0.142)
Spatial unstructured hyperparameter (σv²) 1.539 (0.504,2.886) 1.842 (0.833,3.292)
Temporal hyperparameter (σφ²) 3.327 (1.016,9.495) 0.324 (0.001,1.317)
Overdispersion parameter (κ-1) 2.285 (1.623,3.133) 1.830 (1.257,2.562)
* CI : Bayesian credible interval † IRR : Incidence rate ratio
‡ Standardized variables
4.2.5 Discussion
To our knowledge, this study is the first spatio-temporal statistical model in the
African Meningitis Belt developed at a spatial scale as fine as the health centre catchment
areas and using laboratory confirmed cases of meningococcal meningitis. Relying on
advanced statistical methods, we demonstrated that both climatic and non-climatic factors
(occurrence of early rains, mean relative humidity, occurrence of early cases, presence of
roads and spatial neighbourhood interactions) are important for explaining spatio-temporal
variations in MM A annual incidence at the HCCA level.
Appropriate statistical methods are necessary to investigate the underlying drivers
of observed patterns of count data in small areas with spatio-temporal correlations.
Hierarchical regression models of the Bayesian family have proven useful to analyse the
spatio-temporal dynamics of infectious diseases in different settings, such as dengue in
86

Brazil (Lowe et al., 2013), soil-transmitted helminth infections in Kenya (Pullan et al., 2011)
or schistosomiasis in China (Wang et al., 2008). The Bayesian formulation allows to
acknowledge the uncertainty associated with all model (hyper)parameters (fixed and
random), to include a spatial correlation structure within a prior distribution (Lawson,
2006) and leads to more robust estimates in particular when the geographical level is small
and the disease rare (Elliott et al., 2000b). Such models are still rarely applied to MM in
Africa. The modelling approach we adopted was a negative binomial GLMM using
Bayesian estimation, to control for unobserved confounding factors and take into account
the dependencies over space and time encountered in our dataset, incorporating year-
specific and area-specific random effects (Fong et al., 2010; Lawson, 2006). Ignoring these
multiple correlations could lead to overestimate the significance of the covariates (Wang et
al., 2008). This model also accounted for extra-Poisson variation (overdispersion) in the
count data via the negative binomial formulation, allowing the variance to be larger than
the mean.
Another noteworthy feature of our analysis lies in its spatio-temporal resolution,
uncommon for a country of the Belt. Since outbreaks have been shown to occur in spatially
localized clusters at a sub-district level (Mainassara et al., 2010; Paireau et al., 2012; Tall et
al., 2012), we considered primordial to analyse MM A dynamics at a finer spatial scale than
the more usual country or district levels (Agier et al., 2013; Sultan et al., 2005; Martiny and
Chiapello, 2013; Yaka et al., 2008; Thomson et al., 2006; Molesworth et al., 2003; Bharti et
al., 2012). From a public health perspective, the health centre catchment area used in this
study is also a judicious choice. Indeed, the Nigerien health care system is based on these
integrated health centres, which constitute the lowest health level (sub-district) and whose
locations are chosen according to accessibility for populations. Regarding the time scale, to
comply with our objective of explaining the overall annual burden of MM A in an area
during each meningitis season, we chose to conduct analyses at the year level. We did not
seek in this paper to model the seasonality of meningitis, which would have implied
working at least at month (like in (Dukic et al., 2012)) or week (like in (Agier et al., 2013;
Sultan et al., 2005)) level. Our approach did not allow explaining intra-seasonal temporal
dynamics and diffusion patterns – which were partly described in a previous paper (Paireau
et al., 2012). This would constitute a distinct research question that the one tackled in this
paper and should be further investigated.
The results of this study bring new insights into the epidemiology of MM in the
Belt and the risk factors that play a role in the spatio-temporal variations of incidence. First,
87
we observed that, at the study region level, higher annual incidence correlated with larger
number of HCCAs having at least one MM A case, with larger number of localized
outbreaks and, to a lesser extent, with higher intensity of these localized outbreaks. This
brings support to Mueller and Gessner hypothesis that the magnitude of incidence during
meningitis seasons in a region or country can increase if the geographical expansion and/or
the intensity of localized epidemics increase (Mueller and Gessner, 2010). The
epidemiology thus changes from a regular year with a small number of localized epidemics
in the region to an epidemic wave with many localized epidemics. We then sought to
evaluate factors that could be associated with the occurrence of these localized incidence
increases in a particular area during a particular year. Based on the factors that emerged
from our model and that we discuss below, we hypothesize that spatio-temporal variations
in MM A incidence between years and HCCAs result from variations in the intensity or
duration of the dry season climatic effects on disease risk, and is further impacted by
factors of spatial contacts, representing facilitated pathogen transmission.
First, the presence of primary roads and neighbourhood effects in the multivariate
model indicates that human contacts and movements are important contributing factors
that we assume to likely play a role in the transmission of the meningococcus, and/or an
epidemic co-factor (e.g. respiratory virus (Mueller and Gessner, 2010)). HCCAs crossed by
a road would be statistically more prone to re-infections from distant areas than isolated
HCCAs outside the primary road network, and would experience higher transmission levels
due to higher intensity of human movements and contacts. Yet, we cannot exclude that
differences in accessibility to health centres contributed to bring out primary roads as a risk
factor. One could also argue that health centres served by a road sent more CSF samples
due to easier logistics. However, another study conducted in Niger and based on reported
suspected cases (not affected by a potential logistic bias) also showed fewer absences and
higher reappearance rates of meningitis cases in districts along primary roads (Bharti et al.,
2012). The percentage of neighbours with cases, representing local spatio-temporal
interactions, is not a surprising risk factor. Indeed, a previous study (Paireau et al., 2012)
showed that cases usually tended to be clustered in space and that these clusters most often
encompassed a small number of HCCAs. Areas with more infected neighbours would be
more likely to be infected by local spatial transmission.
Then, the presence of climatic parameters in the multivariate model indicates that,
beyond an influence on MM seasonality agreed by several authors (Greenwood, 1999;
Mueller and Gessner, 2010; Agier et al., 2013; Sultan et al., 2005; Martiny and Chiapello,
88

2013), climate can have a quantitative impact on inter-annual variations of incidence. The
main physiopathological hypothesis for the role of climate is that dryness and dusty winds
would damage the nasopharyngeal mucosa and increase the risk of bloodstream invasion
by a colonizing meningococcus, and thus the case-to-carrier ratio (Greenwood, 1999).
Here, we found that annual incidence was negatively correlated to mean seasonal humidity
over the study region. This factor was purely temporal (equal IRR for all spatial units
within the same year), suggesting that humidity did not have spatial, but only temporal
effect. At the study region level, the seasons of highest MM A incidence were also the
seasons of lowest mean humidity. The between-year variations in humidity were not large
but the results suggest that even a small decrease in humidity, resulting in a small increase
in the case-to-carrier ratio according to the physiopathological hypothesis, can have a
significant impact on the global MM A risk in all HCCAs, as these dryer conditions start in
October and persist over several months (cumulative effect) and over a large geographical
region. Similarly, Yaka et al detected a quantitative effect of climate on inter-annual
variations of meningitis at the country level but November and December northerly winds
were their best predictors (Yaka et al., 2008). This difference might be explained by the fact
that they only considered the climatic conditions over the early dry season and not over the
whole meningitis season. Interestingly, a second climatic factor, the occurrence of early
rains in March, has a significant effect at the HCCA level. It has been noticed that the
meningitis season seemed to stop at the onset of the rainy season, again explained by a
decrease in invasiveness possibly due to less irritating conditions for the pharyngeal mucosa
(Greenwood, 1999). Our results are in agreement with this observation and, more precisely,
show that the local occurrence of first rains in March, i.e. before the real beginning of the
rainy season in the country, is a protective factor. The rains would thus stop the harmful
effect of dryness and prevent local outbreaks to further develop.
The last and particularly strong factor that emerged from our model is the presence
of early cases in a HCCA (before 31 December). It can be interpreted as a risk factor in
itself (an outbreak would have more time to develop if it starts earlier), as an indicator of
longer exposure to irritating climatic conditions of the dry season, or as a proxy of other
factors responsible for the presence of the bacteria and higher levels of carriage and/or
invasion. In any case, this parameter remains a strong determinant of high incidence in a
HCCA. At the study region level, we also showed that the annual MM A incidence was
correlated to the number of HCCAs with at least one early case and to the overall early
incidence. Two other studies stressed the importance of early cases in the final size of the
89

epidemic: an early onset was a good predictor of an epidemic at the district level in (L.
Agier et al., 2013) and the number of cases during the peak months increased with the
number of early cases occurring between October and December at the country level
(Niger) in (Yaka et al., 2008). WHO also considers early cases in the season as a warning
sign of large epidemic (World Health Organization, 2000).
Surprisingly, vaccination the previous or the two previous year(s) was not found to
be a protective factor in Tahoua subset. However, we cannot rule out the possibility that
the low number of vaccinated HCCAs-years in our subset (8%) may have induced a lack of
power to show a true protective effect of vaccination. This result could also be partially due
to the decline of polysaccharide vaccine efficacy to 87% and 70% at one and two years
after vaccination, respectively (Reingold, 1985). It is also possible that the provided data
lack representativeness and over-estimate the real coverage. Of note, we decided not to
study the impact of year n vaccination on year n incidence within this model formulation, as
reactive vaccination would be associated with larger outbreaks (those which required
vaccination) and, considering delays in implementing vaccination campaigns, would
artificially appear in the model as a risk factor (Cuevas et al., 2007; Woods et al., 2000).
Residual spatio-temporal variations that remained unexplained by the covariates
included in our model suggest that other unknown or unmeasured factors contributed to
the observed incidence. First, because our study concerned an ecologic investigation,
suspected factors at the individual level (e.g. age, immuno-depression, smoking…) could
not be accounted for. Then, the temporal variations at the country level could be suspected
to be influenced by higher susceptibility due to waning pre-existing immunity (Moore,
1992) or emergence of a new variant that can escape herd immunity (Leimkugel et al., 2007;
Taha et al., 2002). However, the length of the study period did not enable us to study these
effects: molecular characterization of Nm A isolates showed that the same sequence type
(ST-7) was predominantly circulating in Niger during 2004-2010 (Collard et al., 2013a;
Caugant et al., 2012). At the spatial level, the residual purely spatial variation observed in
our model was mainly unstructured. The covariates better explained the spatial correlation,
which both reflects shared environmental conditions and true epidemic diffusion, than the
unstructured spatial variations. This suggests that other factors specific to each HCCA,
such as quality of local health services or local behavioural practices, could contribute to
explain the between-area heterogeneity in MM A incidence. The difficulty to measure such
factors made the inclusion of area-level random effects necessary. Finally, other
unexplained factors, such as respiratory viral co-infections, might contribute to the residual
90

spatio-temporal heterogeneity, via an effect on transmission, colonization and/or invasion
(Mueller and Gessner, 2010). Although difficult to collect retrospectively, these factors
should be further investigated at the health centre level and at least properly accounted for
in any modelling attempt. Mathematical models, still little developed on this topic (Irving et
al., 2012a), could also help us to better understand the role of carriage and immunity in the
epidemic dynamics.
This study relied on a unique dataset which provided a very precise picture of MM
A spatio-temporal dynamics in Niger over seven years, and has already been used in
published spatio-temporal analyses (Mainassara et al., 2010; Paireau et al., 2012). The cases
were all biologically confirmed by CERMES laboratory, which allowed us to exclude
misclassified infectious agents that give similar clinical signs of meningitis. Databases
commonly used by most statistical studies on MM in the Belt (e.g. (Agier et al., 2013;
Martiny and Chiapello, 2013; Sultan et al., 2005; Thomson et al., 2006; Yaka et al., 2008))
gather clinically-suspected cases of meningitis, and thus include a mixture of different Nm
serogroups and other bacteria such as S. pneumoniae and H. influenzae. In Niger, over our
study period, 40% of positive CSFs were infected by another agent that Nm A. Relying
only on suspected cases would therefore introduce a large number of misclassified cases. If
etiological confirmation by conventional PCR may have led to under-estimation of positive
cases (Collard et al., 2013b), this should have affected the data in a spatially and temporally
consistent way, as biological testing was performed with the same PCR assay by the same
laboratory all along the study period. Our system may also suffer from underreporting
from areas where performing a lumbar puncture and shipping the samples may represent
logistical difficulties. We therefore excluded from the analyses the remote northern regions
where population is very sparse and mainly nomadic. We can also consider that the
potential variability in reporting rates has been taken into account through the explicit
inclusion of overdispersion and spatial heterogeneity in our model. Besides, this
surveillance system was extended to the whole country in 2002 (it was only effective in the
capital city before) and might have been unsteady during the first months following its
implementation. To reduce this potential temporal bias, we started our analyses in 2004,
being confident that the system had thus reached a stable state. Finally, like in many other
settings, the population affected by meningitis may not be entirely covered by the
surveillance system. However, we can reasonably assume that most meningitis cases,
because of their severity, end up reaching the health centres, with or without prior self-
treatment or consultation of a tradi-practitioner (Hayden et al., 2013). Moreover, social and
91

spatial disparities in care-seeking behaviours are probably reduced by free healthcare
offered to all people suffering from meningitis in Niger. For all the reasons above, we are
thus confident that the surveillance system is representative enough and that
underreporting did not substantially affect the validity of our results, which are more likely
to reflect the true underlying risk factors than the spatial disparities in the surveillance
system efficiency.
To conclude, this study brings new insights into the epidemiology of meningitis in
the Belt and allowed us to disentangle the climatic and non-climatic risk factors that play a
role in the spatio-temporal variations of annual incidence at the health centre level. Besides,
in the light of our results, a potential predictive model could rely on factors such as early
cases in an area and its neighbours and early climatic conditions, provided their predictive
value is evaluated. This could aid the development of an early warning system at the
beginning of the meningitis season, following other recent attempts (Agier et al., 2012).
Despite new hope brought by the introduction of a meningococcal A conjugate vaccine
(Caini et al., 2013), the ways in which the meningococcus will adapt to this changing
situation are unknown and other serogroups such as W and X might replace A as the
dominant serogroup. Such modelling could thus be tested on these serogroups, which
would likely be influenced by most of the identified risk factors due to similar ways of
transmission and invasion, and applied in other sub-Saharan countries sharing these
peculiar epidemiological and climatic features.
4.2.6 Acknowkledgments
We thank all the doctors and health staff who took part in the surveillance system,
the Nigerien Ministry of Health, the DSRE, the General Directors of CERMES, and all the
CERMES staff from the Biology and Epidemiology Units, with many thanks to Noémie
Phulpin, Oumarou Alto and Florian Girond for health map and database development. We
also thank the MERIT community and in particular the MAMEMA group for helpful
discussions.
92

4.2.7 Supporting information
Text S1. Explanations on the computation of climate and aerosol covariates
based on the seasonal cycles shown in Figure 11
The study region has a semi-arid tropical climate, characterized by two main
seasons: a rainy season from June to September and a long dry season that can be
subdivided into a hot season (October to mid-November), a cooler season (end of
November to February) and a very hot season (March to May). The seasons are caused by
the annual north-south movement of the intertropical convergence zone: during the wet
season, rains are brought by the monsoon winds blowing from the southwest whereas the
dry and dust-laden Harmattan winds blow from the Sahara during the dry season. As we
were interested in how the climate of a given year or season can influence the annual
epidemic magnitude, we calculated multi-monthly means of each climatic variable to
include in the model, averaged over periods relevant to the meningitis season or the
seasonal cycles of each climatic variable, both for each health centre catchment area and for
the whole study region. First, each climatic variable was averaged over the broad meningitis
season (November to June) represented on Figure 11 by a horizontal dotted line at the top
of each panel. In addition, sub-periods within the meningitis season were chosen according
to the seasonal cycles of each climatic variable. These periods are represented by grey
shading on Figure 11 and were chosen as follows. For temperature, two key periods were
identified: December-February (cooler season) and March-June (very hot season). For
relative humidity, two key periods were identified: November-January (first half of the very
dry season) and February-April (second half of the very dry season). For precipitation, two
key periods were identified: March or March-April (early rainfalls), and May-June (very
beginning of the rainy season). For the last three variables, zonal wind component (U),
meridional wind component (V) and AAI, two key periods were identified: November-
December (first half of the Harmattan season) and January-March (second half of the
Harmattan season). After March, the aerosols rise into the atmosphere and the AAI is no
longer representative of the dust at the surface (Agier et al., 2013).The months of
April/May represent a transition period between the Harmattan and the monsoon regimes.
93

Text S2. Model description
Basic modelling framework. The modelling approach we adopted was a negative
binomial generalized linear mixed model (GLMM). GLMMs combine the properties of two
statistical frameworks, linear mixed models (which incorporate random effects on the linear
predictor scale) and generalized linear models (which handle non-normal data by using link
functions and exponential family) (Bolker et al., 2009). Let Yit denote the number of
observed MM A cases in HCCA i (i = 1,…,669) and year t (t = 1,…,7). We assumed that
the counts Yit followed a negative binomial distribution with an unknown scale parameter κ
and mean µit=λitEit, where Eit was the expected number of cases in HCCA i and year t
(calculated as the population of HCCA i and year t multiplied by the overall MM A
incidence rate for the whole dataset) and λit was the unknown relative risk for HCCA i and
year t. We specified a log-linear model for the relative risks as a function of covariates and
appropriate spatio-temporal random effects.
We included random effects at the HCCA-level (spatial random effects) and the
year level (temporal random effects) to account for unknown or unmeasured risk factors by
introducing an extra source of variability into the model. The HCCA-level random effects
Vi captured the influence of factors that were specific to each area and that made
observations from the same HCCA more likely to be alike (e.g. quality of local health
services or local behavioural practices). Similarly, we included yearly random intercepts φt
to adjust on factors that influenced the overall annual epidemic risk (e.g. arrival of a new
strain or waning herd immunity) and made observations from the same year more likely to
be alike. We also tested a spatio-temporal interaction term θit (observation-level random
effects). Alternative sub-models were tested in R software within the frequentist
framework, estimating parameters by maximum likelihood, and compared using Akaike
Information Criterion (AIC) to determine the hierarchical structure that led to the best
balance between goodness of fit and complexity. The resulting AICs are given in Table 5
below. The model with the lowest AIC included the spatial and temporal random effects.
Afterwards, we used exploratory univariate analyses to identify covariates Xk
significantly associated with MM A incidence at 5% level by likelihood ratio test. We then
performed a forward stepwise selection procedure based on AIC, manually incorporating
the selected covariates, until no additional covariate improved the model’s AIC. We
checked interactions and collinearity between covariates.
94

Table 5. AICs and components of submodels(α is the overall intercept).
Submodel AIC Model for log(λit)
1 6859.1 α
2 6760.5 iV+α
3 6594.4 tϕα +
4 6350.2 tiV ϕα ++
5 6350.0 ittiV θϕα +++
6 5949.1 ∑+++itkkti XV βϕα
Bayesian formulation and implementation. Finally, the best model was
estimated in a Bayesian framework, which leads to more robust estimates when the
geographical level is small and the disease rare (Elliott et al., 2000b) and allowed us to
further include spatial and temporal correlation structures within prior distributions
(Lawson, 2006). Within this framework, we thus decomposed the HCCA-level random
effect into two components, following the model proposed by Besag et al (1991), known as
the convolution BYM (Besag, York and Mollié) model. To the previous unstructured
spatial random part Vi, we added a second component, which captured the influence of
spatially correlated effects Ui that made observations which occurred closer together in
space more likely to be alike (e.g. other environmental effects). Similarly, we also tested
structured temporal random effects θt (as random walk of order 1). These structured
temporal effects did not improve the model’s Deviance Information Criterion (DIC), but
the BYM formulation lowered the DIC of 17 units compared to the model with a single
unstructured spatial component. The final formulation of our Bayesian GLMM was then:
itY ~ ),( κλµ ititit ENegBin = 7,...,1,669,...1 == ti
)log()log()log( ititit E λµ += ∑ +++++=k
tiiitkkit VUXE ϕβα)log(
α ~ ),( +∞−∞U
kβ ~ )10,0( 5N
iU ~ ),( 2
uWCAR σ
iV ~ ),0( 2
vN σ
tϕ ~ ),0( 2
ϕσN
2
1
u
u στ = ,
2
1
v
v στ = ,
2
1
ϕϕ στ = ~ )0005.0,5.0(Ga
)log(κ ~ )10,0( 4N
95

The term α was the overall intercept. The Xk represented the spatio-temporal covariates
and the βk the associated regression coefficients. The spatially and temporally unstructured
random effects were assigned normal priors. The spatially structured random effects were
assigned a conditional autoregressive (CAR) model prior, as follows:
ijji UU ≠, ~ ),( 2
iiuN σ , ∑∑
=j ij
j jij
iw
Uwu ,
∑=
j ij
ui
w
22 σσ
where the weights wij reflected the spatial proximity of HCCA i and j. We considered an
adjacency neighbourhood structure where wij = 1 if HCCAs i and j shared a common
boundary and wij = 0 otherwise. Only first order neighbours were considered since a
previous analysis showed that the median size of spatial clusters was of two neighbouring
HCCAs (Paireau et al., 2012). This CAR model implied that each Ui conditional on the
neighbouring Uj followed a normal distribution with mean equal to the average of
neighbouring Uj and variance inversely proportional to the number of neighbours ni = Σj wij.
As the CAR model formulated above was improper, a uniform flat prior for the intercept α
was specified and a sum-to-zero constraint was imposed on the Ui (Best et al., 1999). The
relative contribution of spatial vs unstructured heterogeneity was given by the spatial
fraction, defined as the marginal variance of the spatial effects divided by the sum of this
variance with the marginal variance of the unstructured random effects. Because we wanted
the observations, not the priors, to drive the conclusions, we chose vague priors. We chose
diffuse Normal priors with mean 0 and precision 1x10⁻⁵ for the regression coefficients βk.
Gamma hyperprior distributions with shape parameters 0.5 and inverse scale parameters
0.0005 were specified for the inverse variances (precisions) of the spatial and temporal
random effects, following (Kelsall and Wakefield, 1999). We used a Normal prior with
mean 0 and precision 1x10⁻⁴ for the log scale parameter of the negative binomial
distribution.
The model was fitted in the Bayesian framework using Markov Chain Monte Carlo
(MCMC) simulation methods implemented in WinBUGS software. Because models must
be completely specified by the user, WinBUGS may not be viewed by some as being as
user-friendly as other statistical software packages, but having to specify a model in
WinBUGS insures a basic understanding of underlying processes that may not accompany
use of many common statistical software packages. Model code is available from the
corresponding author. We standardized the relevant covariates to zero mean and unit
variance, to aid MCMC convergence. Two parallel MCMC chains were run starting from
96

different initial values. Convergence was assessed by visual examination of time-series plots
and calculation of Gelman&Rubin diagnostic test (Gelman and Rubin, 1992). On this basis,
each chain was run for 200000 iterations, discarding the first 25000 samples of each
simulation as burn-in, with a thinning of 5 (to reduce autocorrelation). Posterior estimates
were based on pooling the 2x35000 samples, giving Monte Carlo standard errors of less
than 5% of the posterior standard deviation for all parameters, as usually recommended
(Roberts, 1996). For epidemiological interpretation, we exponentiated the regression
coefficients (exp(βk)) to represent the incidence rate ratios (IRRs) associated with a unit
increase in exposure (i.e. the incidence rate for a given value (respectively category) of a
continuous (resp. categorical) exposure variable, divided by the incidence rate for that
exposure value (resp. category) minus one unit (resp. level)), and calculated their 95%
credible intervals (CIs). We used a similar model formulation for the second model over
Tahoua subset and followed the exact same procedure as described above. The only
difference was the inclusion of vaccination data (described in the main Methods section) in
the covariates selection process.
97

5 Modèle spatio-temporel prédictif
98

Dans ce chapitre, nous présentons les développements en cours concernant
l’élaboration d’un modèle prédictif des épidémies de méningite au Niger. Encouragés par
les résultats du modèle spatio-temporel explicatif, notre objectif est ici de développer un
système d’alerte précoce pour aider en temps réel les autorités sanitaires à la prise de
décision pour le contrôle des épidémies. Les résultats sont préliminaires, certaines analyses
devant encore être approfondies, comme cela est discuté dans la dernière partie du
chapitre.
5.1 Introduction
Contexte
Suite à l’introduction récente d’un vaccin conjugué contre le méningocoque A,
l’épidémiologie du méningocoque à travers l’Afrique subsaharienne est indéniablement
appelée à évoluer, avec le recul du principal sérogroupe responsable des épidémies (OMS,
2013). Cependant, cela ne signifie pas que cette région du monde sera totalement libérée de
la méningite à méningocoque, puisque d’autres sérogroupes tels que le W et le X, non
ciblés par l’actuel vaccin conjugué monovalent, ont aussi un potentiel à causer des
épidémies (Boisier et al., 2007; Decosas and Koama, 2002). De plus, il n’est pas exclu que le
sérogroupe A réapparaisse, selon la durée de protection du vaccin conjugué et l’efficacité
des stratégies de vaccination qui seront adoptées après les campagnes de masse pour
maintenir un niveau de protection suffisant dans la population. Par conséquent, il reste
nécessaire d’améliorer les stratégies de vaccination réactive recommandées par l’OMS, qui
étaient en œuvre avant l’introduction du vaccin conjugué et qui continuent à être
appliquées dans les pays de la ceinture lorsqu’une épidémie est détectée.
Rappelons brièvement les principes de cette stratégie réactive (OMS, 2000). La
surveillance des cas suspects de méningite (définis sur la base d’un diagnostic clinique, cf.
2.1.4) est réalisée à l’échelle des districts, par semaine. Les épidémies (définies par une
incidence annuelle > 100 cas/100 000 habitants) sont détectées en utilisant des seuils
d’incidence hebdomadaire. Deux seuils ont été définis, un seuil d’alerte et un seuil
épidémique, qui appellent des actions différentes (Figure 2). Le seuil d’alerte (> 5
cas/100 000 habitants dans les districts > 30 000 habitants) permet au pays de commencer
à se préparer en cas d’épidémie. Une fois seulement que le seuil épidémique a été franchi
(> 10 ou 15 cas/100 000 habitants selon les situations, dans les districts > 30 000
habitants), le pays peut mettre en œuvre la vaccination de masse dans le district, distribuer
99

les traitements adaptés et informer la population. Pour des districts de moins de 30 000
habitants, ces seuils sont définis non plus en termes d’incidence, mais en nombre de cas
bruts, afin d’éviter les fluctuations importantes de l’incidence dues à la petite taille de
population (OMS, 2000). Un Groupe International de Coordination pour
l’approvisionnement en vaccin méningococcique (GIC) a été créé pour gérer, au niveau de
l’ensemble des pays subsahariens, le stock de vaccins polyosidiques disponibles. Chaque
pays peut commander des vaccins au GIC une fois que l’épidémie est détectée
(dépassement du seuil épidémique) et l’étiologie confirmée en laboratoire. Or, le temps de
prendre la décision de vacciner, recevoir les vaccins et organiser la campagne, la vaccination
arrive souvent après le pic naturel de l’épidémie et ne permet de prévenir qu’une trop faible
proportion des cas théoriquement évitables (Cuevas et al., 2007; Kaninda et al., 2000;
Woods et al., 2000). L’OMS, conscient des limites de cette stratégie, est donc demandeur
auprès des scientifiques de nouveaux modèles statistiques qui permettraient de donner
l’alerte de façon plus précoce et ainsi de lancer des campagnes de vaccination suffisamment
tôt pour être efficaces (Health and Climate Foundation, 2010). La stratégie actuelle, qui ne
s’appuie que sur les données de surveillance de la méningite, pourrait éventuellement tirer
parti de l’inclusion dans les modèles statistiques de données sur les facteurs de risque
potentiels.
Études précédentes
Quelques articles récents ont tenté de développer de tels modèles statistiques
prédictifs. Stanton et al. (2013) comparent ainsi les performances de quatre modèles
différents développés sur les données de notification du Niger entre 1986 et 2007. Ces
modèles sont basés sur des incidences hebdomadaires à l’échelle des districts, pour se
conformer à l’échelle de surveillance actuellement utilisée. La modélisation n’inclut aucun
facteur de risque « extérieur » et s’appuie essentiellement sur la saisonnalité des cas, leur
dépendance spatiale (interaction avec les districts voisins) et leur dépendance temporelle
(incidence des semaines précédentes). Les modèles s’intéressent à la prédiction du
dépassement du seuil épidémique hebdomadaire défini par l’OMS, une ou plusieurs
semaines à l’avance. Concernant la prédiction que le seuil épidémique sera dépassé dans 3
semaines exactement, le meilleur modèle, par ailleurs publié seul (Agier et al., 2012), a une
sensibilité de 62,4 %, une spécificité de 98,8 %, une valeur prédictive positive (VPP) de
62,1 % et une valeur prédictive négative (VPN) de 98,8 %. Concernant la prédiction que
le seuil épidémique sera dépassé dans l’année, le meilleur modèle a une sensibilité de
100
70,6 %, une spécificité de 79,3 %, une VPP de 57,9 % et une VPN de 87,0 %, avec un délai
médian de 2 semaines entre la prédiction et le dépassement du seuil. Une autre publication
récente (Pérez García-Pando et al., 2014) a développé un modèle qui s’intéresse à
l’estimation, en début de saison sèche, du risque de survenue d’une épidémie. Le modèle
utilise également les données de notification du Niger sur la période 1986-2006, à l’échelle
des districts et du pays. La prédiction concerne le dépassement d’un seuil d’incidence
cumulée (> 100/100 000) sur les mois de janvier à mai. La modélisation s’appuie sur
l’incidence précoce (en décembre), la densité de population et les conditions climatiques
précoces (vent, humidité, température et aérosols de septembre à décembre). Les résultats
pour le meilleur modèle à l’échelle des districts (respectivement du pays) indiquent une
sensibilité de 56,7 % (80,0 %), une spécificité de 85,8 % (87,0 %), une VPP de 47,8 % et
une VPN de 89,7 %. Il faut signaler enfin une publication de Yaka et al. (2008) qui ont
étudié la performance d’un modèle prédictif de l’incidence annuelle à l’échelle d’un pays
(Niger et Burkina Faso) de 1968 à 2005, en s’appuyant sur les conditions climatiques
précoces en novembre et décembre. Les prédictions pour le Niger (respectivement le
Burkina Faso) ont une sensibilité de 83 % (74 %) et une VPP de 53 % (50 %). Aucun des
modèles cités précédemment n’a évalué l’impact sanitaire qu’aurait une intervention
vaccinale basée sur leurs prédictions.
Dans le chapitre précédent (Article II), nous avons montré qu’à l’échelle des aires
de santé, la présence de cas précoces avant fin décembre, l’effet du climat (humidité) dès le
mois de novembre et la présence de cas dans les aires voisines étaient des facteurs
importants pour expliquer l’incidence annuelle de la méningite A dans les aires de santé. De
plus, nous avons montré dans l’Article I que l’utilisation de l’échelle des aires de santé
pourrait éventuellement permettre une détection des épidémies plus précoce que l’échelle
des districts. Au vu de ses résultats, il semble donc qu’un modèle prédictif pourrait être
développé à l’échelle des aires de santé, basé sur les caractéristiques précoces des épidémies
(dans l’aire de santé, dans ses voisines et dans le pays) et sur les conditions climatiques
précoces. Ce modèle pourrait permettre de détecter plus précisément (hétérogénéité des
zones touchées au sein d’un district) et plus précocement les épidémies et de mettre en
œuvre une vaccination plus ciblée, donc potentiellement plus coût-efficace.
Objectifs
Dans ce contexte, notre objectif est de développer un modèle pouvant estimer, à
partir du moment où une aire dépasse un certain seuil d’alerte, le risque de survenue d’une
101

épidémie dans cette aire pendant la saison en cours, en fonction de facteurs de risque
épidémiologiques et environnementaux. Le système d’alerte serait donc constitué de deux
étapes : (i) détecter le dépassement du seuil d’alerte dans les aires de santé puis (ii)
modéliser, pour les aires ayant dépassé ce seuil, la probabilité qu’elles progressent vers une
épidémie (Figure 15). La finalité de ce travail est que les prédictions du modèle permettent
de lancer, à bon escient et suffisamment tôt, une campagne de vaccination réactive, de
façon à avoir un impact significatif sur le nombre de cas évités.
Pour constituer un système d’alerte précoce opérationnel, ce modèle doit non
seulement fournir une prédiction précise et suffisamment à l’avance, mais également être
adapté aux conditions locales et facilement utilisable en temps réel par les décideurs locaux
eux-mêmes (Myers et al., 2000; OMS, 1998). Ce dernier critère a des conséquences sur le
choix des données épidémiologiques à utiliser et du type de modèle statistique à
développer.
Figure 15. Schématisation du système d’alerte précoce.
5.2 Données
Cas suspects de méningite
Pour développer ce modèle, nous avons choisi d’utiliser les données de cas suspects
notifiés (définition de cas indiquée au 2.1.4), plutôt que les données de cas confirmés
biologiquement que nous avions utilisées jusqu’ici. La raison est simple : la confirmation
des cas requiert plusieurs semaines, le temps que le LCR soit acheminé au CERMES et que
102

les analyses de laboratoire y soient réalisées. Cette base de données n’est donc pas idéale
pour un système d’alerte précoce. Les données de cas notifiés sont, elles, transmises chaque
semaine au niveau central et permettent donc une surveillance quasiment en temps réel. De
plus, ces données sont celles utilisées en routine par le MSP et l’OMS dans tous les pays de
la ceinture pour détecter les alertes et les épidémies sur la base des seuils d’incidence
hebdomadaires précédemment décrits. Malgré la valeur incontestée du système de
surveillance microbiologique développé au Niger et la faible spécificité de la définition des
cas suspects, nous faisons ici un choix pragmatique et pérenne en privilégiant les cas
suspects. Nous nous inscrivons dans le système de surveillance actuellement mis en place
dans les pays de la ceinture, adapté aux capacités locales limitées en termes d’analyses
microbiologiques de routine. La confirmation biologique des cas en début d’épidémie reste
indispensable pour décider du type de vaccin à utiliser.
Au Niger, ces données de cas suspects sont collectées par un réseau national
coordonné par la Direction de la Surveillance et la Riposte aux Épidémies (DSRE)
rattachée au MSP (Figure 5). Le recueil se fait suivant une remontée de l’information du
niveau local au niveau national : les cas suspects sont notifiés chaque semaine par les
centres de santé aux districts sanitaires, qui compilent les données et les transmettent sous
forme agrégée aux Directions Régionales de Santé Publique, qui elles-mêmes les
transmettent à la DSRE. Pour ces travaux de thèse, nous souhaitions réaliser l’analyse à une
échelle spatiale plus fine que les districts, celles des aires de santé. Dans le cadre de ce
projet, les équipes du CERMES ont donc collecté rétrospectivement sur le terrain, auprès
de chaque district, les notifications originales par centre de santé, avant qu’elles n’aient été
agrégées. Des analyses préliminaires nous ont conduits à sélectionner trois régions du Niger
(Tahoua, Dosso et Tillabéry) pour la complétude de leurs registres (cf. Figure 6 pour situer
ces régions). La période de l’étude couvre les années 2004 à 2011.
Facteurs de risque
Plusieurs types de facteurs de risque sont inclus dans les analyses. Tout d’abord,
comme dans le modèle explicatif, des variables purement spatiales, caractéristiques de
chaque aire de santé d’un point de vue démographique, géographique ou environnemental,
sont étudiées : densité de population, présence d’une route, distance à la route la plus
proche, présence d’une frontière, pays frontalier, distance à la frontière la plus proche,
altitude, couverture végétale et distance moyenne au centre de santé. Les sources de
chacune de ces données ont été indiquées au 4.2.3 et ne sont donc pas détaillées ici.
103

Différents effets de voisinage sont ensuite inclus : nombre de cas total ou maximal
dans les aires de santé voisines, incidence totale ou maximale dans les aires voisines,
nombre et pourcentage d’aires voisines ayant notifié au moins un cas suspect. Ces
interactions spatio-temporelles sont calculées sur la semaine où chaque aire de santé est en
alerte, sur les deux semaines précédant l’alerte et sur la période courant du début de la
saison (novembre) à la semaine de l’alerte.
Des covariables représentant l’histoire épidémiologique récente de chaque aire de
santé (nombre de cas, incidence, dépassement du seuil d’alerte et épidémie localisée l’année
précédente) sont également prises en compte.
L’impact des conditions climatiques dans l’aire de santé (température, humidité
relative, hauteur de pluies, force et direction du vent, indice d’aérosol) est étudié la semaine
de l’alerte et sur les deux semaines précédant l’alerte. Les sources de ces données ont été
indiquées dans le chapitre précédent au 4.2.3. En outre, le dernier jour de pluie de la saison
des pluies précédente est calculé, pour tester si le risque épidémique augmente avec un
démarrage plus précoce de la saison sèche. Ces variables climatiques sont calculées à
l’échelle des aires de santé et à l’échelle de la zone d’étude.
Enfin, des variables purement temporelles, représentant le niveau de risque global
annuel à l’échelle de toute la zone d’étude, sont incluses dans l’analyse, en s’appuyant sur les
résultats de l’Article II qui montrent que l’incidence annuelle à l’échelle du pays augmente
avec l’incidence précoce et le nombre d’aires ayant des cas précoces (Figure 13). Ces
variables précoces sont calculées sur les mois de novembre et décembre (début de la saison
sèche) : nombre de cas précoces, incidence précoce et nombre d’aires ayant au moins un
cas précoce.
5.3 Méthodes
Le modèle développé est un modèle de régression logistique, qui estime la
probabilité de survenue d’une épidémie localisée parmi les aires ayant dépassé le seuil
d’alerte, en fonction de facteurs de risque épidémiologiques et environnementaux. Une aire
entre donc dans le modèle si elle dépasse un certain seuil d’alerte à définir.
104

Définition des épidémies localisées
Il est nécessaire dans un premier temps de définir ce qui constitue une épidémie
localisée, l’événement qui est prédit par le modèle. De façon générale, une épidémie peut se
définir comme la survenue d’un nombre de cas plus élevé que le nombre attendu dans une
région donnée sur une période de temps donnée (CDC, 2013). Il faut donc définir l’échelle
spatiale, l’échelle temporelle et ce qui est considéré comme « un nombre de cas plus élevé
que le nombre attendu ». Dans cette étude, l’échelle spatiale à laquelle est définie une
épidémie localisée est l’aire de santé, zone qui regroupe les villages rattachés à un même
centre de santé. L’échelle temporelle d’intérêt doit représenter la « saison de la méningite »
au Niger. En effet, d’un point de vue de santé publique, l’important pour le pays est le
poids saisonnier de la méningite, c’est-à-dire le nombre de cas cumulés causés par cette
maladie au cours de la saison et qui pourraient potentiellement être évités par la
vaccination. La Figure 16 montre les séries temporelles des cas notifiés au cours de chaque
année épidémiologique (juillet à juin). Sur cette base, l’échelle temporelle sur laquelle est
définie une épidémie localisée est la période novembre-juin, de façon à englober tous les
cas d’une même saison épidémiologique.
Figure 16. Séries temporelles des cas hebdomadaires par aire de santé (bleu clair) et dans la
zone d’étude (bleu foncé). Les pointillés orange délimitent la période allant de début
novembre à fin juin.
Enfin, ce qui constitue « un nombre de cas plus élevé que le nombre attendu » a été
défini comme une incidence supérieure au 90ème percentile (≥ 60 cas/100 000 habitants) des
105

incidences sur la période d’étude, afin de sélectionner les événements exceptionnels
d’incidence. En raison de populations très faibles dans certaines aires de santé, de telles
incidences peuvent être atteintes pour un très petit nombre de cas. Or, l’ambition du
modèle prédictif est de lancer une intervention qui aura un impact sur le nombre de cas
évités. Un critère supplémentaire a donc été ajouté sur le nombre de cas : une épidémie
localisée doit être constituée d’un nombre de cas supérieur au 90ème percentile (≥ 12 cas)
des cas sur la période d’étude. Les épidémies localisées constituent ainsi les événéments
exceptionnels en termes à la fois d’incidence et de nombre de cas. Au final, une épidémie
localisée est définie comme une aire de santé qui dépasse une incidence cumulée supérieure
à 60/100 000 et un nombre de cas cumulé supérieur à 12 pendant les mois de novembre à
juin.
Définition du seuil d’alerte
Dans un deuxième temps, il est nécessaire de définir le seuil d’alerte à partir duquel
une aire-année entrera dans le modèle prédictif. Le choix d’un seuil d’alerte précoce résulte
toujours d’un compromis entre la spécificité des prédictions et le délai que ces prédictions
peuvent fournir. Parmi les critères établis, le seuil d’alerte de notre système doit :
• avoir une grande sensibilité vis-à-vis de la détection d’épidémies localisées pour ne
pas en « laisser passer » dès la première étape du système d’alerte (inclusion dans le
modèle)
• être détecté suffisamment tôt dans la courbe épidémique, sachant qu’au moins 3
semaines sont nécessaires pour l’obtention des vaccins, la campagne de vaccination
et le développement de l’immunité (Kaninda et al., 2000)
• avoir une bonne spécificité pour limiter le nombre de fausses alertes.
Plusieurs définitions du seuil d’alerte ont été testées, basées sur le nombre de cas
hebdomadaires, l’incidence hebdomadaire, le nombre de cas cumulés ou l’incidence
cumulée depuis le début de la saison (novembre). D’autres méthodes pourraient être testées
pour détecter une alerte (Hay et al., 2002; Watkins et al., 2006) mais nous avons privilégié la
simplicité. Parmi les seuils d’alerte détectés suffisamment tôt, pour lesquels au moins 50 %
des cas surviennent trois semaines après leur détection (Table 6), celui qui a la meilleure
spécificité (0,72) est le seuil de 2 cas cumulés depuis le début de la saison. Sa sensibilité est
égale à 1 puisque les épidémies localisées sont constituées d’au moins 12 cas et en cumulent
a fortiori 2 à un moment de la saison. Ainsi, il est spécifié qu’une aire-année entre dans le
106

modèle prédictif dès qu’elle dépasse un seuil d’alerte de 2 cas notifiés depuis le mois de
novembre.
Table 6. Performance d’une sélection de seuils d’alerte à l’échelle des aires de santé.
Seuils Cas après 3
semaines (%) Sensibilité Spécificité VPP VPN
Nombre de cas cumulés
1 65,80 1 0,5909 0,1772 1
2 53,91 1 0,7205 0,2397 1
Incidence hebdomadaire
1/100000 65,51 1 0,5909 0,1772 1
2/100000 63,95 1 0,5954 0,1788 1
3/100000 60,79 1 0,6128 0,1854 1
4/100000 52,73 1 0,6487 0,2005 1
Incidence cumulée
2/100000 64,76 1 0,5915 0,1774 1
3/100000 63,35 1 0,5988 0,18 1
4/100000 59,81 1 0,6167 0,1869 1
5/100000 57,51 1 0,6319 0,1931 1
6/100000 55,06 1 0,6577 0,2047 1
7/100000 53,05 1 0,6785 0,2151 1
8/100000 51,15 1 0,6987 0,2262 1
Modèle statistique
Là encore, le choix du modèle s’est fait sur des critères pragmatiques. Le modèle
statistique doit être simple et rapide à estimer, pour que les acteurs locaux, et notamment
les épidémiologistes du CERMES, puissent se l’approprier et l’utiliser. Nous nous sommes
donc éloignés du modèle hiérarchique bayésien précédemment développé, les prédictions
en temps réel n’étant pas réalisables en raison des méthodes MCMC coûteuses en temps de
calcul et la spécification du modèle dans WinBUGS étant relativement compliquée pour
des non spécialistes. Nous nous sommes tournés vers un modèle de régression logistique,
de type modèle additif généralisé, estimé dans le cadre fréquentiste et implémenté dans le
logiciel R. Le modèle sera jugé sur ses performances en termes de prédiction.
L’unité spatio-temporelle de base du modèle est l’aire-année. La variable Y à prédire
vaut 1 si une aire-année fait une épidémie localisée, 0 sinon. Notons pi la probabilité qu’une
aire-année i fasse une épidémie (Yi = 1). L’équation du prédicteur s’écrit :
107

logit )52/2sin()52/2cos()1
ln()( ii
k
kik
i
i
i SSXp
pp πδπγβα +++=
−= ∑
où Xk représentent les covariables et α, βk, γ et δ les paramètres à estimer. Suite aux résultats
du modèle explicatif et d’une étude conduite à l’échelle des districts (Agier et al., 2013),
nous supposons que le risque épidémique est différent selon que le seuil d’alerte est dépassé
tôt ou tard dans la saison. La semaine Si où le seuil d’alerte est dépassé est donc incluse
dans le modèle, sous la forme de fonctions trigonométriques de période égale à 52
semaines pour prendre en compte la saisonnalité des méningites. Les covariables ayant une
valeur p inférieure à 5 % (test du rapport de vraisemblance) dans l’analyse univariée sont
incluses dans l’analyse multivariée. Une sélection pas-à-pas ascendante basée sur l’AIC est
effectuée, en incluant manuellement les covariables sélectionnées jusqu’à ce qu’aucune
covariable supplémentaire n’améliore le modèle.
Prédictions
Pour évaluer les performances prédictives du modèle multivarié final, une validation
croisée par blocs est réalisée. Le jeu de données est séparé aléatoirement en 10 échantillons
de taille égale. Pour chaque échantillon k (ensemble de validation), les paramètres du
modèle multivarié sont ré-estimés en utilisant les 9 autres échantillons (ensemble
d’apprentissage) puis utilisés pour prédire la probabilité de survenue d’une épidémie
localisée dans les aires de l’échantillon k. En pratique, les valeurs des coefficients du
modèle seraient mises à jour après chaque année, et utilisées pour prédire les probabilités
l’année suivante.
Pour convertir ces probabilités prédites en termes opérationnels, une valeur critique
c est définie telle que, si la probabilité prédite est supérieure ou égale à c, la prédiction est
considérée comme positive (survenue d’une épidémie localisée), négative sinon. Ensuite,
pour une valeur de c donnée, sont comptabilisés les nombres de vrais positifs (VP), de faux
positifs (FP), de vrais négatifs (VN) et de faux négatifs (FN) définis comme suit :
• Vrai positifs : aires qui font une épidémie (et qui ont a fortiori dépassé le seuil
d’alerte) et pour lesquelles le modèle a bien fait une prédiction positive
(probabilité ≥ c)
• Faux positifs : aires qui ne font pas d’épidémie alors qu’elles ont dépassé le seuil
d’alerte et que le modèle a fait une prédiction positive (probabilité ≥ c)
• Faux négatifs : aires qui font une épidémie (et qui ont a fortiori dépassé le seuil
d’alerte) alors que le modèle a fait une prédiction négative (probabilité < c)
108

• Vrais négatifs : aires qui ne font pas d’épidémie et qui, soit n’ont pas dépassé le
seuil d’alerte, soit ont dépassé le seuil d’alerte mais pour lesquelles le modèle a fait
une prédiction négative (probabilité < c).
C’est donc la performance globale du système d’alerte précoce représenté en Figure 15 qui
est ainsi évaluée (combinaison du seuil d’alerte et du modèle prédictif d’épidémie pour les
aires en alerte) puisque les vrais négatifs englobent également les aires qui n’ont pas fait
d’alerte et ne sont donc pas entrées dans le modèle. Avec ces définitions, quatre mesures de
la performance du système sont ensuite calculées pour différentes valeurs de c : la sensibilité
(VP/(VP + FN)), la spécificité (VN/(VN + FP)), la valeur prédictive positive (VPP =
VP/(VP + FP)) et la valeur prédictive négative (VPN = VN/(VN + FN)).
5.4 Résultats préliminaires
Description des données
Dans la zone d’étude (régions de Dosso, Tahoua et Tillabéry) et sur la période
2004-2011, le nombre total de cas notifiés s’élève à 9 705, dont 9 546 (98,4 %) pendant les
mois de novembre à juin. Sur les 1 939 aires-années ayant notifié des cas suspects, 655
(33,8 %) ont dépassé le seuil d’alerte et 157 (8,1 %) ont fait une épidémie localisée. Ces
épidémies localisées représentent 70,2 % des cas notifiés.
Modèle multivarié
Les résultats indiqués sont préliminaires, les analyses devant encore être
approfondies. Le modèle multivarié qui ressort des analyses comprend quatre facteurs
indépendamment associés au risque d’épidémie localisée, en plus de la semaine de l’alerte :
la présence de cas dans les aires voisines la semaine de l’alerte ou la semaine précédente, le
nombre d’aires ayant au moins un cas entre novembre et décembre sur la zone d’étude
(facteur purement temporel), l’humidité dans l’aire de santé pendant la semaine de l’alerte,
et la quantité de pluies tombées sur toute la zone d’étude entre octobre et décembre, après
la saison des pluies (facteur purement temporel). Les odds ratio (OR) correspondants et
leur intervalle de confiance (IC) sont présentés dans la Table 7.
109

Table 7. Résultats préliminaires du modèle logistique multivarié.
Variables OR* 95 % IC†
Cas dans les aires voisines entre S et S-1 (oui vs non)‡ 1,86 (1,13–3,09)
Nombre d'aires ayant au moins un cas en novembre-décembre 1,25 (1,15–1,37)
Humidité relative dans l'aire en S (%)‡ 0,93 (0,89–0,97)
Pluies dans la zone d'étude en octobre-décembre (mm) 0,82 (0,78–0,87)
* OR : odds ratio
† IC : intervalle de confiance
‡ S : semaine de l’alerte
Prédictions
Les performances du système d’alerte vis-à-vis de la sensibilité, la spécificité, la VPP
et la VPN des prédictions, pour différentes valeurs de la probabilité critique c, sont
présentées dans la Table 8.
Table 8. Performances du système d’alerte précoce pour différentes valeurs de c.
c VP FP FN VN sensibilité spécificité VPP VPN
0,1 146 245 11 1537 0,930 0,863 0,373 0,993
0,2 130 157 27 1625 0,828 0,912 0,453 0,984
0,3 111 115 46 1667 0,707 0,935 0,491 0,973
0,4 91 71 66 1711 0,580 0,960 0,562 0,963
0,5 65 47 92 1735 0,414 0,974 0,580 0,950
0,6 49 24 108 1758 0,312 0,987 0,671 0,942
0,7 22 8 135 1774 0,140 0,996 0,733 0,929
Par exemple, pour une probabilité critique c = 0,4, la proportion d’épidémies
correctement prédites est de 58,0 % (sensibilité), la proportion de non-épidémies
correctement prédites est de 96,0 % (spécificité) ; sur toutes les prédictions positives,
56,2 % font bien une épidémie (VPP) et sur toutes les prédictions négatives, 96,3 % ne font
pas d’épidémie (VPN). L’importance relative de ces quatre mesures de performance, et par
conséquent le choix de c, dépendra du contexte et des priorités de santé publique, comme
cela est discuté ci-dessous.
5.5 Discussion
Dans ce chapitre, nous avons présenté les travaux visant à élaborer un système
d’alerte précoce qui permettrait, dès qu’une aire dépasse un certain seuil d’alerte, d’estimer
110

sa probabilité de progresser vers une épidémie localisée pendant la saison en cours, en
fonction de divers facteurs de risque. Les résultats préliminaires indiquent que la
progression vers une épidémie localisée peut être modélisée en fonction de la semaine de
l’alerte, du climat (humidité et pluies), des effets de voisinage et de l’expansion
géographique précoce des cas.
La performance du système d’alerte est évaluée vis-à-vis de sa sensibilité, sa
spécificité, sa VPP et sa VPN, en fonction d’une probabilité critique c au-delà de laquelle
est définie une prédiction positive. L’augmentation de la sensibilité entraînant une baisse de
la spécificité et inversement, le choix de c requiert un compromis. L’importance relative de
ces quatre mesures de performance dépend du contexte et des priorités de santé publique.
Ainsi, on peut vouloir privilégier la sensibilité et la VPN, pour s’assurer que toutes les
épidémies seront bien détectées et que la proportion de faux négatifs sera faible, ou bien la
spécificité et la VPP, pour éviter de gaspiller des ressources limitées et de délivrer des
vaccins dans des aires « faux positifs » qui n’en avaient pas réellement besoin. Ce choix
relève des autorités de santé publique plus que des scientifiques, c’est pourquoi nous avons
choisi de rapporter ici toutes les possibilités.
À première vue, ce modèle à l’échelle des aires de santé se situe au même niveau de
performance que les modèles publiés à l’échelle des districts, en matière de sensibilité,
spécificité, VPP et VPN (Agier et al., 2012; Pérez García-Pando et al., 2014; Stanton et al.,
2013). Bien qu’il faille rester prudent sur la comparaison car ces modèles ne s’intéressent
pas aux mêmes résultats ou aux mêmes conditions, cela montre qu’on peut espérer obtenir
des résultats au moins aussi bons, à une échelle spatiale plus fine, avec par conséquent une
réponse potentiellement plus adaptée, plus ciblée, et donc plus efficace.
Le temps gagné dans la réponse grâce à ce seuil d’alerte très bas et défini à l’échelle
des aires de santé, à comparer au seuil d’incidence hebdomadaire défini à l’échelle des
districts, pourrait également faire une vraie différence dans l’impact d’une campagne de
vaccination sur le nombre de cas évités. En effet, dans une stratégie de vaccination réactive,
l’un des paramètres clés est le délai entre la détection du seuil et le pic épidémique, pour
laisser suffisamment de temps à la mise en place de la campagne de vaccination. Deux
études au Ghana et au Togo ont montré que chaque semaine de retard dans la vaccination
résulte en une diminution de 3 à 8 % du nombre de cas évitables (Kaninda et al., 2000;
Woods et al., 2000). C’est un argument important pour donner la priorité à un système qui
augmente le temps disponible pour mettre en place la réponse à l’épidémie. Le seuil d’alerte
choisi ici est donc volontairement très sensible de façon à être détecté le plus tôt possible
111

dans la courbe épidémique d’une épidémie localisée. Le modèle de régression logistique
intervient ensuite pour améliorer la spécificité du système, puisqu’un grand nombre de faux
positifs, dus à un système trop peu spécifique, gaspillerait des ressources déjà limitées.
La finalité du système d’alerte précoce est de lancer, à bon escient et suffisamment
tôt, une campagne de vaccination réactive, de façon à avoir un impact significatif sur le
nombre de cas évités. Pour compléter l’évaluation de la performance de ce modèle et
communiquer sur des résultats concrets en termes de santé publique, il nous faudra donc
ensuite mesurer l’impact sanitaire et économique qu’aurait une intervention basée sur ses
prédictions. Ainsi, il sera intéressant de calculer notamment : (i) le nombre de cas évitables
si les autorités lançaient une intervention suite aux prédictions du modèle, en prenant en
compte le délai pour que la vaccination soit effective, la couverture vaccinale et l’efficacité
du vaccin, (ii) le nombre total de doses de vaccin distribuées et le nombre de doses
distribuées « à tort » (i.e. alors qu’il n’y a finalement pas d’épidémie localisée). Puisque le
risque épidémique dans une aire dépend aussi de la situation des aires voisines, ces calculs
pourront être faits en considérant plusieurs stratégies vaccinales différentes, telles que la
vaccination de l’aire en alerte uniquement, la vaccination de l’aire en alerte et de ses aires
voisines ou la vaccination de tout le district où se situe l’aire en alerte. Il serait également
intéressant de faire le même exercice de modélisation mais en se situant cette fois à l’échelle
des districts, de façon à comparer les performances et l’impact de ce modèle « district »
avec le modèle « aire de santé » d’une part, et avec les modèles déjà publiés à l’échelle des
districts d’autre part.
Même s’il est trop tôt à ce stade pour formuler des recommandations
opérationnelles aux autorités sanitaires sur la base de ce modèle, il nous semble d’ores et
déjà raisonnable d’encourager une surveillance à l’échelle des aires de santé, ce qui
nécessiterait un effort minimal (non agrégation par les districts des données transmises par
les centres de santé) pour des résultats prometteurs comme le montrent ces résultats
préliminaires. Une étude descriptive menée au Burkina Faso a également montré
l’importance d’utiliser l’échelle des centres de santé pour identifier précisément les
populations concernées par une épidémie (Tall et al., 2012).
Nous avons insisté plus haut sur l’importance de la disponibilité des données en
temps réel dans le choix des données de surveillance pour un système opérationnel. Cela
est valable aussi pour les données sur les facteurs de risque inclus dans le modèle, et
notamment les données climatiques. Au Niger, plusieurs stations météorologiques,
réparties sur le territoire, donnent en temps réel les informations sur l’humidité, la
112

température, les pluies, etc. Pour transformer ces données à l’échelle des aires de santé, il
est nécessaire d’appliquer des modèles d’interpolation spatiale adaptés. Nous n’avons pas
pu obtenir de telles données interpolées et avons donc utilisé à la place des données issues
de réanalyses climatiques (cf. 4.2.3) qui ne sont pas disponibles en temps réel. Pour parfaire
le modèle, il faudra donc travailler avec les météorologues locaux pour se baser sur leurs
données et modèles d’interpolation. On pourra aussi éventuellement comparer les
performances prédictives du modèle global avec celles d’un modèle qui n’inclurait pas de
facteurs climatiques.
Enfin, signalons que si les autorités sanitaires souhaitent redéfinir une épidémie
localisée en fonction de leurs propres critères, notamment si les niveaux d’incidence sont
amenés à évoluer avec l’éventuel remplacement du méningocoque A par d’autres
sérogroupe suite à l’introduction du vaccin conjugué, ce système d’alerte précoce est
facilement adaptable à toute redéfinition. Par ailleurs, ce type de modélisation pourrait être
appliqué et réajusté à d’autres pays de la ceinture pour évaluer si les résultats sont
reproductibles sur d’autres données et dans d’autres contextes épidémiques (validation
externe).
En conclusion, ce travail propose une base solide pour faire avancer la recherche
sur la prédiction des épidémies et une piste de travail intéressante pour le développement
d’un système d’alerte précoce en Afrique subsaharienne. La transition d’un travail de
recherche vers un outil de décision opérationnel peut s’avérer délicate (Cox and Abeku,
2007) mais ce type de modèle peut permettre, dans un premier temps, de développer et
d’évaluer des stratégies de santé publique alternatives.
113

6 Conclusions
114

Dans ce dernier chapitre, nous concluons la thèse en synthétisant les principaux
résultats obtenus, en formulant des recommandations de santé publique sur la base de ses
résultats, puis en proposant des perspectives de recherche pour continuer à améliorer la
compréhension et la prévention des épidémies de méningite à méningocoque en Afrique
subsaharienne.
6.1 Synthèse des travaux
Travaux sur l’analyse des agrégats spatio-temporels
Pour répondre au premier objectif de la thèse, le chapitre 3 (Article I) s’est intéressé
à l’analyse de la distribution spatio-temporelle des cas confirmés de méningite à
méningocoque au Niger de 2003 à 2009, à l’échelle spatiale des aires de santé. Sur chaque
année de la période d’étude, deux méthodes de détection d’agrégats spatiaux ont été
appliquées conjointement, basées respectivement sur un test local d’autocorrélation spatiale
et un algorithme de scan spatial. Cette dernière méthode a également permis de détecter les
agrégats spatio-temporels (définis sur une semaine au maximum) au cours de chaque année
épidémiologique. Enfin, les délais de détection des seuils épidémiques à l’échelle des
districts ont été comparés avec une détection faite à l’échelle des aires de santé. Quatre
enseignements principaux peuvent être tirés de ces analyses :
1. L’échelle d’organisation des structures spatiales détectées dans la distribution des
cas est relativement faible : les agrégats concernent en médiane 2 aires de santé
voisines, soit environ 10 % de la superficie d’un district. Cela démontre une forte
hétérogénéité intra-district dans la répartition des cas, et par conséquent l’existence
de facteurs de risque localisés.
2. La distribution des cas est caractérisée par une forte variabilité inter-annuelle dans
les aires de santé touchées par un agrégat spatial. Neuf districts ont été plus
fréquemment touchés sur la période d’étude, mais peu d’agrégats spatiaux ont été
détectés dans une même aire de santé.
3. Au sein de chaque année épidémique, les agrégats spatio-temporels hebdomadaires
se succèdent dans le pays sans partir d’une source fixe ni suivre une direction
géographique systématique. Cela explique en partie pourquoi les lieux d’émergence
et les sens de propagation des épidémies restent encore si difficiles à prédire.
4. L’utilisation de seuils d’incidence calculés à l’échelle des aires de santé permet dans
33 % des cas de détecter les épidémies plus précocement que les seuils à l’échelle
115

des districts utilisés actuellement, et suggère ainsi une voie potentielle pour apporter
une réponse plus efficace et plus ciblée aux épidémies.
Travaux sur le développement d’un modèle spatio-temporel explicatif
Pour répondre au deuxième objectif de la thèse, le chapitre 4 (Article II) s’est
consacré à l’identification des facteurs de risque environnementaux, épidémiologiques et
socio-démographiques qui pourraient expliquer les augmentations locales d’incidence
annuelle mises en évidence à l’échelle des aires de santé, pour le méningocoque A sur la
période d’étude 2004-2010. Un modèle de régression hiérarchique bayésien a été développé
à l’échelle de l’aire de santé-année, prenant en compte la sur-dispersion et les corrélations
spatiales et temporelles rencontrées dans les données d’incidence. Les résultats de ce travail
de modélisation apportent plusieurs éléments nouveaux dans la compréhension des
épidémies :
1. Les facteurs climatiques ont une influence sur les variations inter-annuelles
d’incidence, à l’échelle du pays (humidité moyenne de novembre à juin
protectrice) et à l’échelle des aires de santé (pluies précoces protectrices).
2. La proportion d’aires voisines ayant des cas augmente le risque dans une aire de
santé.
3. La précocité des épidémies joue un rôle important dans leur incidence cumulée
finale : dans le modèle hiérarchique, la présence de cas avant janvier est un
facteur de risque important à l’échelle des aires de santé ; à l’échelle du pays,
l’incidence annuelle est hautement corrélée à l’incidence précoce et au nombre
d’aires ayant des cas précoces.
4. La vaccination par vaccins polyosidiques n’a pu être étudiée que dans une zone
géographique restreinte et aucun effet significatif n’a pu être mis en évidence.
5. Le modèle fait ressortir une combinaison de facteurs qui semblent jouer à la
fois sur le risque d’invasion et sur le risque de transmission du méningocoque :
la variabilité spatio-temporelle de l’incidence entre les années et les aires de
santé semble en effet résulter de variations dans l’intensité et la durée des effets
de la saison sèche sur le risque de maladie, et est de plus impactée par des
facteurs de contacts spatiaux représentant une transmission du pathogène
favorisée.
116

6. La taille finale de l’épidémie à l’échelle du pays est significativement corrélée au
nombre d’épidémies localisées pendant la saison et, dans une moindre mesure, à
l’intensité de ces épidémies localisées.
Travaux sur le développement d’un modèle prédictif
Pour répondre au troisième objectif de la thèse, le chapitre 5 s’est attaché à
l’élaboration d’un système d’alerte précoce à l’échelle des aires de santé, sur les données de
surveillance épidémiologique des cas suspects. Le système ainsi construit repose sur deux
composantes : la détection d’un seuil d’alerte puis l’estimation, par un modèle prédictif, de
la probabilité de progression vers une épidémie localisée dans l’aire en alerte au cours de la
saison sèche. Le modèle prédictif développé est un modèle de régression logistique, plus
simple que le modèle de l’Article II afin de répondre aux objectifs opérationnels. Les
analyses demandent encore à être approfondies, mais les résultats préliminaires soulèvent
plusieurs points :
1. La probabilité de progression vers une épidémie localisée semble notamment
pouvoir être modélisée en fonction de la semaine de l’alerte, des conditions
climatiques (humidité et pluies), des interactions de voisinage et de l’expansion
géographique précoce des cas.
2. Un modèle prédictif à l’échelle des aires de santé semble être en mesure de
donner d’aussi bons résultats en termes de performances prédictives que les
modèles développés à l’échelle des districts.
Un tel modèle aurait donc le potentiel d’améliorer l’efficacité des stratégies vaccinales, grâce
à une prise de décision plus précoce et une sélection des zones à vacciner mieux ciblée,
permettant d’avoir un impact significatif sur le nombre de cas évités par la vaccination.
6.2 Recommandations opérationnelles
Comment ces résultats peuvent-ils se traduire en recommandations de santé
publique ? La formulation de recommandations doit tenir compte non seulement des
connaissances scientifiques – et une seule étude n’est en général pas suffisante pour
prouver l’intérêt d’une stratégie de prévention –, mais aussi de la faisabilité dans le contexte
local. L’originalité de ce travail de thèse était notamment l’échelle spatiale d’étude. Les
réflexions qui en découlent se rapportent donc principalement à cette problématique :
117

quelle échelle spatiale recommander pour la surveillance ? Quelle échelle spatiale
recommander pour l’action en santé publique ? Dans le contrôle des maladies, la
surveillance et l’action sont deux faces d’une même pièce : une bonne stratégie
d’intervention associée à une mauvaise surveillance est vouée à l’échec, et inversement.
Outre la dimension spatiale, la notion de temps a également son importance.
La surveillance
Tout d’abord, en matière de surveillance, le message principal que nous pouvons
formuler aux autorités sanitaires est de privilégier une surveillance à l’échelle des centres de
santé. Cela ne nécessiterait pas une refonte totale du système actuel puisque les fondements
sont déjà là : la notification des cas suspects est faite à la base du système par les centres de
santé et le Niger dispose d’un recensement de tous les centres de santé du pays et d’une
carte sanitaire à l’échelle des aires de santé. L’effort nécessaire pour mettre en place une
telle surveillance à l’échelle des centres de santé serait donc modeste : il faudrait que les
districts, qui reçoivent les notifications des centres de santé, envoient aux directions
régionales un fichier récapitulatif des données brutes par centre de santé, au lieu des
données agrégées. Au niveau régional et central, cela impliquerait seulement un
changement de format des fichiers de surveillance.
L’intérêt de l’échelle des centres de santé pour la surveillance des méningites a été
établi parallèlement dans l’Article I et dans un article de Tall et al. (2012). Ces deux études
concernent deux pays différents (Niger et Burkina Faso) et par conséquent deux bases de
données distinctes. Elles mettent également en œuvre deux méthodes différentes de
description des épidémies, la première faisant appel à des méthodes de détection d’agrégats
spatiaux et la deuxième étant basée sur la définition de seuils d’incidence. Les analyses
convergent en revanche dans leurs conclusions en mettant en évidence une forte
hétérogénéité spatiale à l’intérieur des districts (coexistence d’incidences très élevées et
d’incidence très basses parmi les aires de santé au sein d’un même district) et la présence
d’épidémies géographiquement très localisées : les agrégats détectés dans la première étude
concernaient en médiane 10 % des aires de santé d’un district et les épidémies localisées
concernaient en médiane 6 % de la population d’un district dans la deuxième étude. Il
apparaît ainsi indispensable d’utiliser l’échelle des centres de santé pour identifier le plus
précisément possible les populations et régions concernées par une épidémie. Ce point a
également été soulevé lors de la conférence d’experts sur les priorités de la recherche sur le
118

méningocoque en Afrique (Greenwood, 2013). Cette échelle ne doit pas nécessairement
remplacer l’échelle actuelle des districts. On peut en effet imaginer aisément une
surveillance « multi-échelle » qui combinerait à la fois les centres de santé et les districts. Un
tel système, plus souple, serait alors en mesure deux capter deux types de signaux, des
augmentations d’incidence très localisées, à l’échelle d’un centre de santé, ou plus étendues,
à l’échelle d’un district.
Le deuxième avantage à utiliser une surveillance à l’échelle des centres de santé
pourrait être une détection plus précoce des épidémies comparée à l’échelle des districts.
Au vu des résultats des deux études réalisées à l’échelle des aires de santé, cet argument
demande encore à être confirmé. Dans l’Article I, respectivement dans l’article de Tall et
al., l’application de seuils épidémiques à l’échelle des aires de santé permettait dans 33 %
des cas, respectivement 27 %, de détecter les épidémies au moins une semaine avant les
seuils à l’échelle des districts. La combinaison d’un seuil d’alerte et d’un modèle prédictif au
sein d’un système d’alerte précoce tel que celui développé dans le chapitre 5, pourrait
permettre de gagner quelques semaines précieuses dans la détection des épidémies. Les
analyses doivent encore être approfondies et ne nous permettent pas de tirer de conclusion
définitive à ce stade.
L’action
En matière d’intervention de santé publique, le contrôle des épidémies de méningite
à méningocoque en Afrique subsaharienne repose sur deux composantes centrales : la
réduction de la létalité par une bonne prise en charge des malades (via le diagnostic, le
traitement, le suivi…) et la réduction de la morbidité par la vaccination réactive (Bertherat,
2007). L’utilisation de l’échelle des aires de santé peut opérer sur ces deux composantes.
Allocation des ressources. En premier lieu, pour réduire la létalité, la prise en
charge des malades peut être améliorée par une meilleure allocation des ressources dans les
zones en ayant le plus besoin. Les « ressources » évoquées ici concernent aussi bien les
ressources matérielles pour le diagnostic (tests de diagnostic rapides (S. Chanteau et al.,
2006; Hamidou et al., 2008)) et le traitement (antibiotiques) que les ressources humaines
(personnel médical). L’un des objectifs de notre travail était d’identifier les zones à risque,
zones les plus fréquemment touchées. L’analyse des agrégats spatiaux a surtout montré que
d’une année sur l’autre, les aires de santé touchées sont très variables. La fréquence de
119

détection d’agrégats dans une même aire de santé est trop faible sur les sept années d’étude
pour formuler ici des recommandations d’allocation des ressources dans des aires de santé
spécifiques. Il paraît plus judicieux de cibler le renforcement des moyens dans les neuf
districts identifiés comme les plus fréquemment touchés.
Vaccination réactive. En second lieu, pour réduire la morbidité, les stratégies de
vaccination réactive doivent être améliorées. L’un des paramètres clés dans le contrôle des
épidémies par la vaccination réactive est le temps. Deux études au Ghana et au Togo ont
montré que chaque semaine de retard dans la vaccination réactive résultait en une
diminution de 3 à 8 % du nombre de cas évitables (Kaninda et al., 2000; Woods et al.,
2000). Pour réduire le temps de réaction, la première possibilité est de jouer sur le curseur
de la détection : plus la détection intervient précocement dans la progression de l’épidémie,
plus les autorités disposent de temps pour organiser la réponse. Cette question de la
détection précoce a été évoquée au point précédent. La deuxième possibilité est de jouer
sur le délai entre détection et vaccination effective. Ce délai comprend la commande des
vaccins, leur acheminement dans les régions en épidémie, la campagne de vaccination et le
développement de l’immunité. Les deux derniers éléments sont incompressibles. En
revanche, une ou plusieurs semaines pourraient être gagnées sur les étapes de commande et
de déploiement des vaccins, d’une part en anticipant dès le début de la saison de la
méningite les quantités de doses de vaccin nécessaires, et d’autre part en pré-positionnant
ces vaccins dans des lieux stratégiques.
Comme nous l’avons montré dans l’Article II, la précocité des épidémies joue un
rôle important dans leur incidence cumulée finale : à l’échelle du pays, l’incidence annuelle
est hautement corrélée à l’incidence précoce et au nombre d’aires ayant des cas précoces.
Ainsi, dès le mois de décembre, l’ampleur qu’aura l’épidémie dans le pays peut être estimée
assez précisément. Il serait donc envisageable de constituer dès janvier un stock de vaccins
proportionnel à la taille estimée de l’épidémie nationale, à la fois en vérifiant les stocks
éventuellement disponibles dans le pays et en commandant les doses manquantes auprès
du GIC pour les stocker dans la capitale. Ainsi, même si la localisation géographique
précise des épidémies est encore inconnue, le pays pourrait être prêt à y faire face avec une
réponse vaccinale proportionnée. Cette anticipation ferait gagner du temps par rapport à
une commande qui n’interviendrait qu’après la détection d’une épidémie localisée, et ainsi
améliorerait le nombre de cas évités par la vaccination.
120

Concernant le pré-positionnement dans des lieux stratégiques, les modèles
développés jusqu’ici, dans cette thèse ou par d’autres auteurs, ne permettent pas en l’état de
recommander le pré-positionnement des vaccins avant le démarrage de la saison à une
échelle administrative plus basse, au niveau de certains districts ou aires de santé. La
présence de cas précoce dans une aire de santé est un risque (Article II) mais ne suffit pas à
prédire l’ampleur de l’incidence saisonnière. Les incertitudes des modèles doivent encore
être réduites pour limiter au maximum les erreurs de pré-positionnement. Par ailleurs, une
telle stratégie nécessiterait que la chaîne de froid puisse être maintenue localement.
En plus de la réduction des délais de détection et de vaccination, l’amélioration des
stratégies de vaccination réactive repose aussi sur le choix des zones à vacciner. Après le
paramètre « temps », il est en effet possible de jouer sur le paramètre « espace ». Les
recommandations actuelles prennent déjà en compte la dimension spatiale et les
interactions entre districts voisins. Ainsi, lorsqu’un district dépasse le seuil épidémique, le
seuil d’alerte devient le seuil épidémique pour tous ses voisins (OMS, 2000). Autrement dit,
un district dont un voisin a dépassé le seuil épidémique, doit théoriquement être vacciné
dès le dépassement du seuil d’alerte, sans attendre le seuil épidémique. Si l’échelle de
détection évolue vers les aires de santé, doit-on alors vacciner seulement l’aire ? ses voisines
également ? ou tout le district ? La problématique reste la même : utiliser au mieux des
quantités de vaccins limitées en ciblant les zones qui en ont le plus besoin. Ces questions ne
sont pas encore résolues ici mais méritent d’être rigoureusement évaluées du point de vue
de leur coût et de leur impact, avant toute recommandation. Nous avons montré à chacune
des étapes de ce travail que la corrélation spatiale entre aires de santé voisines était un
facteur important pour décrire, expliquer et prédire les épidémies localisées. Il apparaît
donc essentiel de prendre en compte cette caractéristique pour l’élaboration des futures
stratégies vaccinales. L’approfondissement des analyses du chapitre 5, ainsi que d’autres
études en cours (Maïnassara et al., manuscrit en préparation), devraient apporter des
éléments de réponse.
6.3 Perspectives de recherche
Les analyses statistiques réalisées dans cette thèse ont apporté de nombreux
éclairages sur la dynamique spatio-temporelle et les facteurs de risque de la méningite à
méningocoque au Niger. Mais ces résultats soulèvent de nouvelles questions, car le
121

processus épidémique reste encore mal expliqué. Notre compréhension est entravée
notamment par une connaissance limitée des mécanismes immunitaires et par le fait qu’une
partie entière de l’iceberg de la méningite, à savoir les porteurs, échappe aux systèmes de
surveillance classiques basés sur les cas symptomatiques. Nos résultats mettent en évidence
l’impact des facteurs climatiques sur les variations inter-annuelles d’incidence dans les aires
de santé, mais leurs mécanismes d’action restent également à déterminer. Nous suggérons
ici des perspectives de recherche qui pourraient contribuer à éclaircir quelques zones
d’ombre de ces processus épidémiologiques.
Comprendre la dynamique du portage et les mécanismes de l’immunité
La dynamique du portage du méningocoque est encore peu comprise et seules
quelques études de prévalence ont été rapportées dans la ceinture de la méningite. La
plupart des études montrent que la prévalence du portage augmente pendant une épidémie
localisée (e.g. Mueller et al., 2011, 2008; Raghunathan et al., 2006; Sié et al., 2008). En
revanche, la question de la saisonnalité est encore débattue. En 2007, une revue
systématique portant sur les quelques études longitudinales conduites dans la ceinture n’a
pas trouvé d’association entre la saison et la prévalence globale du portage (Trotter and
Greenwood, 2007), contrairement à une étude longitudinale ultérieure, ayant une plus
grande taille d’échantillon, qui a mis en évidence une prévalence du portage plus élevée
pendant la saison sèche comparée à la saison des pluies (Kristiansen et al., 2011). De plus,
la durée des épisodes de portage a été très peu étudiée dans le contexte africain alors qu’elle
peut avoir une influence sur la dynamique des épidémies. Par conséquent, de nouvelles
études de portage longitudinales sont nécessaires afin de suivre l’évolution temporelle des
taux de portage à intervalles courts, au cours d’une année entière, voire à plus long terme
pour étudier les variations inter-annuelles, dans des contextes épidémiques variés
(endémicité, hyper-endémicité et épidémie). Ces études devraient idéalement être couplées
à des études de séroprévalence (Mueller et al., 2006) afin de mieux définir les corrélats de
protection contre le portage et la maladie (Trotter et al., 2013) et les réponses immunitaires,
notamment mucosales, à l’infection et à la vaccination (Greenwood, 2013). Les études de
portage sont difficiles à mettre en place car elles demandent un effort financier conséquent
pour rassembler un nombre suffisant de sujets apportant la puissance nécessaire pour
détecter de faibles niveaux de portage. De plus, il n’existe pas de méthode de référence
établie pour le prélèvement nasopharyngé (Basta et al., 2013). Les résultats des différentes
études menées par le consortium MenAfriCar, établi en 2009 pour étudier le portage dans
122

la ceinture de la méningite avant et après l’introduction du vaccin conjugué, devraient
apporter des informations supplémentaires (MenAfriCar Consortium, 2013). L’exploration
de l’influence du microbiote oropharyngé sur le portage du méningocoque et des
changements saisonniers de ce microbiote pourrait également contribuer à une meilleure
compréhension des épidémies (Greenwood, 2013). Enfin, l’idéal serait de mesurer les
conditions climatiques dans les mêmes populations et au même moment qu’une étude de
portage, puisque les deux types de facteurs (dynamique du portage et facteurs climatiques)
ne sont que trop rarement étudiés au sein d’une même étude, rendant difficile leur mise en
relation (Mueller et al., 2008).
Élucider le rôle du climat
Les modèles statistiques développés dans cette thèse mettent en évidence des
associations significatives entre variations climatiques et variations d’incidence entre les
populations des aires de santé. L’étude de ces associations à un niveau écologique et non
individuel trouve en partie sa justification dans le fait que les interventions de santé
publique se font elles-mêmes à l’échelle de groupes de population. Cependant, de telles
associations écologiques ne permettent pas de conclure avec certitude à une relation de
causalité entre les facteurs identifiés et la maladie, en raison du biais écologique évoqué au
2.2.5 (Greenland, 1992). De plus, les mécanismes sous-jacents impliquant le climat dans le
processus épidémiologique au niveau individuel ne sont pas explicités par de tels modèles
statistiques. Il nous est donc difficile de trancher entre les différents scénarios selon
lesquels le climat jouerait plutôt un rôle direct sur la transmission, un rôle direct sur
l’invasion, ou un rôle indirect sur la transmission via les comportements humains, voire
interviendrait simultanément à plusieurs de ces niveaux. L’hypothèse la plus largement
invoquée stipule que l’humidité très faible et les vents d’Harmattan secs et chargés en
poussières désertiques fragilisent la muqueuse nasopharyngée et augmentent ainsi le risque
d’invasion chez un individu colonisé par le méningocoque (Moore, 1992), mais les autres
possibilités ne peuvent pas être totalement exclues. Afin de démêler ces différents
éléments, plusieurs études pourraient être mises en place. D’abord, des études biologiques
en laboratoire, en utilisant des modèles animaux ou de cultures cellulaires pourraient
examiner l’effet de conditions climatiques particulières sur le portage et l’invasion
(Greenwood, 2013). Ensuite, des études à l’échelle individuelle, plutôt qu’écologique,
pourraient également apporter de nouvelles informations. En effet, les paramètres
climatiques utilisés pour les études écologiques sont majoritairement tirés d’images satellites
123

et ne donnent pas d’information précise sur les conditions climatiques réellement ressenties
par un individu, qui peuvent varier en fonction de ses activités dans la journée (en intérieur
ou en extérieur) et des lieux fréquentés. Il serait donc intéressant de suivre une cohorte de
sujets équipés de capteurs individuels, comme cela a pu être réalisé dans des études sur la
pollution atmosphérique dans les pays du Nord (Nieuwenhuijsen, 2000). Cependant, cette
méthode présente des contraintes financières, techniques et logistiques qui peuvent rendre
son utilisation difficile (Guzzo, 1997). Par ailleurs, les paramètres écologiques issus de la
télédétection ne représentent pas toujours le climat au sol. Par exemple, l’indice d’aérosol
mesure la quantité de poussières sur toute la colonne atmosphérique. Des auteurs ont
montré que cette mesure était bien corrélée à la quantité de poussières au sol pendant la
saison sèche, mais qu’à partir d’avril, les aérosols s’élevant dans l’atmosphère, l’indice n’était
plus représentatif de la poussière à basse altitude (Agier et al., 2013). Des modèles
climatiques se développent pour tenter de modéliser la dynamique des poussières à la
surface (Pérez et al., 2011; Schmechtig et al., 2011). Afin de se rapprocher le plus possible
de l’échelle individuelle avec une mesure écologique au sol et à une échelle fine, il pourrait
être envisagé de mettre en place des stations météorologiques à l’échelle des aires de santé
pour coïncider avec la surveillance épidémiologique, ou à l’échelle des villages si le projet de
recherche prévoit également un suivi épidémiologique à cette échelle, dans une zone
géographique définie (un district par exemple) et sur une période de quelques années
pendant lesquelles le financement et le suivi technique et scientifique seraient assurés. Si
une telle étude confirme l’intérêt de suivre le climat à cette échelle, il serait alors bénéfique
de mettre en place une surveillance météorologique à l’échelle des aires de santé sur tout le
territoire, pour s’affranchir des données satellites moins adaptées à la prédiction en temps
réel et des modèles d’interpolation spatiale qui peuvent comporter des incertitudes
lorsqu’ils sont appliqués entre des stations éloignées (Briggs, 2000).
Modèles statistiques versus modèles mathématiques
La modélisation des maladies infectieuses peut être basée sur l’établissement de
relations statistiques entre des incidences observées et des facteurs de risque (l’approche
statistique) ou sur un jeu d’équations mathématiques qui tentent de capturer les processus
biologiques sous-jacents (l’approche mathématique). La modélisation statistique requiert
des données sur les cas de la maladie d’intérêt et sur les facteurs de risque étudiés
(environnementaux, démographiques, etc.) tandis que la modélisation mathématique
requiert des informations précises sur les paramètres biologiques et les variables
124

considérées comme importantes dans les processus de transmission. Chaque type de
modèle a ses avantages et ses inconvénients, et répond à différents objectifs.
Nous l’avons vu au cours de ces travaux, la survenue et l’ampleur des épidémies
résultent vraisemblablement de la combinaison de différents facteurs, certains intrinsèques
à la maladie et à l’hôte, d’autres extrinsèques. Les modèles mathématiques sont bien
adaptés pour la description des facteurs intrinsèques, qui incluent notamment la
susceptibilité de la population, le portage et l’immunité, qui évoluent dans le temps et
l’espace à travers les processus normaux de transmission d’une maladie infectieuse. Les
modèles statistiques, eux, exploitent mieux les relations entre l’incidence et les facteurs
extrinsèques, ou environnementaux, qui sont dus notamment au climat, et peuvent affecter
les variations spatiales, inter-annuelles et saisonnières des risques de transmission et/ou
d’invasion (Myers et al., 2000).
En l’absence de connaissances précises sur les paramètres de transmission, et
disposant en revanche d’une importante base de données de surveillance sur laquelle nous
appuyer, nous avons choisi dans cette thèse la voie statistique qui nous paraissait la plus
adaptée, même si cette approche ne donne qu’une vision simplifiée de la maladie. Pour
pallier les imperfections de cette approche, nous avons introduit des termes de corrélation
spatiale et temporelle pour capturer la nature infectieuse de la maladie et représenter le fait
que les cas présents en un lieu dépendent des cas passés et des cas voisins. Nous avons
également tenté de construire un proxy de l’immunité naturelle en incluant dans le modèle
l’incidence de l’année précédente dans chaque aire de santé, avec l’idée que l’incidence
passée peut refléter le niveau d’immunité développée par la population suite à la circulation
de la bactérie. Cependant, cette variable n’est pas ressortie dans l’analyse. De même, la
vaccination l’année précédente, qui était attendue comme un facteur protecteur, n’était pas
significative dans le modèle explicatif. Nous avons été confrontés à un grand nombre de
données manquantes dans les rapports de vaccination. Des rapports plus complets à
l’échelle des centres de santé seraient nécessaires pour étudier plus rigoureusement l’impact
de la vaccination sur les épidémies. En revanche, il se peut que le niveau d’immunité et de
susceptibilité de la population soit en partie capté par la présence de cas précoces en début
d’épidémie. Ce facteur significatif dans le modèle explicatif pourrait indiquer, entre autres,
un faible niveau d’immunité de la population (Pérez García-Pando et al., 2014). De
meilleures estimations de l’immunité naturelle et acquise par la vaccination aideraient à
mieux comprendre le rôle de l’immunité dans la dynamique de la maladie et l’impact des
autres facteurs de risque.
125

Les modèles mathématiques pourraient nous permettre de mieux étudier les
questions de portage et d’immunité (augmentation de l’immunité suite à des épisodes
répétés de portage, durée de l’immunité, immunité croisée,…) et l’importance relative de la
transmission et de l’invasion dans la genèse des épidémies localisées. Peu de modèles
mathématiques ont été publiés jusqu’à présent sur la méningite à méningocoque en
Afrique, en raison notamment de connaissances encore insuffisantes sur les processus
biologiques, environnementaux et sociaux impliqués. Les deux premières tentatives sont
récentes (Irving et al., 2012a; Tartof et al., 2013). Les auteurs de ces articles reconnaissent
des difficultés à paramétrer leurs modèles. En effet, certains paramètres ne sont pas
documentés dans la littérature et de grandes plages de valeurs ont donc dû être considérées.
Comme évoqué plus haut, des études de terrain sur le portage et l’immunité pourraient
aider à améliorer l’estimation des paramètres des futurs modèles et mieux comprendre les
mécanismes en jeu. Le modèle de Tartof et al. a été développé principalement pour
explorer l’impact de différentes stratégies vaccinales préventives. L’étude d’Irving et al.
explore comment un modèle en compartiments relativement simple peut reproduire la
dynamique irrégulière et complexe des épidémies et montre qu’elle pourrait être causée par
l’interaction entre l’immunité temporaire conférée par le portage et les variations
saisonnières dans le taux de transmission. Cependant, ce modèle ne prend pas en compte
l’impact potentiel des facteurs climatiques sur la variabilité inter-annuelle de l’incidence
alors que nos résultats semblent indiquer le contraire. De plus, le modèle n’essaie pas de
travailler avec des données réelles et de reproduire les incidences observées. Enfin, ce
modèle, comme celui de Tartof et al., ne considère que la dynamique temporelle et ne
prend pas en compte la dimension spatiale des épidémies. Ces considérations indiquent
plusieurs voies d’amélioration des modèles à compartiments existants, en s’inspirant de ce
qui a été développé pour d’autres maladies.
En particulier, la transmission spatiale des maladies infectieuses peut être
incorporée dans les modèles de différentes manières (Riley, 2007). Des modèles de réseaux
peuvent être utilisés, où des nœuds représentent les individus et les liens entre les nœuds
représentent les contacts entre individus (Riley and Ferguson, 2006). La diffusion spatiale
de certaines maladies comme la fièvre aphteuse a été modélisée en considérant que la
probabilité de transmission de l’infection entre deux exploitations agricoles dépend de leur
localisation exacte et de la distance les séparant (Ferguson et al., 2001; Keeling et al., 2001).
Une troisième approche, qui semblerait plus appropriée dans le cas de la méningite à
méningocoque, regroupe les modèles spatiaux de métapopulation, ou modèles de « patch »,
126

qui utilisent un ensemble de populations discrètes couplées (l’état de l’une dépend de l’état
des autres) et ayant chacune sa dynamique interne. La probabilité d’infection d’une
personne dépend de l’incidence de la maladie dans sa propre population et dans les
populations voisines. Les modèles de métapopulation sont très utilisés pour l’étude de la
dynamique spatio-temporelle des maladies infectieuses, comme par exemple la rougeole au
Royaume-Uni (Bolker and Grenfell, 1995; Grenfell et al., 2001) et au Niger (Ferrari et al.,
2008), ou encore la grippe aux États-Unis (Viboud et al., 2006). Concernant la méningite à
méningocoque en Afrique, un tel modèle permettrait d’examiner l’effet de l’hétérogénéité
spatiale et de mieux représenter les caractéristiques spatio-temporelles de l’épidémiologie de
la ceinture (Irving et al., 2012b), à savoir : forte saisonnalité, existence d’épidémies
localisées sporadiques à l’échelle des aires de santé, y compris en dehors des années « non-
épidémiques », et formation de vagues épidémiques à l’échelle du pays, à intervalles
irréguliers. Cela permettrait également de valider, ou d’invalider, notre interprétation des
résultats de l’Article II (influence de la sécheresse sur les variations inter-annuelles du
risque d’invasion, rôle des aires voisines dans le risque de transmission du pathogène,
vagues épidémiques constituées par l’expansion géographique d’épidémies localisées…).
Enfin, un tel modèle pourrait être renforcé par l’inclusion d’effets stochastiques, qui
devraient permettre de modéliser la persistance, les extinctions locales et les réintroductions
du pathogène à l’échelle des aires de santé.
Au final, il nous semble que les deux approches, statistique et mathématique,
doivent s’enrichir l’une de l’autre et que des progrès pourront être réalisés si l’on combine
le meilleur des deux démarches : une meilleure prise en compte des processus sous-jacents
de la maladie et l’incorporation de données réelles de surveillance et de facteurs de risque
pour mieux refléter la réalité et améliorer les prédictions.
Évolutions à venir
Les questions soulevées ici – élucider le rôle du portage, de l’immunité, du climat,
des interactions spatiales, etc. – prennent toute leur importance dans le contexte actuel où
des changements épidémiologiques vont être induits par l’introduction du nouveau vaccin
conjugué. Il sera nécessaire d’y répondre si l’on veut comprendre, modéliser et prévoir ces
évolutions, à court et à long terme. Parmi les changements potentiels et redoutés, la
disparition du sérogroupe A grâce à la vaccination conjuguée laisserait une niche écologique
vide que d’autres sérogroupes pourraient occuper (Martcheva et al., 2008). La modélisation
pourrait aider à anticiper ce risque de remplacement des sérogroupes, comme cela a été fait
127

au Canada par exemple (Vickers et al., 2013), et à adapter les stratégies vaccinales en
conséquence. D’autre part, les modèles existants ont été développés principalement sur des
données de cas suspects, dont la majorité était alors constituée de cas de méningocoque A,
le sérogroupe prédominant lors des épidémies. Il sera donc intéressant de suivre la
dynamique future des autres sérogroupes, d’examiner s’ils sont influencés par les mêmes
facteurs de risque, et s’ils manifestent les mêmes schémas spatio-temporels. En attendant
d’avoir plus de recul et donc plus de données post-vaccination conjuguée, la base de
données de cas confirmés du CERMES, qui permet de distinguer les différents sérogroupes
présents au Niger, dont le A, le W et le X, pourrait être mise à profit pour étudier la
redéfinition éventuelle des seuils d’alerte et d’épidémie et pour développer un modèle
prédictif spécifiquement sur les sérogroupes non-A afin d’apprécier la robustesse des
résultats obtenus.
6.4 Conclusion générale
Dans cette thèse, nous avons étudié la dynamique spatio-temporelle de la méningite
à méningocoque au Niger, au moyen de différentes méthodes statistiques d’épidémiologie
spatiale. D’une part, nos travaux ont contribué à améliorer les connaissances
scientifiques, notamment grâce à l’originalité de leur approche géographique et de l’échelle
spatiale utilisée : mise en évidence des caractéristiques de la distribution spatio-temporelle
des cas, des facteurs climatiques et non-climatiques associés aux variations inter-annuelles
de l’incidence dans les aires de santé, et des facteurs prédictifs des épidémies localisées.
D’autre part, nous avons montré comment ces connaissances scientifiques peuvent
contribuer à rendre plus efficaces les stratégies de santé publique : apports de l’échelle des
aires de santé pour la surveillance, la détection et le contrôle des épidémies en Afrique
subsaharienne, et pistes prometteuses pour l’élaboration d’un système d’alerte précoce.
Ces résultats ont été obtenus sur la base de données du Niger mais peuvent servir
d’exemple pour les autres pays de la ceinture de la méningite, en illustrant ce que la
surveillance à l’échelle des aires de santé et les analyses spatiales apportent à la prévention
et au contrôle des épidémies. Il serait intéressant de reproduire ces analyses dans les pays
partageant les mêmes caractéristiques épidémiologiques et climatiques.
Malgré les espoirs apportés par l’introduction d’un nouveau vaccin conjugué contre
le sérogroupe A, la manière dont le méningocoque va s’adapter aux évolutions en cours est
128

inconnue. Dans ce contexte, il reste nécessaire de continuer le développement de modèles
explicatifs et prédictifs des épidémies, pour réévaluer et adapter les stratégies de contrôle à
cette nouvelle situation. Il sera également primordial de maintenir une surveillance
performante des méningites dans la ceinture, pour suivre soigneusement l’évolution de la
situation épidémiologique.
Plus généralement, ces travaux ont montré l’importance des questions d’échelle
spatiale, en particulier dans l’étude des maladies infectieuses, et l’intérêt d’appliquer plus
largement de telles méthodes spatio-temporelles au sein d’un travail épidémiologique, pour
améliorer la surveillance, la compréhension des épidémies et les stratégies de santé
publique.
129

7 Bibliographie
130

Agier, Deroubaix, A., Martiny, N., Yaka, P., Djibo, H., Broutin, H., 2013. Seasonality of meningitis in Africa and climate forcing: aerosols stand out. J. R. Soc. Interface 10. doi:10.1098/rsif.2012.0814
Agier, L., Broutin, H., Bertherat, E., Djingarey, M.H., Lingani, C., Perea, W., Hugonnet, S., 2013. Timely detection of bacterial meningitis epidemics at district level: a study in three countries of the African Meningitis Belt. Trans. R. Soc. Trop. Med. Hyg. 107, 30–36. doi:10.1093/trstmh/trs010
Agier, L., Stanton, M., Soga, G., Diggle, P.J., 2012. A multi-state spatio-temporal Markov model for categorized incidence of meningitis in sub-Saharan Africa. Epidemiol. Infect. 1, 1–8.
Alexander, F.E., 1992. Space-time clustering of childhood acute lymphoblastic leukaemia: indirect evidence for a transmissible agent. Br. J. Cancer 65, 589–592.
Alonso, J.-M., Taha, M.-K., 2003. [Respiratory virosis and invasive bacterial superinfections. The case for influenza and meningococcal diseases]. Arch. Pédiatrie Organe Off. Sociéte Fr. Pédiatrie 10, 1013–1015.
Anselin, L., 1995. Local indicators of spatial association. Geogr. Anal. 27, 93–115. Anselin, L., 2004. Review of cluster analysis software, in: Report in Fulfilment of
Consultant Agreement #2003-04-01 with the North American Association of Central Cancer Registries, Inc.
Assunção, R., Costa, M., Tavares, A., Ferreira, S., 2006. Fast detection of arbitrarily shaped disease clusters. Stat. Med. 25, 723–742. doi:10.1002/sim.2411
AvRuskin, G.A., Jacquez, G.M., Meliker, J.R., Slotnick, M.J., Kaufmann, A.M., Nriagu, J.O., 2004. Visualization and exploratory analysis of epidemiologic data using a novel space time information system. Int. J. Health Geogr. 3, 26. doi:10.1186/1476-072X-3-26
Ball, W., LeFevre, S., Jarup, L., Beale, L., 2008. Comparison of Different Methods for Spatial Analysis of Cancer Data in Utah. Environ. Health Perspect. 116, 1120–1124. doi:10.1289/ehp.10815
Banos, A., 2001. A propos de l’analyse spatiale exploratoire des données. Cybergeo Eur. J. Geogr., Systèmes, Modélisation, Géostatistiques. doi:10.4000/cybergeo.4056
Basta, N.E., Stuart, J.M., Nascimento, M.C., Manigart, O., Trotter, C., Hassan-King, M., Chandramohan, D., Sow, S.O., Berthe, A., Bedru, A., Tekletsion, Y.K., Collard, J.-M., Jusot, J.-F., Diallo, A., Basséne, H., Daugla, D.M., Gamougam, K., Hodgson, A., Forgor, A.A., Omotara, B.A., Gadzama, G.B., Watkins, E.R., Rebbetts, L.S., Diallo, K., Weiss, N.S., Halloran, M.E., Maiden, M.C.J., Greenwood, B., 2013. Methods for identifying Neisseria meningitidis carriers: a multi-center study in the African meningitis belt. PloS One 8, e78336. doi:10.1371/journal.pone.0078336
Beale, L., Abellan, J.J., Hodgson, S., Jarup, L., 2008. Methodologic Issues and Approaches to Spatial Epidemiology. Environ. Health Perspect. 116, 1105–1110. doi:10.1289/ehp.10816
Beasley, R.P., 1988. Hepatitis B virus. The major etiology of hepatocellular carcinoma. Cancer 61, 1942–1956.
Beck, L.R., Lobitz, B.M., Wood, B.L., 2000. Remote sensing and human health: new sensors and new opportunities. Emerg. Infect. Dis. 6, 217–227.
Bertherat, E., 2007. Meningococcal Meningitis in Africa: Overview, Response strategies and Current challenges.
Besag, J., Newell, J., 1991. The Detection of Clusters in Rare Diseases. J. R. Stat. Soc. A 154, 143–155.
Besag, J., York, J., Mollié, A., 1991. Bayesian image restoration, with two applications in spatial statistics. Ann. Inst. Stat. Math. 43, 1–20. doi:10.1007/BF00116466
131
Best, N.G., Arnold, R., Thomas, A., Waller, L., Conlon, E., 1999. Bayesian models for spatially correlated disease and exposure data, in: Bayesian Statistics 6: Proceedings of the Sixth Valencia International Meeting, June 6-10, 1998. pp. 131–156.
Bharti, N., Broutin, H., Grais, R.F., Ferrari, M.J., Djibo, A., Tatem, A.J., Grenfell, B.T., 2012. Spatial dynamics of meningococcal meningitis in Niger: observed patterns in comparison with measles. Epidemiol. Infect. 140, 1356–1365. doi:10.1017/S0950268811002032
Bingen, E., 2001. Meningites bacteriennes communautaires, Guides médi-bio, ISSN 1631-3623. Elsevier, Paris, France.
Bithell, J., 1998. Geographical analysis. Encycl. Biostat. Blakebrough, I.S., Greenwood, B.M., Whittle, H.C., Bradley, A.K., Gilles, H.M., 1982. The
epidemiology of infections due to Neisseria meningitidis and Neisseria lactamica in a northern Nigerian community. J. Infect. Dis. 146, 626–637.
Boisier, P., Djibo, S., Sidikou, F., Mindadou, H., Kairo, K.K., Djibo, A., Goumbi, K., Chanteau, S., 2005. Epidemiological patterns of meningococcal meningitis in Niger in 2003 and 2004: under the threat of N. meningitidis serogroup W135. Trop. Med. Int. Health TM IH 10, 435–443.
Boisier, P., Nicolas, P., Djibo, S., Taha, M., Jeanne, I., Mainassara, H.B., Tenebray, B., Kairo, K.K., Giorgini, D., Chanteau, S., 2007. Meningococcal Meningitis: Unprecedented Incidence of Serogroup X–Related Cases in 2006 in Niger. Clin. Infect. Dis. 44, 657–663.
Bolker, B., Grenfell, B., 1995. Space, persistence and dynamics of measles epidemics. Philos. Trans. R. Soc. Lond. B. Biol. Sci. 348, 309–320. doi:10.1098/rstb.1995.0070
Bolker, B.M., Brooks, M.E., Clark, C.J., Geange, S.W., Poulsen, J.R., Stevens, M.H.H., White, J.-S.S., 2009. Generalized linear mixed models: a practical guide for ecology and evolution. Trends Ecol. Evol. 24, 127–135. doi:10.1016/j.tree.2008.10.008
Brandtzaeg, P., 2006. Pathogenesis and pathophysiology of invasive meningococcal disease, in: Frosch, M., Maiden, M.C.J. (Eds.), Handbook of Meningococcal Disease: Infection Biology, Vaccination, Clinical Management. Wiley-VCH Verlag GmbH & Co. KGaA, pp. 427–480.
Brandtzaeg, P., van Deuren, M., 2012. Classification and pathogenesis of meningococcal infections. Methods Mol. Biol. Clifton NJ 799, 21–35. doi:10.1007/978-1-61779-346-2_2
Briggs, D., 2000. Exposure assessment, in: Spatial Epidemiology: Methods and Applications. Oxford University Press, New-York, pp. 335–359.
Broome, C.V., Rugh, M.A., Yada, A.A., Giat, L., Giat, H., Zeltner, J.M., Sanborn, W.R., Fraser, D.W., 1983. Epidemic group C meningococcal meningitis in Upper Volta, 1979. Bull. World Health Organ. 61, 325–330.
Broutin, H., Philippon, S., Constantin de Magny, G., Courel, M.-F., Sultan, B., Guégan, J.-F., 2007. Comparative study of meningitis dynamics across nine African countries: a global perspective. Int. J. Health Geogr. 6, 29.
Caini, S., Beck, N.S., Yacouba, H., Maiga, I., Chaibou, I., Hinsa, I., Adakal, A., Issoufou, A., Kim, S.H., Pezzoli, L., 2013. From Agadez to Zinder: estimating coverage of the MenAfriVacTM conjugate vaccine against meningococcal serogroup A in Niger, September 2010 – January 2012. Vaccine 31, 1597–1603. doi:10.1016/j.vaccine.2013.01.015
Campagne, G., Schuchat, A., Djibo, S., Ousséini, A., Cissé, L., Chippaux, J.P., 1999. Epidemiology of bacterial meningitis in Niamey, Niger, 1981-96. Bull. World Health Organ. 77, 499–508.
Cartwright, K., 1995a. Meningococcal carriage and disease, in: Cartwright, K. (Ed.), Meningococcal Disease. Wiley & Sons, Chichester, UK, pp. 113–146.
132

Cartwright, K., 1995b. Meningococcal disease. Wiley & Sons, Chichester, UK. Cartwright, K.A., Jones, D.M., Smith, A.J., Stuart, J.M., Kaczmarski, E.B., Palmer, S.R.,
1991. Influenza A and meningococcal disease. Lancet 338, 554–557. Caugant, D.A., 2002. L’épidémiologie moléculaire des méningocoques. Bull Soc Pathol
Exot 95, 319–322. Caugant, D.A., Kristiansen, B.E., Frøholm, L.O., Bøvre, K., Selander, R.K., 1988. Clonal
diversity of Neisseria meningitidis from a population of asymptomatic carriers. Infect. Immun. 56, 2060–2068.
Caugant, D.A., Kristiansen, P.A., Wang, X., Mayer, L.W., Taha, M.-K., Ouédraogo, R., Kandolo, D., Bougoudogo, F., Sow, S., Bonte, L., 2012. Molecular characterization of invasive meningococcal isolates from countries in the African meningitis belt before introduction of a serogroup A conjugate vaccine. PloS One 7, e46019. doi:10.1371/journal.pone.0046019
CDC, 2013. Vaccines and Immunizations : Glossary [WWW Document]. Cent. Dis. Control Prev. URL http://www.cdc.gov/vaccines/about/terms/glossary.htm#e (accessed 5.15.14).
CDC, 2014. Meningococcal Disease - Chapter 3 - 2014 Yellow Book [WWW Document]. URL http://wwwnc.cdc.gov/travel/yellowbook/2014/chapter-3-infectious-diseases-related-to-travel/meningococcal-disease (accessed 4.28.14).
Chanteau, S., Dartevelle, S., Mahamane, A.E., Djibo, S., Boisier, P., Nato, F., 2006. New rapid diagnostic tests for Neisseria meningitidis serogroups A, W135, C, and Y. PLoS Med 3, e337.
Chanteau, S., Sidikou, F., Djibo, S., Moussa, A., Mindadou, H., Boisier, P., 2006. Scaling up of PCR-based surveillance of bacterial meningitis in the African meningitis belt: indisputable benefits of multiplex PCR assay in Niger. Trans. R. Soc. Trop. Med. Hyg. 100, 677–680.
Chen, J., Roth, R.E., Naito, A.T., Lengerich, E.J., Maceachren, A.M., 2008. Geovisual analytics to enhance spatial scan statistic interpretation: an analysis of U.S. cervical cancer mortality. Int. J. Health Geogr. 7, 57. doi:10.1186/1476-072X-7-57
Clayton, D., Bernardinelli, L., 1992. Bayesian methods for mapping disease risk, in: Geographical and Environmental Epidemiology. Oxford University Press, pp. 205–220.
Clayton, D., Kaldor, J., 1987. Empirical Bayes Estimates of Age-standardized Relative Risks for Use in Disease Mapping. Biometrics 43, 671–681.
Cliff, A.D., Haggett, P., 1989. Atlas of Disease Distributions: Analytic Approaches to Epidemiological Data. Blackwell Pub, Oxford, UK ; New York, NY, USA.
Cliff, A.D., Ord, J.K., 1973. Spatial autocorrelation. Pion. Cline, B.L., 1970. New eyes for epidemiologists: aerial photography and other remote
sensing techniques. Am. J. Epidemiol. 92, 85–89. Collard, J.-M., Issaka, B., Zaneidou, M., Hugonnet, S., Nicolas, P., Taha, M.-K.,
Greenwood, B., Jusot, J.-F., 2013a. Epidemiological changes in meningococcal meningitis in Niger from 2008 to 2011 and the impact of vaccination. BMC Infect. Dis. 13, 576. doi:10.1186/1471-2334-13-576
Collard, J.M., Maman, Z., Abani, A., Mainasara, H.B., Djibo, S., Yacouba, H., Maitournam, R., Sidikou, F., Nicolas, P., Rocourt, J., Jusot, J.F., 2011. Microbiological and epidemiological investigation of the Neisseria meningitidis serogroup A epidemic in Niger in 2009: last wave before the introduction of the serogroup A meningococcal conjugate vaccine? Epidemiol. Infect. 139, 1656–1660. doi:10.1017/S0950268810003092
Collard, J.-M., Wang, X., Mahamane, A.E., Idi, I., Issaka, B., Ousseni, M., Mayer, L.W., Nato, F., Moulia-Pelat, J.-P., 2013b. A five-year field assessment of rapid diagnostic
133

tests for meningococcal meningitis in Niger by using the combination of conventional and real-time PCR assays as a gold standard. Trans. R. Soc. Trop. Med. Hyg. trt104. doi:10.1093/trstmh/trt104
Cox, J., Abeku, T.A., 2007. Early warning systems for malaria in Africa: from blueprint to practice. Trends Parasitol. 23, 243–246. doi:10.1016/j.pt.2007.03.008
Cressie, N.A.C., 1993. Statistics for spatial data. J. Wiley. Cuevas, L.E., Savory, E.C., Hart, C.A., Thomson, M.C., Yassin, M.A., 2007. Effect of
reactive vaccination on meningitis epidemics in Southern Ethiopia. J. Infect. 55, 425–430.
Cuzick, J., Edwards, R., 1990. Spatial clustering for inhomogeneous populations. J. R. Stat. Soc. Ser. B 52, 73–104.
Cuzick, J., Elliott, P., 1994. Small-area studies: purpose and methods, in: Geographical and Environmental Epidemiology : Methods for Small-Area Studies. Oxford University Press, New York, pp. 14–21.
Daugla, D., Gami, J., Gamougam, K., Naibei, N., Mbainadji, L., Narbé, M., Toralta, J., Kodbesse, B., Ngadoua, C., Coldiron, M., Fermon, F., Page, A.-L., Djingarey, M., Hugonnet, S., Harrison, O., Rebbetts, L., Tekletsion, Y., Watkins, E., Hill, D., Caugant, D., Chandramohan, D., Hassan-King, M., Manigart, O., Nascimento, M., Woukeu, A., Trotter, C., Stuart, J., Maiden, M., Greenwood, B., 2014. Effect of a serogroup A meningococcal conjugate vaccine (PsA–TT) on serogroup A meningococcal meningitis and carriage in Chad: a community study. The Lancet 383, 40–47. doi:10.1016/S0140-6736(13)61612-8
De La Rocque, S., Michel, J.F., Cuisance, D., 2001. Les différentes potentialités d’un système d’information géographique pour les études en épidémiologie : L’exemple des trypanosomoses animales en zone soudanienne. Médecine Trop. 61, 365–371.
Decosas, J., Koama, J.-B.T., 2002. Chronicle of an outbreak foretold: meningococcal meningitis W135 in Burkina Faso. Lancet Infect. Dis. 2, 763–765.
Dee, D.P., Uppala, S.M., Simmons, A.J., Berrisford, P., Poli, P., Kobayashi, S., Andrae, U., Balmaseda, M.A., Balsamo, G., Bauer, P., Bechtold, P., Beljaars, A.C.M., van de Berg, L., Bidlot, J., Bormann, N., Delsol, C., Dragani, R., Fuentes, M., Geer, A.J., Haimberger, L., Healy, S.B., Hersbach, H., Hólm, E.V., Isaksen, L., Kållberg, P., Köhler, M., Matricardi, M., McNally, A.P., Monge-Sanz, B.M., Morcrette, J.-J., Park, B.-K., Peubey, C., de Rosnay, P., Tavolato, C., Thépaut, J.-N., Vitart, F., 2011. The ERA-Interim reanalysis: configuration and performance of the data assimilation system. Q. J. R. Meteorol. Soc. 137, 553–597. doi:10.1002/qj.828
Deghmane, A.-E., Taha, M.-K., 2010. Physiopathologie des infections invasives à méningocoque. Médecine Thérapeutique Pédiatrie 13, 117–122.
Denis, F., Rey, J.L., Amadou, A., Saliou, P., Prince-David, M., M’Boup, S., Cadox, M., Mar, I.D., Etienne, J., 1982. Emergence of meningococcal meningitis caused by W 135 subgroup in Africa. Lancet 2, 1335–1336.
Diggle, P., Moyeed, R., Rowlingson, B., Thomson, M., 2002. Childhood malaria in the Gambia: a case-study in model-based geostatistics. J. R. Stat. Soc. Ser. C Appl. Stat. 51, 493–506. doi:10.1111/1467-9876.00283
Dister, S.W., Fish, D., Bros, S.M., Frank, D.H., Wood, B.L., 1997. Landscape characterization of peridomestic risk for Lyme disease using satellite imagery. Am. J. Trop. Med. Hyg. 57, 687–692.
Djibo, S., Nicolas, P., Alonso, J.-M., Djibo, A., Couret, D., Riou, J.-Y., Chippaux, J.-P., 2003. Outbreaks of serogroup X meningococcal meningitis in Niger 1995-2000. Trop. Med. Int. Health TM IH 8, 1118–1123.
Dukic, V., Hayden, M., Forgor, A.A., Hopson, T., Akweongo, P., Hodgson, A., Monaghan, A., Wiedinmyer, C., Yoksas, T., Thomson, M.C., Trzaska, S., Pandya, R., 2012. The
134

Role of Weather in Meningitis Outbreaks in Navrongo, Ghana: A Generalized Additive Modeling Approach. J. Agric. Biol. Environ. Stat. 17, 442–460. doi:10.1007/s13253-012-0095-9
Edmond, K., Clark, A., Korczak, V.S., Sanderson, C., Griffiths, U.K., Rudan, I., 2010. Global and regional risk of disabling sequelae from bacterial meningitis: a systematic review and meta-analysis. Lancet Infect. Dis. 10, 317–328. doi:10.1016/S1473-3099(10)70048-7
Elliott, P., Wakefield, J., Best, N., Briggs, D.J., 2000a. Spatial epidemiology: methods and applications. Oxford University Press, New-York.
Elliott, P., Wakefield, J.C., Best, N.G., Briggs, D.J., 2000b. Spatial epidemiology: methods and applications, in: Spatial Epidemiology: Methods and Applications. Oxford University Press, New-York, pp. 3–14.
Elliott, P., Wartenberg, D., 2004. Spatial epidemiology: current approaches and future challenges. Environ. Health Perspect. 112, 998–1006.
Ferguson, N.M., Donnelly, C.A., Anderson, R.M., 2001. The Foot-and-Mouth Epidemic in Great Britain: Pattern of Spread and Impact of Interventions. Science 292, 1155–1160. doi:10.1126/science.1061020
Ferrari, M.J., Grais, R.F., Bharti, N., Conlan, A.J.K., Bjørnstad, O.N., Wolfson, L.J., Guerin, P.J., Djibo, A., Grenfell, B.T., 2008. The dynamics of measles in sub-Saharan Africa. Nature 451, 679–684. doi:10.1038/nature06509
Fong, Y., Rue, H., Wakefield, J., 2010. Bayesian inference for generalized linear mixed models. Biostat. Oxf. Engl. 11, 397–412. doi:10.1093/biostatistics/kxp053
Frasch, C.E., Zollinger, W.D., Poolman, J.T., 1985. Serotype antigens of Neisseria meningitidis and a proposed scheme for designation of serotypes. Rev. Infect. Dis. 7, 504–510.
Gattrell, A., Loytonen, M., 1998. GIS and Health. Houghton Mifflin Harcourt. Gazibo, M., Gazibo, S., Grégoire, E., Universalis, n.d. NIGER [WWW Document]. Encycl.
Universalis. URL http://www.universalis-edu.com/encyclopedie/niger/ (accessed 4.29.14).
Geary, R.C., 1954. The Contiguity Ratio and Statistical Mapping. Inc. Stat. 5, 115. doi:10.2307/2986645
Gelman, A., Rubin, D.B., 1992. Inference from Iterative Simulation Using Multiple Sequences. Stat. Sci. 7, 457–472. doi:10.1214/ss/1177011136
Ghipponi, P., Darrigol, J., Skalova, R., Cvjetanovic, B., 1971. Study of bacterial air pollution in an arid region of Africa affected by cerebrospinal meningitis. Bull. World Health Organ. 45, 95–101.
Gold, R., Lepow, M.L., Goldschneider, I., Draper, T.L., Gotschlich, E.C., 1975. Clinical evaluation of group A and group C meningococcal polysaccharide vaccines in infants. J. Clin. Invest. 56, 1536–1547. doi:10.1172/JCI108235
Goldschneider, I., Gotschlich, E.C., Artenstein, M.S., 1969a. Human immunity to the meningococcus. II. Development of natural immunity. J. Exp. Med. 129, 1327–1348.
Goldschneider, I., Gotschlich, E.C., Artenstein, M.S., 1969b. Human immunity to the meningococcus. I. The role of humoral antibodies. J. Exp. Med. 129, 1307–1326.
Goovaerts, P., 2006. Geostatistical analysis of disease data: accounting for spatial support and population density in the isopleth mapping of cancer mortality risk using area-to-point Poisson kriging. Int. J. Health Geogr. 5, 52. doi:10.1186/1476-072X-5-52
Gotschlich, E.C., Goldschneider, I., Artenstein, M.S., 1969. Human immunity to the meningococcus. IV. Immunogenicity of group A and group C meningococcal polysaccharides in human volunteers. J. Exp. Med. 129, 1367–1384.
135

Gouvernement du Niger, 2013. Le Niger [WWW Document]. Portail Off. Gouv. Niger. URL http://www.gouv.ne/index.php/le-niger/presentation (accessed 4.28.14).
Greenland, S., 1992. Divergent biases in ecologic and individual-level studies. Stat. Med. 11, 1209–1223.
Greenwood, B., 1999. Manson Lecture. Meningococcal meningitis in Africa. Trans. R. Soc. Trop. Med. Hyg. 93, 341–353.
Greenwood, B., 2006. Editorial: 100 years of epidemic meningitis in West Africa - has anything changed? Trop. Med. Int. Health TM IH 11, 773–780. doi:10.1111/j.1365-3156.2006.01639.x
Greenwood, B., 2013. Priorities for research on meningococcal disease and the impact of serogroup A vaccination in the African meningitis belt. Vaccine 31, 1453–1457. doi:10.1016/j.vaccine.2012.12.035
Grenfell, B.T., Bjørnstad, O.N., Kappey, J., 2001. Travelling waves and spatial hierarchies in measles epidemics. Nature 414, 716–723. doi:10.1038/414716a
Guégan, J.F., Choisy, M., 2009. Introduction à l’épidémiologie intégrative des maladies infectieuses et parasitaires, LMD.Licence Maîtrise Doctorat.Cours Biologie. De Boeck, Bruxelles.
Guihenneuc-Jouyaux, C., 2002. Modélisation statistique des variations géographiques : enjeu d’importance en épidémiologie et en statistique. Rev. Dépidémiologie Santé Publique 50, 409–412.
Guyon, X., 2007. Statistique spatiale. Presented at the Conférence SADA( Statistique Appliquée pour le Développement en Afrique), Cotonou, Bénin, p. 96.
Guzzo, J.-C., 1997. Etude des effets à court terme sur la santé d’une source locale de pollution atmosphérique. Institut de Veille Sanitaire.
Hamidou, A.A., Djibo, S., Mamane, A.E., Moussa, A., Chanteau, S., 2008. Serogrouping of non-interpretable Neisseria meningitidis carriage strains, using rapid diagnostic tests. Trans. R. Soc. Trop. Med. Hyg. 102, 99–100.
Haneberg, B., Tønjum, T., Rodahl, K., Gedde-Dahl, T.W., 1983. Factors preceding the onset of meningococcal disease, with special emphasis on passive smoking, symptoms of ill health. NIPH Ann. 6, 169–173.
Harrison, L.H., Armstrong, C.W., Jenkins, S.R., Harmon, M.W., Ajello, G.W., Miller, G.B., Jr, Broome, C.V., 1991. A cluster of meningococcal disease on a school bus following epidemic influenza. Arch. Intern. Med. 151, 1005–1009.
Hassan-King, M.K.A., Wall, R.A., Greenwood, B.M., 1988. Meningococcal carriage, meningococcal disease and vaccination. J. Infect. 16, 55–59. doi:10.1016/S0163-4453(88)96117-8
Hay, S.I., 2000. An overview of remote sensing and geodesy for epidemiology and public health application. Adv. Parasitol. 47, 1–35.
Hay, S.I., Simba, M., Busolo, M., Noor, A.M., Guyatt, H.L., Ochola, S.A., Snow, R.W., 2002. Defining and detecting malaria epidemics in the highlands of western Kenya. Emerg. Infect. Dis. 8, 555–562.
Hay, S.I., Snow, R.W., Rogers, D.J., 1998. Predicting malaria seasons in Kenya using multitemporal meteorological satellite sensor data. Trans. R. Soc. Trop. Med. Hyg. 92, 12–20.
Hayden, M.H., Dalaba, M., Awine, T., Akweongo, P., Nyaaba, G., Anaseba, D., Pelzman, J., Hodgson, A., Pandya, R., 2013. Knowledge, Attitudes, and Practices Related to Meningitis in Northern Ghana. Am. J. Trop. Med. Hyg. 89, 265–270. doi:10.4269/ajtmh.12-0515
Health and Climate Foundation, 2010. 4th MERIT Technical Meeting : Synthesis report. Geneva, Switzerland.
136

Hodgson, A., Smith, T., Gagneux, S., Adjuik, M., Pluschke, G., Mensah, N.K., Binka, F., Genton, B., 2001. Risk factors for meningococcal meningitis in northern Ghana. Trans. R. Soc. Trop. Med. Hyg. 95, 477–480. doi:10.1016/S0035-9203(01)90007-0
Howe, G.M., 1963. National Atlas of Disease Mortality in the United Kingdom. T. Nelson. Hubert, B., Watier, L., Garnerin, P., Richardson, S., 1992. Meningococcal disease and
influenza-like syndrome: a new approach to an old question. J. Infect. Dis. 166, 542–545.
Hugh-Jones, M., 1989. Applications of remote sensing to the identification of the habitats of parasites and disease vectors. Parasitol. Today 5, 244–251.
INS, 2012. Le Niger en chiffres 2012. Institut National de la Statistique (INS), Niamey, Niger.
INS, 2013. Enquête Démographique et de Santé et à Indicateurs Multiples du Niger 2012. Institut National de la Statistique (INS) et ICF International, Calverton, Maryland, USA.
Irving, T.J., Blyuss, K.B., Colijn, C., Trotter, C.L., 2012a. Modelling meningococcal meningitis in the African meningitis belt. Epidemiol. Infect. 140, 897–905. doi:10.1017/S0950268811001385
Irving, T.J., Colijn, C., Trotter, C., 2012b. A metapopulation model of meningococcal carriage and disease in Burkina Faso. Presented at the 6th International MERIT Technical Meeting, Accra, Ghana.
Jackou-Boulama, M., Michel, R., Ollivier, L., Meynard, J.B., Nicolas, P., Boutin, J.P., 2005. [Correlation between rainfall and meningococcal meningitis in Niger]. Med. Trop. Rev. Corps Sante Colon. 65, 329–33.
Jacquez, G.M., Greiling, D.A., 2003. Local clustering in breast, lung and colorectal cancer in Long Island, New York. Int. J. Health Geogr. 2, 3.
Jarvis, A., Reuter, H.I., Nelson, A., Guevara, E., 2008. Hole-filled seamless SRTM data V4. International Centre for Tropical Agriculture (CIAT).
Jusot, J.-F., Tohon, Z., Yazi, A.A., Collard, J.-M., 2013. Significant sequelae after bacterial meningitis in Niger: a cohort study. BMC Infect. Dis. 13, 228. doi:10.1186/1471-2334-13-228
Kaninda, A.V., Belanger, F., Lewis, R., Batchassi, E., Aplogan, A., Yakoua, Y., Paquet, C., 2000. Effectiveness of incidence thresholds for detection and control of meningococcal meningitis epidemics in northern Togo. Int. J. Epidemiol. 29, 933–940.
Keeling, M.J., Woolhouse, M.E.J., Shaw, D.J., Matthews, L., Chase-Topping, M., Haydon, D.T., Cornell, S.J., Kappey, J., Wilesmith, J., Grenfell, B.T., 2001. Dynamics of the 2001 UK Foot and Mouth Epidemic: Stochastic Dispersal in a Heterogeneous Landscape. Science 294, 813–817. doi:10.1126/science.1065973
Kelsall, J.E., Wakefield, J.C., 1999. Discussion of “Bayesian models for spatially correlated disease and exposure data” by Best N, Arnold R, Thomas A, Waller L, in: Bayesian Statistics 6: Proceedings of the Sixth Valencia International Meeting, June 6-10, 1998. pp. 131–156.
Knorr-Held, L., 2000. Bayesian modelling of inseparable space-time variation in disease risk. Stat. Med. 19, 2555–2567.
Knorr-Held, L., Besag, J., 1998. Modelling risk from a disease in time and space. Stat. Med. 17, 2045–2060.
Knox, E.G., 1989. Detection of clusters, in: Elliott, P. (Ed.), Methodology of Enquiries into Disease Clustering. Small Area Health Statistics Unit, London, pp. 17–20.
Knox, E.G., Bartlett, M.S., 1964. The Detection of Space-Time Interactions. Appl. Stat. 13, 25. doi:10.2307/2985220
137

Kristiansen, P.A., Diomandé, F., Ba, A.K., Sanou, I., Ouédraogo, A.-S., Ouédraogo, R., Sangaré, L., Kandolo, D., Aké, F., Saga, I.M., Clark, T.A., Misegades, L., Martin, S.W., Thomas, J.D., Tiendrebeogo, S.R., Hassan-King, M., Djingarey, M.H., Messonnier, N.E., Préziosi, M.-P., Laforce, F.M., Caugant, D.A., 2013. Impact of the serogroup A meningococcal conjugate vaccine, MenAfriVac, on carriage and herd immunity. Clin. Infect. Dis. Off. Publ. Infect. Dis. Soc. Am. 56, 354–363. doi:10.1093/cid/cis892
Kristiansen, P.A., Diomandé, F., Wei, S.C., Ouédraogo, R., Sangaré, L., Sanou, I., Kandolo, D., Kaboré, P., Clark, T.A., Ouédraogo, A.-S., Absatou, K.B., Ouédraogo, C.D., Hassan-King, M., Thomas, J.D., Hatcher, C., Djingarey, M., Messonnier, N., Préziosi, M.-P., LaForce, M., Caugant, D.A., 2011. Baseline meningococcal carriage in Burkina Faso before the introduction of a meningococcal serogroup A conjugate vaccine. Clin. Vaccine Immunol. CVI 18, 435–443. doi:10.1128/CVI.00479-10
Kulldorff, M., 1997. A spatial scan statistic. Commun Stat. – Theory Meth 26, 1481–1496. Kulldorff, M., 2001. Prospective time periodic geographical disease surveillance using a
scan statistic. J. R. Stat. Soc. Ser. A Stat. Soc. 164, 61–72. doi:10.1111/1467-985X.00186
Kulldorff, M., 2006. Tests of Spatial Randomness Adjusted for an Inhomogeneity. J. Am. Stat. Assoc. 101, 1289–1305. doi:10.1198/016214506000000618
Kulldorff, M., Athas, W.F., Feurer, E.J., Miller, B.A., Key, C.R., 1998. Evaluating cluster alarms: a space-time scan statistic and brain cancer in Los Alamos, New Mexico. Am. J. Public Health 88, 1377–1380.
Kulldorff, M., Nagarwalla, N., 1995. Spatial disease clusters: Detection and inference. Stat. Med. 14, 799–810. doi:10.1002/sim.4780140809
LaForce, F.M., Ravenscroft, N., Djingarey, M., Viviani, S., 2009. Epidemic meningitis due to group A Neisseria meningitidis in the African meningitis belt: a persistent problem with an imminent solution. Vaccine 27, B13–B19.
Langford, I., Day, R., 2001. Poisson regression, in: Leyland, A.H., Goldstein, H. (Eds.), Multilevel Modelling of Health Statistics. John Wiley & Sons, Chichester, pp. 45–57.
Lapeyssonnie, L., 1963. La méningite cérébrospinale en Afrique. Bull. World Health Organ. 28 Suppl, 1–114.
Lapeyssonnie, L., 1974. Stratégie d’emploi des vaccins antiméningococciques. Presented at the Séminaire international sur les vaccinations en Afrique, Fondation Mérieux, Bamako, pp. 183–189.
Last, J.M., 1988. A Dictionary of epidemiology. Oxford University Press. Lawson, A.B., 2006. Statistical Methods in Spatial Epidemiology, Second edition. ed, Wiley
series in probability and statistics. John Wiley & Sons. Leimkugel, J., Hodgson, A., Forgor, A.A., Pflüger, V., Dangy, J.-P., Smith, T., Achtman,
M., Gagneux, S., Pluschke, G., 2007. Clonal waves of Neisseria colonisation and disease in the African meningitis belt: eight- year longitudinal study in northern Ghana. PLoS Med. 4, e101.
Leimkugel, J., Racloz, L., Da Silva J, Pluschke, G., 2009. Global review of meningococcal disease : a shifting etiology. J. Bacteriol. Res. Vol. 1, H. 1.
Lobitz, B., Beck, L., Huq, A., Wood, B., Fuchs, G., Faruque, A.S., Colwell, R., 2000. Climate and infectious disease: use of remote sensing for detection of Vibrio cholerae by indirect measurement. Proc. Natl. Acad. Sci. U. S. A. 97, 1438–1443.
Lowe, R., Bailey, T.C., Stephenson, D.B., Jupp, T.E., Graham, R.J., Barcellos, C., Carvalho, M.S., 2013. The development of an early warning system for climate-sensitive disease risk with a focus on dengue epidemics in Southeast Brazil. Stat. Med. 32, 864–883. doi:10.1002/sim.5549
138

Lunn, D.J., Thomas, A., Best, N., Spiegelhalter, D., 2000. WinBUGS - A Bayesian modelling framework: Concepts, structure, and extensibility. Stat. Comput. 10, 325–337. doi:10.1023/A:1008929526011
Maiden, M.C., Bygraves, J.A., Feil, E., Morelli, G., Russell, J.E., Urwin, R., Zhang, Q., Zhou, J., Zurth, K., Caugant, D.A., Feavers, I.M., Achtman, M., Spratt, B.G., 1998. Multilocus sequence typing: a portable approach to the identification of clones within populations of pathogenic microorganisms. Proc. Natl. Acad. Sci. U. S. A. 95, 3140–3145.
Maiden, M.C.J., Caugant, D.A., 2006. The Population Biology of Neisseria meningitidis: Implications for Meningococcal Disease, Epidemiology and Control, in: Frosch, M., Maiden, M.C.J. (Eds.), Handbook of Meningococcal Disease. Wiley-VCH Verlag GmbH & Co. KGaA, pp. 17–35.
Mainassara, H.B., Molinari, N., Demattei, C., Fabbro-Peray, P., 2010. The relative risk of spatial cluster occurrence and spatio-temporal evolution of meningococcal disease in Niger, 2002-2008. Geospatial Health 5, 93–101.
Mainassara, H.B., Sidikou, F., Djibo, S., Soussou, A.M., Issaka, B.B., Sidiki, A., Rocourt, J., 2014. Epidemiological Patterns of Bacterial Meningitis in Niger from 2002 to 2010. Sci. J. Public Health 2, 58–63.
Malone, J.B., Huh, O.K., Fehler, D.P., Wilson, P.A., Wilensky, D.E., Holmes, R.A., Elmagdoub, A.I., 1994. Temperature data from satellite imagery and the distribution of schistosomiasis in Egypt. Am. J. Trop. Med. Hyg. 50, 714–722.
Mantel, N., 1967. The Detection of Disease Clustering and a Generalized Regression Approach. Cancer Res. 27, 209–220.
Martcheva, M., Bolker, B.M., Holt, R.D., 2008. Vaccine-induced pathogen strain replacement: what are the mechanisms? J. R. Soc. Interface R. Soc. 5, 3–13. doi:10.1098/rsif.2007.0236
Martiny, N., Chiapello, I., 2013. Assessments for the impact of mineral dust on the meningitis incidence in West Africa. Atmos. Environ. 70, 245–253. doi:10.1016/j.atmosenv.2013.01.016
Matheron, G., 1963. Principles of geostatistics. Econ. Geol. 58, 1246–1266. doi:10.2113/gsecongeo.58.8.1246
Mayaux, P., Bartholomé, E., Cabral, A., Cherlet, M., Defourny, P., Di Gregorio, A., Diallo, O., Massart, M., Nonguierma, A., Pekel, J.-F., Pretorius, C., Vancutsem, C., Vasconcelos, M., 2003. The Land Cover Map for Africa in the Year 2000, Global Land Cover 2000 database. European Commision Joint Research Centre.
Mc Leod Griffiss, J., 1995. Mechanisms of host immunity, in: Cartwright, K. (Ed.), Meningococcal Disease. Wiley & Sons, Chichester, UK, pp. 35–70.
McGahey, K., 1905. Report on an outbreak of epidemic cerebro-spinal meningitis in Zungeru during February and March 1905. J. Trop. Med. 8, 210–216.
MenAfriCar Consortium, 2013. Meningococcal carriage in the African meningitis belt. Trop. Med. Int. Health TM IH 18, 968–978. doi:10.1111/tmi.12125
Molesworth, A.M., Cuevas, L.E., Connor, S.J., Morse, A.P., Thomson, M.C., 2003. Environmental risk and meningitis epidemics in Africa. Emerg. Infect. Dis. 9, 1287–1293.
Molesworth, A.M., Thomson, M.C., Connor, S.J., Cresswell, M.P., Morse, A.P., Shears, P., Hart, C.A., Cuevas, L.E., 2002. Where is the meningitis belt? Defining an area at risk of epidemic meningitis in Africa. Trans. R. Soc. Trop. Med. Hyg. 96, 242–249.
Moore, D.A., Carpenter, T.E., 1999. Spatial analytical methods and geographic information systems: use in health research and epidemiology. Epidemiol. Rev. 21, 143–161.
139

Moore, P., Schwartz, B., Reeves, M., Gellin, B., Broome, C., 1989. Intercontinental spread of an epidemic group A Neisseria meningitidis strain. The Lancet 334, 260–263. doi:10.1016/S0140-6736(89)90439-X
Moore, P.S., 1992. Meningococcal meningitis in sub-Saharan Africa: a model for the epidemic process. Clin. Infect. Dis. Off. Publ. Infect. Dis. Soc. Am. 14, 515–525.
Moore, P.S., Hierholzer, J., DeWitt, W., Gouan, K., Djoré, D., Lippeveld, T., Plikaytis, B., Broome, C.V., 1990. Respiratory viruses and mycoplasma as cofactors for epidemic group A meningococcal meningitis. JAMA J. Am. Med. Assoc. 264, 1271–1275.
Moran, P.A.P., 1950. Notes on continuous stochastic phenomena. Biometrika 37, 17–23. Morgenstern, H., 2008. Ecologic studies, in: Modern Epidemiology. Lippincott Williams &
Wilkins, Philadelphia, pp. 511–531. Morris, S.E., Wakefield, J.C., 2000. Assessment of disease risk in relation to a pre-specified
source, in: Spatial Epidemiology: Methods and Applications. Oxford University Press, New-York, pp. 153–184.
MSF, 2008. Prise en charge d’une épidémie de méningite à méningocoque, Quatrième édition. ed.
Mueller, J.E., Gessner, B.D., 2010. A hypothetical explanatory model for meningococcal meningitis in the African meningitis belt. Int. J. Infect. Dis. 14, e553–e559.
Mueller, J.E., Yaro, S., Madec, Y., Somda, P.K., Idohou, R.S., Njanpop Lafourcade, B.-M., Drabo, A., Tarnagda, Z., Sangare, L., Traore, Y., Fontanet, A., Gessner, B.D., 2008. Association of respiratory tract infection symptoms and air humidity with meningococcal carriage in Burkina Faso. Trop. Med. Int. Health 13, 1543–1552. doi:10.1111/j.1365-3156.2008.02165.x
Mueller, J.E., Yaro, S., Njanpop-Lafourcade, B.-M., Drabo, A., Idohou, R.S., Kroman, S.S., Sanou, O., Diagbouga, S., Traoré, Y., Sangaré, L., Borrow, R., Gessner, B.D., 2011. Study of a localized meningococcal meningitis epidemic in Burkina Faso: incidence, carriage, and immunity. J. Infect. Dis. 204, 1787–1795. doi:10.1093/infdis/jir623
Mueller, J.E., Yaro, S., Traore, Y., Sangare, L., Tarnagda, Z., Njanpop-Lafourcade, B.-M., Borrow, R., Gessner, B.D., 2006. Neisseria meningitidis serogroups A and W-135: carriage and immunity in Burkina Faso, 2003. J. Infect. Dis. 193, 812–820. doi:10.1086/500511
Mutonga, D.M., Pimentel, G., Muindi, J., Nzioka, C., Mutiso, J., Klena, J.D., Morcos, M., Ogaro, T., Materu, S., Tetteh, C., Messonnier, N.E., Breiman, R.F., Feikin, D.R., 2009. Epidemiology and Risk Factors for Serogroup X Meningococcal Meningitis during an Outbreak in Western Kenya, 2005-2006. Am. J. Trop. Med. Hyg. 80, 619–624.
Myers, M.F., Rogers, D.J., Cox, J., Flahault, A., Hay, S.I., 2000. Forecasting disease risk for increased epidemic preparedness in public health. Adv. Parasitol. 47, 309–330.
Nieuwenhuijsen, M., 2000. Personal exposure monitoring in environmental epidemiology, in: Spatial Epidemiology: Methods and Applications. Oxford University Press, New-York, pp. 360–374.
Nuttall, I., O’Neill, K., Meert, J.P., 1998. [Systems of geographic information and the campaign against tropical diseases]. Médecine Trop. Rev. Corps Santé Colon. 58, 221–227.
Olivier de Sardan, J., 2011. Au Niger, le cycle des crises alimentaires [WWW Document]. Blogs Diplo. URL http://blog.mondediplo.net/2011-01-07-Au-Niger-le-cycle-des-crises-alimentaires (accessed 4.28.14).
Olyhoek, T., Crowe, B.A., Achtman, M., 1987. Clonal population structure of Neisseria meningitidis serogroup A isolated from epidemics and pandemics between 1915 and 1983. Rev. Infect. Dis. 9, 665–692.
140

OMS, 1998. Lutte contre les épidémies de méningite à méningocoque : Guide pratique OMS. Organisation mondiale de la Santé. WHO/EMC/BAC/98.3, Geneva.
OMS, 2000. Détecter une épidémie de méningite à méningocoque dans les pays à forte endémicité en Afrique. Relevé Épidémiologique Hebd. 75, 306–309.
OMS, 2009. Procédures Opérationnelles Standard pour la Surveillance Renforcée de la Méningite en Afrique. Organisation Mondiale de la Santé, Bureau Régional de l’Afrique.
OMS, 2013. Infections à méningocoques : saison épidémique 2013 dans la ceinture africaine de la méningite [WWW Document]. OMS Alerte Action Au Niv. Mond. Flambées Épidémiques. URL http://www.who.int/csr/don/2013_06_06_menin/fr/ (accessed 5.19.14).
Openshaw, S., Charlton, M., Wymer, C., Craft, A., 1987. A Mark 1 Geographical Analysis Machine for the automated analysis of point data sets. Int. J. Geogr. Inf. Syst. 1, 335–358. doi:10.1080/02693798708927821
Ostfeld, R.S., Glass, G.E., Keesing, F., 2005. Spatial epidemiology: an emerging (or re-emerging) discipline. Trends Ecol. Evol. 20, 328–336. doi:10.1016/j.tree.2005.03.009
Paireau, J., Girond, F., Collard, J.-M., Maïnassara, H.B., Jusot, J.-F., 2012. Analysing spatio-temporal clustering of meningococcal meningitis outbreaks in Niger reveals opportunities for improved disease control. PLoS Negl. Trop. Dis. 6, e1577. doi:10.1371/journal.pntd.0001577
Paireau, J., Maïnassara, H.B., Jusot, J.-F., Collard, J.-M., Idi, I., Moulia-Pelat, J.-P., Mueller, J.E., Fontanet, A., 2014. Spatio-temporal factors associated with meningococcal meningitis annual incidence at the health centre level in Niger, 2004-2010. PLoS Negl. Trop. Dis. 8, e2899. doi:10.1371/journal.pntd.0002899
Palmgren, H., 2009. Meningococcal disease and climate. Glob. Health Action 2. Parent du Châtelet, I., Alonso, J.M., Taha, M.K., 2002. [Clonal expansion of Neisseria
meningitidis W135. Epidemiological implications for the African meningitis belt]. Bull. Société Pathol. Exot. 95, 323–325.
Pascual, M., Dobson, A., 2005. Seasonal patterns of infectious diseases. PLoS Med. 2. Peltola, H., Kataja, J.M., Mäkelä, P.H., 1982. Shift in the age-distribution of meningococcal
disease as predictor of an epidemic? Lancet 2, 595–597. Pérez, C., Haustein, K., Janjic, Z., Jorba, O., Huneeus, N., Baldasano, J.M., Black, T.,
Basart, S., Nickovic, S., Miller, R.L., Perlwitz, J.P., Schulz, M., Thomson, M., 2011. Atmospheric dust modeling from meso to global scales with the online NMMB/BSC-Dust model &ndash; Part 1: Model description, annual simulations and evaluation. Atmospheric Chem. Phys. 11, 13001–13027. doi:10.5194/acp-11-13001-2011
Pérez García-Pando, C., Stanton, M.C., Diggle, P.J., Trzaska, S., Miller, R.L., Perlwitz, J.P., Baldasano, J.M., Cuevas, E., Ceccato, P., Yaka, P., Thomson, M.C., 2014. Soil Dust Aerosols and Wind as Predictors of Seasonal Meningitis Incidence in Niger. Environ. Health Perspect. doi:10.1289/ehp.1306640
Petermann, A.H., 1852. Cholera Map of the British Isles, Showing the Districts Attacked in 1831, 1832 and 1833, and “Statistical Notes.” John Betts, London.
Philippon, S., Broutin, H., de Magny, G.C., Toure, K., Diakite, C.H., Fourquet, N., Courel, M.-F., Sultan, B., Guegan, J.-F., 2009. Meningococcal meningitis in Mali: a long-term study of persistence and spread. Int. J. Infect. Dis. 13, 103–109. doi:10.1016/j.ijid.2008.05.1223
Pickle, L.W., Mungiole, M., Jones, G.K., White, A.A., 1999. Exploring spatial patterns of mortality: the new atlas of United States mortality. Stat. Med. 18, 3211–3220.
141

Pollard, A.J., Frasch, C., 2001. Development of natural immunity to Neisseria meningitidis. Vaccine 19, 1327–1346.
Pollard, A.J., Nadel, S., 2006. Course of Disease and Clinical Management, in: Frosch, M., Maiden, M.C.J. (Eds.), Handbook of Meningococcal Disease: Infection Biology, Vaccination, Clinical Management. Wiley-VCH Verlag GmbH & Co. KGaA, pp. 481–517.
Potthoff, R.F., Whittinghill, M., 1966. Testing for homogeneity: I. The binomial and multinomial distributions. Biometrika 53, 167–182. doi:10.1093/biomet/53.1-2.167
Pullan, R.L., Gething, P.W., Smith, J.L., Mwandawiro, C.S., Sturrock, H.J.W., Gitonga, C.W., Hay, S.I., Brooker, S., 2011. Spatial modelling of soil-transmitted helminth infections in Kenya: a disease control planning tool. PLoS Negl. Trop. Dis. 5, e958. doi:10.1371/journal.pntd.0000958
Pumain, D., Saint-Julien, T., 2004. L’analyse spatiale. 1. Les localisations dans l’espace. Colin, Paris.
Raghunathan, P.L., Jones, J.D., Tiendrebeogo, S.R.M., Sanou, I., Sangare, L., Kouanda, S., Dabal, M., Lingani, C., Elie, C.M., Johnson, S., Ari, M., Martinez, J., Chatt, J., Sidibe, K., Schmink, S., Mayer, L.W., Konde, M.K., Djingarey, M.H., Popovic, T., Plikaytis, B.D., Carlone, G.M., Rosenstein, N., Soriano-Gabarro, M., 2006. Predictors of immunity after a major serogroup W-135 meningococcal disease epidemic, Burkina Faso, 2002. J. Infect. Dis. 193, 607–616. doi:10.1086/499822
Rainey, J.J., Omenah, D., Sumba, P.O., Moormann, A.M., Rochford, R., Wilson, M.L., 2007. Spatial clustering of endemic Burkitt’s lymphoma in high-risk regions of Kenya. Int. J. Cancer J. Int. Cancer 120, 121–127.
Ramakrishnan, M., Ulland, A.J., Steinhardt, L.C., Moïsi, J.C., Were, F., Levine, O.S., 2009. Sequelae due to bacterial meningitis among African children: a systematic literature review. BMC Med. 7, 47. doi:10.1186/1741-7015-7-47
Reingold, A., 1985. Age-specific differences in duration of clinical protection after vaccination with meningococcal polysaccharide A vaccine. The Lancet 326, 114–118. doi:10.1016/S0140-6736(85)90224-7
Reller, L.B., MacGregor, R.R., Beaty, H.N., 1973. Bactericidal Antibody after Colonization with Neisseria meningitidis. J. Infect. Dis. 127, 56–62. doi:10.1093/infdis/127.1.56
Rezaeian, M., Dunn, G., Leger, S.S., Appleby, L., 2007. Geographical epidemiology, spatial analysis and geographical information systems: a multidisciplinary glossary. J. Epidemiol. Community Health 61, 98–102. doi:10.1136/jech.2005.043117
Richardson, S., Monfort, C., 2000. Ecological correlation studies, in: Spatial Epidemiology: Methods and Applications. Oxford University Press, New-York, pp. 205–220.
Riley, S., 2007. Large-scale spatial-transmission models of infectious disease. Science 316, 1298–1301. doi:10.1126/science.1134695
Riley, S., Ferguson, N.M., 2006. Smallpox transmission and control: Spatial dynamics in Great Britain. Proc. Natl. Acad. Sci. 103, 12637–12642. doi:10.1073/pnas.0510873103
Roberts, G., 1996. Markov Chain Concepts Related to Sampling Algorithms, in: Gilks, W., Spiegelhalter, D., Richardson, S. (Eds.), Markov Chain Monte Carlo in Practice. Chapman and Hall, London.
Robinson, T.P., 2000. Spatial statistics and geographical information systems in epidemiology and public health. Adv. Parasitol. 47, 81–128.
Rogers, D.J., 2000. Satellites, space, time and the African trypanosomiases. Adv. Parasitol. 47, 129–171.
Saliou, P., Stoeckel, P., Lafaye, A., Rey, J., Renaudet, J., 1978. Essais contrôlés du vaccin antiméningococcique polysaccharidique A en Afrique de l’Ouest sahélienne (Haute Volta et Mali). Dev. Biol Stand. 41, 97–108.
142

Santaniello-Newton, A., Hunter, P.R., 2000. Management of an outbreak of meningococcal meningitis in a Sudanese refugee camp in Northern Uganda. Epidemiol. Infect. 124, 75–81.
Schmechtig, C., Marticorena, B., Chatenet, B., Bergametti, G., Rajot, J.L., Coman, A., 2011. Simulation of the mineral dust content over Western Africa from the event to the annual scale with the CHIMERE-DUST model. Atmos Chem Phys 11, 7185–7207. doi:10.5194/acp-11-7185-2011
Schwartz, B., Moore, P.S., Broome, C.V., 1989. Global epidemiology of meningococcal disease. Clin. Microbiol. Rev. 2, S118.
Selvin, H.C., 1958. Durkheim’s Suicide and Problems of Empirical Research. Am. J. Sociol. 63. doi:10.1086/222356
Sidikou, F., Djibo, S., Taha, M.K., Alonso, J.M., Djibo, A., Kairo, K.K., Chanteau, S., Boisier, P., 2003. Polymerase chain reaction assay and bacterial meningitis surveillance in remote areas, Niger. Emerg. Infect. Dis. 9, 1486–1488.
Sié, A., Pflüger, V., Coulibaly, B., Dangy, J.P., Kapaun, A., Junghanss, T., Pluschke, G., Leimkugel, J., 2008. ST2859 serogroup A meningococcal meningitis outbreak in Nouna Health District, Burkina Faso: a prospective study. Trop. Med. Int. Health TM IH 13, 861–868. doi:10.1111/j.1365-3156.2008.02056.x
Snow, J., 1855. On the Mode of Communication of Cholera. John Churchill. Sow, S.O., Okoko, B.J., Diallo, A., Viviani, S., Borrow, R., Carlone, G., Tapia, M.,
Akinsola, A.K., Arduin, P., Findlow, H., Elie, C., Haidara, F.C., Adegbola, R.A., Diop, D., Parulekar, V., Chaumont, J., Martellet, L., Diallo, F., Idoko, O.T., Tang, Y., Plikaytis, B.D., Kulkarni, P.S., Marchetti, E., LaForce, F.M., Preziosi, M.-P., 2011. Immunogenicity and Safety of a Meningococcal A Conjugate Vaccine in Africans. N. Engl. J. Med. 364, 2293–2304. doi:10.1056/NEJMoa1003812
Stanton, M.C., Agier, and L., Taylor, B.M., Diggle, P.J., 2013. Towards realtime spatiotemporal prediction of district level meningitis incidence in sub-Saharan Africa. J. R. Stat. Soc. Ser. A Stat. Soc. n/a–n/a. doi:10.1111/rssa.12033
Stephens, D.S., 2007. Conquering the meningococcus. FEMS Microbiol. Rev. 31, 3–14. doi:10.1111/j.1574-6976.2006.00051.x
Stephens, D.S., Greenwood, B., Brandtzaeg, P., 2007. Epidemic meningitis, meningococcaemia, and Neisseria meningitidis. Lancet 369, 2196–2210.
Steven, N., Wood, M., 1995. The clinical spectrum of meningococcal disease, in: Cartwright, K. (Ed.), Meningococcal Disease. Wiley & Sons, Chichester, UK, pp. 177–205.
Stevenson, L.G., 1965. Putting disease on the map: the early use of spot maps in the study of yellow fever. J. Hist. Med. Allied Sci. 20, 226–261.
Stuart, J.M., Cartwright, K.A., Robinson, P.M., Noah, N.D., 1989. Effect of smoking on meningococcal carriage. Lancet 2, 723–725.
Sugumaran, R., Larson, S.R., DeGroote, J.P., 2009. Spatio-temporal cluster analysis of county-based human West Nile virus incidence in the continental United States. Int. J. Health Geogr. 8.
Sultan, B., Labadi, K., Guégan, J.-F., Janicot, S., 2005. Climate drives the meningitis epidemics onset in west Africa. PLoS Med. 2, e6.
SWAC, OECD, 2009. Regional Atlas on West Africa, West African Studies. OECD Publishing.
Taha, M.-K., 2001. Diagnostic et typage moléculaires des bactéries responsables de méningite bactérienne, in: Bingen, E. (Ed.), Me ningites bacte riennes communautaires, Guides médi-bio. Elsevier, Paris, France.
143

Taha, M.-K., Deghmane, A.-E., Antignac, A., Zarantonelli, M.L., Larribe, M., Alonso, J.-M., 2002. The duality of virulence and transmissibility in Neisseria meningitidis. Trends Microbiol. 10, 376–382.
Tall, H., Hugonnet, S., Donnen, P., Dramaix-Wilmet, M., Kambou, L., Drabo, F., Mueller, J.E., 2012. Definition and characterization of localised meningitis epidemics in Burkina Faso: a longitudinal retrospective study. Bmc Infect. Dis. 12. doi:10.1186/1471-2334-12-2
Tango, T., 1995. A class of tests for detecting “general” and “focused” clustering of rare diseases. Stat. Med. 14, 2323–2334.
Tango, T., Takahashi, K., 2005. A flexibly shaped spatial scan statistic for detecting clusters. Int. J. Health Geogr. 4, 11. doi:10.1186/1476-072X-4-11
Tartof, S., Cohn, A., Tarbangdo, F., Djingarey, M.H., Messonnier, N., Clark, T.A., Kambou, J.L., Novak, R., Diomandé, F.V.K., Medah, I., Jackson, M.L., 2013. Identifying optimal vaccination strategies for serogroup A Neisseria meningitidis conjugate vaccine in the African meningitis belt. PloS One 8, e63605. doi:10.1371/journal.pone.0063605
The Lancet Infectious Diseases, 2011. A vaccine against meningitis in Africa. Lancet Infect. Dis. 11, 1.
Thomson, M.C., Molesworth, A.M., Djingarey, M.H., Yameogo, K.R., Belanger, F., Cuevas, L.E., 2006. Potential of environmental models to predict meningitis epidemics in Africa. Trop. Med. Int. Health 11, 781–788. doi:10.1111/j.1365-3156.2006.01630.x
Tilstra, L., de Graaf, M., Aben, I., Stammes, P., 2012. In-flight degradation correction of SCIAMACHY UV reflectances and Absorbing Aerosol Index. J Geophys Res 117. doi:doi:10.1029/2011JD016957
Tobler, W., 1970. A Computer Movie Simulating Urban Growth in the Detroit Region W. Tobler. Economic Geography 46(2):234--240 (1970). Econ. Geogr. 46, 234–340.
Torres, O., Bhartia, P.K., Herman, J.R., Ahmad, Z., Gleason, J., 1998. Derivation of aerosol properties from satellite measurements of backscattered ultraviolet radiation: Theoretical basis. J. Geophys. Res. Atmospheres 103, 17099–17110. doi:10.1029/98JD00900
Trotter, C.L., Greenwood, B.M., 2007. Meningococcal carriage in the African meningitis belt. Lancet Infect. Dis. 7, 797–803. doi:10.1016/S1473-3099(07)70288-8
Trotter, C.L., Yaro, S., Njanpop-Lafourcade, B.-M., Drabo, A., Kroman, S.S., Idohou, R.S., Sanou, O., Bowen, L., Findlow, H., Diagbouga, S., Gessner, B.D., Borrow, R., Mueller, J.E., 2013. Seroprevalence of Bactericidal, Specific IgG Antibodies and Incidence of Meningitis Due to Group A Neisseria meningitidis by Age in Burkina Faso 2008. PLoS ONE 8, e55486. doi:10.1371/journal.pone.0055486
Turnbull, B.W., Iwano, E.J., Burnett, W.S., Howe, H.L., Clark, L.C., 1990. Monitoring for clusters of disease: application to leukemia incidence in upstate New York. Am. J. Epidemiol. 132, S136–143.
Tzeng, Y.L., Stephens, D.S., 2000. Epidemiology and pathogenesis of Neisseria meningitidis. Microbes Infect. 2, 687–700.
UN CDP, 2013. Least Developed Country Information [WWW Document]. U. N. DESA Dev. Policy Anal. Div. Com. Dev. Policy. URL http://www.un.org/en/development/desa/policy/cdp/ldc_info.shtml (accessed 4.28.14).
UNDP, 2012. Table 1: Human Development Index and its components [WWW Document]. U. N. Dev. Programme Open Data. URL https://data.undp.org/dataset/Table-1-Human-Development-Index-and-its-components/wxub-qc5k (accessed 4.28.14).
144

Viboud, C., Bjørnstad, O.N., Smith, D.L., Simonsen, L., Miller, M.A., Grenfell, B.T., 2006. Synchrony, waves, and spatial hierarchies in the spread of influenza. Science 312, 447–451. doi:10.1126/science.1125237
Vickers, D.M., Anonychuk, A.M., De Wals, P., Demarteau, N., Bauch, C.T., 2013. Evaluation of serogroup C and ACWY meningococcal vaccine programs: Projected impact on disease burden according to a stochastic two-strain dynamic model. Vaccine. doi:10.1016/j.vaccine.2013.09.034
Vieusseux, M., 1805. [Mémoire sur la maladie qui a régné à Genève au printemps de 1805]. J Med Chir Pharmacol.
Waddy, B.B., 1952. Climate and respiratory infections. Lancet 2, 674–677. Wakefield, J.C., Kelsall, J.E., Morris, S.E., 2000. Clustering, cluster detection, and spatial
variation in risk, in: Spatial Epidemiology: Methods and Applications. Oxford University Press, New York, pp. 128–152.
Walter, S., 2000. Disease mapping: a historical perspective, in: Spatial Epidemiology: Methods and Applications. Oxford University Press, New-York, pp. 223–239.
Wang, X.-H., Zhou, X.-N., Vounatsou, P., Chen, Z., Utzinger, J., Yang, K., Steinmann, P., Wu, X.-H., 2008. Bayesian spatio-temporal modeling of Schistosoma japonicum prevalence data in the absence of a diagnostic “gold” standard. PLoS Negl. Trop. Dis. 2, e250. doi:10.1371/journal.pntd.0000250
Washino, R.K., Wood, B.L., 1994. Application of remote sensing to arthropod vector surveillance and control. Am. J. Trop. Med. Hyg. 50, 134–144.
Watkins, R., Eagleson, S., Hall, R., Dailey, L., Plant, A., 2006. Approaches to the evaluation of outbreak detection methods. BMC Public Health 6, 263.
Weichselbaum, A., 1887. Über die aetiologie der akuten meningitis cerebro-spinalis. Fortschr Med 5, 573–583.
Whittemore, A.S., Friend, N., Brown, B.W., Holly, E.A., 1987. A Test to Detect Clusters of Disease. Biometrika 74, 631. doi:10.2307/2336703
WHO, 1999. Laboratory methods for the diagnosis of meningitis caused by Neisseria meningitidis, Streptococcus pneumoniae, and Haemophilus influenzae. World Health Organization. WHO/CDS/CSR/EDC/99.7, Geneva.
WHO, 2013a. Global Health Observatory Data Repository [WWW Document]. World Health Organ. URL http://apps.who.int/gho/data (accessed 10.18.13).
WHO, 2013b. Niger: health profile [WWW Document]. World Health Organ. URL http://www.who.int/gho/countries/ner.pdf (accessed 4.28.14).
WHO, 2014. Countries | Niger [WWW Document]. World Health Organ. URL http://www.who.int/countries/ner/en/ (accessed 4.28.14).
Wilder-Smith, A., Goh, K.T., Barkham, T., Paton, N.I., 2003. Hajj-associated outbreak strain of Neisseria meningitidis serogroup W135: estimates of the attack rate in a defined population and the risk of invasive disease developing in carriers. Clin. Infect. Dis. Off. Publ. Infect. Dis. Soc. Am. 36, 679–683. doi:10.1086/367858
Woods, C.W., Armstrong, G., Sackey, S.O., Tetteh, C., Bugri, S., Perkins, B.A., Rosenstein, N.E., 2000. Emergency vaccination against epidemic meningitis in Ghana: implications for the control of meningococcal disease in West Africa. Lancet 355, 30–33. doi:10.1016/S0140-6736(99)03366-8
World Health Organization, 1998. Control of epidemic meningococcal disease. WHO Practical Guidelines, 2nd ed. World Health Organization. WHO/EMC/BAC/98.3, Geneva.
World Health Organization, 2000. Detecting meningococcal meningitis epidemics in highly-endemic African countries. Wkly. Epidemiol. Rec. 75, 306–309.
145

Yaka, P., Sultan, B., Broutin, H., Janicot, S., Philippon, S., Fourquet, N., 2008. Relationships between climate and year-to-year variability in meningitis outbreaks: a case study in Burkina Faso and Niger. Int. J. Health Geogr. 7, 34.
Yazdankhah, S.P., Caugant, D.A., 2004. Neisseria meningitidis: an overview of the carriage state. J. Med. Microbiol. 53, 821.
Young, L.S., LaForce, F.M., Head, J.J., Feeley, J.C., Bennett, J.V., 1972. A simultaneous outbreak of meningococcal and influenza infections. N. Engl. J. Med. 287, 5–9. doi:10.1056/NEJM197207062870102
Zaninetti, J.-M., 2005. Statistique spatiale, méthodes et applications géomatiques. Hermes Science Publishing Lavoisier, Paris-Londres.
146

8 Annexes
147

8.1 Article I : Paireau J et al. Analysing Spatio-Temporal Clustering of
Meningococcal Meningitis Outbreaks in Niger Reveals Opportunities
for Improved Disease Control. PLoS Neglected Tropical Diseases 2012
148

Analysing Spatio-Temporal Clustering of MeningococcalMeningitis Outbreaks in Niger Reveals Opportunities forImproved Disease Control
Juliette Paireau1*, Florian Girond2, Jean-Marc Collard3, Halima B. Maınassara2, Jean-Francois Jusot2
1Unite d’Epidemiologie des Maladies Emergentes, Institut Pasteur, Paris, France, 2Unite Epidemiologie/Sante-Environnement-Climat, Centre de Recherche Medicale et
Sanitaire (CERMES)/Reseau International des Instituts Pasteur, Niamey, Niger, 3Unite de Biologie, Centre de Recherche Medicale et Sanitaire (CERMES)/Reseau
International des Instituts Pasteur, Niamey, Niger
Abstract
Background: Meningococcal meningitis is a major health problem in the ‘‘African Meningitis Belt’’ where recurrentepidemics occur during the hot, dry season. In Niger, a central country belonging to the Meningitis Belt, reported meningitiscases varied between 1,000 and 13,000 from 2003 to 2009, with a case-fatality rate of 5–15%.
Methodology/Principal Findings: In order to gain insight in the epidemiology of meningococcal meningitis in Niger and toimprove control strategies, the emergence of the epidemics and their diffusion patterns at a fine spatial scale have beeninvestigated. A statistical analysis of the spatio-temporal distribution of confirmed meningococcal meningitis cases wasperformed between 2002 and 2009, based on health centre catchment areas (HCCAs) as spatial units. Anselin’s local Moran’sI test for spatial autocorrelation and Kulldorff’s spatial scan statistic were used to identify spatial and spatio-temporalclusters of cases. Spatial clusters were detected every year and most frequently occurred within nine southern districts.Clusters most often encompassed few HCCAs within a district, without expanding to the entire district. Besides, strong intra-district heterogeneity and inter-annual variability in the spatio-temporal epidemic patterns were observed. To furtherinvestigate the benefit of using a finer spatial scale for surveillance and disease control, we compared timeliness of epidemicdetection at the HCCA level versus district level and showed that a decision based on threshold estimated at the HCCA levelmay lead to earlier detection of outbreaks.
Conclusions/Significance: Our findings provide an evidence-based approach to improve control of meningitis in sub-Saharan Africa. First, they can assist public health authorities in Niger to better adjust allocation of resources (antibiotics,rapid diagnostic tests and medical staff). Then, this spatio-temporal analysis showed that surveillance at a finer spatial scale(HCCA) would be more efficient for public health response: outbreaks would be detected earlier and reactive vaccinationwould be better targeted.
Citation: Paireau J, Girond F, Collard J-M, Maınassara HB, Jusot J-F (2012) Analysing Spatio-Temporal Clustering of Meningococcal Meningitis Outbreaks in NigerReveals Opportunities for Improved Disease Control. PLoS Negl Trop Dis 6(3): e1577. doi:10.1371/journal.pntd.0001577
Editor: Joseph M. Vinetz, University of California San Diego School of Medicine, United States of America
Received July 1, 2011; Accepted February 9, 2012; Published March 20, 2012
Copyright: � 2012 Paireau et al. This is an open-access article distributed under the terms of the Creative Commons Attribution License, which permitsunrestricted use, distribution, and reproduction in any medium, provided the original author and source are credited.
Funding: This work was financially supported by French Ministry of Foreign Affairs (FSP 2005-174), Sanofi Pasteur (contract Men07), the Belgian TechnicalCooperation and the Office of International Cooperation of the Principality of Monaco. The internship of JP in CERMES was financially supported by the FondationPierre-Ledoux Jeunesse Internationale. The funders had no role in study design, data collection and analysis, decision to publish, or preparation of the manuscript.
Competing Interests: The authors have declared that no competing interests exist.
* E-mail: [email protected]
Introduction
BackgroundMeningococcal meningitis (MM), caused by the bacterium
Neisseria meningitidis (Nm), is a major health problem in sub-
Saharan Africa. The highest incidences of the disease are observed
in the so-called ‘‘African Meningitis Belt’’ where annual recurrent
epidemics occur during the very hot, dry season [1]. In Niger,
reported meningitis cases varied between 1,000 and 13,000 from
2003 to 2009, with case-fatality rates of 5–15%. The factors
involved in the spatio-temporal occurrence of meningococcal
epidemics are only suspected and still poorly understood.
Surveillance and reactive vaccination are the predominant
strategies for managing meningococcal meningitis outbreaks in the
Belt, recently completed with a conjugate vaccine to prevent the
carriage of Nm serogroup A. In Niger like in most sub-Saharan
countries, surveillance is performed at the district level. Quanti-
tative morbidity and mortality data on meningitis are collected
within a reporting network managed by the Direction for
Statistics, Surveillance and Response to Epidemics (DSSRE) from
the Ministry of Public Health. Data from all health care facilities
covering the entire Niger population are collected on a weekly
basis by the district health authorities, which aggregate and
forward their data to the regions and subsequently to the DSSRE.
These reported data include all suspected and probable cases,
according to the standard clinical definition of meningococcal
meningitis [2]: A suspected case is any person with sudden onset of
fever (.38.5uC rectal or 38.0uC axillary) and one or more of the
following signs: stiff neck, altered consciousness or other meningeal
sign; in patients under one year of age, a suspected case occurs
www.plosntds.org 1 March 2012 | Volume 6 | Issue 3 | e1577

when fever is accompanied by a bulging fontanelle. A probable
case is defined as a suspected case with turbid CSF or Gram stain
showing Gram-negative diplococcus or petechial/purpural rash or
ongoing epidemic. Laboratory confirmation of meningitis is not
required to report a case. In parallel to this epidemiologic
surveillance and in close collaboration with DSSRE, the Centre de
Recherche Medicale et Sanitaire (CERMES) is in charge of the
national microbiological surveillance of meningitis. The CERMES
collects the cerebrospinal fluid (CSF) samples taken from suspected
cases of meningitis by health care workers or physicians and
carries out the etiological diagnosis (see Methods).
Based on this national surveillance system, the strategy applied
in Niger to respond to meningitis outbreaks with limited amounts
of available vaccines, is to initiate reactive vaccination in a district
once weekly incidence exceeds the epidemic threshold defined by
WHO (see [3] and Methods for definitions). Thus, early detection
of epidemics is essential for an effective operational response.
Spatio-temporal analysisAnalysing spatio-temporal patterns of epidemics at a fine
geographic scale could lead to a better understanding of the
underlying causes of the disease and potential future prediction of
outbreaks [4]. One of the techniques to uncover spatial patterns of
disease is cluster detection. In epidemiology, a cluster is a number
of health events situated close together in space and/or time [5].
Identifying spatial and spatio-temporal clusters of cases could help:
(i) to generate new information for further etiologic studies; (ii) to
identify risk areas where to focus the surveillance and allocate the
resources (antibiotics, rapid diagnostic tests…); (iii) to develop cost-
efficient vaccination strategies.
In sub-Saharan Africa, data from national disease notification
have already been used at country, regional or district levels to
study the geographical and temporal dynamics of epidemics and
their correlation with environmental factors [6–12]. However,
little is known about MM emergence and distribution at a sub-
district level. Using a finer spatial scale such as health centre
catchment areas (HCCAs) would have several advantages: (i) it
would capture heterogeneity in MM incidence at sub-district level;
(ii) epidemic thresholds would be studied at a more accurate scale,
allowing for a more rapid and targeted public health response; (iii)
monitoring of the impact of the intervention would be performed
at the same level as the intervention itself.
Therefore, we aimed to investigate the spatio-temporal
distribution of MM epidemics in Niger at the health centre
catchment area level, to identify the most frequently affected
HCCAs requiring a particular attention from public health
authorities. The national microbiological surveillance database
was used to perform two cluster detection methods in order to
uncover spatial and spatio-temporal clustering of MM incidence
from July 2002 to June 2009. Then, as a preliminary analysis to a
more thorough etiologic study, we searched for ecologic
correlation of MM incidence with human density and roads at
the HCCA level. Finally, to further investigate the benefit of using
a finer spatial scale for surveillance and disease control, we
compared timeliness of epidemic detection at the HCCA level
versus district level. This paper provides new insights into the
spatio-temporal dynamics of MM epidemics and discusses the
potential implications of our findings for meningitis control in sub-
Saharan Africa.
Methods
Data collection and laboratory analysesThe CERMES is the national laboratory in charge of the
microbiological surveillance of meningitis in Niger. This surveil-
lance has been reinforced since 2002 [13,14] by its extension to the
whole country (it was only effective in the capital city before 2002)
and by the inclusion of a Polymerase Chain Reaction (PCR) assay
for etiological diagnosis of meningitis to the DSSRE routine
surveillance. CSF samples were collected by health care workers or
physicians from suspected cases of acute meningitis. Each CSF was
documented with an epidemiological form that included date of
sample collection, clinical information and general characteristics
about the patient (age, sex, geographic origin such as region,
district, HCCA and village). The samples were kept either
refrigerated or frozen in health facilities, or inoculated into a
trans-Isolate (TI) medium. The more remote health centres sent
CSF samples (frozen in a cool box) on a voluntary basis to
CERMES by mandated transport companies. Additionally,
CERMES carried out active collection of samples twice a day in
Niamey, so that the samples remained suitable for culture, and
every month within a radius of about 300 kilometres around
Niamey, in the regions of Tillabery and Dosso. Etiological
diagnosis of MM was carried out by PCR for all CSF as described
in [13] and [14] and by culture [15] for suitable CSF received
promptly at CERMES (fresh CSF and CSF inoculated into TI
medium). Questionnaire data and microbiological results were
entered in a database managed by CERMES. The data were used
for a retrospective study on meningococcal meningitis cases
between July 1, 2002 and June 30, 2009.
Ethics statementAll data were collected through the national routine surveillance
system. Therefore, written consent was not asked and approval
from the national ethics committee was not needed. However,
patients were informed of the reason why their cerebrospinal fluid
was sampled and confidentiality on patients’ identity was
guaranteed.
Geographic and demographic dataIn 2008, in order to create a digitized National Health Map of
Niger, CERMES mapped the country’s HCCAs, each of which
Author Summary
Meningococcal meningitis (MM) is an infection of themeninges caused by a bacterium, Neisseria meningitidis,transmitted through respiratory and throat secretions. Itcan cause brain damage and results in death in 5–15% ofcases. Large epidemics of MM occur almost every year insub-Saharan Africa during the hot, dry season. Under-standing how epidemics emerge and spread in time andspace would help public health authorities to developmore efficient strategies for the prevention and the controlof meningitis. We studied the spatio-temporal distributionof MM cases in Niger from 2002 to 2009 at the scale of thehealth centre catchment areas (HCCAs). We found thatspatial clusters of cases most frequently occurred withinnine districts out of 42, which can assist public healthauthorities to better adjust allocation of resources such asantibiotics or rapid diagnostic tests. We also showed thatthe epidemics break out in different HCCAs from year toyear and did not follow a systematic geographicaldirection. Finally, this analysis showed that surveillance ata finer spatial scale (health centre catchment area ratherthan district) would be more efficient for public healthresponse: outbreaks would be detected earlier andreactive vaccination would be better targeted.
Spatio-Temporal Clustering of Meningitis in Niger
www.plosntds.org 2 March 2012 | Volume 6 | Issue 3 | e1577

included all villages served by the same health centre. As projected
data were required for the spatial statistics, all analyses were
carried out with a projected version of the National Health Map,
using the WGS84 – UTM32N projection. The number of
inhabitants per village was extracted from the 2001 census
database of the Institut National de la Statistique (INS) and an
annual population growth rate of 3% was applied. A shapefile of
primary roads was retrieved from the HealthMapper application
of the World Health Organization (WHO).
Statistical analysesDetection of spatial clusters and frequency of
occurrence. To identify high risk areas on which to
concentrate therapeutic and preventive efforts, we searched for
annual spatial clusters, defined as groups of MM cases occurring
during the same epidemiological year and situated closer together
in space than would be expected from the variation in population
density and chance fluctuations. Two cluster detection methods
were used to uncover spatial clustering of MM incidence at the
HCCA level in Niger for each epidemiological year between 2003
and 2009. An epidemiological year n was defined as running from
July 1 of the year n21 to June 30 of the year n. The first method
was the Anselin’s Local Moran’s I test [4,16], implemented in the
ArcGIS software (version 9.3, ESRI Inc. Redlands, CA), which
provided a measure of the spatial autocorrelation for a given
HCCA with its neighbours. Spatial clusters of MM cases were
identified by mapping the significant high-high HCCAs (i.e. high
incidence rate HCCA surrounded by high incidence rate HCCAs)
and high-low HCCAs (i.e. high incidence rate HCCA surrounded
by low incidence rate HCCAs). The second method was the
Kulldorff’s spatial scan statistic [4,17] implemented in the
SaTScan software (version 8.0, Kulldorff and Information
Management Services, Inc.), which used a circular moving
window to identify single HCCAs or groups of HCCAs of
significantly high risk. To determine beforehand the optimal scale
for cluster detection by both methods, i.e. the distance where
spatial effects were maximized [5], the Global Moran’s I test was
used in ArcGIS and correlograms of I against different threshold
distances were plotted in R (version 2.9.1, R Development Core
Team, R Foundation for Statistical Computing, Vienna, Austria).
More details regarding the cluster detection methods can be found
in Supporting information (Text S1).
The frequency of spatial cluster occurrence was calculated for
each HCCA and each health district, respectively defined as the
number of years during which the HCCA contributed to a cluster,
and as the number of years during which the district contained at
least one HCCA contributing to a cluster. The frequencies were
calculated taking into account either (i) clusters detected by one of
the two methods (weaker evidence of clustering) or (ii) clusters
detected by both methods (stronger evidence of clustering).
Detection of spatio-temporal clusters. To analyse the
emergence and diffusion patterns of MM cases within each
epidemic season, we then searched for spatio-temporal clusters,
groups of MM cases situated close together in space and time. The
Kulldorff’s space-time scan [18] implemented in SaTScan was
performed to identify spatio-temporal clusters of maximum one-
week duration. More details regarding the method can be found in
Supporting information (Text S1).
Ecological correlation. To investigate if the highlighted
spatio-temporal patterns could be related to host density and
movement, correlations of MM incidence at the HCCA level with
human density and distance to primary road were explored using
Pearson correlation coefficient.
Timeliness of epidemic detection. Finally, to evaluate the
potential gain in timeliness of epidemic detection at the HCCA
level compared to the district-level surveillance, we applied to our
HCCA-level data the two thresholds currently used for detection
of outbreaks [3]. The alert threshold was defined as 5 cases per
100,000 inhabitants per week for population .30,000 inhabitants
or 2 cases in one week for population ,30,000 inhabitants. The
epidemic threshold was defined as 10 cases per 100,000
inhabitants for population .30,000 inhabitants (under
appropriate conditions [3], otherwise 15 per 100,000) or 5 cases
in one week for population ,30,000 inhabitants. If there was an
epidemic in a neighbouring area, the alert threshold became the
epidemic threshold.
Results
Description of the dataFrom July 1, 2002 to June 30, 2009, a total of 15 801 CSF
specimens from meningitis suspected cases were analysed at the
CERMES laboratory (table 1). 112 CSF (0.7%) could not be tested
(depleted, broken tubes…) and 79 (0.5%) did not give conclusive
results because of contamination. Overall, biological specimens
originated from 416 (61%) of the 682 HCCAs mapped in 2009.
Among these CSF, 6556 (41.5%) were confirmed as bacterial
meningitis cases, 82.2% of which were positive for Neisseria
meningitidis. Serogroup A was the predominant serogroup every
year, except in 2006. The mean (SD) age of the MM cases was 9.6
(7.5) years and 58.8% were male. Over the study period, MM
cases were detected in 349 HCCAs (51.2%) in all regions of Niger
(figure 1), with contrasting incidence rates within districts. The
highest incidence rates were found in HCCAs of Niamey,
Tillabery, Dosso, Tahoua, Maradi and Zinder regions. As for
the temporal distribution, 82.5% of the MM cases occurred from
February to April.
Detection of spatial clusters and frequency of occurrenceFigure 2 depicts for each year the Kulldorff’s spatial scan
statistic results overlain on the Anselin’s Local Moran’s I results.
Over the seven years, the Local Moran’s I method identified 140
high-risk HCCAs (130 high-high and 10 high-low), with an annual
number ranging from 11 (in 2003 and 2007) to 31 (in 2008 and
2009). The spatial scan method identified 58 significant spatial
clusters altogether, with an annual number ranging from 3 (in
2003) to 16 (in 2009). The median number of HCCAs per cluster
was 2 (IQ range = 1–5) and the median annual incidence rate of
the clusters was 34.9 (IQ range= 20.5–72.3) cases per 100,000.
Almost 80% of the high-risk HCCAs identified with the Local
Moran’s I were included in clusters detected by SaTScan and 62%
of the SaTScan clusters encompassed high-high or high-low HCCAs.
Spatial clusters generally occurred in different HCCAs from
year to year over the study period, as shown by the low frequencies
observed at the HCCA level (figure 3). Among the HCCAs
contributing to a cluster at least once over the study period, the
median frequency was 1 (range= 1–4) for clusters detected by at
least one method, and 1 (range = 1–3) for clusters detected by both
methods. Only four HCCAs were detected three or more times by
at least one method and two or more times by both methods. They
were: Chare Zamna (in Zinder urban community), Gazaoua,
Doumega and Loudou.
Spatial clusters most frequently occurred within nine districts
out of 42, containing three or more times a cluster detected by at
least one method, and two or more times a cluster detected by
both methods. These districts were: Tera and Say (bordering
Burkina Faso), Keita, Zinder and five districts bordering Nigeria,
Spatio-Temporal Clustering of Meningitis in Niger
www.plosntds.org 3 March 2012 | Volume 6 | Issue 3 | e1577

Doutchi, Madaoua, Guidan Roumji, Madarounfa and Aguie. The
median time interval between two clusters occurring in the same
district was one year. When a district contained a cluster detected
by at least one method, only 13.3% (median) of its HCCAs
contributed to that cluster, and 9.7% when a district contained a
cluster detected by both methods.
Detection of spatio-temporal clustersNo systematic spatio-temporal pattern for cluster emergence and
epidemic spread was observed within the seven years of the study
period. Figure 4 shows the 66 significant spatio-temporal clusters
detected with the SaTScan space-time scan (except a 2009 northeast
cluster in Dirkou, Bilma district, which is outside the displayed zone)
and the incidence rate observed for each HCCA of a spatio-
temporal cluster during the time period associated to that cluster.
They essentially occurred between February and April, with an
additional few at the beginning (November–January) and the end
(May) of the epidemics. In 2003, the epidemic could be summarized
in two western and eastern poles, with the western pole occurring
before the eastern one. In 2004, the first cluster was detected in the
west; then all clusters appeared in the east, ending with the
northernmost one in Tanout district. In 2005, clusters were detected
only in the eastern part. In 2006, two spatio-temporal poles were
clearly distinguished, first in the east and then in the west. In 2007,
the first three clusters were detected in the west, followed by one in
the east, still another one in the west and a final northernmost one in
Keita district. In 2008, between the eastern clusters at the beginning
and the end of the epidemic season, other clusters essentially
appeared in the centre (Tahoua region) and the west (Tillabery and
Dosso regions) without a clear order, concluding again the
northernmost cluster in Keita district. In 2009, from the first cluster
in the east to the final one in the west, clusters appeared in all
regions in between, but followed no clear geographical direction.
Correlation with population density and roadsNo significant correlation was found between MM incidence at
the HCCA level and human density (r = 0.02) or distance to
primary roads (r =20.07).
Timeliness of epidemic detectionBetween 2003 and 2009, 88 districts crossed the alert threshold.
For 42 (47.7%) of them, the alert threshold was crossed earlier (4
weeks early in median) in at least one HCCA of these districts.
Between 2003 and 2009, 46 districts crossed the epidemic
threshold. For 15 (32.6%) of them, the epidemic threshold was
crossed earlier (3 weeks early in median) in at least one HCCA of
these districts.
Discussion
To our knowledge, this is the first study using health centre
catchment areas as spatial units for the spatio-temporal analysis of
MM over a whole sub-Saharan country. The study’s first finding was
the more frequent detection of spatial clusters within nine southern
districts, mainly on the southern border with Nigeria. Second, clusters
most often encompassed only a few HCCAs within a district, without
expanding to the entire district. In addition, no consistent annual
spatio-temporal pattern for cluster emergence and epidemic spread
could be observed, thus precluding the capacity to predict where the
next epidemic would break out, and what geographical direction it
would follow. These findings rely on laboratory-based data and have
important public health implications as discussed hereafter.
The first asset of this study was the quality of the microbiological
data. We used laboratory-confirmed N. meningitidis cases data,
coming from a surveillance system managed by CERMES and
DSSRE throughout the country. Most other spatio-temporal
studies on meningitis epidemics in sub-Saharan Africa [6–12,19]
are based instead on suspected cases reported in the framework of
the national surveillance systems. In our dataset, none of the three
typical bacterial aetiologies (N. meningitidis, S. pneumoniae and H.
influenzae) could be identified in almost 60% of the CSF analysed
by CERMES over the study period (see Table 1). Relying only on
suspected cases would therefore introduce a large number of
misclassified cases. However, our system may suffer from
underreporting from areas where performing a lumbar puncture
and shipping the samples to CERMES may represent logistical
difficulties. Further analyses (not shown here) have documented
that indeed the districts the most remote from CERMES (in Maradi
Table 1. Results of microbiological analyses of cerebrospinal fluid (CSF) samples by epidemiological year.
Year 2003 2004 2005 2006 2007 2008 2009 Total
Collected CSF 2073 1324 1273 3135 1150 2819 4027 15801
Meningitis positive CSF in number of cases (% of the collected CSF)
Positive CSF 945 (45.6) 487(36.8) 370 (29.1) 1336 (42.6) 329 (28.6) 1218 (43.2) 1872 (46.5) 6557 (41.5)
Bacteria in number of cases (% of the positive results)
N.meningitidis 793 (83.9) 333 (68.4) 166 (44.9) 1143 (85.6) 137 (41.6) 1060 (87.0) 1756 (93.8) 5388 (82.2)
S.pneumoniae 103 (10.9) 123 (25.2) 165 (44.6) 131 (9.8) 128 (38.9) 116 (9.5) 96 (5.1) 862 (13.1)
H.influenzae 49 (5.2) 31 (6.4) 39 (10.5) 62 (4.6) 64 (19.5) 42 (3.5) 18 (1.0) 305 (4.7)
Others 0 (0.0) 0 (0.0) 0 (0.0) 0 (0.0) 0 (0.0) 0 (0.0) 2 (0.1) 2 (,0.1)
Serogroups of N. _eningitides in number of cases (% of the meningococci)
A 715 (90.1) 280 (84.1) 92 (55.4) 539 (47.2) 119 (86.9) 993 (93.7) 1705 (97.1) 4443 (82.5)
X 3 (0.4) 12 (3.6) 41 (24.7) 559 (48.9) 11 (8.0) 5 (0.5) 10 (0.6) 641 (11.9)
W135 64 (8.1) 31 (9.3) 19 (11.5) 24 (2.1) 5 (3.6) 0 (0.0) 10 (0.6) 153 (2.8)
C 0 (0.0) 1 (0.3) 0 (0.0) 0 (0.0) 0 (0.0) 0 (0.0) 0 (0.0) 1 (,0.1)
Y 4 (0.5) 2 (0.6) 0 (0.0) 1 (0.1) 0 (0.0) 0 (0.0) 1 (,0.1) 8 (0.1)
Undetermined 7 (0.9) 7 (2.1) 14 (8.4) 20 (1.7) 2 (1.5) 62 (5.8) 30 (1.7) 142 (2.6)
doi:10.1371/journal.pntd.0001577.t001
Spatio-Temporal Clustering of Meningitis in Niger
www.plosntds.org 4 March 2012 | Volume 6 | Issue 3 | e1577

Spatio-Temporal Clustering of Meningitis in Niger
www.plosntds.org 5 March 2012 | Volume 6 | Issue 3 | e1577

Figure 1. Cumulative incidence rates of meningitis in Niger from July 2002 to June 2009. A: Incidence of laboratory-confirmed cases ofmeningococcal meningitis (MM) at the health centre catchment area level. B: Incidence of suspected cases of meningitis reported to the DSSRE at thedistrict level.doi:10.1371/journal.pntd.0001577.g001
Figure 2. Annual spatial clusters of meningococcal meningitis cases identified in Niger from 2003 to 2009. Each panel shows theresults of both methods, the Anselin’s Local Moran’s I test and the Kulldorff’s spatial scan statistic, for a single epidemiological year.doi:10.1371/journal.pntd.0001577.g002
Spatio-Temporal Clustering of Meningitis in Niger
www.plosntds.org 6 March 2012 | Volume 6 | Issue 3 | e1577

and Zinder regions) were sending less CSF specimens than the closer
ones, for a similar number of suspected cases notified to DSSRE.
However, the proportion of negative cases among the received CSF
specimens was fairly similar among the healthcare centres (outside
the capital Niamey). This suggested that the decision to take or not a
CSF sample from a patient based on clinical criteria had no
significant spatial variability. Moreover, our cluster analyses enabled
us to detect the importance of remote regions in the epidemic
dynamics according to the recurrent clusters identified there. Like in
many other settings, the surveillance systemmay not cover the entire
population of Niger affected by meningitis. However, we can
reasonably assume that most meningitis cases, because of their
severity, end up reaching the healthcare centres, with or without
prior self-treatment or consultation of a tradi-practitioner.Moreover,
free healthcare offered to all people suffering from meningitis in
Niger probably reduces social and spatial disparities in care-seeking
behaviours. Thus, for all the reasons above, we are confident that the
surveillance system is representative enough and that underreporting
did not substantially affect the validity of our results, which are more
likely to reflect the dynamism peculiar to meningitis than the spatial
disparities in the surveillance system efficiency. Incidence estimates
were based on the 2001 census and constant population growth rates
were applied. We could not take into account possible variations of
population growth rate over time and space, due to the difficulty in
quantifying population migrations.
The second asset of this study was the use of HCCAs as spatial
units for the spatio-temporal analysis of MM. They represent a
more accurate spatial unit of analysis than the district level on
which reactive vaccination strategies and spatio-temporal studies
are usually based [3,6,7,19]. Analysing data at the HCCA level has
greater relevance for understanding the epidemic dynamics, for
making decisions in response to starting epidemics and for
assessing control strategies.
Indeed, this study has shown that clusters most often included only
a few HCCAs within a district. This finding, previously suggested by
[20], is important for understanding meningitis epidemics and
should encourage surveillance at the health centre level. Clusters
occurred in different HCCAs within the same districts in consecutive
years, demonstrating strong intra-district heterogeneity and year-to-
year variability of the affected HCCAs. This could result from
outbreaks limited to HCCAs without exceeding the threshold at the
district level: the district is not vaccinated and may be affected by a
large outbreak the following year. Besides, waiting for the threshold
to be reached at the district level to initiate reactive vaccination may
incur unnecessary delays: we showed that a decision based on
threshold estimated at the health centre level might lead to earlier
detection of outbreaks, so more reactive and possibly more cost-
effective vaccination strategies. Thus, adding HCCA-level surveil-
lance to the current district-level surveillance would improve the
timeliness of epidemic detection.
With the introduction of a new meningococcal A conjugate
vaccine (MenAfriVacTM) in the meningitis belt over the next few
years, the use of the health centre catchment areas as spatial units
can also help to monitor more accurately the vaccine supply at a
finer spatial scale, saving doses that could be given inadequately,
and to evaluate its impact and protective efficacy in the population
Figure 3. Frequency of cluster occurrence in Niger from 2003 to 2009. A, B: Frequencies of occurrence of spatial clusters detected by one ofthe two methods (Anselin’s Local Moran’s I test or Kulldorff’s spatial scan statistic). C, D: Frequencies of occurrence of spatial clusters detected byboth methods.doi:10.1371/journal.pntd.0001577.g003
Spatio-Temporal Clustering of Meningitis in Niger
www.plosntds.org 7 March 2012 | Volume 6 | Issue 3 | e1577
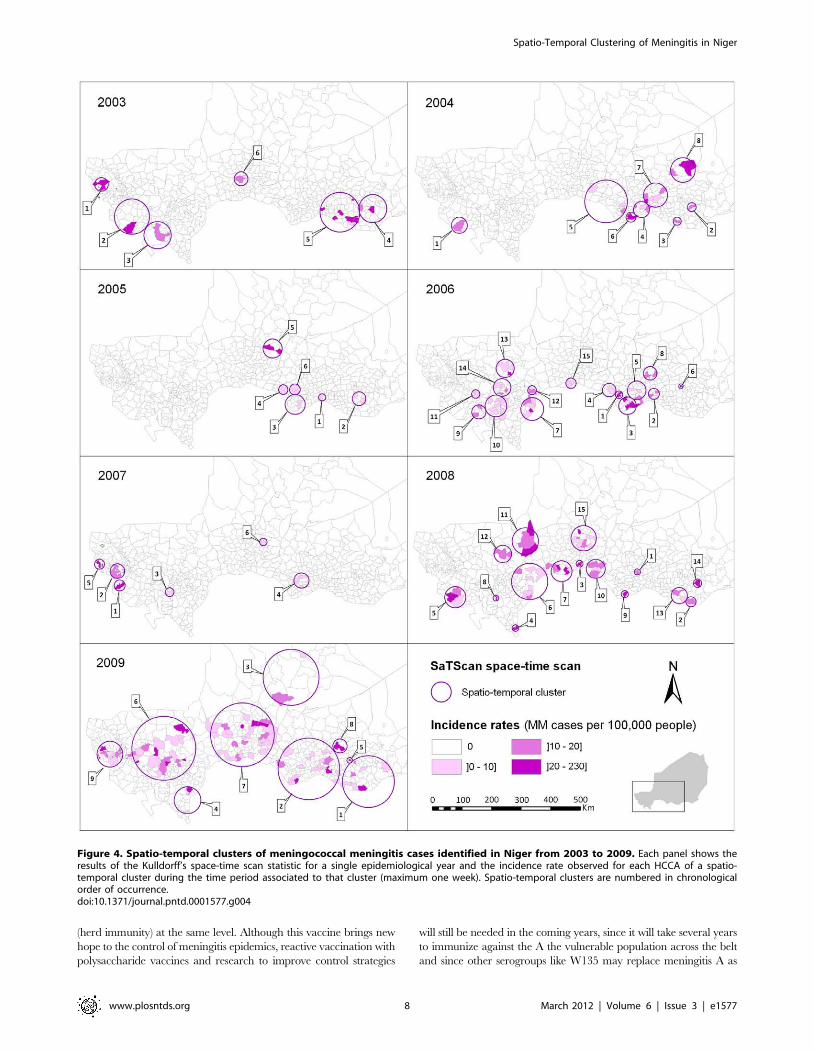
(herd immunity) at the same level. Although this vaccine brings new
hope to the control of meningitis epidemics, reactive vaccination with
polysaccharide vaccines and research to improve control strategies
will still be needed in the coming years, since it will take several years
to immunize against the A the vulnerable population across the belt
and since other serogroups like W135 may replace meningitis A as
Figure 4. Spatio-temporal clusters of meningococcal meningitis cases identified in Niger from 2003 to 2009. Each panel shows theresults of the Kulldorff’s space-time scan statistic for a single epidemiological year and the incidence rate observed for each HCCA of a spatio-temporal cluster during the time period associated to that cluster (maximum one week). Spatio-temporal clusters are numbered in chronologicalorder of occurrence.doi:10.1371/journal.pntd.0001577.g004
Spatio-Temporal Clustering of Meningitis in Niger
www.plosntds.org 8 March 2012 | Volume 6 | Issue 3 | e1577

the dominant serogroup [21]. New decision criteria will have to be
found for reactive vaccination. With the additional use of a finer
spatial scale like the HCCAs, an interesting strategy would be real-
time cluster detection, with prospective space-time scan statistic [22]
or other existing methods [23].
In the context of a resource-limited country, this study can also
assist public health authorities in their decision-making regarding
resource allocation. The spatial clusters detected in our study were
located in different HCCAs from year to year, but nine of the 42
districts were more recurrently affected by clustering of MM cases.
Thus, these findings provide approaches to better adjust allocation
of resources, including a ready supply of antibiotics and rapid
diagnostic tests [24,25], as well as additional health care personnel.
In order to reduce the reaction time of the vaccination, one may
consider allocating vaccines to these districts’ hospitals prior to the
meningitis season, provided the cold chain can be maintained.
Given cost and organizational constraints, further cost-effective-
ness and feasibility analyses are needed to evaluate this strategy,
before any policy recommendation.
Clusters were more often found in nine districts, including five
bordering Nigeria within a 500 km distance between Doutchi and
Aguie, most likely because of intense mobility of border
populations [26]. However, no consistent annual spatio-temporal
pattern could be found over the study period; hence, no spread in
a systematic geographical direction from a fixed source could be
identified. This is contrary to a study carried out in Mali, which
highlighted a potential south-north spread, with Bamako and
Mopti as probable sources [12]. Instead, our results suggest the
emergence of scattered sources, likely from a pool of carriers when
conditions are favorable to the occurrence of the invasive disease.
Favorable conditions may include climatic conditions occurring
during the dry season (low absolute humidity and dust-laden
Harmattan wind), which would damage the nasopharyngeal
mucous membrane and increase the risk of bloodstream invasion
by a colonizing meningococcus [27]. In this study, we observed
that the latest spatio-temporal clusters during the epidemic season
were often the northernmost ones, which could be correlated with
the northward advance of the Intertropical Front preceding the
arrival of rains from the south, thus raising relative humidity.
However, climatic factors do not entirely explain these spatio-
temporal epidemic patterns. As suggested by Mueller’s hypothet-
ical explanatory model [20], their role may be limited to the
hyperendemic increase during the dry season, while transition
from a hyperendemic state to highly localized epidemics may be
due to increased transmission, possibly caused by viral respiratory
co-infections. Moreover, in equivalent climatic conditions, an area
in which the proportion of susceptible individuals is higher due to
waning immunity (acquired by infection or vaccination) would be
more prone to outbreaks [28]. Recently, Irving et al [29] suggested
that population immunity may be a key factor in causing the
unusual epidemiology of meningitis in the Belt. Although density
and distance to primary roads were not individually correlated
with MM incidence at the HCCA level, other socio-demographic
factors (poverty, overcrowded housing, migrations, markets…)
may also have an influence on local transmission of the bacteria
and carriage and contribute to the risk of micro-epidemics of co-
infections [20]. Of note, one spatio-temporal cluster of four adult
cases was detected in February 2009 in Bilma district (see figure 1),
in the oasis town of Dirkou, located on an important south-north
route of trans-Saharan trade and transit migration. Meningococcal
strain variations most likely play a role in the occurrence of
epidemic waves [20,30,31]. In this study, the spatio-temporal
distribution of all N. meningitidis cases was analysed irrespective of
the serogroups. A subsequent analysis will differentiate serogroups
of meningococci as their spatio-temporal patterns may significant-
ly vary [32,33]. Further etiologic studies are needed to explore
causality of the spatio-temporal patterns highlighted in this paper.
Finally, our findings provide an evidence-based approach to
reflect on public health policies and indicate a promising strategy
to improve prevention and control of meningitis in sub-Saharan
Africa. They can serve as an example for other meningitis belt
countries, illustrating what finer scale surveillance and spatial
analyses can offer for prevention and control of meningitis.
Research efforts should now focus on investigating the role of dust,
socio-demographic factors, co-infections and vaccination strategies
on cluster occurrence at the HCCA level, and on developing an
operational decision support tool to respond better to meningitis
outbreaks with the introduction of the new conjugate vaccine.
Supporting Information
Text S1 Supporting information on Global Moran’s I,
Anselin’s Local Moran’s I and Kulldorff’s spatial scan
statistics.
(DOC)
Checklist S1 STROBE checklist.
(DOC)
Acknowledgments
The authors are indebted to all the doctors and health staff who have sent
CSF specimens and epidemiological forms to CERMES, and also to
DSSRE staff. We thank the CERMES technical staff who analysed the
CSF, Noemie Phulpin for health map creation and database management,
and Oumarou Alto for his contribution to the health map. We also thank
Arnaud Fontanet for helpful comments and suggestions on the manuscript
and Tamara Giles-Vernick for English editing.
Author Contributions
Conceived and designed the experiments: JP J-MC J-FJ. Performed the
experiments: JP FG J-MC HBM J-FJ. Analyzed the data: JP FG J-MC
HBM J-FJ. Wrote the paper: JP J-MC J-FJ.
References
1. Lapeyssonnie L (1963) La meningite cerebrospinale en Afrique. Bull WorldHealth Organ 28 Suppl: 1–114.
2. World Health Organization (1998) Control of epidemic meningococcal disease.WHO Practical Guidelines. 2nd ed. Geneva: World Health Organization.WHO/EMC/BAC/98.3.
3. World Health Organization (2000) Detecting meningococcal meningitisepidemics in highly-endemic African countries. Wkly Epidemiol Rec 75:306–309.
4. Sugumaran R, Larson SR, DeGroote JP (2009) Spatio-temporal cluster analysisof county-based human West Nile virus incidence in the continental UnitedStates. Int J Health Geogr 8.
5. Moore DA, Carpenter TE (1999) Spatial analytical methods and geographicinformation systems: use in health research and epidemiology. Epidemiol Rev21: 143–161.
6. Thomson MC, Molesworth AM, Djingarey MH, Yameogo KR, Belanger F,et al. (2006) Potential of environmental models to predict meningitis epidemicsin Africa. Trop Med Int Health 11: 781–788.
7. Molesworth AM, Cuevas LE, Connor SJ, Morse AP, Thomson MC (2003)Environmental risk and meningitis epidemics in Africa. Emerging Infect Dis 9:1287–1293.
8. Yaka P, Sultan B, Broutin H, Janicot S, Philippon S, et al. (2008) Relationshipsbetween climate and year-to-year variability in meningitis outbreaks: a casestudy in Burkina Faso and Niger. Int J Health Geogr 7: 34.
9. Broutin H, Philippon S, Constantin de Magny G, Courel M-F, Sultan B, et al.(2007) Comparative study of meningitis dynamics across nine African countries:a global perspective. Int J Health Geogr 6: 29.
10. Sultan B, Labadi K, Guegan J-F, Janicot S (2005) Climate drives the meningitisepidemics onset in west Africa. PLoS Med 2: e6.
Spatio-Temporal Clustering of Meningitis in Niger
www.plosntds.org 9 March 2012 | Volume 6 | Issue 3 | e1577

11. Jackou-Boulama M, Michel R, Ollivier L, Meynard JB, Nicolas P, et al. (2005)Correlation entre la pluviometrie et la meningite a meningocoque au Niger.Med Trop 65: 329–333.
12. Philippon S, Broutin H, Constantin de Magny G, Toure K, Diakite CH, et al.(2009) Meningococcal meningitis in Mali: a long-term study of persistence andspread. Int J Infect Dis 13: 103–109.
13. Sidikou F, Djibo S, Taha MK, Alonso JM, Djibo A, et al. (2003) Polymerasechain reaction assay and bacterial meningitis surveillance in remote areas, Niger.Emerg Infect Dis 9: 1486–1488.
14. Chanteau S, Sidikou F, Djibo S, Moussa A, Mindadou H, et al. (2006) Scalingup of PCR-based surveillance of bacterial meningitis in the African meningitisbelt: indisputable benefits of multiplex PCR assay in Niger. Trans R Soc TropMed Hyg 100: 677–680.
15. World Health Organization (1999) Laboratory methods for the diagnosis ofmeningitis caused by Neisseria meningitidis, Streptococcus pneumoniae, andHaemophilus influenzae. Geneva: World Health Organization. WHO/CDS/CSR/EDC/99.7.
16. Anselin L (1995) Local indicators of spatial association. Geographical analysis27: 93–115.
17. Kulldorff M (1997) A spatial scan statistic. Commun Statist – Theory Meth 26:1481–1496.
18. Kulldorff M, Athas WF, Feurer EJ, Miller BA, Key CR (1998) Evaluating clusteralarms: a space-time scan statistic and brain cancer in Los Alamos, New Mexico.Am J Public Health 88: 1377–1380.
19. Cuevas LE, Savory EC, Hart CA, Thomson MC, Yassin MA (2007) Effect ofreactive vaccination on meningitis epidemics in Southern Ethiopia. J Infect 55:425–430.
20. Mueller JE, Gessner BD (2010) A hypothetical explanatory model formeningococcal meningitis in the African meningitis belt. Int J Infect Dis 14:e553–e559.
21. The Lancet Infectious Diseases (2011) A vaccine against meningitis in Africa.Lancet Infect Dis 11: 1.
22. Kulldorff M (2001) Prospective time periodic geographical disease surveillanceusing a scan statistic. J R Stat Soc Ser A Stat Soc 164: 61–72.
23. Watkins R, Eagleson S, Hall R, Dailey L, Plant A (2006) Approaches to theevaluation of outbreak detection methods. BMC Public Health 6: 263.
24. Chanteau S, Dartevelle S, Mahamane AE, Djibo S, Boisier P, et al. (2006) Newrapid diagnostic tests for Neisseria meningitidis serogroups A, W135, C, and Y.PLoS Med 3: e337.
25. Hamidou AA, Djibo S, Mamane AE, Moussa A, Chanteau S (2008)Serogrouping of non-interpretable Neisseria meningitidis carriage strains, usingrapid diagnostic tests. Trans R Soc Trop Med Hyg 102: 99–100.
26. Maınassara HB, Molinari N, Dematteı C, Fabbro-Peray P (2010) The relativerisk of spatial cluster occurrence and spatio-temporal evolution of meningococcaldisease in Niger. Geospat Health 5: 93–101.
27. Greenwood B (1999) Manson Lecture. Meningococcal meningitis in Africa.Trans R Soc Trop Med Hyg 93: 341–353.
28. Pascual M, Dobson A (2005) Seasonal patterns of infectious diseases. PLoS Med2.
29. Irving TJ, Blyuss KB, Colijn C, Trotter CL (2011) Modelling meningococcalmeningitis in the African meningitis belt. Epidemiol Infect. pp 1–9.
30. Taha M-K, Deghmane A-E, Antignac A, Zarantonelli ML, Larribe M, et al.(2002) The duality of virulence and transmissibility in Neisseria meningitidis.Trends Microbiol 10: 376–382.
31. Leimkugel J, Hodgson A, Forgor AA, Pfluger V, Dangy J-P, et al. (2007) Clonalwaves of Neisseria colonisation and disease in the African meningitis belt: eight-year longitudinal study in northern Ghana. PLoS Med 4: e101.
32. Boisier P, Djibo S, Sidikou F, Mindadou H, Kairo KK, et al. (2005)Epidemiological patterns of meningococcal meningitis in Niger in 2003 and2004: under the threat of N. meningitidis serogroup W135. Trop Med IntHealth 10: 435–443.
33. Boisier P, Nicolas P, Djibo S, Taha M, Jeanne I, et al. (2007) MeningococcalMeningitis: Unprecedented Incidence of Serogroup X–Related Cases in 2006 inNiger. Clin Infect Dis 44: 657–663.
Spatio-Temporal Clustering of Meningitis in Niger
www.plosntds.org 10 March 2012 | Volume 6 | Issue 3 | e1577

8.2 Article II : Paireau J et al. Spatio-Temporal Factors Associated
with Meningococcal Meningitis Annual Incidence at the Health Centre
Level in Niger, 2004-2010. PLoS Neglected Tropical Diseases 2014
149

Spatio-Temporal Factors Associated with MeningococcalMeningitis Annual Incidence at the Health Centre Levelin Niger, 2004–2010
Juliette Paireau1,2*, Halima B. Maınassara3., Jean-Francois Jusot3., Jean-Marc Collard4, Issa Idi3, Jean-
Paul Moulia-Pelat3, Judith E. Mueller1,5, Arnaud Fontanet1,6
1Unite d’Epidemiologie des Maladies Emergentes, Institut Pasteur, Paris, France, 2Univ. Pierre et Marie Curie, Cellule Pasteur UPMC, Paris, France, 3Unite
d’Epidemiologie/Sante-Environnement-Climat, Centre de Recherche Medicale et Sanitaire (CERMES)/Reseau International des Instituts Pasteur, Niamey, Niger, 4Unite de
Biologie, Centre de Recherche Medicale et Sanitaire (CERMES)/Reseau International des Instituts Pasteur, Niamey, Niger, 5 EHESP French School of Public Health, Sorbonne
Paris Cite, Rennes, France, 6Conservatoire National des Arts et Metiers, Chaire Sante et Developpement, Paris, France
Abstract
Background: Epidemics of meningococcal meningitis (MM) recurrently strike the African Meningitis Belt. This study aimed atinvestigating factors, still poorly understood, that influence annual incidence of MM serogroup A, the main etiologic agentover 2004–2010, at a fine spatial scale in Niger.
Methodology/Principal Findings: To take into account data dependencies over space and time and control for unobservedconfounding factors, we developed an explanatory Bayesian hierarchical model over 2004–2010 at the health centrecatchment area (HCCA) level. The multivariate model revealed that both climatic and non-climatic factors were importantfor explaining spatio-temporal variations in incidence: mean relative humidity during November–June over the study region(posterior mean Incidence Rate Ratio (IRR) = 0.656, 95% Credible Interval (CI) 0.405–0.949) and occurrence of early rains inMarch in a HCCA (IRR = 0.353, 95% CI 0.239–0.502) were protective factors; a higher risk was associated with the percentageof neighbouring HCCAs having at least one MM A case during the same year (IRR = 2.365, 95% CI 2.078–2.695), the presenceof a road crossing the HCCA (IRR = 1.743, 95% CI 1.173–2.474) and the occurrence of cases before 31 December in a HCCA(IRR = 6.801, 95% CI 4.004–10.910). At the study region level, higher annual incidence correlated with greater geographicspread and, to a lesser extent, with higher intensity of localized outbreaks.
Conclusions: Based on these findings, we hypothesize that spatio-temporal variability of MM A incidence between yearsand HCCAs result from variations in the intensity or duration of the dry season climatic effects on disease risk, and is furtherimpacted by factors of spatial contacts, representing facilitated pathogen transmission. Additional unexplained factors maycontribute to the observed incidence patterns and should be further investigated.
Citation: Paireau J, Maınassara HB, Jusot J-F, Collard J-M, Idi I, et al. (2014) Spatio-Temporal Factors Associated with Meningococcal Meningitis Annual Incidenceat the Health Centre Level in Niger, 2004–2010. PLoS Negl Trop Dis 8(5): e2899. doi:10.1371/journal.pntd.0002899
Editor: Guilherme S. Ribeiro, Institute of Collective Health, Federal University of Bahia, Brazil
Received December 23, 2013; Accepted April 13, 2014; Published May 22, 2014
Copyright: � 2014 Paireau et al. This is an open-access article distributed under the terms of the Creative Commons Attribution License, which permitsunrestricted use, distribution, and reproduction in any medium, provided the original author and source are credited.
Funding: This work was financially supported by Universite Pierre et Marie Curie (JP, PhD scholarship), Office of International Cooperation of the Principality ofMonaco, French Ministry of Foreign Affairs, Sanofi Pasteur, World Health Organization, Institut Pasteur and Belgian Technical Cooperation. The funders had no rolein study design, data collection and analysis, decision to publish, or preparation of the manuscript.
Competing Interests: The authors have declared that no competing interests exist.
* E-mail: [email protected]
. These authors contributed equally to this work.
Introduction
Meningococcal meningitis (MM) is caused by Neisseria meningitidis
(Nm), a commensal bacterium of the human nasopharynx
transmitted by direct contact with respiratory droplets from
carriers and causing meningitis after crossing the nasopharyngeal
mucosa. Epidemics of meningococcal meningitis recurrently strike
countries of the African Meningitis Belt [1]. In this sub-Saharan
area, MM dynamics is characterized by seasonality and spatio-
temporal heterogeneity: the disease is endemic all year round but
every dry season, a hyper-endemic or epidemic increase in
incidence is observed, the magnitude of which varies between
years and regions [2,3]. Within a country, localized outbreaks are
reported at sub-district scales [4–6]. Most epidemics have been
caused by meningococci of serogroup A but C, W or X outbreaks
have also been reported [7–9]. Niger, a landlocked country of the
Belt, reported between 1000 and 13500 suspected meningitis cases
annually during 2004–2010, with case-fatality rates of 4–12%
[10]. Over the study period (2004–2010), the surveillance-based
control strategy applied in Niger was to launch reactive
vaccination campaigns with A/C or A/C/W polysaccharide
vaccines once an outbreak has exceeded a threshold defined at the
district level by the World Health Organization (WHO) [11].
More than 100 years after the first major epidemic reported in
the Belt, the reasons for the peculiar epidemiology of MM in
Africa are still poorly understood [12]. A combination of
PLOS Neglected Tropical Diseases | www.plosntds.org 1 May 2014 | Volume 8 | Issue 5 | e2899

concomitant factors is probably necessary to trigger an epidemic in
a particular place at a particular time, involving the organism (e.g.
strain virulence and transmissibility [13]), the host (e.g. immune
status and susceptibility [14,15]) and the environment (e.g. dry
climate and dusty winds [16]).
Previous statistical ecologic studies aiming at explaining the
spatio-temporal dynamics of MM epidemics in the Belt were
mainly focused on climatic risk factors. These studies sought for
drivers of either the seasonality of epidemics (i.e. when the onset/
peak/end of the meningitis season occur) or their intensity (i.e.
magnitude of incidence over a chosen time period) at different
spatial scales. According to most authors, the temporal dynamics
of sub-Saharan climate is the major driver of MM seasonality in
the Belt [2,3,17–19]. The suspected contribution of climatic
factors to the intensity of epidemics is still under debate. At the
country level, Yaka et al partly related annual incidence in Niger
to the northern component of wind during November to
December [20]. At the district level, annual incidence in four
African countries was correlated to rainfall amount and dust load
in the pre-, post- and epidemic season [21] and monthly incidence
in one district of Ghana was modelled by a combination of various
climatic and non-climatic variables [22].
However, to our best knowledge, none of the published
statistical models tried to explain intensity of meningitis
outbreaks at a finer spatial scale than the district, whereas
recent studies in Niger and Burkina Faso demonstrated that
outbreaks occur at sub-district scales in highly localized clusters
[4–6]. Besides, whereas two neighbouring areas (sharing similar
climatic conditions) can have different epidemic behaviours
[4,6], few models combined climatic factors with other types of
risk factors suspected to interact, such as previous epidemics,
vaccination campaigns, population density or proximity to
infected regions.
The objective of our paper was therefore to study the influence
of climatic and non-climatic factors on the spatio-temporal
variations of annual incidence of MM serogroup A, the main
etiologic agent over the study period, at the health centre
catchment area (HCCA) scale in Niger, using a database of
laboratory-confirmed cases and developing an explanatory Bayes-
ian hierarchical model from 2004 to 2010 at the HCCA-year level.
Methods
Ethics statementThis study was approved by the Clinical Research Committee
of Institut Pasteur and authorized by the National Consultative
Ethics Committee of Niger and the two French data protection
competent authorities: CCTIRS (Comite Consultatif sur le
Traitement de l’Information en matiere de Recherche dans le
domaine de la Sante) and CNIL (Commission Nationale de
l’Informatique et des Libertes). The data collected involving
patients were anonymized.
Cartographic dataSpatial analyses were based on the National Health Map of
Niger, created by the Centre de Recherche Medicale et Sanitaire
(CERMES) in 2008, at the level of the HCCAs, areas which
include all villages served by the same integrated health centre. We
used the 2010 updated version of this National Health Map of 732
HCCAs, in the WGS84 geodetic system with UTM 32N
projection. On average, a HCCA covers a 40640 km2 area.
Study regionThe study region comprised the 669 HCCAs of the southern
most populated part of Niger, located roughly to the south of the
16th parallel (Figure 1). It represents 96% of the national
population of 17 138 707 inhabitants (2012 national census).
The semi-arid tropical climate of this Sahelian region is
characterized by a long dry season from October to May and a
rainy season from June to September. In the North lies the Sahara
desert, with less than one inhabitant per km2.
Meningitis dataThe CERMES is the national reference laboratory in charge of
the microbiological surveillance of bacterial meningitis in Niger.
Basically, cerebrospinal fluid (CSF) samples taken from suspected
cases of meningitis by health care workers are routinely collected
throughout Niger and the etiological diagnosis is carried out by
Figure 1. Spatial distribution of meningococcal meningitis A inNiger from July 2003 to June 2010. Cumulative incidence rates ineach health centre catchment area (cases per 100000 inhabitants).doi:10.1371/journal.pntd.0002899.g001
Author Summary
Meningococcal meningitis (MM) is a severe infection of themeninges caused by a bacterium transmitted throughrespiratory droplets. During January–May, epidemics ofMM recurrently strike sub-Saharan countries, includingNiger. Understanding why epidemics occur in a particularplace at a particular time would help public healthauthorities to develop more efficient prevention strategies.To date, factors that govern the occurrence of localizedoutbreaks are still poorly understood and epidemicsremain unpredictable. In this retrospective study (2004–2010), we developed a statistical model in order toinvestigate the influence of various factors (climatic,demographic, epidemiologic, etc.) on the annual incidenceof MM serogroup A at a fine spatial scale (the health centrecatchment area) in Niger. We found that mean relativehumidity and occurrence of early rains were protectiveclimatic factors and that a higher risk was associated withthe presence of a road, the percentage of neighbouringareas having cases and the occurrence of early casesbefore January. These findings contribute to improve ourunderstanding of MM epidemics in Africa and theassociated factors, and might be used in the future forthe subsequent development of an early warning system.
Spatio-Temporal Factors of Meningococcal Meningitis in Niger
PLOS Neglected Tropical Diseases | www.plosntds.org 2 May 2014 | Volume 8 | Issue 5 | e2899

Polymerase Chain Reaction (PCR) for all CSF. This enhanced
surveillance system is active in the whole country since 2002, and
has been described in detail elsewhere [4]. We used the CERMES
database for a retrospective study on confirmed MM A cases
between 1 July 2003 and 30 June 2010. We aggregated MM A
cases by HCCA and epidemiological year, defined as running
from 1 July of the year n–1 to 30 June of the year n, in order to
cover an entire meningitis season.
Vaccination dataHealth districts were contacted to obtain data on polysaccharide
vaccines (number of delivered vaccine doses and/or vaccine
coverage) at the HCCA level over the study period and the
previous two years. Full vaccination records could be collected
only for Tahoua region over 2002–2010. Missing data in records
from other regions did not enable us to use them in our analyses.
We thus studied the effect of previous vaccination campaigns
conducted in Tahoua region during the years n-1 and n-2 on MM
incidence of year n. We considered different forms for the
vaccination covariate: either the coverage rate (as a continuous or
categorized variable), the vaccination status (vaccinated: yes/no),
or the exceedance of several coverage thresholds (above threshold:
yes/no). The cumulative effect of successive vaccination cam-
paigns could not be studied as only one HCCA was vaccinated two
years in a row.
Demographic dataThe Institut National de la Statistique (INS) provided the
number of inhabitants per village according to the 2001 national
census. We aggregated the villages’ populations at the HCCA level
and applied a mean annual population growth rate of 3.3%
(provided by the INS). We computed the population density
covariate as the number of inhabitants per HCCA divided by the
HCCA surface area calculated in ArcGIS software (version 10.0,
ESRI Inc. Redlands, CA).
Road networkWe retrieved a shapefile of primary roads from the Health-
Mapper application of the WHO. This shapefile was superim-
posed to the National Health Map in ArcGIS. For each HCCA,
we computed its minimum distance to the closest primary road
and expressed it as a binary covariate (road versus no road) or a
categorical covariate (classes of distance).
Landcover dataThe landcover classification for Niger was obtained at a 1 km2
resolution, from the Land Cover Map of Africa from the Global
Land Cover 2000 Project [23]. The main vegetation types
represented in our geographical subset were different classes of
shrublands, grasslands and croplands.
Climate and aerosol dataGridded climate data from 2003 to 2010 were extracted from
ERA-Interim reanalysis, produced by the European Centre for
Medium-Range Weather Forecasts (ECMWF) [24]. We retrieved
relative humidity, temperature, total precipitation, U (west-east)
and V (south-north) wind components at a 0.75u spatial resolution
at a daily time-step. To characterize the wind-blown mineral dust
emission from the Sahara, we used the Absorbing Aerosol Index
(AAI), a dimensionless quantity which indicates the presence of
ultraviolet-absorbing aerosols in the Earth’s atmosphere [25]. The
AAI used in this study is derived from the reflectances measured
by SCIAMACHY (Scanning Imaging Absorption Spectrometer
for Atmospheric Chartography) satellite instrument in the
ultraviolet wavelength range [26]. We retrieved monthly gridded
data (1.00u61.25u latitude-longitude grid) from 2003 to 2010
(www.temis.nl/airpollution/absaai/). As we were interested in
how the climate of a given year or season can influence the annual
epidemic magnitude, we calculated multi-monthly means of each
climatic variable, averaged over periods relevant to the meningitis
season or the seasonal cycles of each climatic variable, both for
each HCCA and for the whole study region (see Figure S1 and
Text S1 for further details).
Altitude dataShuttle Radar Topography Mission (SRTM) elevation data
were obtained from the processed CGIAR-CSI (Consortium for
Spatial Information) SRTM 90 m Digital Elevation Dataset
version 4.1 [27], available as 5u65u tiles at a 3 arc second
resolution (approximately 90 m). Six tiles were downloaded and
combined in ArcGIS to cover the whole study region.
Database preparationFinally, we collated these multi-source and multi-format spatio-
temporal datasets and reconciled data at the HCCA level (i.e.
cartographic, epidemiological, vaccination and demographic data)
and gridded data (i.e. landcover, climate, AAI and altitude data)
by averaging the gridded values over each HCCA using the
statistical computing software R (version 2.15.3, R Core Team, R
Foundation for Statistical Computing, Vienna, Austria). Then, in
addition to the covariates described above, we created supple-
mentary variables to include in the statistical analyses. To take into
account potential interactions with bordering countries, we
calculated in ArcGIS the minimum distance of each HCCA to
the closest border and expressed it as a binary variable (border
versus no border) or a categorical variable (classes of distance and
classes of bordering countries). The five bordering countries of our
geographical subset are shown in Figure 1. To account for
potential geographic disparities in accessibility to health centres,
we computed for each HCCA the mean distance (weighted by the
villages’ population) from villages to their health centre. To
represent the tendency of meningitis to occur in spatio-temporal
clusters of neighbouring infected HCCAs, we computed ‘‘neigh-
bourhood’’ variables, using various definitions for this spatio-
temporal interaction (presence/total number of MM A cases in
neighbours, mean/maximum incidence and number/percentage
of neighbours with MM A cases, over an epidemiological year).
Neighbours were defined as adjacent HCCAs (first order
neighbours), since a previous analysis showed that the median
size of spatial clusters was of two neighbouring HCCAs [4]. We
also computed «historical» variables describing what happened the
previous year in terms of presence/number of MM A cases and
incidence, in each HCCA, in its neighbours and in its district
(upper administrative level) as potential proxies for natural
immunity. We computed similar variables for other Nm serogroups
at the HCCA level in order to explore potential interactions
between serogroups. Finally, we included in the analyses the
presence of early cases in each HCCA, defined as cases occurring
before 31 December following [20], as an early start of the hyper-
endemic increase could indicate a higher epidemic risk.
Statistical analysisFirst, for descriptive purposes, we explored whether the annual
epidemic magnitude in the study region could be related to the
annual and early geographical distribution of MM A cases and
localized outbreaks, using Pearson correlation coefficient. We
defined localized outbreaks as HCCAs exceeding an annual
Spatio-Temporal Factors of Meningococcal Meningitis in Niger
PLOS Neglected Tropical Diseases | www.plosntds.org 3 May 2014 | Volume 8 | Issue 5 | e2899

incidence threshold of 20/100000, corresponding to the 95th
percentile of incidence, following the primary reference used in
[6].
Then, to investigate the spatio-temporal association of MM A
annual incidence at the HCCA level with climatic and non-
climatic factors, we developed a retrospective hierarchical model
in Niger for 2004–2010, over two geographical subsets: (i) over the
whole study region of 669 HCCAs and (ii) over a subset of 95
HCCAs (located in Tahoua region) for which vaccination data
were fully available.
The modelling approach we adopted was a Bayesian negative
binomial generalized linear mixed model (GLMM). We assumed
that the number of observed MM A cases in each HCCA i and
year t followed a negative binomial distribution with an unknown
scale parameter k and mean mit. We modelled log(mit) as a function
of covariates as described above and appropriate random effects.
Basically, we included spatial random effects at the HCCA level,
separated into a spatially unstructured component to capture the
influence of unknown factors that are independent across areas
and a spatially structured component to capture the influence of
spatially correlated effects. The temporal structure was modelled
by yearly random intercepts. We included the expected number of
cases in each HCCA i and year t as an offset in the model to
estimate the incidence rate ratios (IRRs) associated with a unit
increase in exposure, by exponentiating the regression coefficients.
A preliminary forward stepwise covariate selection was
performed in R software, estimating parameters by maximum
likelihood. The Bayesian multivariate model was subsequently
developed in WinBUGS [28], using Markov chain Monte Carlo
(MCMC) simulation methods. Further details on the modelling
approach are given in Text S2.
Results
Description of the dataIn Niger, from 1 July 2003 to 30 June 2010, 5512 cases of Nm
were biologically confirmed. Other aetiologies included Streptococcus
pneumoniae (N= 850) and Haemophilus influenzae (N= 277). Serogroup
A accounted for 72.4% (N=3988) of Nm cases and was largely
predominant every year, except during 2006 and 2010 when
serogroups X and W represented 48.9% and 71.6% of Nm cases,
respectively. The median age of Nm A cases was 8.3 years
(interquartile range (IQR) 5–13). Among all Nm A cases, 97.0%
originated from our study region and 28.0% from our Tahoua
subset (Figure 1). Nm A cases essentially occurred over a six-month
period: 98.1% of them were observed between December andMay,
with a peak during February–April (80.4%). MM A temporal
evolution during July 2003–June 2010 (Figure 2) was characterized
by considerable between-year variations (17-fold increase between
the lowest annual incidence of 0.7 per 100000 in 2005 and the
highest annual incidence of 11.3 per 100000 in 2009).
Among the seven years of the study period, the annual MM A
incidence across the whole study region was correlated to the
number of HCCAs having at least one MM A case (r=0.95, p,
0.01), to the number of localized outbreaks (r=0.99, p,0.01), to
the maximum annual incidence of the localized outbreaks
(r=0.80, p=0.03), to the number of HCCAs with at least one
early case (r=0.96, p,0.01) and to the early incidence across the
study region (r=0.93, p,0.01). The corresponding graphs are
displayed in Figure S2. The median duration of the localized
outbreaks (time between first and last cases) was 45 days (IQR 24–
75).
Bayesian multivariate model over the study regionIn the Bayesian multivariate model over the whole study region,
the overdispersion parameter of the negative binomial (k21) had a
posterior mean value of 2.586 (95% CI= 2.223–2.998) (Table 1).
This was significantly different from zero, which confirmed that
the negative binomial formulation was necessary to account for
extra-Poisson variation in the dataset.
Regarding fixed effects, five covariates were significantly
associated with MM A incidence (the 95% CI of their associated
IRR did not contain 1). A reduced risk was associated with higher
average relative humidity during the meningitis season (Novem-
ber–June) over the study region (posterior mean IRR=0.656,
95% CI 0.405–0.949). Early rains in March in an HCCA
represented a protective spatio-temporal factor (IRR=0.353, 95%
CI 0.239–0.502). The analyses identified three non-climatic
factors; a positive association was found between disease incidence
and percentage of neighbouring HCCAs having at least one MM
A case during the same epidemiological year (IRR=2.365, 95%
CI 2.078–2.695), as well as presence of a road crossing the HCCA
(IRR=1.743, 95% CI 1.173–2.474) and occurrence of early cases
before 31 December in a HCCA (IRR=6.801, 95% CI 4.004–
10.910).
The variances of the spatially structured and unstructured
random effects were respectively 0.174 (95% CI 0.010–0.488) and
2.579 (95% CI 1.974–3.294) (Table 1). The posterior mean
estimate of the spatial fraction was 0.062 (95% CI 0.004–0.166),
meaning that most of the residual area-specific variability was
spatially unstructured. Spatial correlation was almost totally
captured by the multivariate model. The year-specific random
effects also significantly contributed to the model (Table 1) and the
inclusion of covariates helped to decrease the temporal random
effects variance compared to the null model.
A scatter plot of the 4683 fitted posterior mean MM A cases
versus the observed MM A cases shows the overall goodness of fit
of the model (Figure 3.A). The inter-annual variations of incidence
at the study region level were correctly captured by the model
(Figure 3.B).
Figure 2. Temporal distribution of meningococcal meningitis(MM) A in Niger from July 2003 to June 2010. Time series of dailycases smoothed by cubic spline.doi:10.1371/journal.pntd.0002899.g002
Spatio-Temporal Factors of Meningococcal Meningitis in Niger
PLOS Neglected Tropical Diseases | www.plosntds.org 4 May 2014 | Volume 8 | Issue 5 | e2899

Bayesian multivariate model over Tahoua subsetIn Tahoua subset during 2002–2010, mass campaigns of A/C
or A/C/W polysaccharide vaccination have been conducted in 53
HCCAs-years out of 665; the median reported vaccination
coverage was 80.0% (IQR 53.5–89.2%).
The final multivariate model over Tahoua subset yielded similar
results as the model over the whole study region (see Table S1).
The same covariates were independently associated to disease
incidence, except that early rains were no longer significant over
this smaller geographical subset. No vaccination covariates were
significant.
Discussion
To our knowledge, this study is the first spatio-temporal
statistical model in the African Meningitis Belt developed at a
spatial scale as fine as the health centre catchment areas and using
laboratory confirmed cases of meningococcal meningitis. Relying
Table 1. Results from the Bayesian hierarchical model of meningococcal meningitis (MM) A annual incidence at the health centrecatchment area (HCCA) level over the study region, Niger 2004–2010.
Null Model Multivariate model
Parameters Posterior mean 95% CI* Posterior mean 95% CI*
Fixed effects (IRR{)
Early cases (yes vs. no) 6.801 (4.004,10.910)
Neighbouring HCCAs with MM A cases` (%) 2.365 (2.078,2.695)
Road (yes vs. no) 1.743 (1.173,2.474)
Early rains (yes vs. no) 0.353 (0.239,0.502)
Mean seasonal humidity` (%) 0.656 (0.405,0.949)
Random effects
Spatial structured hyperparameter (su2) 1.470 (0.799,2.295) 0.174 (0.010,0.488)
Spatial unstructured hyperparameter (sv2) 1.965 (1.278,2.761) 2.579 (1.974,3.294)
Temporal hyperparameter (sQ2) 1.755 (0.539,5.154) 0.303 (0.073,0.978)
Overdispersion parameter (k21) 4.009 (3.485,4.601) 2.586 (2.223,2.998)
Posterior mean parameter estimates and their 95% credible intervals (CIs) for the ‘‘null’’ model (no covariates included) and the multivariate model.* CI: Bayesian credible interval.{IRR: Incidence rate ratio.`Standardized variables.doi:10.1371/journal.pntd.0002899.t001
Figure 3. Multivariate model goodness of fit. (A) Scatter plot of the fitted posterior mean numbers of meningococcal meningitis A cases peryear and health centre catchment area and their 95% credible intervals (CIs) (light-blue shaded region) versus the observed numbers. (B) Observedincidence rates (horizontal blue lines) per year over the study region and their corresponding fitted posterior mean annual incidence rates (filled dark-blue circles) and their 95%CIs (vertical dark-blue lines).doi:10.1371/journal.pntd.0002899.g003
Spatio-Temporal Factors of Meningococcal Meningitis in Niger
PLOS Neglected Tropical Diseases | www.plosntds.org 5 May 2014 | Volume 8 | Issue 5 | e2899

on advanced statistical methods, we demonstrated that both
climatic and non-climatic factors (occurrence of early rains, mean
relative humidity, occurrence of early cases, presence of roads and
spatial neighbourhood interactions) are important for explaining
spatio-temporal variations in MM A annual incidence at the
HCCA level.
Appropriate statistical methods are necessary to investigate the
underlying drivers of observed patterns of count data in small
areas with spatio-temporal correlations. Hierarchical regression
models of the Bayesian family have proven useful to analyse the
spatio-temporal dynamics of infectious diseases in different
settings, such as dengue in Brazil [29], soil-transmitted helminth
infections in Kenya [30] or schistosomiasis in China [31]. The
Bayesian formulation allows to acknowledge the uncertainty
associated with all model (hyper)parameters (fixed and random),
to include a spatial correlation structure within a prior distribution
[32] and leads to more robust estimates in particular when the
geographical level is small and the disease rare [33]. Such models
are still rarely applied to MM in Africa. The modelling approach
we adopted was a negative binomial GLMM using Bayesian
estimation, to control for unobserved confounding factors and take
into account the dependencies over space and time encountered in
our dataset, incorporating year-specific and area-specific random
effects [32,34]. Ignoring these multiple correlations could lead to
overestimate the significance of the covariates [31]. This model
also accounted for extra-Poisson variation (overdispersion) in the
count data via the negative binomial formulation, allowing the
variance to be larger than the mean.
Another noteworthy feature of our analysis lies in its spatio-
temporal resolution, uncommon for a country of the Belt. Since
outbreaks have been shown to occur in spatially localized clusters
at a sub-district level [4–6], we considered primordial to analyse
MM A dynamics at a finer spatial scale than the more usual
country or district levels [17–21,35,36]. From a public health
perspective, the health centre catchment area used in this study is
also a judicious choice. Indeed, the Nigerien health care system is
based on these integrated health centres, which constitute the
lowest health level (sub-district) and whose locations are chosen
according to accessibility for populations. Regarding the time
scale, to comply with our objective of explaining the overall annual
burden of MM A in an area during each meningitis season, we
chose to conduct analyses at the year level. We did not seek in this
paper to model the seasonality of meningitis, which would have
implied working at least at month (like in [22]) or week (like in
[17,18]) level. Our approach did not allow explaining intra-
seasonal temporal dynamics and diffusion patterns – which were
partly described in a previous paper [4]. This would constitute a
distinct research question that the one tackled in this paper and
should be further investigated.
The results of this study bring new insights into the epidemi-
ology of MM in the Belt and the risk factors that play a role in the
spatio-temporal variations of incidence. First, we observed that, at
the study region level, higher annual incidence correlated with
larger number of HCCAs having at least one MM A case, with
larger number of localized outbreaks and, to a lesser extent, with
higher intensity of these localized outbreaks. This brings support to
Mueller and Gessner hypothesis that the magnitude of incidence
during meningitis seasons in a region or country can increase if the
geographical expansion and/or the intensity of localized epidemics
increase [3]. The epidemiology thus changes from a regular year
with a small number of localized epidemics in the region to an
epidemic wave with many localized epidemics. We then sought to
evaluate factors that could be associated with the occurrence of
these localized incidence increases in a particular area during a
particular year. Based on the factors that emerged from our model
and that we discuss below, we hypothesize that spatio-temporal
variations in MM A incidence between years and HCCAs result
from variations in the intensity or duration of the dry season
climatic effects on disease risk, and is further impacted by factors of
spatial contacts, representing facilitated pathogen transmission.
First, the presence of primary roads and neighbourhood effects
in the multivariate model indicates that human contacts and
movements are important contributing factors that we assume to
likely play a role in the transmission of the meningococcus, and/or
an epidemic co-factor (e.g. respiratory virus [3]). HCCAs crossed
by a road would be statistically more prone to re-infections from
distant areas than isolated HCCAs outside the primary road
network, and would experience higher transmission levels due to
higher intensity of human movements and contacts. Yet, we
cannot exclude that differences in accessibility to health centres
contributed to bring out primary roads as a risk factor. One could
also argue that health centres served by a road sent more CSF
samples due to easier logistics. However, another study conducted
in Niger and based on reported suspected cases (not affected by a
potential logistic bias) also showed fewer absences and higher
reappearance rates of meningitis cases in districts along primary
roads [36]. The percentage of neighbours with cases, representing
local spatio-temporal interactions, is not a surprising risk factor.
Indeed, a previous study [4] showed that cases usually tended
to be clustered in space and that these clusters most often
encompassed a small number of HCCAs. Areas with more
infected neighbours would be more likely to be infected by local
spatial transmission.
Then, the presence of climatic parameters in the multivariate
model indicates that, beyond an influence on MM seasonality
agreed by several authors [2,3,17–19], climate can have a
quantitative impact on inter-annual variations of incidence. The
main physiopathological hypothesis for the role of climate is that
dryness and dusty winds would damage the nasopharyngeal
mucosa and increase the risk of bloodstream invasion by a
colonizing meningococcus, and thus the case-to-carrier ratio [2].
Here, we found that annual incidence was negatively correlated to
mean seasonal humidity over the study region. This factor was
purely temporal (equal IRR for all spatial units within the same
year), suggesting that humidity did not have spatial, but only
temporal effect. At the study region level, the seasons of highest
MM A incidence were also the seasons of lowest mean humidity.
The between-year variations in humidity were not large but the
results suggest that even a small decrease in humidity, resulting in
a small increase in the case-to-carrier ratio according to the
physiopathological hypothesis, can have a significant impact on
the global MM A risk in all HCCAs, as these dryer conditions start
in October and persist over several months (cumulative effect) and
over a large geographical region. Similarly, Yaka et al detected a
quantitative effect of climate on inter-annual variations of
meningitis at the country level but November and December
northerly winds were their best predictors [20]. This difference
might be explained by the fact that they only considered the
climatic conditions over the early dry season and not over the
whole meningitis season. Interestingly, a second climatic factor,
the occurrence of early rains in March, has a significant effect at
the HCCA level. It has been noticed that the meningitis season
seemed to stop at the onset of the rainy season, again explained by
a decrease in invasiveness possibly due to less irritating conditions
for the pharyngeal mucosa [2]. Our results are in agreement with
this observation and, more precisely, show that the local
occurrence of first rains in March, i.e. before the real beginning
of the rainy season in the country, is a protective factor. The rains
Spatio-Temporal Factors of Meningococcal Meningitis in Niger
PLOS Neglected Tropical Diseases | www.plosntds.org 6 May 2014 | Volume 8 | Issue 5 | e2899

would thus stop the harmful effect of dryness and prevent local
outbreaks to further develop.
The last and particularly strong factor that emerged from our
model is the presence of early cases in a HCCA (before 31
December). It can be interpreted as a risk factor in itself (an
outbreak would have more time to develop if it starts earlier), as an
indicator of longer exposure to irritating climatic conditions of the
dry season, or as a proxy of other factors responsible for the
presence of the bacteria and higher levels of carriage and/or
invasion. In any case, this parameter remains a strong determinant
of high incidence in a HCCA. At the study region level, we also
showed that the annual MM A incidence was correlated to the
number of HCCAs with at least one early case and to the overall
early incidence. Two other studies stressed the importance of early
cases in the final size of the epidemic: an early onset was a good
predictor of an epidemic at the district level in [37] and the
number of cases during the peak months increased with the
number of early cases occurring between October and December
at the country level (Niger) in [20]. WHO also considers early
cases in the season as a warning sign of large epidemic [11].
Surprisingly, vaccination the previous or the two previous
year(s) was not found to be a protective factor in Tahoua subset.
However, we cannot rule out the possibility that the low number of
vaccinated HCCAs-years in our subset (8%) may have induced a
lack of power to show a true protective effect of vaccination. This
result could also be partially due to the decline of polysaccharide
vaccine efficacy to 87% and 70% at one and two years after
vaccination, respectively [38]. It is also possible that the provided
data lack representativeness and over-estimate the real coverage.
Of note, we decided not to study the impact of year n vaccination
on year n incidence within this model formulation, as reactive
vaccination would be associated with larger outbreaks (those which
required vaccination) and, considering delays in implementing
vaccination campaigns, would artificially appear as a risk factor in
the model [39,40].
Residual spatio-temporal variations that remained unexplained
by the covariates included in our model suggest that other
unknown or unmeasured factors contributed to the observed
incidence. First, because our study concerned an ecologic
investigation, suspected factors at the individual level (e.g. age,
immuno-depression, smoking…) could not be accounted for.
Then, the temporal variations at the country level could be
suspected to be influenced by higher susceptibility due to waning
pre-existing immunity [15] or emergence of a new variant that can
escape herd immunity [13,41]. However, the length of the study
period did not enable us to study these effects: molecular
characterization of Nm A isolates showed that the same sequence
type (ST-7) was predominantly circulating in Niger during 2004–
2010 [42,43]. At the spatial level, the residual purely spatial
variation observed in our model was mainly unstructured. The
covariates better explained the spatial correlation, which both
reflects shared environmental conditions and true epidemic
diffusion, than the unstructured spatial variations. This suggests
that other factors specific to each HCCA, such as quality of local
health services or local behavioural practices, could contribute to
explain the between-area heterogeneity in MM A incidence. The
difficulty to measure such factors made the inclusion of area-level
random effects necessary. Finally, other unexplained factors, such
as respiratory viral co-infections, might contribute to the residual
spatio-temporal heterogeneity, via an effect on transmission,
colonization and/or invasion [3]. Although difficult to collect
retrospectively, these factors should be further investigated at the
health centre level and at least properly accounted for in any
modelling attempt. Mathematical models, still little developed on
this topic [44], could also help us to better understand the role of
carriage and immunity in the epidemic dynamics.
This study relied on a unique dataset which provided a very
precise picture of MM A spatio-temporal dynamics in Niger over
seven years, and has already been used in published spatio-
temporal analyses [4,5]. The cases were all biologically confirmed
by CERMES laboratory, which allowed us to exclude misclassified
infectious agents that give similar clinical signs of meningitis.
Databases commonly used by most statistical studies on MM in the
Belt (e.g. [17–21]) gather clinically-suspected cases of meningitis,
and thus include a mixture of different Nm serogroups and other
bacteria such as S. pneumoniae and H. influenzae. In Niger, over our
study period, 40% of positive CSFs were infected by another agent
that Nm A. Relying only on suspected cases would therefore
introduce a large number of misclassified cases. If etiological
confirmation by conventional PCR may have led to under-
estimation of positive cases [45], this should have affected the data
in a spatially and temporally consistent way, as biological testing
was performed with the same PCR assay by the same laboratory
all along the study period. Our system may also suffer from
underreporting from areas where performing a lumbar puncture
and shipping the samples may represent logistical difficulties. We
therefore excluded from the analyses the remote northern regions
where population is very sparse and mainly nomadic. We can also
consider that the potential variability in reporting rates has been
taken into account through the explicit inclusion of overdispersion
and spatial heterogeneity in our model. Besides, this surveillance
system was extended to the whole country in 2002 (it was only
effective in the capital city before) and might have been unsteady
during the first months following its implementation. To reduce
this potential temporal bias, we started our analyses in 2004, being
confident that the system had thus reached a stable state. Finally,
like in many other settings, the population affected by meningitis
may not be entirely covered by the surveillance system. However,
we can reasonably assume that most meningitis cases, because of
their severity, end up reaching the health centres, with or without
prior self-treatment or consultation of a tradi-practitioner [46].
Moreover, social and spatial disparities in care-seeking behaviours
are probably reduced by free healthcare offered to all people
suffering from meningitis in Niger. For all the reasons above, we
are thus confident that the surveillance system is representative
enough and that underreporting did not substantially affect the
validity of our results, which are more likely to reflect the true
underlying risk factors than the spatial disparities in the
surveillance system efficiency.
To conclude, this study brings new insights into the epidemi-
ology of meningitis in the Belt and allowed us to disentangle the
climatic and non-climatic risk factors that play a role in the spatio-
temporal variations of annual incidence at the health centre level.
Besides, in the light of our results, a potential predictive model
could rely on factors such as early cases in an area and its
neighbours and early climatic conditions, provided their predictive
value is evaluated. This could aid the development of an early
warning system at the beginning of the meningitis season,
following other recent attempts [47]. Despite new hope brought
by the introduction of a meningococcal A conjugate vaccine [48],
the ways in which the meningococcus will adapt to this changing
situation are unknown and other serogroups such as W and X
might replace A as the dominant serogroup. Such modelling could
thus be tested on these serogroups, which would likely be
influenced by most of the identified risk factors due to similar
ways of transmission and invasion, and applied in other sub-
Saharan countries sharing these peculiar epidemiological and
climatic features.
Spatio-Temporal Factors of Meningococcal Meningitis in Niger
PLOS Neglected Tropical Diseases | www.plosntds.org 7 May 2014 | Volume 8 | Issue 5 | e2899

Supporting Information
Figure S1 Seasonality of climate and aerosols. Annual
cycles of daily meteorological variables (temperature, relative
humidity, precipitation, U wind and V wind) and monthly
Absorbing Aerosol Index (AAI) averaged over the study region
between 2004 and 2010.
(TIF)
Figure S2 Epidemiological characteristics related to
annual incidence. Correlation between the annual meningo-
coccal meningitis (MM) A incidence in the study region and
epidemiological features of the MM A cases distribution (annual in
dark blue and early in light blue) in health centre catchment areas
(HCCAs) over the seven years of the study period.
(TIF)
Table S1 Tahoua model results. Results from the Bayesian
hierarchical model of meningococcal meningitis (MM) A annual
incidence at the health centre catchment area (HCCA) level over
Tahoua subset, Niger 2004–2010: Posterior mean parameter
estimates and their 95% credible intervals (CIs) for the ‘‘null’’
model (no covariates included) and the multivariate model.
(DOC)
Text S1 Explanations on the computation of climate
and aerosol covariates based on the seasonal cycles
shown in Figure S1.
(DOC)
Text S2 Model description.
(DOC)
Acknowledgments
We thank all the doctors and health staff who took part in the surveillance
system, the Nigerien Ministry of Health, the Direction of Surveillance and
Response to Epidemics (DSRE), the General Directors of CERMES, and
all the CERMES staff from the Biology and Epidemiology Units, with
many thanks to Noemie Phulpin, Oumarou Alto and Florian Girond for
health map and database development. We also thank the MERIT
community and in particular the MAMEMA group for helpful discussions.
Author Contributions
Conceived and designed the experiments: JP JFJ. Performed the
experiments: JP HBM JFJ JMC II JPMP. Analyzed the data: JP JEM.
Wrote the paper: JP JFJ JMC JEM AF.
References
1. Lapeyssonnie L (1963) La meningite cerebrospinale en Afrique. Bull WorldHealth Organ 28 Suppl: 1–114.
2. Greenwood B (1999) Manson Lecture. Meningococcal meningitis in Africa.Trans R Soc Trop Med Hyg 93: 341–353.
3. Mueller JE, Gessner BD (2010) A hypothetical explanatory model formeningococcal meningitis in the African meningitis belt. International Journalof Infectious Diseases 14: E553–E559. doi:10.1016/j.ijid.2009.08.013.
4. Paireau J, Girond F, Collard J-M, Maınassara HB, Jusot J-F (2012) Analysingspatio-temporal clustering of meningococcal meningitis outbreaks in Nigerreveals opportunities for improved disease control. PLoS Negl Trop Dis 6:e1577. doi:10.1371/journal.pntd.0001577.
5. Mainassara HB, Molinari N, Demattei C, Fabbro-Peray P (2010) The relativerisk of spatial cluster occurrence and spatio-temporal evolution of meningococcaldisease in Niger, 2002–2008. Geospatial Health 5: 93–101.
6. Tall H, Hugonnet S, Donnen P, Dramaix-Wilmet M, Kambou L, et al. (2012)Definition and characterization of localised meningitis epidemics in BurkinaFaso: a longitudinal retrospective study. Bmc Infectious Diseases 12.doi:10.1186/1471-2334-12-2.
7. Broome CV, Rugh MA, Yada AA, Giat L, Giat H, et al. (1983) Epidemic groupC meningococcal meningitis in Upper Volta, 1979. Bull World Health Organ61: 325–330.
8. Decosas J, Koama J-BT (2002) Chronicle of an outbreak foretold: meningococ-cal meningitis W135 in Burkina Faso. Lancet Infect Dis 2: 763–765.
9. Boisier P, Nicolas P, Djibo S, Taha M, Jeanne I, et al. (2007) MeningococcalMeningitis: Unprecedented Incidence of Serogroup X–Related Cases in 2006 inNiger. Clin Infect Dis 44: 657–663.
10. World Health Organization (n.d.) Global Health Observatory Data Repository.Available: http://apps.who.int/gho/data. Accessed 18 October 2013.
11. World Health Organization (2000) Detecting meningococcal meningitisepidemics in highly-endemic African countries. Wkly Epidemiol Rec 75: 306–309.
12. Greenwood B (2006) Editorial: 100 years of epidemic meningitis in West Africa -has anything changed? Trop Med Int Health 11: 773–780. doi:10.1111/j.1365-3156.2006.01639.x.
13. Taha M-K, Deghmane A-E, Antignac A, Zarantonelli ML, Larribe M, et al.(2002) The duality of virulence and transmissibility in Neisseria meningitidis.Trends in Microbiology 10: 376–382.
14. Tzeng YL, Stephens DS (2000) Epidemiology and pathogenesis of Neisseriameningitidis. Microbes and infection 2: 687–700.
15. Moore P (1992) Meningococcal Meningitis in Sub-Saharan Africa - a Model forthe Epidemic Process. Clinical Infectious Diseases 14: 515–525.
16. Palmgren H (2009) Meningococcal disease and climate. Global Health Action 2:10.3402/gha.v2i0.2061.
17. Agier L, Deroubaix A, Martiny N, Yaka P, Djibo A, et al. (2013) Seasonality ofmeningitis in Africa and climate forcing: aerosols stand out. Journal of the RoyalSociety Interface 10. doi:10.1098/rsif.2012.0814.
18. Sultan B, Labadi K, Guegan J-F, Janicot S (2005) Climate drives the meningitisepidemics onset in west Africa. PLoS Med 2: e6.
19. Martiny N, Chiapello I (2013) Assessments for the impact of mineral dust on themeningitis incidence in West Africa. Atmospheric Environment 70: 245–253.doi:10.1016/j.atmosenv.2013.01.016.
20. Yaka P, Sultan B, Broutin H, Janicot S, Philippon S, et al. (2008) Relationships
between climate and year-to-year variability in meningitis outbreaks: a case
study in Burkina Faso and Niger. Int J Health Geogr 7: 34.
21. Thomson MC, Molesworth AM, Djingarey MH, Yameogo KR, Belanger F, et
al. (2006) Potential of environmental models to predict meningitis epidemics in
Africa. Tropical Medicine & International Health 11: 781–788. doi:10.1111/
j.1365-3156.2006.01630.x.
22. Dukic V, Hayden M, Forgor AA, Hopson T, Akweongo P, et al. (2012) The
Role of Weather in Meningitis Outbreaks in Navrongo, Ghana: A Generalized
Additive Modeling Approach. Journal of Agricultural Biological and Environ-
mental Statistics 17: 442–460. doi:10.1007/s13253-012-0095-9.
23. Mayaux P, Bartholome E, Cabral A, Cherlet M, Defourny P, et al. (2003) The
Land Cover Map for Africa in the Year 2000. European Commision Joint
Research Centre. Available: http://bioval.jrc.ec.europa.eu/products/glc2000/
glc2000.php.
24. Dee DP, Uppala SM, Simmons AJ, Berrisford P, Poli P, et al. (2011) The ERA-
Interim reanalysis: configuration and performance of the data assimilation
system. Q J Roy Meteorol Soc 137: 553–597. doi:10.1002/qj.828.
25. Torres O, Bhartia PK, Herman JR, Ahmad Z, Gleason J (1998) Derivation of
aerosol properties from satellite measurements of backscattered ultraviolet
radiation: Theoretical basis. Journal of Geophysical Research: Atmospheres 103:
17099–17110. doi:10.1029/98JD00900.
26. Tilstra L, de Graaf M, Aben I, Stammes P (2012) In-flight degradation
correction of SCIAMACHY UV reflectances and Absorbing Aerosol Index.
J Geophys Res 117. doi:doi:10.1029/2011JD016957.
27. Jarvis A, Reuter HI, Nelson A, Guevara E (2008) Hole-filled seamless SRTM
data V4. International Centre for Tropical Agriculture (CIAT). Available:
http://srtm.csi.cgiar.org.
28. Lunn DJ, Thomas A, Best N, Spiegelhalter D (2000) WinBUGS - A Bayesian
modelling framework: Concepts, structure, and extensibility. Statistics and
Computing 10: 325–337. doi:10.1023/A:1008929526011.
29. Lowe R, Bailey TC, Stephenson DB, Jupp TE, Graham RJ, et al. (2013) The
development of an early warning system for climate-sensitive disease risk with a
focus on dengue epidemics in Southeast Brazil. Stat Med 32: 864–883.
doi:10.1002/sim.5549.
30. Pullan RL, Gething PW, Smith JL, Mwandawiro CS, Sturrock HJW, et al.
(2011) Spatial modelling of soil-transmitted helminth infections in Kenya: a
disease control planning tool. PLoS Negl Trop Dis 5: e958. doi:10.1371/
journal.pntd.0000958.
31. Wang X-H, Zhou X-N, Vounatsou P, Chen Z, Utzinger J, et al. (2008) Bayesian
spatio-temporal modeling of Schistosoma japonicum prevalence data in the
absence of a diagnostic ‘‘gold’’ standard. PLoS Negl Trop Dis 2: e250.
doi:10.1371/journal.pntd.0000250.
32. Lawson AB (2006) Statistical Methods in Spatial Epidemiology. Second edition.
John Wiley & Sons.
33. Elliott P, Wakefield JC, Best NG, Briggs DJ (2000) Spatial epidemiology:
methods and applications. Spatial epidemiology. New-York: Oxford University
Press. pp. 3–14.
34. Fong Y, Rue H, Wakefield J (2010) Bayesian inference for generalized linear
mixed models. Biostatistics 11: 397–412. doi:10.1093/biostatistics/kxp053.
Spatio-Temporal Factors of Meningococcal Meningitis in Niger
PLOS Neglected Tropical Diseases | www.plosntds.org 8 May 2014 | Volume 8 | Issue 5 | e2899

35. Molesworth AM, Cuevas LE, Connor SJ, Morse AP, Thomson MC (2003)
Environmental risk and meningitis epidemics in Africa. Emerging Infectious
Diseases 9: 1287–1293.
36. Bharti N, Broutin H, Grais RF, Ferrari MJ, Djibo A, et al. (2012) Spatial
dynamics of meningococcal meningitis in Niger: observed patterns in
comparison with measles. Epidemiology and Infection 140: 1356–1365.
doi:10.1017/S0950268811002032.
37. Agier L, Broutin H, Bertherat E, Djingarey MH, Lingani C, et al. (2013) Timely
detection of bacterial meningitis epidemics at district level: a study in three
countries of the African Meningitis Belt. Transactions of The Royal Society of
Tropical Medicine and Hygiene 107: 30–36.
38. Reingold A (1985) Age-specific differences in duration of clinical protection after
vaccination with meningococcal polysaccharide A vaccine. The Lancet 326:
114–118. doi:10.1016/S0140-6736(85)90224-7.
39. Woods CW, Armstrong G, Sackey SO, Tetteh C, Bugri S, et al. (2000)
Emergency vaccination against epidemic meningitis in Ghana: implications for
the control of meningococcal disease in West Africa. Lancet 355: 30–33.
doi:10.1016/S0140-6736(99)03366-8.
40. Cuevas LE, Savory EC, Hart CA, Thomson MC, Yassin MA (2007) Effect of
reactive vaccination on meningitis epidemics in Southern Ethiopia. Journal of
Infection 55: 425–430.
41. Leimkugel J, Hodgson A, Forgor AA, Pfluger V, Dangy J-P, et al. (2007) Clonal
waves of Neisseria colonisation and disease in the African meningitis belt: eight-
year longitudinal study in northern Ghana. PLoS Med 4: e101.
42. Collard J-M, Issaka B, Zaneidou M, Hugonnet S, Nicolas P, et al. (2013)Epidemiological changes in meningococcal meningitis in Niger from 2008 to2011 and the impact of vaccination. BMC Infectious Diseases 13: 576.doi:10.1186/1471-2334-13-576.
43. Caugant DA, Kristiansen PA, Wang X, Mayer LW, Taha M-K, et al. (2012)Molecular characterization of invasive meningococcal isolates from countries inthe African meningitis belt before introduction of a serogroup A conjugatevaccine. PLoS ONE 7: e46019. doi:10.1371/journal.pone.0046019.
44. Irving TJ, Blyuss KB, Colijn C, Trotter CL (2012) Modelling meningococcalmeningitis in the African meningitis belt. Epidemiology and Infection 140: 897–905. doi:10.1017/S0950268811001385.
45. Collard J-M, Wang X, Mahamane AE, Idi I, Issaka B, et al. (2013) A five-yearfield assessment of rapid diagnostic tests for meningococcal meningitis in Nigerby using the combination of conventional and real-time PCR assays as a goldstandard. Trans R Soc Trop Med Hyg 108: trt104. doi:10.1093/trstmh/trt104.
46. Hayden MH, Dalaba M, Awine T, Akweongo P, Nyaaba G, et al. (2013)Knowledge, Attitudes, and Practices Related to Meningitis in Northern Ghana.Am J Trop Med Hyg 89: 265–270. doi:10.4269/ajtmh.12-0515.
47. Agier L, Stanton M, Soga G, Diggle PJ (2012) A multi-state spatio-temporalMarkov model for categorized incidence of meningitis in sub-Saharan Africa.Epidemiology and Infection 1: 1–8.
48. Caini S, Beck NS, Yacouba H, Maiga I, Chaibou I, et al. (2013) From Agadez toZinder: estimating coverage of the MenAfriVacTM conjugate vaccine againstmeningococcal serogroup A in Niger, September 2010–January 2012. Vaccine31: 1597–1603. doi:10.1016/j.vaccine.2013.01.015.
Spatio-Temporal Factors of Meningococcal Meningitis in Niger
PLOS Neglected Tropical Diseases | www.plosntds.org 9 May 2014 | Volume 8 | Issue 5 | e2899

8.3 Article hors sujet de thèse : Paireau J et al. Litchi-associated acute
encephalitis in children, Northern Vietnam, 2004-2009. Emerging
Infectious Diseases 2012
Cette dernière annexe présente un article réalisé pendant la thèse sur l’analyse
spatio-temporelle d’épidémies d’encéphalites aiguës au Vietnam et l’influence des facteurs
environnementaux. Il nous semblait intéressant de le faire figurer dans ce document.
150

Since the end of the 1990s, unexplained outbreaks
of acute encephalitis in children coinciding with litchi
harvesting (May–July) have been documented in the
Bac Giang Province in northern Vietnam. A retrospective
ecologic analysis of data for 2004–2009 involving
environmental, agronomic, and climatic factors was
conducted to investigate the suspected association
between the outbreaks and litchi harvesting. The clinical,
biological, and immunologic characteristics of the patients
suggested a viral etiology. The ecologic study revealed an
independent association between litchi plantation surface
proportion and acute encephalitis incidence: Incidence
rate ratios were 1.52 (95% CI 0.90–2.57), 2.94 (95% CI
1.88–4.60), and 2.76 (95% CI 1.76–4.32) for second, third,
and fourth quartiles, respectively, compared with the lowest
quartile. This ecologic study confi rmed the suspected
association between incidence of acute encephalitis and
litchi plantations and should be followed by other studies to
identify the causative agent for this syndrome.
Acute encephalitis syndrome (AES) is a major public health problem in Asia. The main etiologic agent is the
Japanese encephalitis virus (JEV), a positive-sense single-
stranded fl avivirus transmitted by Culex spp. mosquitoes. It is responsible for ≈50,000 encephalitis cases every year in the region (1). Recently, the Nipah and Chandipura viruses were identifi ed as responsible for acute encephalitis outbreaks in Malaysia and India (2,3). In addition, many other viral encephalitis cases of unknown etiology exist throughout Asia (4).
In Vietnam, according to the National Institute of Hygiene and Epidemiology (NIHE), the annual incidence rate for AES in the general population was 2.24–2.90 cases per 100 000 inhabitants during 1998–2005. This rate corresponds with 1,800–2,300 cases per year, two thirds of which occurred in northern Vietnam. Since the inclusion in 1997 of the JEV vaccine into the Extended Program on Immunization by the World Health Organization (WHO), the relative proportion of non-JE cases has increased substantially among patients hospitalized with AES in Vietnam, from ≈40% in 1996 to ≈90% in 2009 (P.T. Nga, unpub. data).
In northern Vietnam, unexplained outbreaks of non-JE acute encephalitis have been documented since 1999. These outbreaks are unusual because of their specifi c location (Bac Giang Province), their strict seasonality (92% of unexplained AES occur during May–July), the restricted age group of persons at risk (88% are <15 years old), and the clinical features (abrupt febrile onset, rapid progression to coma, and higher case-fatality rate than for JE). Approximately 50–100 children are referred to the provincial hospital each epidemic season, but the actual number of cases could be underreported because some patients might have died at home.
The local population and public health practitioners have anecdotally attributed the emergence of AES to the recent intensifi cation of litchi production in the province: production rose from 870 tons during 1985–1989 to
Litchi–associated Acute Encephalit is in Children,
Northern V ietnam, 2004–2009Juliette Paireau, Nguyen Hai Tuan, Rémi Lefrançois, Matthew R. Buckwalter, Ngu Duy Nghia,
Nguyen Tran Hien, Olivier Lortholary, Sylvain Poirée, Jean-Claude Manuguerra, Antoine Gessain, Matthew L. Albert, Paul T. Brey, Phan Thi Nga, and Arnaud Fontanet
Emerging Infectious Diseases � www.cdc.gov/eid � Vol. 18, No. 11, November 2012 1817
Author affi liations: Institut Pasteur, Paris, France (J. Paireau, R.
Lefrançois, M.R. Buckwalter, J.-C. Manuguerra, A. Gessain, M.L.
Albert, A. Fontanet); National Institute of Hygiene and Epidemiology,
Hanoi, Vietnam (N.H. Tuan, N.D. Nghia, P.T. Nga, N.T. Hien);
Université Paris X-Nanterre, Paris (R. Lefrançois); INSERM
U818, Paris (M.R. Buckwalter, M.L. Albert); Hôpital Necker-
Enfants Malades, Paris (O. Lortholary, S. Poirée); Université
Paris Descartes, Paris (O. Lortholary, M.L. Albert); CNRS URA
1930, Paris (A. Gessain); Institut Pasteur, Vientiane, Lao People’s
Democratic Republic (P.T. Brey); and Conservatoire National des
Arts et Métiers, Paris (A. Fontanet)
DOI: http://dx.doi.org/10.3201/eid1811.111761

RESEARCH
400,000 tons during 2000–2005. Bac Giang Province has the highest litchi production in Vietnam, three fourths of which is consumed domestically and the rest is exported mainly to People’s Republic of China (5,6). Vietnamese litchis are mostly of the Thieu variety, which has a short harvest period of ≈1 month during May–July (7), which coincides with the epidemic season of the outbreaks in Bac Giang.
Because of the distinct early clinical manifestations (8), the syndrome has been locally termed Ac Mong encephalitis (AME), after the Vietnamese word for nightmare. The typical clinical illness starts with headache and fever, followed by seizures (often during the night); approximately one third of cases progress to coma and death.
The causative agent of AME has remained unidentifi ed and may be responsible for unexplained acute encephalitis elsewhere in the world, particularly in regions sharing similar ecology and environment. Litchi is widely distributed throughout subtropical and tropical regions. The 5 leading litchi-producing countries are China, India, Taiwan, Thailand, and Vietnam (9).
Our fi rst objective was to describe the epidemiologic and clinical features of this severe encephalitis among children in northern Vietnam. Our second objective was to strengthen or weaken the hypothesis that litchi cultivation is associated with acute outbreaks of AES in Bac Giang Province. We investigated this suspected association using a retrospective ecologic analysis for 2004–2009 in Bac Giang Province that involved various environmental, agronomic, and climatic factors. Confi rmation of this association would pave the way for further hypothesis-testing studies investigating the causal mechanisms behind this ecologic correlation.
Materials and Methods
Study Area
Bac Giang Province is located in northeastern Vietnam, 50 km from the capital, Hanoi (Figure 1). This
mainly rural area covers 3,827 km2 and has a population of ≈1.6 million inhabitants. About one third of the land area is devoted to agriculture and one fourth to forestry and timber production. The climate comprises 2 distinct seasons: the cold, dry season from October through March and the hot, rainy season from April through September. The province is divided into 10 districts and 230 communes. The only hospital is in Bac Giang City, which is the capital of the province.
Data Collection and Laboratory AnalysesRecords from patients admitted to the provincial
hospital with suspected AES from January 2004 through December 2009 were collected from Bac Giang Preventive Medicine Centre and NIHE. Among these patients, criteria for inclusion in the ecologic analyses were clinical diagnosis of suspected acute viral encephalitis, age <15 years, onset date during May 1–July 31, and negative serology for JEV IgM (IgM antibody-capture ELISA) or full immunization against JEV (receipt of 3 doses). Patients meeting these criteria are referred to as suspected AME case-patients.
Detailed clinical and biologic examinations, including blood analyses, cerebrospinal fl uid (CSF) analyses, and cranial computed tomography scans, were available for 88 AME patients hospitalized during 2006–2009 that were included in a parallel case–control study (in progress). Alanine aminotransferase and aspartate aminotransferase levels also were tested in 17 patients. The representativeness of this subgroup was evaluated by comparing it with the whole group on all common measured characteristics (age, sex, day of onset, and geographic coordinates) by χ2 and t tests.
To determine the nature of the host response to AME, Multiple Analyte Profi ling (Luminex Inc., Austin, TX, USA) was performed on the serum and CSF of a subset of AME patients collected in 2007. Samples were analyzed for 39 separate chemokines and cytokines by using the Luminex 100IS technology (Miliplex MAP kits; Milipore, Billerica, MA, USA). The analyzed group comprised samples from 5 patients who survived, 5 who died of the
1818 Emerging Infectious Diseases � www.cdc.gov/eid � Vol. 18, No. 11, November 2012
Figure 1. Location and map of Bac
Giang province in Vietnam. A color
version of this fi gure is available
online (wwwnc.cdc.gov/EID/article/
18/11/11-1761-F1.htm).

Litchi–associated Encephalitis
disease, and 4 serum samples from asymptomatic siblings. Data are presented as concentration (pg/mL). We used a Mann-Whitney U test to compare values between groups.
In virology, a collection of 9 supernatants from short-term cell cultures (including Vero and C6/36 cells) and their corresponding CSF and serum samples, taken from patients during 2006–2008 who had severe, including fatal, forms of disease, were all screened for known viruses by using PCR-based assays at Institut Pasteur (Paris, France). Searched viruses included JEV, dengue viruses 1–4, West Nile virus, chikungunya virus, herpes simplex viruses 1 and 2, varicella-zoster virus, Rift Valley fever virus, Crimean-Congo hemorrhagic fever virus, and most viruses of genera Enterovirus and Alphavirus. All assay results were negative.
Ecologic Data Collection and Mapping
Demographic and agronomic data were collected by the Bac Giang Preventive Medicine Centre from the district statistics offi ces for each year from 2004 through 2009 for the 230 communes. These data included population count; production of rice and litchi; surface area dedicated to rice cultivation, litchi cultivation, and forestry; and the number of pigs, water buffaloes, cattle, and poultry. Starting and ending months of the rice and litchi harvests were collected at the district level. Daily meteorologic data were collected at the provincial level from the National Centre for Hydro-Meteorological Forecasting, Ministry of Natural Resources and Environment (Hanoi, Vietnam). These data included mean temperature, mean relative humidity, and total rainfall during January 2004–December 2009.
A commune-level map of Bac Giang Province was retrieved from the Map Library of the WHO health mapping program. To improve the accuracy of the WHO map, a 1:50,000 topographic map of Bac Giang Province (Cartography Offi ce of Vietnam National Institute of Geography) was digitized and geo-referenced (WGS84 coordinate system) with SavGIS software (www.savgis.org). From these 2 cartographic sources, a new, more precise, map of Bac Giang communes and rivers (WGS84-UTM48N projection) was created with ArcGIS software (version 10.1, ESRI Inc., Redlands, CA, USA). In addition, mean elevations of the communes were derived from satellite raster data (US Geological Survey, Shuttle Radar Topography Mission), collected from the FTP server of Global Land Cover Facility, University of Maryland (ftp://ftp.glcf.umiacs.umd.edu/glcf/).
Statistical Analyses
To investigate the spatiotemporal association between AME incidence and potential ecologic factors, including litchi cultivation, we conducted a commune-level retrospective ecologic regression analysis in Bac Giang
Province for 2004–2009. A 2-level (year and commune) binomial negative regression model with fi xed-effect coeffi cients and random-effect intercepts was conducted by using STATA software (version 11.0; StataCorp LP, College Station, TX, USA). The outcome was the number of AME cases per commune per year. The covariates included in the analysis are listed in Table 1 (Appendix, wwwnc.cdc.gov/EID/article/18/11/11-1761-T1.htm). Continuous variables were modeled as categorical variables (by quartiles for agronomical variables and by terciles for meteorologic variables). Population size was introduced as an offset in the model so that the measure comparing the risk across exposure categories was an incidence rate ratio (IRR). The multivariate analysis included covariates with a p value <0.25 in the univariate analyses, and a backward deletion of variables by Wald test was conducted until all variables in the fi nal model had p values <0.05.
In addition, we investigated the temporal correlation between the epidemics and the litchi harvests to test whether AME cases occurred earlier in areas that harvested litchis earlier in the year. A Mann-Whitney U test was used to compare the distribution of the week numbers (1–52) of cases in the 5 districts that harvested litchis during May–June (group 1) to the distribution of the week numbers of cases in the 5 districts that harvested litchis during June–July (group 2). The test was performed in R (version 2.12.1; R Development Core Team, R Foundation for Statistical Computing, Vienna, Austria).
Ethical Considerations
This study was approved by the Clinical Research Committee of Institut Pasteur, and ethical clearance was obtained from the NIHE Institutional Review Board. Informed consent for participation in the study was obtained from each child’s legal representative (parent, guardian, or other legally recognized person as defi ned by Vietnamese national laws).
Results
Spatial and Temporal Distribution of Cases
During the study period, 239 children met the inclusion criteria. Their median age was 5 years (interquartile range 2–7.5), and the male:female ratio was 1.21:1. Temporally, the number of AME cases in the study decreased from 57 in 2004 to 19 in 2006, then increased to 58 in 2008 and fell to 12 in 2009 (Figure 2, panel A). The annual litchi production in the province is plotted for comparison purposes (Figure 2, panel B). Spatially, we estimated the cumulative incidence of the disease at the commune level during the study period, which ranged from 0 to 205 cases per 100,000 inhabitants (Figure 3, panel A). The highest incidences were mainly found in communes in
Emerging Infectious Diseases � www.cdc.gov/eid � Vol. 18, No. 11, November 2012 1819

RESEARCH
Luc Nam, Luc Ngan, and Son Dong districts, accounting for 56% of all cases. The annual number of cases per commune ranged from 0 to 6. For comparative analysis, we determined the mean proportion of the communes’ surface devoted to litchi cultivation over the study period (Figure 3, panel B).
Clinical and Laboratory Results
Detailed clinical and biologic results were available for 88 patients (Table 2). This subgroup of patients did not signifi cantly differ from the whole group for all common measured characteristics. Children were hospitalized within 1 day (median) after symptom onset; most had fever (89%), seizures (82%), and vomiting (64%). At admission,
meningeal signs (85%), altered mental status (87%), or coma (10%) were commonly seen. During hospitalization, limb paralysis developed in 13% of children. Twenty-two (25%) of the 88 children died of the disease. Spinal tap was performed in 75 children; CSF was transparent for 73 (97%) children. Leukocyte count in CSF, available for 16 children, was slightly elevated (median 20 cells/mm3 [reference <5 cells/mm3]), and with lymphocyte predominance (median 57%). Cranial computed tomography scans were performed in 50 children; no change was detected in 58% of children; edema in 28%; and focal signs in 14%.
Results of Multiple Analyte Profi ling are shown for selected analytes in the online Technical Appendix Figure (wwwnc.cdc.gov/EID/pdfs/11-1761-Techapp.pdf).
1820 Emerging Infectious Diseases � www.cdc.gov/eid � Vol. 18, No. 11, November 2012
Table 2. Clinical and laboratory features of Ac Mong encephalitis patients, Bac Giang Province, Vietnam, 2004–2009*
Feature No. (%) Median (IQR)
Sex, n = 88 F 41 (47) NA M 47 (53) NA
Age, y, n = 88 <2 16 (18) NA 2–4 27 (31) NA 4–6 19 (22) NA 6–15 26 (30) NA
Symptoms/signs before and at admission Headache, n = 62 36 (58) NA Fever,† n = 85 76 (89) NA Temperature at admission, °C, n = 87 NA 38.2 (38.0–39.0) Seizures, n = 87 71 (82) NA Altered mental status, n = 75 65 (87) NA Coma, n = 70 7 (10) NA Meningeal symptoms,‡ n = 67 57 (85) NA Limb paralysis, n = 75 4 (5) NA Cranial nerve palsy, n = 60 2 (3) NA Vomiting, n = 58 37 (64) NA Diarrhea, n = 52 4 (8) NA
Days between onset and admission, n = 88 NA 1 (0–2)
Blood analysis NA NA
Leukocytes, 109 cells/L, n = 85 NA 17.5 (10.7–22.0)
Lymphocytes, %, n = 72 NA 19 (13–29)
Platelets, 109/L, n = 68 NA 254.5 (207.5–309.5)
Hemoglobin, g/L, n = 70 NA 114 (100–130) Glucose, mmol/L, n = 72 NA 5.0 (3.2–6.1)
CSF sample
Leukocytes, 109 cells/L, n = 16 NA 20 (12.5–85)
Lymphocytes, %, n = 18 NA 57 (40–75) Protein level >0.5 g/L, n = 66 9 (14) NA Transparent appearance of CSF, n = 75 73 (97) NA Increased CSF pressure, i.e., >20 cm H20, n = 70 35 (50) NA
Cranial CT scan, n = 50 Normal 29 (58) NA Diffuse edema 14 (28) NA Evidence of brain herniation 4 (8) NA Hemorrhagic stigma 3 (6) NA Intraparenchymal hypodensity 4 (8) NA Cortico-subcortical atrophy 8 (16) NA
Liver enzymes, n = 17 ALT, U/L NA 42 (37–58) AST, U/L NA 58 (43–76) *IQR, interquartile range; NA, not applicable; CSF, cerebrospinal fluid; CT, computed tomographic; ALT, alanine aminotransferase; AST, aspartate aminotransferase. †Observed by parents before admission or measured at admission (>38°C). ‡Either meningitis signs, stiff neck, Kernig’s sign, meningitis rash.

Litchi–associated Encephalitis
interferon-α2 levels (mean ± SEM) were elevated in the
serum of patients who survived AME (538.5 ± 196.6) compared with their sibling controls (56.15 ± 55.09) (p = 0.17). Interleukin-8 (IL-8) levels were elevated in the CSF of AME patients of both outcomes but were higher in those who died (930.3 ± 328.7) than in those who survived (237.6 ± 118.4) (p = 0.095). Serum IL-6 also was detected in patients of both outcomes, with higher levels in patients who died (132.2 ± 68.5) than in sibling controls (0.875 ± 0.425) (p = 0.029). IL-6 was elevated in the CSF of patients who died (430.1 ± 148.5) and in those who survived the disease (2151.8 ± 1934.6).
Ecologic Regression Results
The fi nal multivariate model resulted in 3 factors independently associated with AME (Table 3). A positive association between disease incidence and litchi surface proportion was found: the IRRs were 1.52 (95% CI 0.90–2.57), 2.94 (95% CI 1.88–4.60), and 2.76 (95% CI 1.76–4.32) for second, third, and fourth quartiles, respectively, compared with the lowest quartile. A reduced risk was associated with density of poultry: the IRRs were 0.62 (95% CI 0.43–0.91), 0.61 (95% CI 0.42–0.89), and 0.25 (0.15–0.43) for second, third, and fourth quartiles, respectively, compared with the lowest quartile. Relative humidity was negatively associated with disease incidence:
the IRRs were 0.84 (95% CI 0.61–1.16) and 0.35 (95% CI 0.23–0.54) for second and third terciles, respectively, compared with the lowest tercile.
Temporal Correlation between the
Epidemics and the Litchi Harvests
Figure 4 displays the weekly distributions of AME cases and associated kernel densities for the districts that harvested litchis during May–June (group 1) and during June–July (group 2). The Mann-Whitney U test showed that the distributions of the week numbers differed signifi cantly (p = 0.007) between the 2 groups, with a delay of 1 week for group 2 compared with group 1.
DiscussionWe found evidence for a spatiotemporal association
between the outbreaks of unknown encephalitis in Bac Giang Province and litchi cultivation. The ecologic regression analysis demonstrated that the annual risk for AME in a commune increased with the proportion of litchi-cultivated surface and that the epidemics occurred earlier in the districts that harvested litchis during May–June than in those that harvested litchis during June–July.
Similar to the clinical features of Chandipura encephalitis (3), i.e., acute encephalitis with rapid onset, those reported here suggest a viral etiology. Unfortunately, all viral investigations have thus far been uninformative. New techniques, such as high-throughput sequencing and resequencing micro-arrays, are currently performed on serum, CSF, culture supernatants, and brain homogenates from suckling mice inoculated intracerebrally with patients’ CSF. Although electron microscopy of brain tissue is a standard method of identifying new viral pathogens in encephalitis syndromes, we were unable to obtain brain tissue specimens through autopsy because of cultural barriers.
The association between litchis and acute encephalitis remains unclear. As with other emerging viruses, we face a multifactorial problem that seems to have litchi fruit production and harvest as its focal point. One possible scenario is that fruit-bearing litchi trees can attract bats, which might be the reservoir for the putative pathogen. Mosquitoes could feed on the infected bats and transmit the virus to humans who have insuffi cient protection against mosquito bites. Several species of bats were identifi ed in the province, such as the frugivorous bats Rousettus
leschenaultii, which can feed on litchi. These bats’ highly gregarious, cave dwelling, and migratory characteristics facilitate their role in virus carrying and circulation (10).The bat population density is high during April–September (which includes the time of litchi harvest) before migration during October–March.
In addition, several mosquito species were identifi ed in Bac Giang Province: Anopheles vagus, Armigeres
Emerging Infectious Diseases � www.cdc.gov/eid � Vol. 18, No. 11, November 2012 1821
Figure 2. Temporal evolution of Ac Mong encephalitis (AME) and
litchi cultivation, Bac Giang Province, Vietnam, 2004–2009. A)
Annual number of AME cases; B) annual litchi production.

RESEARCH
subalbatus, Culex tritaeniorhynchus, Cx. vishnui, Cx.
gelidus, Cx. fuscocephalus, Cx. quinquefasciatus, and Cx. bitaeniorhynchus. Although the peak incidence of May–July correlates with the rice paddy breeding and development of Culex spp. mosquitoes, the paddy fi elds area was negatively associated with the risk for disease in univariate analysis. No data were collected on vector densities in Bac Giang.
Other modes of transmission, e.g., direct contact with litchis contaminated by bat saliva, urine, or guano (11) or with other vectors, such as insects found in litchi trees or phlebotomine sand fl ies, as in the case of Chandipura virus (12), cannot be excluded. Deforestation in Bac Giang to develop the growing of litchi trees because of their high
economic value also might have disrupted the ecologic equilibrium of the province, leading to the emergence of a new vector-borne disease (13). The putative virus also might be exclusively human; use of human feces as fertilizers to enhance litchi growth in these plantations might have contaminated the soil with enteroviruses, which are known to cause fatal encephalitis in deprived children (14).
Last, a toxic origin might be possible; in India, a toxic weed, Cassia occidentalis, caused an acute hepatomyoencephalopathy syndrome, which was fi rst assumed to be viral encephalitis (15). However, in our study, the presence of fever and meningeal symptoms and the absence of high elevation of liver enzyme favor a viral etiology rather than a toxic origin. Additionally, we demonstrated that children with AME harbor elevated levels of type I interferon in serum and interferon-inducible cytokines, such as IL-6 and IL-8 in CSF, compatible with an infectious process (16,17); however, these cytokines are expected to be elevated in any infl ammatory process.
The protective effects of poultry density and mean relative humidity during January–April (pre–epidemic period) are more diffi cult to interpret. With respect to the hypothesis of an arbovirus-mediated pathogenesis, a possibility is that poultry is a preferred host for the putative vector (18). Regarding negative correlation with humidity, above a certain limit, high relative humidity can be harmful to insects; insects or their eggs can drown or be infected more readily by pathogens (19). Litchi growing also depends on climate; ideal conditions include a brief dry, cool, and frost-free winter to lead to fl owering, followed by warmer temperatures and moderate rainfall and humidity during fruit development and harvest (20). Still, climatic variations alone could not explain the spatial differences in disease risk between communes of the same province. Moreover, even if the association is not proved to be causal, the persistence of both variables (litchi surface and mean
1822 Emerging Infectious Diseases � www.cdc.gov/eid � Vol. 18, No. 11, November 2012
Table 3. Multivariate analysis of Ac Mong encephalitis, Bac Giang Province, Vietnam, 2004–2009
Variable/category IRR* (95% CI) p value†
Litchi surface, % commune surface <1.49 1 <0.001 1.49–5.84 1.52 (0.90–2.57) 5.84–12.92 2.94 (1.88–4.60) >12.92 2.76 (1.76–4.32)
Poultry density, no./km2
<1,449.79 1 <0.001 1,449.79–3,715.18 0.62 (0.43–0.91) 3,715.18–7,065.25 0.61 (0.42–0.89) >7,065.25 0.25 (0.15–0.43)
Mean humidity, %, January–April <82.07 1 <0.001 82.07–83.55 0.84 (0.61–1.16) >83.55 0.35 (0.23–0.54) *IRR, incidence rate ratio. †Indicates global p value.
Figure 3. Commune-level maps of Bac Giang Province, Vietnam,
2004–2009. A) Cumulative incidence rate per 100,000 inhabitants
of Ac Mong encephalitis. B) Mean percentage of commune surface
area devoted to litchi cultivation. C) Mean poultry density (no. per
km2). A color version of this fi gure is available online (wwwnc.cdc.
gov/EID/ article/18/11/11-1761-F3.htm).
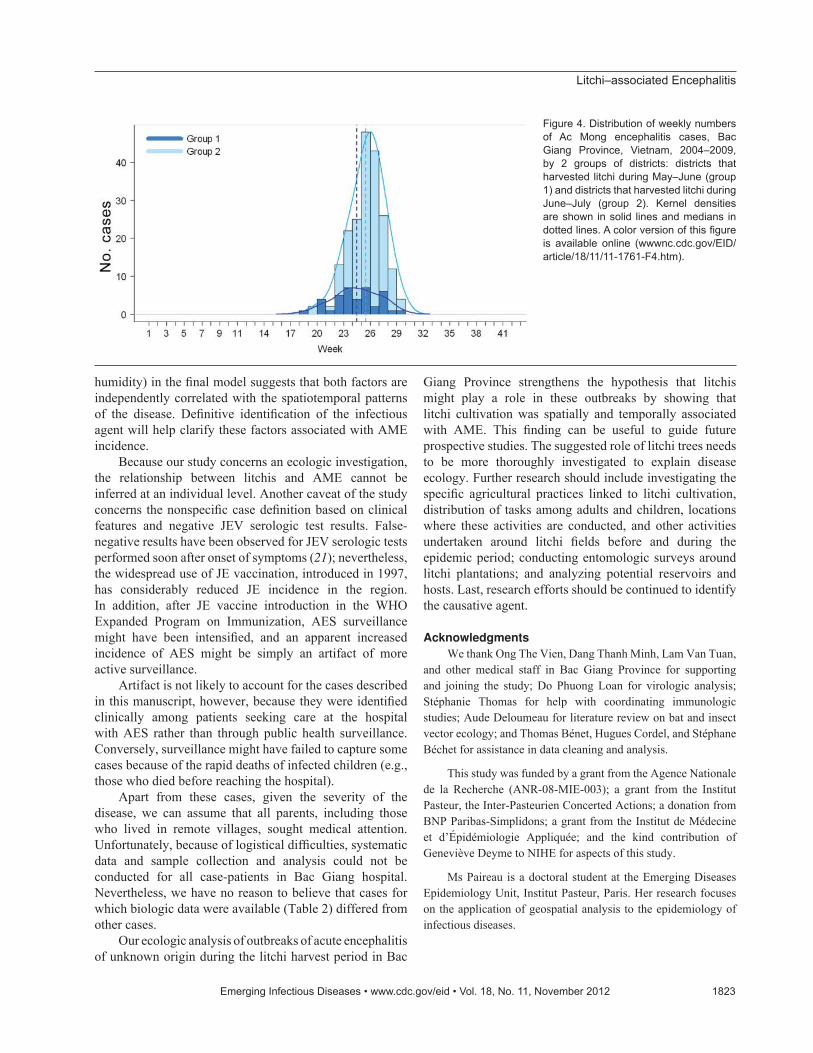
Litchi–associated Encephalitis
humidity) in the fi nal model suggests that both factors are independently correlated with the spatiotemporal patterns of the disease. Defi nitive identifi cation of the infectious agent will help clarify these factors associated with AME incidence.
Because our study concerns an ecologic investigation, the relationship between litchis and AME cannot be inferred at an individual level. Another caveat of the study concerns the nonspecifi c case defi nition based on clinical features and negative JEV serologic test results. False-negative results have been observed for JEV serologic tests performed soon after onset of symptoms (21); nevertheless, the widespread use of JE vaccination, introduced in 1997, has considerably reduced JE incidence in the region. In addition, after JE vaccine introduction in the WHO Expanded Program on Immunization, AES surveillance might have been intensifi ed, and an apparent increased incidence of AES might be simply an artifact of more active surveillance.
Artifact is not likely to account for the cases described in this manuscript, however, because they were identifi ed clinically among patients seeking care at the hospital with AES rather than through public health surveillance. Conversely, surveillance might have failed to capture some cases because of the rapid deaths of infected children (e.g., those who died before reaching the hospital).
Apart from these cases, given the severity of the disease, we can assume that all parents, including those who lived in remote villages, sought medical attention. Unfortunately, because of logistical diffi culties, systematic data and sample collection and analysis could not be conducted for all case-patients in Bac Giang hospital. Nevertheless, we have no reason to believe that cases for which biologic data were available (Table 2) differed from other cases.
Our ecologic analysis of outbreaks of acute encephalitis of unknown origin during the litchi harvest period in Bac
Giang Province strengthens the hypothesis that litchis might play a role in these outbreaks by showing that litchi cultivation was spatially and temporally associated with AME. This fi nding can be useful to guide future prospective studies. The suggested role of litchi trees needs to be more thoroughly investigated to explain disease ecology. Further research should include investigating the specifi c agricultural practices linked to litchi cultivation, distribution of tasks among adults and children, locations where these activities are conducted, and other activities undertaken around litchi fi elds before and during the epidemic period; conducting entomologic surveys around litchi plantations; and analyzing potential reservoirs and hosts. Last, research efforts should be continued to identify the causative agent.
Acknowledgments
We thank Ong The Vien, Dang Thanh Minh, Lam Van Tuan, and other medical staff in Bac Giang Province for supporting and joining the study; Do Phuong Loan for virologic analysis; Stéphanie Thomas for help with coordinating immunologic studies; Aude Deloumeau for literature review on bat and insect vector ecology; and Thomas Bénet, Hugues Cordel, and Stéphane Béchet for assistance in data cleaning and analysis.
This study was funded by a grant from the Agence Nationale de la Recherche (ANR-08-MIE-003); a grant from the Institut Pasteur, the Inter-Pasteurien Concerted Actions; a donation from BNP Paribas-Simplidons; a grant from the Institut de Médecine et d’Épidémiologie Appliquée; and the kind contribution of Geneviève Deyme to NIHE for aspects of this study.
Ms Paireau is a doctoral student at the Emerging Diseases Epidemiology Unit, Institut Pasteur, Paris. Her research focuses on the application of geospatial analysis to the epidemiology of infectious diseases.
Emerging Infectious Diseases � www.cdc.gov/eid � Vol. 18, No. 11, November 2012 1823
Figure 4. Distribution of weekly numbers
of Ac Mong encephalitis cases, Bac
Giang Province, Vietnam, 2004–2009,
by 2 groups of districts: districts that
harvested litchi during May–June (group
1) and districts that harvested litchi during
June–July (group 2). Kernel densities
are shown in solid lines and medians in
dotted lines. A color version of this fi gure
is available online (wwwnc.cdc.gov/EID/
article/18/11/11-1761-F4.htm).

RESEARCH
References
1. Gould EA, Solomon T. Pathogenic fl aviviruses. Lancet. 2008;371:500–9. http://dx.doi.org/10.1016/S0140-6736(08)60238-X
2. Mackenzie JS. Emerging zoonotic encephalitis viruses: lessons from Southeast Asia and Oceania. J Neurovirol. 2005;11:434–40. http://dx.doi.org/10.1080/13550280591002487
3. Rao BL, Basu A, Wairagkar NS, Gore MM, Arankalle VA, Thakare JP, et al. A large outbreak of acute encephalitis with high fatality rate in children in Andhra Pradesh, India, in 2003, associated with Chandipura virus. Lancet. 2004;364:869–74. http://dx.doi.org/10.1016/S0140-6736(04)16982-1
4. Lee VT, Qui PT, Ha DQ, Hue NB, Bao LQ, Cam BV, et al. Viral etiology of encephalitis in children in southern Vietnam: results of a one-year prospective descriptive study. PLoS Negl Trop Dis. 2010;4:e854. http://dx.doi.org/10.1371/journal.pntd.0000854
5. Department of Planning and Projection, Ministry of Agriculture and Rural Development, Vietnam. Food Market Monitor, Vietnam. 2003 (Jun);no.06/03. Hanoi (Vietnam): The Department; 2003.
6. Hai VM, Dung NV. Lychee production in Vietnam. In: Papademetriou NK, Dent FJ, editors. Lychee production in the Asia-Pacifi c region. Bangkok: Food and Agriculture Organization Regional Offi ce for Asia and the Pacifi c; 2002. p. 114–119.
7. Cao-Van P, Bourdeaut J. Vietnamese litchi: exceptional development. Fruitrop. 1998;50:14–6 [cited 2012 Sep 4]. http://passionfruit.cirad.fr/index.php/download/%28id%29/1362/%28langue%29/eng/%28type%29/complet
8. Study on putative viral agent responsible for acute encephalitis syndrome in Bac Giang by Aedes albopictus C6/36 cell culture [in Vietnamese]. Hoan Kiem District (Vietnam): General Society of Medicine and Pharmacy of Vietnam. 2006;XVI(1).
9. Evans EA, Degner RL. Recent developments in world production and trade of lychee (Litchi chinensis): implications for Florida growers. Proc Fla State Hort Soc. 2005;118:247–9.
10. Cui J, Counor D, Shen D, Sun G, He H, Deubel V, et al. Detection of Japanese encephalitis virus antibodies in bats in southern China. Am J Trop Med Hyg. 2008;78:1007–11.
11. Wacharapluesadee S, Lumlertdacha B, Boongird K, Wanghongsa S, Chanhome L, Rollin P, et al. Bat Nipah virus, Thailand. Emerg Infect Dis. 2005;11:1949–51. http://dx.doi.org/10.3201/eid1112.050613
12. Geevarghese G, Arankalle VA, Jadi R, Kanojia PC, Joshi MV, Mishra AC. Detection of Chandipura virus from sand fl ies in the genus Sergentomyia (Diptera: Phlebotomidae) at Karimnagar district, Andhra Pradesh, India. J Med Entomol. 2005;42:495–6. http://dx.doi.org/10.1603/0022-2585(2005)042[0495:DOCVFS]2.0.CO;2
13. Walsh JF, Molyneux DH, Birley MH. Deforestation: effects on vector-borne disease. Parasitology. 1993;106(Suppl):S55–75. http://dx.doi.org/10.1017/S0031182000086121
14. Sapkal GN, Bondre VP, Fulmali PV, Patil P, Gopalkrishna V, Dadhania V, et al. Enteroviruses in patients with acute encephalitis, Uttar Pradesh, India. Emerg Infect Dis. 2009;15:295–8. http://dx.doi.org/10.3201/eid1502.080865
15. Vashishtha VM, Kumar A, John TJ, Nayak NC. Cassia occidentalis poisoning causes fatal coma in children in western Uttar Pradesh. Indian Pediatr. 2007;44:522–5.
16. Winter PM, Dung NM, Loan HT, Kneen R, Wills B, Thu LT, et al. Proinfl ammatory cytokines and chemokines in humans with Japanese encephalitis. J Infect Dis. 2004;190:1618–26. http://dx.doi.org/10.1086/423328
17. Kawabe S, Ito Y, Ohta R, Sofue A, Gotoh K, Morishima T, et al. Comparison of the levels of human herpesvirus 6 (HHV-6) DNA and cytokines in the cerebrospinal fl uid and serum of children with HHV-6 encephalopathy. J Med Virol. 2010;82:1410–5. http://dx.doi.org/10.1002/jmv.21808
18. Speight MR, Hunter MD, Watt AD. Ecology of insects: concepts and applications. 2nd ed. Chichester (UK): Wiley-Blackwell; 2008.
19. Gullan PJ, Cranston PS. The insects: an outline of entomology. 4th ed. Chichester (UK): Wiley-Blackwell; 2010.
20. Diczbalis Y. Farm and forestry production and marketing profi le for lychee (Litchi chinensis). In: Elevitch CR, editor. Specialty crops for Pacifi c Island. Holualoa (HI): Permanent Agriculture Resources; 2011.
21. Ravi V, Robinson JS, Russell BJ, Desai A, Ramamurty N, Featherstone D, et al. Evaluation of IgM antibody capture enzyme-linked immunosorbent assay kits for detection of IgM against Japanese encephalitis virus in cerebrospinal fl uid samples. Am J Trop Med Hyg. 2009;81:1144–50. http://dx.doi.org/10.4269/ajtmh.2009.09-0144
Address for correspondence: Arnaud Fontanet, Unité d’Epidémiologie des
Maladies Emergentes, Bâtiment Laveran 3ème étage, Institut Pasteur, 25
rue du Docteur Roux, 75015 Paris, France; email: [email protected]
1824 Emerging Infectious Diseases � www.cdc.gov/eid � Vol. 18, No. 11, November 2012
The opinions expressed by authors contributing to this
journal do not necessarily refl ect the opinions of the Centers for
Disease Control and Prevention or the institutions with which
the authors are affi liated.
Scan this QR Code with your
smartphone and enjoy listening
to our podcasts about the latest
emerging infectious diseases.
http://wwwnc.cdc.gov/eid/podcasts.htm
Top Related
Copyright © 2022 FDOKUMEN

