


Bahasa
Halaman
Hukum

United States Office of Air Quality EPA-450/2-78-015 Environmental Protection Planning and Standards OAQPS No. 1.2-1 01 Agency Research Triangle Park NC 2771 1 June 1978
Air
CW.TINGGuideline Series O T H E R METAL
P.P- 42 Section 4 . 2 . 7 . 9 Reference Number
Control of Volatile Organic Emissions trom tx~s tmg Stationary Sources -
Volume VI: Surface Coating of Miscellaneous Metal Parts and Products

EPA-450/2-78-015 (OAOPS NO.1.2-101)
CONTROL OF VOLATILE ORGANIC EMISSIONS FROM EXISTING
STATIONARY SOURCES VOLUME VI: SURFACE COATING
OF MISCELLANEOUS METAL PARTS AND PRODUCTS
Emissions Standards and Engineering Division Chemical and Petroleum Branch
U.S. ENVIRONMENTAL PROTECTION AGENCY Office of Air, Noise and Radiation
Office of Air Quality Planning and Standards Research Triangle Park, North Carolina 2771 1
June 1978
PREFACE
This document i s one o f a ser ies designed t o inform Regional, State,
and l o c a l a i r p o l l u t i o n con t ro l agencies of techniques ava i l ab le fo r
reducing emissions o f v o l a t i l e organic compounds (VOC) from -ex i s t i ng
s ta t i ona ry sources. This document deals w i t h the sur face coat ing of
miscel laneous metal p a r t s and products, and i s intended t o prov ide
guidance on VOC emission c o n t r o l f o r j ob shop and o r i g i n a l equipment
manufactur ing (OEM) i n d u s t r i e s which apply coat ings on metal substrates
which have not been the subject o f more s p e c i f i c prev ious documents
i n t h i s ser ies . Reports have a l ready been publ ished which i d e n t i f y con t ro l
op t ions f o r t h e f o l l o w i n g i ndus t r i es : can, c o i l , automobile and l i g h t
du ty t ruck , metal f u r n i t u r e , magnet wire, and l a r g e appliances.*
Th is r e p o r t describes the types of coat ing operat ions found i n t h i s
broad i n d u s t r i a1 category, i d e n t i f i e s the sources and types o f VOC emissions,
and r e p o r t s t he a v a i l a b l e methods and costs f o r min imiz ing these emissions.
Mon i to r ing techniques fo r coat ings which are low i n organic solvents are
suggested. More de ta i l e d d iscussions of coat ings low i n organic solvent
and add-on c o n t r o l technologies are found i n , "Control o f V o l a t i l e Organic
Emissionsfrom E x i s t i n g S ta t i ona ry Sources - Volume I: Contro l Methods f o r
Surf ace Coating Operat ions, " EPA-45012-76-028, November, 1976. ASTM t e s t
methods f o r mon i to r ing the organic so l vent content of coat ings are summarized
in , "Control of V o l a t i l e Organic Emissions from E x i s t i n g S ta t i ona ry Sources -Volume 11: Surface Coating of Cans, Coi ls , Paper, Fabrics, Automobi l e s and
L i g h t Duty Trucks," EPA-45012-77-008, May, 1977.
* E a r l i e r volumes i n t h i s se r i es are a v a i l a b l e from t h e Nat ional Technical In fo rmat ion Service.
iii
OAQPS GUIDELINE SERIES
The guidelines series of reports is being issued by the office of Air Quality Planning and Standards (OAQPS) to information to state and local air pollution control agencies; for example, to provide guidance on the acquisition and processing of air quality data and on the planning and analysis requisite for the maintence of air quality. Reports published in this series will be available - as supplies permit - f rom the Library Services Office (MD-35). U.S. Environmental Protection Agency, Research Triangle Park, North Carolina 2771 1; or, for a nominal fee, from the National 'Technical Information Service, 5285 Port Royal Road, Springfield, Virginia 221 61.
Publication No. EPA-450/2-78-015
(OAQPS NO. 1.2-101)

The m i s ce l l aneous metal part and product category includes hundreds
of small t o medium s i ze industr ies fo r which writing individual guideline
documents would be impractical . After reviewing these industr ies , EPA
prepared t h i s report t o a s s i s t local agencies I n determinq the level of VOC
control that represents the presumptive norm tha t can be achieved through
the application of reasonably avai 1able control technology ( R A C T ) . Reasonably
available control technology i s defined as the lowest emission l imi t tha t a
par t i cu la r source i s capable of meeting by the application of control
technology t ha t i s reasonably avai 1 able considering technological and
economic f ea s ib i l i t y . I t may require technology tha t has been applied t o
s imilar , b u t not necessari ly identical source categories. I t is not
intended t ha t extensive research and development be conducted before a
given control technology can be applied t o the source. This does not,
however, preclude requiring a short-term evaluation program t o permit
the application of a given technology t o a pa r t i cu la r source. This l a t t e r
e f fo r t i s an appropriate technology forcing aspect of RACT. The diagram
on the next page provides emission l imi t s t ha t represent RACT f o r the
industr ies included in the miscellaneous metal pa r t s and products category
of the surface coating industry.
I t must be cautioned t ha t the l im i t s reported i n the diagram are necessari ly
based on a general consideration of the capab i l i t i e s and problems of the
hundreds of industr ies which coat t h e i r products. I t wil l not be applicable
t o every plant o r even every industry w i t h i n t he many industr ies which
coat. For example, the level of control which i s herein recommended f o r
a par t icular source may be based on a type of coating which cannot meet
the specif icat ions required of another product from a simi 1 ar source.
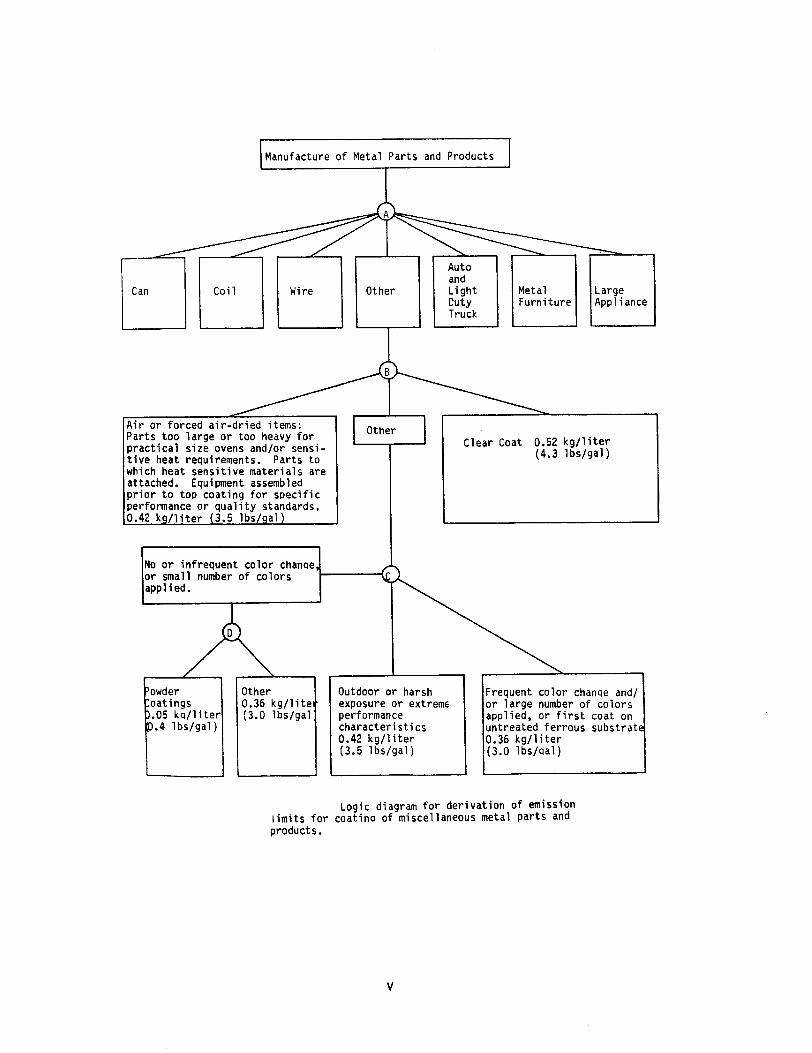
Manufacture of Metal Parts and Products
Air or forced air-dr ied items: Parts too la rae o r too heavy f o r Clear Coat 0.52 k g / l i t e rpract ical size ovens and/or sensi - (4.3 1 bs/gal) t i v e heat requirements. Parts t o which heat sens i t ive mater ials are attached. Equipment assembled pr io r t o top coating f o r spec i f ic performance o r qua1 i t y standards.
No o r infrequent color chanae or small number of colors appl i ed .
owder Other Outdoor o r harsh Frequent color chanae and/ oat ings 0.36 k g / l i t e exposure o r extreme or large number of colors .05 ka/l i ter (3.0 lbs/gal performance applied, o r f i r s t coat on .4 lbs /ga l ) charac te r i s t i cs untreated ferrous subs t ra t 40.42 kg/l i t e r 0.36 k g / l i t e r k
(3.5 lbs /ga l ) ,(3.0 lbs /aa l )
Logic diagram f o r derivat ion of emission l imits f o r coatino of miscellaneous metal par t s and products.

The recomnended emission l imi t s are based on the use of coatings
low in organic solvents. They range from 0.05 t o 0.52 Kg per l i t e r
(0.4 t o 4.4 Ibs /gal) . Equivalent reductions i n VOC emissions can be achieved
by the use of add-on control devices such as incinerators and carbon adsorbers.
Many co'ating applicators, however, have expressed t ha t they plan t o meet
future VOC regulations through the use of coatings low i n organic solvents
ra ther than resor t t o add-on control devices.
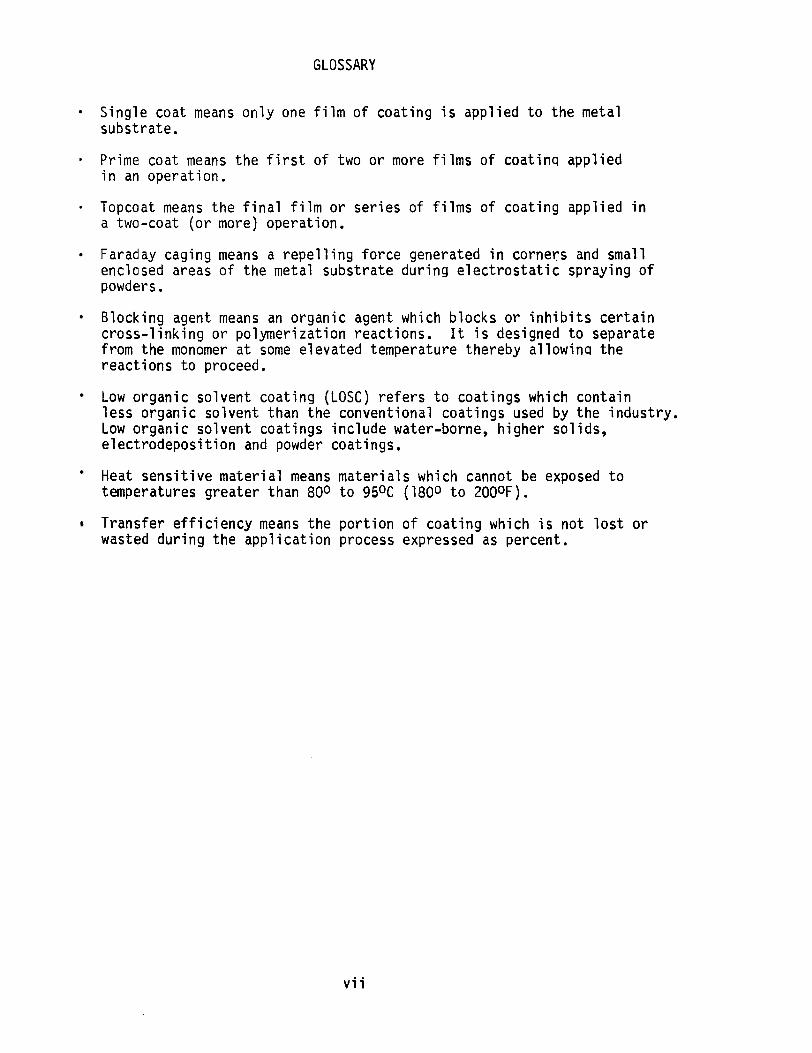
GLOSSARY
Sing le coat means o n l y one f i l m o f coat ing i s app l ied t o the metal substrate.
Prime coat means the f i r s t o f two o r more f i l m s o f coat ins app l ied i n an operat ion.
Topcoat means the f i n a l f i l m o r se r i es o f f i l m s o f coat ing appl ied i n a two-coat ( o r more) operat ion.
Faraday caging means a r e p e l l i n g fo rce generated i n corners and smal l enclolsed areas of the metal substrate dur ing e l e c t r o s t a t i c spraying of powders.
Block ing agent means an organic agent which b locks o r i n h i b i t s c e r t a i n c ross - l i nk ing o r polymer izat ion react ions. I t i s designed t o separate from the monomer a t some elevated temperature thereby a l low ins the reac t i ons t o proceed.
Low organic solvent coat ing (LOSC) re fers t o coat ings which conta in l e s s organic solvent than the convent ional coat ings used by the i ndus t r y . Low organic solvent coat ings inc lude water-borne, h igher so l ids , e lec t rodepos i t i on and powder coatings.
Heat s e n s i t i v e ma te r ia l means ma te r ia l s which cannot be exposed t o temperatures greater than 800 t o 950C (1800 t o 2000F).
Transfer e f f i c i e n c y means the p o r t i o n o f coat ing which i s no t l o s t o r wasted du r ing the a p p l i c a t i o n process expressed as percent.
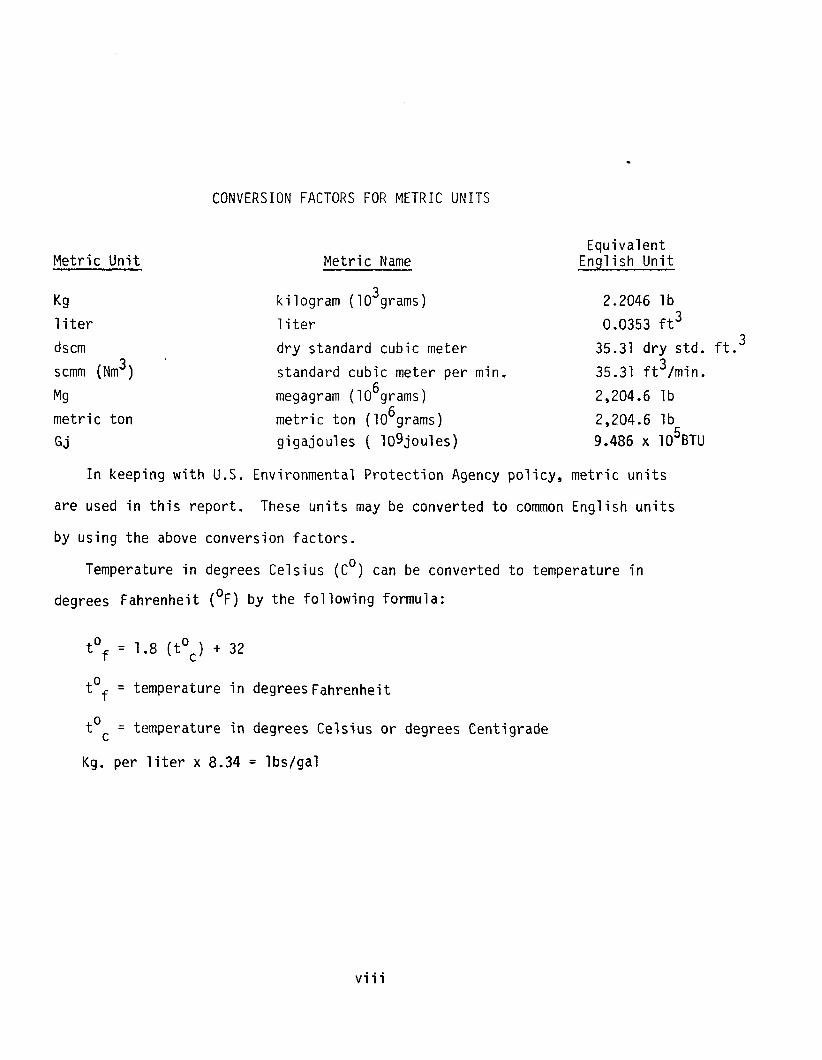
CONVERSION FACTORS FOR METRIC UNITS
Metric Unit Metric Name Equivalent English Unit
Kg 3kilogram (10grams) 2.2046 lb
liter 1iter 0.0353 ft3
dscm 3scmm (Nm )
Mg metric ton
dry standard cubic meter
standard cubic meter per min. 6 megagram (10grams) 6metric ton (10grams)
35.31 dry std. ft. 3
335.31 ft /min.
2,204.6 lb 2,204.6 lb
Gj gigajoules ( 109joules) 9.486 x ~ O ~ B T U
In keeping with U.S. Environmental Protection Agency policy, metric units
are used in this report. These units may be converted to common English units
by using the above conversion factors.
Temperature in degrees Celsius (cO) can be converted to temperature in degrees Fahrenheit (OF) by the fol lowing formula:
tof = temperature in degrees Fahrenheit
to = temperature in degrees Celsius or degrees Centigrade C
Kg. per liter x 8.34 = lbs/gal
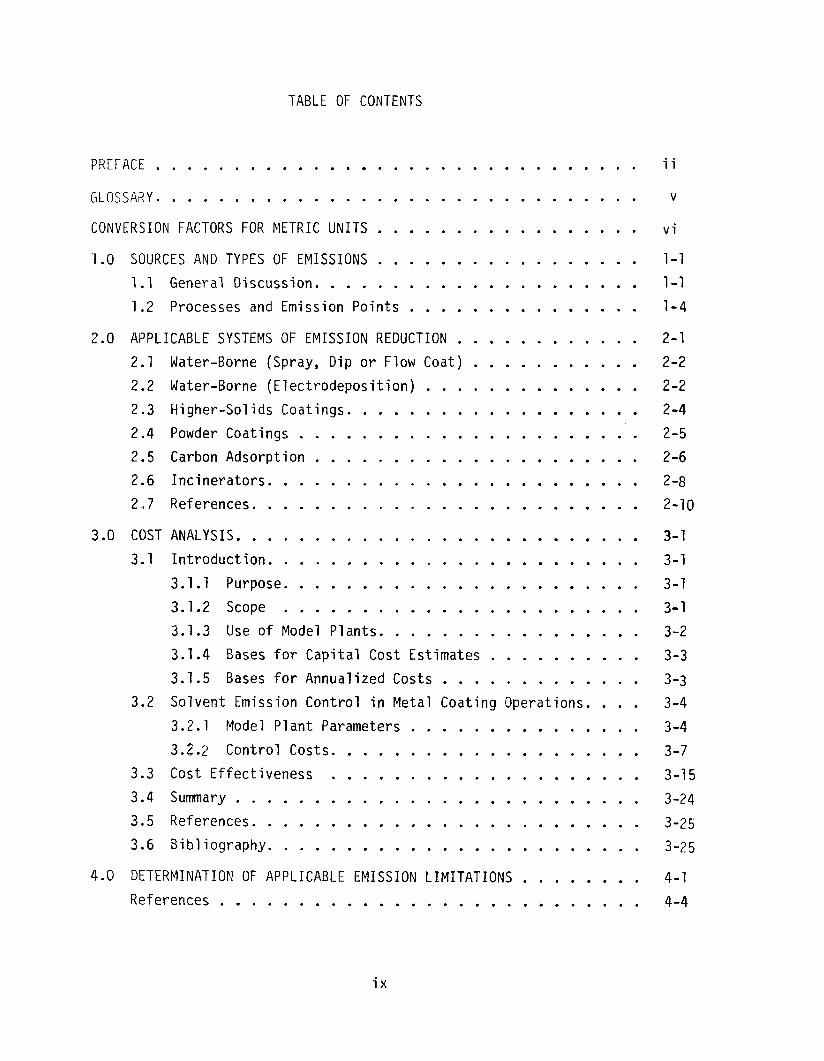
TABLE OF CONTENTS
PREFACE . . . . . . . . . . . . . . . . . . . . . . . . . . . . . . . GLOSSARY . . . . . . . . . . . . . . . . . . . . . . . . . . . . . . . CONVER.SION FACTORS FOR FIETRIC UNITS . . . . . . . . . . . . . . . . . 1.0 SOURCES AND TYPES OF EMISSIONS . . . . . . . . . . . . . . . . .
1.1 General Discussion . . . . . . . . . . . . . . . . . . . . . 1.2 Processes and Emission Points . . . . . . . . . . . . . . .
2.0 APPLICABLE SYSTEMS OF EMISSION REDUCTION . . . . . . . . . . . . 2.1 Water-Borne (Spray. D i p or Flow Coat) . . . . . . . . . . . 2.2 Water-Borne (Electrodeposition) . . . . . . . . . . . . . . 2.3 Higher-Solids Coatings . . . . . . . . . . . . . . . . . . . 2.4 Powder Coatings . . . . . . . . . . . . . . . . . . . . . . 2.5 Carbon Adsorption . . . . . . . . . . . . . . . . . . . . . 2.6 Incinerators. . . . . . . . . . . . . . . . . . . . . . . . 2.7 References. . . . . . . . . . . . . . . . . . . . . . . . .
3.0 COSTANALYSIS. . . . . . . . . . . . . . . . . . . . . . . . . . 3.1 Introduction. . . . . . . . . . . . . . . . . . . . . . . .
3.1.1 Purpose. . . . . . . . . . . . . . . . . . . . . . . 3.1.2 Scope . . . . . . . . . . . . . . . . . . . . . . . 3.1.3 Use of Model Plants . . . . . . . . . . . . . . . . . 3.1.4 Bases for Capital Cost Estimates . . . . . . . . . . 3.1.5 Bases for Annualized Costs . . . . . . . . . . . . .
3.2 Solvent Emission Control in Metal Coating Operations . . . . 3.2.1 Model Plant Parameters . . . . . . . . . . . . . . . 3.2.2 Control Costs . . . . . . . . . . . . . . . . . . . .
3.3 Cost Effectiveness . . . . . . . . . . . . . . . . . . . . 3.4 Summary . . . . . . . . . . . . . . . . . . . . . . . . . . 3.5 References. . . . . . . . . . . . . . . . . . . . . . . . . 3.6 Bibliography. . . . . . . . . . . . . . . . . . . . . . . .
4.0 DETERMINATION OF APPLICABLE EMISSION LIMITATIONS . . . . . . . . References . . . . . . . . . . . . . . . . . . . . . . . . . . .

5.0 .ADVERSE AND BENEFICIAL EFFECTS OF APPLYING TECHNOLOGY . . . . . . 5-1
5.1 Water-Borne (Spray. Dip. o r Flow Coat) . . . . . . . . . . . 5-1
5.2 Water-Borne ( E l ectrodeposi t i o n ) . . . . . . . . . . . . . . 5-2
5.3 Higher So l i ds Coatings . . . . . . . . . . . . . . . . . . . 5-4
5.4 Powder Coatings . . . . . . . . . . . . . . . . . . . . . . 5-4
5.5 Carbon Adsorpt ion . . . . . . . . . . . . . . . . . . . . . 5-6
5.6 I n c i n e r a t i o n. . . . . . . . . . . . . . . . . . . . . . . . 5-7
5.7 References . . . . . . . . . . . . . . . . . . . . . . . . . 5-11
6.0 MONITORING TECHNIQUES AND ENFORCEMENT ASPECTS . . . . . . . . . . 6-1
APPENDIX A .SAMPLE CALCULATIONS OF CONTROL OPTIONS ;. . . . . . . . A-1
APPENDIX A .Reference . . . . . . . . . . . . . . . . . . . . . . . . A-4
1.0 SOURCES AND TYPES OF EMISSIONS
This chapter provides general information on the mi scel 1aneous metal
parts and products industries, the methods by which conventional coatings
are applied, and the volatile organic compound (VOC) emissions which can be
expected from the coatings.
1.1 GENERAL DISCUSSION
A wide variety of metal parts and products are coated for decorative or
protective purposes. These are grouped into hundreds of small industri a1
categories for which writing individual guideline documents would be
unreasonable. This guideline document is intended to provide information on
industries which coat metal parts and products, with the exception of the can,
coil, magnet wire, automobiles and light duty truck, metal furniture and large appliance
industries. These have been reported previously in "Control of Volatile Organic
Emissions from Existing Stationary Sources - Volumes 11, 111, IV, and V."
The 'industrial categories for which this guideline is intended and some
examples of each category are listed in Table 1.1,
There are far more dissimilarities than similarities between both the many
plants and various industries represented by this category. For example, the
geographic distribution of these industry categories is market-dependent and
varies greatly. Some industries such as large farm machinery are located
primarily in agricultural areas of the country such as EPA Regions V and
VII. Others, like small appliances may be scattered throughout the country
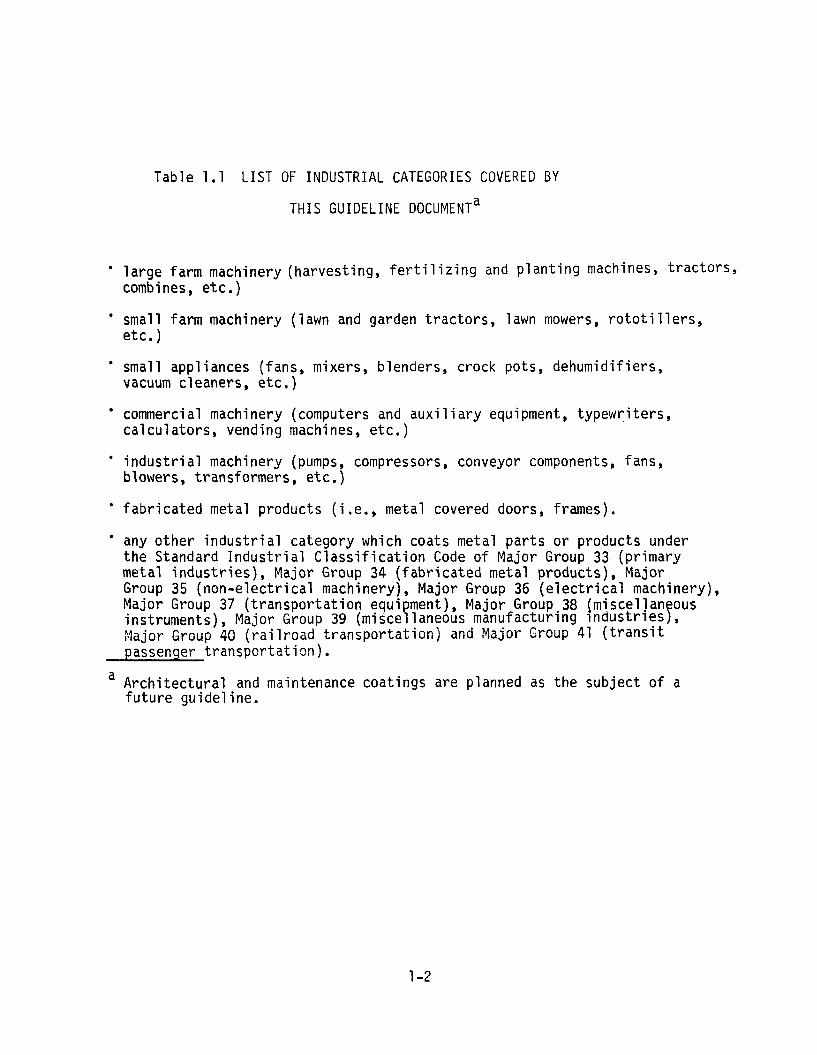
Table 1.1 LIST OF INDUSTRIAL CATEGORIES COVERED BY
large farm machinery (harvesting, ferti 1 izing and planting machines, tractors, combines, etc.)
small farm machinery (lawn and garden tractors, lawn mowers, rototillers, etc.)
ma1 1 appliances (fans, mixers, blenders, crock pots, dehumidifiers, vacuum cleaners, etc. )
commerci a1 machi nery (computers and auxi 1 i ary equipment, typewriters, calculators, vending machines, etc. )
industri a1 machinery (pumps, compressors, conveyor components, fans, blowers, transformers, etc.)
fabricated metal products (i .e., metal covered doors, frames).
any other industrial category which coats metal parts or products under the Standard Industrial Classification Code of Major Group 33 (primary me.ta1 industries), Major Group 34 (fabricated metal products), Major Group 35 (non-electrical machinery), Major Group 36 (electrical machinery), Major Group 37 (transportation equi ment), Major Group.38 (miscel~aneous e instruments), Major Group 39 (misce laneous manufacturing ~ndustr~es), ;.lajor Group 40 (railroad transportation) and Major Group 41 (transit passenger transportat ion).
a Architectural and maintenance coatings are planned as the subject of a future guideline.
although greater numbers of small appliance manufacturers may be located near
large population centers. Within some industries, large variations in
manufacturing techniques and procedures exist. Some facilities manufacture
and coat metal parts, then assemble them to form a final product to be sold
directly for retail. 0thers.often called "job shops", manufacture and coat
products under contract; specifications differ from product to product. The
metal parts are then shipped to the final product manufacturer to be assembled
with othier parts into some product. Such facilities are often located in
the vicinity of the manufacturers for whom they perform this service.
The size of metal coating facilities and their mode of operation varies
not only between industries but also within each industry. Two facilities
coating the same product may apply different coatings using completely different
application methods. The size of the facility is dependent on several things:
number of coating lines, size of parts or products coated, type of coating
operation (i .e., spray, dip, flow or roll coat), and number of coats of paint
applied..
The coatings are a critical constituent of the metal coating industry.
In many cases the coatings must provide esthetic appeal, but in all cases,
they must protect the metal from the atmosphere in which it will be used.
Adverse conditions may include moisture, sunlight, extreme temperature,
abrasion and corrosive chemicals. A wide variety of coatings are applied
by the many industries considered by this document. Both enamels (at about
30-40 volume percent solids) and lacquers (at 10-20 volume percent solids)
are used, although enamels are more common. Coatings are often shipped by
the manufacturer as a concentrate but thinned prior to application. Typical
coatings are a1 kyds, acrylics, epoxies, polyesters, vinyls, si 1icones,

plastisols and phenols.
Most coatings contain several (up to 10) different solvents. Typical
solvents are ketones, esters, alcohols, a1 iphatics, ethers, aromatics and
terpenes. 1.2 PROCESSES AND EMISSION POINTS
Each meta 1 coating line tends to be somewhat unique because of its age,
product coated , design, and application technique. Figure 1.1 portrays
common features found in many coating lines, and the following comments
summarize these features.
Flow diagrams a and b of Figure 1.1 show common methods of applying
coatings on miscellaneous parts and products in both a conveyorized and
batch, oven-baked single coat and two-coat operations. These methods typically
include spray, dip, or flow coating for both single coats and primers.
Spray is usually used for the topcoat.
First the metal substrate is cleansed to remove grease, dust.,mill
scale or corrosion. Often it is pretreated to improve adhesion. The most
common method is the five stage cleansing process where the metal is cleaned
with an aqueous caustic solution, rinsed with water, cleaned with a non-
caustic solution, treated with phosphate and finally rinsed again with
water. Chromate rinses or other pretreatments may also be used. Other
cleaning methods are also used. The parts may be cleaned in a shot-blasting
chamber by using organic solvent cleansers. (See Control of Volati le Organic
Emissions from Solvent Metal Cleaning) The metal often passes through an
oven to remove water before the coating is applied.
Spraying is the more common method of applying coatings, for single coat
operations, but flow coating and dipping are also used. For two coat operations,

the primers are more likely to be applied either by flow or dip coating while
the topcoats are almost always sprayed.
To apply a flow coating, the metal parts are moved by a conveyor through
an enclosed booth. Inside, a series of nozzles (which may be stationary or
may oscillate), located at various angles to the conveyor, shoot out streams
of coating which "flow" over the part. The excess coating drains into a
sink located on the botton of the booth, is filtered and pumped back into a
holding tank for reuse. Flow coating provides about a 90 percent transfer
efficiency. Additional solvents are added to control the viscosity due to
evaporation in the flow coater.
The coated parts are often conveyed through a flashoff tunnel to
evaporate solvent and allow the coating to flow out properly. The flow
coater and flashoff tunnel are often located in a separate room in the facility
and vented either through roof fans or by means of an exhaust system which .
maintains a slight negative pressure to capture the organic vapors. Exhaust
gas flow is maintained at a rate sufficient to keep organic levels below 25
percent of the lower explosive level or lower if necessary to protect the
employees.
One or two color single coat applications or primers for two coat
applications may also be applied by dipping. The metal parts are briefly
immersed either manually or by conveyor into a tank full of coating. The
excess coating is allowed to drip from the part and drain back into the tanks.
This method also provides about 90 percent transfer efficiency of the coating.
The viscosity in dip coating, as on flow coating is very critical. The dip
coating tank and drain board may be completely enclosed in a separate room
and vented through roof fans, or through a ventilation system adjoining the
tank and drain board. The flow rates from such a ventilation system will

- - - - --
depend on the size of the dip tank.
Spraying is the most common technique for applying single coat, some
primer and most topcoat applications. It provides a transfer efficiency of
40 to 70 percent. Electrostatic spraying with disc, bell and other types
of spray equipment are commonly used to increase the transfer efficiency
to 70 to 90 percent. Transfer efficiencies will vary with the part being
coated and if manual, the expertise of the operator. "Touch-up" of assembled
parts is usually performed manually.
Spray coating is performed in a booth to contain overspray, to minimize
contamination, and sometimes to control the atmosphere in which the coating
is applied. The spray booths must be maintained at a slight negative pressure
to capture overspray. Minimum acceptable air quality for spray booths are
prescribed by OSHA.
After coating and flashoff, the parts are baked in single or multi-pass - - -- -_
baking ovens at 150-230'~ (275-450'~). Since the cost of reducing organic -- - --- -- - _ _ _ _ -- -- -emissions in the exhaust stream are proportional to the volume of gas exhausted,
it is important to minimize the infusion of air into the oven. Several factors,
however, must be considered. An inlet air velocity of 15 to 45 mpm (50 to
150 fpm) is required to prevent back convection and escape of emissions.
Since the entry and exit openings are usually sized for the largest parts
that may be baked on the line, this may result in greater oven exhaust rates
than needed to meet 25 percent of the LEL. Dilution air and VOC levels have
a strong effect on air pollution control costs. For example, halving the air
flow doubles the organic concentration and reduces the capital and operating
cost of add-on control equipment. Air curtains may be used at the openings
to sweep the openings and minimize the air volume required to contain the
emissions within the oven.

-- - -
Flow diagram c of Figure 1.1 shows a manual two-coat operation often
used for items such as large industrial, construction, transportation equipment
where the coatings are air or forced air dried. Ovens cannot be used because
these assembled products include heat sensitive materials (i .e., tires,
rubber tubing, plastic parts, etc.). Also, these products are often too
large to be cured in an oven. Other air or forced air dried items include
parts which are too thick or heavy to be cured in an oven and parts where
production dictates that installation of ovens to cure coatings would not be
economically feasible. For many of these items, the coatings must be resistant
to steam cleaning, the outdoor elements as well as the corrosive coastal salt
environment, and to the hazards of oil, gas01 ine, chemical spi 1ls, fertilizer,
moisture and other miscellaneous exposures.
The assembled unit is cleaned to remove dirt, grease, or mill scale.
The unit is usually moved to another room where it is spray coated with a
primer, allowed to dry, spray coated with a topcoat and again allowed to air
or farced air dry. These rooms which may be often as large as 8 x 8 x 18
meters (25 x 25 x 60 feet). A draft fan prevents escape of overspray and
maintains the concentration of organics within the worker safety limits
prescribed by OSHA. Some of these items may even be coated outdoors.
In summary, organic emissions from the coating of miscellaneous metal
parts and products are emitted from the application and flashoff areas-aad
the ovens (if used). For spray and flow coating, the bulk of the VOC is
evaporated in the application and flashoff areas as noted in Table 1.2
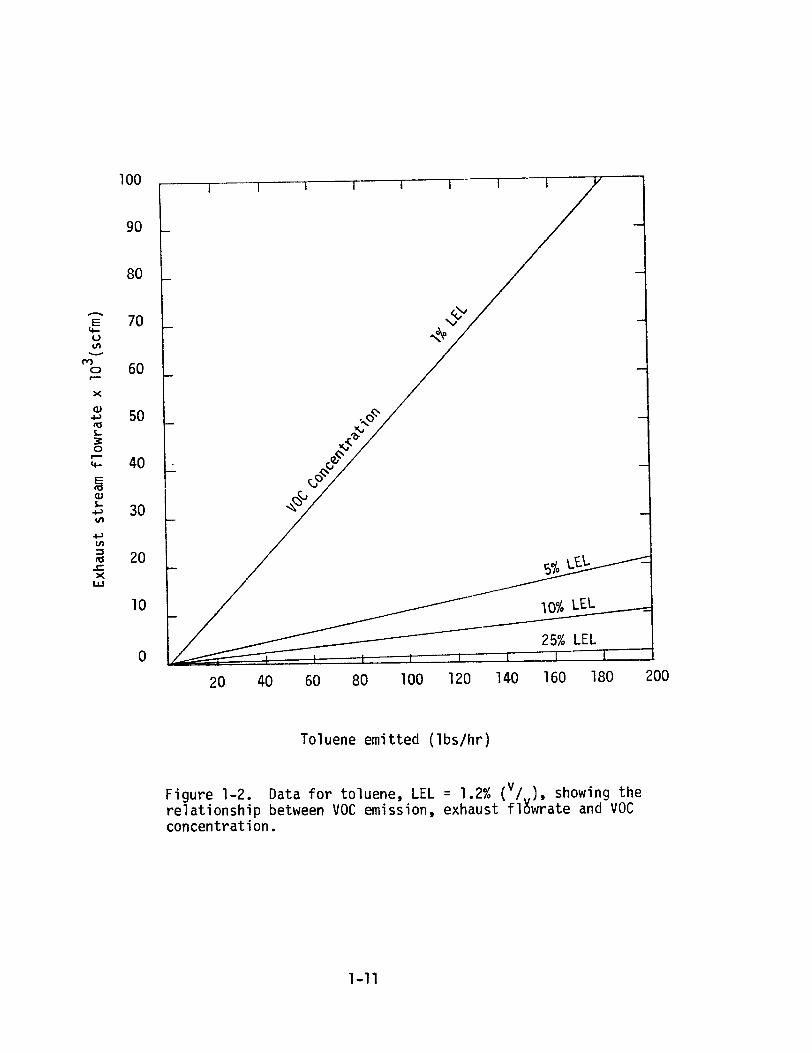
Figure 1.2 displays the relationship between VOC emissions and exhaust
flow rate with isopleths of organic concentration in terms of the LEL. It
emphasizes the effect of solvent concentration on the volume of exhaust gases

that must be treated. Note that if a given coating line evaporates 140
pounds of solvent per hour, the exhaust rate at one percent of the LEL
(80,000 SCFM) is 10 times that of the same stream at 10 percent of the LEL
(8,000SCFM) . Since operating at higher LEL's clearly reduces the exhaust
stream f l o w rate, the related capitol and operational costs of VOC emission
control equipment are reduced.
The flow rates and concentrations are influenced by several factors
including the type of application system and the conditions within the
flashoff area or oven which is the actual source of emissions. Unfortunately,
flow rates are often designed for the most difficult combination of circum-
stances. As a result, the rate may be excess of many items coated on a
specific line and as a result, VOC levels are usually well below 25 percent of
the LEL.

Table 1.2 SOURCE OF VOC FMISSIONS FROM COATING MISCELLANEOUS METAL PARTS AND PRODUCTS
PERCENT OF TOTAL VOC
Application Method Application and Flashoff -Oven
Dip
Flow coat
Spray (oven cured) 20-30
Spray (air dried) not applicable
a~his assumes a coating applied at 25 volume percent solids, 75 percent organic solvent which is equivalent to a VOC emission factor of 0.66 kg of organicsolvent emitted per liter of coating (5.5 lbs/gal) minus water.
25% LEL 0
20 40 60 80 100 120 140 160 180 200
Toluene emitted (lbs/hr)
Figure 1-2. Data for toluene, LEL = 1.2% ("/ ), showing the re1 ationship between VOC emission, exhaust f18wrate and VOC concentration.
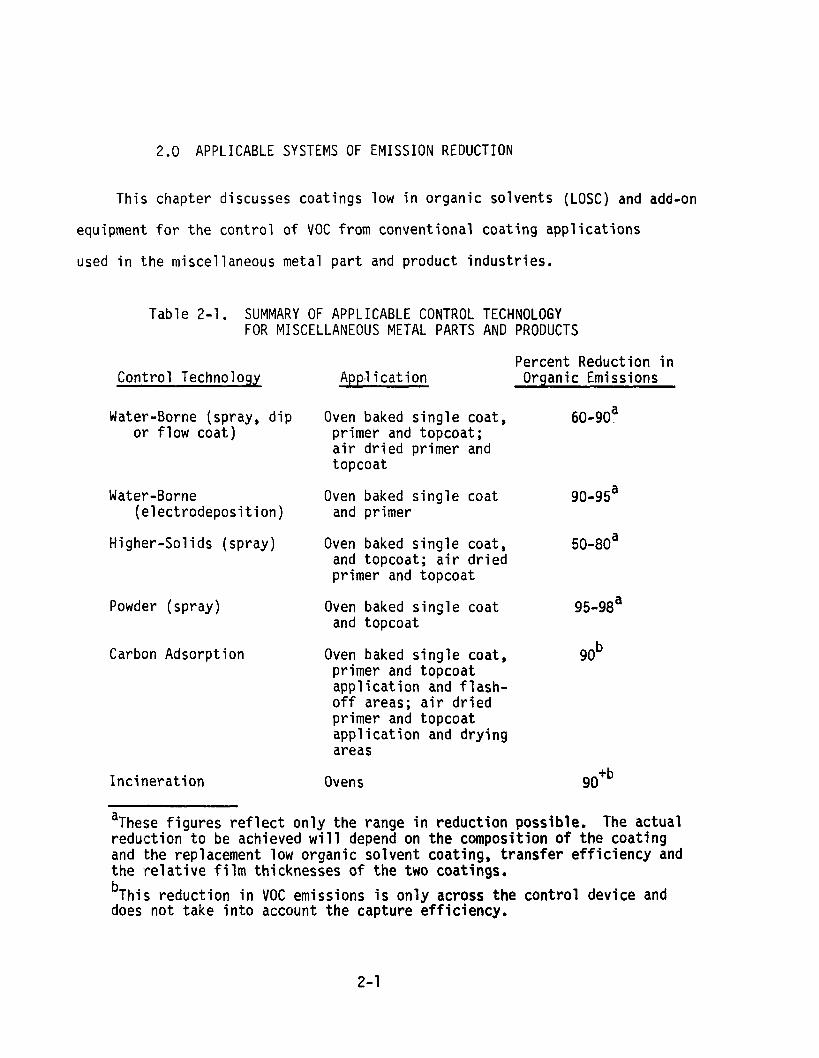
2.0 APPLICABLE SYSTEMS OF E M I S S I O N REDUCTION
This chapter discusses coat ings low i n organic solvents (LOSC) and add-on
equipment f o r t he con t ro l o f VOC from conventional coat ing app l i ca t i ons
used i n t h e miscellaneous metal p a r t and product i ndus t r i es .
Table 2-1. SUMMARY OF APPLICABLE CONTROL TECHNOLOGY FOR MISCELLANEOUS METAL PARTS AND PRODUCTS
Percent Reduction i n Control Technology App.1 i c a t i o n Organic Emissions
Water-Borne (spray, d i p Oven baked s i n g l e coat, 60-90" o r f 1 ow coat ) pr imer and topcoat;
a i r d r i ed pr imer and topcoat
Water-Borne Oven baked s i n g l e coat 90-95a (e lectrodeposi t i o n ) and primer
Higher-Sol i d s (spray) Oven baked s i n g l e coat, 50-8oa and topcoat; a i r d r i e d pr imer and topcoat
Powder (spray) Oven baked s i n g l e coat 95-9ga and topcoat
Carbon Adsorpt ion Oven baked s i n g l e coat, gob pr imer and topcoat a p p l i c a t i o n and f l a s h - o f f areas; a i r d r i e d pr imer and topcoat app l i ca t i on and d ry ing areas
I n c i n e r a t i o n Ovens
a ~ h e s e f i g u r e s r e f l e c t o n l y the range i n reduc t ion possible. The ac tua l reduct ion t o be achieved w i l l depend on t h e composition of t h e coat ing and the replacement low organic solvent coating, t r a n s f e r e f f i c i e n c y and t h e r e l a t i v e f i l m thicknesses o f t h e two coatings.
b ~ h i s reduct ion i n VOC emissions i s o n l y across the c o n t r o l device and does not take i n t o account the capture e f f i c i e n c y .
2.1 WATER-BORNE (SPRAY, D I P OR FLOW COAT) /
The a p p l i c a t i o n o f water-borne coat ings i s s i m i l a r t o organic solvent-
borne coat ings thus conversion t o water-borne coat ings does n o t necessar i l y
r e q u i r e extensive replacement of t he e x i s t i n g coat ing app l i ca t i on equipment.
A reduc t i on o f 60 t o 90 percent i n organic emissions may be achieved by
swi tch ing t o water-borne coat ings. The ac tua l reduct ion, however, w i l l
depend on several var iab les : t he composit ion o f t h e o r i g i n a l organic
solvent-borne coat ing, t he composit ion o f the water-borne coat ing replacement,
re1 a t i v e t r a n s f e r e f f i c i e n c i e s , and the re1 a t i v e f il m thicknesses requi red.
The t r a n s f e r e f f i c i e n c y o f water-borne coat ings i s s i m i l a r t o t h a t of
convent ional coat ings. A1 though water i s t he major c a r r i e r , some organic
so lvents must be inc luded t o temper t h e evaporat ion r a t e , p rov ide the coat ing
w i t h t h e des i red proper t ies , and prov ide f i l m coalescence. Some small
appl iance manufacturers have converted t h e i r e l e c t r o s t a t i c spray and d i p
coat ing 1 ines t o apply water-bornes .' Water-borne coat ings are now being
app l ied on some farm machinery, on fabr ica ted metal products and commercial
machinery by f low coat ing, dipping, and both e l e c t r o s t a t i c and convent ional
spraying methods. 2
Fur ther t echn ica l d e t a i l s on t h e use o f water-borne coat ings may be
found i n Volume I , Sections 3.3.1 and 3.3.5.'
2.2 WATER-BORNE (ELECTRODEPOSITION)
Although conver t ing t o e lec t rodepos i ted water-borne coat ings w i 11 requ i r e
new a p p l i c a t i o n equipment ( i .e., tank, u l t r a f i l t e r , r i n s i n g s ta t i ons , etc . ) ,
i t r e s u l t s i n increased cor ros ion p r o t e c t i o n and can depos i t t h i n coat ings
un i fo rm ly a t g rea ter t r a n s f e r e f f i c i e n c y (about 99 percent) than any o ther
a p p l i c a t i o n system. Elect rodeposi ted coat ings may be app l ied a t 0.3 t o 1.2 m i l s
thickness, and f i l m th ickness may be adjusted by vo l tage and immersion time.
Farm and commercial machinery, and fabricated metal product facilities have
been reported to apply coatings by electrodeposition. 4' One major advantage of water-borne coatings is that, unlike sol vent-borne
coatings, the pretreatment dry-off oven may no longer be required. After an
additional rinse with deionized water, the parts are subsequently grounded and
immersed into the coating bath which may contain from 8 to 15 volume percent
solids, 2 to 4 volume percent organic solvent, and the balance deionized water.
An electrical potential causes the suspended solids to migrate and adhere to
the part. (Coatings are available for application by either anodic or cathodic
electrodeposition.) As the coated parts emerge from the bath, the coating is
primarily solids with some water and trace quantities of organic solvent. These
solvents control the flow of the coating during the curing process. The parts are
then rinsed in several stages to remove any excess paint. (The rinse is then
ultrafiltered to remove the water and organics. The paint solids are returned
to the bath.)
A complicating factor in determining the emission factor for electrodeposition
is the very limited information now available on the final disposition of organic
solvent. If the emission factor considers only the coating applied to the metal
substrate (which would be emitted from the oven), it is only about 0.024 to 0.06 ka/liter
(minus water). This factor does not consider any organic emissions which may occur
from the tank or the rinsing stages. If the emission factor is based on the bath
composition, it is much greater (i .e., .31 to -38 kg/liter minus water). This
factor, however, does not consider the effect of solvent recycled to the bath
or purged from the system. It appears that the methods by which ultrafilter
residue is treated and how the coatings are replenished in the bath vary
considerably from coater to coater. A conservative emission factor for
electrodeposited coatings is 0.36 kg/liter less water. Certainly, however, with

---
effect of improved transfer efficiency included, use of electrodeposi ted coatings
can reduce VOC emissions by at least 90 to 95 percent over conventional coatings.
El ectrodeposi ted coatings are normal ly baked at 150-200'~ (257-400'~) . Research is currently underway to eliminate the intermediate baking step now
used to cure electrodeposi ted primers prior to topcoat application.
Both the primer and topcoat would be baked as a one-coat system. This would
provide attendant savings in capital and operating costs and fuel requirements.
For further technical detai 1s on the use of electrodeposi tion coating
technology, see Volume I, Section 3.3.1. 5
2.3 HIlGHER-SOLIDS COATINGS
The reduction in volatile organic emissions achievable by converting to
coatings which contain higher solids ranges from 50 to 80 percent. Coatings with
45 to 60 volume percent solids are currently being applied with spray or roll
coating technology, Coatings with even greater solids content (60to 80 volume
percent) are making inroads due to the development of new spray application
technologies. Research is underway on higher solids coatings which will cure at
ambient temperatures. These will be very attractive for applications such as
large farm and industrial machinery.
Higher-solids coatings can be applied by roll coating, or by spraying, either
with automated electrostatic techniques, or manually. The first two are the
more efficient application methods. Due to the higher viscosity of high-solids
coatings, additional mechanical, thermal or electrical energy may be necessary
for pumping and adequate atomization.6 Transfer efficiencies with high-solids
coatings are often better than with conventional sol ids coatings particularly
with electrostatic sprays. 7
Further technical details on the use of high-solids coatings may be
found in Volume I , Section 3.3.2. 8

2.4 POWDER COATINGS
Powder coatings have been sprayed as a single coat on small
appl, iances, small farm machinery, fabricated metal product parts, and
industrial machinery component parts.9 Powders can be applied by *
electrostatic spraying at thicknesses from 0.9 to 5 mils, and thicknesses
of much less than 1 mil have been achieved on experimental interior
can lines. Powder coatings are also applied by dipping but the resultant
film is much thicker, a minimum of about 6 mi 1s. After application
of the coating, the metal part is moved to an oven where the powder
par,ticles melt and flow to form a continuous, solid film. Powders
are essentially 100 percent solids, but they can release about 0.5 -3.5 weight percent of volatile organic compounds due to unblocking
and cross1 inking reactions during the curing process. 10
Powder coatings are applied by electrostatic spray with almost
the same technique used for solvent-borne coatings , a1 though different equipment must be used. Film thickness can be controlled by the
voltage potential. Powder coatings wrap around edges of complicated
metal parts and are self-leveling on flat parts, but do not (as some
of the 1 iquid counterparts also do not) coat small recesses we1 1.
Depending on the application, this could be an advantage or disadvantage.
This problem may be reduced or eliminated by preheating the parts, but
may result in a thicker film.
Powder coatings may be applied in smaller spray booths than
the ones used for conventional coatings. As a result, the air require-
ments necessary for proper ventilation may be greatly reduced. Use
of powders may not only conserve space but may also reduce the energy &At least one f i r m has one year of production experience applying a coating thickness of 1 mil. Because thicker films are more common, the cost estimates in Chapter 3 are based on coating thicknesses of 2 )mils.

required to heat the spray booth make-up air during the winter months.
Changing colors when applying powder coatings requires slightly
more time than conventional coatings since any color contamination
does not blend. If the operator tries to segregate the overspray color
in order to recycle it, the booth and recovery unit should be cleaned
thoroughly to avoid color contamination. This will require greater downtime.
Two methods have evolved for minimizing the time required to
change colors. Some facilities have several overspray recovery
units available that may easily be attached to a single spray booth.
Others have instal led several mobile spray booths and associated
recovery equipment1' to minimize the number of changeovers that must
be made. Still another approach has been to use the multicolored
overspray on parts that do not have critical color specifications.
A1 though curing temperatures, 170' to 230'~ (275-450'~) are often
higher than with conventional coatings, powders do not require a
flashoff zone, the air flow from the ovens may be reduced since no
solvent is present. Further technical details on the application of
powder coatings may be found in Volume I, Sections 3.3.3 and 3.3 .5 . 12
2.5 CARBON ADSORPTION
As discussed in Chapter 1, at least one-half of the volatile
organic compounds from coating miscellaneous metal products is emitted
from the application and flashoff areas. The remainder is emitted
from the ovens. The use of carbon adsorption to collect the emissions
from the application and flashoff areas can reduce those emissions by
90 percent across the adsorber . Carbon adsorption is considered a viable control option for these
areas although there are no known installations in facilities that coat
mi scel 1aneous metal parts or products. Carbon adsorption is technical ly
feasible for these applications13 (no new inventions are required for
its implementation), but pilot studies may be necessary before this
control technology is instal led.
The requisite size of a carbon adsorption unit is dependent on
the exhaust flow rate, organic concentration, and the desorption
period. Design parameters vary with each application because of the
variety of metal parts coated and coatings used. About 95 percent
effic,iency reportedly is effected by dry filters or by water or oil
wash curtains14 Additional particulate removal may be necessary.
however, if the remaining 5 percent is significant enough to render
the bed inefficient.
Flashoff areas have to be enclosed to maximize capture of the
vola.tile organic emissions. The flow rates and VOC concentrations
depend on the configuration of the coating line and the "tightness"
of the enclosure. If the coating application areas are located on
the first floor of the plant, for example, and the ovens are mounted
on the roof, it may be difficult and expensive to try to contain the
VOC that flashes off as the substrate traverses from the applicator
to the oven. In other cases the application areas may be located
near the oven where enclosing the flashoff areas would be less difficult.
In some situations, the exhaust system on an oven will draw the solvent-
laden air from the flashoff areas into the oven.
Further technical details on the use of carbon adsorption may be
found in Volume I, Section 3.2.1. 15
- -
2.6 INCINERATORS
Incinerators are the most universally applicable control system
for VOC. There are no serious technical problems associated with the
use of either catalytic or noncatalytic incinerators on miscellaneous
metal product coating facilities. Incinerator heat recovery efficiencies
have improved and operating costs have been reduced significantly
in recent years.
Incineration systems may be more desirable ( less costly and
perhaps more efficient) than adsorption for reducing VOC emissions
from the baking ovens for several reasons:
1. No cooling system is required. High temperature (150' to
230'~) exhaust gases have to be cooled to 40°C or lower before
entering a carbon bed.
2 . VOC in the exhaust stream can provide appreciable heat energy
eg. 350'~ at 25 percent of the LEL. Thus at significant VOC levels,
auxiliary fuel use can be minimized or sometimes even eliminated by
the proper use of heat exchangers.
3. Particulate and condensible matter from volatilization and/or
degradation of resins, may coat the carbon bed. These materials will
not affect an incinerator.
It is desirable but not always feasible to incorporate secondary
heat recovery systems to minimize fuel consumption and overall operating
costs. Waste heat may be recovered for use in many process areas; for
example, cleansing and pretreatment sections, the ovens, and for space
heating during the colder months.
Incineration of the exhaust from application and f lashoff areas

i s certainly technical 1y feasible, Its economic practicality may
depend on minimizing the volume to be burned and recovering sufficient
heat to keep fuel consumption at an acceptable level.
Further technical details on the use of incineration may be found
in Volume I, Section 3.2.2. 16

2.7 REFERENCES
1. Gallagher, V. N., Environmental Protection Agency, Research Triangle Park, North Carolina, Reports of trips to small appliance facilities in 1976.
2. Springborn Laboratories, Inc. (formerly DeBell and Richardson, Inc.), Trip reports Nos. 18, 21, 69, 135, 142, 143, and 144. General Surface Coating Study under contract by EPA No. 68-02-2075.
3. OAQPS Guidelines - "Control of Volatile Organic Emissions from Existing Stationary Sources - Volume I: Control Methods for Surface Coating Operations," EPA-450/2-76-028, November, 1976.
4. Springborn Laboratories, Inc., Trip report No. 22, 87, 135. General Surface Coating Study under contract No. 68-02-2075.
5. OAQPS Guidelines - Volume I, Op. Cit.
6. DeYittorio, J. M., Ransburg Corporation, Application Equipment for High- Solids and Plural Component Coatings, Volume I, No. 2, April, 1976.
7. LeBras, L. R . , PPG Industries, Pittsburgh, Pennsylvania, Letter to V . Gallagher in comnent to draft of Volume 111, letter dated September 22, 1977.
8. OAQPS Guidelines - Volume I, Op. Cit.
9. Springborn Laboratories, Inc., Trip report No. 48, 88, 95, 98, 122, 123. Genera1 Surface Coating study under contract by EPA, No. 68-02-2075.
10. Ccrle, Gordon E., Jr., Associationfor Finishing Processes of SME. Letter to Vera N. Gallagher in comment to the draft of this document, letter dated April 18, 1978.
1 Springborn Laboratories, Op. Cit.,reference 9.
12. OHQPS Guidelines - Volume I, Op. Cit.
13. Johnson, W. J., General Motors Corporation, Warren, Michigan. Letter to Radian Corporation commenting on "Evaluation of a Carbon Adsorption -Incineration Control System for Auto Assembly Plants," EPA Contract No. 68-02-1319, Task No, 46, January, 1976, dated March 12, 1976.
14. Johnson, W. J., General Motors Corporation, Warren, Michigan. Letter to James McCarthy dated August 13, 1976.
15. OAQPS Guidelines - Volume I, Op, Cit.
16. Ibid.
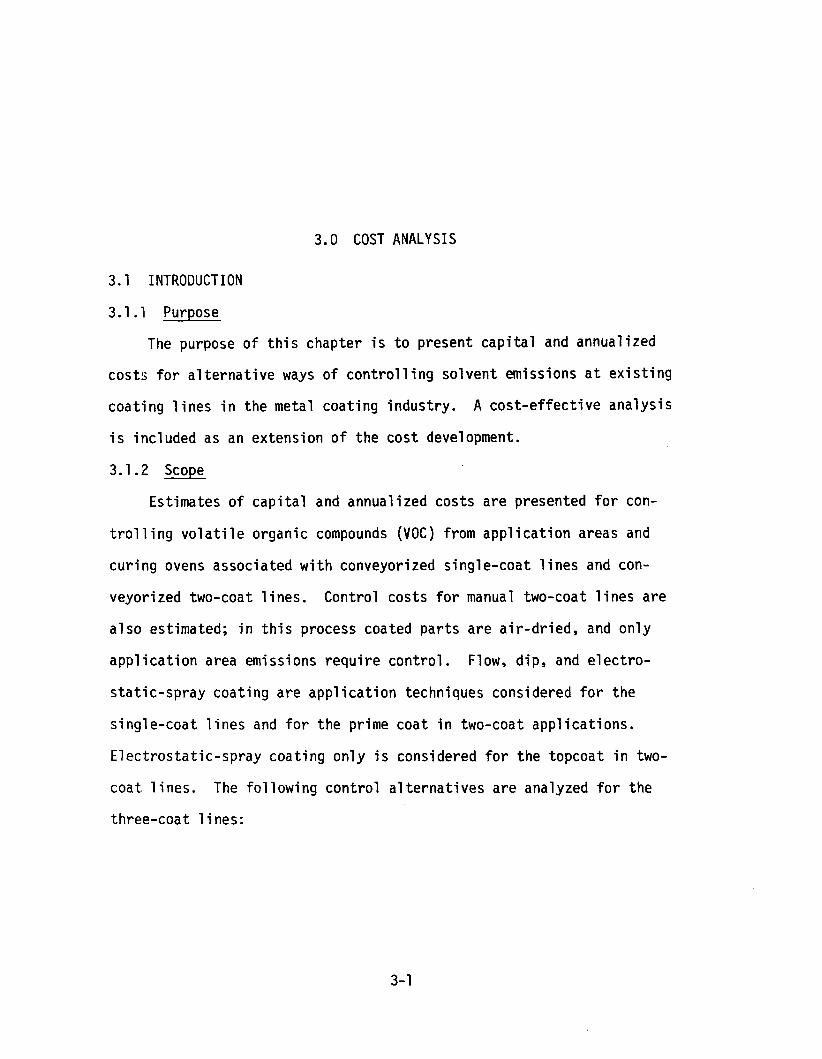
3.0 COST ANALYSIS
3.1 INTRODUCTION
3.1 .I Purpose
The purpose of this chapter is to present capital and annualized
costs for a1 ternative ways of control 1 ing solvent emissions at existing
coating lines in the metal coating industry. A cost-effective analysis
is included as an extension of the cost development.
3.1.2 Scope
Estimates of capital and annualized costs are presented for con-
trol 1 ing volatile organic compounds (VOC) from application areas and
curing ovens associated with conveyorized single-coat lines and con-
veyorized two-coat lines. Control costs for manual two-coat lines are
also estimated; in this process coated parts are air-dried, and only
application area emissions require control. Flow, dip, and electro-
static-spray coating are application techniques considered for the
single-coat lines and for the prime coat in two-coat applications.
Electrostatic-spray coating only is considered for the topcoat in two-
coat lines. The following control alternatives are analyzed for the
three-coat lines:
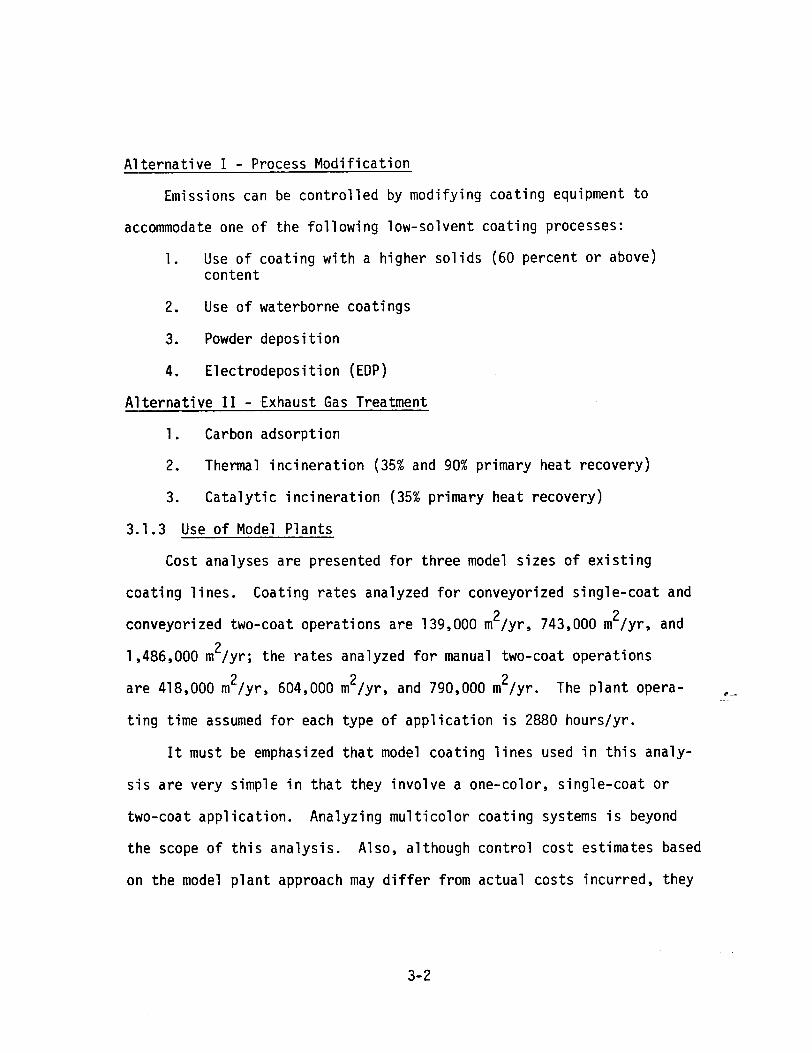
A1 t e r n a t i v e I - Process M o d i f i c a t i o n -
Emissions can be c o n t r o l l e d by modi fy ing coat ing equipment t o
ac.commodate one o f the f o l l o w i n g low-solvent coat ing processes:
1. Use o f coat ing w i t h a h igher so l i d s (60 percent o r above) content
2. Use o f waterborne coat ings
3. Powder depos ition
4. Electrodeposi t i o n (EDP)
A1 t e r n a t i v e I 1 - Exhaust Gas Treatment
1. Carbon adsorp t ion
2. Thermal i n c i n e r a t i o n (35% and 90% pr imary heat recovery)
3. C a t a l y t i c i n c i n e r a t i o n (35% pr imary heat recovery)
Use o f Model P lan ts
Cost analyses a re presented f o r th ree model s izes o f e x i s t i n g
coa t i ng 1 ines. Coating r a t e s analyzed f o r conveyori zed s i ng l e-coat and
2conveyorized two-coat operat ions a r e 139,000 m 2/yr, 743,000 m /y r , and
21,486,000 rn /yr; the r a t e s analyzed f o r manual two-coat operat ions
2 2 2a re 418,000 m /yr, 604,000 m /yr, and 790,000 m / y r . The p l a n t opera- ,-.-
t i n g t ime assumed f o r each type o f a p p l i c a t i o n i s 2880 hours/yr.
It must be emphasized t h a t model coat ing l i n e s used i n t h i s analy-
s i s a r e very simple i n t h a t they i n v o l v e a one-color, s ing le -coat o r
two-coat app l i ca t i on . Analyzing m u l t i c o l o r coat ing systems i s beyond
the scope of t h i s ana lys is . Also, a l though c o n t r o l c o s t est imates based
on the model p l a n t approach may d i f f e r from ac tua l cos ts incurred, they

are nevertheless considered the best means o f comparing r e l a t i v e costs
and cos t e f fec t iveness o f a l t e r n a t i v e con t ro l measures.
3.1.4 Bases f o r Cap i ta l Cost Estimates
Cap i ta l costs represent the investment requ i red f o r r e t r o f i t t i n g a
con t ro l system, i nc lud ing costs o f equipment, mater ia l , l abo r f o r i n -
s t a l l a t i o n , and o ther associated costs. Cap i ta l cos t estimates are
based on cos t surveys o f var ious i n s t a l l a t i o n s presented i n the re f -
erences (1, 2). Most o f the surveyed costs represent new i n s t a l l a t i o n s .
These costs have been modi f ied t o apply t o r e t r o f i t i n s t a l l a t i o n s .
A l l c a p i t a l costs are expressed i n mid-1977 d o l l a r s . I n a d d i t i o n
t o basic con t ro l equipment, c a p i t a l costs inc lude a u x i l i a r y equipment
such as hoods, ducts, etc., as we l l as i n d i r e c t expenses such as con-
t ingencies, con t rac to r ' s fee, and taxes.
3.1.5 Bases f o r Annualized Costs
Annualized costs represent the cos t o f operat ing and main ta in ing
t h e c o n t r o l system and t h a t of recover ing the c a p i t a l investment.
Operating costs inc lude costs f o r mater ia ls , u t i l i t i e s , and normal
maintenance. Net annualized costs f o r process changes, i.e., l i n e con-
versions, a re incremental costs incur red i n conver t ing from high-solvent
t o 1 ow-sol vent coat ings. The bases f o r these pro jec ted incremental
cos ts a re a v a i l a b l e i n t h e referenced mate r ia l (1, 2). Again, i t must
be emphasized t h a t these analyses o f model coat ing l i n e s are provided as
a means of comparing the r e l a t i v e costs o f a l t e r n a t i v e con t ro l measures.
Various coat ing i n d u s t r i e s have devoted considerable resources t o the
development of incremental costs of low-sol vent coat ing conversions.

However, a comparison of these estimates may show a wide variation due
to differences in some key assumptions. Specifically, coating material
costs appear to have the greatest impact on annual costs. Differences
in coating thickness requirements, transfer efficiencies, raw material
costs, and coating specifications wi11 inf1uence these incremental
costs.
General cost factors used to estimate annualized costs for model
coating lines are provided in Tab 1e 3-1.
3.2. SOLVENT EMISSION CONTROL IN METAL COATING OPERATIONS
3.2.1 Model Plant Parameters
Table 3-2 presents technical parameters for the model sizes selec-
ted. The estimated exhaust flow rates are based on solvent usage in
the operation; and the estimated solvent coatings thickness and trans-
fer efficiencies are based on typical practice.
Add-on control systems can provide overall emi ssion control effi -ciencies of the order of 80 to 90 percent. Separate control systems are
assumed for appl ication/flash-off areas and drying ovens. Emission
control efficiencies for process modifications range from 70 to 99
percent (3, 4), depending on the type of coating selected.
The cost analysis is based solely on model sizes. Generally no
consideration has been given to detailed design characteristics of the
model lines in terms of process equipment requirements, line speed, etc.
However, it was necessary to consider gas flow rate, required dry coating
thickness, and coating transfer efficiencies to estimate capital and
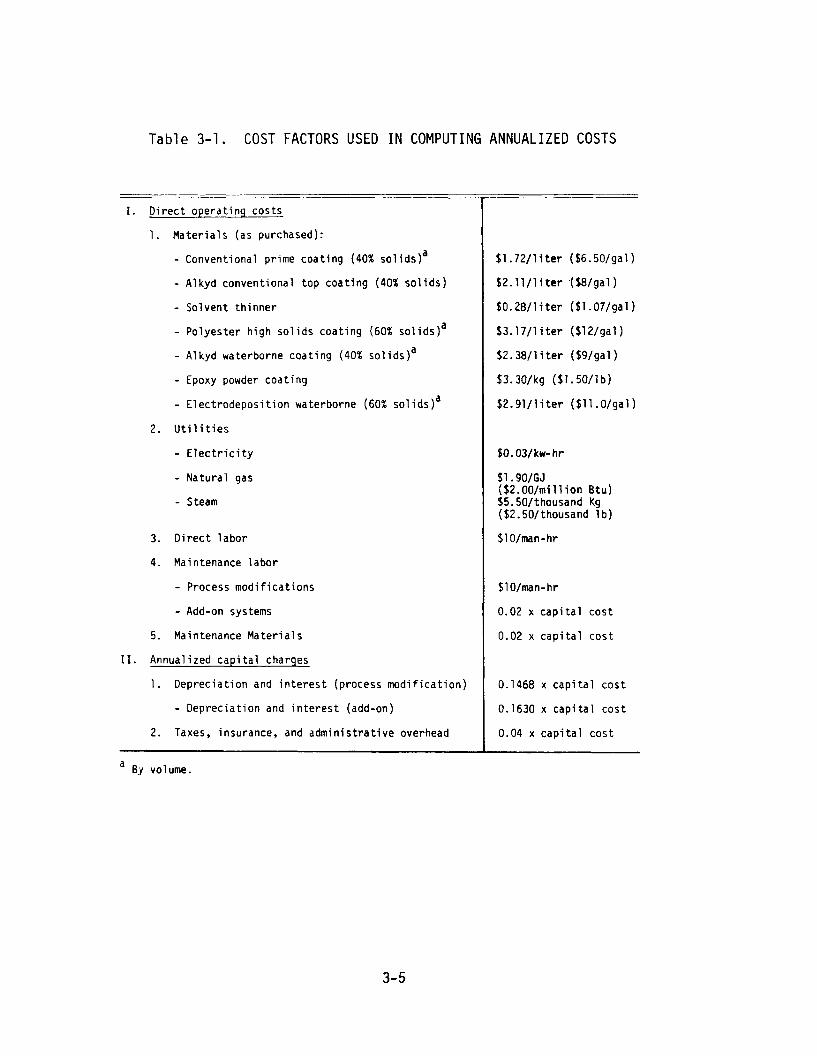
Table 3-1. COST FACTORS USED IN COMPUTING ANNUALIZED COSTS
-I. D i r e c t operat ing costs
1. M a t e r i a l s (as purchased):
- Conventional prime coa t ing (40% so l i d s ) a
- Alkyd conventional top coa t ing (40% s o l i d s )
- Solvent th inner
- Polyester h igh so l i d s coa t ing (60% solid^)^
- Alkyd waterborne coa t ing (40% solid^)^
- Epoxy powder coa t ing
- Electrodeposi t i o n waterborne (60% sol i d s ) a
2. U t i l i t i e s
- E l e c t r i c i t y
- Natura l gas
- Steam
3. D i r e c t l abor
4. Maintenance l a b o r
- Process mod i f i ca t ions
- Add-on systems
5. Maintenance M a t e r i a l s
11. Annualized c a p i t a l charges
1. Deprec iat ion and i n t e r e s t (process m o d i f i c a t i o n )
- Deprec iat ion and i n t e r e s t (add-on)
2. Taxes, insurance, and a d m i n i s t r a t i v e overhead
a BY volume.
$1.72/l it e r (S6.501gal)
$2.1111 i t e r ($8/gal )
$ 0 . 2 8 / l i t e r ($1 .O7/gal)
$3.17/1 it e r ($12/ga1)
$2.38/1 it e r ($9 /ga l )
$3.30/kg ($1.5011 b )
$2.9 l / l it e r ($1 1 .O/gal )
$0.03/kw-hr
$1.9O/GJ ($2.00/mil l i o n Btu) $5.50/thousand ($2.50/thousand
$1 O/man-hr
$1 O/man-hr
0.02 x c a p i t a l
0.02 x c a p i t a l
Kg 1b )
cos t
cos t
0.1468 x c a p i t a l cos t
0.1630 x c a p i t a l cos t
0.04 x c a p i t a l cos t

T a b 1e 3-2. TECHNICAL PARAMETERS FOR MODEL COATING L INES
Conveyorized s ing le -coa t and two-coat opera t ion
L i n e size, m2/yr ( f t 2/yr) 139,000 (1.500,000)
Exhaust r a t e , Nm3/sec (scfm)
- Flow coa t booth
- Flow coa t oven
- D ip coa t booth
- D ip coa t oven
- Spray coa t booth
- Spray coa t oven
Manual two-coat operat ion
2 2L ine s ize , m I y r ( f t l y r )
3Exhaust r a t e , Nm Isec (scfm)
- Prime coa t booth 28.55 (60,500)
- Top coa t booth 28.55 (60,500)
Process conversion data
Dry coa t ing thickness, wn ( m i l s ) / c o a t Transfer e f f i c i e n c y , %a
- Conventional so l vent 25 (1 ) 8ob
- High s o l i d s so lvents 30 (1.2) 80
- Powder depos i t i on 50 ( 2 ) 9 5
- EDP 18 (0.7) 9 5
- Waterborne so lvents 25 ( 1 ) 80 -gob
a Reference 3.
80 percent f a r spray coat ing, 90 percent f o r d i p and f low coat ings.
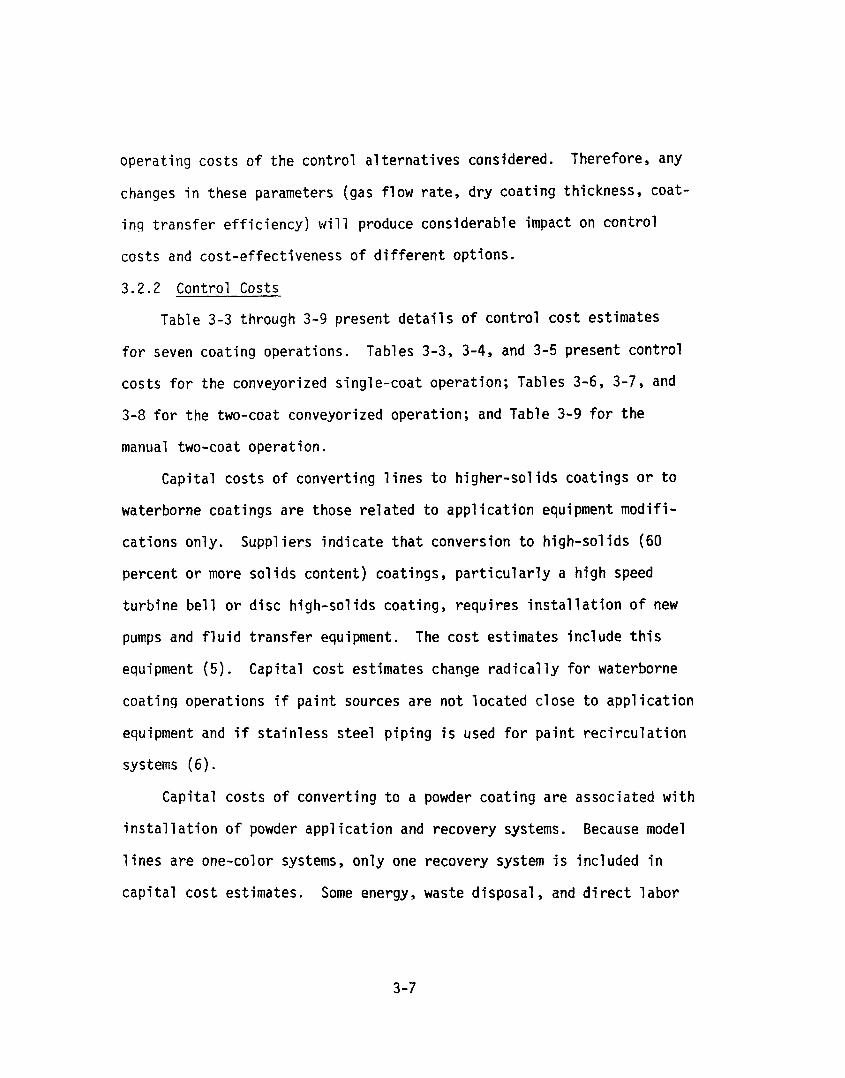
operating costs of the control a1 ternatives considered. Therefore, any
changes in these parameters (gas flow rate, dry coating thickness, coat-
i ng transfer efficiency) will produce considerable impact on control
costs and cost-effectiveness of different options.
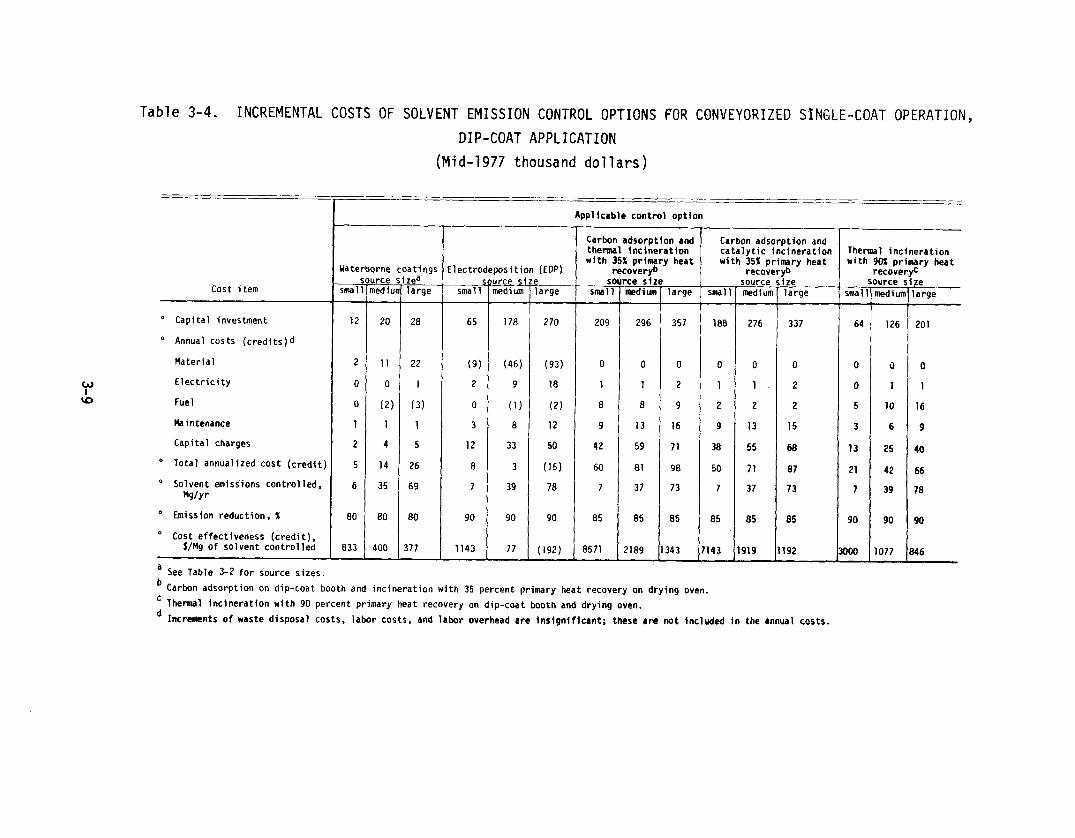
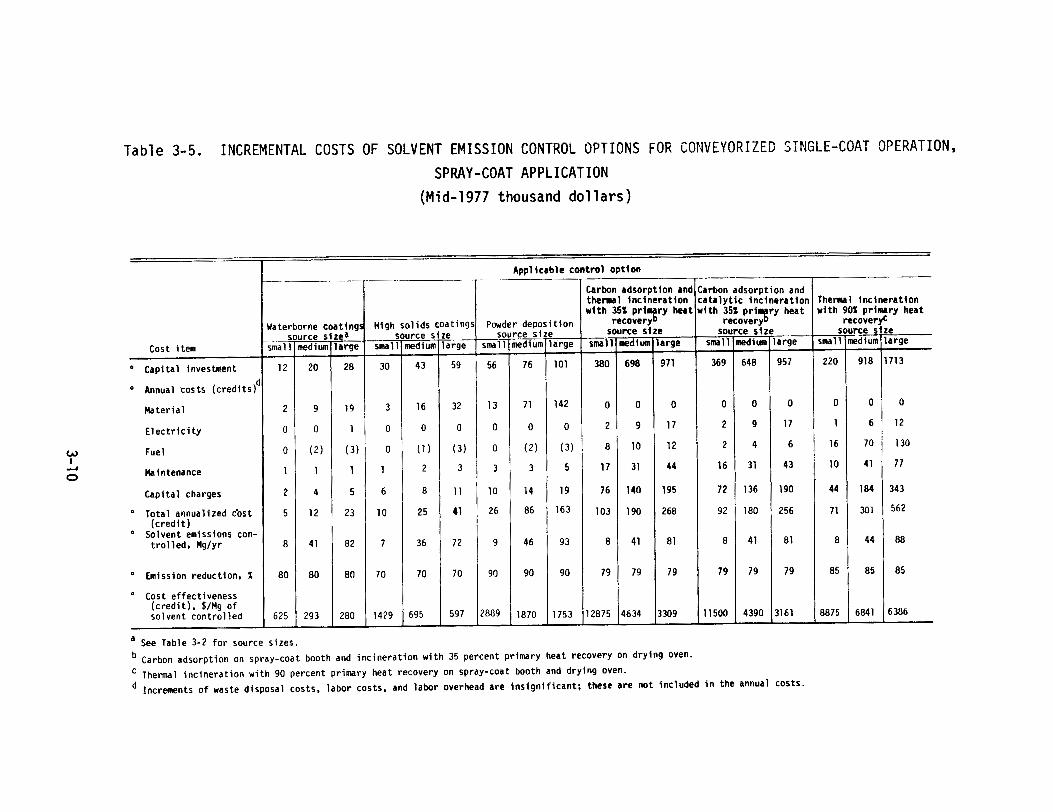
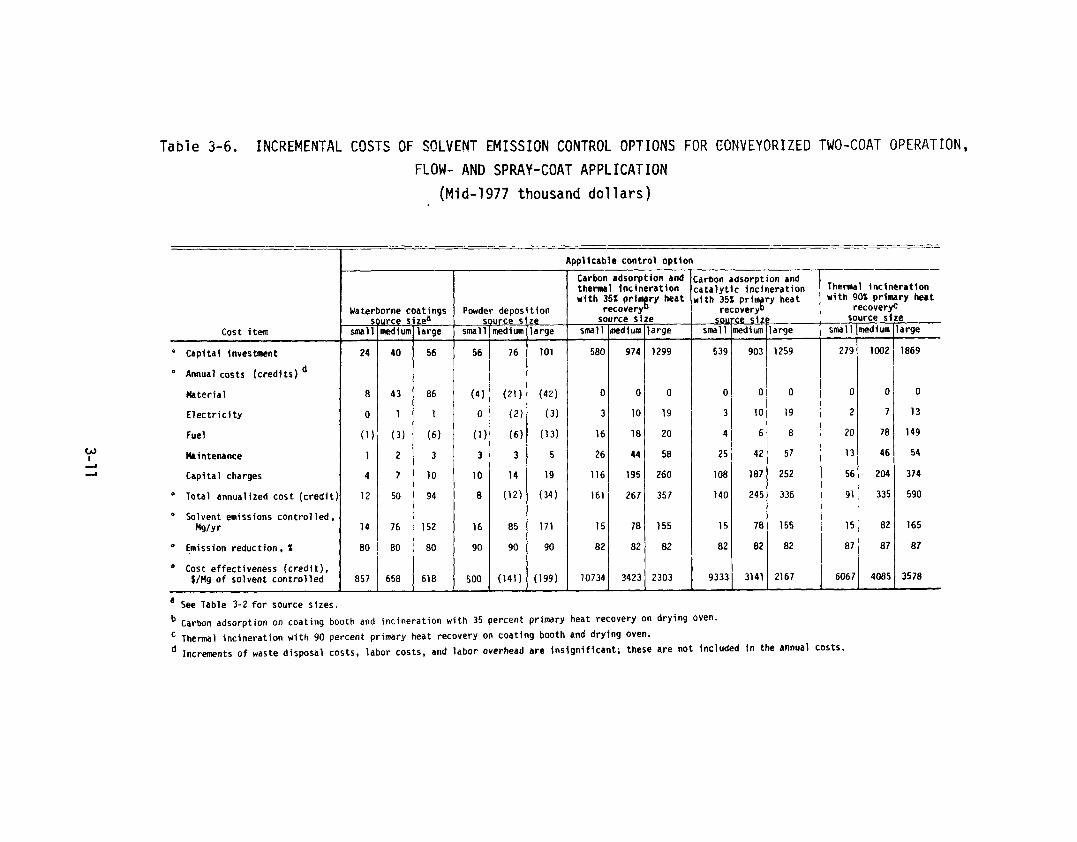
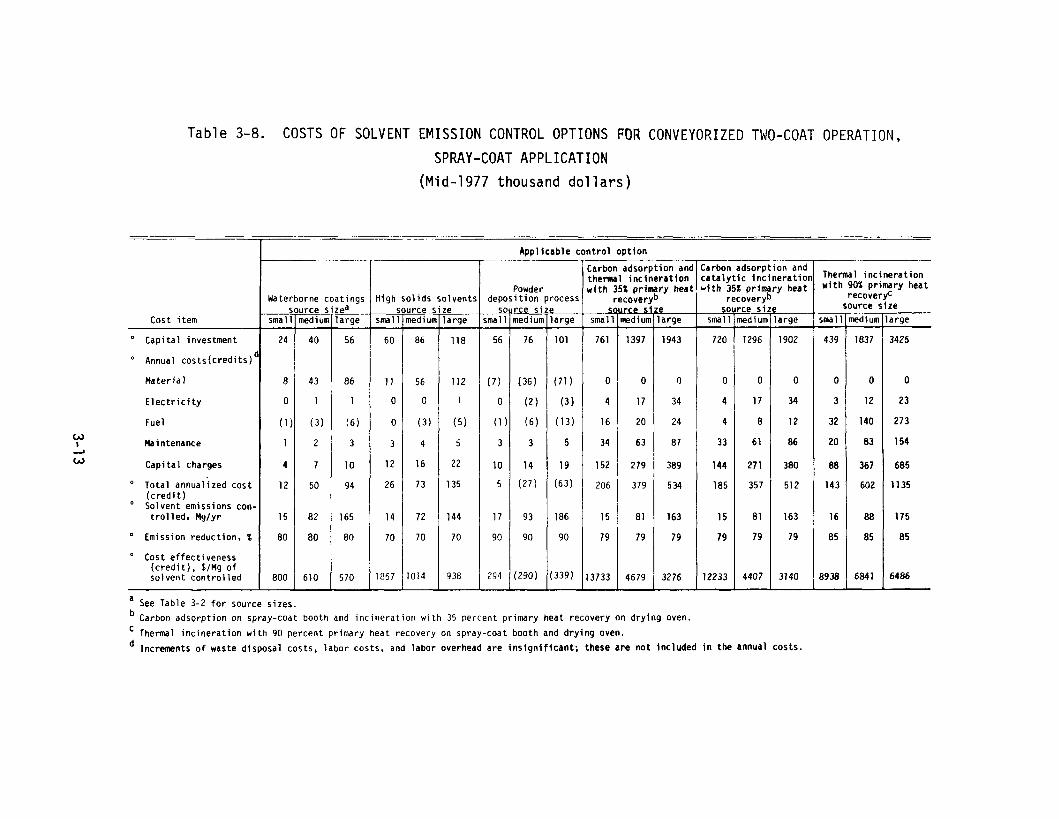
3.2.2 Control Costs
Table 3-3 through 3-9 present details of control cost estimates
for seven coating operations. Tables 3-3, 3-4, and 3-5 present control
costs for the conveyorized single-coat operation; Tables 3-6, 3-7, and
3-8 for the two-coat conveyorized operation; and Table 3-9 for the
manual two-coat operat ion.
Capital costs of converting 1 ines to higher-sol ids coatings or to
waterborne coatings are those re1 ated to appl i cation equipment modif i-
cations only. Suppliers indicate that conversion to high-solids (60
percent or more sol ids content) coatings, particularly a high speed
turbine be1 1 or disc high-sol ids coating, requires instal lation of new
pumps and fluid transfer equipment. The cost estimates include this
equipment (5). Capital cost estimates change radical ly for waterborne
coating operations if paint sources are not located close to application
equipment and if stainless steel piping is used for paint recirculation
systems (6).
Capital costs of converting to a powder coating are associated with
installation of powder application and recovery systems. Because model
lines are one-color systems, only one recovery system is included in
capital cost estimates. Some energy, waste disposal , and direct 1 abor

0
. u c a w - > u O 5 F c. '2 u w L C . m 0 C
al al h W * L O W w x > 0) u 0 C U .- .- al 2,- L L C
D m u U m v - al C'C s .u '-
h S m L o - O * 2 2 . 5 n u w 4 L u - 0 4 t U w 1 u u 3 m L 0 Y a - s P C L m c > m o o r U L h k .r w n 3 > m 0 - C U
2 z 2 0 1 m r L m w a l * C x u .r * z 2 z '- 2 L v - 0 c L n m n m
7
--
--
--
Table 3-4. INCREMENTAL COSTS OF SOLVENT EMISS ION CONTROL OPTIONS FOR CONVEYORIZED SINGLE-COAT OPERATION,
DIP-COAT APPL ICAT ION
(Mid-1977 thousand dollars)
Appl i cab le con t ro l op t ion
Cost itern
Waterborne
ned iu--sma 1 -
)sting!Lea large-
Electrodeposi t ion (EOP) KElx nediurn-
:-large
A
small
rdsorpt ion and inc inera t ion
C primary heat :overyb
Carbo~ t h e y w i t h .
I Sf
Small a mediun -large
Carbon adsorption and c a t a l y t i c inc inera t ion w i t h 35% primary heat
crybrecovr
mediurn Ize large
Thermal inc inera t ion w i t h 90% primary heat
recover# ze large
urce-rediur-
-sma 1 -- -
" Capital investment 12 20 28 65 178 64 126
" Annual costs ( c r e d i t s ) d
Mater ia l 2 11 22 (9) (46) 0 0
E l e c t r i c i t y 0 0 1 2 9 0 1
Fuel 0 (2) (3 ) 0 (1) 5 10
Maintenance 1 1 1 3 8 3 6
Capital charges 2 4 5 12 33 13 25
' Total annualized cost ( c r e d i t ] 5 14 26 8 3 21 42 O Solvent emissions contro l led.
WYr 6 35 69 7 39 7 39
O Emission reduction. X 80 80 80 90 90 90 90
Cost ef fect iveness ( c r e d i t ) , $/Mg o f so lvent con t ro l l e d 833 400 377- 1143 77- DO0 077-
a See Table 3-2 f o r source sizes.
Carbon adsorption on dip-coat booth and inc inera t ion w i t h 35 percent primary heat recovery on d ry ing oven.
Thermal inc inera t ion w i t h 90 percent primary heat recovery on d ip-coat booth and dry ing oven.
* I n c r m n t s o f waste disposal costs, labor costs, and labor overhead are i n s i g n i f i c a n t ; these a re not included i n the annual costs.
- -
Table 3-5. INCREMENTAL COSTS OF SOLVENT EMISS ION CONTROL OPTIONS FOR CONVEYORIZED SINGLE-COAT OPERATION,
SPRAY-COAT APPL ICAT ION
(Mid-1977 thousand do1 lars)
Appl icable c o n t r o l 0 ~ t i o n 1
arbon adsorptton and rbon adsorpt ion and h e m 1 i n c i n e r a t i o n t a l y t i c tnc ine ra t ion henna1 i n c i n e r a t i o n 4 th 352 p r t "%r y heat t h 352 p r i
"gr y heat t i t h 902 p r i -y heat
recovery recovery recoveraterborne GIoat:Inga High so l i d s coatings Powder deposi t ion
-I source s i z e - sou e s i z OUI Lrce s L lrge iGai i imlrge sMll Kii arge 5 r rge
Cost itern ediunr l rge 7 --- - --
Capita l Investment 20 )71 369 648 957 113
C O Annual costs ( c r e d i t s )
0 0 0 0 0 Mater ia l 9
E l e c t r i c i t y 0 17 2 9 17 12
13012 2 4 6 W Fuel (2) I 44 16 31 43 77
ehintenance0
Capi ta l charges 4 195 72 136 190 343
O Tota l annualized dost 12 268 92 180 256 562
-I 1 lii( c r e d i t )" Solvent emissions con-
t r o l l e d , Mglyr 4 1 8 1 8 41 81 88
80 !" Emission reduction, % 79 79 79 79 85
" Cost e f fect iveness ( c r e d i t ) , S/Mg of solvent c o n t r o l l e d 293 4390 3161 6 386 --
a see Table 3-2 f o r source sizes.
Carbon adsorption on spray-coat booth and i n c i n e r a t i o n w i t h 35 percent primary heat recovery on d ry ing oven.
Thermal i n c i n e r a t i o n w i t h 90 percent primary heat recovery on spray-coat booth and d ry ing oven.
Increments o f waste disposal costs. l abor costs, and labor overhead are i n s i g n i f i c a n t ; these are not included i n the annual costs.
Tabie 3-6. INCREMENTAL COSTS OF SOLVENT EMISSION CONTROL OPTIONS FOR EONVEYORIZED TWO-COAT OPERATION, FLOW- AND SPRAY-COAT APPLICATION
(Mid-1977 thousand do1 lars)
Applicable control option
.arbon adsorption and
Cost item
1 Waterborne coz kt ingsL large-
Powder depos
M medium -sma 1
ion e arge
thermal incineration with 351 pri I7-y heat
arge-recover)
Sf-small
:atalytic incineration rith 35% pri~ ry heat "grecovervd edi um - arge
SOL small-
Thermal incineratton with 90% primary heat
recover6
a Capital Investment 56 1299 539 903 1259
O Annual costs (credits)
Material 86 0 0 0 0
Electricity 1 19 3 10 19
Fuel (6) 20 4 6 8
M i ntenance 3 58 25 42 57
Capital charges 10 260 108 187 252
* Total annualized cost (credit 94 357 140 245 336
O Solvent emissions control led. WYr 152 155 15 78 155
Emission reduction, 1 80 82 82 82 82
" Cost effectiveness (credit). $/Mg of solvent controlled 618- 2303 9333 3141 2167
I
a See Table 3-2 for source sizes.
Carbon adsorption on coating booth and incineration with 35 percent primry heat recovery on drying oven.
Thermal incineration with 9 0 percent primary heat recovery on coating booth and drying oven.
Increments of waste disposal costs, labor costs, and labor overhead are insignificant; these are not included in the annual costs.

Tab1e 3-7. INCREMENTAL COSTS OF SOLVENT EMISSION CONTROL OPTIONS FOR CONVEYORIZED TWO-COAT OPERATION, DIP- AND SPRAY-COAT APPLICATION
. (Mid-1977 thousand do1 1ars )
Applicable con t ro l opt fon - -
Carbon adsorption and Carbon adsorption and
<-Powdc
I-deposi t ion ~i ze 4
t h e m 1 inc inera t ion w i t h 35% primary heat
recoveryb source s ize
c a t a l y t i c Inc inera t lon w i t h 35% p r i9r y heat
recovery
Thermal inc inera t ion w i t h 90% primary heat
recove@ source size
Cost i tem small- large 1 small rediumllarge edium- arae I smalllmediumllarae smalllmedium Ilarcre
O Capi ta l investment 24 994
Annual costs (c red i t s?
Mater ia l 8 0
E l e c t r i c i t y 0 10
Fuel (11 18
Maintenance 1 45
Capi ta l charges 4 199
O Total annualized cost ( c r e d i t 12 272
Solvent emissions con t ro l led, M9lyr 14 78
O Emission reduction, X 80 82
O Cost ef fect iveness ( c r e d i t ) , $/Mg o f solvent con t ro l led 857- 3487
a See Table 3-2 f o r source sizes.
Carbon adsorption on coat ing booth and inc inera t ion w i t h 35 percent primary heat recovery on d ry ing oven. Thermal inc inera t ion w i t h 90 percent primary heat recovery on coat ing booth and dry ing oven.
Increments of waste disposal costs, labor costs, and labor overhead are i n s i g n i f i c a n t ; these are not included i n the annual costs.
Tab1e 3-8. COSTS OF SOLVENT EMISS ION CONTROL OPTIONS FOR CONVEYORIZED TWO-COAT OPERATION,
SPRAY-COAT APPL ICAT ION
( M i d - 1 9 7 7 thousand do1 l a r s )
A991 icable control option
Waterborne (
-ltingslea
Htgh solids solvent! -
Powder deposition pr
:arbon adsorption ant :henna1 incineration rith 35% prifnpry heal
recoveryb source size
Carbon adsorption and catalytic in cine ratio^ 4 t h 35% primary heat
recoveryb 2
Thermal incineration with 90% primary heat
recoveryC source size -
Cost item sma 1 ned i un large- small nedi un - small medium large small- arge- smal 1-O Capital investment 56 86 761 1397 1943 720 1902 439
" Annual costs(credi ts)'
Material 86 56 0 0 0
Electricity 1 0 4 34 3
Fuel (6) (3) 4 12 32
w I Maintenance 3 4 33 86 20
w Capital charges 10 16 144 380 88
O Total annualized cost 94 73 185 512 143
" (credit) Solvent emissions con- trolled. Mg/yr 165 7 2 15 163 16
" Emission reduction. % 8 0 70 79 79 85
" Cost effectiveness (credit), $/Mg of solvent control led 570- 014 12233- 3140 8938
a See Table 3-2 for source sizes.
Carbon adsorption on spray-coat booth and incineration with 35 percent primary heat recovery on drying oven.
Thermal incineration with 90 percent primary heat recovery on spray-coat booth and drying oven.
Increments of waste disposal costs, labor costs, and labor overhead are insignificant; these are not included in the annual costs.
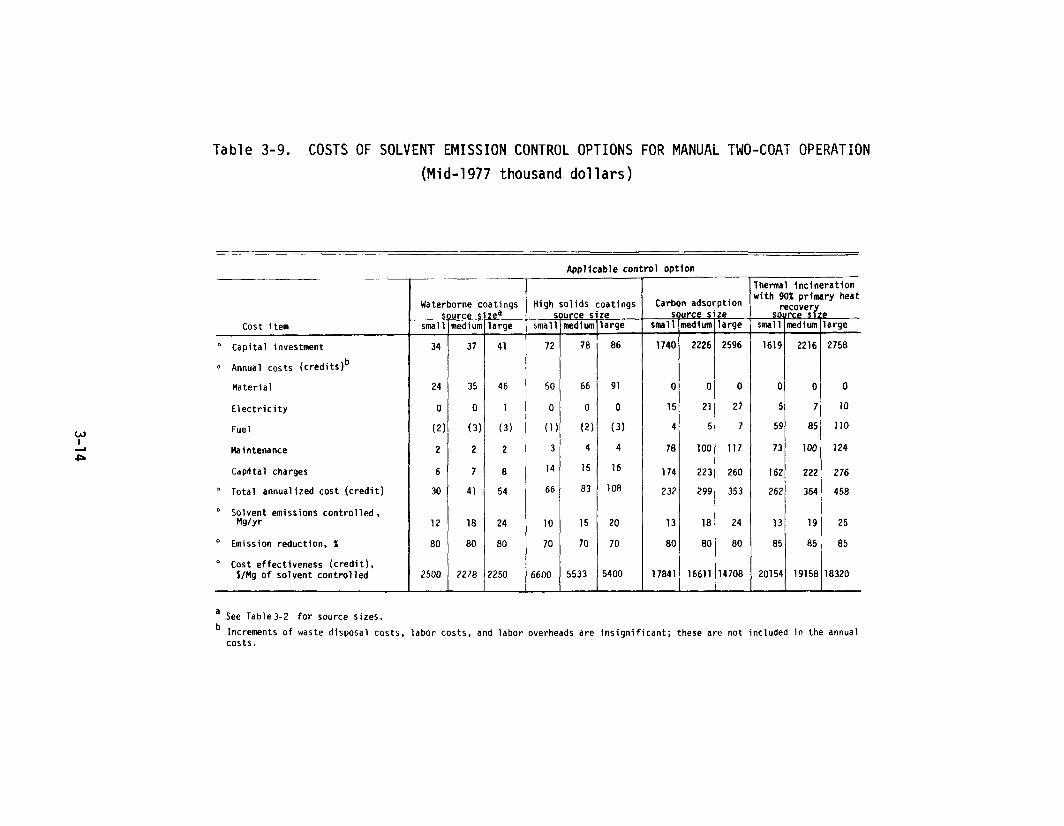
T a b l e 3-9. COSTS OF SOLVENT EMISS ION CONTROL OPTIONS FOR MANUAi TWO-COAT OPERATION
(Mid-1 977 thousand do1 lars)
Appl icable c o n t r o l op t ion
IThennal i n c i n e r a t i o n
Waterborne (
E L5 )stings r e
Carbon adsorption source s i z e
w i t h 90% primary heat recovery
source S I ~
Cost item iediunsmall- lediun small lmedium)large arge- smalllmedium 1 arge-I 1
" Capi ta l investment 34 86 2758
Annual costs ( c r e d i t s )b
Mater ia l 24 91 0
E l e c t r i c i t y 0 0 10
Fuel (21 (3) 110
Maintenance 2 4 124
Capntal charges 6 16 276
" Tota l annualized cost ( c r e d i t ) 30 108 458
O Solvent emissions con t ro l l ed . Mglyr 12 20 25
" Emission reduction, 1 80 70 85
" Cost e f fect iveness ( c r e d i t ) , $/Mg o f so lvent c o n t r o l l e d 2500
-5400 8320
-a See Table3-2 f o r source s izes.
Increments of waste disposal costs, labor costs, and labor overheads are i n s i g n i f i c a n t ; these are not included i n the annual costs.
savings are estimated for powder coating conversions (1, 2); however, a
higher coating thickness of 50 urn (2 mils) assumed for powder coating
diminishes possible savings.
For electrodeposi tion, lower applied film thickness helps override
some of the associated increased electrical costs (1).
Annualized costs of incineration of oven emissions primarily
represent fuel required to raise the temperature of the exhaust gases
from 160°C (320°F) to 760°C (1400°F).
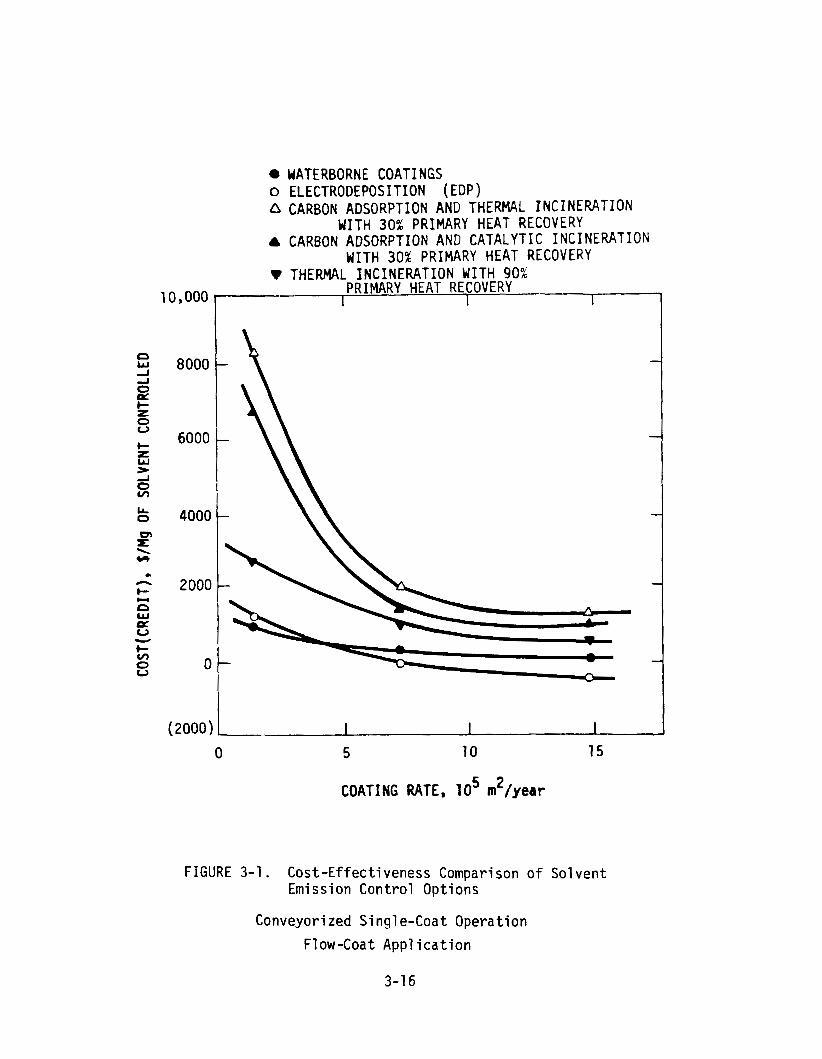
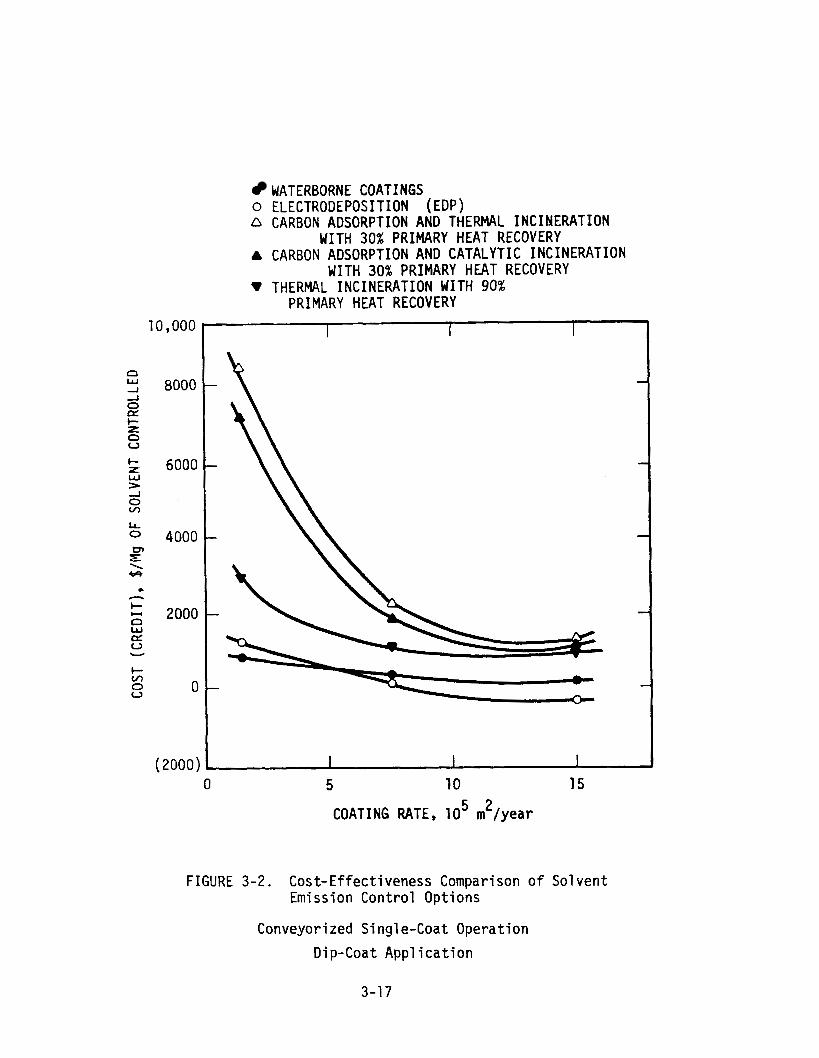
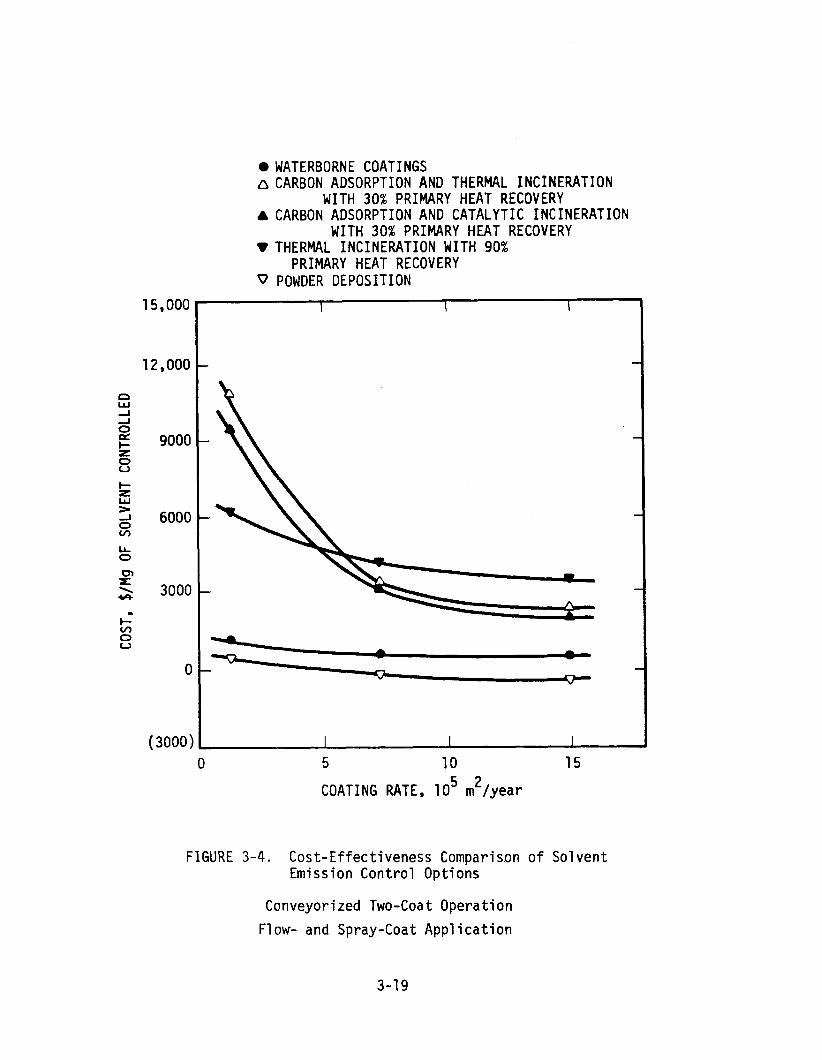
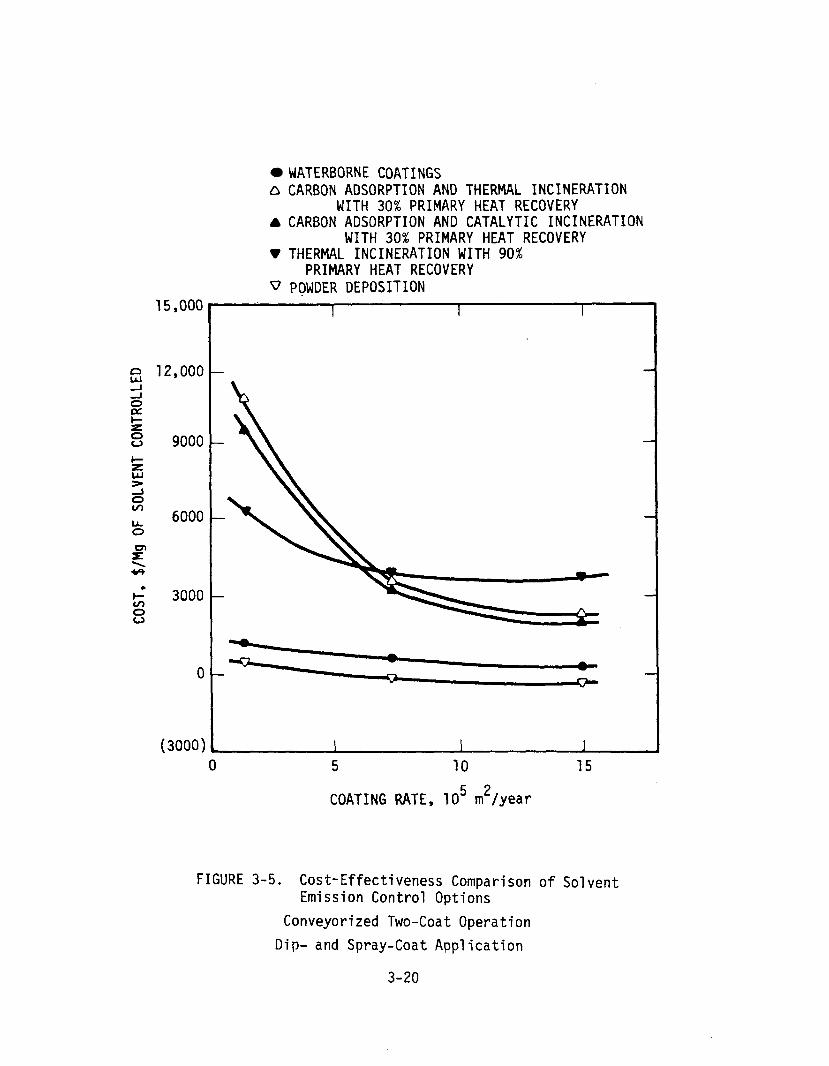
3.3 COST EFFECTIVENESS
Figures 3-1 through 3-7 present cost-effectiveness curves for the
options analyzed: Figures 3-1, 3-2, and 3-3 for conveyorized single-
coat operation; Figures 3-4, 3-5, and 3-6 for conveyorized two-coat
operation; and Figure 3-7 for manual two-coat operation. These curves
represent the effect of line size on the cost per unit weight of solvent
controlled. The cost per unit weight of solvent controlled decreases
with the increasing line size in a11 cases.
The two most cost-effective options eval uated for conveyori zed
single f low-coat and single dip-coat operations appear to be convers ion
to waterborne coatings and conversion to the electrodeposition process.
The most costly options appear to be add-on control devices. Conversion
to waterborne coatings seems to be a cost-effective option for spray
coating in a conveyorized single-coat operation; carbon adsorption
combined with thermal i ncineration, with 35 percent primary heat recovery
is the most costly.
0 WATERBORNE COATINGS o ELECTRODEPOSITION (EDP)
CARBON ADSORPTION AND THERMAL INCINERATION WITH 30% PRIMARY HEAT RECOVERY
A CARBON ADSORPTION AND CATALYTIC INCINERATION WITH 30% PRIMARY HEAT RECOVERY
V THERMAL INCINERATION WITH 90% PRIMARY HEAT RECOVERY
I i
0 5 10 15
COATING RATE, 5 210 m /year
FIGURE 3-1. Cos t -E f fec t i veness Comparison o f So lven t Emission Cont ro l Opt ions
Conveyorized Sing le-Coat Opera t ion
Flow-Coat Appl i c a t i o n
WATERBORNE COATINGS 0 ELECTRODEPOSITION (EDP) n CARBON ADSORPTION AND THERMAL INCINERATION
WITH 30% PRIMARY HEAT RECOVERY A CARBON ADSORPTION AND CATALYTIC INCINERATION
WITH 30% PRIMARY HEAT RECOVERY V THERMAL INCINERATION WITH 90%
PRIMARY HEAT RECOVERY
I 1
5 10 5 2 COATING RATE, 10 m /year
FIGURE 3-2. Cost-Effectiveness Comparison o f Solvent Emission Control Options
Conveyorized Single-Coat Operation
Dip-Coat Appl i c a t i o n

WATERBORNE COATINGS CARBON ADSORPTION AND THERMAL INCINERATION
WITH 30% PRIMARY HEAT RECOVERY A CARBON ADSORPTION AND CATALYTIC INCINERATION
WITH 30% PRIMARY HEAT RECOVERY V THERMAL INCINERATION WITH 90%
PRIMARY HEAT RECOVERY v POWDER DEPOSITION
H I G H SOLIDS COATINGS
1 I
5 2 COATING RATE, 10 m /year
FIGURE 3-3. Cost-Effect iveness Comparison of Solvent Emission Contro l Options
Conveyorized Single-Coat Operat ion
Spray-Coat A p p l i c a t i o n
WATERBORNE COATINGS n CARBON ADSORPTION AND THERMAL INCINERATION
WITH 30% PRIMARY HEAT RECOVERY r CARBON ADSORPTION AND CATALYTIC INCINERATION
WITH 30% PRIMARY HEAT RECOVERY V THERMAL INCINERATION WITH 90%
PRIMARY HEAT RECOVERY V POWDER DEPOSITION
1 I 1
5 10 15 5 2 COATING RATE, 10 m /year
FIGURE 3-4. Cos t -E f fec t i veness Comparis.on o f So lven t Emission Cont ro l Opt ions
Conveyori zed Two-Coat Opera t ion
Flow- and Spray-Coat Appl i c a t i o n
WATERBORNE COATINGS 6 CARBON ADSORPTION AND THERMAL INCINERATION
WITH 30% PRIMARY HEAT RECOVERY A CARBON ADSORPTION AND CATALYTIC INCINERATION
WITH 30% PRIMARY HEAT RECOVERY V THERMAL INCINERATION WITH 90%
PRIMARY HEAT RECOVERY V POWDER DEPOSITION
1 I
5 2 COATING RATE, 10 m /year
FIGURE 3-5. Cos t - E f f e c t i v e n e s s Comparison o f Sol vent Emission Cont ro l Opt ions
Conveyorized Two-Coat Opera t ion
D ip - and Spray-Coat A p p l i c a t i o n
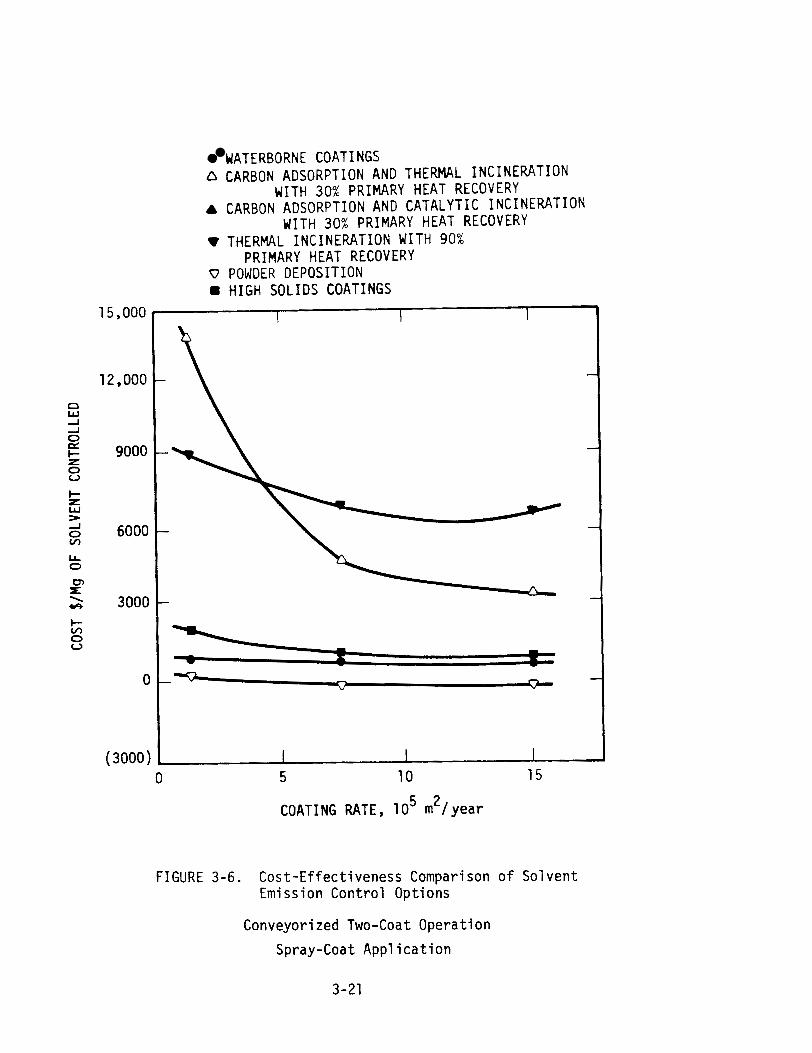
FIGURE 3-6. Cost-Ef fect iveness Comparison o f Solvent Emission Contro l Options
WATERBORNE COATINGS A CARBON ADSORPTION AND THERMAL INCINERATION
WITH 30% PRIMARY HEAT RECOVERY 4 CARBON ADSORPTION AND CATALYTIC INCINERATION
WITH 30% PRIMARY HEAT RECOVERY V THERMAL INCINERATION WITH 90%
PRIMARY HEAT RECOVERY V POWDER DEPOSITION
HIGH SOLIDS COATINGS
Conveyorized Two-Coat Operat ion
Spray-Coat A p p l i c a t i o n
15,000 -
12,000
0 W A A 0
9000 Z 0 U
I- Z W >
6000 5? LL 0
pr
3000
5 0 0
0
(3000)
I I I
-
- 4
- -
- -
--Q - u
CI V
-
, I I I 0 5 10 15
5 2 COATING RATE, 10 m l year

WATERBORNE COATINGS ACARBON ADSORPTION AND THERMAL INCINERATION
WITH 30% PRIMARY HEAT RECOVERY V THERMAL INCINERATION WITH 90%
PRIMARY HEAT RECOVERY
- HIGH SOLIDS COATINGS I I
I -
t7,0 0
4000 -
r I I0 -
0 5 10
COATING RATE, 10 5 rn2/year
FIGURE 3-7. Cost-Effectiveness Comparison of Solvent Emission Control Options
Manual Two-Coat Operation

Conversion t o a powder-coating process i s the most cost-effec-
t i v e con t ro l op t i on evaluated f o r conveyorized two-coat operat ions.
Add-on c o n t r o l systems appear t o be considerably more expensive than
process m o d i f i c a t i o n opt ions.
Conversion t o waterborne coat ings i s t he l e a s t c o s t l y op t i on
evaluated f o r manual two-coat operat ions. Again, add-on c o n t r o l systems
c o s t much more than process changes.
I n f l o w and d i p coat ing i n conveyorized s ing le -coat operat ions,
thermal i n c i n e r a t i o n w i t h 90 percent pr imary heat recovery* appears t o
be a more c o s t - e f f e c t i v e add-on con t ro l than carbon adsorpt ion w i t h
e i t h e r thermal o r c a t a l y t i c i n c i n e r a t i o n + w i t h 30 percent pr imary heat
recovery. Th is system a l so appears t o be the most c o s t - e f f e c t i v e f o r
small s i z e l i n e s on l y i n a l l o ther operat ions (spray-coat ing i n con-
veyorized s ing le -coat operat ions and a l l coat ings i n conveyorized two-
coat operat ions) ; however, i t i s the l e a s t c o s t - e f f e c t i v e f o r medium
s i z e and l a rge s i z e l i n e s . For these app l ica t ions , carbon adsorp t ion
w i t h thermal i n c i n e r a t i o n a t 30 percent pr imary heat recovery seems t o
be more c o s t - e f f e c t i v e than carbon adsorp t ion w i t h c a t a l y t i c i n c inera-
t i o n a t 30 percent pr imary heat recovery.
The carbon adsorp t ion system appears t o be more c o s t - e f f e c t i v e than
thermal i nc ine ra t i on , w i t h 90 percent pr imary heat recovery on manual
two-coat operat ions.
* Thlermal i n c i n e r a t i o n w i t h 90 percent pr imary heat recovery i s app l i ed on coat ing booth and d ry ing oven.
+ Ca~rbon adsorpt ion on booth and the rma l / ca ta l y t i c i n c i n e r a t i o n on d ry ing oven.
3.4 SUMMARY
Cost analyses o f t he model l i n e s i n d i c a t e t h a t m o d i f i c a t i o n o f t he
coat ing process t o a low-solvent coat ing usua l l y appears t o be more
cos t - -e f fec t i ve f o r c o n t r o l o f VOC than add-on con t ro l . However, because
annual ized cos ts f o r a1 t e r n a t i v e coat ing systems a re g r e a t l y a f f e c t e d by
assumptions i m p l i c i t i n the c a l c u l a t i o n o f coat ing costs, comparisons
between a l t e r n a t i v e coat ing systems can e x h i b i t s i g n i f i c a n t case by case
var ia t ions .

3.5 REFERENCES
1 Second In te r im Report on Air Po l lu t i on Control Engineering and Cost Study of t h e General Surface Coating Indus t ry . Prepared by Spring- born Labora tor ies , Inc. , under EPA Cont rac t No. 68-02-2075. August 23, '1977.
2. Second In te r im Report on Air Po l lu t i on Control Engineering and Cost Stud,y of t h e General Surface Coating Indus t ry - Appendixes A & B. Prepared by Springborn Laborator ies , Inc. , under EPA Contract No. 68-02-2075. August 23, 1977.
3. Study o f Systems f o r Heat Recovery from Af te rburners . I n d u s t r i a l Gas Cleaning I n s t i t u t e , Stamford, Connecticut. EPA Cont rac t No. 68-02-1473, Task No. 23. October 1977.
4. REECo Newslet ters 1 through 4. REECo Regenerat ive Environmental Equipment Co., Inc . , Muncy, Pennsyl vania . 1973.
5. Information suppl ied t o U .S. EPA by Regenera ti ve Environmental Equipment Co., Inc. (REECo), March 31, 1978.
6. High S o l i d s Coatings Volume 2, No. 2. Technology Marketing Corpora- t i o n , Stamford, Connecticut. April 1977.
3.6 BIBLIOGRAPHY
Control of V o l a t i l e Organic Emissions from Exis t ing S t a t i o n a r y Sources, Volume I: Control Methods f o r Surface-Coating Operat ions. EPA-450/2-76-028, Research Tr i ang le Park, North Caro l ina . November 1976 (OAQPS NO. 1.2-067).
Control of V o l a t i l e Organic Emissions from Exis t ing S t a t i ona ry Sources, Volume 11: Surface Coating o f Cans, Co i l s , Paper, Fab-rics, Automobiles, and Light-Duty Trucks. EPA-450/2-77-008, Research Tr i ang le Park, North Caro l ina . May 1977 (OAQPS No. 1.2-073).
Report o f Fuel Requirements, Capi ta l Cost and Operating Expense f o r C a t a l y t i c and Thermal Af te rburners . CE Air Prehea te r , I n d u s t r i a l Gas Cleaning I n s t i t u t e , Stamford, Connect icut . EPA-450/3-76-031. September 1 976.
Ca,pital and Operating Costs of Se l ec t ed Air P o l l u t i o n Control Systems. GARD, Inc . , Ni les , I l l i n o i s . EPA Cont rac t No. 68-02-2072. May 1976.
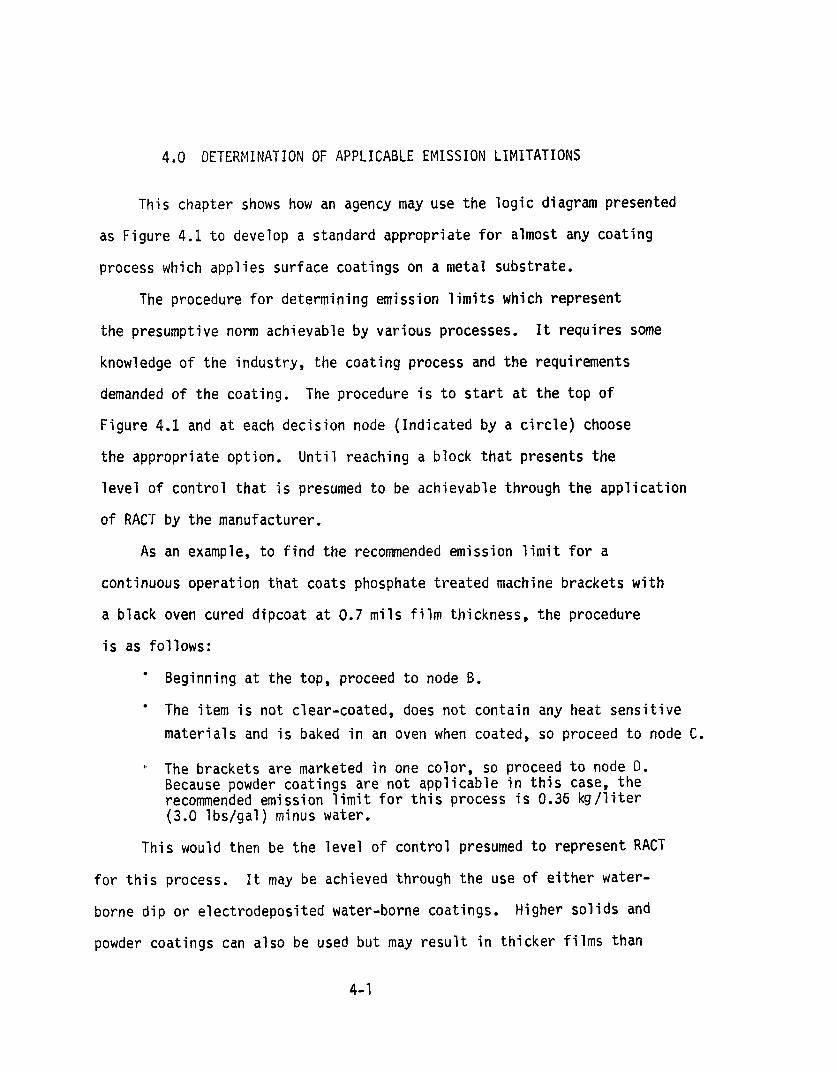
4.0 DETERMINATION OF APPLICABLE EMISSION LIMITATIONS
This chapter shows how an agency may use the logic diagram presented
as Figure 4.1 to develop a standard appropriate for almost any coating
process which applies surface coatings on a metal substrate.
The procedure for determining emission limits which represent
the presumptive norm achievable by various processes. It requires some
knowledge of the industry, the coating process and the requirements
demanded of the coating. The procedure is to start at the top of
Figure 4.1 and at each decision node (Indicated by a circle) choose
the appropriate option. Unti 1 reaching a block that presents the
level o f control that is presumed to be ach
of RACT by the manufacturer.
As an examp le, to find the recommended
ievable through the applicat ion
emission limit for a
continuous operation that coats phosphate treated machine brackets with
a black oven cured dipcoat at 0.7 mils film thickness, the procedure
is as follows:
Beginning at the top, proceed to node B.
The item is not clear-coated, does not contain any heat sensitive materials and is baked in an oven when coated, so proceed to node C.
' The brackets are marketed in one color, so proceed to node D. Because powder coatings are not applicable in this case, the recommended emission limit for this process is 0.36 kg/liter (3.0 lbs/gal) minus water.
This would then be the level of control presumed to represent RACT
for this process. It may be achieved through the use of either water-
borne dip or electrodeposited water-borne coatings. Higher solids and
powder coatings can also be used but may result in thicker films than
the 0.7 mil obtained from low solids coatings.
Current technology does not provide low-pol luting coatings which
can successfully replace conventional coatings for a1 1 the speci a1 ty
items coated by the many industrial categories covered by these
emission limits. Some low-polluting coatings are beinq used on production
lines while others are in various stages of research. There wi 11 be,
however, si tutations where low-pol luting coatings may never be applicable
and even the use of add-on control technology may not be feasible
ei tlher technical ly or economically.

Manufacture of Metal Parts and Products P Auto and
coil('I ire(^) Other Light Metal ( 2 ) Large( 4 ) Cuty Furniture Appliance~ruck(l)
I
Air or forced air-dried items: Parts too large or too heavy for practical size ovens and/or sensi- tive heat requirements. Parts to which heat sensitive materials are attached. Equipment assembled prior to top coating for s~ecific performance or quality stand r s. 0.42 kglliter (3.5 lbslgal) 757
1
No or infrequent color chanoe, or small number of colors applied.
IOutdoor or harsh Frequent color chanqe and/ exposure or extreme or large number of colors
Iperformance applied, or first coat on characteristics 0.42 kg/liter ( 5 ) , untreated ferrous substrat
0.36 kglliter(3.5 lbs/gal)
I I (3.0 lbslsal) (7)
Fiqure 4.1 Logic diagram for derivation of emission limits for coatina of miscellaneous metal parts and products.

4.1 REFERENCES
The recommended emission limitations for this category are given in "Control of Volatile Organic Emissions from Existing Stationary Sources - Volume 11: Surface Coating of Cans, Coils, Paper, Fabric, Automobiles and Light Duty Trucks ," EPA-450/2-77-008, May, 1977. The recommended emission limitations for this category are given in "Control of Volatile Organic Emissions from Existing Stationary Sources -Volume II I Surf ace Coating of Metal Furniture," EPA-450/2-77-032, December, 1977.
The recomnended emission limitations for this category are given in "Control of Volatile Organic Emissions from Existing Stationary Sources - Volume IV: Surface Coating for Insulation of Magnet Wire," EPA-450/2-77-033, December, 1977.
The recommended emission limitations for this category are given in "Control of Volatile Organic Emissions from Existing Stationary Sources - Volume V: Surface Coating of Large Appliances," EPA-450/ 2-77-034, December, 1977.
This emission limit is achievable by use of about 52 volume percent solids organic solvent-borne coating. Units for this and other limitations are kilograms of solvent emitted per 1 iter of coating applied (minus water),
This limit is achievable by use of a 41 volume percent solids organic solvent-borne or a water-borne equivalent coating.
This emission limit is acheivable by use of a 59 volume percent higher solids or a water-borne equivalent coating, or powder or electrodeposited water-borne coatings. DuPont Comments to the First Draft of Control of Volatile Organic Emissions from Existing Stationary Sources - Volume VI: Surface Coating of Miscellaneous Metal Parts and Products, Letter Dated April 20, 1978.
There are some products for which a coating thickness greater than 2 mi 1s is required hut ather coating quality or performance requirements preclude the use of powder coatings. Comments from Deere and Company on the First Draft of Control of Volatile Organic Emissions from Existing Stationary Sources - Volume VI: Surface Coating of Miscellaneous Metal Parts and Products, Letter dated March 29, 1978.
5.0 ADVERSE AND BENEFICIAL EFFECTS OF APPLYING TECHNOLOGY
This chapter reviews t h e adverse and b e n e f i c i a l e f f e c t s of each technique
which reduces VOC emissions. Th is inc ludes n o t o n l y environmental aspects bu t
a l so energy and cost . I t a lso h i g h l i g h t s any l i m i t a t i o n s o f low organic
so l vent techno1 ogy as compared t o convent ional h igh organic s o l vent coat ings .
5.1 WATER-BORNE (SPRAY, DIP, OR FLOW COAT)
There are several advantages t o conver t ing t o water-borne coat ings.
" Conversion t o water-borne coat ings w i l l l i k e l y be t h e f i r s t op t i on
considered by many f a c i l i t i e s because o f t he p o s s i b i l i t y t h a t these
coat ings can be app l ied w i t h minimal m o d i f i c a t i o n o f e x i s t i n g equipment.
" Convert ing t o water-borne coat ings prov ides a p o t e n t i a l decrease
i n t o x i c i t y and f lammabi l i t y .
" Water-borne coat ings may be th inned w i t h water.
" Coating equipment can be cleaned o r f l ushed w i t h water r a t h e r
than organ ic solvent . ( I f water-borne coat ings are al lowed t o dry, however,
they are then no longer so lub le i n water and must be cleaned w i t h solvent .
" Use o f water-borne coat ings may a l l ow a decrease i n oven temperature.
" Use of water-borne coat ings w i l l permi t some reduc t i on i n a i r f low
s ince t h e amount of organics which must be evaporated i n t h e oven i s
1 reduced. (The permiss ib le reduc t ion may be 1 i m i ted, however, by h igh humid i ty
w i t h i n t h e oven which w i l l r e s u l t i n condensation on the oven w a l l s and poss ib l y
cause improper cu r ing o f t he f i l m .
I n some cases the d r y - o f f oven may no longer be necessary. 2
There are some p o t e n t i a l disadvantages t o water-borne coat ings when compared
w i t h convent ional organic-borne coat ings.
Spraying with water-borne coatings may require closer attention
to detail than with organic-borne coatings because temperature, humidity,
gun-to-metal-part distance, and flashoff time may affect the appearance
and performance of the coating.
On many large electrostatic spray lines, use of water-borne coatings
may be impractical because of the difficulties involved in electrically
insulating the entire system.
Water-borne coatings applied by dip and f low coating application
equipment will need to be monitored more closely due to their more sensitive
chemistry.
An additional rinse may be needed. Cleansing and pretreatment of the
substrate are more critical because of possible coating contamination and pH
changes within the dip or flow coating tank. 3
Some equipment may have to be replaced or adjusted (due to different
surface tension of water than that of organic solvent) or protected from
corrosi~on.~ (In one converted flow coating operation, the only change was
that the number of nozzles had to be doubled to obtain the same coverage as
with conventional coatings.) 5
The coating bath, flashoff time, temperature, air circulation, and
humidity may have to be controlled and frequently monitored, because changes
in weather conditions may affect the application of water-borne coatings. 6
5.2 ELECTRODEPOSITION
Several other advantages, in addition to reduced VOC emissions, accrue
from converting to electrodeposi tion.
The major one is improved quality control, a consequence of the fully
automated process.

It provides excellent and uniform coating coverage and corrosion
protection because the paint particles are able to get into small recesses
of parts;.
Fire hazards and potential toxicity are decreased in electrodeposition
due to the minimal organic solvent content.
If electrodeposition replaced a spray coating operation, the solid
and 1 iquid wastes associated with spraying operations wi 11 be reduced
drastically.
' The lower organic content permits lower ventilation rates, resulting
in reduced energy consumption.
There are some disadvantages to the electrodeposition process.
Electrodeposition may increase electrical consumption. The'amwnt
will depend on the original application system, the size of the electro-
deposition bath, and the thickness of the coating applied. Electrical energy
is required for the coating system, the refrigeration to overcome the
temperature rise from the electri cal process, for good paint circulation
in the bath, and to operate the ultrafi lter. Electrodeposition may consume
three times as much energy in the application area as water-borne flow or dip
coating operations.7 It does not, however, appear as energy inefficient
when compared to a spraying operation because the high air volumes are no
longer required. Energy consumption will also be less in the baking process.
The air flow in the oven may be reduced and the flashoff tunnel may be
omitted.
A poor electrical connection will result in a poor coating (for
example, if the hooks which hold the metal parts are not poperly cleaned or
hung and inadvertently provide an electrical insulation, the quality of the
coating will suffer.)
The coverage is so uniform that electrodeposited coatings will not
hide imperfections in the substrate.
Conversion to electrodeposition will require a change of equipment
at significant capital cost and can be relatively expensive on small
scale production lines.
5.3 HIGHER SOLIDS COATINGS
One of the greatest advantages of converting to higher solids coatings
as a means of reducing emissions of VOC is that they may be applied with
little change to existing equipment. Some application equipment (i.e.,
spray guns) may have to be replaced or a paint heater may have to be
installed to reduce the viscosity of the higher solids coatings but these
are relatively inexpensive changes. Conversion to high solids coatings can
reduce a plant's energy consumption. Air flow in the spray booth can be
decreased because less organic solvent must be evaporated from a high solids
coating when applying the same volume of coating. Since the energy required
by the oven is largely dependent on the air flow (and it, in turn, is
heavily influenced by the organic concentration 1 imitations imposed for
safety reasons)8, the use of higher solids coatings will reduce energy
requirements. Solid and liquid wastes may also decrease since less coating
is applied per dry mil. However, the tackiness of high solid coatings may
make cleanup more difficult. 9
Some two-component high solids coatings may contain isocyanate compounds
which are potentially toxic and must be handled and applied with caution.
These also require instal lation of special application equipment.
5.4 POWDER COATINGS
There are several advantages obtained after a facility is converted to
powder coatings .
WOC emissions are almost completely eliminated.
There are no solid or liquid wastes to be disposed of as compared
to solvent-borne coatings.
Powder does not require the purchase, or use of solvents to
control the viscosity of the coating or to clean the equipment. ' Powders can mask imperfections and weld marks.
Conversion to powder coatings may reduce the energy requirements
in a spray booth because the large volumes of fresh air required for
appl ication of sol vent-borne coatings may not be required. Energy require-
ments for the ovens may also be reduced because little organics are being
evaporated requiring less dilution. (It has been estimated that a 35-70
percent overall reduction in energy requirements will result when a conven-
tional single coat spray application is replaced with powder and 55-70
percent reduction wi 11 occur for a two-coat spray application. ) 10
The exhaust air from the spray booth can be filtered and returned
to the working area.
Up to 98 percent transfer efficiency of powder coatings can be
realized since the overspray can be reclaimed. Not all overspray is always
reusable, however, because a buildup of powder fines may have to be discarded,
and the larger and heavier granules may have to be reprocessed again before
they are suitable for reuse. 11
There are several disadvantages to converting to the use of powder
coatings.
The conversion is non-reversible since a1 1 appl ication equipment,
spray booths, and associated equipment (and often ovens) used for liquid
systems must be replaced. This will then limit the flexibility o f the
faci 1 ity to apply other coatings.
Coating film thicknesses of less than 0.9 mils have not been
successfully obtained with powders on a production line basis,
Metallic powder coatings are not as esthetically pleasing as con-
ventional metal 1 ics.
Color matching of a powder coating is difficult because its color
cannot be changed by the applicator. Solvent borne coatings can be.
Powder films have appearance limitations for some applications.
Uncured powder coatings must be kept dry since their subsequent
perf ormance can be affected . Powder coatings are subject to explosions (as are many particulate
dusts). 12
Color changes for powder require about half an hour downtime if
powder is recovered for reuse. This may greatly curtail production
capacities. Color changes may be shortened if powders are not reclaimed
in their respective colors, but this results in a coating usage efficiency
of only 50 to 60 percent.
5.5 CARBON ADSORPTION
Although the technology is well documented and considered technically
feasible, there are not miscellaneous metal part or product facilities
known to be using carbon adsorption systems to reduce organic emissions
from coating application of flashoff areas. The energy required to operate
a carbon adsorption system is a potential disadvantage. The actual quantity
will depend on the size of adsorber(s) and the concentration of the solvents
entering the carbon bed. Any reduction which can be made in the amount of
air flow from the coating application and flashoff areas will permit
purchase of a smaller adsorber with an attendant reduction in energy requirements.
The amount of solid and liquid waste generated by the use of a carbon
adsorber will depend on the type of coating application system. For
example, emissions from flow and dip coating operations do not require
filtration or scrubbing. Emissions from spray booths, however, may require
pretreatment by fi 1tration or scrubbing since the overspray may foul the
adswber bed. Water miscible solvents may produce a water pollution problem
if the adsorber is regenerated with steam. This, however, can be avoided by
incinerating the regeneration stream, by stripping the organics from the
condensate or using nitrogen gas as a stripping medium. Each will increase
the cost and energy consumption of a carbon adsorption unit. Since there
is little possibility that the recovered solvents may be reused i n the
mi scel 1aneous metal part and product industries, any recovery or solvents
would be for fuel value only.
An important factor when considering instal 1ation of a carbon adsorption
system is plant space. Large facilities may require many dual-bed carbon
adsorption units in parallel which will need a relatively large area within
the plant.
5.6 INCINERATION
The most common and widely applicable technique for the reduction of
organic emissions is incinerat ion. Incinerators (or afterburners) have
been used for many years for reducing organic emissions. One disadvantage
is the quantity of additional fuel required unless heat recovery is used.
The use of primary heat recovery to preheat the inlet gas stream to near
in~iner~ationtemperature will minimize and can even eliminate fuel require-
ments. If secondary heat recovery can be used for other energy-using
processes, fuel requirements can be reduced even further. If there are
enough areas where secondary heat may be utilized, an incineration system
may even reduce the p lant ' s overall fuel consumption. Table 5-1 shows the
potent i a1 decreases i n energy usage when using incinerators fol lowed by
tube and shell heat exchangers with heat recovery efficiencies of 38 percent
to 55 percent. Some examples where secondary heat from the incinerator
exhaust may be used are: oven makeup a i r , boiler, cleaning processes, dryoff
ovens, and plant room heating. Greater primary heat recovery eff ic iencies
(80 to 95 percent) are shown i n Table 5-2 using other types of heat exchangers
such as ceramic wheel stone packed beds. These are reportedly very a t t rac t ive
even for low organic concentration streams because of the i r low fuel requirements.

TABLE 5 -1
BURNER REQUIREMENTS FOR INCINERATORS
IN l o 6 BTUIHRa,b,13
NON-CATALYTIC INCINERATORS 5 percent LEL 1 5 percent LEL
No Heat Recovery 5000 scfm
15,000 scfm 30,000 scfm
38% E f f i c i e n t Pr imary Heat Re
5000 scfm 15,~000 scfm 30,000 scfm
Pr imary and 55% E f f i c i e n t Secondary Heat Recovery
5000 scfm 15,000 scfm 30,,000 scfm
CATALYTIC INCINERATORS
No Heat Recovery 5000 scfm
15,000 scfm 30,000 scfm
38% E f f i c i e n t pr imary Heat Recovery
5000 scfm 15,000 scfrn 301,000 scfm
Pr imary and 55% E f f i c i e n t Secondary Heat Recovery
5000 scfm 15,000 scfm 3('1,000 scfm
a ) Based on 3 0 0 ' ~ oven o u t l e t temperature; 1 4 0 0 ~ ~o u t l e t temperature f o r n o n - c a t a l y t i c and 600°F i n l e t temperature f o r c a t a l y t i c inc ine ra to rs
b ) ( - ) i n d i c a t e s n e t o v e r a l l f u e l savings.
c ) These heat recovery e f f i c i e n c i e s a re based on sens ib le heat.
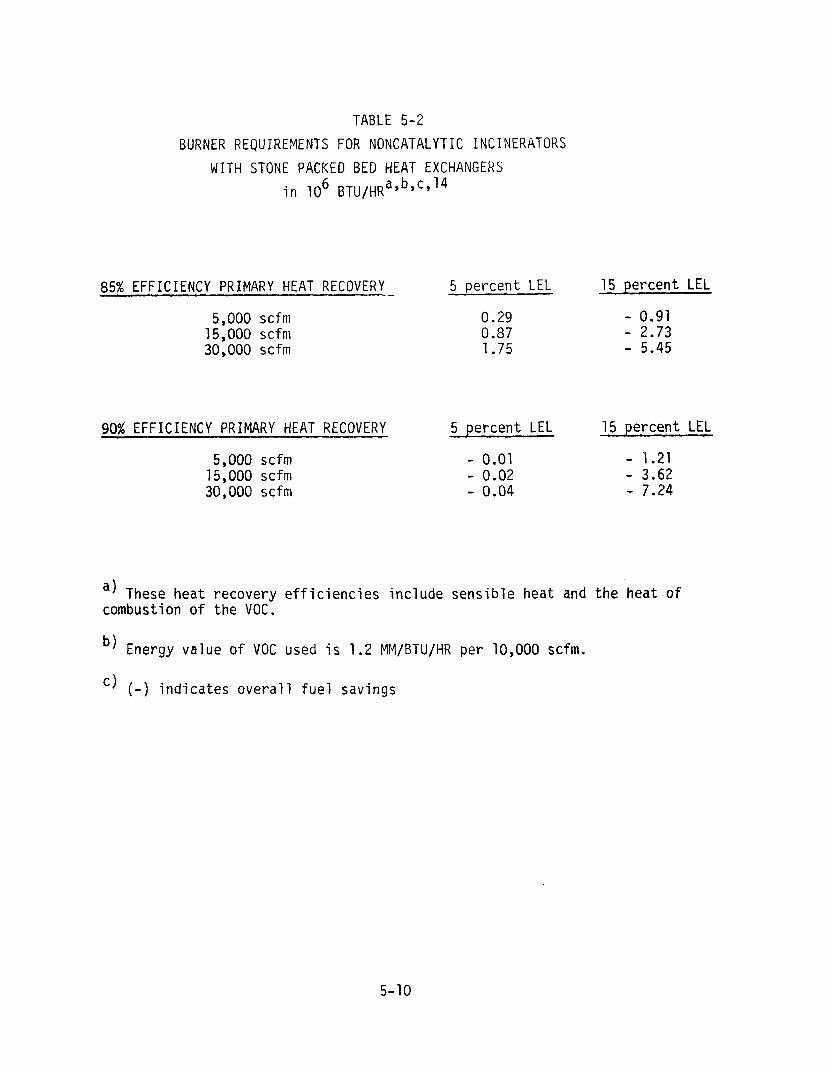
TABLE 5-2
BURNER REQUIREMENTS FOR NONCATALYTIC INCINERATORS WITH STONE PACKED BED HEAT EXCHANGERS
in lo6 BTU/HR a,b,c,l4
85% EFFICIENCY PRIMARY HEAT RECOVERY 5 percent LEL 15 percent LEL
5,000 scfm 15,000 scfm 30,000 scfrn
90% EFFICIENCY PRIMARY HEAT RECOVERY 5 percent LEL 15 percent LEL-5,000 scfm 15,000 scfm 30,000 scfm
a) These heat recovery efficiencies include sensible heat and the heat of combustion of the VOC.
b, Energy value of VOC used is 1.2 MM/BTU/HR per 10,000 scfm.
( - ) indicates overall fuel savings

5.7 REFERENCES
McCormick, Donald, "Converting a Flowcoater t o Water-Borne Paint ," Whirlpool Corporation. Presented a t the NPCA Chemical Coatings Conference, Cincinnati, Ohio, April 23, 1976.
I b i d .
Water-Borne Flow coating and Dip, Products Finishing, pages 73-76, February, 1977.
Products Finishing, Op. Ci t .
McCorrnick, Op. C i t .
Products Finishing, Op. C i t.
Kennedy, W. D . , "Major Appl iance Electrocoat," Whirl pool Corporation. Presented a t the NPCA Chmical Coatinas Conference, Cincinnati, Ohio, u
April 22, 1976.
DeVi t t o r i o , J . M. , Ransburg Corporation, "Application Equi pment f o r High-Solids and Plural Component Coatings," Volume I , No. 2, April , 1976.
"Question Corner," High-Solids Coatings, Volume I , No. 3, July, 1976.
"Economic Ju s t i f i c a t i on of Powder Coating, " Powder Finishi ng World , pages 18-22, 4th Quar ter , 1976.
LeBras, Louis, Technical Director, PPG Industr ies , Inc. , Pittsburgh, Pennsylvania. Letter t o V . N . Gallagher i n comment of the metal fu rn i tu re d r a f t document. Let ter dated August 31, 1977.
Ibid.
Combustion Engineering Air P reha t e r , We1 1 s v i l l e , New York. Report of Fuel Requirements, Capital Cost, and Operating Expenses f o r Cata lyt ic and Thermal Afterburners, EPA Contract Report No. EPA-45013-76-031, September, 1976.
Mueller, James H . , Regenerative Environmental Equipment Co., Inc., Morris Plains, New Jersey. Letter t o V . N. Gallagher in coment o f t h i s dra f t documenlt. Letter dated March 31, 1978.
6.0 MONITORING TECHNIQUES AND ENFORCEMENT ASPECTS
This chapter discusses the recommended emission limits, the monitoring
techniques and enforcement aspects for both coatings which are low in organic
solvents and add-on control equipment.
Limitations in VOC may be expressed in terms of mass or volume and
may be based on the entire coating (including organic solvent) or only on
paint solids. In this guideline, limitations are expressed as the allow-
able mass of organic solvent per unit volume of coating (kgs per liter of
coating or Ibs per gallon of coating - minus water) as it is delivered to the coating
applicator. The water content of the coating is not included in the ratio.
The principal advantage of this format is that enforcement is relatively
simple. Field personnel can draw samples and have them analyzed quickly.
A disadvantage is that the relationship between the solvent fraction and
organic emissions is not linear. If the organic solvent content is expressed
in terms of mass of organic solvent per unit volume of paint solids (kgs per
liter or lbs per gallon of solids), the disparity disappears. This relationship
is linear and more readily understood, e.g., a coating containing 2 Ibs of
organic solvent per gallon of solids releases twice as much organic solvent
as one with one pound per gallon. The disadvantage of this format, however,
is that the analytical methods are more complex. Appendix A of Volume I1
of this series, "Control of Volatile Organic Emissions from Existing Stationary
Sources - Volume 11: Surface Coating of Cans, Coils, Paper, Fabrics,
Automobiles, and Light-Duty Trucks," presents ASTM test methods that permit
determination ~f the organic solvent per gallon of coating (minus water).
For miscellaneous metal p a r t and product coat ing f a c i l i t i e s , i t i s
recommended t h a t , i f possib le, emission l i m i t a t i o n s should be expressed
i n terms o f the organic so lvent content o f t h e coat ing s ince these values
can be determined w i t h r e l a t i v e l y simple a n a l y t i c a l techniques. A l t e r n a t i v e
compliance procedures should permi t operators t o use add-on c o n t r o l equip-
ment i f they so choose. (Sample c a l c u l a t i o n s t o v e r i f y compliance w i t h
t h i s type of emission 1 i m i t are shown i n Appendix A o f t h i s document .)
Other opt ions such as mass o r volume o f organic so lvent per mass
of coat ing are genera l l y l ess des i rab le al though they may be e n t i r e l y
appropr iate f o r a given i ndus t r y . Basing l i m i t a t i o n s on t h e mass of
coat ing o r p a i n t s o l i d s i s no t genera l l y recommended because the s p e c i f i c
g r a v i t y of a coat ing s o l i d s tends t o vary w ide ly w i t h the degree and type o f
pigment employed. H igh l y pigmented pa in t s have much greater dens i ty than
unpi gmented c lea r coats or varnishes.
The recommended l i m i t a t i o n s assume t h e miscel laneous metal p a r t and
product f a c i l i t i e s merely convert an organic-borne coat ing t o a coat ing
low i n organic so lvent . They do no t consider t h e reduc t i on i n VOC emissions
which would r e s u l t f rom a decrease i n f i l m th ickness o r an increase i n t he
t rans fe r e f f i c i e n c y o f a coat ing. For example, assume a f a c i l i t y apply ing
convent ional coat ing a t 1.2 m i l s f i l m thickness, converts t o a coa t i ng
which, al though i t conta ins l ess organic solvent , does no t q u i t e meet t h e
recommended emission l i m i t . I f t h e new coat ing i s serv iceab le when app l ied
i n a t h i n n e r coat, i t may r e s u l t i n a reduc t ion i n VOC emissions comparable
t o o r even greater than a coat ing which meets the recommended emission l i m i t .
Another example would be t h e emission reduct ions t h a t accrue from
improved coat ing techniques. A f a c i l i t y t h a t converts f rom a convent ional
manual spray a p p l i c a t i o n ( a t a t r a n s f e r e f f i c i e n c y of 40-70 percent) t o an
automated electrostatic spray system (at a transfer efficiency of 70-90
percent), or from any spray system to a flow or dip coat system (at a
transfer efficiency of at least 90 percent) would realize a significant
reduction in VOC emissions. All of these possibilities should be considered
in any evaluation of the overall reduction achieved by the operator.
In those few faci 1i ties where add-on control equipment is a more
likely option, it may be more appropriate to state emission limits in terms
of control efficiency across the incinerator, adsorber, etc. Otherwise,
where limitations are expressed only in terms of the solvent content of the
coating, it would be necessary to determine the mass emission rate from the
control system and relate it to the quantity of coating applied during
the test period. This is a more complicated procedure since it may not be
easy to determine the amount of coating consumed during the test period and
an analysis by mass of the organic solvent directed to the control device
would be even more difficult. Chapter 5 of "Control of Volatile Organic
Emissions from Existing Stationary Sources - Volume I: Control Methods
for Surface Coating Operations" presents approaches which may be used.
When add-on type devices are selected as the compliance method, the air
pollution control agency should require that the coating lines be equipped
with an approved capture device to assure effective containment. The capture
system will likely have to be custom designed to accommodate the individual
plant ~(ariables which affect performance. When reviewing the design of such
a system, however, the air pollution control official must also consider
requirements imposed by the Occupational Safety and Health Administration
and the National Fire Prevention Association.
It is recognized that some coatings will emit more VOC than merely its
solvent content. This incremental VOC may come from three possible sources.
The first. is the possibility that some of the monomer may evaporate. Also,
if the film forms by condensation polymerization, the evolution of by-products
may be a compounding factor. Finally, it has been reported that the industry
is using increasing quantities of "blocking agentsi' which are released fram
the polymer matrix during the curing process.
There are now no approved analytical methods certified by the agency
for determining the quantity of VOC emitted by such reactions although
certainly the organic mass emission rate could be determined by expensive
and sophisticated analytical techniques. The more practical means of
quantifying the contribution of the polymerization reaction to the overall
emission problem would be by contacting the manufacturer of the coating.
Certainly, his knowledge of the fundamental chemical mechanisms involved
would at low calculation o f an emission rate based on the chemical reaction.
This emission will occur during the cure (if at all) which is usually
temperature initiated by the oven. If the oven is controlled by an incinerator,
then verification of the efficiency of the device should be sufficient to
assure compliance with the coating regulations.
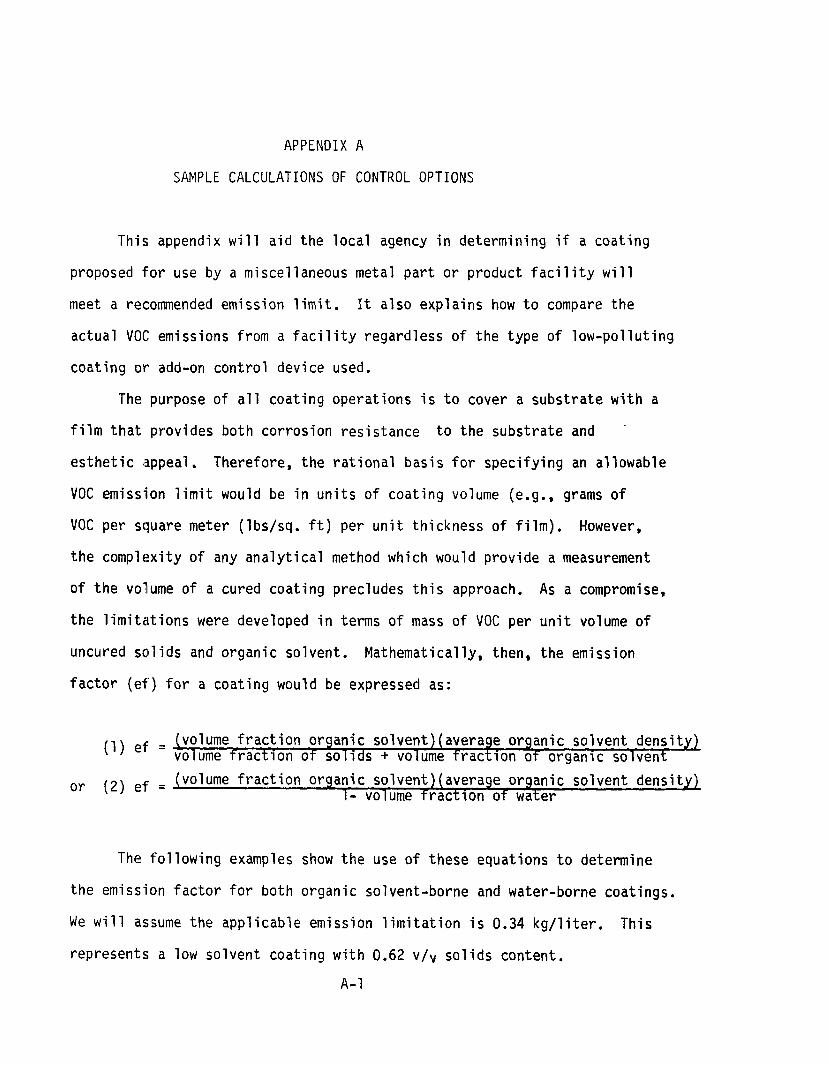
APPENDIX A
SAMPLE CALCULATIONS OF CONTROL OPTIONS
This appendix will aid the local agency in determining if a coating
proposed for use by a miscellaneous metal part or product facility will
meet a recommended emission limit. It also explains how to compare the
actual VOC emissions from a facility regardless of the type of low-polluting
coating or add-on control device used.
The purpose of all coating operations is to cover a substrate with a
film that provides both corrosion resistance to the substrate and
esthetic appeal. Therefore, the rational basis for specifying an a1 lowable
VOC emission limit would be in units of coating volume (e.g., grams of
VOC per square meter (lbs/sq. ft) per unit thickness of film). However,
the complexity of any analytical method which would provide a measurement
of the volume of a cured coating precludes this approach. As a compromise,
the limitations were developed in terms of mass of VOC per unit volume of
uncured solids and organic solvent. Mathematically, then, the emission
factor (ef) for a coating would be expressed as:
) ef = (volume fraction organic solvent) (average organic solvent density) volume traction of solids + volume fraction ot organic solvent
( 2 ) ef = (volume fraction organic solvent) (average organic solvent density) ,, 1- volume fract~on of water
The following examples show the use of these equations to determine
the emission factor for both organic solvent-borne and water-borne coatings.
We will assume the applicable emission limitation is 0.34 kg/liter. This
represents a low solvent coating with 0.62 v / ~ solids content.
A-1
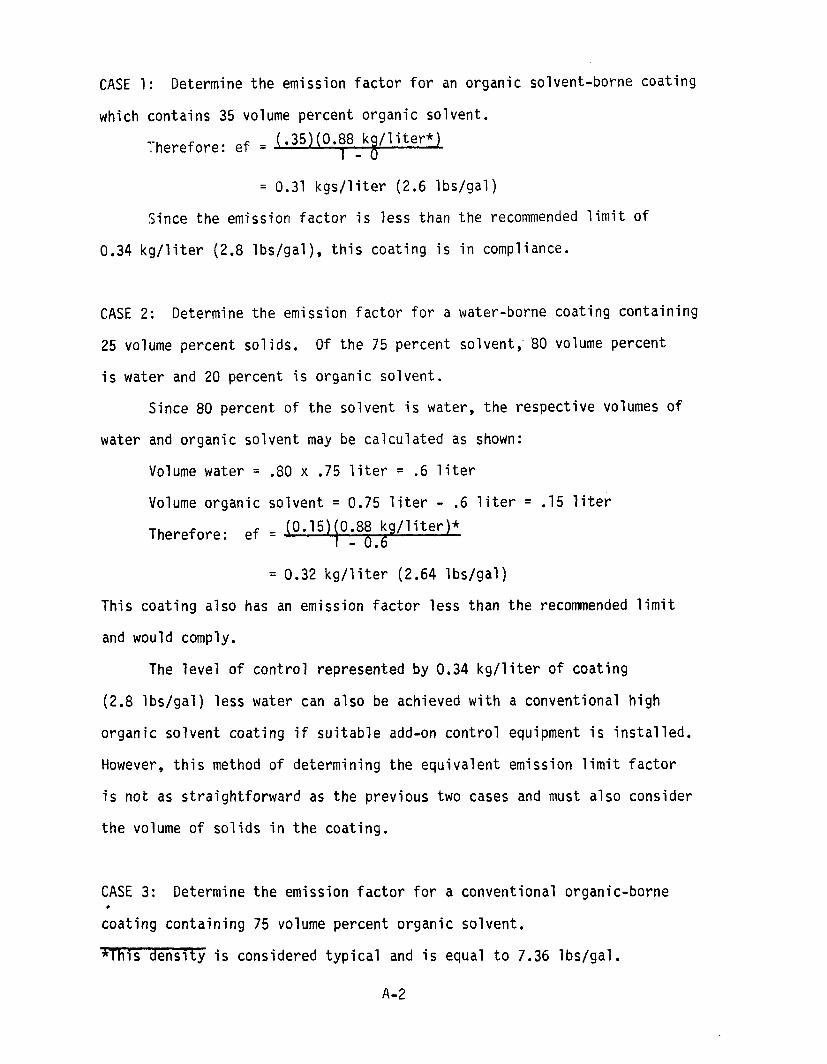
CASE 1: Determine the emission factor for an organic solvent-borne coating
which contains 35 volume percent organic solvent.
Therefore: ef = (.35)(0.88 -kg/liter*)
= 0.31 kgs/ 1iter (2.6 lbslgal)
Since the emission factor is less than the recommended limit of
0.34 kglliter (2.8 Ibs/gal), th is coating is in compliance.
CASE 2: Determine the emission factor for a water-borne coating containing
25 volume percent sol ids. O f the 75 percent solvent,' '80 volume percent
is water and 20 percent is organic solvent.
Since 80 percent of the solvent is water, the respective volumes of
water and organic solvent may be calculated as shown:
Volume water = .80 x .75 liter = .6 liter
Volume organic solvent = 0.75 liter - .6 liter = .15 liter
-= 0.32 kglliter (2.64 Ibs/gal)
This coating also has an emission factor less than the recommended limit
and would comply.
The level of control represented by 0.34 kglliter of coating
(2.8 'lbslgal) less water can also be achieved with a conventional high
organic solvent coating if suitable add-on control equipment is instal led.
However, this method of determin ing the equivalent emission limit factor
is not as straightforward as the previous two cases and must also consider
the volume of solids in the coat ing.
CASE 3: Determine the emission factor for a conventional organi c-borne . coating containing 75 volume percent organic solvent.
*[his density is considered typical and is equal to 7.36 lbslgal.
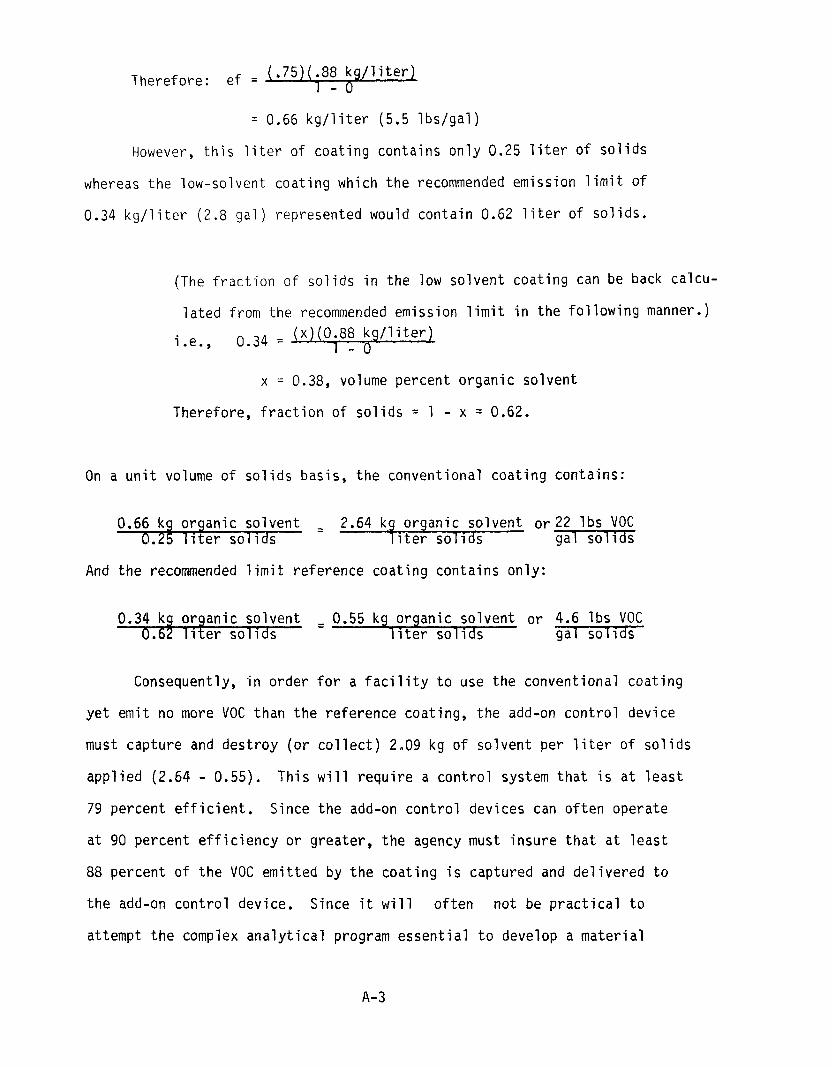
= 0.66 kg/liter (5.5 Ibs/gal)
However, this liter of coating contains only 0.25 liter of solids
whereas the low-solvent coating which the recommended emission limit of
0.34 kg/liter (2.8gal ) represented would contain 0.62 liter of solids.
(The fraction of solids in the low solvent coating can be back calcu-
lated from the recommended emission limit in the following manner.) i.e., 0.34 = (~)(0.88kglliter)
1 - 0
x = 0.38, volume percent organic solvent
Therefore, fraction of solids = 1 - x = 0.62.
On a unit volume of solids basis, the conventional coating contains:
0.66 kg organic solvent -- 2.64 kg organic solvent or22 Ibs VOC 0.25 liter solids liter solids gal solids
And the recommended 1imi t reference coating contains only:
0.34 kg organic solvent -- 0.55 kg organic solvent or 4.6 lbs VOC 0.62 liter solids liter solids gal solids
Consequently, in order for a facility to use the conventional coating
yet emit no more VOC than the reference coating, the add-on control device
must capture and destroy (or collect) 2.09 kg of solvent per liter of solids
applied (2.64 - 0.55). This will require a control system that is at least
79 percent efficient. Since the add-on control devices can often operate
at 90 percent efficiency or greater, the agency must insure that at least
88 percent of the VOC emitted by the coating is captured and delivered to
the add-on control device. Since it will often not be practical to
attempt the complex analytical program essential to develop a material
balance around t h e coat ing a p p l i c a t i o n and f l a s h o f f areas and ovens,
t h e agency may c e r t i f y an acceptable capture system based on good
1engineer ing p rac t i ce .
APPENDIX A REFERENCE
1. Young, Dexter E: , Environmental P r o t e c t i o n Agency, memorandum concerning requirements f o r v e n t i l a t i o n o f spray booths and ovens. Dated March 10, 1977.
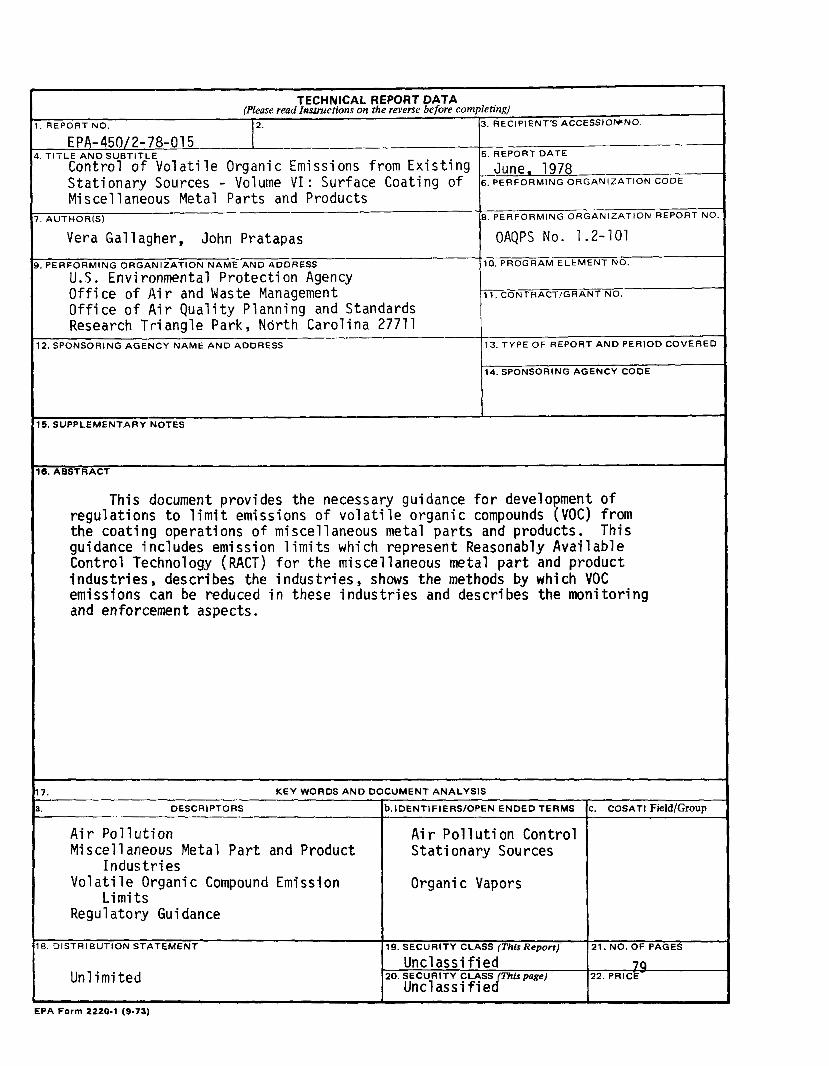
I
TECHNICAL REPORT DATA (Please read Iurtlztctlons on the reverse before completing)
1 . REPORT NO. 2. (3. RECIPIENT'S ACCESSIOWNO.
I -
Control o f V o l a t i l e Organic Emissions from S ta t i ona ry Sources - Volume V I : Surface M i scel laneous Metal Parts and Products
8. PERFORMING ORGANIZATION REPORT NO
I Vera Gal lagher, John Pratapas I OAQPS No. 1.2-101
NAME AND ADDRESS 10. PROGRAM ELEMENT NO.
U.S. Environmental P ro tec t i on Agency o f fice o f Ai r and Waste ana age ment 11. CONTRACTIGRANT NO.
O f f i c e o f A i r Q u a l i t y Planning and Standards Research T r i angle Park, North Carol ina 27711
NAME A N D ADDRESS
14. SPONSORING AGENCY CODE I 15. SUPPLEMENTARY NOTES
16. ABSTRACT
This document provides the necessary guidance f o r development of regu la t ions t o l i m i t emissions o f vo l a t i l e o rgan ic compounds (VOC) from the coat ing operat ions of m i s c e l l aneous metal p a r t s and products. This guidance i,ncludes emission 1 im i t s which represent Reasonably Avai 1 ab le Contro l Technology (RACT) f o r t he miscellaneous metal p a r t and product i n d u s t r i e s , describes the i ndus t r i es , shows the methods by which VOC emissions can be reduced i n these i n d u s t r i e s and describes the mon i to r ing and enforcement aspects.
KEY WORDS A N D DOCUMENT ANALYSIS
DESCRIPTORS ~.IDENTIFIERS/OPENENDEDTERMS c. c o S A T l F i e l d / G r o ~ p
A i r P o l l u t i o n A i r P o l l u t i o n Contro l M isce l l aneous Metal P a r t and Product S ta t ionary Sources
I n d u s t r i e s Vol a t i l e Organic Compound Emission Organi c Vapors
L im i t:s Regulatory Guidance I I I
19. SECURITY CLASS (This Repor t j 21. NO. OF PAGES
Unc lass i f i ed 74 Unl imi ted 20. SECURITY CLASS This page)
~ n c l a s s if i e d 22. PRICE-
I I EPA Form 2220-1 (9-73)
United States Office of Air. Noise, and Radiation Environmental Protection Office of Air Quality Planning and Standards 4 e n w Research Triangle Park NC 2771 1
Official Business Publ~cationNo EPA-450/2-78-015 Postage and Penalty for Private Use Fees Patd 8300 Environmental
Protectton US.MULAgency EPA 335
If your address is incorrect, please change on the above label: tear off; and return to the above address. If you do not desire toconttnue receiving this technical report sertes, CHECK HERE 0 ; tear off label; and return it to the above address.
Copyright © 2022 FDOKUMEN

