


Bahasa
Halaman
Hukum


ISSN 2636-8498
PRESS
EnvironmentalResearch Technology&
www.ert.yildiz.edu.tr
Year 2021Volume 4Number 4
EDITOR-IN-CHIEFAhmet Demir, Yildiz Technical University, Istanbul, TurkeyMehmet Sinan Bilgili, Yildiz Technical University, Istanbul, Turkey
ACADEMIC ADVISORY BOARDAdem BasturkMustafa OzturkLutfi AkcaOktay TabasaranAhmet Demir
SCIENTIFIC DIRECTORAhmet Demir, Yildiz Technical University, Istanbul, Turkey
ASSISTANT EDITORHanife Sari Erkan, Yildiz Technical University, Istanbul, Turkey
LANGUAGE EDITORGüleda Engin, Yildiz Technical University, Istanbul, Turkey
EDITORIAL BOARDAndjelka Mihajlov, Serbia; Artur J. Badyda, Poland; Aysegul Pala, Turkey; Aysen Erdincler, Turkey; Azize Ayol, Turkey; Bulent Keskinler, Turkey; Didem Ozcimen, Turkey; Erwin Binner, Austria; Eyup Debik, Turkey; F. Dilek Sanin, Turkey; Gulsum Yilmaz, Turkey; Hamdy Seif, Lebanon; Hanife Buyukgungor, Turkey; Ilirjan Malollari, Albania; Ismail Koyuncu, Turkey;
Jaakko Puhakka, Finland; Lucas Alados Arboledas, Spain; Mahmoud A. Alawi, Jordan;
Marcelo Antunes Nolasco, Brazil; Martin Kranert, Germany; Mehmet Emin Aydin, Turkey;
Mesut Akgun, Turkey; Mukand S. Babel, Thailand; Mustafa Odabasi, Turkey; Mufide Banar, Turkey; Mustafa Okutan, Turkey; Mufit Bahadi̇r, Germany; Neslihan Dogan Saglamti̇mur, Turkey; Nihal Bektas, Turkey; Nurdan Gamze Turan, Turkey; Osman Arikan, Turkey; Osman Nuri Agdag, Turkey; Omer Akgi̇ray, Turkey; Ozer Ci̇nar, Turkey; Pier Paolo Manca, Italy; Recep Boncukcuoglu, Turkey; Saim Özdemi̇r, Turkey; Sameer Afi̇fi, Palestine; Serdar Aydi̇n, Turkey;
Timothy O. Randhi̇r, United States; Ülkü Yeti̇s, Turkey; Victor Alcaraz Gonzalez, Mexico; Yaşar Nuhoğlu, Turkey
Volume 4 Number 4 Year 2021
Environmental Research & Technology
ISSN 2636-8498
Volume 4 Number 4 Year 2021
CO-EDITORS (AIR POLLUTION)
Arslan Saral, Turkey; Mohd Talib Lati̇ f, Malaysia; Nedim Vardar, Puerto Rico; Sait Cemil
Sofuoğlu, Turkey; Wina Graus, Netherlands
CO-EDITORS (ENVIRONMENTAL ENGINEERING AND SUSTAINABLE SOLUTIONS)
Bulent Inanc, Turkey; Guleda Engi̇ n, Turkey; Hossein Kazemi̇ an, Canada; Raffaella Pomi,
Italy; Yilmaz Yi̇ ldi̇ rim, Turkey; Zenon Hamkalo, Ukraine
CO-EDITORS (WASTE MANAGEMENT)
Bestami Ozkaya, Turkey; Bulent Topkaya, Turkey; Kahraman Unlu, Turkey; Mohamed
Osmani, United Kingdom; Pin Jing He, China
CO-EDITORS (WATER AND WASTEWATER MANAGEMENT)
Ayşe FİLİBELİ, Turkey; Baris CALLİ, Turkey; Marina PRİSCİANDARO, Italy; Selvam
KALİYAMOORTHY, Japan; Subramanyan VASUDEVAN, India
Abstracting and Indexing: TR-DİZİN, Index Copernicus, ROAD, SJI Factor, EurAsian Scientific Journal Index (ESJI) ,Research Bib(Academic Resource Index), Scientific Indexing Services, ASOS IndexJournal Description: Environmental Research & Technology is a peer-reviewed, free of charge, International multidisciplinary Journal published by Environmental Engineering Department of Yildiz Technical University, Turkey. The Journal offers complete coverage of environmental issues with original contributions such as Research Articles, Short Communications, Review Papers, Book Reviews, Editorial Discussions, and Conference Papers. Suggestions for Special Issues are also welcomed. Publisher: Yildiz Technical UniversityEditor-in-Chief: Prof. Dr. Ahmet Demir, [email protected]; Prof. Dr. Mehmet Sinan Bil̇gil̇i, [email protected] of Publication: EnglishFrequency: 4 issues per yearRegular Issues: March (1) - July (2) - September (3) - November (4)Publication Type: Online e-version
Environmental Research & Technology
ISSN 2636-8498
Volume 4 Number 4 Year 2021
Environmental Research & Technology
Research ArticlesDeveloping an approach for the sustainability assessment of groundwater remediation technologies based on multi criteria decision makingSamahir Sheikh IDRİS, Emel TOPUZ
Which kinetic model best fits the methane production on pig farms with covered lagoon digesters?André ROSA, Juciara LOPES, Alisson BORGES, Izabelle SOUSA, Antonella ALMEİDA,Silas MELO
Cefuroxime oxidation with new generation anodes: Evaluation of parameter effects, kinetics and total intermediate productsAyşe KURT
An investigation based on removal of ibuprofen and its transformation products by a batch activated sludge process: A kinetic studyAyşe ÖZGÜVEN, Dilara ÖZTÜRK, Tuba BAYRAM
Biosorption of Ni2+ and Cr3+ in synthetic sewage: Adsorption capacities of water hyacinth (Eichhornia crassipes)Francis James OGBOZIGE, Helen Uzoamaka NWOBU
Economic evaluation of fluoride removal by membrane capacitive deionizationHalil İbrahim UZUN, Eyüp DEBİK
Macroporous thermoset monoliths from glycidyl methacrylate (GMA)-based high internal phase emulsions (HIPEs): Effect of cellulose nanocrystals (CNCs) as filler - Functionalization and removal of Cr(III) from aqueous solutionsBurcu KEKEVI, Ali ESLEK, E. Hilal MERT
Boron removal from aqueous solutions by polyethyleneimine- Fe3+ attached column adsorbentsŞahin AKPINAR, Hasan KOÇYİĞİT, Fatma GÜRBÜZ, Mehmet ODABAŞI
The agricultural waste inventory on the regional basis in Turkey: Valuation of agricultural waste with zero-waste concept in the scope of circular economySimge SERTGÜMEÇ, Ayşe Nur USTA, Cevat ÖZARPA
Bioremediation of areas devastated by industrial wasteZehrudin OSMANOVIC, Nedžad HARACIC, Ibrahim SARAJLIC, Amila DUBRAVAC, Eldin HALILCEVIC
Household water consumption behavior during the COVID-19 pandemic and its relationship with COVID-19 casesEsma BİRİŞÇİ, Ramazan ÖZ
CONTENTS
293
308
317
329
342
352
358
369
377
386
391
ISSN 2636-8498
Developing an approach for the sustainability assessment of groundwater remediation technologies based on multi criteria
decision making
Environ Res Tec, Vol. 4, Issue. 4, pp. 293–307, December 2021
Environmental Research and Technologyhttps://ert.yildiz.edu.tr - https://dergipark.org.tr/tr/pub/ert
DOI: https://doi.org/10.35208/ert.903897
Research Article
Samahir Sheikh IDRİS1 , Emel TOPUZ*2
1Department of Chemical Engineering, Gebze Technical University, Kocaeli, Turkey2Department of Environmental Engineering, Gebze Technical University, Kocaeli, Turkey
*Corresponding author.*E-mail address: [email protected]
Published by Yıldız Technical University Press, İstanbul, TurkeyCopyright 2021, Yıldız Technical University. This is an open access article under the CC BY-NC license (http://creativecommons.org/licenses/by-nc/4.0/).
ARTICLE INFO
Article historyReceived: 26 March 2021Revised: 16 September 2021Accepted: 06 October 2021
Key words:Analytic hierarchy process; Fuzzy numbers; Groundwater remediation; Sustainability assessment multi-criteria decision-making
ABSTRACT
Groundwater is regarded as an important supply of drinking water, as well as for agricultural and industrial purposes. Groundwater pollution worsens as a result of several contaminants such as industrial, urban, and agricultural activities, and the difficulty is to select appropriate groundwater remediation methods. This research develops a technique for assessing the sustain-ability of groundwater remediation methods by integrating the Multi-Criteria Decision Making (MCDM) method with a Fuzzy Inference Engine. A standard approach for assessing the sustain-ability of groundwater remediation systems has been developed, consisting of four major crite-ria: economic, technical, environmental, and social. Following the calculations and determining the priority of all the criteria and techniques based on the weights, the results show the sequence of technologies in which Pump and Treat is the best with 7.83, followed by air stripping with 7.04, and monitored natural attenuation and permeable reactive barrier were the last with 3.70 and 3.19, respectively. The criteria that give P&T the most weight is both the technical and social criterion, with a weight of 8.18, while the criterion with the lowest weight was the economic criterion, with a weight of 4.22. The technical, environmental, and social aspects of P&T were all high, making it the optimum technology where the decision-maker or stakeholder can deal with the decline in the economic component, which is also proof of P&T's preferability and the most sustainable one, and It was also feasible to examine all options to determine which factors are reducing their sustainability and which should be addressed in order to enhance sustainability.
Cite this article as: Idris SS, Topuz E. Developing an approach for the sustainability assess-ment of groundwater remediation technologies based on multi criteria decision making. En-viron Res Tec 2021;4:4:293–307.
INTRODUCTION
Groundwater is the essential component and form of the world's freshwater resources (about two-thirds); it is the
second biggest freshwater resource after polar ice caps. Groundwater is created by Karst formations from the dis-solution of soluble rocks such as limestone, dolomite, and gypsum and is found in pore spaces in the ground [1].
Environ Res Tec, Vol. 4, Issue. 4, pp. 293–307, December 2021294
Groundwater is more valuable than surface water since it is utilized for solely practical needs such as drinking and is rarely used in situ for non-consumptive goals; however, it is now used for irrigation in some areas. Groundwater bodies differ from surface water bodies, as evidenced by the fact that they are used differently [2]. Unfortunately, ground-water resources are polluted or contaminated because of anthropogenic activities [1]. A deterioration of the phys-ical, chemical and biological characteristics decreases the water quality [3]. Groundwater pollution occurs due to the high amount of contaminant brought to the groundwater through filtration, sorption, chemical processes, microbio-logical decomposition, or dilution. Groundwater pollution can affect or could be affected by many factors including environmental deterioration [4], global warming [5, 6], depletion of the ozone layer [6], impacts on the health of living organisms [3] and reduced efficiency or infertility of farmlands and crop fields [7]. Pollution of groundwater can lead to health concerns, degradation of the ecology, and shortages of water. Health issues may include minor con-ditions such as nausea, vomiting, irritation of the eyes and nose, diarrhea, or chronic conditions, such as cancer, hep-atitis, kidney damage, anemia, nervous system problems, circulation problems, bone conditions, hair loss, and prob-lems with reproduction. It might lead to serious illness, and in rare circumstances, it could lead to death. Water scar-city can happen due to high dependence of the people on groundwater in their daily life [3].
Treatment aims to preserve the health, environment, and agricultural lands of humans and remove hazardous products, components, or pollutants which affect soil and groundwater or reduce the risk of pollutants [8] and make groundwater clean and appropriate for use in humanity and agriculture [9]. Also, It can be used in aquifers to increase the water level. In addition to reducing water pollution lev-els and diluting water composition. So, groundwater may be used to preserve resources in the groundwater [10].
Many pollutants affect the soil and the groundwater with harmful impacts such as different industrial wastes and processes [9, 11], pesticides and organic and non-organic pollutants [12], mineral oil and heavy metals [8] such as Arsenic [13], grey water footprint (GWF) which contain Nitrate, and Arsenic [10].
Groundwater must be cleansed before it can be used as a water resource, and the purification process is known as remediation. Technical concepts for remediation can be di-vided into physical, chemical, biological, stabilization, and thermal treatment procedures; depending on the site, these remediation methods might be in-situ or ex-situ. Contain-ment, pump-and-treat, extraction, stabilization/solidifica-tion, soil washing, air stripping, precipitation, vitrification, thermal desorption, and bioremediation are the most wide-ly employed methods [14]. These technologies each have
their performance and preferences in a variety of areas; thus, stakeholders or decision-makers must assess and pick the appropriate technology to fulfill their goals. This option is hard to make owing to the challenges of remediation, such as significant expenses [3], presence of the chemical compounds, which makes it a challenge to remove them from the surrounding soil and the groundwater itself [15]. Furthermore, unlike surface or air pollution, the primary difficulty is that it is below ground and undetectable; de-cades might pass before it is ever recognized. Because it is subterranean and three-dimensional, quantifying and map-ping is difficult. As a result, several costly cores may need to be drilled to determine their location, and even then, some educated guesswork is required. Furthermore, groundwater does not stay in one location for long, allowing pollutants to enter drinking water aquifers and necessitating costly pu-rifying operations [16]. After identifying the source of the groundwater contamination, the requirement for remedi-ation remains an impediment to selecting the appropriate technology to provide the greatest treatment. In terms of sustainability, there are numerous uncertainties connected with the choice of groundwater remediation techniques. Regulatory, political, and legal concerns can all be stum-bling blocks. If the party responsible for the pollution is not readily identified or is no longer in business, responsibility may be determined in court prior to the commencement of the cleanup procedure. When remediation work does begin, ground conditions and the components inside the earth may have changed from when the initial assessment was made [1]. The nature of the technology is almost all under the barriers of technological change and innovation in general, so spending a long time to choose the best tech-nology can be harmful, not beneficial because every day a new update could occur, and more impact is happening [15]. Diseases are widespread among many populations or the impact of plants and animals from the pollution [2, 3]. Factory owners and facilities close to groundwater sites do not agree to stop work until the problem is solved and are not excluded from being a party to pollution until this is proven [17].
Sustainability assessment can be used to pick the right tech-nology in groundwater remediation among many choices; to achieve the target or the goal of the stakeholders or the decision-makers. Sustainability assessment examines the performances of different alternative technologies based on their economic, technical, social, and environmental [11], [18]. Political aspects are also included in sustainability as-sessment in some studies [11]. These aspects include sev-eral criteria that should integrate into the groundwater re-mediation technologies' sustainability assessment [11, 18].
Multi-Criteria Decision Analysis (MCDA) is a method for making the decision process in a structured and well-orga-nized way, thus providing decision support when there is a large amount of detailed information. MCDM is widely
Environ Res Tec, Vol. 4, Issue. 4, pp. 293–307, December 2021 295
used in management and decision-making, particularly in environmental and energy problems [11, 18, 19]. MCDM has many methods that are used in the determination and weighting the best alternative and the most useful criterion, such as Hierarchy Process (AHP), PROMETHEE (Prefer-ence Ranking Organization Method for Enrichment Eval-uation), TOPSIS (Technique for Order Preference by Sim-ilarity to an Ideal Solution), and Analytic Network Process (ANP) and fuzzy-AHP. AHP is the most frequently used method in many environmental studies [11, 18].
There are previous studies in the literature, including the evaluation of groundwater remediation technologies. There is an integration between formulation and computation methods in the earlier studies; however, their computation efficiency is still open to improvement because of uncer-tainties in many techniques used in groundwater remedi-ation. Other alternatives should be added, like genetic al-gorithm methods as mentioned in [1]. In [3], dealing with multiple uncertainties in real-world cases was shown, scores were evaluated based on economy and technology with four-time periods only using AHP. Some studies focused on specific pollutants for selection remediation technolo-gies like [13] that focused solely on removing the arsenic compounds from the groundwater or criteria for selecting technologies were very limited [19]. Another practice for sustainable remediation for contaminated groundwater is based on Decision Making Trial and Evaluation Labora-tory (DEMATEL) and Analytic Network Process (ANP). Although these methods were beneficial, it is limited to ex-ecute for remediation measurement. Therefore, it is needed to propose an approach that can tolerate the uncertainties related to the implementation of remediation technologies, count all sustainability aspects including technical, eco-nomic, social, and environmental, and be used for all types of groundwater remediation projects independently from pollutant or location.
In this study, the main goal is to develop a novel framework for the sustainability assessment of groundwater remedia-tion technologies by using AHP through the combination of Fuzzy Inference Engines (FAHP). Because searching for the most sustainable technology for groundwater remedi-ation demands multiple decision criteria that may contain environmental, technical, economic, and social aspects. A fuzzy inference engine can provide tolerance for the uncertainties related to the implementation of remedia-tion technologies since the expert opinions can be quan-tified. Our approach aims to support decision-makers in selecting the most appropriate groundwater technology for their cases based on sustainability since this approach can serve for any kind of groundwater pollution in any place. Sustainability assessment for groundwater remedia-tion technology has four main criteria: Economic criteri-on, which means all economical and cost belongings. The technical criterion used generally with the field relates to
technology. The environmental criterion means a most of most negative impact on the environment. The social cri-terion studies the maximization of the social welfare of people. Every criterion has its sub-criterion, and all will be explained in detail [11, 18–20].
MATERIALS AND METHODS
Proposed Sustainability Assessment Approach for Groundwater Remediation TechnologiesAn approach for the sustainability assessment of ground-water technologies using AHP and a fuzzy inference engine was proposed in this study. AHP includes a set of criteria, and the evaluation of these criteria relies heavily on pre-vious reviews and/or the opinions of experts and surveys. If the decision-maker is in a state of ambiguity and, then fuzzy logic is the ideal technique in this case. AHP method is not very efficient when a user preference cannot define intelligibly since it cannot reflect vague human thoughts. Therefore, using the fuzzy inference engine instead of an averaging technique provides expert opinions for quan-tification. Fuzzy numbers can include the scoring step of AHP methodology, and the fuzzy inference engine can be adapted to the last calculation step of AHP. This combined version of AHP can be called FAHP. AHP establishes the hierarchy, and the fuzzy set concept makes the scoring and comparison process resilient and eligible to expound ex-perts’ preferences. The score of each criterion and the com-parison values are given by three numerical values, triangle fuzzy sets [22]. And final quantification is made using fuzzy inference engine rules.
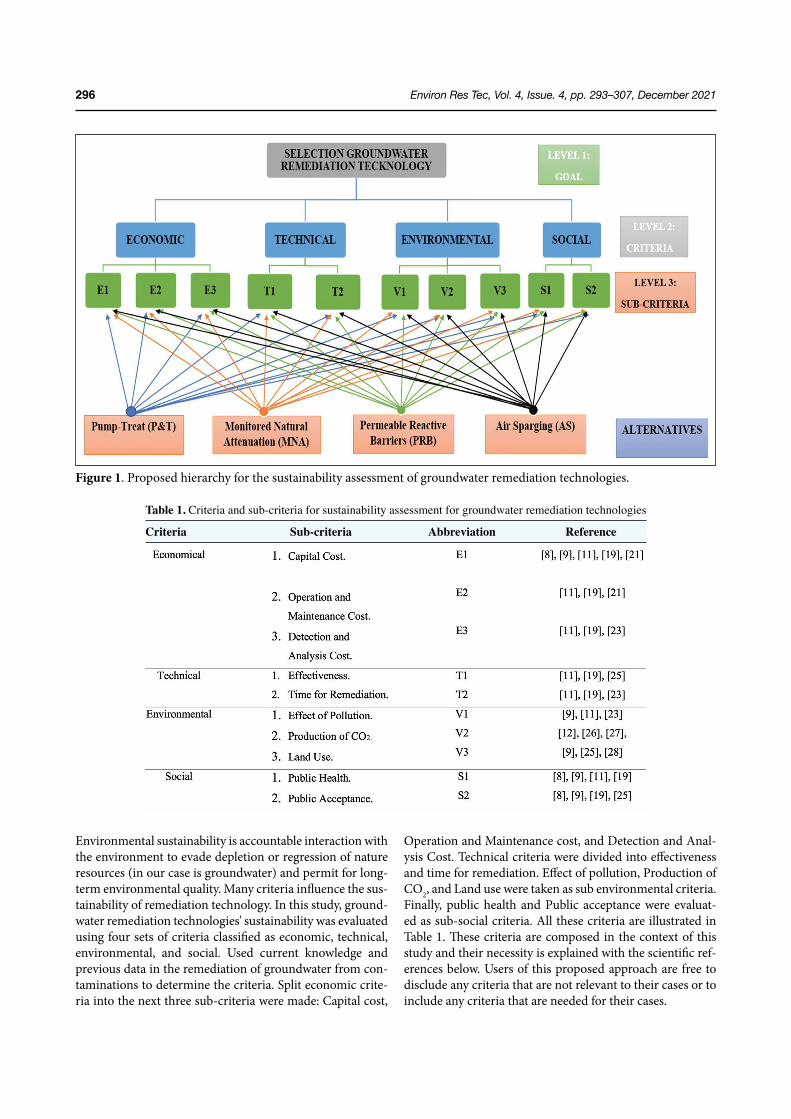
Developing the Hierarchy For AHPThe first procedure is building a hierarchy for the deci-sion. The AHP problem hierarchy contains a goal (deci-sion to be made), various alternatives for getting that goal, and insignificant criteria on which the other options can be judged that connect to the purpose. The first level of the hierarchy is the target; in our case, the goal was to assess groundwater remediation technologies' sustainability. The second level in the hierarchy is setting the main criteria: sustainability assessment criteria, Economic, Technical, Environmental, and Social. The third level is to determine sub-criteria. Considering those requirements, a combined simplified decision hierarchy to pick out an appropriate technology for the groundwater remediation process, [22] as shown in Figure 1. Fourth level is the alternatives which are selected among the most commonly applied ground-water remediation technologies [11, 19, 23] to demon-strate the application of the proposed approach consists of; Pump-treat (P&T), Monitored natural attenuation (MNA), Permeable reactive barriers (PRB), and Air sparg-ing (AS). Users of this approach are free to select their al-ternatives for their cases.
Environ Res Tec, Vol. 4, Issue. 4, pp. 293–307, December 2021296
Environmental sustainability is accountable interaction with the environment to evade depletion or regression of nature resources (in our case is groundwater) and permit for long-term environmental quality. Many criteria influence the sus-tainability of remediation technology. In this study, ground-water remediation technologies' sustainability was evaluated using four sets of criteria classified as economic, technical, environmental, and social. Used current knowledge and previous data in the remediation of groundwater from con-taminations to determine the criteria. Split economic crite-ria into the next three sub-criteria were made: Capital cost,
Operation and Maintenance cost, and Detection and Anal-ysis Cost. Technical criteria were divided into effectiveness and time for remediation. Effect of pollution, Production of CO2, and Land use were taken as sub environmental criteria. Finally, public health and Public acceptance were evaluat-ed as sub-social criteria. All these criteria are illustrated in Table 1. These criteria are composed in the context of this study and their necessity is explained with the scientific ref-erences below. Users of this proposed approach are free to disclude any criteria that are not relevant to their cases or to include any criteria that are needed for their cases.
Figure 1. Proposed hierarchy for the sustainability assessment of groundwater remediation technologies.
Table 1. Criteria and sub-criteria for sustainability assessment for groundwater remediation technologies
Criteria Sub-criteria Abbreviation Reference
Environ Res Tec, Vol. 4, Issue. 4, pp. 293–307, December 2021 297
Economic CriterionCapital Cost: The capital cost indicates the establishment of plants and facilities for groundwater remediation [8, 9, 11, 18, 20].Operation and Maintenance Cost: The operation and main-tenance costs are linked to the outlays of operation and maintenance of the plants and facilities for groundwater remediation [11, 18, 20].Detection and Analysis Cost: The detection and analysis costs contain all the outlays for analysis and detection when utiliz-ing the technologies for groundwater remediation [11, 18, 22].
Technical CriterionEffectiveness: It means the effectiveness of remediation for waste removal from groundwater [11, 18, 23].Time for remediation: The time for remediation represents the needed time for groundwater remediation [11, 18, 22].
Environmental CriterionEffect of pollution: It measures the integrated environmen-tal impacts when applying the technologies for groundwa-ter remediation [9, 11, 22].Production of CO2: This criterion refers to the total amount of CO2 emissions that should be avoided if the groundwater remediation or the mechanisms leads to it [12, 25, 26].Land use: This criterion is used to analyze the land that will be used for the groundwater remediation process [9, 26, 27].We have to mention that, In recent years, global warming has become an environmental challenge as a result of green-house gas emissions (GHEs), and both are severe issues. GHEs are released from carbon dioxide (CO2), methane (CH4), and nitrous oxide (N2O) [28–31], as well as water vapor, ozone, chlorofluorocarbons, and sulfur hexafluoride [28], all of which are generated by wastewater treatment plants (WWTPs) [28, 29].There are two types of WWTPs sources. On-site or direct source emissions from fossil fuel burning, methane emis-sions, and process emissions of other greenhouse gases [28], collection system emissions [29], emissions related to the biochemical treatment process, and microbiological ac-tivity in wastewater [31] are among them.
Off-site or indirect sources are emissions from electricity use in the plant [28, 30, 31], heat, air consumption, trans-portation, chemical use, and sludge stabilization and dis-posal and reuse processes [29, 31].
CO2 was the most significant greenhouse gas released as a result of the biodegradation of organic and inorganic com-pounds [28, 31].
As a solution to this hazardous problem of reducing GHG emissions from various industrial facilities, we may min-imize energy consumption, which will also improve the economics [28] and process equipment (with the majority focused on biological processes including activated sludge, stabilization ponds, and aerobic reactors) [31], biogas re-covery decreased greenhouse gas emissions as well [29].
Social CriterionPublic health: It measures the effect on the residents' health when applying the technologies for groundwater remedia-tion [8, 9, 11, 18].
Public acceptance: This including the acceptance of the technologies for the groundwater remediation process [9, 18, 24], also it is the acceptance of the land that will use [8], furthermore it indicates that citizens accept all the effects of starting a project such as noise, turbulence, road blocking, and odors if there is [24].
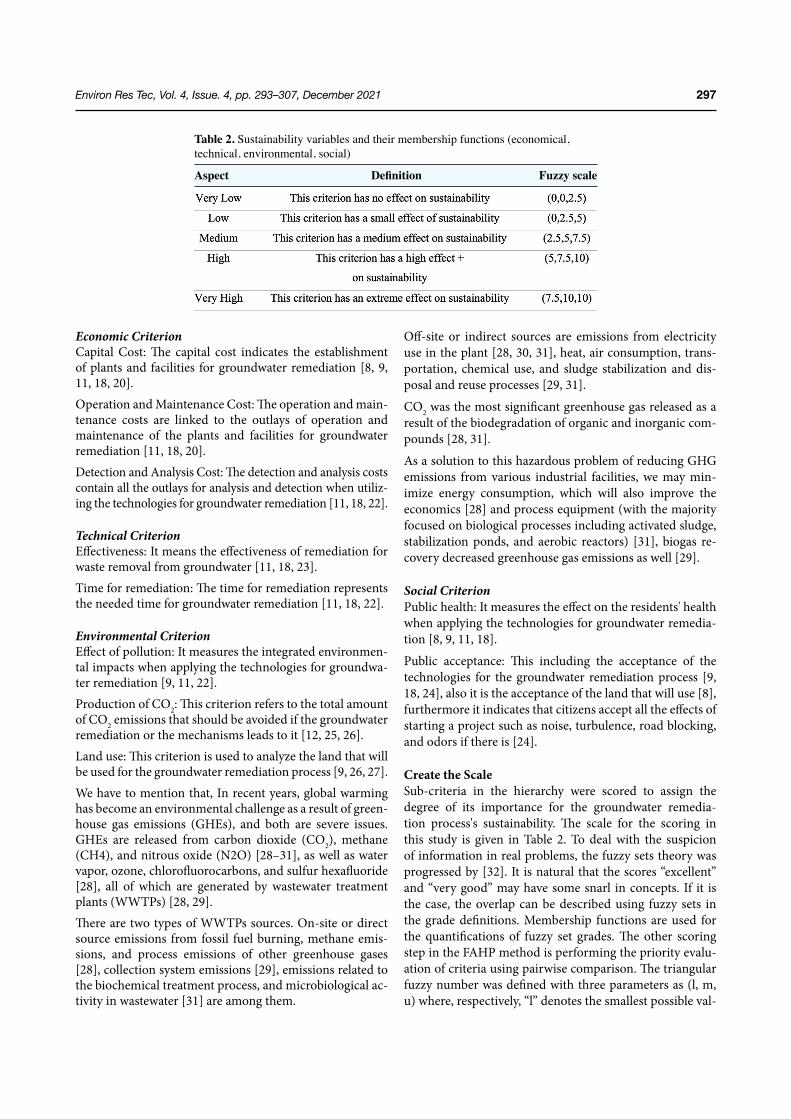
Create the ScaleSub-criteria in the hierarchy were scored to assign the degree of its importance for the groundwater remedia-tion process's sustainability. The scale for the scoring in this study is given in Table 2. To deal with the suspicion of information in real problems, the fuzzy sets theory was progressed by [32]. It is natural that the scores “excellent” and “very good” may have some snarl in concepts. If it is the case, the overlap can be described using fuzzy sets in the grade definitions. Membership functions are used for the quantifications of fuzzy set grades. The other scoring step in the FAHP method is performing the priority evalu-ation of criteria using pairwise comparison. The triangular fuzzy number was defined with three parameters as (l, m, u) where, respectively, “l” denotes the smallest possible val-
Table 2. Sustainability variables and their membership functions (economical, technical, environmental, social)
Aspect Definition Fuzzyscale
Environ Res Tec, Vol. 4, Issue. 4, pp. 293–307, December 2021298
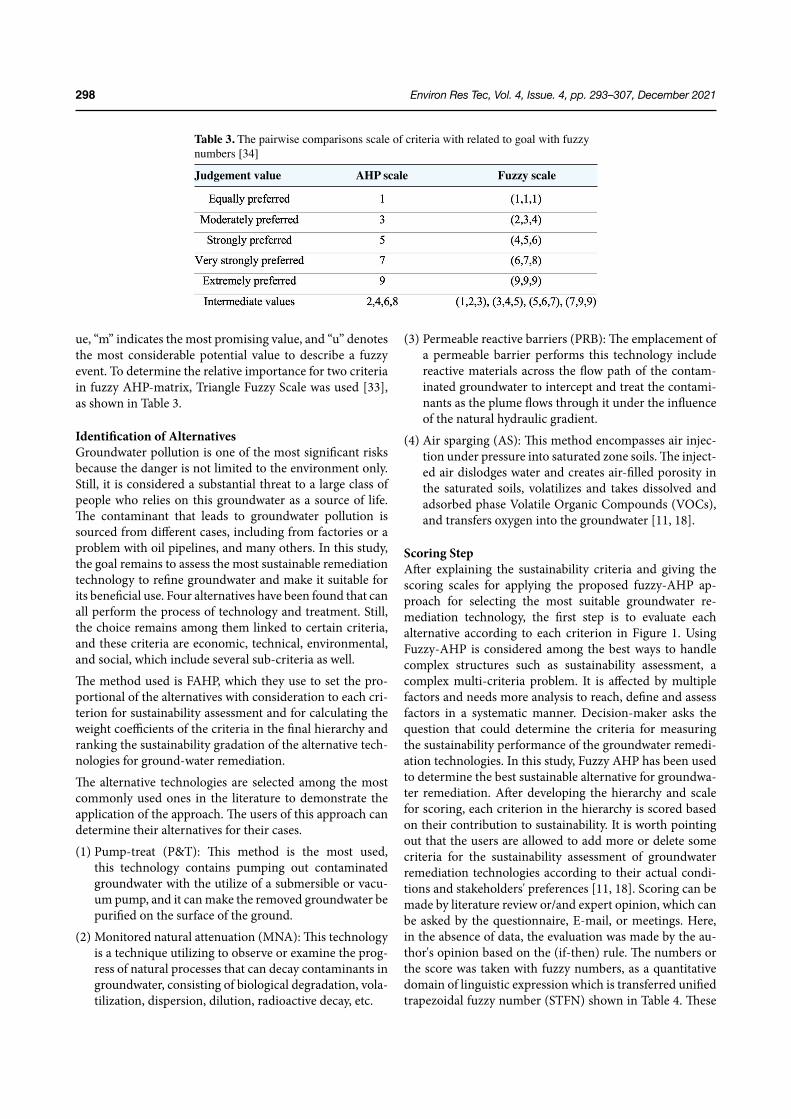
ue, “m” indicates the most promising value, and “u” denotes the most considerable potential value to describe a fuzzy event. To determine the relative importance for two criteria in fuzzy AHP-matrix, Triangle Fuzzy Scale was used [33], as shown in Table 3.
Identification of AlternativesGroundwater pollution is one of the most significant risks because the danger is not limited to the environment only. Still, it is considered a substantial threat to a large class of people who relies on this groundwater as a source of life. The contaminant that leads to groundwater pollution is sourced from different cases, including from factories or a problem with oil pipelines, and many others. In this study, the goal remains to assess the most sustainable remediation technology to refine groundwater and make it suitable for its beneficial use. Four alternatives have been found that can all perform the process of technology and treatment. Still, the choice remains among them linked to certain criteria, and these criteria are economic, technical, environmental, and social, which include several sub-criteria as well.The method used is FAHP, which they use to set the pro-portional of the alternatives with consideration to each cri-terion for sustainability assessment and for calculating the weight coefficients of the criteria in the final hierarchy and ranking the sustainability gradation of the alternative tech-nologies for ground-water remediation.The alternative technologies are selected among the most commonly used ones in the literature to demonstrate the application of the approach. The users of this approach can determine their alternatives for their cases.(1) Pump-treat (P&T): This method is the most used,
this technology contains pumping out contaminated groundwater with the utilize of a submersible or vacu-um pump, and it can make the removed groundwater be purified on the surface of the ground.
(2) Monitored natural attenuation (MNA): This technology is a technique utilizing to observe or examine the prog-ress of natural processes that can decay contaminants in groundwater, consisting of biological degradation, vola-tilization, dispersion, dilution, radioactive decay, etc.
(3) Permeable reactive barriers (PRB): The emplacement of a permeable barrier performs this technology include reactive materials across the flow path of the contam-inated groundwater to intercept and treat the contami-nants as the plume flows through it under the influence of the natural hydraulic gradient.
(4) Air sparging (AS): This method encompasses air injec-tion under pressure into saturated zone soils. The inject-ed air dislodges water and creates air-filled porosity in the saturated soils, volatilizes and takes dissolved and adsorbed phase Volatile Organic Compounds (VOCs), and transfers oxygen into the groundwater [11, 18].
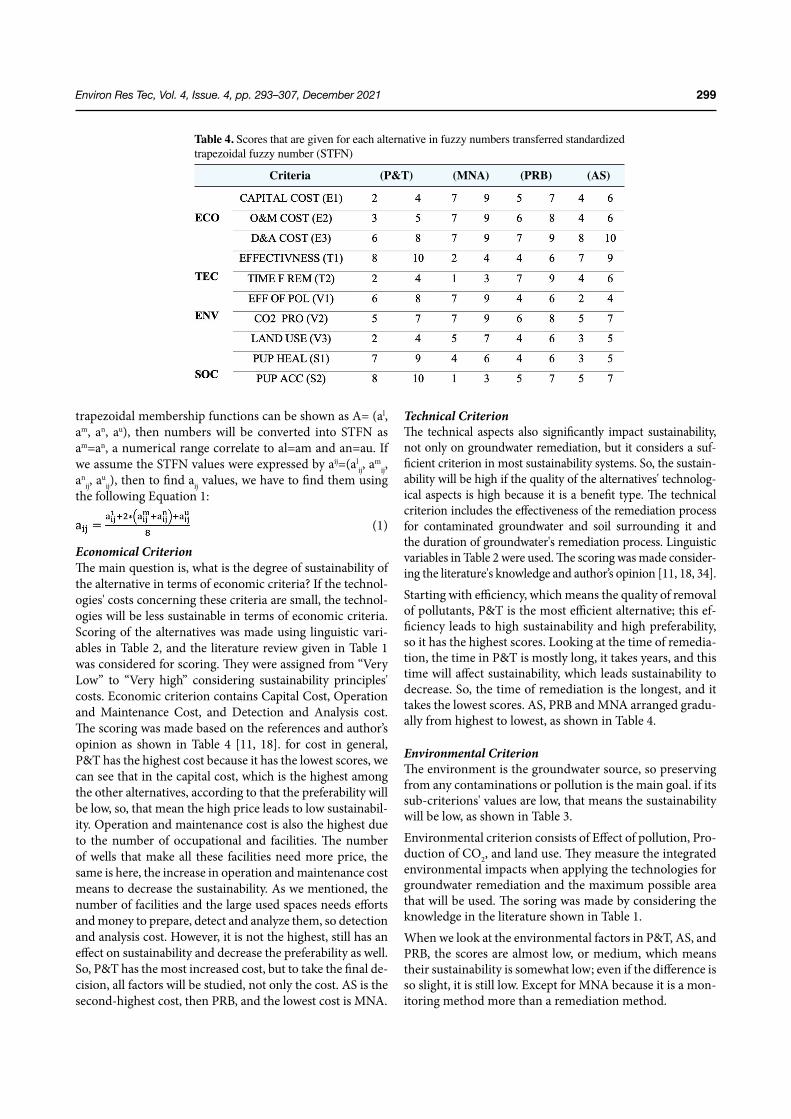
Scoring StepAfter explaining the sustainability criteria and giving the scoring scales for applying the proposed fuzzy-AHP ap-proach for selecting the most suitable groundwater re-mediation technology, the first step is to evaluate each alternative according to each criterion in Figure 1. Using Fuzzy-AHP is considered among the best ways to handle complex structures such as sustainability assessment, a complex multi-criteria problem. It is affected by multiple factors and needs more analysis to reach, define and assess factors in a systematic manner. Decision-maker asks the question that could determine the criteria for measuring the sustainability performance of the groundwater remedi-ation technologies. In this study, Fuzzy AHP has been used to determine the best sustainable alternative for groundwa-ter remediation. After developing the hierarchy and scale for scoring, each criterion in the hierarchy is scored based on their contribution to sustainability. It is worth pointing out that the users are allowed to add more or delete some criteria for the sustainability assessment of groundwater remediation technologies according to their actual condi-tions and stakeholders' preferences [11, 18]. Scoring can be made by literature review or/and expert opinion, which can be asked by the questionnaire, E-mail, or meetings. Here, in the absence of data, the evaluation was made by the au-thor's opinion based on the (if-then) rule. The numbers or the score was taken with fuzzy numbers, as a quantitative domain of linguistic expression which is transferred unified trapezoidal fuzzy number (STFN) shown in Table 4. These
Table 3. The pairwise comparisons scale of criteria with related to goal with fuzzy numbers [34]
Judgementvalue AHPscale Fuzzyscale
Environ Res Tec, Vol. 4, Issue. 4, pp. 293–307, December 2021 299
trapezoidal membership functions can be shown as A= (al, am, an, au), then numbers will be converted into STFN as am=an, a numerical range correlate to al=am and an=au. If we assume the STFN values were expressed by aij=(al
ij, am
ij, an
ij, au
ij), then to find aij values, we have to find them using the following Equation 1:
(1)
Economical CriterionThe main question is, what is the degree of sustainability of the alternative in terms of economic criteria? If the technol-ogies' costs concerning these criteria are small, the technol-ogies will be less sustainable in terms of economic criteria. Scoring of the alternatives was made using linguistic vari-ables in Table 2, and the literature review given in Table 1 was considered for scoring. They were assigned from “Very Low” to “Very high” considering sustainability principles' costs. Economic criterion contains Capital Cost, Operation and Maintenance Cost, and Detection and Analysis cost. The scoring was made based on the references and author’s opinion as shown in Table 4 [11, 18]. for cost in general, P&T has the highest cost because it has the lowest scores, we can see that in the capital cost, which is the highest among the other alternatives, according to that the preferability will be low, so, that mean the high price leads to low sustainabil-ity. Operation and maintenance cost is also the highest due to the number of occupational and facilities. The number of wells that make all these facilities need more price, the same is here, the increase in operation and maintenance cost means to decrease the sustainability. As we mentioned, the number of facilities and the large used spaces needs efforts and money to prepare, detect and analyze them, so detection and analysis cost. However, it is not the highest, still has an effect on sustainability and decrease the preferability as well. So, P&T has the most increased cost, but to take the final de-cision, all factors will be studied, not only the cost. AS is the second-highest cost, then PRB, and the lowest cost is MNA.
Technical CriterionThe technical aspects also significantly impact sustainability, not only on groundwater remediation, but it considers a suf-ficient criterion in most sustainability systems. So, the sustain-ability will be high if the quality of the alternatives' technolog-ical aspects is high because it is a benefit type. The technical criterion includes the effectiveness of the remediation process for contaminated groundwater and soil surrounding it and the duration of groundwater's remediation process. Linguistic variables in Table 2 were used. The scoring was made consider-ing the literature's knowledge and author’s opinion [11, 18, 34].Starting with efficiency, which means the quality of removal of pollutants, P&T is the most efficient alternative; this ef-ficiency leads to high sustainability and high preferability, so it has the highest scores. Looking at the time of remedia-tion, the time in P&T is mostly long, it takes years, and this time will affect sustainability, which leads sustainability to decrease. So, the time of remediation is the longest, and it takes the lowest scores. AS, PRB and MNA arranged gradu-ally from highest to lowest, as shown in Table 4.
Environmental CriterionThe environment is the groundwater source, so preserving from any contaminations or pollution is the main goal. if its sub-criterions' values are low, that means the sustainability will be low, as shown in Table 3.Environmental criterion consists of Effect of pollution, Pro-duction of CO2, and land use. They measure the integrated environmental impacts when applying the technologies for groundwater remediation and the maximum possible area that will be used. The soring was made by considering the knowledge in the literature shown in Table 1.When we look at the environmental factors in P&T, AS, and PRB, the scores are almost low, or medium, which means their sustainability is somewhat low; even if the difference is so slight, it is still low. Except for MNA because it is a mon-itoring method more than a remediation method.
Table 4. Scores that are given for each alternative in fuzzy numbers transferred standardized trapezoidal fuzzy number (STFN)
Criteria (P&T) (MNA) (PRB) (AS)
Environ Res Tec, Vol. 4, Issue. 4, pp. 293–307, December 2021300
The Effect of pollution on P&T and its environmental im-pact is medium, which could mean medium preferability and sustainability. Also, the Production of CO2 is medi-um, also AS, but comparing with PRB, so its sustainability is better than PRB. The land used for both AS and P&T is low sustainable due to low scores and big used lands. So, in environmental factors, the results are almost close except MNA.
Social CriterionSocial aspects are considered significant in terms of sustain-ability, as they are the first and last beneficiaries of resourc-es. A class of society uses these resources as the primary source of their lives; therefore, it is essential to follow these sources and their validity. If the value of public health is high and the people's acceptance, that means sustainabili-ty will be better. So, the measure of social aspect is based on investigating the effect on public health, which mea-sures residents' health when applying the technologies for groundwater remediation.
Linguistic variables in Table 2 were used, and scoring was made by using the literature knowledge given in Table 1. Public health and public acceptance have somehow high scores, which means the acceptance of people was high. The effects of P&T on their health were low or medium, which means when the people's acceptance is high, sustainability is high, and when public health is not affected too much or not be affected, that also means the sustainability is high, as shown in Table 4.
Compare Factors Pairwise and Conversion to STFNEach sub-criterion is compared to the other sub-criteria under the same group's main criterion based on its relative contribution to the sustainability assessment. Chang’s 1-9
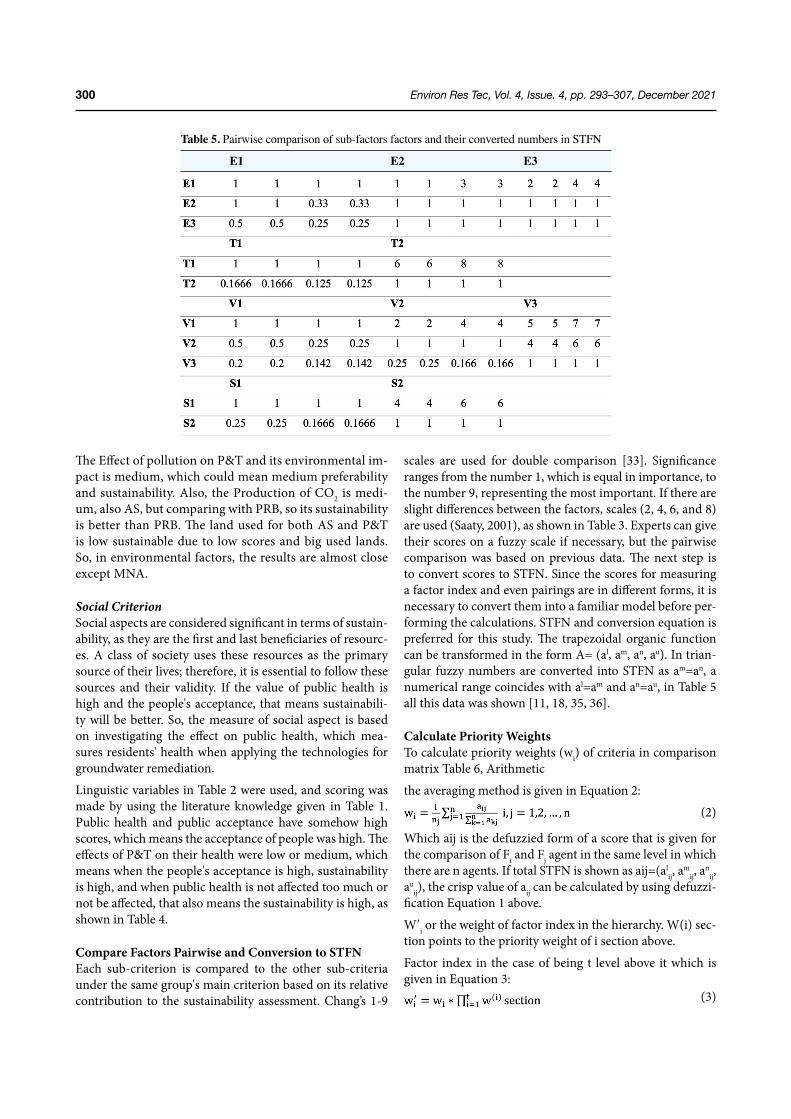
scales are used for double comparison [33]. Significance ranges from the number 1, which is equal in importance, to the number 9, representing the most important. If there are slight differences between the factors, scales (2, 4, 6, and 8) are used (Saaty, 2001), as shown in Table 3. Experts can give their scores on a fuzzy scale if necessary, but the pairwise comparison was based on previous data. The next step is to convert scores to STFN. Since the scores for measuring a factor index and even pairings are in different forms, it is necessary to convert them into a familiar model before per-forming the calculations. STFN and conversion equation is preferred for this study. The trapezoidal organic function can be transformed in the form A= (al, am, an, au). In trian-gular fuzzy numbers are converted into STFN as am=an, a numerical range coincides with al=am and an=au, in Table 5 all this data was shown [11, 18, 35, 36].
Calculate Priority WeightsTo calculate priority weights (wi) of criteria in comparison matrix Table 6, Arithmetic
the averaging method is given in Equation 2:
(2)
Which aij is the defuzzied form of a score that is given for the comparison of Fi and Fj agent in the same level in which there are n agents. If total STFN is shown as aij=(al
ij, am
ij, an
ij, au
ij), the crisp value of aij can be calculated by using defuzzi-fication Equation 1 above.
W′i or the weight of factor index in the hierarchy. W(i) sec-tion points to the priority weight of i section above.
Factor index in the case of being t level above it which is given in Equation 3:
(3)
Table 5. Pairwise comparison of sub-factors factors and their converted numbers in STFN
E1 E2 E3
Environ Res Tec, Vol. 4, Issue. 4, pp. 293–307, December 2021 301
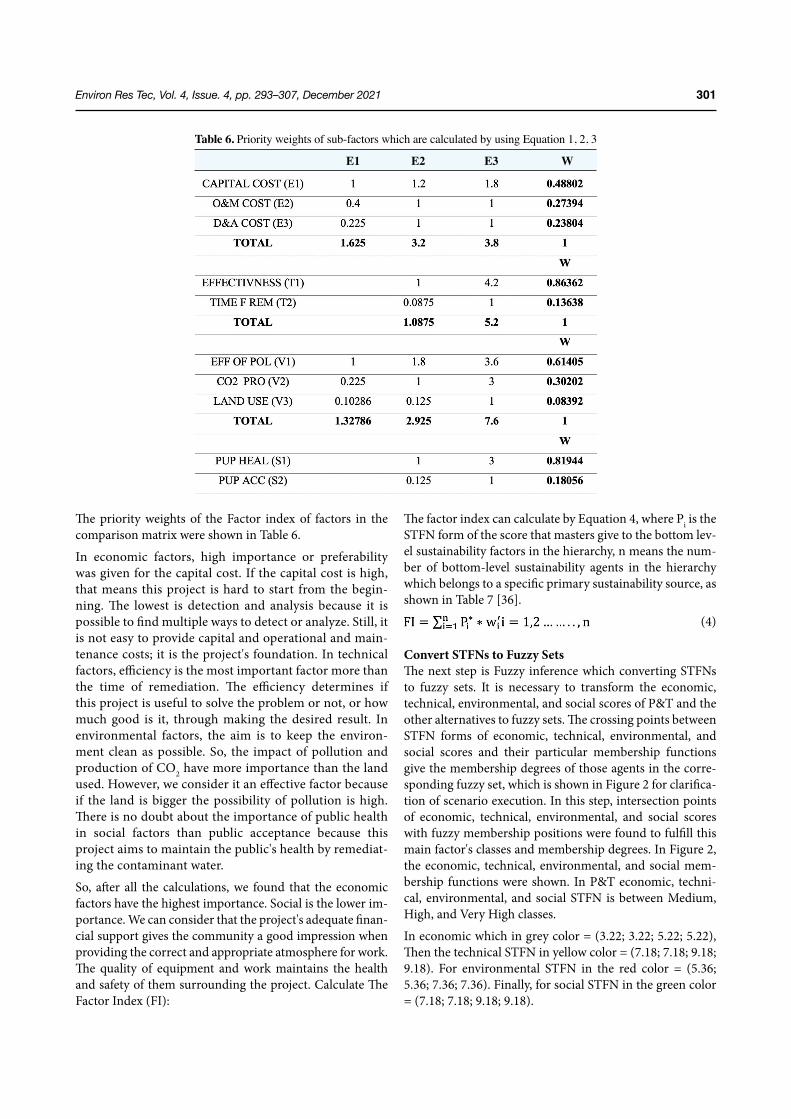
The priority weights of the Factor index of factors in the comparison matrix were shown in Table 6.
In economic factors, high importance or preferability was given for the capital cost. If the capital cost is high, that means this project is hard to start from the begin-ning. The lowest is detection and analysis because it is possible to find multiple ways to detect or analyze. Still, it is not easy to provide capital and operational and main-tenance costs; it is the project's foundation. In technical factors, efficiency is the most important factor more than the time of remediation. The efficiency determines if this project is useful to solve the problem or not, or how much good is it, through making the desired result. In environmental factors, the aim is to keep the environ-ment clean as possible. So, the impact of pollution and production of CO2 have more importance than the land used. However, we consider it an effective factor because if the land is bigger the possibility of pollution is high. There is no doubt about the importance of public health in social factors than public acceptance because this project aims to maintain the public's health by remediat-ing the contaminant water.
So, after all the calculations, we found that the economic factors have the highest importance. Social is the lower im-portance. We can consider that the project's adequate finan-cial support gives the community a good impression when providing the correct and appropriate atmosphere for work. The quality of equipment and work maintains the health and safety of them surrounding the project. Calculate The Factor Index (FI):
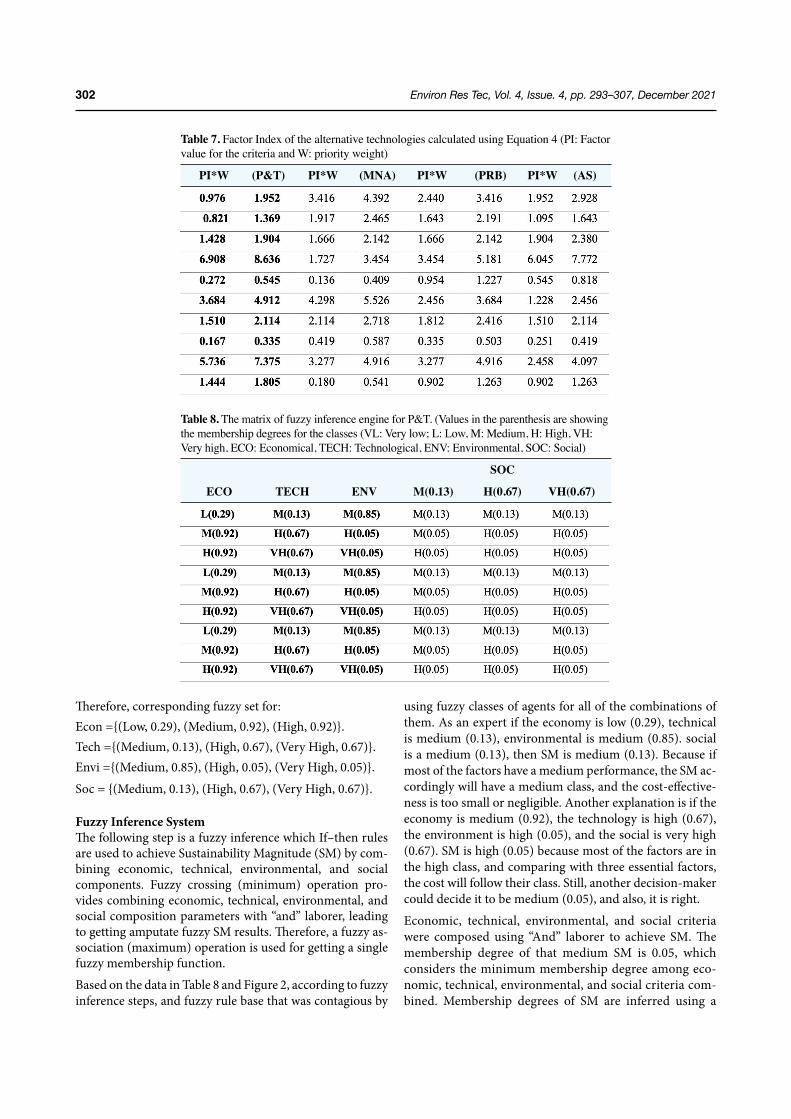
The factor index can calculate by Equation 4, where Pi is the STFN form of the score that masters give to the bottom lev-el sustainability factors in the hierarchy, n means the num-ber of bottom-level sustainability agents in the hierarchy which belongs to a specific primary sustainability source, as shown in Table 7 [36].
(4)
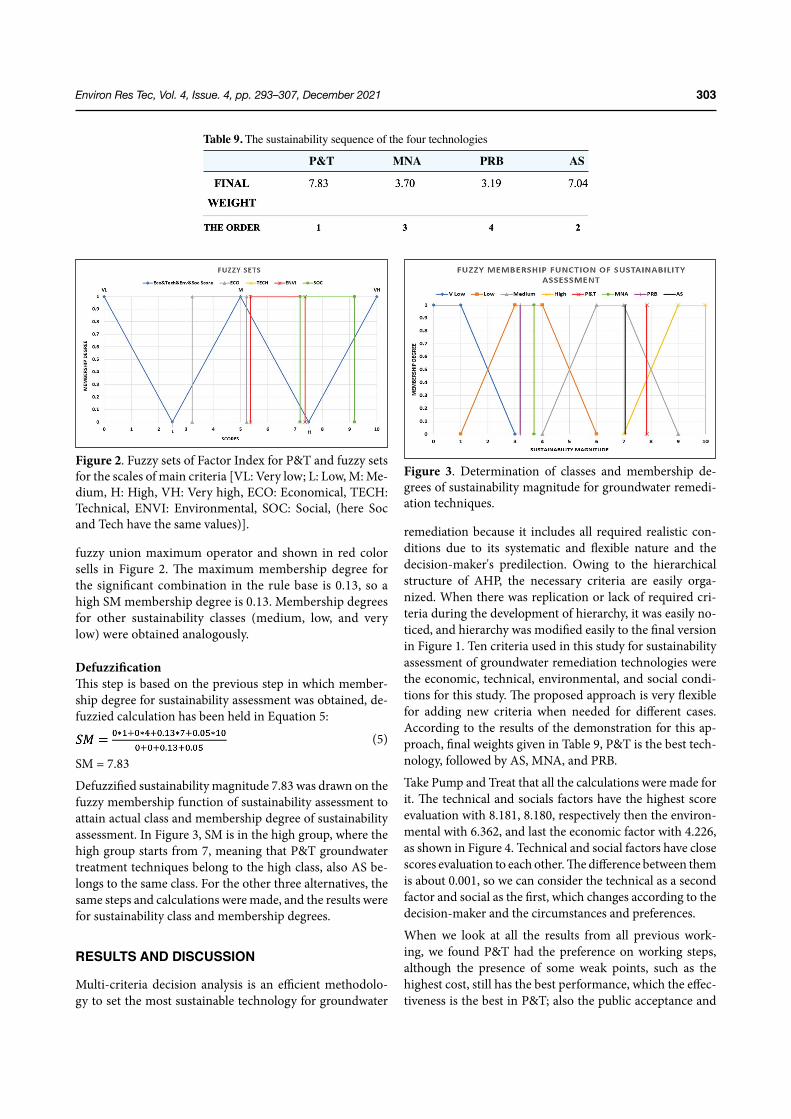
Convert STFNs to Fuzzy SetsThe next step is Fuzzy inference which converting STFNs to fuzzy sets. It is necessary to transform the economic, technical, environmental, and social scores of P&T and the other alternatives to fuzzy sets. The crossing points between STFN forms of economic, technical, environmental, and social scores and their particular membership functions give the membership degrees of those agents in the corre-sponding fuzzy set, which is shown in Figure 2 for clarifica-tion of scenario execution. In this step, intersection points of economic, technical, environmental, and social scores with fuzzy membership positions were found to fulfill this main factor's classes and membership degrees. In Figure 2, the economic, technical, environmental, and social mem-bership functions were shown. In P&T economic, techni-cal, environmental, and social STFN is between Medium, High, and Very High classes.
In economic which in grey color = (3.22; 3.22; 5.22; 5.22), Then the technical STFN in yellow color = (7.18; 7.18; 9.18; 9.18). For environmental STFN in the red color = (5.36; 5.36; 7.36; 7.36). Finally, for social STFN in the green color = (7.18; 7.18; 9.18; 9.18).
Table 6. Priority weights of sub-factors which are calculated by using Equation 1, 2, 3
E1 E2 E3 W
Environ Res Tec, Vol. 4, Issue. 4, pp. 293–307, December 2021302
Therefore, corresponding fuzzy set for:Econ ={(Low, 0.29), (Medium, 0.92), (High, 0.92)}.Tech ={(Medium, 0.13), (High, 0.67), (Very High, 0.67)}.Envi ={(Medium, 0.85), (High, 0.05), (Very High, 0.05)}.Soc = {(Medium, 0.13), (High, 0.67), (Very High, 0.67)}.
Fuzzy Inference SystemThe following step is a fuzzy inference which If–then rules are used to achieve Sustainability Magnitude (SM) by com-bining economic, technical, environmental, and social components. Fuzzy crossing (minimum) operation pro-vides combining economic, technical, environmental, and social composition parameters with “and” laborer, leading to getting amputate fuzzy SM results. Therefore, a fuzzy as-sociation (maximum) operation is used for getting a single fuzzy membership function.Based on the data in Table 8 and Figure 2, according to fuzzy inference steps, and fuzzy rule base that was contagious by
using fuzzy classes of agents for all of the combinations of them. As an expert if the economy is low (0.29), technical is medium (0.13), environmental is medium (0.85). social is a medium (0.13), then SM is medium (0.13). Because if most of the factors have a medium performance, the SM ac-cordingly will have a medium class, and the cost-effective-ness is too small or negligible. Another explanation is if the economy is medium (0.92), the technology is high (0.67), the environment is high (0.05), and the social is very high (0.67). SM is high (0.05) because most of the factors are in the high class, and comparing with three essential factors, the cost will follow their class. Still, another decision-maker could decide it to be medium (0.05), and also, it is right.
Economic, technical, environmental, and social criteria were composed using “And” laborer to achieve SM. The membership degree of that medium SM is 0.05, which considers the minimum membership degree among eco-nomic, technical, environmental, and social criteria com-bined. Membership degrees of SM are inferred using a
Table 7. Factor Index of the alternative technologies calculated using Equation 4 (PI: Factor value for the criteria and W: priority weight)
PI*W (P&T) PI*W (MNA) PI*W (PRB) PI*W (AS)
Table 8. The matrix of fuzzy inference engine for P&T. (Values in the parenthesis are showing the membership degrees for the classes (VL: Very low; L: Low, M: Medium, H: High, VH: Very high, ECO: Economical, TECH: Technological, ENV: Environmental, SOC: Social)
SOC
ECO TECH ENV M(0.13) H(0.67) VH(0.67)
Environ Res Tec, Vol. 4, Issue. 4, pp. 293–307, December 2021 303
fuzzy union maximum operator and shown in red color sells in Figure 2. The maximum membership degree for the significant combination in the rule base is 0.13, so a high SM membership degree is 0.13. Membership degrees for other sustainability classes (medium, low, and very low) were obtained analogously.
DefuzzificationThis step is based on the previous step in which member-ship degree for sustainability assessment was obtained, de-fuzzied calculation has been held in Equation 5:
(5)
SM = 7.83
Defuzzified sustainability magnitude 7.83 was drawn on the fuzzy membership function of sustainability assessment to attain actual class and membership degree of sustainability assessment. In Figure 3, SM is in the high group, where the high group starts from 7, meaning that P&T groundwater treatment techniques belong to the high class, also AS be-longs to the same class. For the other three alternatives, the same steps and calculations were made, and the results were for sustainability class and membership degrees.
RESULTS AND DISCUSSION
Multi-criteria decision analysis is an efficient methodolo-gy to set the most sustainable technology for groundwater
remediation because it includes all required realistic con-ditions due to its systematic and flexible nature and the decision-maker's predilection. Owing to the hierarchical structure of AHP, the necessary criteria are easily orga-nized. When there was replication or lack of required cri-teria during the development of hierarchy, it was easily no-ticed, and hierarchy was modified easily to the final version in Figure 1. Ten criteria used in this study for sustainability assessment of groundwater remediation technologies were the economic, technical, environmental, and social condi-tions for this study. The proposed approach is very flexible for adding new criteria when needed for different cases. According to the results of the demonstration for this ap-proach, final weights given in Table 9, P&T is the best tech-nology, followed by AS, MNA, and PRB.
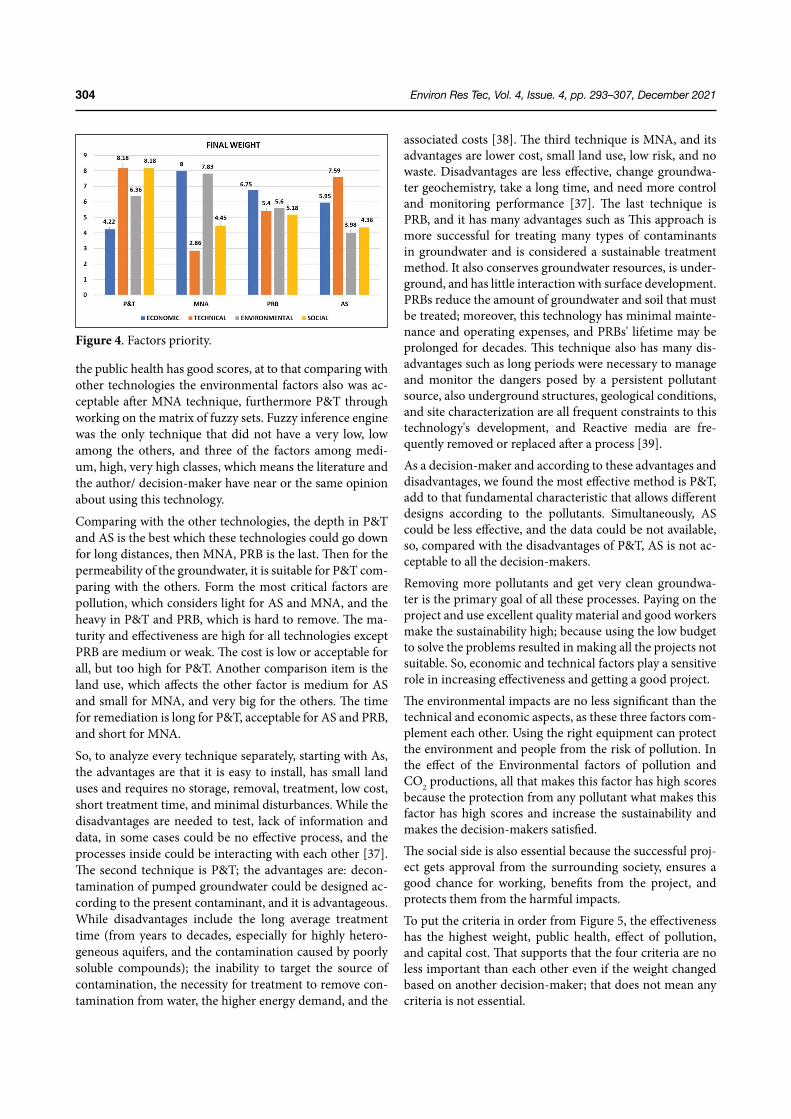
Take Pump and Treat that all the calculations were made for it. The technical and socials factors have the highest score evaluation with 8.181, 8.180, respectively then the environ-mental with 6.362, and last the economic factor with 4.226, as shown in Figure 4. Technical and social factors have close scores evaluation to each other. The difference between them is about 0.001, so we can consider the technical as a second factor and social as the first, which changes according to the decision-maker and the circumstances and preferences.
When we look at all the results from all previous work-ing, we found P&T had the preference on working steps, although the presence of some weak points, such as the highest cost, still has the best performance, which the effec-tiveness is the best in P&T; also the public acceptance and
Table 9. The sustainability sequence of the four technologies
P&T MNA PRB AS
Figure 2. Fuzzy sets of Factor Index for P&T and fuzzy sets for the scales of main criteria [VL: Very low; L: Low, M: Me-dium, H: High, VH: Very high, ECO: Economical, TECH: Technical, ENVI: Environmental, SOC: Social, (here Soc and Tech have the same values)].
Figure 3. Determination of classes and membership de-grees of sustainability magnitude for groundwater remedi-ation techniques.
Environ Res Tec, Vol. 4, Issue. 4, pp. 293–307, December 2021304
the public health has good scores, at to that comparing with other technologies the environmental factors also was ac-ceptable after MNA technique, furthermore P&T through working on the matrix of fuzzy sets. Fuzzy inference engine was the only technique that did not have a very low, low among the others, and three of the factors among medi-um, high, very high classes, which means the literature and the author/ decision-maker have near or the same opinion about using this technology.
Comparing with the other technologies, the depth in P&T and AS is the best which these technologies could go down for long distances, then MNA, PRB is the last. Then for the permeability of the groundwater, it is suitable for P&T com-paring with the others. Form the most critical factors are pollution, which considers light for AS and MNA, and the heavy in P&T and PRB, which is hard to remove. The ma-turity and effectiveness are high for all technologies except PRB are medium or weak. The cost is low or acceptable for all, but too high for P&T. Another comparison item is the land use, which affects the other factor is medium for AS and small for MNA, and very big for the others. The time for remediation is long for P&T, acceptable for AS and PRB, and short for MNA.
So, to analyze every technique separately, starting with As, the advantages are that it is easy to install, has small land uses and requires no storage, removal, treatment, low cost, short treatment time, and minimal disturbances. While the disadvantages are needed to test, lack of information and data, in some cases could be no effective process, and the processes inside could be interacting with each other [37]. The second technique is P&T; the advantages are: decon-tamination of pumped groundwater could be designed ac-cording to the present contaminant, and it is advantageous. While disadvantages include the long average treatment time (from years to decades, especially for highly hetero-geneous aquifers, and the contamination caused by poorly soluble compounds); the inability to target the source of contamination, the necessity for treatment to remove con-tamination from water, the higher energy demand, and the
associated costs [38]. The third technique is MNA, and its advantages are lower cost, small land use, low risk, and no waste. Disadvantages are less effective, change groundwa-ter geochemistry, take a long time, and need more control and monitoring performance [37]. The last technique is PRB, and it has many advantages such as This approach is more successful for treating many types of contaminants in groundwater and is considered a sustainable treatment method. It also conserves groundwater resources, is under-ground, and has little interaction with surface development. PRBs reduce the amount of groundwater and soil that must be treated; moreover, this technology has minimal mainte-nance and operating expenses, and PRBs' lifetime may be prolonged for decades. This technique also has many dis-advantages such as long periods were necessary to manage and monitor the dangers posed by a persistent pollutant source, also underground structures, geological conditions, and site characterization are all frequent constraints to this technology's development, and Reactive media are fre-quently removed or replaced after a process [39].
As a decision-maker and according to these advantages and disadvantages, we found the most effective method is P&T, add to that fundamental characteristic that allows different designs according to the pollutants. Simultaneously, AS could be less effective, and the data could be not available, so, compared with the disadvantages of P&T, AS is not ac-ceptable to all the decision-makers.
Removing more pollutants and get very clean groundwa-ter is the primary goal of all these processes. Paying on the project and use excellent quality material and good workers make the sustainability high; because using the low budget to solve the problems resulted in making all the projects not suitable. So, economic and technical factors play a sensitive role in increasing effectiveness and getting a good project.
The environmental impacts are no less significant than the technical and economic aspects, as these three factors com-plement each other. Using the right equipment can protect the environment and people from the risk of pollution. In the effect of the Environmental factors of pollution and CO2 productions, all that makes this factor has high scores because the protection from any pollutant what makes this factor has high scores and increase the sustainability and makes the decision-makers satisfied.
The social side is also essential because the successful proj-ect gets approval from the surrounding society, ensures a good chance for working, benefits from the project, and protects them from the harmful impacts.
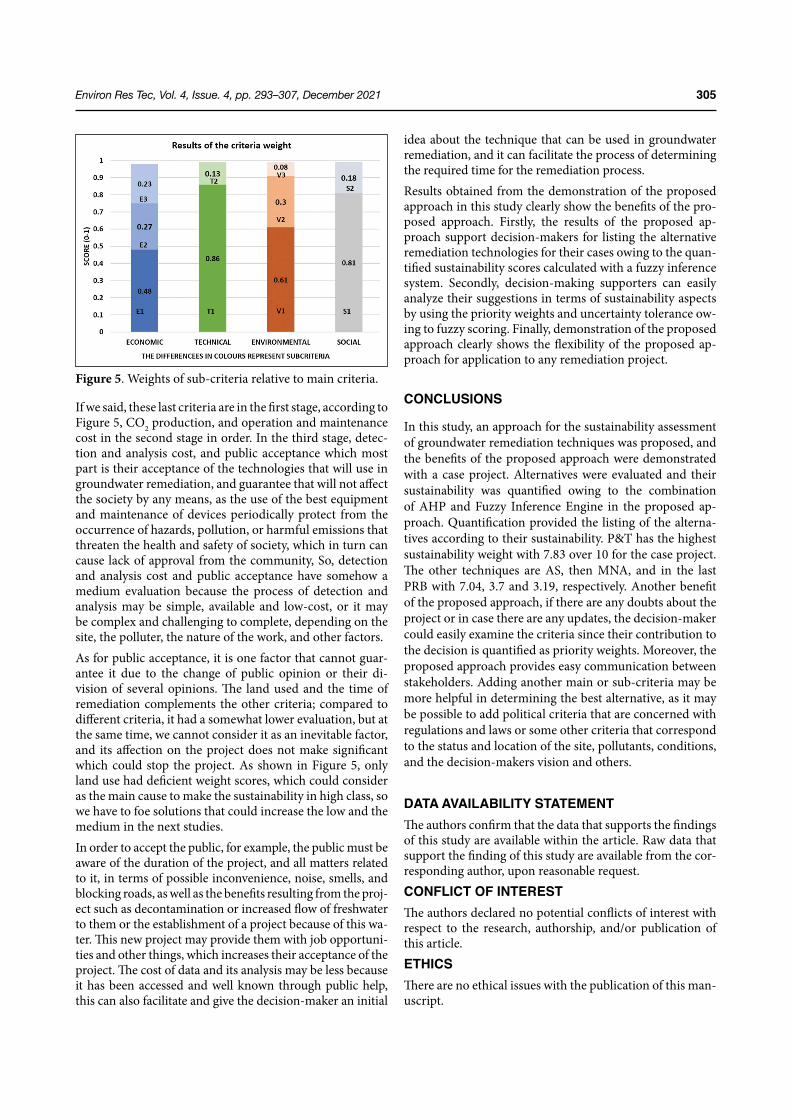
To put the criteria in order from Figure 5, the effectiveness has the highest weight, public health, effect of pollution, and capital cost. That supports that the four criteria are no less important than each other even if the weight changed based on another decision-maker; that does not mean any criteria is not essential.
Figure 4. Factors priority.
Environ Res Tec, Vol. 4, Issue. 4, pp. 293–307, December 2021 305
If we said, these last criteria are in the first stage, according to Figure 5, CO2 production, and operation and maintenance cost in the second stage in order. In the third stage, detec-tion and analysis cost, and public acceptance which most part is their acceptance of the technologies that will use in groundwater remediation, and guarantee that will not affect the society by any means, as the use of the best equipment and maintenance of devices periodically protect from the occurrence of hazards, pollution, or harmful emissions that threaten the health and safety of society, which in turn can cause lack of approval from the community, So, detection and analysis cost and public acceptance have somehow a medium evaluation because the process of detection and analysis may be simple, available and low-cost, or it may be complex and challenging to complete, depending on the site, the polluter, the nature of the work, and other factors.As for public acceptance, it is one factor that cannot guar-antee it due to the change of public opinion or their di-vision of several opinions. The land used and the time of remediation complements the other criteria; compared to different criteria, it had a somewhat lower evaluation, but at the same time, we cannot consider it as an inevitable factor, and its affection on the project does not make significant which could stop the project. As shown in Figure 5, only land use had deficient weight scores, which could consider as the main cause to make the sustainability in high class, so we have to foe solutions that could increase the low and the medium in the next studies.In order to accept the public, for example, the public must be aware of the duration of the project, and all matters related to it, in terms of possible inconvenience, noise, smells, and blocking roads, as well as the benefits resulting from the proj-ect such as decontamination or increased flow of freshwater to them or the establishment of a project because of this wa-ter. This new project may provide them with job opportuni-ties and other things, which increases their acceptance of the project. The cost of data and its analysis may be less because it has been accessed and well known through public help, this can also facilitate and give the decision-maker an initial
idea about the technique that can be used in groundwater remediation, and it can facilitate the process of determining the required time for the remediation process.Results obtained from the demonstration of the proposed approach in this study clearly show the benefits of the pro-posed approach. Firstly, the results of the proposed ap-proach support decision-makers for listing the alternative remediation technologies for their cases owing to the quan-tified sustainability scores calculated with a fuzzy inference system. Secondly, decision-making supporters can easily analyze their suggestions in terms of sustainability aspects by using the priority weights and uncertainty tolerance ow-ing to fuzzy scoring. Finally, demonstration of the proposed approach clearly shows the flexibility of the proposed ap-proach for application to any remediation project.
CONCLUSIONS
In this study, an approach for the sustainability assessment of groundwater remediation techniques was proposed, and the benefits of the proposed approach were demonstrated with a case project. Alternatives were evaluated and their sustainability was quantified owing to the combination of AHP and Fuzzy Inference Engine in the proposed ap-proach. Quantification provided the listing of the alterna-tives according to their sustainability. P&T has the highest sustainability weight with 7.83 over 10 for the case project. The other techniques are AS, then MNA, and in the last PRB with 7.04, 3.7 and 3.19, respectively. Another benefit of the proposed approach, if there are any doubts about the project or in case there are any updates, the decision-maker could easily examine the criteria since their contribution to the decision is quantified as priority weights. Moreover, the proposed approach provides easy communication between stakeholders. Adding another main or sub-criteria may be more helpful in determining the best alternative, as it may be possible to add political criteria that are concerned with regulations and laws or some other criteria that correspond to the status and location of the site, pollutants, conditions, and the decision-makers vision and others.
DATA AVAILABILITY STATEMENTThe authors confirm that the data that supports the findings of this study are available within the article. Raw data that support the finding of this study are available from the cor-responding author, upon reasonable request.CONFLICT OF INTERESTThe authors declared no potential conflicts of interest with respect to the research, authorship, and/or publication of this article.ETHICSThere are no ethical issues with the publication of this man-uscript.
Figure 5. Weights of sub-criteria relative to main criteria.
Environ Res Tec, Vol. 4, Issue. 4, pp. 293–307, December 2021306
REFERENCES
[1] E. Brands, R. Rajagopal, U. Eleswarapu, P. Li, “Groundwater. International Encyclopedia of Ge-ography,” People, the Earth, Environment and Tech-nology, pp. 1–17, 2017.
[2] B. Karthikeyan, N. Vaman, K. Srinivasan, S. Babu, L. Elango, “Identification of surface water-groundwa-ter interaction by hydrogeochemical indicators and assessing its suitability for drinking and irrigational purposes in Chennai, Southern India,” Applied Wa-ter Science, Vol. 4, pp. 159–174, 2014.
[3] A. O. Talabi, T. J. Kayode, “Groundwater pollution and remediation,” Journal of Water Resource and Protection, Vol. 11, pp. 1–19, 2019.
[4] H. Lu L. Ren Y. Chen, P. Tian, J. Liu, “A cloud model based multi-attribute decision making approach for selection and evaluation of groundwater manage-ment schemes,” Journal of Hydrology, Vol. 555, pp. 881–893, 2017.
[5] L. Ren, H. Lu, H. Zhao, J. Xia, “An interval-valued triangular fuzzy modified multi-attribute preference model for prioritization of groundwater resources management,” Journal of Hydrology, Vol. 562, pp. 335-345, 2018.
[6] M. I. Litter, A. M. Ingallinella, V. Olmos, M. Savio, G. Difeo, L. Botto, I. Schalamuk, “Arsenic in Argen-tina: Technologies for arsenic removal from ground-water sources, investment costs and waste manage-ment practices,” Science of the Total Environment, Vol. 690, pp. 778-789, 2019.
[7] D. R. Ridsdale, B. F. Noble, “Assessing sustainable remediation frameworks using sustainability princi-ples,” Journal of Environmental Management, Vol. 184, pp. 36-44, 2016.
[8] L. Huysegoms, V. Cappuyns, “Critical review of de-cision support tools for sustainability assessment of site remediation options,” Journal of Environmental Management, Vol. 196, pp. 278–296, 2017.
[9] Y. Ali, H. Pervez, J. Khan, “Selection of the most fea-sible wastewater treatment technology in Pakistan using multi-criteria decision-making (MCDM),” Water Conservation Science and Engineering, Vol. 5, pp. 199–213, 2020.
[10] P. Yapicioğlu, M. İ. Yeşilnacar, “Grey water footprint assessment of groundwater resources in southeast-ern Turkey: effect of recharge,” Water Supply, Article ws2021247, 2021.
[11] D. An, B. Xi, J. Ren, Y. Wang, X. Jia, C. He, and Z. Li, “Sustainability assessment of groundwater remedi-ation technologies based on multi-criteria decision making method,” Resources, Conservation and Re-cycling, Vol. 119, pp. 36-46, 2017.
[12] J. Tian, Z. Huo, F. Ma, X. Gao, Y. Wu, “Applica-tion and selection of remediation technology for
OCPs-contaminated sites by decision-making methods,” International Journal of Environmental Research and Public Health, Vol. 16, pp. 1888, 2019.
[13] P. Yapicioğlu, P. Derin, M. İ. Yeşilnacar, “Assessment of Harran Plain Groundwater in Terms of Arsenic Contamination,” Geological Bulletin of Turkey, 1–9, 2020.
[14] Y.S. Ok, J. Rinklebe, D. Hou, D.C.W. Tsang, and F.M.G Tack, editors. “Soil and Groundwater Reme-diation Technologies: a practical guide” 1st ed. CRC Press, Florida, 2020.
[15] A. Baba, G. Tayfur, Groundwater contamination and its effect on health in Turkey,” Environmental Monitoring and Assessment, Vol. 183, pp. 77–94, 2011.
[16] D. A. M. A al Manmi, T. O. Abdullah, P. M. Al-Jaf, N. Al-Ansari, “Soil and groundwater pollution assess-ment and delineation of intensity risk map in Sulay-maniyah City, NE of Iraq,” Water (Switzerland), Vol. 11, pp. 2158, 2019.
[17] M. J., Pawari, S. A. G. A. R. Gawande, “Ground wa-ter pollution & its consequence. International jour-nal of engineering research and general science,” Vol. 3, pp. 773-776, 2015.
[18] D., An, B., Xi, Y., Wang, D., Xu, J., Tang, L., Dong, J. Ren, C. Pang, “A sustainability assessment method-ology for prioritizing the technologies of groundwa-ter contamination remediation,” Journal of Cleaner Production, Vol. 112, pp.4647–4656, 2016.
[19] P. Brinkhoff, Multi-criteria analysis for assessing sustainability of remedial actions-applications in contaminated land development, A Literature Re-view, Chalmers University of Technology, Göteborg, Sweden. 2011.
[20] S. H. Zolfani, J. Saparauskas, New application of SWARA method in prioritizing sustainability as-sessment indicators of energy system. Engineering Economics Vol. 24, pp. 408-414, 2013.
[21] O. Pons, A. De la Fuente, A. Aguado, “The use of MIVES as a sustainability assessment MCDM meth-od for architecture and civil engineering applica-tions,” Sustainability, Vol. 8, pp. 460, 2016.
[22] K. V. Plakas, A. A Georgiadis, A. J. Karabelas, “Sus-tainability assessment of tertiary wastewater treat-ment technologies: a multi-criteria analysis,” Water Science and Technology, Vol. 73, pp. 1532-1540, 2016.
[23] H. Wang, Y. Cai, Q. Tan, Y. Zeng, “Evaluation of groundwater remediation technologies based on fuzzy multi-criteria decision analysis approaches,” Water, Vol. 9, pp. 443, 2017.
[24] R.P. Bardos, H.F. Thomas, J.W. Smith, N.D. Har-ries, F. Evans, R. Boyle. T. Howard, R. Lewis, A.O. Thomas, and A. Haslam, “The development and use of sustainability criteria in SuRF-UK’s sustainable
Environ Res Tec, Vol. 4, Issue. 4, pp. 293–307, December 2021 307
remediation framework,” Sustainability, Vol. 10, pp. 1781, 2018.
[25] A. Rubio-Aliaga, M. S. García-Cascales, J. M. Sán-chez-Lozano, and A. Molina-Garcia, “MCDM-based multidimensional approach for selection of optimal groundwater pumping systems: design and case ex-ample,” Renewable Energy, Vol. 163, pp. 213–224, 2021.
[26] A. Beames, S. Broekx, R. Lookman, K. Touchant, and P. Seuntjens, “Sustainability appraisal tools for soil and groundwater remediation: how is the choice of remediation alternative influenced by different sets of sustainability indicators and tool structures?,” Science of the Total Environment, Vol. 470, pp. 954-966, 2014.
[27] M. Bertoni, “Multi-criteria decision making for sus-tainability and value assessment in early PSS design,” Sustainability, Vol. 11, pp. 1952, 2019.
[28] Ö. Demir, and P. Yapıcıoğlu, Investigation of GHG emission sources and reducing GHG emissions in a municipal wastewater treatment plant. Greenhouse Gases: Science and Technology, Vol. 9, pp. 948-964, 2019.
[29] H. Gülşen, and P. Yapıcıoğlu, “Greenhouse gas emission estimation for a UASB reactor in a dairy wastewater treatment plant,” International Journal of Global Warming, Vol. 17, pp. 373-388, 2019.
[30] H. Gülşen, and P. Yapıcıoğlu, “Minimizing green-house gas emissions from leachate treatment by us-ing zeolite column,” Carbon Management, Vol. 12, pp. 51-68, 2021.
[31] P. Yapıcıoğlu, Minimization of greenhouse gas emis-sions from extended aeration activated sludge pro-cess. Water Practice and Technology, Vol. 16, pp. 96-
107, 2021.[32] L.A. Zadeh, “Fuzzy sets,” Inform Control Vol. 8, pp.
338–353, 1965[33] D. Y. Chang, “Extent analysis and synthetic decision,
optimization techniques and applications,” World Scientific, Singapore, Vol. 1, pp. 352, 1992.
[34] H. M. M. M. Jayawickrama, A. K. Kulatunga, and S. Mathavan, “Fuzzy AHP based plant sustainability evaluation method,” Procedia Manufacturing, Vol. 8(Suppl C), pp. 571-578, 2017.
[35] Z. Işik, and H. Aladağ, “A fuzzy AHP model to assess sustainable performance of the construction indus-try from urban regeneration perspective,” Journal of Civil Engineering and Management, Vol. 23, pp. 499-509, 2017.
[36] E. Topuz, I. Talinli, and E. Aydin, “Integration of en-vironmental and human health risk assessment for industries using hazardous materials: a quantitative multi criteria approach for environmental decision makers,” Environment International, Vol. 37, pp. 393-403, 2011.
[37] Epa, O.U. “How to evaluate alternative cleanup tech-nologies for underground storage tank sites: a guide for corrective action plan review,” Land and Emer-gency Management, 2014.
[38] A. Casasso, T. Tosco, C. Bianco, A. Bucci, and R. Sethi, “How can we make pump and treat systems more energetically sustainable?” Water, Vol. 12, pp. 67, 2020.
[39] A. A. H. Faisal, A. H. Sulaymon, and Q. M Khaliefa, “A review of permeable reactive barrier as passive sustainable technology for groundwater remedia-tion,” International Journal of Environmental Sci-ence and Technology, Vol. 15, pp. 1123-1138, 2017.
Which kinetic model best fits the methane production on pig farms with covered lagoon digesters?
Environ Res Tec, Vol. 4, Issue. 4, pp. 308–316, December 2021
Environmental Research and Technologyhttps://ert.yildiz.edu.tr - https://dergipark.org.tr/tr/pub/ert
DOI: https://doi.org/10.35208/ert.916002
Research Article
Juciara O. LOPES , André P. ROSA* , Izabelle P. SOUSA , Silas M. MELO , Antonella A. ALMEIDA , Alisson C. BORGES
Department of Agricultural Engineering, Federal University of Viçosa, Viçosa, MG, Brazil
*Corresponding author.*E-mail address: [email protected] paper has been presented at EurAsia Waste Management Symposium 2020, İstanbul, Turkey
Published by Yıldız Technical University Press, İstanbul, TurkeyCopyright 2021, Yıldız Technical University. This is an open access article under the CC BY-NC license (http://creativecommons.org/licenses/by-nc/4.0/).
ARTICLE INFO
Article historyReceived: 20 April 2021Revised: 23 September 2021Accepted: 06 October 2021
Key words:Anaerobic digestion; Biogas; modeling; Pig farming
ABSTRACT
The volumetric production of biogas can be estimated through kinetic models, although many of them have not been validated adequately in full-scale systems with specific operational conditions in tropical countries. This study aimed to evaluate the applicability of these kinet-ic models to estimate methane production in pig farming operated with covered lagoon di-gesters (CLD, to inform: Chen-Hashimoto, First-order, Cone, Modified Gompertz, Modified Stover-Kincannon and Deng. The input data were obtained through the monitoring of two CLD in pig farming located in Minas Gerais-Brazil. The analyzed parameters were methane composition, the temperature of the substrate, chemical oxygen demand (COD), and volatile solids. The real production of methane (Pactual) was determined in relation to the electric power production at the internal combustion engine. The results obtained for Pactual and the models were compared through regression analysis (t-test, α=1%). All of the evaluated mod-els overestimate the methane production in comparison with Pactual. The smallest difference between the CH4 production and the measurement on the pig farm was obtained with Chen model, overestimating approximately 16.3%, while the highest estimate was 38.5% obtained with the Modified Stover-Kincannon model. The results showed the absence of statistical dif-ferences among the real data (monitored system) and the simulated data (p-value>0.01). The mathematical kinetic models are considered a reliable tool to evaluate the energetic potential of biogas in pig farming with CLD from operational simplicity and low cost.
Cite this article as: Lopes JO, Rosa AP, Sousa IP, Melo SM, Almeida AA, Borges AC. Which kinetic model best fits the methane production on pig farms with covered lagoon di-gesters? Environ Res Tec 2021;4:4:308–316.
INTRODUCTION
Agribusiness is one of the most important sectors of the Brazilian economy. Among the many sectors in it, pig farming plays a prominent role [1]. Confined animal breeding produces high volumes of manure, which con-
tains a high content of organic matter, nutrients, and metals. The lack of proper treatment for the effluent can contaminate water bodies, soil, and the atmosphere [2]. Because manure treatment is required, covered lagoon di-gesters have been widely used in Brazil as an alternative treatment on pig farms [3].
Environ Res Tec, Vol. 4, Issue. 4, pp. 308–316, December 2021 309
In Brazil, the covered lagoon digesters (CLD) are widely used to treat manure in pig farms and their use has many bene-fits such as lower implementation and maintenance costs as well as biogas energy recovery [4]. The use of mathematical modeling is an important tool for estimating the volumetric production of biogas. Among the models, kinetics have been widely used to assist in understanding about the breakdown of organic matter, to estimate biogas production, and to provide data for projects, operation, and control of the performance of the anaerobic digestion [5]. According to Neto [6], kinet-ic studies are aimed at evaluating a phenomenon or process, through the quantification of parameters as time and substrate concentration in a gradual process to obtain a known product.
The use of kinetic models to estimate methane produc-tion for different types of manure has been done by sev-eral authors on a laboratory-scale. Zhang et al. [7] used the first-order kinetic model and the modified Gompertz model to estimate the methane production through the co-digestion of pig manure with dewatered sewage sludge in batch reactors. Nguyen et al. [8] evaluated four kinetic models (Cone model, a first-order Kinetic model, modified Gompertz model, and dual pooled first-order kinetic mod-el) to obtain the model that best fits the methane production from nine different types of manure. Yang et al. [9] applied the Chen-Hashimoto model, modified the Stovere-Kincan-non model, and Deng model in the treatment of swine ma-nure using batch anaerobic reactor in laboratory-scale. The Chen-Hashimoto model exhibited well-fitting results.
The kinetic studies are in its majority, used in controlled conditions by laboratory-scale. It is possible to identify the existence of some gaps related to the application of these kinetic models on a full scale, particularly when using cov-
ered lagoon digesters. In this way, assure the reliability of kinetic models to methane production can contribute to the improvement of energetic sustainability in the farms. This study aimed at evaluating and comparing the fit of kinetic models to estimate methane production in pig farming with covered lagoon digesters. The differential of this study is the proposal to transition from the laboratory-scale to full, con-sidering the use of kinetic models from the use of an oper-ational parameter with easy determination (volatile solids).
MATERIALS AND METHODS
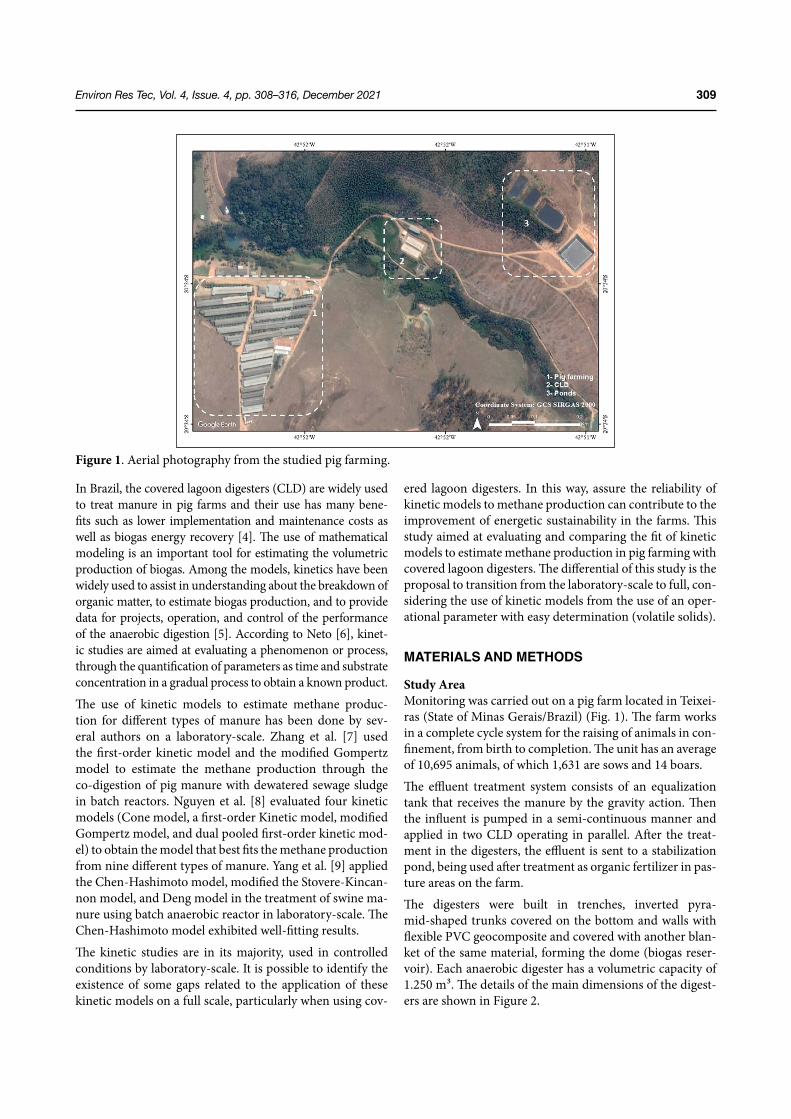
Study AreaMonitoring was carried out on a pig farm located in Teixei-ras (State of Minas Gerais/Brazil) (Fig. 1). The farm works in a complete cycle system for the raising of animals in con-finement, from birth to completion. The unit has an average of 10,695 animals, of which 1,631 are sows and 14 boars.
The effluent treatment system consists of an equalization tank that receives the manure by the gravity action. Then the influent is pumped in a semi-continuous manner and applied in two CLD operating in parallel. After the treat-ment in the digesters, the effluent is sent to a stabilization pond, being used after treatment as organic fertilizer in pas-ture areas on the farm.
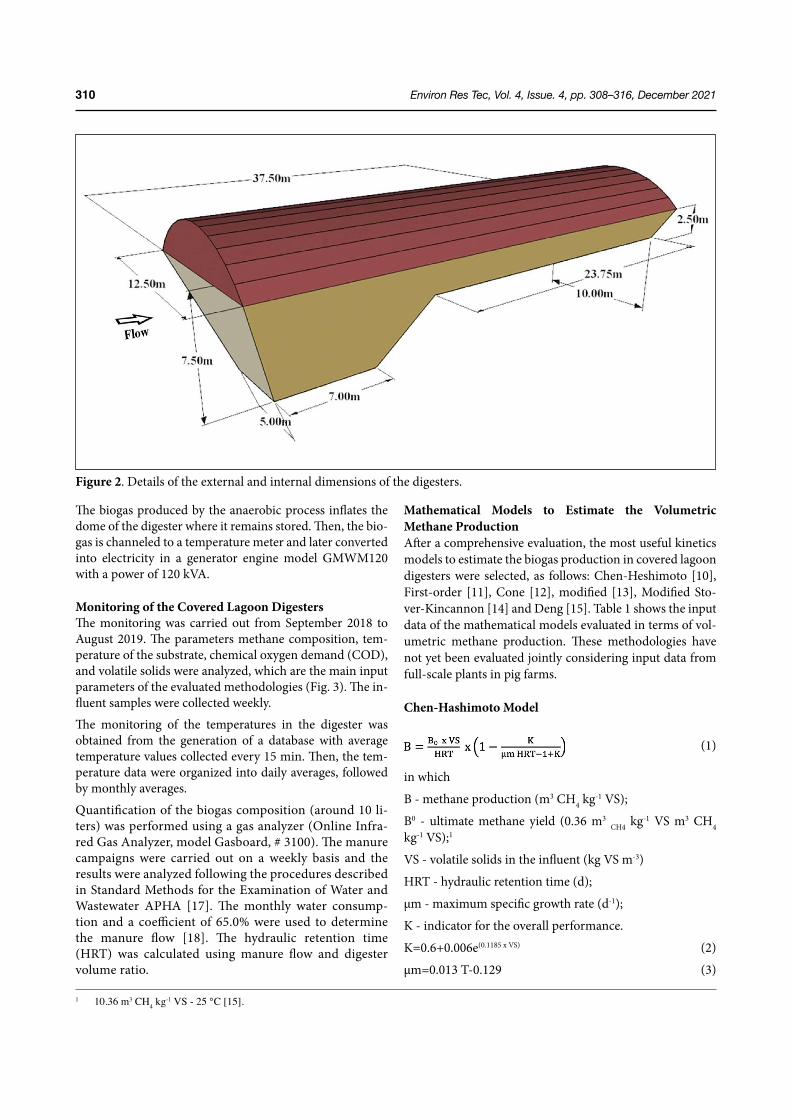
The digesters were built in trenches, inverted pyra-mid-shaped trunks covered on the bottom and walls with flexible PVC geocomposite and covered with another blan-ket of the same material, forming the dome (biogas reser-voir). Each anaerobic digester has a volumetric capacity of 1.250 m³. The details of the main dimensions of the digest-ers are shown in Figure 2.
Figure 1. Aerial photography from the studied pig farming.
Environ Res Tec, Vol. 4, Issue. 4, pp. 308–316, December 2021310
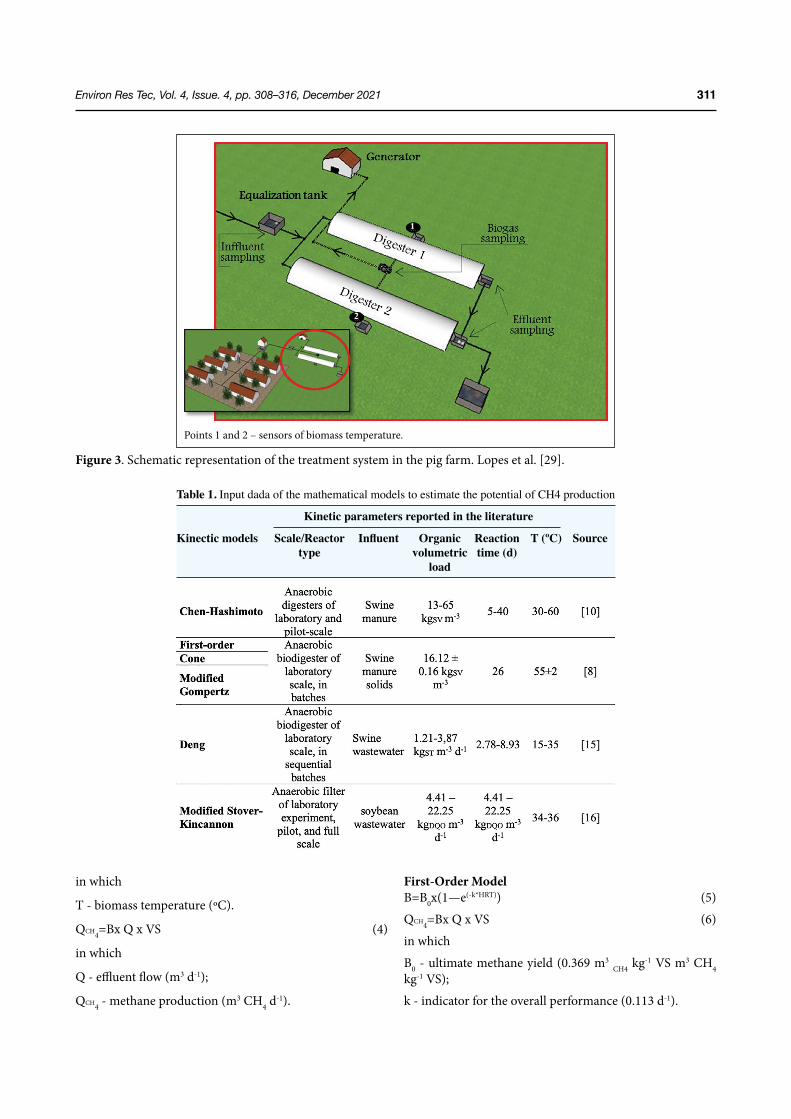
The biogas produced by the anaerobic process inflates the dome of the digester where it remains stored. Then, the bio-gas is channeled to a temperature meter and later converted into electricity in a generator engine model GMWM120 with a power of 120 kVA.
Monitoring of the Covered Lagoon DigestersThe monitoring was carried out from September 2018 to August 2019. The parameters methane composition, tem-perature of the substrate, chemical oxygen demand (COD), and volatile solids were analyzed, which are the main input parameters of the evaluated methodologies (Fig. 3). The in-fluent samples were collected weekly. The monitoring of the temperatures in the digester was obtained from the generation of a database with average temperature values collected every 15 min. Then, the tem-perature data were organized into daily averages, followed by monthly averages.
Quantification of the biogas composition (around 10 li-ters) was performed using a gas analyzer (Online Infra-red Gas Analyzer, model Gasboard, # 3100). The manure campaigns were carried out on a weekly basis and the results were analyzed following the procedures described in Standard Methods for the Examination of Water and Wastewater APHA [17]. The monthly water consump-tion and a coefficient of 65.0% were used to determine the manure flow [18]. The hydraulic retention time (HRT) was calculated using manure flow and digester volume ratio.
Mathematical Models to Estimate the Volumetric Methane ProductionAfter a comprehensive evaluation, the most useful kinetics models to estimate the biogas production in covered lagoon digesters were selected, as follows: Chen-Heshimoto [10], First-order [11], Cone [12], modified [13], Modified Sto-ver-Kincannon [14] and Deng [15]. Table 1 shows the input data of the mathematical models evaluated in terms of vol-umetric methane production. These methodologies have not yet been evaluated jointly considering input data from full-scale plants in pig farms.
Chen-Hashimoto Model
(1)
in which
B - methane production (m3 CH4 kg-1 VS);
B0 - ultimate methane yield (0.36 m3 CH4 kg-1 VS m3 CH4 kg-1 VS);1
VS - volatile solids in the influent (kg VS m-3)
HRT - hydraulic retention time (d);
µm - maximum specific growth rate (d-1);
K - indicator for the overall performance.
K=0.6+0.006e(0.1185 x VS) (2)
µm=0.013 T-0.129 (3)
1 10.36 m3 CH4 kg-1 VS - 25 °C [15].
Figure 2. Details of the external and internal dimensions of the digesters.
Environ Res Tec, Vol. 4, Issue. 4, pp. 308–316, December 2021 311
in which
T - biomass temperature (ºC).
QCH4=Bx Q x VS (4)
in which
Q - effluent flow (m3 d-1);
QCH4 - methane production (m3 CH4 d-1).
First-Order ModelB=B0x(1—e(-k*HRT)) (5)
QCH4=Bx Q x VS (6)
in which
B0 - ultimate methane yield (0.369 m3 CH4 kg-1 VS m3 CH4 kg-1 VS);
k - indicator for the overall performance (0.113 d-1).
Figure 3. Schematic representation of the treatment system in the pig farm. Lopes et al. [29].
Points 1 and 2 – sensors of biomass temperature.
Table 1. Input dada of the mathematical models to estimate the potential of CH4 production
Kinetic parameters reported in the literature
Kinectic models Scale/Reactor Influent Organic Reaction T (ºC) Source type volumetric time (d) load
Environ Res Tec, Vol. 4, Issue. 4, pp. 308–316, December 2021312
Cone
(5)
in which
B0 - ultimate methane yield (0.376 m3 CH4 kg-1 VS);
k - indicator for the overall performance (0.168 d-1);
n- shape factor (1.56).
QCH4=Bx Q x VS (6)
Modified Gompertz
(7)
in which
B0 - ultimate methane yield (0.327 m3 CH4 kg-1 VS);
Rmax - maximum methane production rate (0.034 m-3 kg-1 d-1);
λ - lag phase time (0.531 d).
QCH4= Bx Q x VS (8)
Deng
(9)
in which
Rp - volumetric yield of methane production (m3CH4 m
-3 d-1);2
Rpmax - maximum volumetric yield of methane production (m3 CH4 m
-3 d-1);3
KLR - constant of saturation (kgVS m-3 d-1);3
Lr - organic volumetric loads (kg VS m-3 d-1).2
Rpmax=2.760–7.181 e(0,067T) (10)
KLR=3.469–13.676 e(-0,101T) (11)
(12)
in which
V - digester volume (m-3).
QCH4=RP x Q (13)
Modified Stover-Kincannon
(14)
in which
M - yield methane production (m3 m-3 d-1);Mmax - maximum methane production (19. 23 m3 m-3 d-1);MB - constant (53.46 kg m-3 d-1).QCH4=M x V (15)The actual methane production (Pactual) from September 2018 to August 2019 was determined using the equivalent of electricity production in an internal combustion engine as shown in Eq 16-.18.
(16)
in whichP - available electric power (kW);E – the amount of electricity produced per month, obtained from energy bills (kWh);m - the number of days in the calculated month (d);24 - number of hours the generator runs in one day (h);
(17)
in whichPCLd - lower caloric potential available (kWh m-3);PE - specific weight (kg Nm-3) (interpolated values accord-ing to Zilotti [19];PCL - lower caloric potential (kcal kg-1) considering inter-polated values according to Avelar [18];4.19/3,600 - conversion factor from kcal to kWh.
(18)
in whichPTB = Total amount of produced methane (m3 CH4 d
-1);Ef= worldwide efficiency of thermal machines (0.25);%CH4 = Percentage of methane in the biogas;24 – conversion factor h d-1.The Pactual and the mathematical models were compared by using a T-test for a significance level of 1%, the comparison was carried out using monthly average values. The methane production in all cases was estimated considering the mod-els and their input data as they were conceived.
RESULTS AND DISCUSSION
Monitoring of Covered Lagoon DigestersOver the experimental period, the manure flow ranged from 98.0 to 107.2 m3 d-1 with an average of 102.3 m3 d-1.
2 Rp and Lr: according to [15].3 Rpmax and KLR: according to [16].
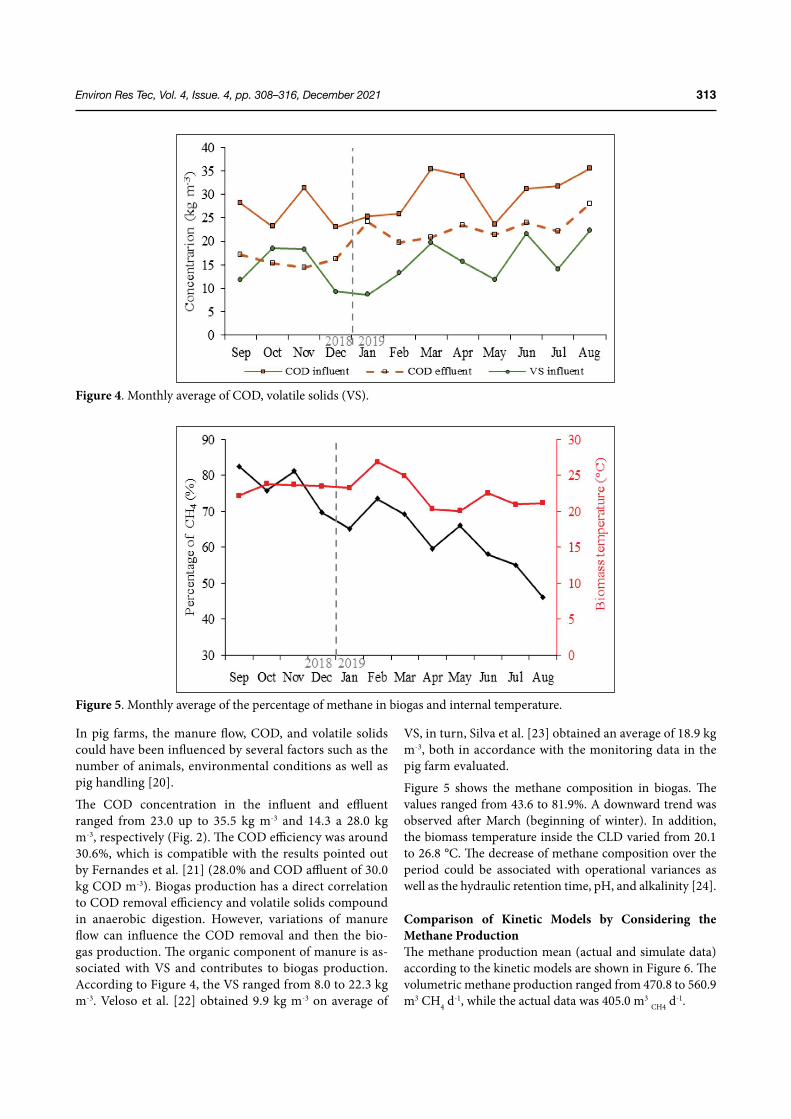
Environ Res Tec, Vol. 4, Issue. 4, pp. 308–316, December 2021 313
In pig farms, the manure flow, COD, and volatile solids could have been influenced by several factors such as the number of animals, environmental conditions as well as pig handling [20].
The COD concentration in the influent and effluent ranged from 23.0 up to 35.5 kg m-3 and 14.3 a 28.0 kg m-3, respectively (Fig. 2). The COD efficiency was around 30.6%, which is compatible with the results pointed out by Fernandes et al. [21] (28.0% and COD affluent of 30.0 kg COD m-3). Biogas production has a direct correlation to COD removal efficiency and volatile solids compound in anaerobic digestion. However, variations of manure flow can influence the COD removal and then the bio-gas production. The organic component of manure is as-sociated with VS and contributes to biogas production. According to Figure 4, the VS ranged from 8.0 to 22.3 kg m-3. Veloso et al. [22] obtained 9.9 kg m-3 on average of
VS, in turn, Silva et al. [23] obtained an average of 18.9 kg m-3, both in accordance with the monitoring data in the pig farm evaluated.
Figure 5 shows the methane composition in biogas. The values ranged from 43.6 to 81.9%. A downward trend was observed after March (beginning of winter). In addition, the biomass temperature inside the CLD varied from 20.1 to 26.8 °C. The decrease of methane composition over the period could be associated with operational variances as well as the hydraulic retention time, pH, and alkalinity [24].
Comparison of Kinetic Models by Considering the Methane ProductionThe methane production mean (actual and simulate data) according to the kinetic models are shown in Figure 6. The volumetric methane production ranged from 470.8 to 560.9 m3 CH4 d
-1, while the actual data was 405.0 m3 CH4 d-1.
Figure 4. Monthly average of COD, volatile solids (VS).
Figure 5. Monthly average of the percentage of methane in biogas and internal temperature.
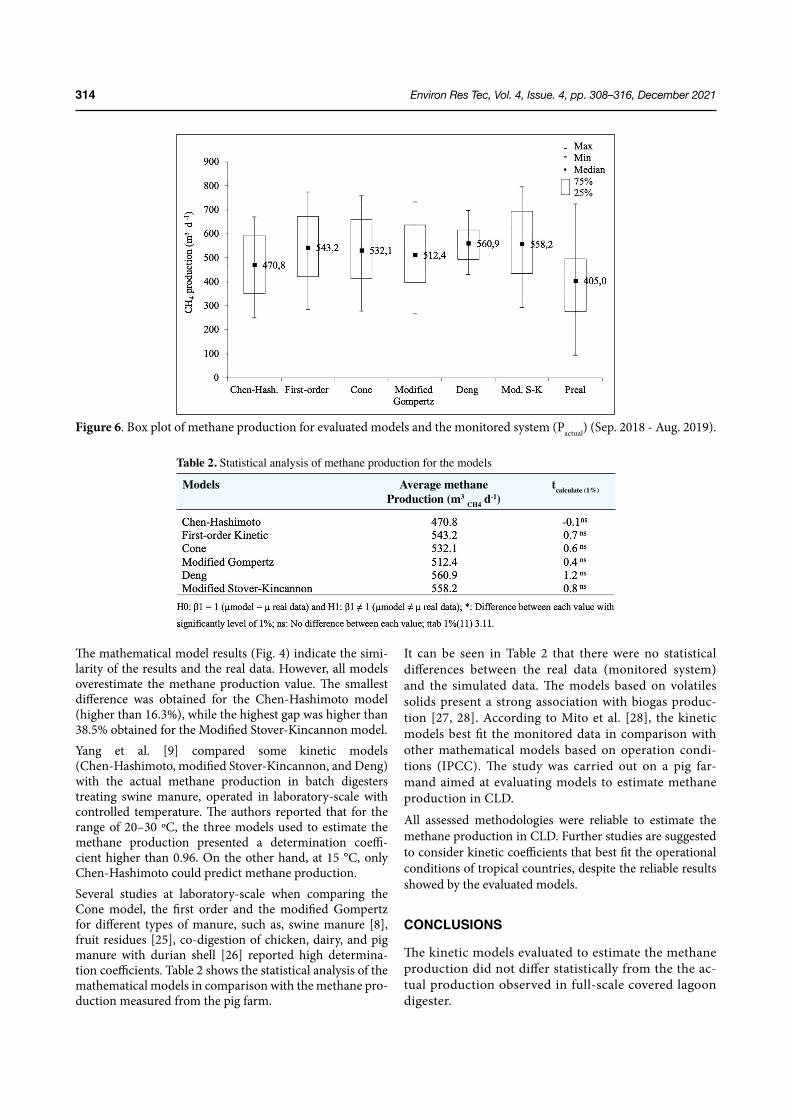
Environ Res Tec, Vol. 4, Issue. 4, pp. 308–316, December 2021314
The mathematical model results (Fig. 4) indicate the simi-larity of the results and the real data. However, all models overestimate the methane production value. The smallest difference was obtained for the Chen-Hashimoto model (higher than 16.3%), while the highest gap was higher than 38.5% obtained for the Modified Stover-Kincannon model.Yang et al. [9] compared some kinetic models (Chen-Hashimoto, modified Stover-Kincannon, and Deng) with the actual methane production in batch digesters treating swine manure, operated in laboratory-scale with controlled temperature. The authors reported that for the range of 20–30 ºC, the three models used to estimate the methane production presented a determination coeffi-cient higher than 0.96. On the other hand, at 15 °C, only Chen-Hashimoto could predict methane production.Several studies at laboratory-scale when comparing the Cone model, the first order and the modified Gompertz for different types of manure, such as, swine manure [8], fruit residues [25], co-digestion of chicken, dairy, and pig manure with durian shell [26] reported high determina-tion coefficients. Table 2 shows the statistical analysis of the mathematical models in comparison with the methane pro-duction measured from the pig farm.
It can be seen in Table 2 that there were no statistical differences between the real data (monitored system) and the simulated data. The models based on volatiles solids present a strong association with biogas produc-tion [27, 28]. According to Mito et al. [28], the kinetic models best fit the monitored data in comparison with other mathematical models based on operation condi-tions (IPCC). The study was carried out on a pig far-mand aimed at evaluating models to estimate methane production in CLD.
All assessed methodologies were reliable to estimate the methane production in CLD. Further studies are suggested to consider kinetic coefficients that best fit the operational conditions of tropical countries, despite the reliable results showed by the evaluated models.
CONCLUSIONS
The kinetic models evaluated to estimate the methane production did not differ statistically from the the ac-tual production observed in full-scale covered lagoon digester.
Figure 6. Box plot of methane production for evaluated models and the monitored system (Pactual) (Sep. 2018 - Aug. 2019).
Table 2. Statistical analysis of methane production for the models
Models Average methane tcalculate (1%) Production (m3 CH4 d-1)
Environ Res Tec, Vol. 4, Issue. 4, pp. 308–316, December 2021 315
The kinetic models stands out as interesting and reliable tools to estimate methane production, which is obtained from an operational parameter with easy determination (volatile solids).
The use of mathematical models to estimate methane pro-duction may be a useful tool for energy sustainability stud-ies and contributes to the decision-making in pig farming.
ACKNOWLEDGMENTSThis study was partially funded by the Coordination for the Improvement of Higher Education Personnel - Brazil (CAPES) - Finance Code 001, National Council for Sci-entific and Technological Development - Brazil (CNPq) – Grant No. 140417/2020-6 and Minas Gerais State Research Foundation (FAPEMIG), Grant No. APQ-01109-18.
DATA AVAILABILITY STATEMENTThe authors confirm that the data that supports the findings of this study are available within the article. Raw data that support the finding of this study are available from the cor-responding author, upon reasonable request.
CONFLICT OF INTERESTThe authors declared no potential conflicts of interest with respect to the research, authorship, and/or publication of this article.
ETHICSThere are no ethical issues with the publication of this man-uscript.
REFERENCES
[1] Market and Trade Meat Swine. United Sttates De-partment of Agricultural Service. Available from: https://apps.fas.usda.gov/psdonline/app/index.html#/app/topCountriesByCommodity. Aceessed on Dec 15, 2021.
[2] A. Kunz, M. M. Higarashi, and P. A. de Oliveira, “Tecnologias de manejo e tratamento de dejetos de suínos estudadas no Brasil,” Cadernos de Ciência & Tecnologia, Vol. 22, pp. 651–665, 2005.
[3] M. L. Veroneze, D.Schwantes, A. C. Gonçalves, A. Richart, J. Manfrin, A. da Paz Schiller, and T. B. Schuba, “Production of biogas and biofertilizer us-ing anaerobic reactors with swine manure and glyc-erin doses,” Journal of Cleaner Production, Vol. 213, pp. 176–184, 2019.
[4] J. Á. Fernandes, “Variáveis microbiológicas e físi-co-químicas em biodigestores anaeróbios escala pi-loto alimentados com dejetos de bovinos leiteiros e suínos,” Master thesis, Federal University the Juiz de Fora, Juiz de Fora, 2016.
[5] F. J. Andriamanohiarisoamanana, I. Ihara, G. Yoshi-
da, and K. Umetsu, “Kinetic study of oxytetracycline and chlortetracycline inhibition in the anaerobic di-gestion of dairy manure”, Bioresource Technology, Vol. 315, pp. 123810, 2020.
[6] W. S. Neto, “Cinética de processos fermentativos.” In: Curso fermentation technology. 1st ed., Feder-al Univeversity the Santa Catarina, Florianópolis, Brazik, 1999.
[7] W. Zhang, Q. Wei, S. Wu, D. Qi, W. Li, Z. Zuo, and R. Dong, “Batch anaerobic co-digestion of pig manure with dewatered sewage sludge under mesophilic conditions”, Applied Energy, Vol.128, pp. 175–183, 2014.
[8] D. D. Nguyen, B. H. Jeon, J. H. Jeung, E. R. Rene, J. R. Banu, B. Ravindran, and S. W. Chang, “Thermo-philic anaerobic digestion of model organic wastes: Evaluation of biomethane production and multiple kinetic models analysis”, Bioresource Technology, Vol. 280, pp. 269–276, 2019.
[9] H. Yang, L. Deng, G. Liu, D. Yang, Y. Liu, and Z. Chen, “A model for methane production in anaero-bic digestion of swine wastewater”, Water Research, Vol.102, pp. 464–474, 2016.
[10] Y. R. Chen, “Kinetic analysis of anaerobic digestion of pig manure and its design implications,” Agricul-tural Wastes, Vol. 8, pp. 65–81, 1983.
[11] A. Veeken, and B. Hamelers, “Effect of temperature on hydrolysis rates of selected biowaste components”, Bioresource Technology, Vol. 69, pp. 249–254, 1999.
[12] J. W. Cone, A. H. van Gelder, G. J. Visscher, and L. Oudshoorn, “Influence of rumen fluid and substrate concentration on fermentation kinetics measured with a fully automated time related gas production apparatus”, Animal Feed Science and Technology, Vol. 61, pp. 113–128, 1996.
[13] M. H. Zwietering, I. Jongenburger, F. M. Rombouts, and K. J. A. E. M. Van't Riet, “Modeling of the bac-terial growth curve”, Applied and environmental mi-crobiology, Vol. 56, pp. 1875-1881, 1990.
[14] S. Kerkhoff, J. M. de L. Yuki, K. Rodrigo, N. C. Cami-lo, L. Mariani, and J. L. G. Silva, “Potencial teórico de produção de biogás e energia elétrica a partir da bio-massa residual da suinocultura da Região Oeste do Paraná,” in 10º Congresso sobre Geração Distribuí-da e Energia no Meio Rural, 2015.
[15] L. Deng, H. Yang, G. Liu, D. Zheng, Z. Chen, Y. Liu, X. Pu, L. Song, Z. Wang, and Y. Lei, “Kinetics of tem-perature effects and its significance to the heating strategy for anaerobic digestion of swine wastewa-ter”, Applied Energy, Vol.134, pp. 349–355, 2014.
[16] H. Yu, F. Wilson, and J. H. Tay, “Kinetic analysis of an anaerobic filter treating soybean wastewater”, Water Research, Vol. 32, pp. 3341–3352, 1998.
[17] APHA - American Public Health Association &
Environ Res Tec, Vol. 4, Issue. 4, pp. 308–316, December 2021316
American Water Works Association., Standard methods for the examination of water and wastewa-ter, 23rd ed. American Public Health Assoccatoion, Washington, United States of America, 2017.
[18] L. H. N. Avellar, “A valorização dos subprodutos agroindustriais visando a cogeração e a redução da poluição ambiental,” D. thesis, State University the Paulista Júlio de Mesquita Filho, Guaratinguetá, Brazil, 2001.
[19] H. A. R. Zilotti, “Potencial de produção de biogás em uma estação de tratamento de esgoto de Cascav-el para a geração de energia elétrica,” M. thesis, State University the Oeste do Paraná, Cáscavel, Brazil. Feb. 2012.
[20] M. Guimarães, and G. Amaral, “Impactos ambi-entais da suinocultura: desafios e oportunidades,” BNDES Setorial, no. 44, pp. 125–156, 2016.
[21] D. M. Fernandes, R. N. Costanzi, A. Feiden, S. Nel-son, and M. De Souza, “Processo de biodigestão an-aeróbia em uma granja de suínos,” Ambiência, Vol. 10, pp. 741–754, 2014.
[22] V. Veloso, A. T. Campos, D. B. Marin, M. C. Matti-oli, and A. C. Néri, “Sustentabilidade ambiental da suinocultura com manejo de dejetos em biodigestor – avaliação de parâmetros físico-químicos” Revista Engenharia na Agricultura, Vol. 26, pp. 322–333, 2018.
[23] F. P. Silva, J. P. Botton, S. N. M. de Souza, and A. M. M. Hachisuca, “Parâmetros físico-químico na op-eração de biodigestores para suinocultura,” Revista Tecnológica, vol. Edição Esp, pp. 33–41, 2015.
[24] N. A. de L. Ferreira, K. O. Aires, M. V. de A. Almeida,
M. C. de Melo, and V. E. D. Monteiro, “Avaliação das concentrações de metano gerado em um biorreator de bancada com base em parâmetros físico-químicos,” Eng. Sanitária Ambient Vol. 22, pp. 473–479, 2017.
[25] C. Zhao, H. Yan, Y. Liu, Y. Huang, R. Zhang, C. Chen, and G. Liu, “Bio-energy conversion perfor-mance, biodegradability, and kinetic analysis of dif-ferent fruit residues during discontinuous anaerobic digestion” Waste Management, Vol. 52, pp. 295-301, 2016.
[26] J. Shen, C. Zhao, Y. Liu, R. Zhang, G. Liu and C. Chen, “Biogas production from anaerobic co-diges-tion of durian shell with chicken, dairy, and pig ma-nures”, Energy Conversion and Management, Vol. 198, pp.110535, 2019.
[27] C. Hasan, A. K. Feitosa, M. C. de A. Silva, and M. Marder, O. Konrad, “Produção de biogás a partir deresíduos agroindustriais: análise dos teores de sólidos totais, voláteis e fixos em amostras pré di-gestão anaeróbia,” Revista Brasileira De Energias Renovavies, Vol. 8, pp. 257–273, 2019.
[28] Y. de L. Mito, S. Kerkhoff, J. L. G. Silva, M. G. Ven-drame, R. L. R. Steinmetz, and A. Kunz, “Metodolo-gia para estimar o potencial de biogás e biometano a partir de plantéis suínos e bovinos no Brasil,” Docu-mentos 196. 1st ed. Embrapa Suínos e Aves, Concór-dia, Brazil, 2018.
[29] J.O. Lopes, A.P. Rosa, I.P. Sousa, N.S. Oliveira, and A. C. Borges, “Mathematical models for estimating methane production in covered lagoon biodigest-ers treating pig manure,” Engenharia Agrícola, Vol. 41(4), pp. 438-448, 2021.
Cefuroxime oxidation with new generation anodes: Evaluation of parameter effects, kinetics and total intermediate products
Environ Res Tec, Vol. 4, Issue. 4, pp. 317–328, December 2021
Environmental Research and Technologyhttps://ert.yildiz.edu.tr - https://dergipark.org.tr/tr/pub/ert
DOI: https://doi.org/10.35208/ert.867139
Research Article
Ayşe KURT
Bursa Uludağ University, Central Research Laboratory, Nilüfer, Bursa
*Corresponding author.*E-mail address: [email protected]
Published by Yıldız Technical University Press, İstanbul, TurkeyCopyright 2021, Yıldız Technical University. This is an open access article under the CC BY-NC license (http://creativecommons.org/licenses/by-nc/4.0/).
ARTICLE INFO
Article historyReceived: 24 January 2021Revised: 30 September 2021Accepted: 14 October 2021
Key words:Anode; Cefuroxim; Current density; Electrochemical oxidation; Wastewater
ABSTRACT
In this study, it was investigated the capability of new generation Sb-SnO2/Ti anodes, which are well known with their promising results in ozone generation and stability, to remove ce-furoxim (CXM) antibiotic from aqueous solution. Comparison of different electrolyte types were performed for this purpose; NaCl and KCl. KCl increased the conductivity and caused to the formation of important oxidants and thus, affected electrochemical oxidation reactions more positively than NaCl. It was obtained that, pH parameter has a very important effect on the removal efficiencies in this process and higher efficiencies were obtained at the natural pH value (pH 7) of the aqueous solution. It was thought that, this was probably because the reac-tions occured in aqueous solution mostly instead of anodic surface. Furthermore, the removal efficiencies increased with current density increase and the best results were obtained at 50 mA/cm2 current density. As a result of the study, at the end of 60 min of reaction, the aqueous solution containing cefuroxime antibiotic was completely treated without any toxic interme-diate product formation with 750 mg/L KCl addition, at pH 7 and 50 mA/cm2 current density.
Cite this article as: Kurt A. Cefuroxime oxidation with new generation anodes: Evaluation of parameter effects, kinetics and total intermediate products. Environ Res Tec 2021;4:4:317–328.
INTRODUCTION
For many years, antibiotics have been used widely in treat-ment of bacterial infectious diseases, fish farm practices and animal breeding applications [1, 2]. However, these compounds are considered as the most dangerous types of pharmaceutical pollutants because they cause to the mi-croorganism resistance in the environment and, have some toxicological properties. However, bacteria with antibiotic resistance genes can spread easily and thus, threaten envi-ronment and human health, seriously [3].
The risk of contamination of them to the receiving envi-ronment is high due to the high rates usage of antibiot-icsand the lack of treatment technologies and insufficien-cy of the existing technologies. In this regard, advanced oxidation processes are very advantageous and are one of the most common types of treatment processes those are particularly promising. Because they can eliminate non-biodegradable organic compounds and color and reduce organic pollution and toxicity without producing any process waste [4].
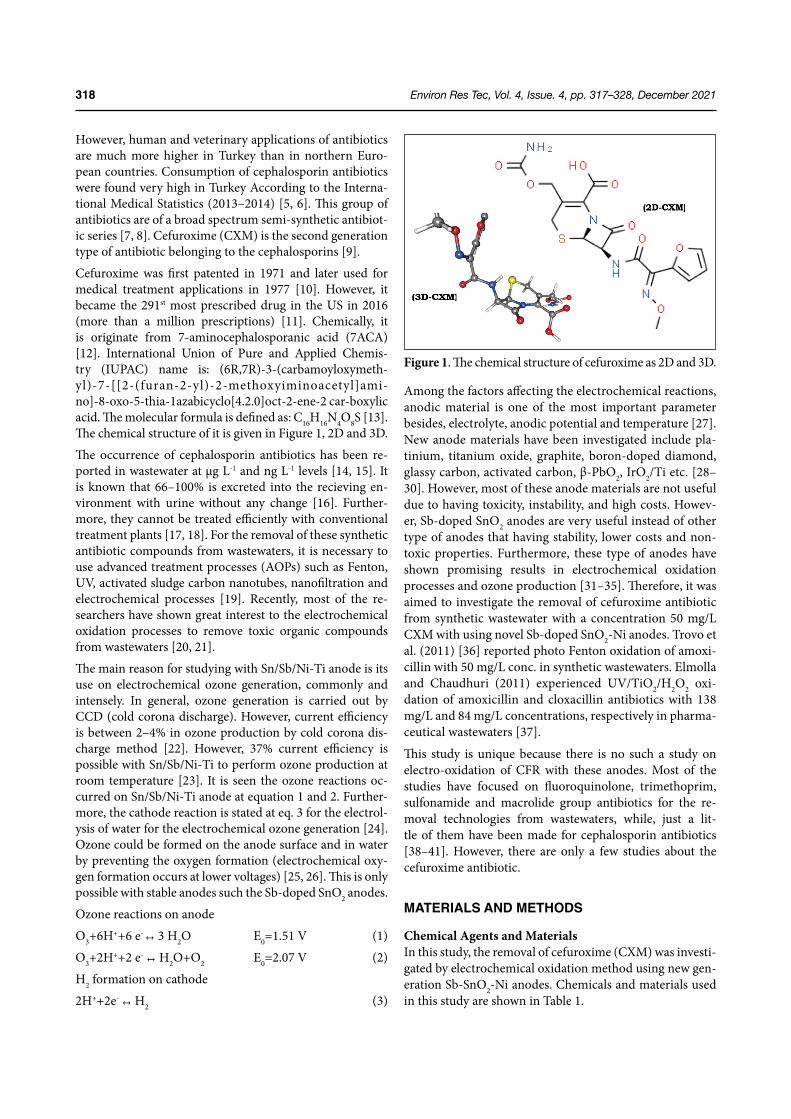
Environ Res Tec, Vol. 4, Issue. 4, pp. 317–328, December 2021318
However, human and veterinary applications of antibiotics are much more higher in Turkey than in northern Euro-pean countries. Consumption of cephalosporin antibiotics were found very high in Turkey According to the Interna-tional Medical Statistics (2013–2014) [5, 6]. This group of antibiotics are of a broad spectrum semi-synthetic antibiot-ic series [7, 8]. Cefuroxime (CXM) is the second generation type of antibiotic belonging to the cephalosporins [9].
Cefuroxime was first patented in 1971 and later used for medical treatment applications in 1977 [10]. However, it became the 291st most prescribed drug in the US in 2016 (more than a million prescriptions) [11]. Chemically, it is originate from 7-aminocephalosporanic acid (7ACA) [12]. International Union of Pure and Applied Chemis-try (IUPAC) name is: (6R,7R)-3-(carbamoyloxymeth-yl)-7-[[2-(furan-2-yl)-2-methoxyiminoacetyl]ami-no]-8-oxo-5-thia-1azabicyclo[4.2.0]oct-2-ene-2 car-boxylic acid. The molecular formula is defined as: C16H16N4O8S [13]. The chemical structure of it is given in Figure 1, 2D and 3D.
The occurrence of cephalosporin antibiotics has been re-ported in wastewater at µg L-1 and ng L-1 levels [14, 15]. It is known that 66–100% is excreted into the recieving en-vironment with urine without any change [16]. Further-more, they cannot be treated efficiently with conventional treatment plants [17, 18]. For the removal of these synthetic antibiotic compounds from wastewaters, it is necessary to use advanced treatment processes (AOPs) such as Fenton, UV, activated sludge carbon nanotubes, nanofiltration and electrochemical processes [19]. Recently, most of the re-searchers have shown great interest to the electrochemical oxidation processes to remove toxic organic compounds from wastewaters [20, 21].
The main reason for studying with Sn/Sb/Ni-Ti anode is its use on electrochemical ozone generation, commonly and intensely. In general, ozone generation is carried out by CCD (cold corona discharge). However, current efficiency is between 2–4% in ozone production by cold corona dis-charge method [22]. However, 37% current efficiency is possible with Sn/Sb/Ni-Ti to perform ozone production at room temperature [23]. It is seen the ozone reactions oc-curred on Sn/Sb/Ni-Ti anode at equation 1 and 2. Further-more, the cathode reaction is stated at eq. 3 for the electrol-ysis of water for the electrochemical ozone generation [24]. Ozone could be formed on the anode surface and in water by preventing the oxygen formation (electrochemical oxy-gen formation occurs at lower voltages) [25, 26]. This is only possible with stable anodes such the Sb-doped SnO2 anodes.
Ozone reactions on anode
O3+6H++6 e- ↔ 3 H2O E0=1.51 V (1)
O3+2H++2 e- ↔ H2O+O2 E0=2.07 V (2)
H2 formation on cathode
2H++2e- ↔ H2 (3)
Among the factors affecting the electrochemical reactions, anodic material is one of the most important parameter besides, electrolyte, anodic potential and temperature [27]. New anode materials have been investigated include pla-tinium, titanium oxide, graphite, boron-doped diamond, glassy carbon, activated carbon, β-PbO2, IrO2/Ti etc. [28–30]. However, most of these anode materials are not useful due to having toxicity, instability, and high costs. Howev-er, Sb-doped SnO2 anodes are very useful instead of other type of anodes that having stability, lower costs and non-toxic properties. Furthermore, these type of anodes have shown promising results in electrochemical oxidation processes and ozone production [31–35]. Therefore, it was aimed to investigate the removal of cefuroxime antibiotic from synthetic wastewater with a concentration 50 mg/L CXM with using novel Sb-doped SnO2-Ni anodes. Trovo et al. (2011) [36] reported photo Fenton oxidation of amoxi-cillin with 50 mg/L conc. in synthetic wastewaters. Elmolla and Chaudhuri (2011) experienced UV/TiO2/H2O2 oxi-dation of amoxicillin and cloxacillin antibiotics with 138 mg/L and 84 mg/L concentrations, respectively in pharma-ceutical wastewaters [37].
This study is unique because there is no such a study on electro-oxidation of CFR with these anodes. Most of the studies have focused on fluoroquinolone, trimethoprim, sulfonamide and macrolide group antibiotics for the re-moval technologies from wastewaters, while, just a lit-tle of them have been made for cephalosporin antibiotics [38–41]. However, there are only a few studies about the cefuroxime antibiotic.
MATERIALS AND METHODS
Chemical Agents and MaterialsIn this study, the removal of cefuroxime (CXM) was investi-gated by electrochemical oxidation method using new gen-eration Sb-SnO2-Ni anodes. Chemicals and materials used in this study are shown in Table 1.
Figure 1. The chemical structure of cefuroxime as 2D and 3D.
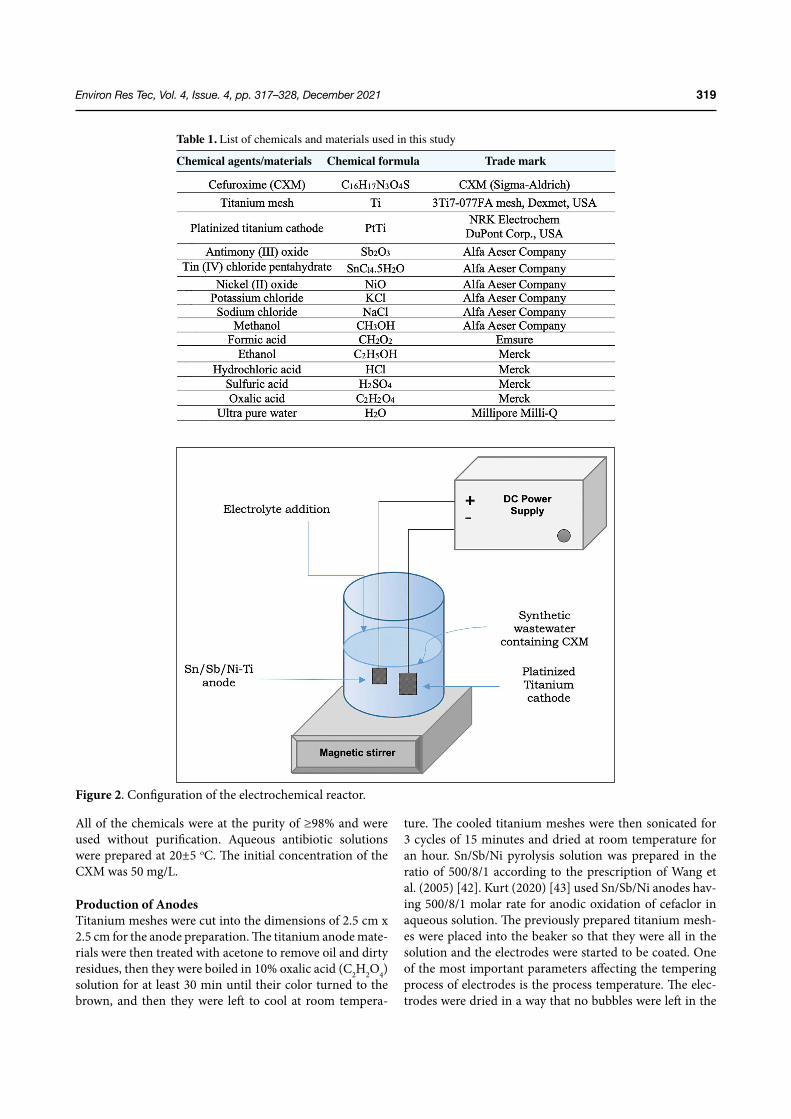
Environ Res Tec, Vol. 4, Issue. 4, pp. 317–328, December 2021 319
All of the chemicals were at the purity of ≥98% and were used without purification. Aqueous antibiotic solutions were prepared at 20±5 oC. The initial concentration of the CXM was 50 mg/L.
Production of AnodesTitanium meshes were cut into the dimensions of 2.5 cm x 2.5 cm for the anode preparation. The titanium anode mate-rials were then treated with acetone to remove oil and dirty residues, then they were boiled in 10% oxalic acid (C2H2O4) solution for at least 30 min until their color turned to the brown, and then they were left to cool at room tempera-
ture. The cooled titanium meshes were then sonicated for 3 cycles of 15 minutes and dried at room temperature for an hour. Sn/Sb/Ni pyrolysis solution was prepared in the ratio of 500/8/1 according to the prescription of Wang et al. (2005) [42]. Kurt (2020) [43] used Sn/Sb/Ni anodes hav-ing 500/8/1 molar rate for anodic oxidation of cefaclor in aqueous solution. The previously prepared titanium mesh-es were placed into the beaker so that they were all in the solution and the electrodes were started to be coated. One of the most important parameters affecting the tempering process of electrodes is the process temperature. The elec-trodes were dried in a way that no bubbles were left in the
Table 1. List of chemicals and materials used in this study
Chemical agents/materials Chemical formula Trade mark
Figure 2. Configuration of the electrochemical reactor.
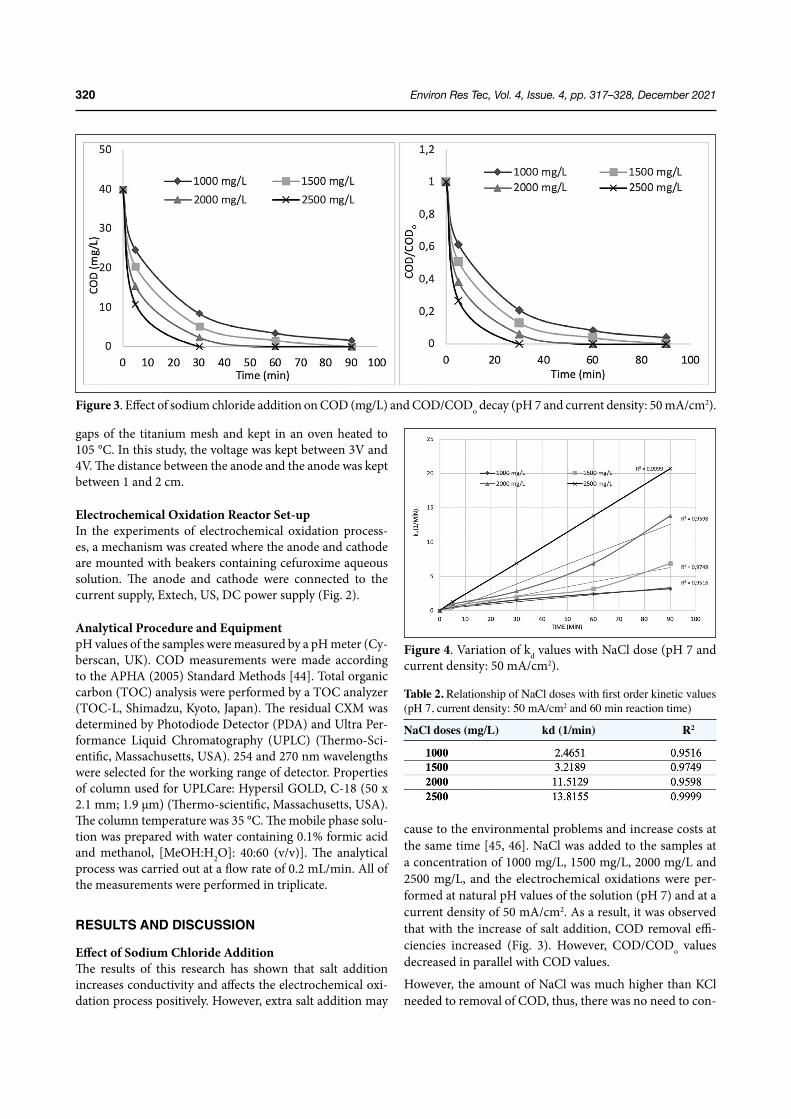
Environ Res Tec, Vol. 4, Issue. 4, pp. 317–328, December 2021320
gaps of the titanium mesh and kept in an oven heated to 105 °C. In this study, the voltage was kept between 3V and 4V. The distance between the anode and the anode was kept between 1 and 2 cm.
Electrochemical Oxidation Reactor Set-upIn the experiments of electrochemical oxidation process-es, a mechanism was created where the anode and cathode are mounted with beakers containing cefuroxime aqueous solution. The anode and cathode were connected to the current supply, Extech, US, DC power supply (Fig. 2).
Analytical Procedure and EquipmentpH values of the samples were measured by a pH meter (Cy-berscan, UK). COD measurements were made according to the APHA (2005) Standard Methods [44]. Total organic carbon (TOC) analysis were performed by a TOC analyzer (TOC-L, Shimadzu, Kyoto, Japan). The residual CXM was determined by Photodiode Detector (PDA) and Ultra Per-formance Liquid Chromatography (UPLC) (Thermo-Sci-entific, Massachusetts, USA). 254 and 270 nm wavelengths were selected for the working range of detector. Properties of column used for UPLCare: Hypersil GOLD, C-18 (50 x 2.1 mm; 1.9 µm) (Thermo-scientific, Massachusetts, USA). The column temperature was 35 °C. The mobile phase solu-tion was prepared with water containing 0.1% formic acid and methanol, [MeOH:H2O]: 40:60 (v/v)]. The analytical process was carried out at a flow rate of 0.2 mL/min. All of the measurements were performed in triplicate.
RESULTS AND DISCUSSION
Effect of Sodium Chloride AdditionThe results of this research has shown that salt addition increases conductivity and affects the electrochemical oxi-dation process positively. However, extra salt addition may
cause to the environmental problems and increase costs at the same time [45, 46]. NaCl was added to the samples at a concentration of 1000 mg/L, 1500 mg/L, 2000 mg/L and 2500 mg/L, and the electrochemical oxidations were per-formed at natural pH values of the solution (pH 7) and at a current density of 50 mA/cm2. As a result, it was observed that with the increase of salt addition, COD removal effi-ciencies increased (Fig. 3). However, COD/CODo values decreased in parallel with COD values.
However, the amount of NaCl was much higher than KCl needed to removal of COD, thus, there was no need to con-
Figure 3. Effect of sodium chloride addition on COD (mg/L) and COD/CODo decay (pH 7 and current density: 50 mA/cm2).
Figure 4. Variation of kd values with NaCl dose (pH 7 and current density: 50 mA/cm2).
Table 2. Relationship of NaCl doses with first order kinetic values (pH 7, current density: 50 mA/cm2 and 60 min reaction time)
NaCl doses (mg/L) kd (1/min) R2
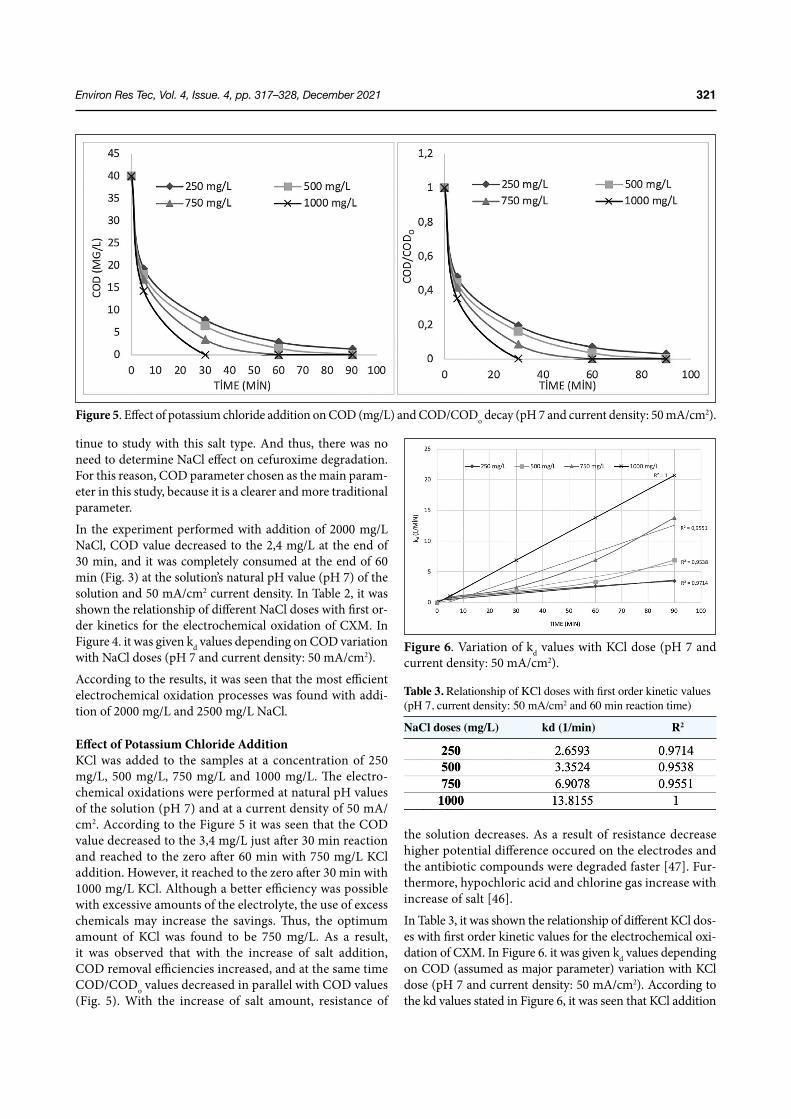
Environ Res Tec, Vol. 4, Issue. 4, pp. 317–328, December 2021 321
tinue to study with this salt type. And thus, there was no need to determine NaCl effect on cefuroxime degradation. For this reason, COD parameter chosen as the main param-eter in this study, because it is a clearer and more traditional parameter.
In the experiment performed with addition of 2000 mg/L NaCl, COD value decreased to the 2,4 mg/L at the end of 30 min, and it was completely consumed at the end of 60 min (Fig. 3) at the solution’s natural pH value (pH 7) of the solution and 50 mA/cm2 current density. In Table 2, it was shown the relationship of different NaCl doses with first or-der kinetics for the electrochemical oxidation of CXM. In Figure 4. it was given kd values depending on COD variation with NaCl doses (pH 7 and current density: 50 mA/cm2).
According to the results, it was seen that the most efficient electrochemical oxidation processes was found with addi-tion of 2000 mg/L and 2500 mg/L NaCl.
Effect of Potassium Chloride AdditionKCl was added to the samples at a concentration of 250 mg/L, 500 mg/L, 750 mg/L and 1000 mg/L. The electro-chemical oxidations were performed at natural pH values of the solution (pH 7) and at a current density of 50 mA/cm2. According to the Figure 5 it was seen that the COD value decreased to the 3,4 mg/L just after 30 min reaction and reached to the zero after 60 min with 750 mg/L KCl addition. However, it reached to the zero after 30 min with 1000 mg/L KCl. Although a better efficiency was possible with excessive amounts of the electrolyte, the use of excess chemicals may increase the savings. Thus, the optimum amount of KCl was found to be 750 mg/L. As a result, it was observed that with the increase of salt addition, COD removal efficiencies increased, and at the same time COD/CODo values decreased in parallel with COD values (Fig. 5). With the increase of salt amount, resistance of
the solution decreases. As a result of resistance decrease higher potential difference occured on the electrodes and the antibiotic compounds were degraded faster [47]. Fur-thermore, hypochloric acid and chlorine gas increase with increase of salt [46].
In Table 3, it was shown the relationship of different KCl dos-es with first order kinetic values for the electrochemical oxi-dation of CXM. In Figure 6. it was given kd values depending on COD (assumed as major parameter) variation with KCl dose (pH 7 and current density: 50 mA/cm2). According to the kd values stated in Figure 6, it was seen that KCl addition
Figure 5. Effect of potassium chloride addition on COD (mg/L) and COD/CODo decay (pH 7 and current density: 50 mA/cm2).
Figure 6. Variation of kd values with KCl dose (pH 7 and current density: 50 mA/cm2).
Table 3. Relationship of KCl doses with first order kinetic values (pH 7, current density: 50 mA/cm2 and 60 min reaction time)
NaCl doses (mg/L) kd (1/min) R2
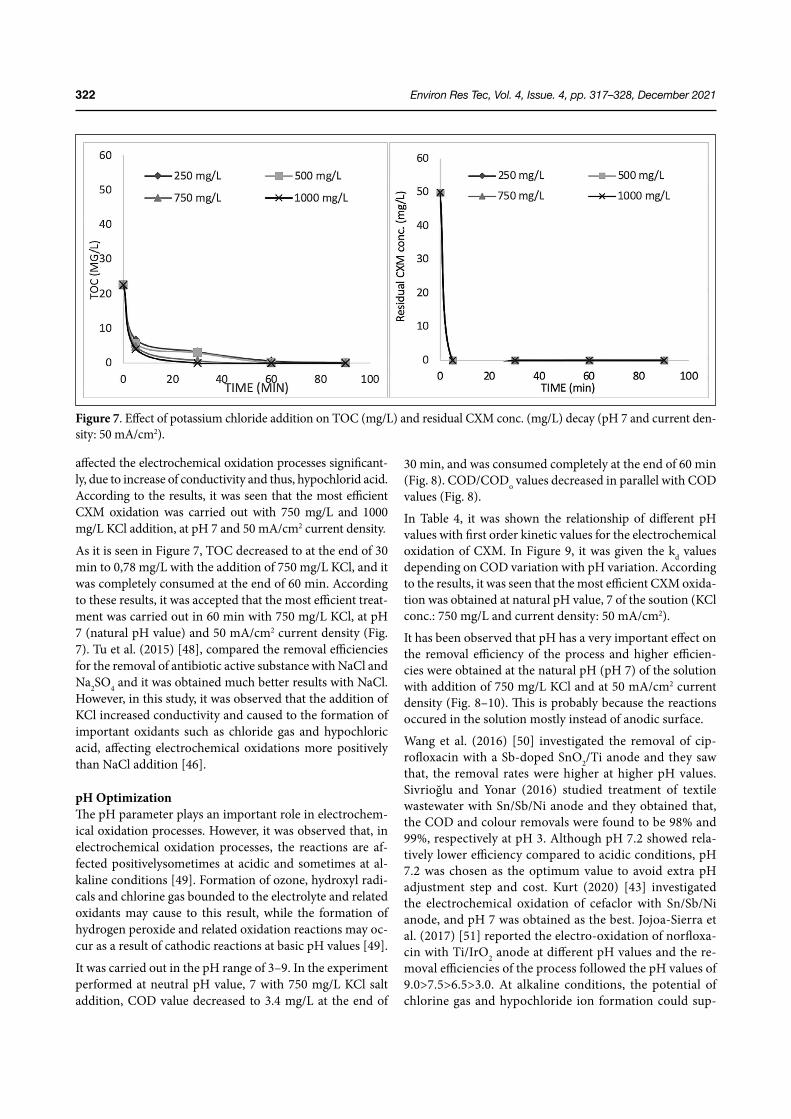
Environ Res Tec, Vol. 4, Issue. 4, pp. 317–328, December 2021322
affected the electrochemical oxidation processes significant-ly, due to increase of conductivity and thus, hypochlorid acid. According to the results, it was seen that the most efficient CXM oxidation was carried out with 750 mg/L and 1000 mg/L KCl addition, at pH 7 and 50 mA/cm2 current density.
As it is seen in Figure 7, TOC decreased to at the end of 30 min to 0,78 mg/L with the addition of 750 mg/L KCl, and it was completely consumed at the end of 60 min. According to these results, it was accepted that the most efficient treat-ment was carried out in 60 min with 750 mg/L KCl, at pH 7 (natural pH value) and 50 mA/cm2 current density (Fig. 7). Tu et al. (2015) [48], compared the removal efficiencies for the removal of antibiotic active substance with NaCl and Na2SO4 and it was obtained much better results with NaCl. However, in this study, it was observed that the addition of KCl increased conductivity and caused to the formation of important oxidants such as chloride gas and hypochloric acid, affecting electrochemical oxidations more positively than NaCl addition [46].
pH OptimizationThe pH parameter plays an important role in electrochem-ical oxidation processes. However, it was observed that, in electrochemical oxidation processes, the reactions are af-fected positivelysometimes at acidic and sometimes at al-kaline conditions [49]. Formation of ozone, hydroxyl radi-cals and chlorine gas bounded to the electrolyte and related oxidants may cause to this result, while the formation of hydrogen peroxide and related oxidation reactions may oc-cur as a result of cathodic reactions at basic pH values [49].
It was carried out in the pH range of 3–9. In the experiment performed at neutral pH value, 7 with 750 mg/L KCl salt addition, COD value decreased to 3.4 mg/L at the end of
30 min, and was consumed completely at the end of 60 min (Fig. 8). COD/CODo values decreased in parallel with COD values (Fig. 8).
In Table 4, it was shown the relationship of different pH values with first order kinetic values for the electrochemical oxidation of CXM. In Figure 9, it was given the kd values depending on COD variation with pH variation. According to the results, it was seen that the most efficient CXM oxida-tion was obtained at natural pH value, 7 of the soution (KCl conc.: 750 mg/L and current density: 50 mA/cm2).
It has been observed that pH has a very important effect on the removal efficiency of the process and higher efficien-cies were obtained at the natural pH (pH 7) of the solution with addition of 750 mg/L KCl and at 50 mA/cm2 current density (Fig. 8–10). This is probably because the reactions occured in the solution mostly instead of anodic surface.
Wang et al. (2016) [50] investigated the removal of cip-rofloxacin with a Sb-doped SnO2/Ti anode and they saw that, the removal rates were higher at higher pH values. Sivrioğlu and Yonar (2016) studied treatment of textile wastewater with Sn/Sb/Ni anode and they obtained that, the COD and colour removals were found to be 98% and 99%, respectively at pH 3. Although pH 7.2 showed rela-tively lower efficiency compared to acidic conditions, pH 7.2 was chosen as the optimum value to avoid extra pH adjustment step and cost. Kurt (2020) [43] investigated the electrochemical oxidation of cefaclor with Sn/Sb/Ni anode, and pH 7 was obtained as the best. Jojoa-Sierra et al. (2017) [51] reported the electro-oxidation of norfloxa-cin with Ti/IrO2 anode at different pH values and the re-moval efficiencies of the process followed the pH values of 9.0>7.5>6.5>3.0. At alkaline conditions, the potential of chlorine gas and hypochloride ion formation could sup-
Figure 7. Effect of potassium chloride addition on TOC (mg/L) and residual CXM conc. (mg/L) decay (pH 7 and current den-sity: 50 mA/cm2).
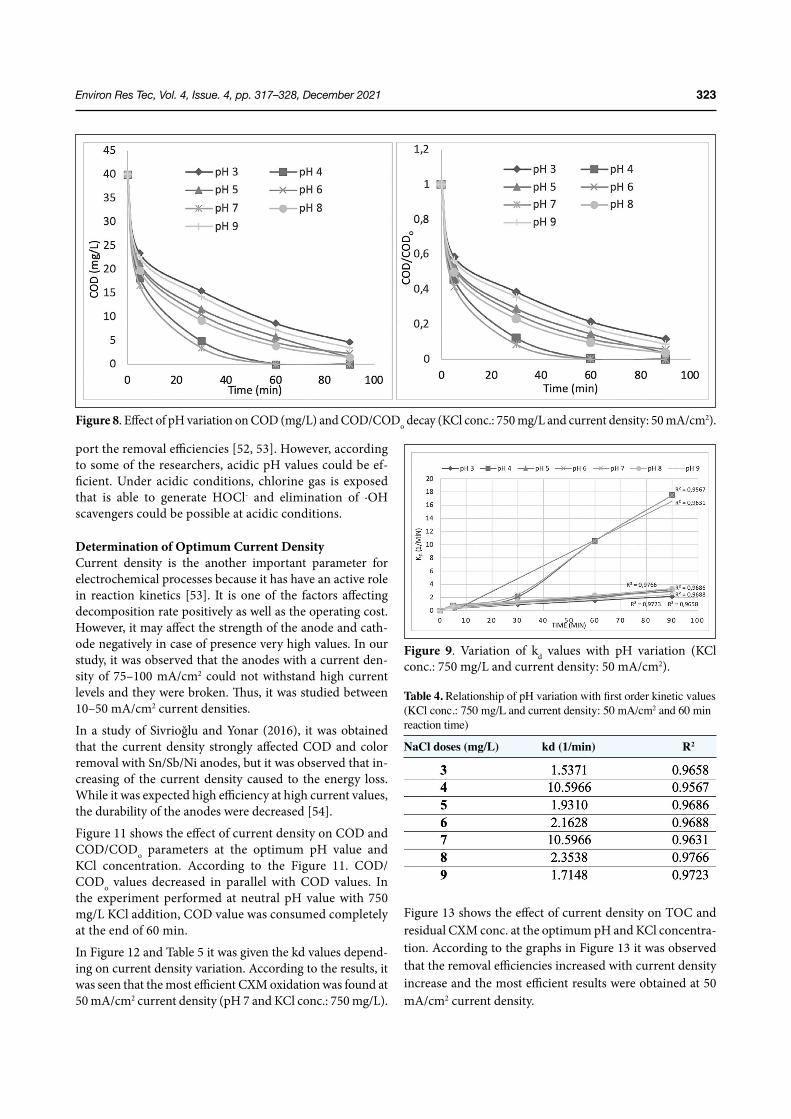
Environ Res Tec, Vol. 4, Issue. 4, pp. 317–328, December 2021 323
port the removal efficiencies [52, 53]. However, according to some of the researchers, acidic pH values could be ef-ficient. Under acidic conditions, chlorine gas is exposed that is able to generate HOCl- and elimination of ∙OH scavengers could be possible at acidic conditions.
Determination of Optimum Current DensityCurrent density is the another important parameter for electrochemical processes because it has have an active role in reaction kinetics [53]. It is one of the factors affecting decomposition rate positively as well as the operating cost. However, it may affect the strength of the anode and cath-ode negatively in case of presence very high values. In our study, it was observed that the anodes with a current den-sity of 75–100 mA/cm2 could not withstand high current levels and they were broken. Thus, it was studied between 10–50 mA/cm2 current densities.
In a study of Sivrioğlu and Yonar (2016), it was obtained that the current density strongly affected COD and color removal with Sn/Sb/Ni anodes, but it was observed that in-creasing of the current density caused to the energy loss. While it was expected high efficiency at high current values, the durability of the anodes were decreased [54].
Figure 11 shows the effect of current density on COD and COD/CODo parameters at the optimum pH value and KCl concentration. According to the Figure 11. COD/CODo values decreased in parallel with COD values. In the experiment performed at neutral pH value with 750 mg/L KCl addition, COD value was consumed completely at the end of 60 min.
In Figure 12 and Table 5 it was given the kd values depend-ing on current density variation. According to the results, it was seen that the most efficient CXM oxidation was found at 50 mA/cm2 current density (pH 7 and KCl conc.: 750 mg/L).
Figure 13 shows the effect of current density on TOC and residual CXM conc. at the optimum pH and KCl concentra-tion. According to the graphs in Figure 13 it was observed that the removal efficiencies increased with current density increase and the most efficient results were obtained at 50 mA/cm2 current density.
Figure 8. Effect of pH variation on COD (mg/L) and COD/CODo decay (KCl conc.: 750 mg/L and current density: 50 mA/cm2).
Table 4. Relationship of pH variation with first order kinetic values (KCl conc.: 750 mg/L and current density: 50 mA/cm2 and 60 min reaction time)
NaCl doses (mg/L) kd (1/min) R2
Figure 9. Variation of kd values with pH variation (KCl conc.: 750 mg/L and current density: 50 mA/cm2).
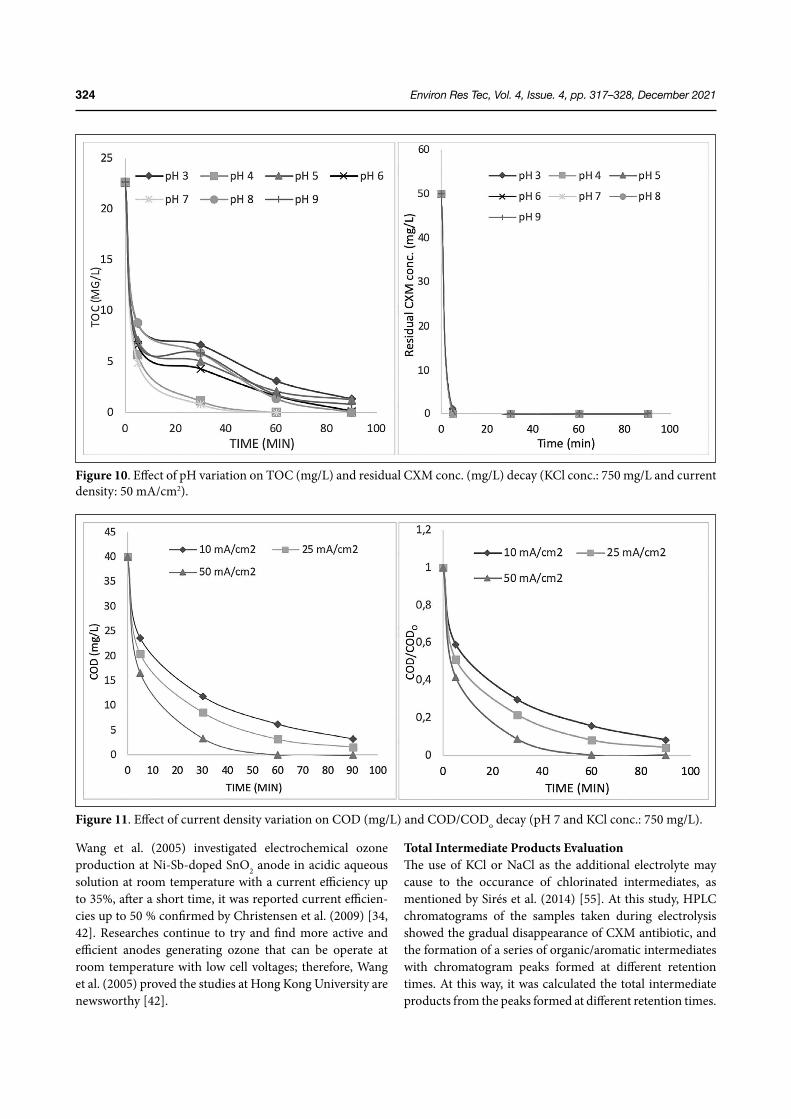
Environ Res Tec, Vol. 4, Issue. 4, pp. 317–328, December 2021324
Wang et al. (2005) investigated electrochemical ozone production at Ni-Sb-doped SnO2 anode in acidic aqueous solution at room temperature with a current efficiency up to 35%, after a short time, it was reported current efficien-cies up to 50 % confirmed by Christensen et al. (2009) [34, 42]. Researches continue to try and find more active and efficient anodes generating ozone that can be operate at room temperature with low cell voltages; therefore, Wang et al. (2005) proved the studies at Hong Kong University are newsworthy [42].
Total Intermediate Products EvaluationThe use of KCl or NaCl as the additional electrolyte may cause to the occurance of chlorinated intermediates, as mentioned by Sirés et al. (2014) [55]. At this study, HPLC chromatograms of the samples taken during electrolysis showed the gradual disappearance of CXM antibiotic, and the formation of a series of organic/aromatic intermediates with chromatogram peaks formed at different retention times. At this way, it was calculated the total intermediate products from the peaks formed at different retention times.
Figure 10. Effect of pH variation on TOC (mg/L) and residual CXM conc. (mg/L) decay (KCl conc.: 750 mg/L and current density: 50 mA/cm2).
Figure 11. Effect of current density variation on COD (mg/L) and COD/CODo decay (pH 7 and KCl conc.: 750 mg/L).
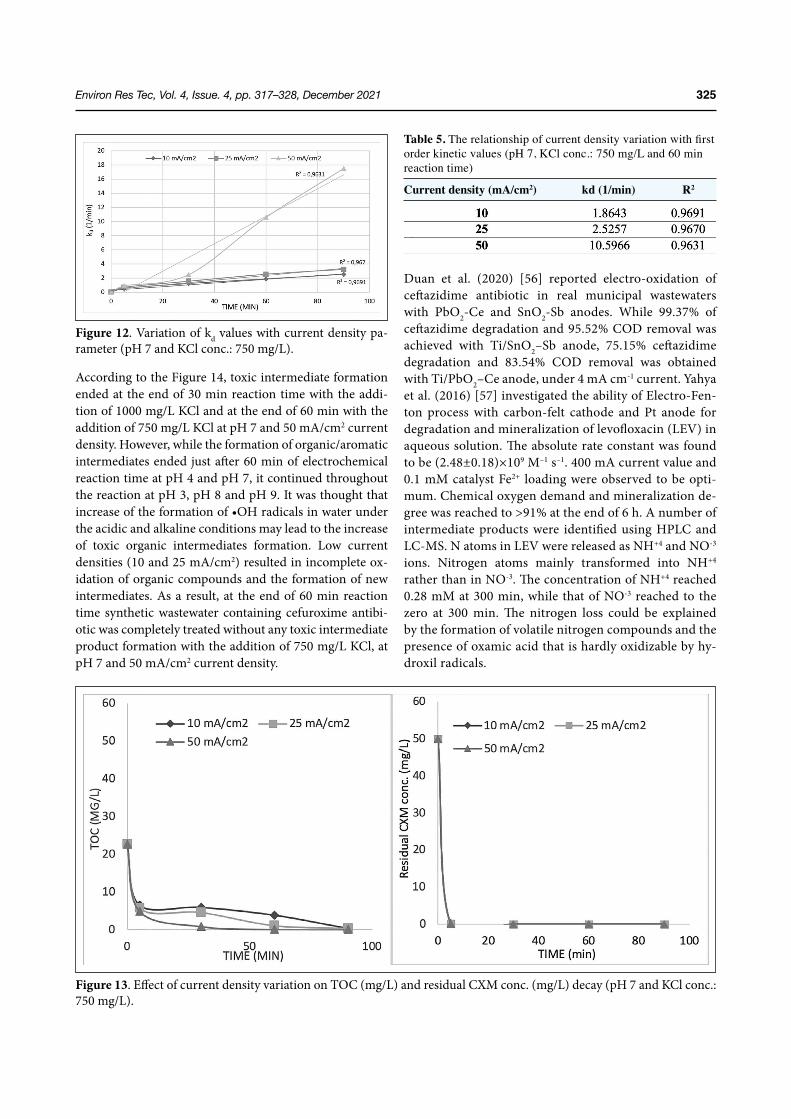
Environ Res Tec, Vol. 4, Issue. 4, pp. 317–328, December 2021 325
According to the Figure 14, toxic intermediate formation ended at the end of 30 min reaction time with the addi-tion of 1000 mg/L KCl and at the end of 60 min with the addition of 750 mg/L KCl at pH 7 and 50 mA/cm2 current density. However, while the formation of organic/aromatic intermediates ended just after 60 min of electrochemical reaction time at pH 4 and pH 7, it continued throughout the reaction at pH 3, pH 8 and pH 9. It was thought that increase of the formation of •OH radicals in water under the acidic and alkaline conditions may lead to the increase of toxic organic intermediates formation. Low current densities (10 and 25 mA/cm2) resulted in incomplete ox-idation of organic compounds and the formation of new intermediates. As a result, at the end of 60 min reaction time synthetic wastewater containing cefuroxime antibi-otic was completely treated without any toxic intermediate product formation with the addition of 750 mg/L KCl, at pH 7 and 50 mA/cm2 current density.
Duan et al. (2020) [56] reported electro-oxidation of ceftazidime antibiotic in real municipal wastewaters with PbO2-Ce and SnO2-Sb anodes. While 99.37% of ceftazidime degradation and 95.52% COD removal was achieved with Ti/SnO2–Sb anode, 75.15% ceftazidime degradation and 83.54% COD removal was obtained with Ti/PbO2–Ce anode, under 4 mA cm-1 current. Yahya et al. (2016) [57] investigated the ability of Electro-Fen-ton process with carbon-felt cathode and Pt anode for degradation and mineralization of levofloxacin (LEV) in aqueous solution. The absolute rate constant was found to be (2.48±0.18)×109 M–1 s–1. 400 mA current value and 0.1 mM catalyst Fe2+ loading were observed to be opti-mum. Chemical oxygen demand and mineralization de-gree was reached to >91% at the end of 6 h. A number of intermediate products were identified using HPLC and LC-MS. N atoms in LEV were released as NH+4 and NO-3 ions. Nitrogen atoms mainly transformed into NH+4 rather than in NO-3. The concentration of NH+4 reached 0.28 mM at 300 min, while that of NO-3 reached to the zero at 300 min. The nitrogen loss could be explained by the formation of volatile nitrogen compounds and the presence of oxamic acid that is hardly oxidizable by hy-droxil radicals.
Figure 13. Effect of current density variation on TOC (mg/L) and residual CXM conc. (mg/L) decay (pH 7 and KCl conc.: 750 mg/L).
Figure 12. Variation of kd values with current density pa-rameter (pH 7 and KCl conc.: 750 mg/L).
Table 5. The relationship of current density variation with first order kinetic values (pH 7, KCl conc.: 750 mg/L and 60 min reaction time)
Current density (mA/cm2) kd (1/min) R2
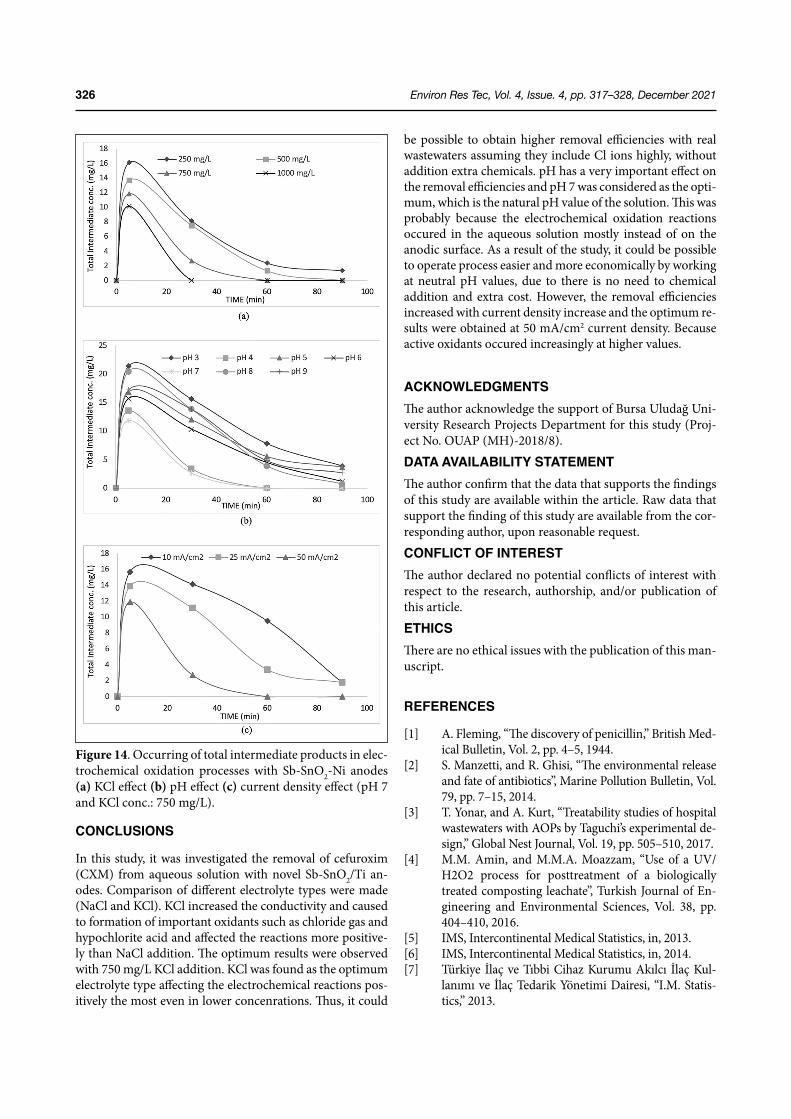
Environ Res Tec, Vol. 4, Issue. 4, pp. 317–328, December 2021326
CONCLUSIONS
In this study, it was investigated the removal of cefuroxim (CXM) from aqueous solution with novel Sb-SnO2/Ti an-odes. Comparison of different electrolyte types were made (NaCl and KCl). KCl increased the conductivity and caused to formation of important oxidants such as chloride gas and hypochlorite acid and affected the reactions more positive-ly than NaCl addition. The optimum results were observed with 750 mg/L KCl addition. KCl was found as the optimum electrolyte type affecting the electrochemical reactions pos-itively the most even in lower concenrations. Thus, it could
be possible to obtain higher removal efficiencies with real wastewaters assuming they include Cl ions highly, without addition extra chemicals. pH has a very important effect on the removal efficiencies and pH 7 was considered as the opti-mum, which is the natural pH value of the solution. This was probably because the electrochemical oxidation reactions occured in the aqueous solution mostly instead of on the anodic surface. As a result of the study, it could be possible to operate process easier and more economically by working at neutral pH values, due to there is no need to chemical addition and extra cost. However, the removal efficiencies increased with current density increase and the optimum re-sults were obtained at 50 mA/cm2 current density. Because active oxidants occured increasingly at higher values.
ACKNOWLEDGMENTSThe author acknowledge the support of Bursa Uludağ Uni-versity Research Projects Department for this study (Proj-ect No. OUAP (MH)-2018/8).DATA AVAILABILITY STATEMENTThe author confirm that the data that supports the findings of this study are available within the article. Raw data that support the finding of this study are available from the cor-responding author, upon reasonable request.CONFLICT OF INTERESTThe author declared no potential conflicts of interest with respect to the research, authorship, and/or publication of this article.ETHICSThere are no ethical issues with the publication of this man-uscript.
REFERENCES
[1] A. Fleming, “The discovery of penicillin,” British Med-ical Bulletin, Vol. 2, pp. 4–5, 1944.
[2] S. Manzetti, and R. Ghisi, “The environmental release and fate of antibiotics”, Marine Pollution Bulletin, Vol. 79, pp. 7–15, 2014.
[3] T. Yonar, and A. Kurt, “Treatability studies of hospital wastewaters with AOPs by Taguchi’s experimental de-sign,” Global Nest Journal, Vol. 19, pp. 505–510, 2017.
[4] M.M. Amin, and M.M.A. Moazzam, “Use of a UV/H2O2 process for posttreatment of a biologically treated composting leachate”, Turkish Journal of En-gineering and Environmental Sciences, Vol. 38, pp. 404–410, 2016.
[5] IMS, Intercontinental Medical Statistics, in, 2013.[6] IMS, Intercontinental Medical Statistics, in, 2014.[7] Türkiye İlaç ve Tıbbi Cihaz Kurumu Akılcı İlaç Kul-
lanımı ve İlaç Tedarik Yönetimi Dairesi, “I.M. Statis-tics,” 2013.
Figure 14. Occurring of total intermediate products in elec-trochemical oxidation processes with Sb-SnO2-Ni anodes (a) KCl effect (b) pH effect (c) current density effect (pH 7 and KCl conc.: 750 mg/L).
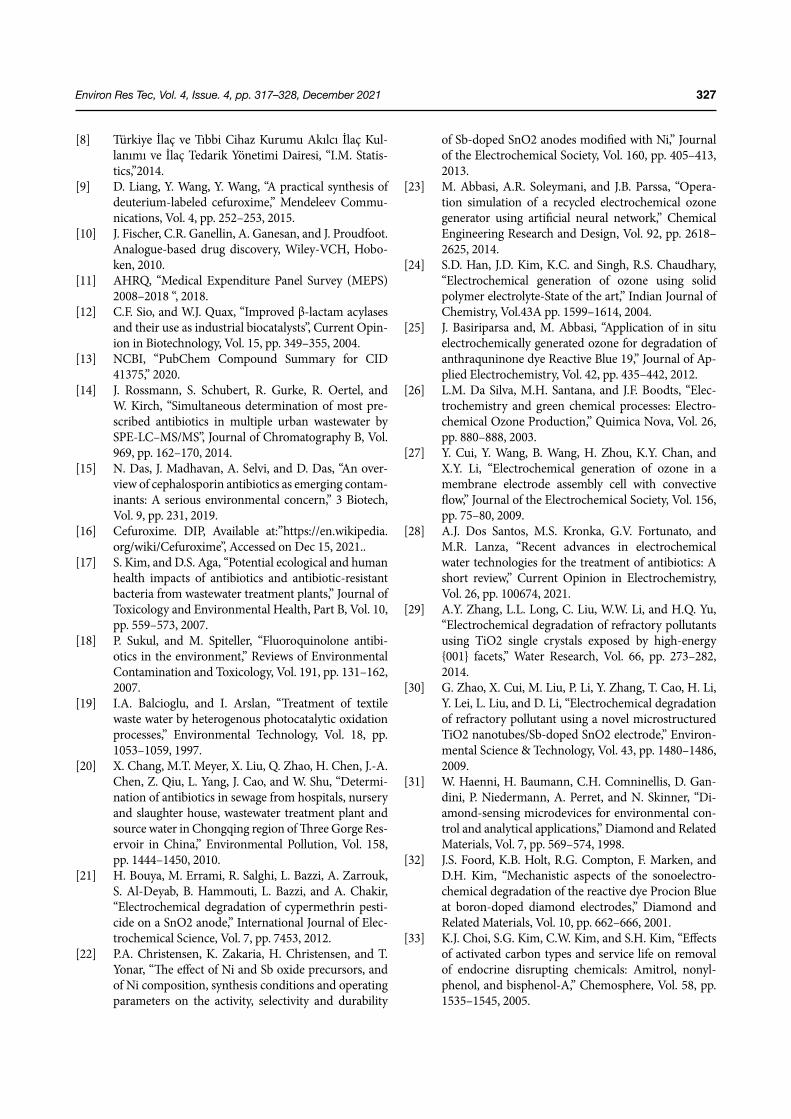
Environ Res Tec, Vol. 4, Issue. 4, pp. 317–328, December 2021 327
[8] Türkiye İlaç ve Tıbbi Cihaz Kurumu Akılcı İlaç Kul-lanımı ve İlaç Tedarik Yönetimi Dairesi, “I.M. Statis-tics,”2014.
[9] D. Liang, Y. Wang, Y. Wang, “A practical synthesis of deuterium-labeled cefuroxime,” Mendeleev Commu-nications, Vol. 4, pp. 252–253, 2015.
[10] J. Fischer, C.R. Ganellin, A. Ganesan, and J. Proudfoot. Analogue-based drug discovery, Wiley-VCH, Hobo-ken, 2010.
[11] AHRQ, “Medical Expenditure Panel Survey (MEPS) 2008–2018 “, 2018.
[12] C.F. Sio, and W.J. Quax, “Improved β-lactam acylases and their use as industrial biocatalysts”, Current Opin-ion in Biotechnology, Vol. 15, pp. 349–355, 2004.
[13] NCBI, “PubChem Compound Summary for CID 41375,” 2020.
[14] J. Rossmann, S. Schubert, R. Gurke, R. Oertel, and W. Kirch, “Simultaneous determination of most pre-scribed antibiotics in multiple urban wastewater by SPE-LC–MS/MS”, Journal of Chromatography B, Vol. 969, pp. 162–170, 2014.
[15] N. Das, J. Madhavan, A. Selvi, and D. Das, “An over-view of cephalosporin antibiotics as emerging contam-inants: A serious environmental concern,” 3 Biotech, Vol. 9, pp. 231, 2019.
[16] Cefuroxime. DIP, Available at:”https://en.wikipedia.org/wiki/Cefuroxime”, Accessed on Dec 15, 2021..
[17] S. Kim, and D.S. Aga, “Potential ecological and human health impacts of antibiotics and antibiotic-resistant bacteria from wastewater treatment plants,” Journal of Toxicology and Environmental Health, Part B, Vol. 10, pp. 559–573, 2007.
[18] P. Sukul, and M. Spiteller, “Fluoroquinolone antibi-otics in the environment,” Reviews of Environmental Contamination and Toxicology, Vol. 191, pp. 131–162, 2007.
[19] I.A. Balcioglu, and I. Arslan, “Treatment of textile waste water by heterogenous photocatalytic oxidation processes,” Environmental Technology, Vol. 18, pp. 1053–1059, 1997.
[20] X. Chang, M.T. Meyer, X. Liu, Q. Zhao, H. Chen, J.-A. Chen, Z. Qiu, L. Yang, J. Cao, and W. Shu, “Determi-nation of antibiotics in sewage from hospitals, nursery and slaughter house, wastewater treatment plant and source water in Chongqing region of Three Gorge Res-ervoir in China,” Environmental Pollution, Vol. 158, pp. 1444–1450, 2010.
[21] H. Bouya, M. Errami, R. Salghi, L. Bazzi, A. Zarrouk, S. Al-Deyab, B. Hammouti, L. Bazzi, and A. Chakir, “Electrochemical degradation of cypermethrin pesti-cide on a SnO2 anode,” International Journal of Elec-trochemical Science, Vol. 7, pp. 7453, 2012.
[22] P.A. Christensen, K. Zakaria, H. Christensen, and T. Yonar, “The effect of Ni and Sb oxide precursors, and of Ni composition, synthesis conditions and operating parameters on the activity, selectivity and durability
of Sb-doped SnO2 anodes modified with Ni,” Journal of the Electrochemical Society, Vol. 160, pp. 405–413, 2013.
[23] M. Abbasi, A.R. Soleymani, and J.B. Parssa, “Opera-tion simulation of a recycled electrochemical ozone generator using artificial neural network,” Chemical Engineering Research and Design, Vol. 92, pp. 2618–2625, 2014.
[24] S.D. Han, J.D. Kim, K.C. and Singh, R.S. Chaudhary, “Electrochemical generation of ozone using solid polymer electrolyte-State of the art,” Indian Journal of Chemistry, Vol.43A pp. 1599–1614, 2004.
[25] J. Basiriparsa and, M. Abbasi, “Application of in situ electrochemically generated ozone for degradation of anthraquninone dye Reactive Blue 19,” Journal of Ap-plied Electrochemistry, Vol. 42, pp. 435–442, 2012.
[26] L.M. Da Silva, M.H. Santana, and J.F. Boodts, “Elec-trochemistry and green chemical processes: Electro-chemical Ozone Production,” Quimica Nova, Vol. 26, pp. 880–888, 2003.
[27] Y. Cui, Y. Wang, B. Wang, H. Zhou, K.Y. Chan, and X.Y. Li, “Electrochemical generation of ozone in a membrane electrode assembly cell with convective flow,” Journal of the Electrochemical Society, Vol. 156, pp. 75–80, 2009.
[28] A.J. Dos Santos, M.S. Kronka, G.V. Fortunato, and M.R. Lanza, “Recent advances in electrochemical water technologies for the treatment of antibiotics: A short review,” Current Opinion in Electrochemistry, Vol. 26, pp. 100674, 2021.
[29] A.Y. Zhang, L.L. Long, C. Liu, W.W. Li, and H.Q. Yu, “Electrochemical degradation of refractory pollutants using TiO2 single crystals exposed by high-energy {001} facets,” Water Research, Vol. 66, pp. 273–282, 2014.
[30] G. Zhao, X. Cui, M. Liu, P. Li, Y. Zhang, T. Cao, H. Li, Y. Lei, L. Liu, and D. Li, “Electrochemical degradation of refractory pollutant using a novel microstructured TiO2 nanotubes/Sb-doped SnO2 electrode,” Environ-mental Science & Technology, Vol. 43, pp. 1480–1486, 2009.
[31] W. Haenni, H. Baumann, C.H. Comninellis, D. Gan-dini, P. Niedermann, A. Perret, and N. Skinner, “Di-amond-sensing microdevices for environmental con-trol and analytical applications,” Diamond and Related Materials, Vol. 7, pp. 569–574, 1998.
[32] J.S. Foord, K.B. Holt, R.G. Compton, F. Marken, and D.H. Kim, “Mechanistic aspects of the sonoelectro-chemical degradation of the reactive dye Procion Blue at boron-doped diamond electrodes,” Diamond and Related Materials, Vol. 10, pp. 662–666, 2001.
[33] K.J. Choi, S.G. Kim, C.W. Kim, and S.H. Kim, “Effects of activated carbon types and service life on removal of endocrine disrupting chemicals: Amitrol, nonyl-phenol, and bisphenol-A,” Chemosphere, Vol. 58, pp. 1535–1545, 2005.
Environ Res Tec, Vol. 4, Issue. 4, pp. 317–328, December 2021328
[34] P. Christensen, W. Lin, H. Christensen, A. Imkum, J. Jin, G. Li, and C.M. Dyson, “Room temperature, elec-trochemical generation of ozone with 50% current efficiency in 0.5 M sulfuric acid at cell voltages< 3V,” Ozone: Science & Engineering, Vol. 31, pp. 287–293, 2009.
[35] X. Yang, R. Zou, F. Huo, D. Cai, and D. Xiao, “Prepara-tion and characterization of Ti/SnO2–Sb2O3–Nb2O5/PbO2 thin film as electrode material for the degrada-tion of phenol,” Journal of Hazardous Materials, Vol. 164, pp. 367–373, 2009.
[36] A.G. Trovo, R.F.P. Nogueira, A. Agüera, A.R. Fernan-dez-Alba, and S. Malato, “Degradation of the antibiot-ic amoxicillin by photo-Fenton process–chemical and toxicological assessment,” Water Research, Vol. 45, pp. 1394–1402, 2011.
[37] E.S. Elmolla, and M. Chaudhuri, “The feasibility of using combined TiO2 photocatalysis-SBR process for antibiotic wastewater treatment,” Desalination, Vol. 272, pp. 218–224, 2011.
[38] P.E. Stackelberg, E.T. Furlong, M.T. Meyer, S.D. Zaugg, A.K. and Henderson, D.B. Reissman, “Persistence of pharmaceutical compounds and other organic waste-water contaminants in a conventional drinking-wa-ter-treatment plant,” Science of the Total Environment, Vol. 329, pp. 99–113, 2004.
[39] L.H. Santos, M. Gros, S. Rodriguez-Mozaz, C. Deler-ue-Matos, A. Pena, D. Barceló, M. Conceição, and B.S.M.Montenegroa, “Contribution of hospital efflu-ents to the load of pharmaceuticals in urban wastewa-ters: Identification of ecologically relevant pharmaceu-ticals,” Science of the Total Environment, Vol. 461, pp. 302–316, 2013.
[40] J. Wang, D. Duncan, Z. Shi, and B. Zhang, “WEB-based gene set analysis toolkit (WebGestalt): Update 2013,” Nucleic Acids Research, Vol. 41, pp. 77–83, 2013.
[41] L. Yao, Y. Wang, L. Tong, Y. Li, Y. Deng, W. Guo, and Y. Gan, “Seasonal variation of antibiotics concentration in the aquatic environment: A case study at Jianghan Plain, central China,” Science of the Total Environ-ment, Vol. 527–528, pp. 56–64, 2015.
[42] Y.H. Wang, S. Cheng, K.Y. Chan, and X.Y. Li, “Elec-trolytic generation of ozone on antimony-and nick-el-doped tin oxide electrode,” Journal of the Electro-chemical Society, Vol. 152, pp. 197–200, 2005.
[43] A. Kurt, “Anodic oxidation of cefaclor antibiotic in aqueous solution containing potassium chloride,” Global NEST Journal, Vol. 22, pp. 438–445, 2020.
[44] W.E. Federation, A.P.H. Association, “Standard meth-ods for the examination of water and wastewater,” American Public Health Association (APHA): Wash-ington, DC, USA, 2005.
[45] J.B. Parsa, M. Golmirzaei, M. Abbasi, “Degradation of azo dye CI Acid Red 18 in aqueous solution by ozone-electrolysis process,” Journal of Industrial and Engineering Chemistry, Vol. 20, pp. 689–694, 2014.
[46] I.M.S. Pillai, and A.K. Gupta, “Anodic oxidation of coke oven wastewater: multiparameter optimization for simultaneous removal of cyanide, COD and phe-nol”, Journal of Environmental Management, Vol. 176, pp. 45–53, 2016.
[47] Z. Shen, D. Wu, J. Yang, T. Yuan, W. Wang, and J. Jia, “Methods to improve electrochemical treatment ef-fect of dye wastewater,” Journal of Hazardous Materi-als, Vol. 131, pp. 90–97, 2006.
[48] X. Tu, S. Xiao, Y. Song, D. Zhang, and P. Zeng, “Treat-ment of simulated berberine wastewater by electro-chemical process with Pt/Ti anode,” Environmental Earth Sciences, Vol. 73, pp. 4957–4966, 2015.
[49] K. Arihara, and C. Terashima, A. Fujishima, “Elec-trochemical production of high-concentration ozone-water using freestanding perforated diamond electrodes,” Journal of the Electrochemical Society, Vol. 154, pp. 71–75, 2007.
[50] Y. Wang, C. Shen, M. Zhang, B.T. Zhang, and Y.G. Yu, "The electrochemical degradation of ciprofloxa-cin using a SnO2-Sb/Ti anode: influencing factors, reaction pathways and energy demand", Chemical Engineering Journal, Vol. 296, pp. 79–89, 2016.
[51] S.D. Jojoa-Sierra, J. Silva-Agredo, E. Herrera-Cal-deron, and R.A. Torres-Palma, “Elimination of the antibiotic norfloxacin in municipal wastewater, urine and seawater by electrochemical oxidation on IrO2 anodes,” Science of The Total Environment, Vol. 575 pp. 1228–1238, 2017.
[52] X.M. Li, M. Wang, Z. Jiao, and Z. Chen, “Study on electrolytic oxidation for landfill leachate treatment,” China Water and Wastewater, Vol. 17,pp. 14–17, 2001.
[53] Y. Deng, and J.D. Englehardt, “Electrochemical ox-idation for landfill leachate treatment,” Waste Man-agement, Vol. 27, pp. 380–388, 2007.
[54] Ö. Sivrioğlu, and T. Yonar, “Electrochemical Degra-dation of Textile Effluent Using Novel Ozone Gen-erating Sn-Sb-Ni Anodes,” International Journal of Environmental Engineering, Vol. 3, pp. 55–59, 2016.
[55] I. Sirés, E. Brillas, M.A. Oturan, M.A. Rodrigo, and M. Panizza, “Electrochemical advanced oxidation processes: today and tomorrow. A review,” Environ-mental Science and Pollution Research, Vol. 21, pp. 8336–8367, 2014.
[56] P. Duan, X. Jia, J. Lin, and R. Xia, "Electro-oxidation of ceftazidime in real municipal wastewater using PbO2–Ce and SnO2–Sb electrodes: influence of elec-trolyte and degradation pathway", Journal of Applied Electrochemistry, Vol. 51(2), pp. 183–195, 2021.
[57] M.S. Yahya, M. El Karbane, N. Oturan, K. El Kacemi, and M.A. Oturan, “Mineralization of the antibiotic levofloxacin in aqueous medium by electro-Fenton process: Kinetics and intermediate products anal-ysis,” Environmental technology, Vol. 37, pp. 1276–1287, 2016.
An investigation based on removal of ibuprofen and its transformation products by a batch activated sludge process: A kinetic study
Environ Res Tec, Vol. 4, Issue. 4, pp. 329–341, December 2021
Environmental Research and Technologyhttps://ert.yildiz.edu.tr - https://dergipark.org.tr/tr/pub/ert
DOI: https://doi.org/10.35208/ert.947460
Research Article
Ayşe ÖZGÜVEN* , Dilara ÖZTÜRK , Tuba BAYRAM
Department of Environmental Engineering, Van Yüzüncü Yıl University Faculty of Engineering, Van, Turkey
*Corresponding author.*E-mail address: [email protected]
Published by Yıldız Technical University Press, İstanbul, TurkeyCopyright 2021, Yıldız Technical University. This is an open access article under the CC BY-NC license (http://creativecommons.org/licenses/by-nc/4.0/).
ARTICLE INFO
Article historyReceived: 03 June 2021Revised: 19 October 2021Accepted: 25 October 2021
Key words:Activated sludge; Ibuprofen; Metabolite; Removal
ABSTRACT
Ibuprofen metabolites can form in humans as a result of metabolic activities or can be pro-duced by microorganisms in wastewater treatment plants and receiving environments, which increases their likelihood of being present in the environment. In this study, various experi-ments were conducted to determine the removal degree for ibuprofen, ibuprofen carboxylic acid (IBU-CBX), and 2-hydroxylated ibuprofen (IBU-2-OH) metabolites with an activated sludge reactor. Furthermore, the pseudo-first-order biodegradation rate constant (kbiol) (17.76 L/gSSday) was calculated to determine the decomposition degree of ibuprofen in the batch activated sludge system. The effects of different ibuprofen concentrations (8.2, 5.6, 3.2, 1.51 mg/L) at constant biomass concentration (3 g/L) on the biodegradation mechanism were investigated. In addition, IBU-2-OH and IBU-CBX were tested in a batch activated sludge reactor with a volume of 2 L individually at 100 μg/L with activated sludge containing 3 g/L biomass. It was observed that ibuprofen had a removal efficiency of more than 90%. IBU-CBX and IBU-2-OH were removed at approximately 27–91% and 18–82%, respectively. In abiotic conditions, the removal of ibuprofen was found to be 7.07%. It was confirmed that the removal of ibuprofen largely depended on biological degradation. This study enabled us to know which metabolites are involved in the biodegradation process of ibuprofen in batch experiments with the activated sludge process.
Cite this article as: Özgüven A, Öztürk D, Bayram T. An investigation based on removal of ibuprofen and its transformation products by a batch activated sludge process: A kinetic study. Environ Res Tec 2021;4:4:329–341.
INTRODUCTION
Due to the rapid increase in the human population and technological developments, toxic substance concentrations discharged to the receiving environment increase day by day. Industrial wastewater may contain various organic or inorganic contaminants [1]. Pharmaceutical compounds and their metabolites are subclasses of organic pollutants
usually detected in wastewater and surface water. As a result of human consumption and veterinary usage, pharmaceu-tical compounds are found in wastewater treatment plant effluents, in aquatic environments such as rivers and surface waters, and the potential for these substances to cause ad-verse effects in the aquatic environment has raised increas-ing concern [2–6]. The most common way medicines are transmitted to aquatic environments is by discharge from
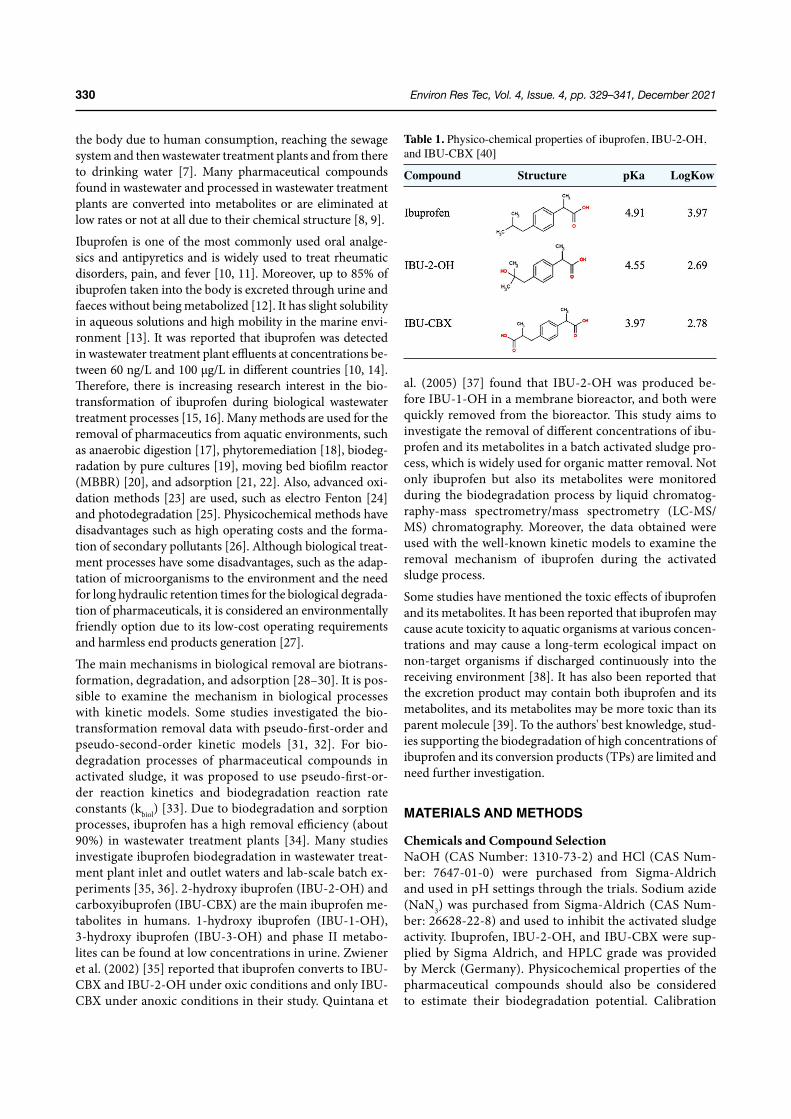
Environ Res Tec, Vol. 4, Issue. 4, pp. 329–341, December 2021330
the body due to human consumption, reaching the sewage system and then wastewater treatment plants and from there to drinking water [7]. Many pharmaceutical compounds found in wastewater and processed in wastewater treatment plants are converted into metabolites or are eliminated at low rates or not at all due to their chemical structure [8, 9].
Ibuprofen is one of the most commonly used oral analge-sics and antipyretics and is widely used to treat rheumatic disorders, pain, and fever [10, 11]. Moreover, up to 85% of ibuprofen taken into the body is excreted through urine and faeces without being metabolized [12]. It has slight solubility in aqueous solutions and high mobility in the marine envi-ronment [13]. It was reported that ibuprofen was detected in wastewater treatment plant effluents at concentrations be-tween 60 ng/L and 100 µg/L in different countries [10, 14]. Therefore, there is increasing research interest in the bio-transformation of ibuprofen during biological wastewater treatment processes [15, 16]. Many methods are used for the removal of pharmaceutics from aquatic environments, such as anaerobic digestion [17], phytoremediation [18], biodeg-radation by pure cultures [19], moving bed biofilm reactor (MBBR) [20], and adsorption [21, 22]. Also, advanced oxi-dation methods [23] are used, such as electro Fenton [24] and photodegradation [25]. Physicochemical methods have disadvantages such as high operating costs and the forma-tion of secondary pollutants [26]. Although biological treat-ment processes have some disadvantages, such as the adap-tation of microorganisms to the environment and the need for long hydraulic retention times for the biological degrada-tion of pharmaceuticals, it is considered an environmentally friendly option due to its low-cost operating requirements and harmless end products generation [27].
The main mechanisms in biological removal are biotrans-formation, degradation, and adsorption [28–30]. It is pos-sible to examine the mechanism in biological processes with kinetic models. Some studies investigated the bio-transformation removal data with pseudo-first-order and pseudo-second-order kinetic models [31, 32]. For bio-degradation processes of pharmaceutical compounds in activated sludge, it was proposed to use pseudo-first-or-der reaction kinetics and biodegradation reaction rate constants (kbiol) [33]. Due to biodegradation and sorption processes, ibuprofen has a high removal efficiency (about 90%) in wastewater treatment plants [34]. Many studies investigate ibuprofen biodegradation in wastewater treat-ment plant inlet and outlet waters and lab-scale batch ex-periments [35, 36]. 2-hydroxy ibuprofen (IBU-2-OH) and carboxyibuprofen (IBU-CBX) are the main ibuprofen me-tabolites in humans. 1-hydroxy ibuprofen (IBU-1-OH), 3-hydroxy ibuprofen (IBU-3-OH) and phase II metabo-lites can be found at low concentrations in urine. Zwiener et al. (2002) [35] reported that ibuprofen converts to IBU-CBX and IBU-2-OH under oxic conditions and only IBU-CBX under anoxic conditions in their study. Quintana et
al. (2005) [37] found that IBU-2-OH was produced be-fore IBU-1-OH in a membrane bioreactor, and both were quickly removed from the bioreactor. This study aims to investigate the removal of different concentrations of ibu-profen and its metabolites in a batch activated sludge pro-cess, which is widely used for organic matter removal. Not only ibuprofen but also its metabolites were monitored during the biodegradation process by liquid chromatog-raphy-mass spectrometry/mass spectrometry (LC-MS/MS) chromatography. Moreover, the data obtained were used with the well-known kinetic models to examine the removal mechanism of ibuprofen during the activated sludge process.
Some studies have mentioned the toxic effects of ibuprofen and its metabolites. It has been reported that ibuprofen may cause acute toxicity to aquatic organisms at various concen-trations and may cause a long-term ecological impact on non-target organisms if discharged continuously into the receiving environment [38]. It has also been reported that the excretion product may contain both ibuprofen and its metabolites, and its metabolites may be more toxic than its parent molecule [39]. To the authors' best knowledge, stud-ies supporting the biodegradation of high concentrations of ibuprofen and its conversion products (TPs) are limited and need further investigation.
MATERIALS AND METHODS
Chemicals and Compound SelectionNaOH (CAS Number: 1310-73-2) and HCl (CAS Num-ber: 7647-01-0) were purchased from Sigma-Aldrich and used in pH settings through the trials. Sodium azide (NaN3) was purchased from Sigma-Aldrich (CAS Num-ber: 26628-22-8) and used to inhibit the activated sludge activity. Ibuprofen, IBU-2-OH, and IBU-CBX were sup-plied by Sigma Aldrich, and HPLC grade was provided by Merck (Germany). Physicochemical properties of the pharmaceutical compounds should also be considered to estimate their biodegradation potential. Calibration
Table 1. Physico-chemical properties of ibuprofen, IBU-2-OH, and IBU-CBX [40]
Compound Structure pKa LogKow
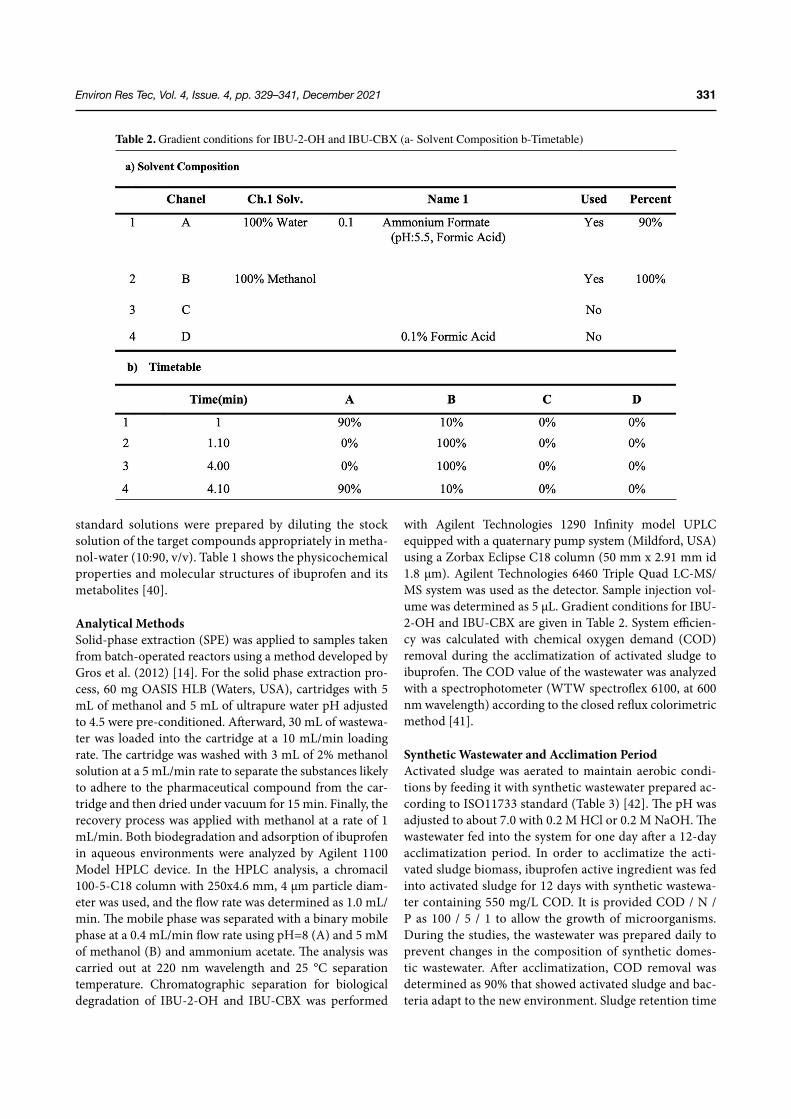
Environ Res Tec, Vol. 4, Issue. 4, pp. 329–341, December 2021 331
standard solutions were prepared by diluting the stock solution of the target compounds appropriately in metha-nol-water (10:90, v/v). Table 1 shows the physicochemical properties and molecular structures of ibuprofen and its metabolites [40].
Analytical MethodsSolid-phase extraction (SPE) was applied to samples taken from batch-operated reactors using a method developed by Gros et al. (2012) [14]. For the solid phase extraction pro-cess, 60 mg OASIS HLB (Waters, USA), cartridges with 5 mL of methanol and 5 mL of ultrapure water pH adjusted to 4.5 were pre-conditioned. Afterward, 30 mL of wastewa-ter was loaded into the cartridge at a 10 mL/min loading rate. The cartridge was washed with 3 mL of 2% methanol solution at a 5 mL/min rate to separate the substances likely to adhere to the pharmaceutical compound from the car-tridge and then dried under vacuum for 15 min. Finally, the recovery process was applied with methanol at a rate of 1 mL/min. Both biodegradation and adsorption of ibuprofen in aqueous environments were analyzed by Agilent 1100 Model HPLC device. In the HPLC analysis, a chromacil 100-5-C18 column with 250x4.6 mm, 4 µm particle diam-eter was used, and the flow rate was determined as 1.0 mL/min. The mobile phase was separated with a binary mobile phase at a 0.4 mL/min flow rate using pH=8 (A) and 5 mM of methanol (B) and ammonium acetate. The analysis was carried out at 220 nm wavelength and 25 °C separation temperature. Chromatographic separation for biological degradation of IBU-2-OH and IBU-CBX was performed
with Agilent Technologies 1290 Infinity model UPLC equipped with a quaternary pump system (Mildford, USA) using a Zorbax Eclipse C18 column (50 mm x 2.91 mm id 1.8 μm). Agilent Technologies 6460 Triple Quad LC-MS/MS system was used as the detector. Sample injection vol-ume was determined as 5 μL. Gradient conditions for IBU-2-OH and IBU-CBX are given in Table 2. System efficien-cy was calculated with chemical oxygen demand (COD) removal during the acclimatization of activated sludge to ibuprofen. The COD value of the wastewater was analyzed with a spectrophotometer (WTW spectroflex 6100, at 600 nm wavelength) according to the closed reflux colorimetric method [41].
Synthetic Wastewater and Acclimation PeriodActivated sludge was aerated to maintain aerobic condi-tions by feeding it with synthetic wastewater prepared ac-cording to ISO11733 standard (Table 3) [42]. The pH was adjusted to about 7.0 with 0.2 M HCl or 0.2 M NaOH. The wastewater fed into the system for one day after a 12-day acclimatization period. In order to acclimatize the acti-vated sludge biomass, ibuprofen active ingredient was fed into activated sludge for 12 days with synthetic wastewa-ter containing 550 mg/L COD. It is provided COD / N / P as 100 / 5 / 1 to allow the growth of microorganisms. During the studies, the wastewater was prepared daily to prevent changes in the composition of synthetic domes-tic wastewater. After acclimatization, COD removal was determined as 90% that showed activated sludge and bac-teria adapt to the new environment. Sludge retention time
Table 2. Gradient conditions for IBU-2-OH and IBU-CBX (a- Solvent Composition b-Timetable)
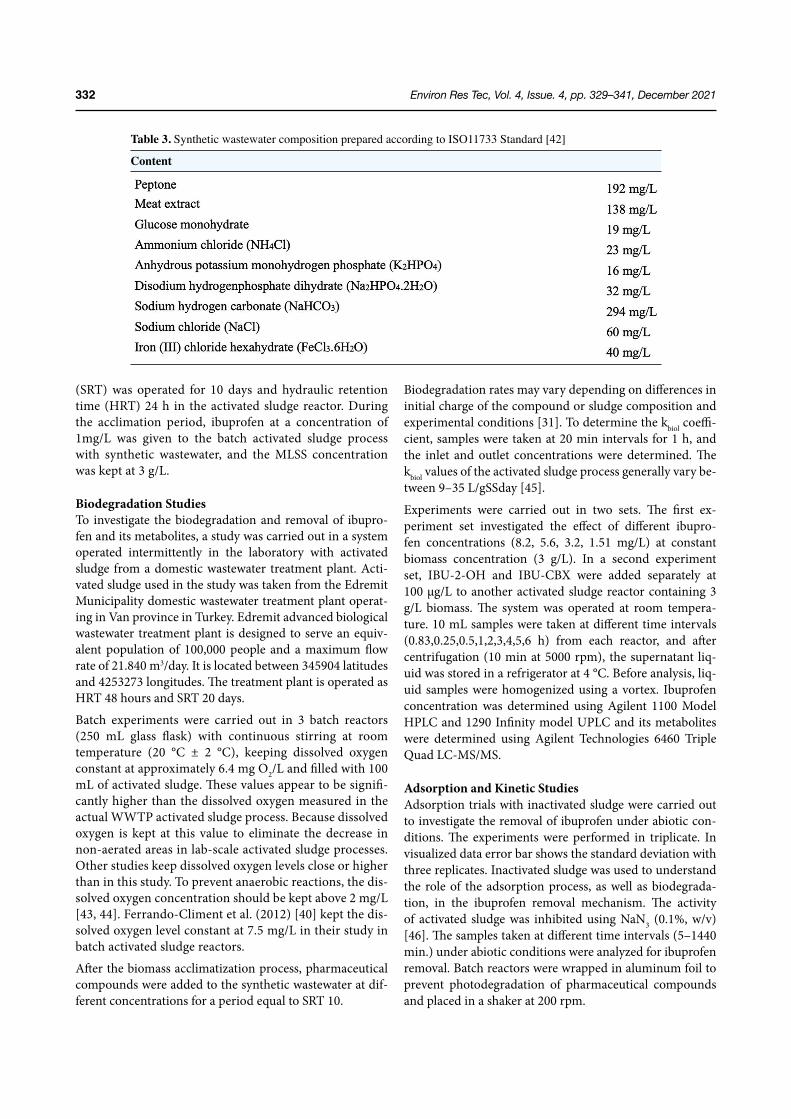
Environ Res Tec, Vol. 4, Issue. 4, pp. 329–341, December 2021332
(SRT) was operated for 10 days and hydraulic retention time (HRT) 24 h in the activated sludge reactor. During the acclimation period, ibuprofen at a concentration of 1mg/L was given to the batch activated sludge process with synthetic wastewater, and the MLSS concentration was kept at 3 g/L.
Biodegradation StudiesTo investigate the biodegradation and removal of ibupro-fen and its metabolites, a study was carried out in a system operated intermittently in the laboratory with activated sludge from a domestic wastewater treatment plant. Acti-vated sludge used in the study was taken from the Edremit Municipality domestic wastewater treatment plant operat-ing in Van province in Turkey. Edremit advanced biological wastewater treatment plant is designed to serve an equiv-alent population of 100,000 people and a maximum flow rate of 21.840 m3/day. It is located between 345904 latitudes and 4253273 longitudes. The treatment plant is operated as HRT 48 hours and SRT 20 days.
Batch experiments were carried out in 3 batch reactors (250 mL glass flask) with continuous stirring at room temperature (20 °C ± 2 °C), keeping dissolved oxygen constant at approximately 6.4 mg O2/L and filled with 100 mL of activated sludge. These values appear to be signifi-cantly higher than the dissolved oxygen measured in the actual WWTP activated sludge process. Because dissolved oxygen is kept at this value to eliminate the decrease in non-aerated areas in lab-scale activated sludge processes. Other studies keep dissolved oxygen levels close or higher than in this study. To prevent anaerobic reactions, the dis-solved oxygen concentration should be kept above 2 mg/L [43, 44]. Ferrando-Climent et al. (2012) [40] kept the dis-solved oxygen level constant at 7.5 mg/L in their study in batch activated sludge reactors.
After the biomass acclimatization process, pharmaceutical compounds were added to the synthetic wastewater at dif-ferent concentrations for a period equal to SRT 10.
Biodegradation rates may vary depending on differences in initial charge of the compound or sludge composition and experimental conditions [31]. To determine the kbiol coeffi-cient, samples were taken at 20 min intervals for 1 h, and the inlet and outlet concentrations were determined. The kbiol values of the activated sludge process generally vary be-tween 9–35 L/gSSday [45].
Experiments were carried out in two sets. The first ex-periment set investigated the effect of different ibupro-fen concentrations (8.2, 5.6, 3.2, 1.51 mg/L) at constant biomass concentration (3 g/L). In a second experiment set, IBU-2-OH and IBU-CBX were added separately at 100 μg/L to another activated sludge reactor containing 3 g/L biomass. The system was operated at room tempera-ture. 10 mL samples were taken at different time intervals (0.83,0.25,0.5,1,2,3,4,5,6 h) from each reactor, and after centrifugation (10 min at 5000 rpm), the supernatant liq-uid was stored in a refrigerator at 4 °C. Before analysis, liq-uid samples were homogenized using a vortex. Ibuprofen concentration was determined using Agilent 1100 Model HPLC and 1290 Infinity model UPLC and its metabolites were determined using Agilent Technologies 6460 Triple Quad LC-MS/MS.
Adsorption and Kinetic StudiesAdsorption trials with inactivated sludge were carried out to investigate the removal of ibuprofen under abiotic con-ditions. The experiments were performed in triplicate. In visualized data error bar shows the standard deviation with three replicates. Inactivated sludge was used to understand the role of the adsorption process, as well as biodegrada-tion, in the ibuprofen removal mechanism. The activity of activated sludge was inhibited using NaN3 (0.1%, w/v) [46]. The samples taken at different time intervals (5–1440 min.) under abiotic conditions were analyzed for ibuprofen removal. Batch reactors were wrapped in aluminum foil to prevent photodegradation of pharmaceutical compounds and placed in a shaker at 200 rpm.
Table 3. Synthetic wastewater composition prepared according to ISO11733 Standard [42]
Content
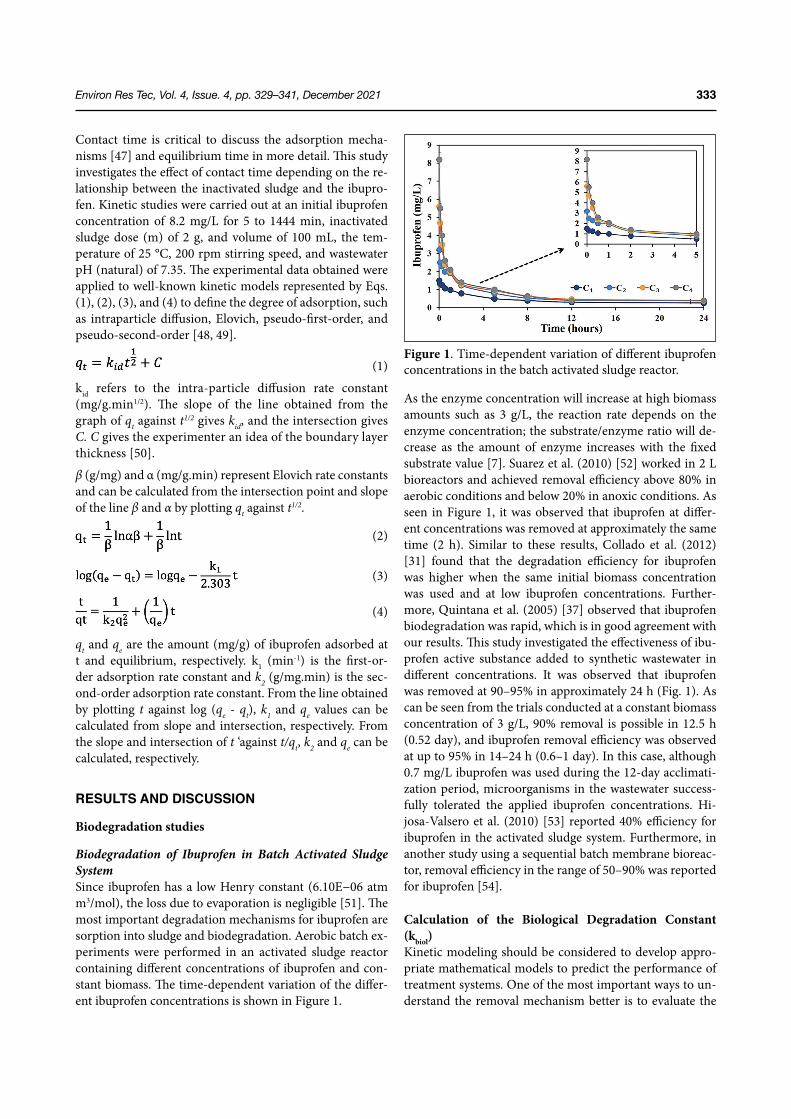
Environ Res Tec, Vol. 4, Issue. 4, pp. 329–341, December 2021 333
Contact time is critical to discuss the adsorption mecha-nisms [47] and equilibrium time in more detail. This study investigates the effect of contact time depending on the re-lationship between the inactivated sludge and the ibupro-fen. Kinetic studies were carried out at an initial ibuprofen concentration of 8.2 mg/L for 5 to 1444 min, inactivated sludge dose (m) of 2 g, and volume of 100 mL, the tem-perature of 25 °C, 200 rpm stirring speed, and wastewater pH (natural) of 7.35. The experimental data obtained were applied to well-known kinetic models represented by Eqs. (1), (2), (3), and (4) to define the degree of adsorption, such as intraparticle diffusion, Elovich, pseudo-first-order, and pseudo-second-order [48, 49].
(1)
kid refers to the intra-particle diffusion rate constant (mg/g.min1/2). The slope of the line obtained from the graph of qt against t1/2 gives kid, and the intersection gives C. C gives the experimenter an idea of the boundary layer thickness [50].
β (g/mg) and α (mg/g.min) represent Elovich rate constants and can be calculated from the intersection point and slope of the line β and α by plotting qt against t1/2.
(2)
(3)
(4)
qt and qe are the amount (mg/g) of ibuprofen adsorbed at t and equilibrium, respectively. k1 (min-1) is the first-or-der adsorption rate constant and k2 (g/mg.min) is the sec-ond-order adsorption rate constant. From the line obtained by plotting t against log (qe - qt), k1 and qe values can be calculated from slope and intersection, respectively. From the slope and intersection of t ‘against t/qt, k2 and qe can be calculated, respectively.
RESULTS AND DISCUSSION
Biodegradation studies
Biodegradation of Ibuprofen in Batch Activated Sludge SystemSince ibuprofen has a low Henry constant (6.10E−06 atm m3/mol), the loss due to evaporation is negligible [51]. The most important degradation mechanisms for ibuprofen are sorption into sludge and biodegradation. Aerobic batch ex-periments were performed in an activated sludge reactor containing different concentrations of ibuprofen and con-stant biomass. The time-dependent variation of the differ-ent ibuprofen concentrations is shown in Figure 1.
As the enzyme concentration will increase at high biomass amounts such as 3 g/L, the reaction rate depends on the enzyme concentration; the substrate/enzyme ratio will de-crease as the amount of enzyme increases with the fixed substrate value [7]. Suarez et al. (2010) [52] worked in 2 L bioreactors and achieved removal efficiency above 80% in aerobic conditions and below 20% in anoxic conditions. As seen in Figure 1, it was observed that ibuprofen at differ-ent concentrations was removed at approximately the same time (2 h). Similar to these results, Collado et al. (2012) [31] found that the degradation efficiency for ibuprofen was higher when the same initial biomass concentration was used and at low ibuprofen concentrations. Further-more, Quintana et al. (2005) [37] observed that ibuprofen biodegradation was rapid, which is in good agreement with our results. This study investigated the effectiveness of ibu-profen active substance added to synthetic wastewater in different concentrations. It was observed that ibuprofen was removed at 90–95% in approximately 24 h (Fig. 1). As can be seen from the trials conducted at a constant biomass concentration of 3 g/L, 90% removal is possible in 12.5 h (0.52 day), and ibuprofen removal efficiency was observed at up to 95% in 14–24 h (0.6–1 day). In this case, although 0.7 mg/L ibuprofen was used during the 12-day acclimati-zation period, microorganisms in the wastewater success-fully tolerated the applied ibuprofen concentrations. Hi-josa-Valsero et al. (2010) [53] reported 40% efficiency for ibuprofen in the activated sludge system. Furthermore, in another study using a sequential batch membrane bioreac-tor, removal efficiency in the range of 50–90% was reported for ibuprofen [54].
Calculation of the Biological Degradation Constant (kbiol)Kinetic modeling should be considered to develop appro-priate mathematical models to predict the performance of treatment systems. One of the most important ways to un-derstand the removal mechanism better is to evaluate the
Figure 1. Time-dependent variation of different ibuprofen concentrations in the batch activated sludge reactor.
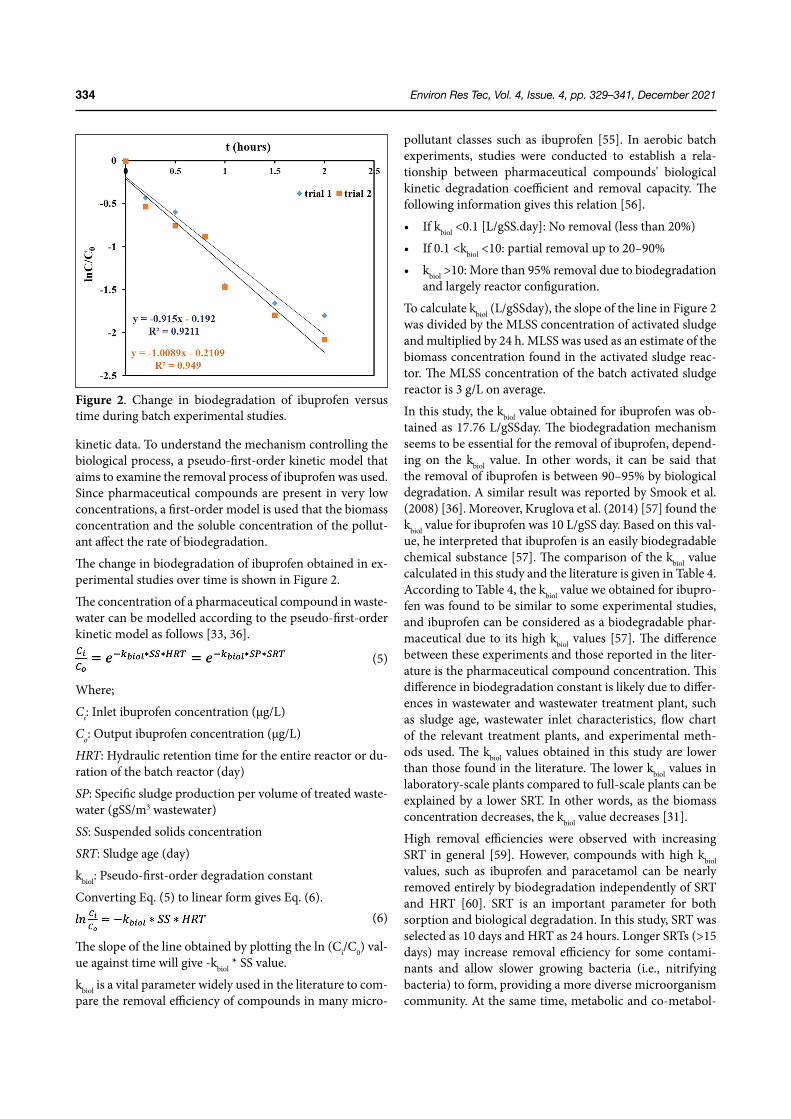
Environ Res Tec, Vol. 4, Issue. 4, pp. 329–341, December 2021334
kinetic data. To understand the mechanism controlling the biological process, a pseudo-first-order kinetic model that aims to examine the removal process of ibuprofen was used. Since pharmaceutical compounds are present in very low concentrations, a first-order model is used that the biomass concentration and the soluble concentration of the pollut-ant affect the rate of biodegradation.
The change in biodegradation of ibuprofen obtained in ex-perimental studies over time is shown in Figure 2.
The concentration of a pharmaceutical compound in waste-water can be modelled according to the pseudo-first-order kinetic model as follows [33, 36].
(5)
Where;
Ci: Inlet ibuprofen concentration (µg/L)
Co: Output ibuprofen concentration (µg/L)
HRT: Hydraulic retention time for the entire reactor or du-ration of the batch reactor (day)
SP: Specific sludge production per volume of treated waste-water (gSS/m3 wastewater)
SS: Suspended solids concentration
SRT: Sludge age (day)
kbiol: Pseudo-first-order degradation constant
Converting Eq. (5) to linear form gives Eq. (6).
(6)
The slope of the line obtained by plotting the ln (Ci/C0) val-ue against time will give -kbiol * SS value.
kbiol is a vital parameter widely used in the literature to com-pare the removal efficiency of compounds in many micro-
pollutant classes such as ibuprofen [55]. In aerobic batch experiments, studies were conducted to establish a rela-tionship between pharmaceutical compounds' biological kinetic degradation coefficient and removal capacity. The following information gives this relation [56].
• If kbiol <0.1 [L/gSS.day]: No removal (less than 20%)
• If 0.1 <kbiol <10: partial removal up to 20–90%
• kbiol >10: More than 95% removal due to biodegradation and largely reactor configuration.
To calculate kbiol (L/gSSday), the slope of the line in Figure 2 was divided by the MLSS concentration of activated sludge and multiplied by 24 h. MLSS was used as an estimate of the biomass concentration found in the activated sludge reac-tor. The MLSS concentration of the batch activated sludge reactor is 3 g/L on average.
In this study, the kbiol value obtained for ibuprofen was ob-tained as 17.76 L/gSSday. The biodegradation mechanism seems to be essential for the removal of ibuprofen, depend-ing on the kbiol value. In other words, it can be said that the removal of ibuprofen is between 90–95% by biological degradation. A similar result was reported by Smook et al. (2008) [36]. Moreover, Kruglova et al. (2014) [57] found the kbiol value for ibuprofen was 10 L/gSS day. Based on this val-ue, he interpreted that ibuprofen is an easily biodegradable chemical substance [57]. The comparison of the kbiol value calculated in this study and the literature is given in Table 4. According to Table 4, the kbiol value we obtained for ibupro-fen was found to be similar to some experimental studies, and ibuprofen can be considered as a biodegradable phar-maceutical due to its high kbiol values [57]. The difference between these experiments and those reported in the liter-ature is the pharmaceutical compound concentration. This difference in biodegradation constant is likely due to differ-ences in wastewater and wastewater treatment plant, such as sludge age, wastewater inlet characteristics, flow chart of the relevant treatment plants, and experimental meth-ods used. The kbiol values obtained in this study are lower than those found in the literature. The lower kbiol values in laboratory-scale plants compared to full-scale plants can be explained by a lower SRT. In other words, as the biomass concentration decreases, the kbiol value decreases [31].
High removal efficiencies were observed with increasing SRT in general [59]. However, compounds with high kbiol values, such as ibuprofen and paracetamol can be nearly removed entirely by biodegradation independently of SRT and HRT [60]. SRT is an important parameter for both sorption and biological degradation. In this study, SRT was selected as 10 days and HRT as 24 hours. Longer SRTs (>15 days) may increase removal efficiency for some contami-nants and allow slower growing bacteria (i.e., nitrifying bacteria) to form, providing a more diverse microorganism community. At the same time, metabolic and co-metabol-
Figure 2. Change in biodegradation of ibuprofen versus time during batch experimental studies.
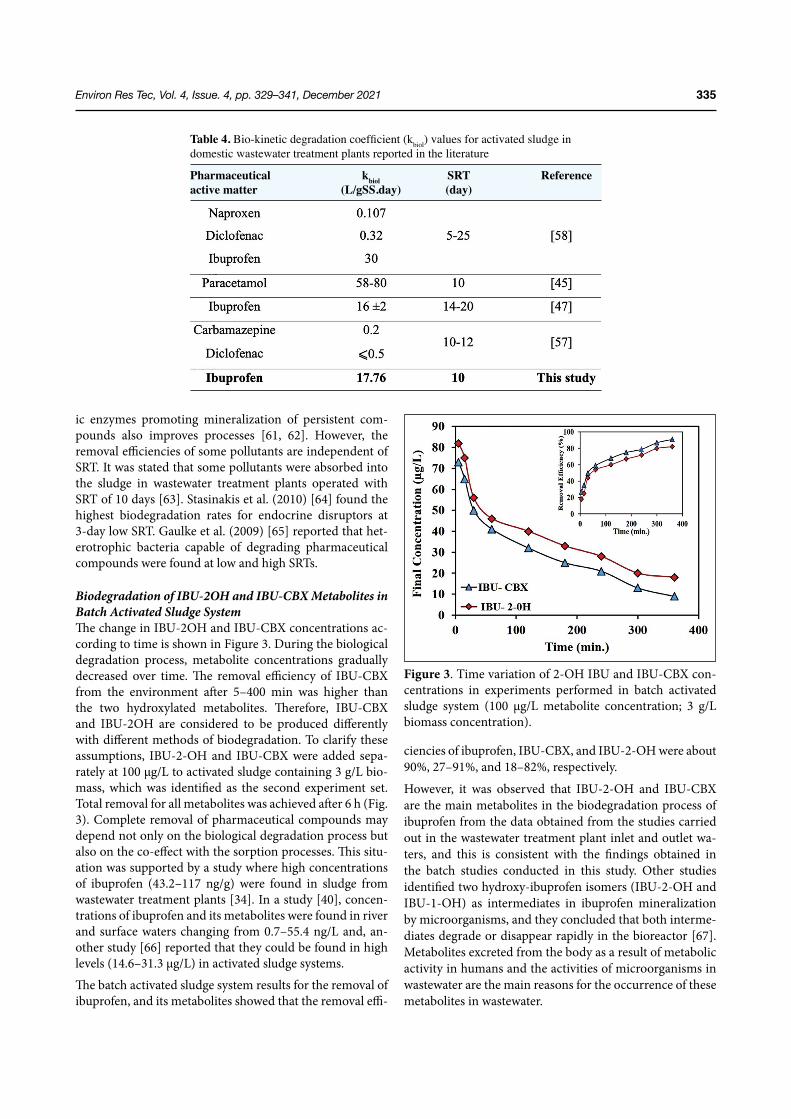
Environ Res Tec, Vol. 4, Issue. 4, pp. 329–341, December 2021 335
ic enzymes promoting mineralization of persistent com-pounds also improves processes [61, 62]. However, the removal efficiencies of some pollutants are independent of SRT. It was stated that some pollutants were absorbed into the sludge in wastewater treatment plants operated with SRT of 10 days [63]. Stasinakis et al. (2010) [64] found the highest biodegradation rates for endocrine disruptors at 3-day low SRT. Gaulke et al. (2009) [65] reported that het-erotrophic bacteria capable of degrading pharmaceutical compounds were found at low and high SRTs.
Biodegradation of IBU-2OH and IBU-CBX Metabolites in Batch Activated Sludge SystemThe change in IBU-2OH and IBU-CBX concentrations ac-cording to time is shown in Figure 3. During the biological degradation process, metabolite concentrations gradually decreased over time. The removal efficiency of IBU-CBX from the environment after 5–400 min was higher than the two hydroxylated metabolites. Therefore, IBU-CBX and IBU-2OH are considered to be produced differently with different methods of biodegradation. To clarify these assumptions, IBU-2-OH and IBU-CBX were added sepa-rately at 100 μg/L to activated sludge containing 3 g/L bio-mass, which was identified as the second experiment set. Total removal for all metabolites was achieved after 6 h (Fig. 3). Complete removal of pharmaceutical compounds may depend not only on the biological degradation process but also on the co-effect with the sorption processes. This situ-ation was supported by a study where high concentrations of ibuprofen (43.2–117 ng/g) were found in sludge from wastewater treatment plants [34]. In a study [40], concen-trations of ibuprofen and its metabolites were found in river and surface waters changing from 0.7–55.4 ng/L and, an-other study [66] reported that they could be found in high levels (14.6–31.3 μg/L) in activated sludge systems.The batch activated sludge system results for the removal of ibuprofen, and its metabolites showed that the removal effi-
ciencies of ibuprofen, IBU-CBX, and IBU-2-OH were about 90%, 27–91%, and 18–82%, respectively.
However, it was observed that IBU-2-OH and IBU-CBX are the main metabolites in the biodegradation process of ibuprofen from the data obtained from the studies carried out in the wastewater treatment plant inlet and outlet wa-ters, and this is consistent with the findings obtained in the batch studies conducted in this study. Other studies identified two hydroxy-ibuprofen isomers (IBU-2-OH and IBU-1-OH) as intermediates in ibuprofen mineralization by microorganisms, and they concluded that both interme-diates degrade or disappear rapidly in the bioreactor [67]. Metabolites excreted from the body as a result of metabolic activity in humans and the activities of microorganisms in wastewater are the main reasons for the occurrence of these metabolites in wastewater.
Table 4. Bio-kinetic degradation coefficient (kbiol) values for activated sludge in domestic wastewater treatment plants reported in the literature
Pharmaceutical kbiol SRT Reference active matter (L/gSS.day) (day)
Figure 3. Time variation of 2-OH IBU and IBU-CBX con-centrations in experiments performed in batch activated sludge system (100 μg/L metabolite concentration; 3 g/L biomass concentration).
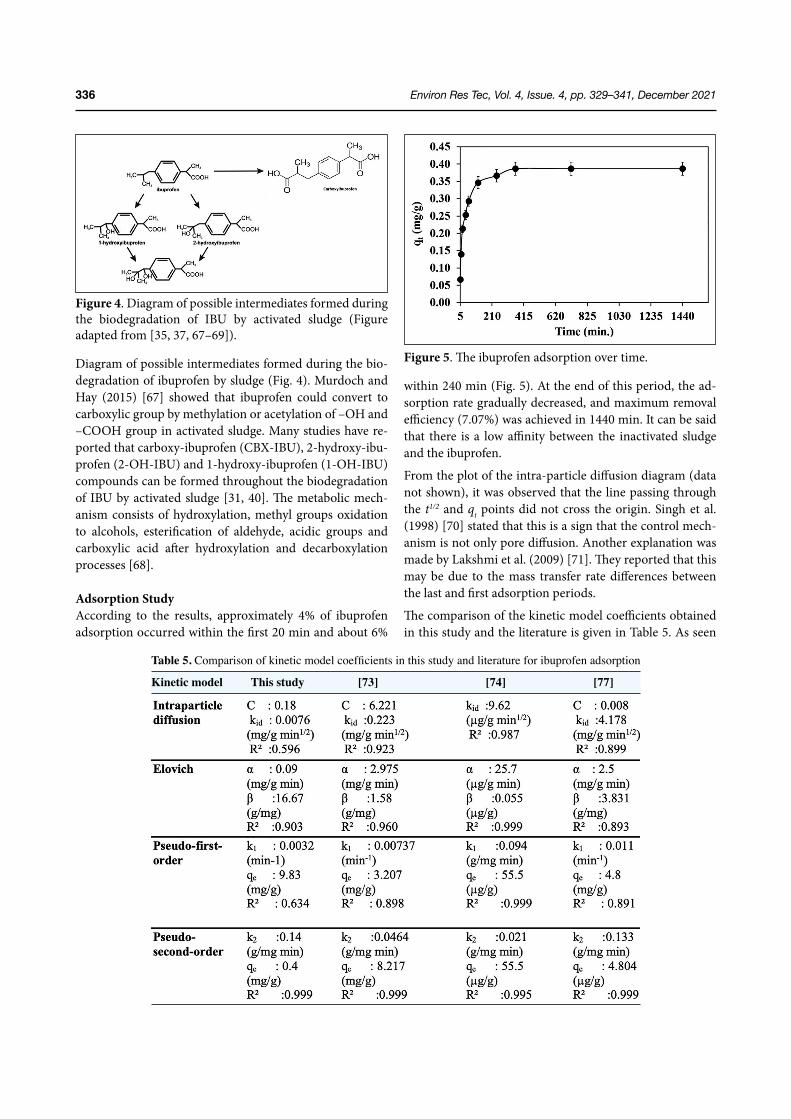
Environ Res Tec, Vol. 4, Issue. 4, pp. 329–341, December 2021336
Diagram of possible intermediates formed during the bio-degradation of ibuprofen by sludge (Fig. 4). Murdoch and Hay (2015) [67] showed that ibuprofen could convert to carboxylic group by methylation or acetylation of –OH and –COOH group in activated sludge. Many studies have re-ported that carboxy-ibuprofen (CBX-IBU), 2-hydroxy-ibu-profen (2-OH-IBU) and 1-hydroxy-ibuprofen (1-OH-IBU) compounds can be formed throughout the biodegradation of IBU by activated sludge [31, 40]. The metabolic mech-anism consists of hydroxylation, methyl groups oxidation to alcohols, esterification of aldehyde, acidic groups and carboxylic acid after hydroxylation and decarboxylation processes [68].
Adsorption StudyAccording to the results, approximately 4% of ibuprofen adsorption occurred within the first 20 min and about 6%
within 240 min (Fig. 5). At the end of this period, the ad-sorption rate gradually decreased, and maximum removal efficiency (7.07%) was achieved in 1440 min. It can be said that there is a low affinity between the inactivated sludge and the ibuprofen.
From the plot of the intra-particle diffusion diagram (data not shown), it was observed that the line passing through the t1/2 and qt points did not cross the origin. Singh et al. (1998) [70] stated that this is a sign that the control mech-anism is not only pore diffusion. Another explanation was made by Lakshmi et al. (2009) [71]. They reported that this may be due to the mass transfer rate differences between the last and first adsorption periods.
The comparison of the kinetic model coefficients obtained in this study and the literature is given in Table 5. As seen
Figure 4. Diagram of possible intermediates formed during the biodegradation of IBU by activated sludge (Figure adapted from [35, 37, 67–69]).
Figure 5. The ibuprofen adsorption over time.
Table 5. Comparison of kinetic model coefficients in this study and literature for ibuprofen adsorption
Kinetic model This study [73] [74] [77]
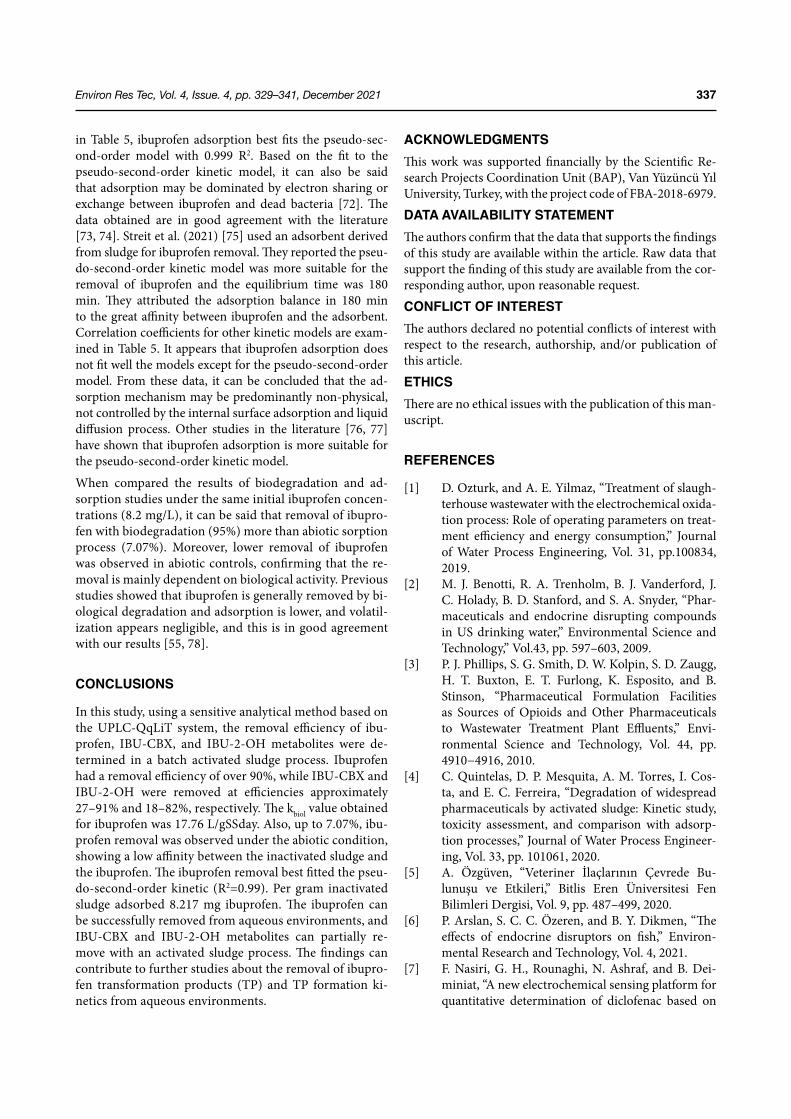
Environ Res Tec, Vol. 4, Issue. 4, pp. 329–341, December 2021 337
in Table 5, ibuprofen adsorption best fits the pseudo-sec-ond-order model with 0.999 R2. Based on the fit to the pseudo-second-order kinetic model, it can also be said that adsorption may be dominated by electron sharing or exchange between ibuprofen and dead bacteria [72]. The data obtained are in good agreement with the literature [73, 74]. Streit et al. (2021) [75] used an adsorbent derived from sludge for ibuprofen removal. They reported the pseu-do-second-order kinetic model was more suitable for the removal of ibuprofen and the equilibrium time was 180 min. They attributed the adsorption balance in 180 min to the great affinity between ibuprofen and the adsorbent. Correlation coefficients for other kinetic models are exam-ined in Table 5. It appears that ibuprofen adsorption does not fit well the models except for the pseudo-second-order model. From these data, it can be concluded that the ad-sorption mechanism may be predominantly non-physical, not controlled by the internal surface adsorption and liquid diffusion process. Other studies in the literature [76, 77] have shown that ibuprofen adsorption is more suitable for the pseudo-second-order kinetic model.
When compared the results of biodegradation and ad-sorption studies under the same initial ibuprofen concen-trations (8.2 mg/L), it can be said that removal of ibupro-fen with biodegradation (95%) more than abiotic sorption process (7.07%). Moreover, lower removal of ibuprofen was observed in abiotic controls, confirming that the re-moval is mainly dependent on biological activity. Previous studies showed that ibuprofen is generally removed by bi-ological degradation and adsorption is lower, and volatil-ization appears negligible, and this is in good agreement with our results [55, 78].
CONCLUSIONS
In this study, using a sensitive analytical method based on the UPLC-QqLiT system, the removal efficiency of ibu-profen, IBU-CBX, and IBU-2-OH metabolites were de-termined in a batch activated sludge process. Ibuprofen had a removal efficiency of over 90%, while IBU-CBX and IBU-2-OH were removed at efficiencies approximately 27–91% and 18–82%, respectively. The kbiol value obtained for ibuprofen was 17.76 L/gSSday. Also, up to 7.07%, ibu-profen removal was observed under the abiotic condition, showing a low affinity between the inactivated sludge and the ibuprofen. The ibuprofen removal best fitted the pseu-do-second-order kinetic (R2=0.99). Per gram inactivated sludge adsorbed 8.217 mg ibuprofen. The ibuprofen can be successfully removed from aqueous environments, and IBU-CBX and IBU-2-OH metabolites can partially re-move with an activated sludge process. The findings can contribute to further studies about the removal of ibupro-fen transformation products (TP) and TP formation ki-netics from aqueous environments.
ACKNOWLEDGMENTSThis work was supported financially by the Scientific Re-search Projects Coordination Unit (BAP), Van Yüzüncü Yıl University, Turkey, with the project code of FBA-2018-6979.
DATA AVAILABILITY STATEMENTThe authors confirm that the data that supports the findings of this study are available within the article. Raw data that support the finding of this study are available from the cor-responding author, upon reasonable request.
CONFLICT OF INTERESTThe authors declared no potential conflicts of interest with respect to the research, authorship, and/or publication of this article.
ETHICSThere are no ethical issues with the publication of this man-uscript.
REFERENCES
[1] D. Ozturk, and A. E. Yilmaz, “Treatment of slaugh-terhouse wastewater with the electrochemical oxida-tion process: Role of operating parameters on treat-ment efficiency and energy consumption,” Journal of Water Process Engineering, Vol. 31, pp.100834, 2019.
[2] M. J. Benotti, R. A. Trenholm, B. J. Vanderford, J. C. Holady, B. D. Stanford, and S. A. Snyder, “Phar-maceuticals and endocrine disrupting compounds in US drinking water,” Environmental Science and Technology,” Vol.43, pp. 597–603, 2009.
[3] P. J. Phillips, S. G. Smith, D. W. Kolpin, S. D. Zaugg, H. T. Buxton, E. T. Furlong, K. Esposito, and B. Stinson, “Pharmaceutical Formulation Facilities as Sources of Opioids and Other Pharmaceuticals to Wastewater Treatment Plant Effluents,” Envi-ronmental Science and Technology, Vol. 44, pp. 4910−4916, 2010.
[4] C. Quintelas, D. P. Mesquita, A. M. Torres, I. Cos-ta, and E. C. Ferreira, “Degradation of widespread pharmaceuticals by activated sludge: Kinetic study, toxicity assessment, and comparison with adsorp-tion processes,” Journal of Water Process Engineer-ing, Vol. 33, pp. 101061, 2020.
[5] A. Özgüven, “Veteriner İlaçlarının Çevrede Bu-lunuşu ve Etkileri,” Bitlis Eren Üniversitesi Fen Bilimleri Dergisi, Vol. 9, pp. 487–499, 2020.
[6] P. Arslan, S. C. C. Özeren, and B. Y. Dikmen, “The effects of endocrine disruptors on fish,” Environ-mental Research and Technology, Vol. 4, 2021.
[7] F. Nasiri, G. H., Rounaghi, N. Ashraf, and B. Dei-miniat, “A new electrochemical sensing platform for quantitative determination of diclofenac based on
Environ Res Tec, Vol. 4, Issue. 4, pp. 329–341, December 2021338
gold nanoparticles decorated multiwalled carbon nanotubes/graphene oxide nanocomposite film,” International Journal of Environmental Analytical Chemistry, Vol. 101, pp. 153–166, 2021.
[8] B. Balcı, O. Keskinkan, and A. Erkuş, “The use of ac-tivated sludge for removal of Paracetamol,” Çukuro-va Üniversitesi Mühendislik-Mimarlık Fakültesi Dergisi, Vol. 27, pp.1–12, 2012.
[9] A. Erkuş, M. Başıbüyük, and F. Ş. Erkuş, “The ex-amination of paracetamol and diclofenac removal in activated sludge systems under different operat-ing conditions,” International Journal of Ecosystems and Ecology Science, Vol. 5, pp. 315–320, 2015.
[10] B. Petrie, and R. Barden, and B. Kasprzyk/Hordern, “A review on emerging contaminants in wastewa-ters and the environment: Current knowledge, un-derstanding areas and recommendations for future monitoring,” Water Research, Vol. 72, pp. 3–27, 2015.
[11] R. Salgado, D. Brito, J.P. Noronha, B. Almeida, M.R. Bronze, A. Oehmen, G. Carvalho, and M.T. Barreto Crespo, “Metabolite identification of ibuprofen bio-degradation by Patulibacter medicamentivorans un-der aerobic conditions,” Environmental Technology, Vol. 41, pp. 450–465, 2020.
[12] K.D. Rainsford, “Ibuprofen: Pharmacology, effica-cy and safety,” Inflammopharmacology, Vol. 17, pp. 275–342, 2009.
[13] H. Guedidi, L. Reinert, J. M. Lévêque, Y. Soneda, N. Bellakhal, and L. Duclaux, “The effects of the surface oxidation of activated carbon, the solution pH and the temperature on adsorption of ibuprofen,” Car-bon, Vol. 54, pp. 432–443, 2013.
[14] M. Gros, S. Rodríguez-Mozaz, and D. Barceló, “Fast and comprehensive multi-residue analysis of a broad range of human and veterinary pharmaceuticals and some of their metabolites in surface and treated wa-ters by ultra-high-performance liquid chromatogra-phy coupled to quadrupole-linear ion trap tandem mass spectrometry,” Journal of Chromatography A, Vol. 1248, pp. 104–121, 2012.
[15] Y. Li, B. Wu, G. Zhu, Y. Liu, W. J. Ng, A. Appan, and S. K. Tan, “High-throughput pyrosequencing analy-sis of bacteria relevant to cometabolic and metabolic degradation of ibuprofen in horizontal subsurface flow constructed wetlands,” Science of the Total En-vironment, Vol. 562, pp. 604–613, 2016.
[16] Y. Jia, L.Yin, S. K. Khanal, H. Zhang, A. S. Oberoi, and H. Lu, “Biotransformation of ibuprofen in bio-logical sludge systems: Investigation of performance and mechanisms,” Water Research, Vol.170, Article 115303,2020.
[17] Y., Tang, B., Zhao, and C. Liu, “Removal mechanisms of β-blockers by anaerobic digestion in a UASB re-
actor with carbon feeding,” Bioresource Technology Reports, Vol. 11, Article 100531, 2020.
[18] Y. Li, J. Lian, B. Wu, H. Zou, and S. K. Tan, “Phytore-mediation of pharmaceutical-contaminated waste-water: Insights into rhizobacterial dynamics related to pollutant degradation mechanisms during plant life cycle,” Chemosphere, Vol. 253, Article 126681, 2020.
[19] J. Zur, D. Wojcieszynska, K. Hupert-Kocurek, A. Marchlewicz, and U. Guzik, “Paracetamol–toxicity and microbial utilization Pseudomonas moorei KB4 as a case study for exploring degradation pathway,” Chemosphere, Vol. 206, pp. 192–202, 2018.
[20] A. Husain Khan, H. Abdul Aziz, N. A. Khan, S. Ahmed, M. S. Mehtab, S. Vambol, V. Vambol, F. Changani and S. Islam, “Pharmaceuticals of emerg-ing concern in hospital wastewater: removal of Ibu-profen and Ofloxacin drugs using MBBR method,” International Journal of Environmental Analytical Chemistry, Vol. 1, pp. 15, 2020.
[21] H. Khazri, I. Ghorbel-Abid, R. Kalfat, and M. Trabel-si-Ayadi, “Removal of ibuprofen, naproxen and car-bamazepine in aqueous solution onto natural clay: equilibrium, kinetics, and thermodynamic study,” Applied Water Science, Vol. 7, pp. 3031–3040, 2017.
[22] N.K. Haro, I.V.J. Davila, K.G.P. Nunes, M.A.E. de Franco, N.R. Marcilio, and L.A. Féris, “Kinetic, equilibrium and thermodynamic studies of the ad-sorption of paracetamol in activated carbon in batch model and fixed-bed column,” Applied Water Sci-ence, Vol. 11, pp. 1–9,2021
[23] H. Khorsandi, M. Teymori, A. A. Aghapour, S. J. Ja-fari, S. Taghipour, and R. Bargeshadi, “Photodegra-dation of ceftriaxone in aqueous solution by using UVC and UVC/H2O2 oxidation processes,” Applied Water Science, Vol. 9, pp. 1–8, 2019.
[24] H. Olvera-Vargas, N. Gore-Datar, O. Garcia-Rodri-guez, S. Mutnuri, and O. Lefebvre, “Electro-Fenton treatment of real pharmaceutical wastewater paired with a BDD anode: Reaction mechanisms and re-spective contribution of homogeneous and hetero-geneous OH,” Chemical Engineering Journal, Vol. 404, Article 126524, 2021.
[25] M.S. Hussien, “Facile synthesis of nanostructured mn-doped ag3po4 for visible photodegradation of emerging pharmaceutical contaminants: strepto-mycin photodegradation,” Journal of Inorganic and Organometallic Polymers and Materials, Vol. 31, pp. 945–959, 2021.
[26] Z. Li, and P. Yang, “Review on physicochemical, chemical, and biological processes for pharmaceuti-cal wastewater,” In IOP Conference Series: Earth and Environmental Science, Vol. 113, Article 012185, 2018.
Environ Res Tec, Vol. 4, Issue. 4, pp. 329–341, December 2021 339
[27] S. Wu, L. Zhang, and J. Chen, “Paracetamol in the environment and its degradation by microorgan-isms,” Applied Microbiology and Biotechnology, Vol. 96, pp. 875–884, 2012.
[28] H. Bodin, A. Daneshvar, M. Gros, and M. Hultberg, “Effects of biopellets composed of microalgae and fungi on pharmaceuticals present at environmental-ly relevant levels in water,” Ecological Engineering, Vol. 91, pp. 169–172, 2016.
[29] I. D. Godos, R. Muñoz, and B. Guieysse, “Tetracy-cline removal during wastewater treatment in high-rate algal ponds,” Journal of Hazardous Materials, Vol. 229, pp. 446–449, 2012.
[30] I. Santos, M.J. Grossman, A. Sartoratto, A.N. Ponezi, and L.R. Durrant, “Degradation of the recalcitrant pharmaceuticals carbamazepine and 17α-ethinyl-estradiol by ligninolytic fungi,” Chemical Engineer-ing Transactions, Vol. 27, pp. 169–174, 2012.
[31] N. Collado, G. Buttiglieri, L. Ferrando-Climent, S. Rodriguez-Mozaz, D. Barceló, J. Comas, and I. Ro-driguez-Roda, “Removal of ibuprofen and its trans-formation products: experimental and simulation studies,” Science of the Total Environment, Vol. 433, pp. 296–301, 2012.
[32] N. Dorival-Garcia, A. Zafra-Gomez, A. Navalon, J. Gonzalez-Lopez, E. Hontoria, and J. L. Vilchez, “Removal and degradation characteristics of quino-lone antibiotics in laboratory-scale activated sludge reactors under aerobic, nitrifying and anoxic condi-tions,” Journal of Environmental Management, Vol. 120, pp. 75–83, 2013.
[33] A. Dawas-Massalha, S.Gur-Reznik, S. Lerman, I. Sabbah, C. G. Dosoretz, “Co-metabolic oxidation of pharmaceutical compounds by a nitrifying bacterial enrichment,” Bioresource Technology, Vol. 167, pp. 336–342, 2014.
[34] A. Jelić, M. Petrović, and D. Barceló, “Multi-residue method for trace level determination of pharmaceu-ticals in solid samples using pressurized liquid ex-traction followed by liquid chromatography/quad-rupole-linear ion trap mass spectrometry,” Talanta, Vol. 80, pp. 363–371, 2009.
[35] C. Zwiener, S. Seeger, T. Glauner, and F. Frimmel, “Metabolites from the biodegradation of pharma-ceutical residues of ibuprofen in biofilm reactors and batch experiments,” Analytical and Bioanalyti-cal Chemistry, Vol. 372, pp. 569–575, 2002.
[36] T. M. Smook, H. Zho, and R. G. Zytner, “Removal of ibuprofen from wastewater: comparing biodegrada-tion in conventional, membrane bioreactor, and bi-ological nutrient removal treatment systems,” Water Science and Technology, Vol. 57, pp. 1–8, 2008.
[37] J. B. Quintana, S. Weiss, and T. Reemtsma, “Path-ways and metabolites of microbial degradation of
selected acidic pharmaceutical and their occurrence in municipal wastewater treated by a membrane bioreactor,” Water Research, Vol. 39, pp. 2654–2664, 2005.
[38] T. Ding, M. Yang, J. Zhang, B. Yang, K. Lin, J. Li, and J. Gan, “Toxicity, degradation and metabolic fate of ibuprofen on freshwater diatom Navicula sp.,” Jour-nal of Hazardous Materials, Vol. 330, pp. 127–134, 2017.
[39] S. Chopra, and D. Kumar, “Ibuprofen as an emerg-ing organic contaminant in environment, distribu-tion and remediation,” Heliyon, Vol. 6, pp. e04087, 2020.
[40] L. Ferrando-Climent, N. Collado, G. Buttiglieri, M. Gros, I. Rodriguez-Roda, S. Rodriguez-Mozaz, and D. Barceló, “Comprehensive study of ibuprofen and its metabolites in activated sludge batch experiments and aquatic environment,” Science of the Total Envi-ronment, Vol. 438, pp. 404–413,2012.
[41] A. D. Eaton, L. S. Clesceri, E. W. Rice, A. E. Green-berg, and M. A. H. Franson, “Standard methods for the examination of water and wastewater,” Ameri-can Public Health Association, Washington, 1998.
[42] BS-EN-ISO 11733: Water quality-Determination of the elimination and biodegradability of organ-ic compounds in an aqueous medium-Activated sludge simulation test, 2004.
[43] Y. Zhang, N. Love, and M. Edwards, “Nitrification in drinking water systems,” Critical Reviews in Environmental Science and Technology, Vol. 39, pp.153–208, 2009.
[44] A. Mowla, M. Mehrvar and R. Dhib, “Combination of sonophotolysis and aerobic a c t i v a t e d sludge processes for treatment of synthetic pharma-ceutical wastewater,” Chemical Engineering Jour-nal, Vol. 255, pp. 411–423, 2014.
[45] A. Joss, S. Zabczynski, A. Göebel, B. Hoffmann, D. Löffler, C. S. McArdell, T. A. Ternes, A. Thomsen, and H. Siegrist, “Biological degradation of pharma-ceuticals in municipal wastewater treatment: pro-posing a classification scheme”. Water Research, Vol. 40, pp. 1686–1696, 2006.
[46] B. Li, and T. Zhang, “Biodegradation and adsorp-tion of antibiotics in the activated sludge process,” Environmental Science and Technology, Vol. 44, pp. 3468–3473, 2010.
[47] T. Alvarino, S. Suarez, J.M. Lema, and F. Omil, “Un-derstanding the removal mechanisms of PPCPs and the influence of main technological parameters in anaerobic UASB and aerobic CAS reactors,” Journal of Hazardous Materials, Vol. 278, pp. 506–513, 2014.
[48] S. Y. Elovich, and O. G. Larionov, “Theory of ad-sorption from nonelectrolyte solutions on solid adsorbents,” Bulletin of the Academy of Sciences of
Environ Res Tec, Vol. 4, Issue. 4, pp. 329–341, December 2021340
the USSR, Division of Chemical Science, Vol. 11, pp. 191–197,1962.
[49] W. J. Weber Jr, and J. C. Morris, “Kinetics of adsorp-tion on carbon from solution,” Journal of The Sani-tary Engineering Division, Vol. 89, pp. 31–59, 1963
[50] T. Bayram, S. Bucak, and D. Ozturk, “BR13 dye re-moval using sodium dodecyl sulfate modified mont-morillonite: equilibrium, thermodynamic, kinetic and reusability studies,” Chemical Engineering and Processing-Process Intensification, Vol.158, Article 108186, 2020.
[51] H.H. Cho, H. Huang, and K. Schwab, “Effects of Solution Chemistry on the Adsorption of Ibuprofen and Triclosan onto Carbon Nanotubes”, Langmuir, Vol. 27, pp. 12960–12967, 2011.
[52] S. Suarez, F. Omil, and J. M. Lema, “Fate and remov-al of pharmaceuticals and personal care products (PPCPs) in a conventional activated sludge treat-ment process,” Water Pollution, Vol. 135, pp. 255–265, 2010.
[53] M. Hijosa-Valsero, V. Matamoros, R. Sidrach-Car-dona, J. Martín-Villacorta, E. Bécares, and J. M. Bay-ona, “Comprehensive assessment of the design con-figuration of constructed wetlands for the removal of pharmaceuticals and personal care products from urban wastewaters,” Water Research, Vol. 44, pp. 3669–3678, 2010.
[54] D. Serrano, S. Suárez, J.M. Lema, F. Omil, “Remov-al of persistent pharmaceutical micropollutants from sewage by addition of PAC in a sequential membrane bioreactor,” Water Research, Vol. 45, pp. 5323–5333, 2011.
[55] F. Çeçen, and G. Gül, “Biodegradation of five phar-maceuticals: estimation by predictive models and comparison with activated sludge data,” Internation-al Journal of Environmental Science and Technolo-gy, Vol. 18, pp. 327, 2021.
[56] A. Gome, and K. Upadhyay, “Chemical kinetics of ozonation and other processes used for the treat-ment of wastewater containing pharmaceuticals: a review,” International Journal of Current Research and Review, Vol. 4, pp. 157, 2012.
[57] A. Kruglova, P. Ahlgren, N. Korhonen, P. Rantanen, A. Mikola, and R. Vahala, “Biodegradation of ibu-profen, diclofenac and carbamazepine in nitrifying activated sludge under 12 C temperature condi-tions,” Science of The Total Environment, Vol. 499, pp. 394–401, 2014.
[58] C. Noutsopoulos, V. Charalambous, and E. Kouma-ki, “Evaluating the fate of emerging contaminants in wastewater treatment plants through plant-wide mathematical modelling,” Environmental Processes, Vol. 7, pp. 1065–1094, 2020.
[59] J. Boonnorat, A. Kanyatrakul, A. Prakhongsak, R.
Honda, P. Panichnumsin, and N. Boonapatcharoen, “Effect of hydraulic retention time on micropollut-ant biodegradation in activated sludge system aug-mented with acclimatized sludge treating low-mi-cropollutants wastewater,” Chemosphere, Vol. 230, pp. 606–615, 2019.
[60] S. C. Wang, Removal of Emerging Contaminants in Biological Treatment. University of California, Los Angeles, 2009.
[61] N. Kreuzinger, M. Clara, B. Strenn, and H. Kroiss, “Relevance of the sludge retention time (SRT) as de-sign criteria for wastewater treatment plants for the removal of endocrine disruptors and pharmaceuti-cals from wastewater,” Water Science and Technolo-gy, Vol. 50, pp.149–156, 2004.
[62] J. Oppenheimer, R. Stephenson, A. Burbano, L. and L. Liu, “Characterizing the passage of personal care products through wastewater treatment processes,” Water Environment Research, Vol. 79, pp. 2564–2577, 2007.
[63] M. Clara, N. Kreuzinger, B. Strenn, O. Gans, and H. Kroiss, “The solids retention time – a suitable design parameter to evaluate the capacity of wastewater treatment plants to remove micropollutants,” Water Research, Vol. 39, pp. 97–106, 2005.
[64] A.S. Stasinakis, C.I. Kordoutis, V.C. Tsiouma, G. Gatidou, and N. S. Thomaidis, “Removal of select-ed endocrine disrupters in activated sludge systems: effect of sludge retention time on their sorption and biodegradation,” Bioresource Technology, Vol. 101, pp. 2090–2095, 2010.
[65] L.S. Gaulke, S.E. Strand, T.F. Kalhorn, and H.D. Stensel, “Estrogen biodegradation kinetics and es-trogenic activity reduction for two biological waste-water treatment methods,” Environmental Science and Technology, 43, 7111–7116, 2009.
[66] J. Radjenovic, M. Petrovic, and D. Barcelo, “Fate and distribution of pharmaceuticals in wastewater and sewage sludge of the conventional activated sludge (CAS) and advanced membrane bioreactor (MBR) treatment,” Water Research, Vol. 43, pp. 831–841, 2009.
[67] R.W. Murdoch, and A.G. Hay, “The biotransforma-tion of ibuprofen to trihydroxyibuprofen in activat-ed sludge and by Variovorax Ibu-1,” Biodegradation, Vol. 26, pp. 105–113, 2015.
[68] R. Salgado, D. Brito, J. P. Noronha, B. Almeida, M. R. Bronze, A. Oehmen, G. Carvalho, M. T. Barreto Crespo, “Metabolite identification of ibuprofen bio-degradation by Patulibacter medicamentiv-orans under aerobic conditions,” Environmental Technology, Vol. 41, pp. 450–465, 2020.
[69] C.Y. Huang, L.H. Fu, M.H. Sung, C.F. Huang, J.P. Wu, and H.W Kuo, “Ibuprofen biodegrada-
Environ Res Tec, Vol. 4, Issue. 4, pp. 329–341, December 2021 341
tion by hospital, municipal, and distillery activated sludges,” Environmental Technology, Vol. 41, pp. 171–180, 2020.
[70] D.B. Singh, D.C. Rupainwar, G. Prasad, and K.C. Jayaprakas, “Studies on the Cd (II) removal from water by adsorption,” Journal of Hazardous Materi-als, Vol. 60, pp. 29–40, 1998.
[71] U. R. Lakshmi, V. C. Srivastava, I. D. Mall, and D. H. Lataye, “Rice husk ash as an effective adsorbent: evaluation of adsorptive characteristics for Indigo Carmine dye,” Journal of Environmental Manage-ment, Vol. 90, pp. 710–720, 2009.
[72] H. Zhang, Y. Tang, D. Cai, X. Liu, X. Wang, Q. Huang, and Z. Yu, “Hexavalent chromium remov-al from aqueous solution by algal bloom residue derived activated carbon: equilibrium and kinetic studies,” Journal of Hazardous Materials, Vol.181, pp. 801–808, 2010.
[73] P. Banerjee, P. Das, A. Zaman, and P. Das, “Applica-tion of graphene oxide nanoplatelets for adsorption of ibuprofen from aqueous solutions: evaluation of process kinetics and thermodynamics,” Process Safety and Environmental Protection, Vol. 101, pp. 45–53, 2016.
[74] I. Ali, Z. A. AL-Othman, and A. Alwarthan, "Syn-
thesis of composite iron nano adsorbent and remov-al of ibuprofen drug residue from water,” Journal of Molecular Liquids, Vol. 219, pp. 858–864, 2016.
[75] A. F. Streit, G. C. Collazzo, S. P. Druzian, R. S. Ver-di, E. L. Foletto, L. F. Oliveira, and G. L. Dotto, “Ad-sorption of ibuprofen, ketoprofen, and paracetamol onto activated carbon prepared from effluent treat-ment plant sludge of the beverage industry,” Chemo-sphere, Vol. 262, pp.128322, 2021.
[76] J. Martín, M. del Mar Orta, S. Medina-Carrasco, J. L. Santos, I. Aparicio, and E. Alonso, “Evaluation of a modified mica and montmorillonite for the ad-sorption of ibuprofen from aqueous media,” Applied Clay Science, Vol. 171, pp. 29–37, 2019.
[77] O. S. Bello, O. C. Alao, T. C. Alagbada, O. S. Agboo-la, O. T. Omotoba, and O. R. Abikoye, “A renewable, sustainable and low-cost adsorbent for ibuprofen re-moval,” Water Science and Technology, Vol. 83, pp. 111–122. 2021.
[78] R. Salgado, J. P. Noronha, A. Oehmen, G. Carvalho, and M. A. M. Reis, “Analysis of 65 pharmaceuticals and personal care products in 5 wastewater treat-ment plants in Portugal using a simplified analytical methodology,” Water Science and Technology, Vol. 62, pp. 2862–2871, 2010.
Biosorption of Ni2+ and Cr3+ in synthetic sewage: Adsorption capacities of water hyacinth (Eichhornia crassipes)
Environ Res Tec, Vol. 4, Issue. 4, pp. 342–351, December 2021
Environmental Research and Technologyhttps://ert.yildiz.edu.tr - https://dergipark.org.tr/tr/pub/ert
DOI: https://doi.org/10.35208/ert.980490
Research Article
Francis James OGBOZIGE*1 , Helen Uzoamaka NWOBU2
1Department of Civil Engineering, Federal University Otuoke, Nigeria2Department of Chemical Engineering, University of Lagos, Nigeria
*Corresponding author.*E-mail address: [email protected]
Published by Yıldız Technical University Press, İstanbul, TurkeyCopyright 2021, Yıldız Technical University. This is an open access article under the CC BY-NC license (http://creativecommons.org/licenses/by-nc/4.0/).
ARTICLE INFO
Article historyReceived: 09 August 2021Revised: 24 October 2021Accepted: 01 November 2021
Key words:Freundlich; Halsey; Harkin-Jura; Langmuir; Temkin
ABSTRACT
Water hyacinth (Eichhornia crassipes) is an aquatic weed that is causing numerous adverse effects on freshwater bodies. Developing countries are still battling on how to control the growth of this weed without damaging other aquatic lives important to man. Literatures have revealed that most developing countries are still discharging untreated sewage containing heavy metals into waterbod-ies due to economic and technical constraints in handling conventional methods of treating heavy metals. Hence, the research investigated the possibility of using water hyacinth to adsorb heavy metals (Ni2+ and Cr3+) from sewage before discharging into waterbodies in order to solve two major problems faced in the aquatic environment, at minimal cost. This was achieved by using the said weed (water hyacinth) to treat Ni2+ and Cr3+ solutions prepared in the lab. Results showed that the adsorption process for both ions occurred on heterogeneous surfaces while the mechanism of ad-sorption followed Pseudo 2nd–order kinetics. The Freundlich, Langmuir and Temkin adsorption ca-pacities for Ni2+ are 19.6925l/g, 0.7470l/mg and 1.1093l/mg respectively while for Cr3+ are 16.814l/g, 0.7011l/mg and 0.9623l/mg respectively. However, the heat of sorption for Ni2+ is 96.906KJ/mol while that of Cr3+ is 98.749KJ/mol. Furthermore, FT-IR analysis identified seven functional groups involved in the binding sites with more of hydroxyl group (O–H) from alcohol and carboxylic acid. It was concluded that water hyacinth could be used as a potential bio-adsorbent of metal ions.
Cite this article as: Ogbozige FJ, Nwobu HU. Biosorption of Ni2+ and Cr3+ in synthetic sewage: Adsorption capacities of water hyacinth (Eichhornia crassipes). Environ Res Tec 2021;4:4:342–351.
INTRODUCTION
Several researchers including Obasi and Akudinobi [1–3] have reported alarming concentrations of heavy metals in institutional and industrial effluents especially in devel-oping countries even after been treated. This is because the sewage are mostly treated in either waste stabilization pond (WSP), tricking filter (TF) or activated sludge pro-
cess (ASP) without further treatment. Hence, the wastewa-ters are merely treated in terms of reducing the biochem-ical oxygen demand (BOD) or chemical oxygen demand (COD) and bacteriological load to permissible limits since the technology associated with WSP, TF and ASP cannot treat or reduce heavy metals. Thus, the discharge of such effluents into water bodies is still dangerous even if the con-centrations of BOD, COD and bacteriological load are safe.
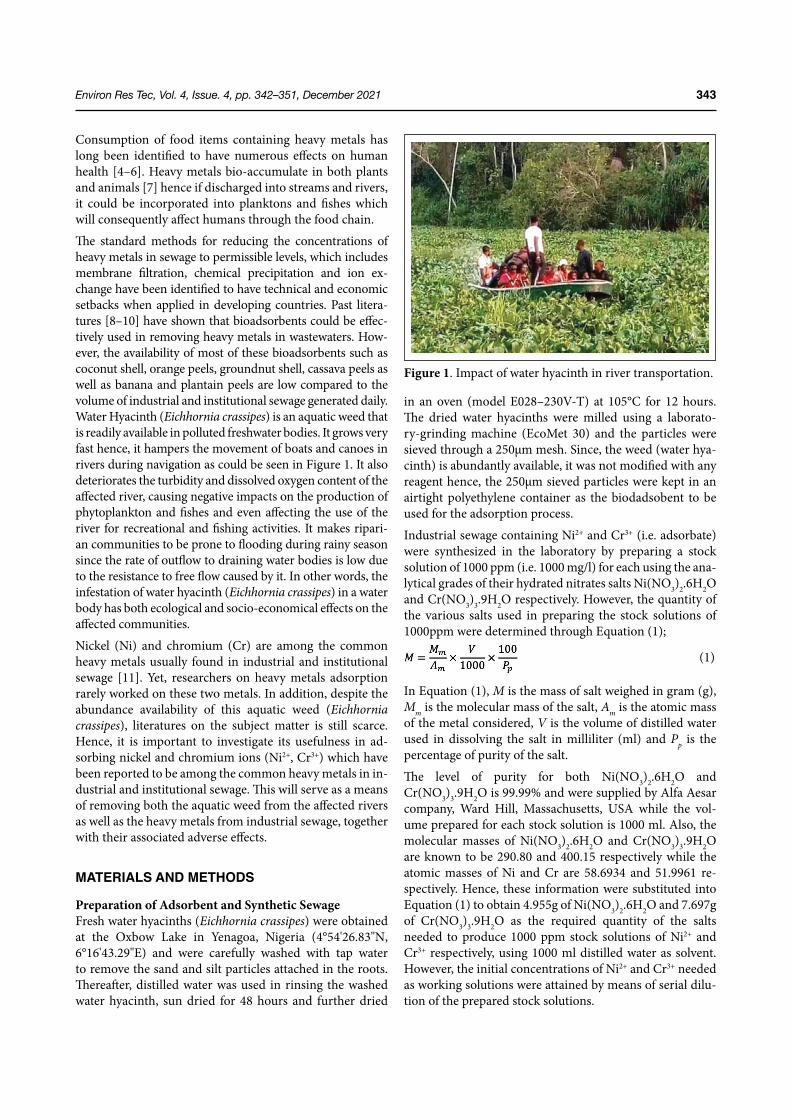
Environ Res Tec, Vol. 4, Issue. 4, pp. 342–351, December 2021 343
Consumption of food items containing heavy metals has long been identified to have numerous effects on human health [4–6]. Heavy metals bio-accumulate in both plants and animals [7] hence if discharged into streams and rivers, it could be incorporated into planktons and fishes which will consequently affect humans through the food chain.The standard methods for reducing the concentrations of heavy metals in sewage to permissible levels, which includes membrane filtration, chemical precipitation and ion ex-change have been identified to have technical and economic setbacks when applied in developing countries. Past litera-tures [8–10] have shown that bioadsorbents could be effec-tively used in removing heavy metals in wastewaters. How-ever, the availability of most of these bioadsorbents such as coconut shell, orange peels, groundnut shell, cassava peels as well as banana and plantain peels are low compared to the volume of industrial and institutional sewage generated daily. Water Hyacinth (Eichhornia crassipes) is an aquatic weed that is readily available in polluted freshwater bodies. It grows very fast hence, it hampers the movement of boats and canoes in rivers during navigation as could be seen in Figure 1. It also deteriorates the turbidity and dissolved oxygen content of the affected river, causing negative impacts on the production of phytoplankton and fishes and even affecting the use of the river for recreational and fishing activities. It makes ripari-an communities to be prone to flooding during rainy season since the rate of outflow to draining water bodies is low due to the resistance to free flow caused by it. In other words, the infestation of water hyacinth (Eichhornia crassipes) in a water body has both ecological and socio-economical effects on the affected communities.Nickel (Ni) and chromium (Cr) are among the common heavy metals usually found in industrial and institutional sewage [11]. Yet, researchers on heavy metals adsorption rarely worked on these two metals. In addition, despite the abundance availability of this aquatic weed (Eichhornia crassipes), literatures on the subject matter is still scarce. Hence, it is important to investigate its usefulness in ad-sorbing nickel and chromium ions (Ni2+, Cr3+) which have been reported to be among the common heavy metals in in-dustrial and institutional sewage. This will serve as a means of removing both the aquatic weed from the affected rivers as well as the heavy metals from industrial sewage, together with their associated adverse effects.
MATERIALS AND METHODS
Preparation of Adsorbent and Synthetic SewageFresh water hyacinths (Eichhornia crassipes) were obtained at the Oxbow Lake in Yenagoa, Nigeria (4°54'26.83"N, 6°16'43.29"E) and were carefully washed with tap water to remove the sand and silt particles attached in the roots. Thereafter, distilled water was used in rinsing the washed water hyacinth, sun dried for 48 hours and further dried
in an oven (model E028–230V-T) at 105°C for 12 hours. The dried water hyacinths were milled using a laborato-ry-grinding machine (EcoMet 30) and the particles were sieved through a 250µm mesh. Since, the weed (water hya-cinth) is abundantly available, it was not modified with any reagent hence, the 250µm sieved particles were kept in an airtight polyethylene container as the biodadsobent to be used for the adsorption process.
Industrial sewage containing Ni2+ and Cr3+ (i.e. adsorbate) were synthesized in the laboratory by preparing a stock solution of 1000 ppm (i.e. 1000 mg/l) for each using the ana-lytical grades of their hydrated nitrates salts Ni(NO3)2.6H2O and Cr(NO3)3.9H2O respectively. However, the quantity of the various salts used in preparing the stock solutions of 1000ppm were determined through Equation (1);
(1)
In Equation (1), M is the mass of salt weighed in gram (g), Mm is the molecular mass of the salt, Am is the atomic mass of the metal considered, V is the volume of distilled water used in dissolving the salt in milliliter (ml) and Pp is the percentage of purity of the salt.
The level of purity for both Ni(NO3)2.6H2O and Cr(NO3)3.9H2O is 99.99% and were supplied by Alfa Aesar company, Ward Hill, Massachusetts, USA while the vol-ume prepared for each stock solution is 1000 ml. Also, the molecular masses of Ni(NO3)2.6H2O and Cr(NO3)3.9H2O are known to be 290.80 and 400.15 respectively while the atomic masses of Ni and Cr are 58.6934 and 51.9961 re-spectively. Hence, these information were substituted into Equation (1) to obtain 4.955g of Ni(NO3)2.6H2O and 7.697g of Cr(NO3)3.9H2O as the required quantity of the salts needed to produce 1000 ppm stock solutions of Ni2+ and Cr3+ respectively, using 1000 ml distilled water as solvent. However, the initial concentrations of Ni2+ and Cr3+ needed as working solutions were attained by means of serial dilu-tion of the prepared stock solutions.
Figure 1. Impact of water hyacinth in river transportation.
Environ Res Tec, Vol. 4, Issue. 4, pp. 342–351, December 2021344
Metal Adsorption StudiesBatch adsorption was conducted to understand the impacts of certain parameters on the removal of the metal ions (Ni2+ and Cr3+) using water hyacinth as adsorbent. The parame-ters considered in this research are contact time, adsorbent dosage, initial adsorbate concentration and solution pH. While studying the impact of each of the aforementioned parameters, the parameter concerned was varied while oth-ers were kept constant.
Effect of Contact TimeThe effect of contact time on the adsorption process was studied by considering different contact times ranging from 10 to 100 minutes at room temperature (20–25°C). In each of the adsorbates considered (Ni2+ and Cr3+), 25 ml having initial concentration of 2.5 mg/l and pH 7 was measured into a 50 ml beaker and a weighing machine (model: FA 1604) was used to measure 0.5 g of the water hyacinth ad-sorbent into the beaker. The mixture in the beakers were properly mixed by stirring at 150 rpm for different contact times (10, 20, 30,…….., 100 minutes) using a magnetic stir-rer (model: SH-2). The stirred mixture was filtered through a Whatman filter paper (Grade 1) and the concentration of the metal ion (Ni2+ or Cr3+) in the filtrate was determined using atomic absorption spectrometer, AAS (model: 280FS AA). However, each of the contact time considered was studied trice and the mean value of the concentrations of metal ion obtained from the AAS was recorded.
Effect of Adsorbent DosageDifferent masses of the water hyacinth adsorbent ranging from 0.2 to 1.0 g were weighed and added separately into 50 ml beakers already containing 25 ml of 2.5 mg/l of each of the adsorbates (Ni2+ and Cr3+) at pH 7. The mixture in the beakers were stirred at 150 rpm for a constant contact time of 50 minutes under room temperature (20–25°C), and filtered through grade 1 of Whatman filter paper. The process was re-peated trice in each of the dose considered (0.2, 0.4, 0.6, 0.8, 1.0 g) and their mean concentrations of Ni2+ or Cr3+ in their respective filtrates obtained from the AAS were recorded.
Effect of Initial Adsorbate ConcentrationWorking solutions of Ni2+ and Cr3+ containing initial con-centrations ranging from 1.0 to 5.0 mg/l at pH 7 were prepared from their respective stock solutions. This was followed by measuring 25ml of each initial concentration prepared (1.0, 2.0, 3.0, 4.0, 5.0 mg/l) for Ni2+ and Cr3+ sep-arately into 50ml beaker, and 0.5g of the adsorbent were measured into the beakers. The mixture in the beakers were thoroughly mixed at 150 rpm for 50 minutes con-tact time under room temperature (20–25°C), filtered on Whatman filter paper (grade 1) and the filtrates were ana-lysed on AAS for the concentrations of Ni2+ and Cr3+. The procedure was replicated trice for each initial adsorbate
concentration and the average value of the metal ion got-ten from the AAS was recorded.
Effect of Solution pHThe impact of this parameter (solution pH) on the remov-al of the metal ions was known by measuring 25 ml of 2.5 mg/l of the adsorbates (Ni2+ and Cr3+) of different pH val-ues ranging from 5 to 9 into 50 ml beakers separately. The varied solution pH 5, 6, 7,8, 9 were achieved by adding some drops of either 0.1M of HCl or 0.1M of NaOH into the working solutions until the desired pH value is indicat-ed in a pH meter (model: pH-20W). Similarly, 0.5g of the water hyacinth adsorbent was added into each of the bea-kers containing the varied pH solutions and were properly stirred at 150 rpm for 50 minutes under room temperature (20–25°C). Thereafter, the stirred contents in the beakers were filtered through a Whatman filter paper of grade 1 and the filtrates were analysed in an AAS for the concentrations of Ni2+ or Cr3+ as the case may be. Just like the case in the other parameters earlier explained, the process was repeat-ed trice for each of the pH solution and the mean value of the concentrations of Ni2+ or Cr3+ was recorded.
Trend Analysis of Varied Adsorption ParametersIn order to understand the impacts of the varied parame-ters on the adsorption process, the percentage of metal ions adsorbed for each of the varied parameters studied were de-termined by employing Equation (2);
(2)
Where C0 is the initial concentration in mg/l while Cf is the final concentration of metal ion obtained from the AAS. In each of the parameters studied (i.e. contact time, adsorbent dosage, initial adsorbate concentration and solution pH), the percentages of metal ion adsorbed for both Ni2+ and Cr3+ were plotted against their corresponding variations on 2-line graphs (one line for each metal ion). Different colour legends were assigned to the metal ions in the 2-line graphs, which help in revealing the metal ion that was adsorbed more in each variations of a given parameter.
Adsorption Isotherm StudiesThe adsorption isotherm models considered in this research are Freundlich, Langmuir, Temkin, Harkin-Jura, and Halsey. Prior to their applications, the equilibrium concentrations (Ce) of the metal ions were determined by recording the con-centration that remained constant even when contact times were increased. Hence, the equilibrium adsorption for each metal ion was calculated using Equation (3);
(3)
Where qe is the amount of metal ion (adsorbate) adsorbed at equilibrium in mg/g, V is the volume of solution (adsor-
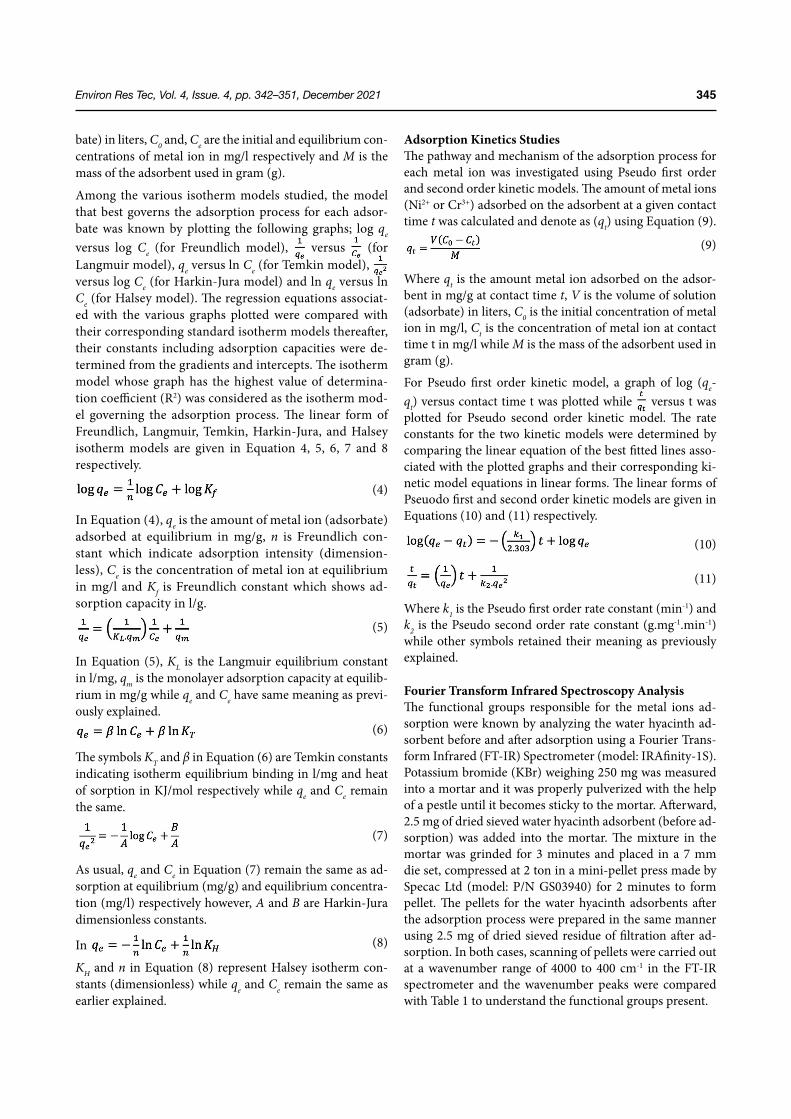
Environ Res Tec, Vol. 4, Issue. 4, pp. 342–351, December 2021 345
bate) in liters, C0 and, Ce are the initial and equilibrium con-centrations of metal ion in mg/l respectively and M is the mass of the adsorbent used in gram (g).
Among the various isotherm models studied, the model that best governs the adsorption process for each adsor-bate was known by plotting the following graphs; log qe versus log Ce (for Freundlich model), versus (for Langmuir model), qe versus ln Ce (for Temkin model), versus log Ce (for Harkin-Jura model) and ln qe versus ln Ce (for Halsey model). The regression equations associat-ed with the various graphs plotted were compared with their corresponding standard isotherm models thereafter, their constants including adsorption capacities were de-termined from the gradients and intercepts. The isotherm model whose graph has the highest value of determina-tion coefficient (R2) was considered as the isotherm mod-el governing the adsorption process. The linear form of Freundlich, Langmuir, Temkin, Harkin-Jura, and Halsey isotherm models are given in Equation 4, 5, 6, 7 and 8 respectively.
(4)
In Equation (4), qe is the amount of metal ion (adsorbate) adsorbed at equilibrium in mg/g, n is Freundlich con-stant which indicate adsorption intensity (dimension-less), Ce is the concentration of metal ion at equilibrium in mg/l and Kf is Freundlich constant which shows ad-sorption capacity in l/g.
(5)
In Equation (5), KL is the Langmuir equilibrium constant in l/mg, qm is the monolayer adsorption capacity at equilib-rium in mg/g while qe and Ce have same meaning as previ-ously explained.
(6)
The symbols KT and β in Equation (6) are Temkin constants indicating isotherm equilibrium binding in l/mg and heat of sorption in KJ/mol respectively while qe and Ce remain the same.
(7)
As usual, qe and Ce in Equation (7) remain the same as ad-sorption at equilibrium (mg/g) and equilibrium concentra-tion (mg/l) respectively however, A and B are Harkin-Jura dimensionless constants.
In (8)
KH and n in Equation (8) represent Halsey isotherm con-stants (dimensionless) while qe and Ce remain the same as earlier explained.
Adsorption Kinetics StudiesThe pathway and mechanism of the adsorption process for each metal ion was investigated using Pseudo first order and second order kinetic models. The amount of metal ions (Ni2+ or Cr3+) adsorbed on the adsorbent at a given contact time t was calculated and denote as (qt) using Equation (9).
(9)
Where qt is the amount metal ion adsorbed on the adsor-bent in mg/g at contact time t, V is the volume of solution (adsorbate) in liters, C0 is the initial concentration of metal ion in mg/l, Ct is the concentration of metal ion at contact time t in mg/l while M is the mass of the adsorbent used in gram (g).
For Pseudo first order kinetic model, a graph of log (qe-qt) versus contact time t was plotted while versus t was plotted for Pseudo second order kinetic model. The rate constants for the two kinetic models were determined by comparing the linear equation of the best fitted lines asso-ciated with the plotted graphs and their corresponding ki-netic model equations in linear forms. The linear forms of Pseuodo first and second order kinetic models are given in Equations (10) and (11) respectively.
(10)
(11)
Where k1 is the Pseudo first order rate constant (min-1) and k2 is the Pseudo second order rate constant (g.mg-1.min-1) while other symbols retained their meaning as previously explained.
Fourier Transform Infrared Spectroscopy AnalysisThe functional groups responsible for the metal ions ad-sorption were known by analyzing the water hyacinth ad-sorbent before and after adsorption using a Fourier Trans-form Infrared (FT-IR) Spectrometer (model: IRAfinity-1S). Potassium bromide (KBr) weighing 250 mg was measured into a mortar and it was properly pulverized with the help of a pestle until it becomes sticky to the mortar. Afterward, 2.5 mg of dried sieved water hyacinth adsorbent (before ad-sorption) was added into the mortar. The mixture in the mortar was grinded for 3 minutes and placed in a 7 mm die set, compressed at 2 ton in a mini-pellet press made by Specac Ltd (model: P/N GS03940) for 2 minutes to form pellet. The pellets for the water hyacinth adsorbents after the adsorption process were prepared in the same manner using 2.5 mg of dried sieved residue of filtration after ad-sorption. In both cases, scanning of pellets were carried out at a wavenumber range of 4000 to 400 cm-1 in the FT-IR spectrometer and the wavenumber peaks were compared with Table 1 to understand the functional groups present.
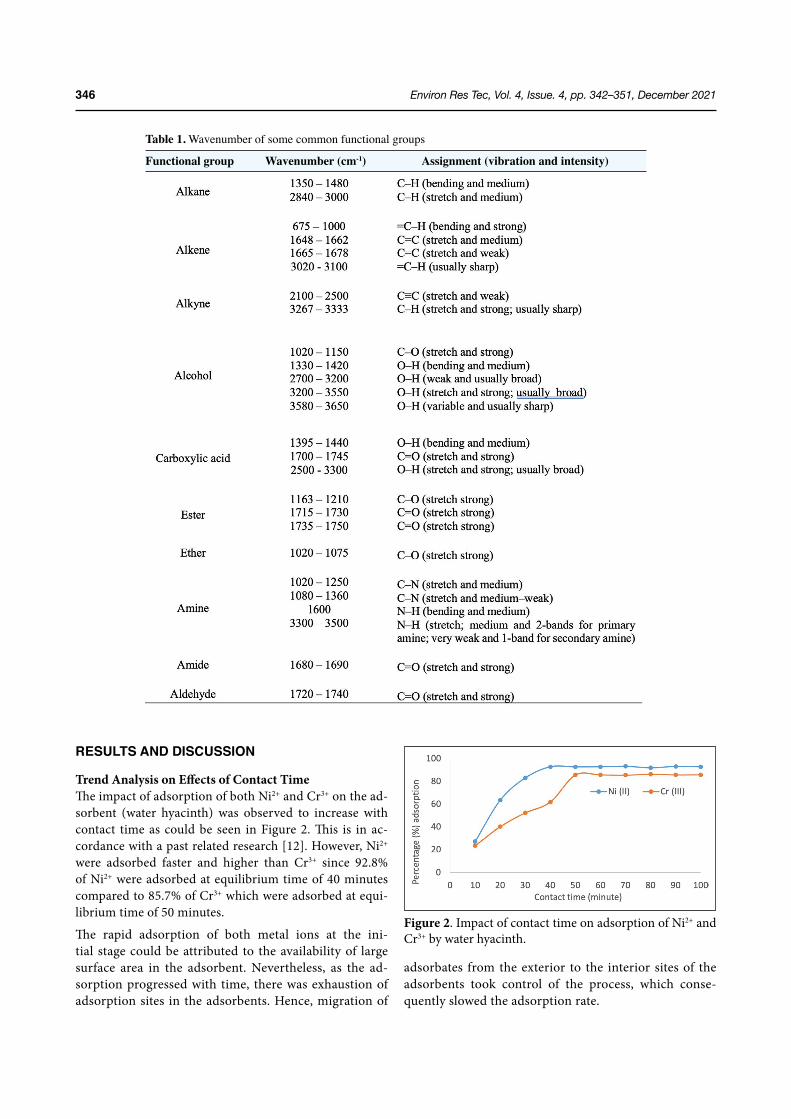
Environ Res Tec, Vol. 4, Issue. 4, pp. 342–351, December 2021346
RESULTS AND DISCUSSION
Trend Analysis on Effects of Contact TimeThe impact of adsorption of both Ni2+ and Cr3+ on the ad-sorbent (water hyacinth) was observed to increase with contact time as could be seen in Figure 2. This is in ac-cordance with a past related research [12]. However, Ni2+ were adsorbed faster and higher than Cr3+ since 92.8% of Ni2+ were adsorbed at equilibrium time of 40 minutes compared to 85.7% of Cr3+ which were adsorbed at equi-librium time of 50 minutes.
The rapid adsorption of both metal ions at the ini-tial stage could be attributed to the availability of large surface area in the adsorbent. Nevertheless, as the ad-sorption progressed with time, there was exhaustion of adsorption sites in the adsorbents. Hence, migration of
adsorbates from the exterior to the interior sites of the adsorbents took control of the process, which conse-quently slowed the adsorption rate.
Figure 2. Impact of contact time on adsorption of Ni2+ and Cr3+ by water hyacinth.
Table 1. Wavenumber of some common functional groups
Functional group Wavenumber (cm-1) Assignment (vibration and intensity)
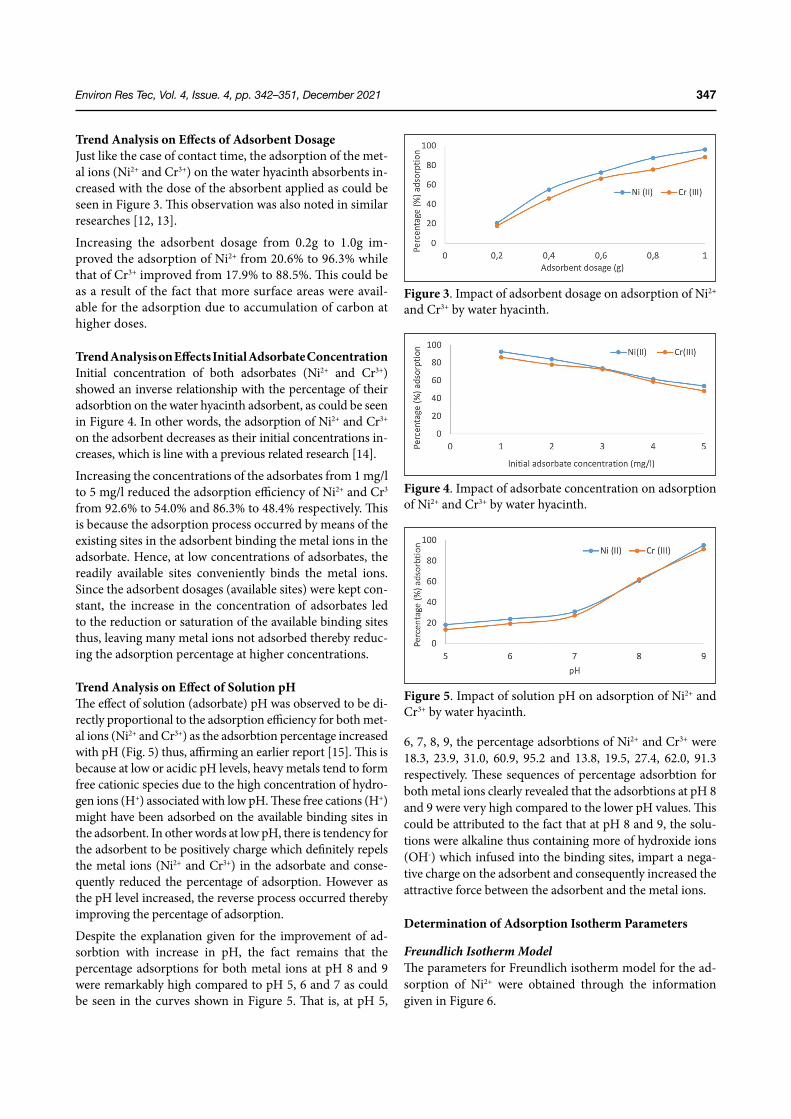
Environ Res Tec, Vol. 4, Issue. 4, pp. 342–351, December 2021 347
Trend Analysis on Effects of Adsorbent DosageJust like the case of contact time, the adsorption of the met-al ions (Ni2+ and Cr3+) on the water hyacinth absorbents in-creased with the dose of the absorbent applied as could be seen in Figure 3. This observation was also noted in similar researches [12, 13].
Increasing the adsorbent dosage from 0.2g to 1.0g im-proved the adsorption of Ni2+ from 20.6% to 96.3% while that of Cr3+ improved from 17.9% to 88.5%. This could be as a result of the fact that more surface areas were avail-able for the adsorption due to accumulation of carbon at higher doses.
Trend Analysis on Effects Initial Adsorbate Concentration Initial concentration of both adsorbates (Ni2+ and Cr3+) showed an inverse relationship with the percentage of their adsorbtion on the water hyacinth adsorbent, as could be seen in Figure 4. In other words, the adsorption of Ni2+ and Cr3+ on the adsorbent decreases as their initial concentrations in-creases, which is line with a previous related research [14].
Increasing the concentrations of the adsorbates from 1 mg/l to 5 mg/l reduced the adsorption efficiency of Ni2+ and Cr3 from 92.6% to 54.0% and 86.3% to 48.4% respectively. This is because the adsorption process occurred by means of the existing sites in the adsorbent binding the metal ions in the adsorbate. Hence, at low concentrations of adsorbates, the readily available sites conveniently binds the metal ions. Since the adsorbent dosages (available sites) were kept con-stant, the increase in the concentration of adsorbates led to the reduction or saturation of the available binding sites thus, leaving many metal ions not adsorbed thereby reduc-ing the adsorption percentage at higher concentrations.
Trend Analysis on Effect of Solution pH The effect of solution (adsorbate) pH was observed to be di-rectly proportional to the adsorption efficiency for both met-al ions (Ni2+ and Cr3+) as the adsorbtion percentage increased with pH (Fig. 5) thus, affirming an earlier report [15]. This is because at low or acidic pH levels, heavy metals tend to form free cationic species due to the high concentration of hydro-gen ions (H+) associated with low pH. These free cations (H+) might have been adsorbed on the available binding sites in the adsorbent. In other words at low pH, there is tendency for the adsorbent to be positively charge which definitely repels the metal ions (Ni2+ and Cr3+) in the adsorbate and conse-quently reduced the percentage of adsorption. However as the pH level increased, the reverse process occurred thereby improving the percentage of adsorption.
Despite the explanation given for the improvement of ad-sorbtion with increase in pH, the fact remains that the percentage adsorptions for both metal ions at pH 8 and 9 were remarkably high compared to pH 5, 6 and 7 as could be seen in the curves shown in Figure 5. That is, at pH 5,
6, 7, 8, 9, the percentage adsorbtions of Ni2+ and Cr3+ were 18.3, 23.9, 31.0, 60.9, 95.2 and 13.8, 19.5, 27.4, 62.0, 91.3 respectively. These sequences of percentage adsorbtion for both metal ions clearly revealed that the adsorbtions at pH 8 and 9 were very high compared to the lower pH values. This could be attributed to the fact that at pH 8 and 9, the solu-tions were alkaline thus containing more of hydroxide ions (OH-) which infused into the binding sites, impart a nega-tive charge on the adsorbent and consequently increased the attractive force between the adsorbent and the metal ions.
Determination of Adsorption Isotherm Parameters
Freundlich Isotherm ModelThe parameters for Freundlich isotherm model for the ad-sorption of Ni2+ were obtained through the information given in Figure 6.
Figure 3. Impact of adsorbent dosage on adsorption of Ni2+ and Cr3+ by water hyacinth.
Figure 4. Impact of adsorbate concentration on adsorption of Ni2+ and Cr3+ by water hyacinth.
Figure 5. Impact of solution pH on adsorption of Ni2+ and Cr3+ by water hyacinth.
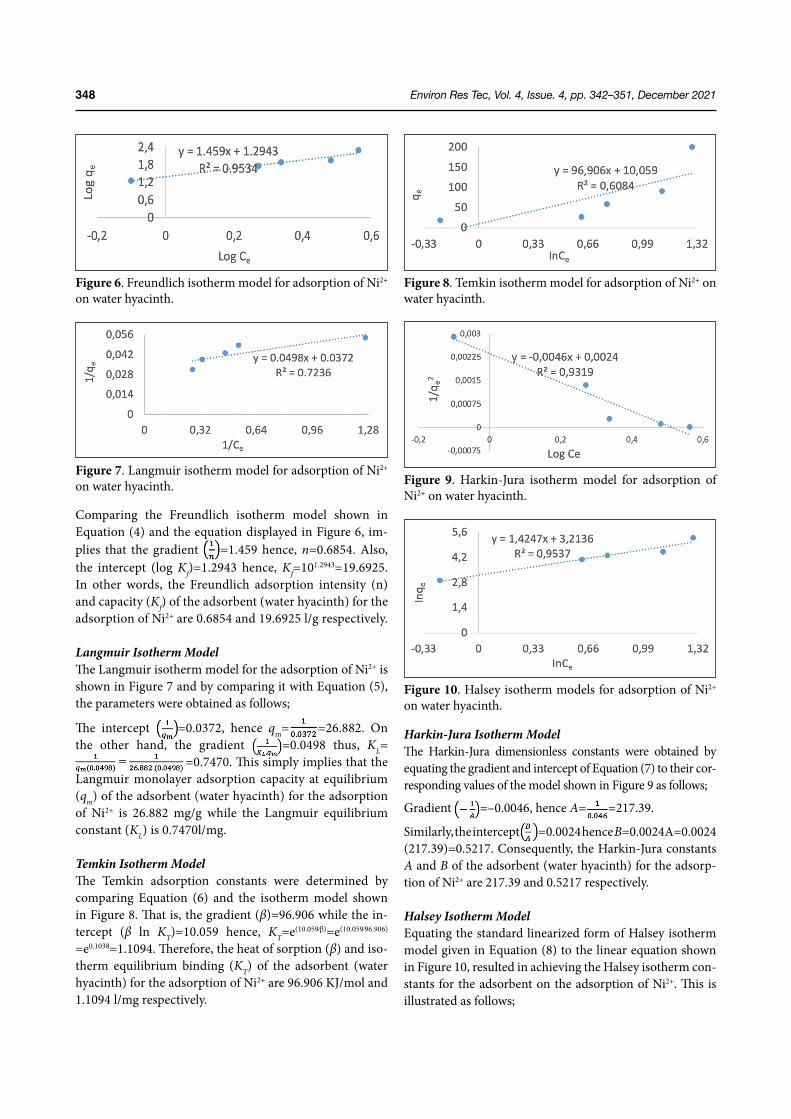
Environ Res Tec, Vol. 4, Issue. 4, pp. 342–351, December 2021348
Comparing the Freundlich isotherm model shown in Equation (4) and the equation displayed in Figure 6, im-plies that the gradient =1.459 hence, n=0.6854. Also, the intercept (log Kf)=1.2943 hence, Kf=101.2943=19.6925. In other words, the Freundlich adsorption intensity (n) and capacity (Kf) of the adsorbent (water hyacinth) for the adsorption of Ni2+ are 0.6854 and 19.6925 l/g respectively.
Langmuir Isotherm ModelThe Langmuir isotherm model for the adsorption of Ni2+ is shown in Figure 7 and by comparing it with Equation (5), the parameters were obtained as follows;
The intercept =0.0372, hence qm= =26.882. On the other hand, the gradient =0.0498 thus, KL=
=0.7470. This simply implies that the Langmuir monolayer adsorption capacity at equilibrium (qm) of the adsorbent (water hyacinth) for the adsorption of Ni2+ is 26.882 mg/g while the Langmuir equilibrium constant (KL) is 0.7470l/mg.
Temkin Isotherm ModelThe Temkin adsorption constants were determined by comparing Equation (6) and the isotherm model shown in Figure 8. That is, the gradient (β)=96.906 while the in-tercept (β ln KT)=10.059 hence, KT=e(10.059⁄β)=e(10.059⁄96.906)
=e0.1038=1.1094. Therefore, the heat of sorption (β) and iso-therm equilibrium binding (KT) of the adsorbent (water hyacinth) for the adsorption of Ni2+ are 96.906 KJ/mol and 1.1094 l/mg respectively.
Harkin-Jura Isotherm ModelThe Harkin-Jura dimensionless constants were obtained by equating the gradient and intercept of Equation (7) to their cor-responding values of the model shown in Figure 9 as follows;
Gradient =–0.0046, hence A= =217.39.
Similarly, the intercept =0.0024 hence B=0.0024A=0.0024 (217.39)=0.5217. Consequently, the Harkin-Jura constants A and B of the adsorbent (water hyacinth) for the adsorp-tion of Ni2+ are 217.39 and 0.5217 respectively.
Halsey Isotherm ModelEquating the standard linearized form of Halsey isotherm model given in Equation (8) to the linear equation shown in Figure 10, resulted in achieving the Halsey isotherm con-stants for the adsorbent on the adsorption of Ni2+. This is illustrated as follows;
Figure 6. Freundlich isotherm model for adsorption of Ni2+ on water hyacinth.
Figure 7. Langmuir isotherm model for adsorption of Ni2+ on water hyacinth.
Figure 8. Temkin isotherm model for adsorption of Ni2+ on water hyacinth.
Figure 9. Harkin-Jura isotherm model for adsorption of Ni2+ on water hyacinth.
Figure 10. Halsey isotherm models for adsorption of Ni2+ on water hyacinth.
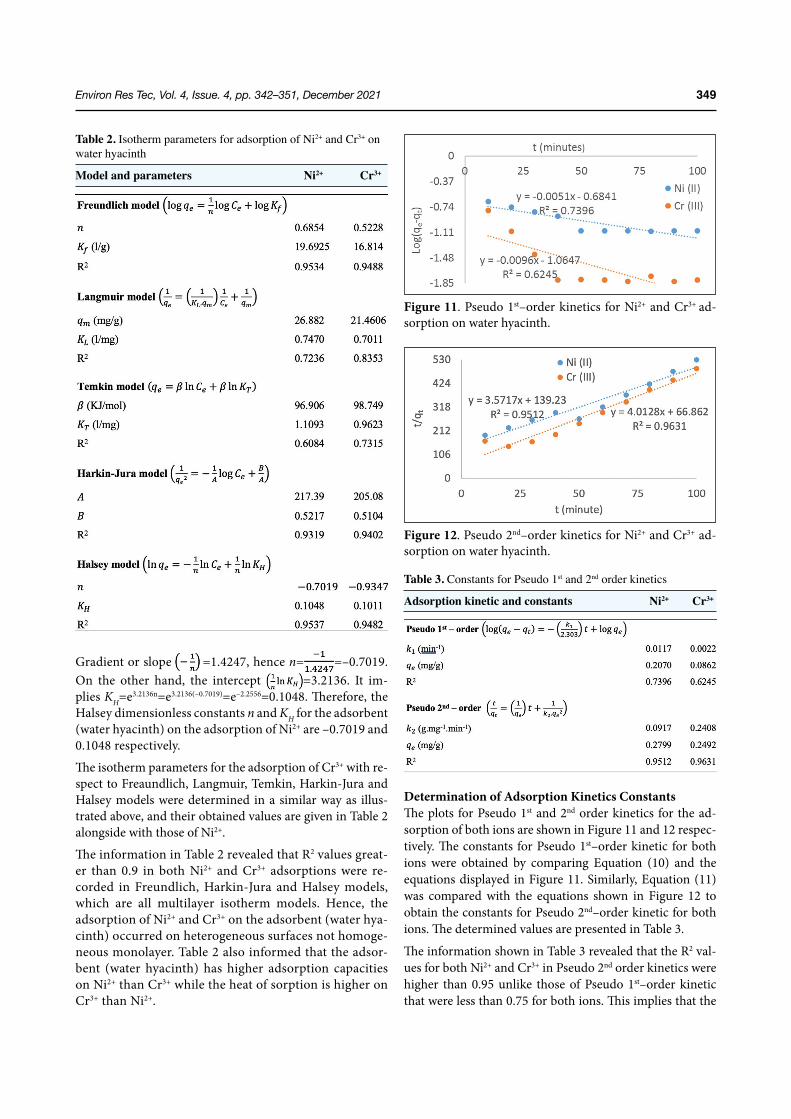
Environ Res Tec, Vol. 4, Issue. 4, pp. 342–351, December 2021 349
Gradient or slope =1.4247, hence n= =–0.7019. On the other hand, the intercept =3.2136. It im-plies KH=e3.2136n=e3.2136(–0.7019)=e–2.2556=0.1048. Therefore, the Halsey dimensionless constants n and KH for the adsorbent (water hyacinth) on the adsorption of Ni2+ are –0.7019 and 0.1048 respectively.
The isotherm parameters for the adsorption of Cr3+ with re-spect to Freaundlich, Langmuir, Temkin, Harkin-Jura and Halsey models were determined in a similar way as illus-trated above, and their obtained values are given in Table 2 alongside with those of Ni2+.
The information in Table 2 revealed that R2 values great-er than 0.9 in both Ni2+ and Cr3+ adsorptions were re-corded in Freundlich, Harkin-Jura and Halsey models, which are all multilayer isotherm models. Hence, the adsorption of Ni2+ and Cr3+ on the adsorbent (water hya-cinth) occurred on heterogeneous surfaces not homoge-neous monolayer. Table 2 also informed that the adsor-bent (water hyacinth) has higher adsorption capacities on Ni2+ than Cr3+ while the heat of sorption is higher on Cr3+ than Ni2+.
Determination of Adsorption Kinetics ConstantsThe plots for Pseudo 1st and 2nd order kinetics for the ad-sorption of both ions are shown in Figure 11 and 12 respec-tively. The constants for Pseudo 1st–order kinetic for both ions were obtained by comparing Equation (10) and the equations displayed in Figure 11. Similarly, Equation (11) was compared with the equations shown in Figure 12 to obtain the constants for Pseudo 2nd–order kinetic for both ions. The determined values are presented in Table 3.
The information shown in Table 3 revealed that the R2 val-ues for both Ni2+ and Cr3+ in Pseudo 2nd order kinetics were higher than 0.95 unlike those of Pseudo 1st–order kinetic that were less than 0.75 for both ions. This implies that the
Figure 11. Pseudo 1st–order kinetics for Ni2+ and Cr3+ ad-sorption on water hyacinth.
Figure 12. Pseudo 2nd–order kinetics for Ni2+ and Cr3+ ad-sorption on water hyacinth.
Table 2. Isotherm parameters for adsorption of Ni2+ and Cr3+ on water hyacinth
Model and parameters Ni2+ Cr3+
Table 3. Constants for Pseudo 1st and 2nd order kinetics
Adsorption kinetic and constants Ni2+ Cr3+
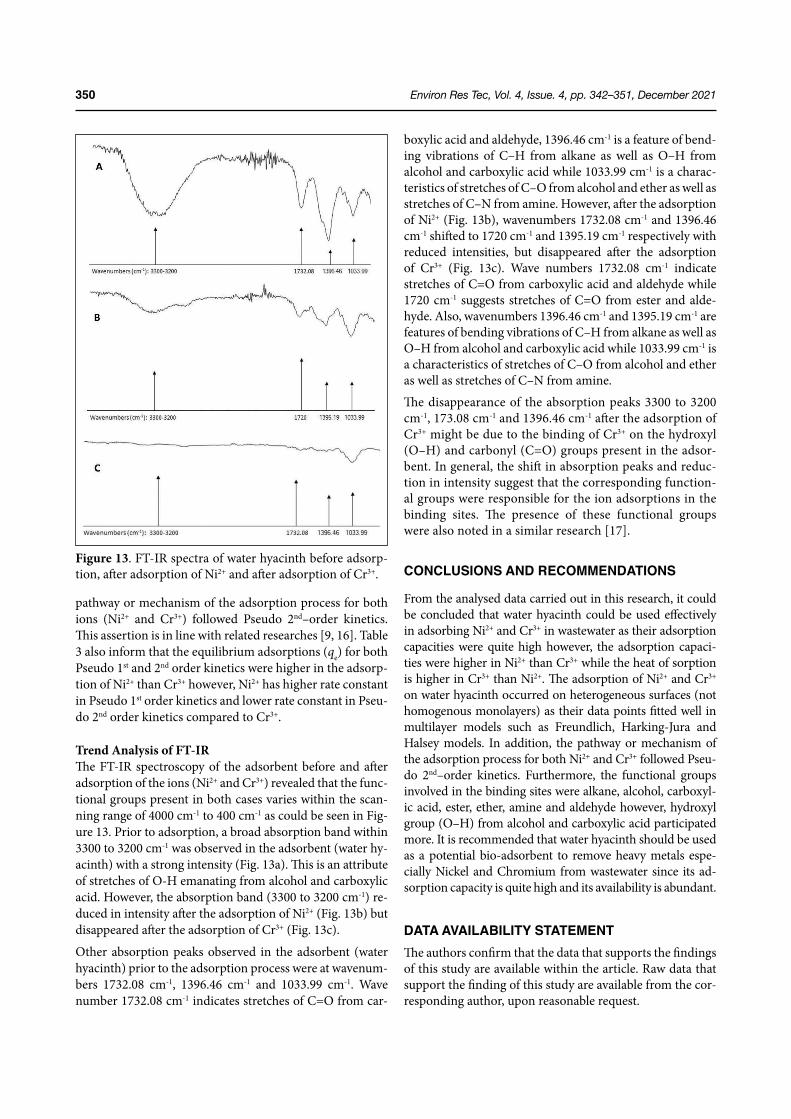
Environ Res Tec, Vol. 4, Issue. 4, pp. 342–351, December 2021350
pathway or mechanism of the adsorption process for both ions (Ni2+ and Cr3+) followed Pseudo 2nd–order kinetics. This assertion is in line with related researches [9, 16]. Table 3 also inform that the equilibrium adsorptions (qe) for both Pseudo 1st and 2nd order kinetics were higher in the adsorp-tion of Ni2+ than Cr3+ however, Ni2+ has higher rate constant in Pseudo 1st order kinetics and lower rate constant in Pseu-do 2nd order kinetics compared to Cr3+.
Trend Analysis of FT-IRThe FT-IR spectroscopy of the adsorbent before and after adsorption of the ions (Ni2+ and Cr3+) revealed that the func-tional groups present in both cases varies within the scan-ning range of 4000 cm-1 to 400 cm-1 as could be seen in Fig-ure 13. Prior to adsorption, a broad absorption band within 3300 to 3200 cm-1 was observed in the adsorbent (water hy-acinth) with a strong intensity (Fig. 13a). This is an attribute of stretches of O-H emanating from alcohol and carboxylic acid. However, the absorption band (3300 to 3200 cm-1) re-duced in intensity after the adsorption of Ni2+ (Fig. 13b) but disappeared after the adsorption of Cr3+ (Fig. 13c).
Other absorption peaks observed in the adsorbent (water hyacinth) prior to the adsorption process were at wavenum-bers 1732.08 cm-1, 1396.46 cm-1 and 1033.99 cm-1. Wave number 1732.08 cm-1 indicates stretches of C=O from car-
boxylic acid and aldehyde, 1396.46 cm-1 is a feature of bend-ing vibrations of C–H from alkane as well as O–H from alcohol and carboxylic acid while 1033.99 cm-1 is a charac-teristics of stretches of C–O from alcohol and ether as well as stretches of C–N from amine. However, after the adsorption of Ni2+ (Fig. 13b), wavenumbers 1732.08 cm-1 and 1396.46 cm-1 shifted to 1720 cm-1 and 1395.19 cm-1 respectively with reduced intensities, but disappeared after the adsorption of Cr3+ (Fig. 13c). Wave numbers 1732.08 cm-1 indicate stretches of C=O from carboxylic acid and aldehyde while 1720 cm-1 suggests stretches of C=O from ester and alde-hyde. Also, wavenumbers 1396.46 cm-1 and 1395.19 cm-1 are features of bending vibrations of C–H from alkane as well as O–H from alcohol and carboxylic acid while 1033.99 cm-1 is a characteristics of stretches of C–O from alcohol and ether as well as stretches of C–N from amine.
The disappearance of the absorption peaks 3300 to 3200 cm-1, 173.08 cm-1 and 1396.46 cm-1 after the adsorption of Cr3+ might be due to the binding of Cr3+ on the hydroxyl (O–H) and carbonyl (C=O) groups present in the adsor-bent. In general, the shift in absorption peaks and reduc-tion in intensity suggest that the corresponding function-al groups were responsible for the ion adsorptions in the binding sites. The presence of these functional groups were also noted in a similar research [17].
CONCLUSIONS AND RECOMMENDATIONS
From the analysed data carried out in this research, it could be concluded that water hyacinth could be used effectively in adsorbing Ni2+ and Cr3+ in wastewater as their adsorption capacities were quite high however, the adsorption capaci-ties were higher in Ni2+ than Cr3+ while the heat of sorption is higher in Cr3+ than Ni2+. The adsorption of Ni2+ and Cr3+ on water hyacinth occurred on heterogeneous surfaces (not homogenous monolayers) as their data points fitted well in multilayer models such as Freundlich, Harking-Jura and Halsey models. In addition, the pathway or mechanism of the adsorption process for both Ni2+ and Cr3+ followed Pseu-do 2nd–order kinetics. Furthermore, the functional groups involved in the binding sites were alkane, alcohol, carboxyl-ic acid, ester, ether, amine and aldehyde however, hydroxyl group (O–H) from alcohol and carboxylic acid participated more. It is recommended that water hyacinth should be used as a potential bio-adsorbent to remove heavy metals espe-cially Nickel and Chromium from wastewater since its ad-sorption capacity is quite high and its availability is abundant.
DATA AVAILABILITY STATEMENTThe authors confirm that the data that supports the findings of this study are available within the article. Raw data that support the finding of this study are available from the cor-responding author, upon reasonable request.
Figure 13. FT-IR spectra of water hyacinth before adsorp-tion, after adsorption of Ni2+ and after adsorption of Cr3+.
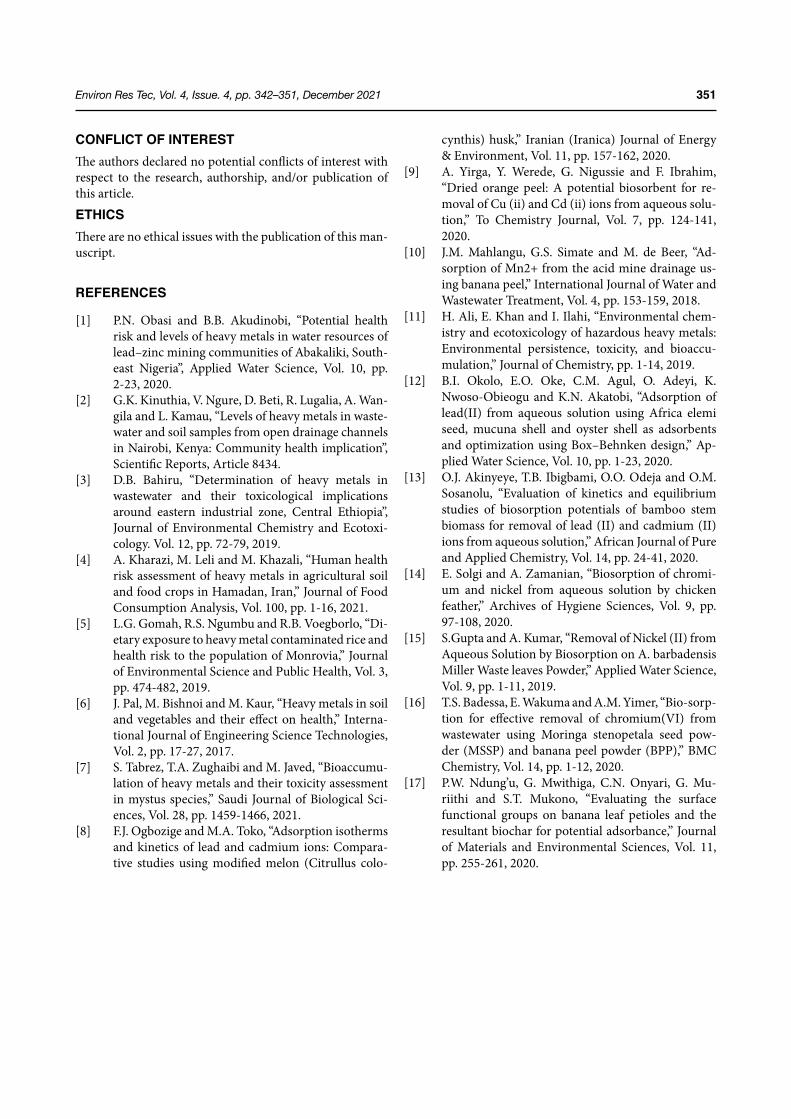
Environ Res Tec, Vol. 4, Issue. 4, pp. 342–351, December 2021 351
CONFLICT OF INTERESTThe authors declared no potential conflicts of interest with respect to the research, authorship, and/or publication of this article.ETHICSThere are no ethical issues with the publication of this man-uscript.
REFERENCES
[1] P.N. Obasi and B.B. Akudinobi, “Potential health risk and levels of heavy metals in water resources of lead–zinc mining communities of Abakaliki, South-east Nigeria”, Applied Water Science, Vol. 10, pp. 2-23, 2020.
[2] G.K. Kinuthia, V. Ngure, D. Beti, R. Lugalia, A. Wan-gila and L. Kamau, “Levels of heavy metals in waste-water and soil samples from open drainage channels in Nairobi, Kenya: Community health implication”, Scientific Reports, Article 8434.
[3] D.B. Bahiru, “Determination of heavy metals in wastewater and their toxicological implications around eastern industrial zone, Central Ethiopia”, Journal of Environmental Chemistry and Ecotoxi-cology. Vol. 12, pp. 72-79, 2019.
[4] A. Kharazi, M. Leli and M. Khazali, “Human health risk assessment of heavy metals in agricultural soil and food crops in Hamadan, Iran,” Journal of Food Consumption Analysis, Vol. 100, pp. 1-16, 2021.
[5] L.G. Gomah, R.S. Ngumbu and R.B. Voegborlo, “Di-etary exposure to heavy metal contaminated rice and health risk to the population of Monrovia,” Journal of Environmental Science and Public Health, Vol. 3, pp. 474-482, 2019.
[6] J. Pal, M. Bishnoi and M. Kaur, “Heavy metals in soil and vegetables and their effect on health,” Interna-tional Journal of Engineering Science Technologies, Vol. 2, pp. 17-27, 2017.
[7] S. Tabrez, T.A. Zughaibi and M. Javed, “Bioaccumu-lation of heavy metals and their toxicity assessment in mystus species,” Saudi Journal of Biological Sci-ences, Vol. 28, pp. 1459-1466, 2021.
[8] F.J. Ogbozige and M.A. Toko, “Adsorption isotherms and kinetics of lead and cadmium ions: Compara-tive studies using modified melon (Citrullus colo-
cynthis) husk,” Iranian (Iranica) Journal of Energy & Environment, Vol. 11, pp. 157-162, 2020.
[9] A. Yirga, Y. Werede, G. Nigussie and F. Ibrahim, “Dried orange peel: A potential biosorbent for re-moval of Cu (ii) and Cd (ii) ions from aqueous solu-tion,” To Chemistry Journal, Vol. 7, pp. 124-141, 2020.
[10] J.M. Mahlangu, G.S. Simate and M. de Beer, “Ad-sorption of Mn2+ from the acid mine drainage us-ing banana peel,” International Journal of Water and Wastewater Treatment, Vol. 4, pp. 153-159, 2018.
[11] H. Ali, E. Khan and I. Ilahi, “Environmental chem-istry and ecotoxicology of hazardous heavy metals: Environmental persistence, toxicity, and bioaccu-mulation,” Journal of Chemistry, pp. 1-14, 2019.
[12] B.I. Okolo, E.O. Oke, C.M. Agul, O. Adeyi, K. Nwoso-Obieogu and K.N. Akatobi, “Adsorption of lead(II) from aqueous solution using Africa elemi seed, mucuna shell and oyster shell as adsorbents and optimization using Box–Behnken design,” Ap-plied Water Science, Vol. 10, pp. 1-23, 2020.
[13] O.J. Akinyeye, T.B. Ibigbami, O.O. Odeja and O.M. Sosanolu, “Evaluation of kinetics and equilibrium studies of biosorption potentials of bamboo stem biomass for removal of lead (II) and cadmium (II) ions from aqueous solution,” African Journal of Pure and Applied Chemistry, Vol. 14, pp. 24-41, 2020.
[14] E. Solgi and A. Zamanian, “Biosorption of chromi-um and nickel from aqueous solution by chicken feather,” Archives of Hygiene Sciences, Vol. 9, pp. 97-108, 2020.
[15] S.Gupta and A. Kumar, “Removal of Nickel (II) from Aqueous Solution by Biosorption on A. barbadensis Miller Waste leaves Powder,” Applied Water Science, Vol. 9, pp. 1-11, 2019.
[16] T.S. Badessa, E. Wakuma and A.M. Yimer, “Bio-sorp-tion for effective removal of chromium(VI) from wastewater using Moringa stenopetala seed pow-der (MSSP) and banana peel powder (BPP),” BMC Chemistry, Vol. 14, pp. 1-12, 2020.
[17] P.W. Ndung’u, G. Mwithiga, C.N. Onyari, G. Mu-riithi and S.T. Mukono, “Evaluating the surface functional groups on banana leaf petioles and the resultant biochar for potential adsorbance,” Journal of Materials and Environmental Sciences, Vol. 11, pp. 255-261, 2020.
Economic evaluation of fluoride removal by membrane capacitive deionization
Environ Res Tec, Vol. 4, Issue. 4, pp. 352–357, December 2021
Environmental Research and Technologyhttps://ert.yildiz.edu.tr - https://dergipark.org.tr/tr/pub/ert
DOI: https://doi.org/10.35208/ert.915844
Research Article
Halil İbrahim UZUN*1 , Eyüp DEBİK2
1Department of Food Engineering, Muş Alparslan University, Faculty of Engineering Architecture, Muş, Turkey2Department of Environmental Engineering, Yıldız Technical University, Faculty of Civil Engineering, İstanbul, Turkey
*Corresponding author.*E-mail address: [email protected] paper has been presented at 5th International Symposium on Environment and Morals, 2020, İstanbul, Turkey
Published by Yıldız Technical University Press, İstanbul, TurkeyCopyright 2021, Yıldız Technical University. This is an open access article under the CC BY-NC license (http://creativecommons.org/licenses/by-nc/4.0/).
ARTICLE INFO
Article historyReceived: 14 April 2021Revised: 03 November 2021Accepted: 23 November 2021
Key words:Deionization; Economic analysis; Fluoride; Membrane capacitive
ABSTRACT
Today, one of the most important issues of all is the supply of drinking and utility water, which is the most basic need for human beings, to be healthy and reliable, economical. Some sub-stances in natural water sources pose a danger to living creatures when they exceed certain con-centrations. Fluoride, which can be commonly found in water as a result of natural or industrial effects, poses various risks for the living not only in its deficiency, but also its excess. Therefore. the fluoride concentration should be under control. Membrane Capacitive Deionization Pro-cess is an effective method to remove ions from water. In this study, firstly, optimum conditions have been determined by working on the removal of fluoride from groundwater with MCDI which is prepared synthetically. Subsequently, the groundwater, which was obtained from Is-parta province and containing 7.71 mg/L fluoride, was treated by the membrane capacitive deionization method at the optimum conditions determined by 99%. Groundwater fluoride concentration has been reduced below the drinking water fluoride limit. For this treatment, 0.06 kWh/m3 energy was expensed and this corresponds to an energy cost of $ 0.006/m3. These results are quite economical when compared to other groundwater fluoride removal methods.
Cite this article as: Uzun Hİ, Debik E. Economic evaluation of fluoride removal by membrane capacitive deionization. Environ Res Tec 2021;4:4:352–357.
INTRODUCTION
Water is one of the most basic needs for the existence and health of living creatures, and a healthy and safe water supply becomes very important in the supply of water as drinking water and utility water. Increasing living stan-dards together with socio-economic developments boosts per capita drinking and utility water requirements as well. The increase in daily water consumption as a result of pop-ulation growth, rural-urban migration, and urbanization,
and industrialization necessitates the supply of drinking water from surface and groundwater resources. Although all water contain anions such as chlorides and sulfates, in particular, this type of anions and cations do not pose a sig-nificant risk unless their total salt concentration exceeds the acceptable limit [1]. However, anions such as fluoride and nitrate can cause health problems. Fluoride (F-) contamina-tion commonly occurs in the groundwater and the highest F- concentration reported in groundwater of South Asia, Africa and the Middle East countries [1, 2].
Environ Res Tec, Vol. 4, Issue. 4, pp. 352–357, December 2021 353
The presence of F- in drinking water has both beneficial and harmful effects on the health of living creatures, depending on the limit values of concentration of F-. F- at a range of 0.5 to 1.0 mg/L has positive effects on teeth and bones. Howev-er, F- concentrations greater than 1.5 mg/L cause permanent bone and joint deformities, dental and skeletal fluorosis for children, in particular. When exposed to a F- concentration greater than 4 mg/L, on the other hand, neurological dam-ages and further toxic effects may occur. It is observed that in some countries around the world such as China, India, Kenya, Mexico, Thailand, and especially in Isparta province in Turkey, the concentration of F- ions in groundwater used for drinking water exceeds acceptable drinking water stan-dards. Studies conducted in Isparta suggested that volcanic lake sediments, possible sources of F-, are over 20 km2 and may reach up to 60 m in thickness in the region, that the flu-oride content in trachyandesites and tuffites in Isparta-Göl-cük region increased parallel to the abundance of biotite, and that this could result in F- enrichment in groundwater. It was revealed that these groundwater caused dental fluo-rosis, which was known as Isparta Brown Stain in the 1960s and the use of groundwater as a water source was stopped in the mid-1990s [3].
Various techniques such as adsorption, ion exchange, re-verse osmosis, and electrodialysis are still broadly utilized for fluoride removal from the water today [1, 4, 5]. All of these techniques have some disadvantages such as imprac-ticality, low efficiency, and high operating costs.
Some parameters such as inlet concentration, removal effi-ciency and cost in fluoride removal with different treatment techniques are given in Table 1.
In recent years, the use of capacitive deionization (CDI), which is defined as a practical, low cost and eco-friendly electrochemical desalination process, becomes popular. In CDI, the electrode compartments directly participate in the ion removal/concentration process, with oxidation/reduc-tion at the electrodes; electrons are transferred by electro-static adsorption/ desorption. In the CDI process, electrical double layers are formed on the anode and cathode surfaces created by the applied voltage and thus, oppositely charged ions are effectively captured at the opposite electrodes. Membrane capacitive deionization (MCDI), on the other
hand, is a technology that increases the efficiency of CDI created by adding ion-selective membranes to the surfaces of CDI electrodes [9].
In this study, the purification of F- of different concentra-tions from synthetic groundwater through the MCDI pro-cess by using the optimum conditions obtained in previous studies with MCDI technology was investigated. Subse-quently, fluoride-containing groundwater supplied from Isparta was purified and the costs were worked out [10].
MATERIALS AND METHODS
MCDI Process and Operation ConditionsFigure 1 shows the schematic representation of the Voltea Brand MCDI reactor, which was used in the study.
The MCDI system consists of 24 cells made of PVC. Each cell contained a graphite current distributor (thickness δ=250 μm), chemically identical porous carbon electrodes to work as cathode and anode (δe=362 μm), anion- and cation-selective membranes to control ion flow (Neosepta AM-1 and Neosepta CM-1, Tokuyama Co., Japan, δ≈130 μm) and textile separator (δ=115 μm) that allowed water flow and separated the electrodes from each other. The re-sistance of the carbon electrodes was 1 (±0,2) Ω·cm2, and the total electrode area was 2.7 m2. The anion- and cat-ion-selective membranes had resistance values of approx-imately 2Ω cm2. Table 2 shows the operating ranges of the different parameters used in the device.
The MCDI device could be operated automatically or man-ually at three stages: “purification”, “preliminary” and “con-centrated flow”. In automatic mode, optimum flow is cal-
Table 1. Operating costs of different treatment methods in fluoride removal
Treatment technigues F- Removal Operation Reference concentration efficiency cost (mg/L) (%) (cost/m3)
Table 2. Ranges of MCDI operating parameters
Parameter Range
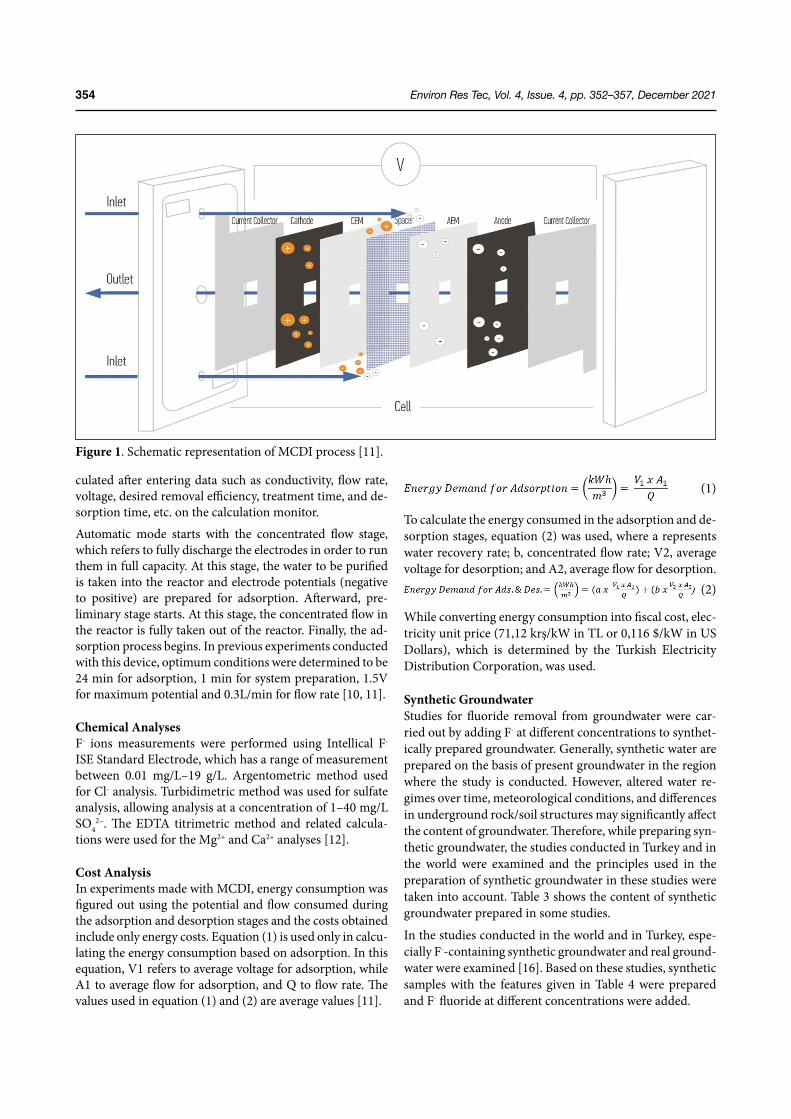
Environ Res Tec, Vol. 4, Issue. 4, pp. 352–357, December 2021354
culated after entering data such as conductivity, flow rate, voltage, desired removal efficiency, treatment time, and de-sorption time, etc. on the calculation monitor.
Automatic mode starts with the concentrated flow stage, which refers to fully discharge the electrodes in order to run them in full capacity. At this stage, the water to be purified is taken into the reactor and electrode potentials (negative to positive) are prepared for adsorption. Afterward, pre-liminary stage starts. At this stage, the concentrated flow in the reactor is fully taken out of the reactor. Finally, the ad-sorption process begins. In previous experiments conducted with this device, optimum conditions were determined to be 24 min for adsorption, 1 min for system preparation, 1.5V for maximum potential and 0.3L/min for flow rate [10, 11].
Chemical AnalysesF- ions measurements were performed using Intellical F- ISE Standard Electrode, which has a range of measurement between 0.01 mg/L–19 g/L. Argentometric method used for Cl- analysis. Turbidimetric method was used for sulfate analysis, allowing analysis at a concentration of 1–40 mg/L SO4
2−. The EDTA titrimetric method and related calcula-tions were used for the Mg2+ and Ca2+ analyses [12].
Cost AnalysisIn experiments made with MCDI, energy consumption was figured out using the potential and flow consumed during the adsorption and desorption stages and the costs obtained include only energy costs. Equation (1) is used only in calcu-lating the energy consumption based on adsorption. In this equation, V1 refers to average voltage for adsorption, while A1 to average flow for adsorption, and Q to flow rate. The values used in equation (1) and (2) are average values [11].
(1)
To calculate the energy consumed in the adsorption and de-sorption stages, equation (2) was used, where a represents water recovery rate; b, concentrated flow rate; V2, average voltage for desorption; and A2, average flow for desorption.
(2)
While converting energy consumption into fiscal cost, elec-tricity unit price (71,12 krş/kW in TL or 0,116 $/kW in US Dollars), which is determined by the Turkish Electricity Distribution Corporation, was used.
Synthetic GroundwaterStudies for fluoride removal from groundwater were car-ried out by adding F- at different concentrations to synthet-ically prepared groundwater. Generally, synthetic water are prepared on the basis of present groundwater in the region where the study is conducted. However, altered water re-gimes over time, meteorological conditions, and differences in underground rock/soil structures may significantly affect the content of groundwater. Therefore, while preparing syn-thetic groundwater, the studies conducted in Turkey and in the world were examined and the principles used in the preparation of synthetic groundwater in these studies were taken into account. Table 3 shows the content of synthetic groundwater prepared in some studies.
In the studies conducted in the world and in Turkey, espe-cially F--containing synthetic groundwater and real ground-water were examined [16]. Based on these studies, synthetic samples with the features given in Table 4 were prepared and F- fluoride at different concentrations were added.
Figure 1. Schematic representation of MCDI process [11].
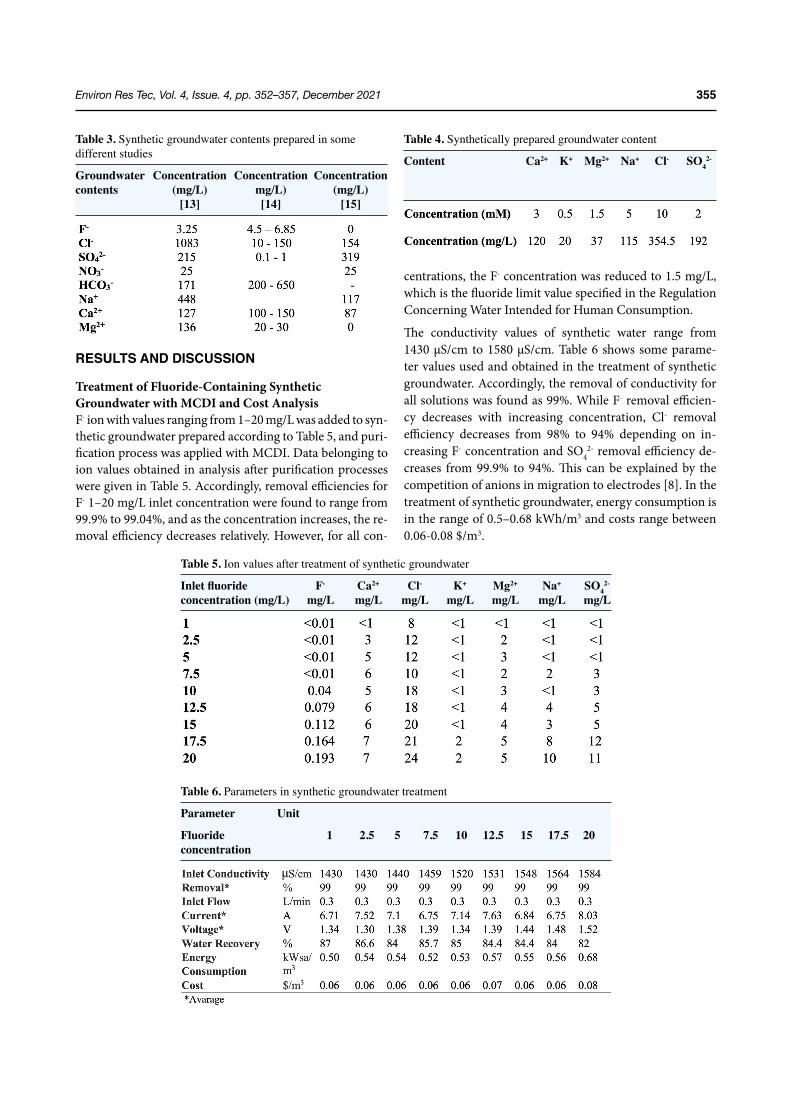
Environ Res Tec, Vol. 4, Issue. 4, pp. 352–357, December 2021 355
RESULTS AND DISCUSSION
Treatment of Fluoride-Containing Synthetic Groundwater with MCDI and Cost AnalysisF- ion with values ranging from 1–20 mg/L was added to syn-thetic groundwater prepared according to Table 5, and puri-fication process was applied with MCDI. Data belonging to ion values obtained in analysis after purification processes were given in Table 5. Accordingly, removal efficiencies for F- 1–20 mg/L inlet concentration were found to range from 99.9% to 99.04%, and as the concentration increases, the re-moval efficiency decreases relatively. However, for all con-
centrations, the F- concentration was reduced to 1.5 mg/L, which is the fluoride limit value specified in the Regulation Concerning Water Intended for Human Consumption.
The conductivity values of synthetic water range from 1430 μS/cm to 1580 μS/cm. Table 6 shows some parame-ter values used and obtained in the treatment of synthetic groundwater. Accordingly, the removal of conductivity for all solutions was found as 99%. While F- removal efficien-cy decreases with increasing concentration, Cl- removal efficiency decreases from 98% to 94% depending on in-creasing F- concentration and SO4
2- removal efficiency de-creases from 99.9% to 94%. This can be explained by the competition of anions in migration to electrodes [8]. In the treatment of synthetic groundwater, energy consumption is in the range of 0.5–0.68 kWh/m3 and costs range between 0.06-0.08 $/m3.
Table 3. Synthetic groundwater contents prepared in some different studies
Groundwater Concentration Concentration Concentration contents (mg/L) mg/L) (mg/L) [13] [14] [15]
Table 4. Synthetically prepared groundwater content
Content Ca2+ K+ Mg2+ Na+ Cl- SO42-
Table 5. Ion values after treatment of synthetic groundwater
Inletfluoride F- Ca2+ Cl- K+ Mg2+ Na+ SO42-
concentration (mg/L) mg/L mg/L mg/L mg/L mg/L mg/L mg/L
Table 6. Parameters in synthetic groundwater treatment
Parameter Unit
Fluoride 1 2.5 5 7.5 10 12.5 15 17.5 20 concentration
μ
Environ Res Tec, Vol. 4, Issue. 4, pp. 352–357, December 2021356
Treatment of Fluoride-Containing Groundwater with MCDI and Cost AnalysisTable 7 shows the values belonging to groundwater supplied from Isparta province that contains F- above the limit values.
Corresponding to groundwater with 410 μS/cm conductiv-ity, water prepared with NaCl solution at the same conduc-tivity was treated with MCDI and the effect of ion content on performance was investigated. Table 8 indicates that there are differences between the treatment of groundwater using the MCDI process and the treatment of the solution prepared with NaCl. In the treatment of groundwater, a cur-rent of 2.18 A with a potential of 0.48 V was used and the conductivity removal efficiency was 99%. In the treatment of NaCl solution, on the other hand, 1.97 A-current was provided with 1.47 V potential and conductivity removal ef-ficiency was obtained as 99.9%. The current used is directly related to the ion contents and the difference in the currents used corresponding the potentials arises from this situation. While a treatment cost of 0.019 $/m3 occurs in the treatment of NaCl solution, the treatment cost of groundwater was re-alized as $ 0.006/m3. This result shows that F- removal from groundwater with the MCDI process is more economical than the other electrochemical methods given in Table 1.
As a result of the treatment of groundwater with the MCDI process; as seen in Table 9, drinking water was obtained by purifying the total conductivity of 410 µS/cm with a treatment efficiency of 99%. Groundwater F- value of 7.71 mg/L was reduced below the limit values with a removal efficiency of 99.9%.
CONCLUSION
Healthy and safe water supply for the protection of human health is one of the most important issues today. Besides, increasing per capita water consumption due to various fac-tors makes finding new water resources inevitable. Howev-
er, when fluoride that can be found in groundwater exceeds limit values, this may lead to serious problems, especially in bone structures.
Traditional methods widely used today for the removal of F- from water have disadvantages such as impracticality, low efficiency, and high operating costs. As an alternative to traditional treatment methods, the use of capacitive de-ionization (CDI), a practical, low-cost and eco-friendly, and highly efficient electrochemical desalination process, becomes popular.
In this study, the purification of fluoride from groundwater using MCDI technology was investigated and analyzes were made for the cost of the process. We managed to treat F- ions (7,71 mg/L) in the groundwater we analyzed, which was far above the limit values, with a removal efficiency of 99%. The cost analysis indicated that 0.06 kWh/m3 energy was con-sumed for treatment, which corresponds to 0.006 $/m3.
As a result, it was revealed in the study that the MCDI pro-cess can be used as an alternative technology to remove F- ions from groundwater economically and efficiently.
DATA AVAILABILITY STATEMENTThe authors confirm that the data that supports the findings of this study are available within the article. Raw data that support the finding of this study are available from the cor-responding author, upon reasonable request.
CONFLICT OF INTERESTThe authors declared no potential conflicts of interest with respect to the research, authorship, and/or publication of this article.
ETHICSThere are no ethical issues with the publication of this man-uscript.
Table 7. Ion Values of groundwater supplied from Isparta
Parameter Conductivity F- Cl- SO42- Ca2+ Mg2+ Na+
µS/cm mg/L mg/L mg/L mg/L mg/L mg/L
Table 8. Parameters in groundwater treatment
Cycleinformation Unit Groundwater
Table 9. Ion values after groundwater treatment
Parameter Unit Outlet Average removal concentration %
μ
Environ Res Tec, Vol. 4, Issue. 4, pp. 352–357, December 2021 357
REFERENCES
[1] B. Yazici-Karabulut, A.D. Atasoy, O.T. Can, and M.L. Yesilnacar, “Electrocoagulation for nitrate removal in groundwater of intensive agricultural region: a case study of Harran plain, Turkey",” Environmental Earth Sciences, Vol. 80, 190.
[2] A. Bhatnagar and M. Sillanpää, “A review of emerging adsorbents for nitrate removal from wa-ter,”Chemical Engineering Journal, Vol. 168, pp. 493–504, 2011.
[3] M. Amini, K. Mueller, K.C. Abbaspour, T. Rosen-berg, M. Afyuni, K.N. Møller, M. Sarr and C.A. John-son, "Statistical modeling of global geogenic fluoride contamination in groundwaters,” Environmental Science & Technology, Vol.42, pp. 3662–3668, 2008
[4] I. Kürkçüoğlu, V. Karakılıç, and M. Kürkçüoğlu, “Is-parta ilinde yüksek florlu su kaynaklarını kullanan iki bölgede atmosferik radon düzeylerinin incelen-mesi” Süleyman Demirel Üniversitesi Sağlık Bilim-leri Dergisi, Vol.1, pp. 49–61, 2010.
[5] S. Jagtap, M.K. Yenkie, N. Labhsetwar and S. Rayalu, “Fluoride in drinking water and defluoridation of water,” Chemical Reviews, Vol. 112, pp. 2454–2466, 2012.
[6] N. Drouichea, N. Ghaffourb, H. Lounicic, N. Ma-meric, A. Maallemia and H. Mahmoudid, "Elec-trochemical treatment of chemical mechanical polishing wastewater: removal of fluoride — sludge characteristics — operating cost", Desalination, Vol. 223, pp. 134–142, 2008
[7] M. Changmai, M. Pasawan and M.K. Purkait, “A hy-brid method for the removal of fluoride from drink-ing water: Parametric study and cost estimation,” Separation and Purification Technology, Vol. 206, pp.140–148, 2018.
[8] V.F. Menaa, A. Betancor-Abreua, S. Gonzaleza, S. Delgadob, R.M. Soutoa, J.J. Santanad, "Fluoride re-moval from natural volcanic underground water by an electrocoagulation process: Parametric and cost
evaluations", Journal of Environmental Manage-ment, Vol. 246, pp. 472–483, 2019
[9] H.İ. Uzun and E. Debik, “Membran kapasitif deiy-onizasyon prosesi ile sertlik giderimi,” Akademik Platform Mühendislik ve Fen Bilimleri Dergisi, Vol.7, pp. 341–346, 2019.
[10] E. Debik and H. I. Uzun, "Yeraltı Suyu İyonik Kir-leticilerin Gideriminde Membran Kapasitif Deiy-onizasyon Prosesi : Performans Parametrelerinin ve Optimum İşletme Şartlarının Tespiti", ISEM2016, 3rd International Symposium on Environment and Morality, Alanya–Turkey 4-6 November 2016.
[11] H.I. Uzun and E. Debik, “Economical approach to nitrate removal via membrane capacitive deioniza-tion",” Separation and Purification Technology, Vol. 209, pp. 776–781, 2019.
[12] APHA, “Standard method for examination of water and wastewater,” American Public Health Assoca-tion, 2011.
[13] M.A. Menkouchi Sahli, S. Annouar, M. Tahaikt, M. Mountadar, A. Soufiane and A. Elmidaoui, “Flu-oride removal for underground brackish water by adsorption on the natural chitosan and by electrodi-alysis,” Desalination, Vol. 212, pp. 37 - 45, 2007.
[14] P. Bhattacharya, A. Chatterjee and G. Jacks, “Occur-rence of arsenic contaminated groundwater in allu-vial aquifers form Delta Plains, Eastern India: Op-tions for safe drinking water supply,” International Journal of Water Resources Development, Vol.13, pp. 19–92, 1997.
[15] D.D. Runnells and J.L. Larson, “A laboratory study of electromigration as a possible field technique for the removal of contaminants from ground water,” Groundwater Monitoring Remediation, Vol. 6, pp. 85–91, 1986.
[16] N. Aksoy, C. Şimşek and O. Gunduz, “Groundwater contamination mechanism in a geothermal field: A case study of Balcova, Turkey,” Journal of Contami-nant Hydrology, Vol. 103, pp. 13–28, 2009.
Macroporous thermoset monoliths from glycidyl methacrylate (GMA)-based high internal phase emulsions (HIPEs): Effect of cellulose
nanocrystals (CNCs) as filler - Functionalization and removal of Cr(III) from aqueous solutions
Environ Res Tec, Vol. 4, Issue. 4, pp. 358–368, December 2021
Environmental Research and Technologyhttps://ert.yildiz.edu.tr - https://dergipark.org.tr/tr/pub/ert
DOI: https://doi.org/10.35208/ert.973855
Research Article
Burcu KEKEVİ*1 , Ali ESLEK2 , E. Hilal MERT3
1Department of Material and Material Processing, Yalova University, Yalova Community College, Yalova, Turkey2Department of Polymer Materials Engineering, Yalova University, Institute of Graduate Studies, Yalova, Turkey
3Department of Polymer Materials Engineering, Yalova University Faculty of Engineering, Yalova, Turkey
*Corresponding author.*E-mail address: [email protected]
Published by Yıldız Technical University Press, İstanbul, TurkeyCopyright 2021, Yıldız Technical University. This is an open access article under the CC BY-NC license (http://creativecommons.org/licenses/by-nc/4.0/).
ARTICLE INFO
Article historyReceived: 25 July 2021Revised: 22 November 2021Accepted: 25 November 2021
Key words:Amine functionalization; Chrome (III) removal; CNC; GMA; Macroporous foam
ABSTRACT
Macroporous foams having 80 vol % of nominal porosity were synthesized by the copoly-merization crosslinking of glycidyl methacrylate (GMA) based high internal phase emulsions (HIPEs). To alter the mechanical and thermal properties, cellulose nanocrystals (CNCs) were used as filler. For this purpose, CNCs were added to the continuous oil phase during emulsifi-cation process at a loading rate of 1, 5 or 7 wt %. Consequently, composite foams were obtained by purification of the polymerized HIPEs (polyHIPEs). The effect of CNCs on the morpho-logical and mechanical properties was investigated. It was found that CNCs have a significant influence on the thermal stability and the compressive strength of the obtained foams. In the end, the neat polyHIPE foam and the polyHIPE/CNC composite foam with 1 wt % of CNC were post-functionalized by reacting phenylimidazole (PIAL) with the epoxy ring of the GMA units. Resulting amine functional foams and the neat foam were utilized in Cr(III) removal from aqueous solutions. It was demonstrated that amine functional foams have a great po-tential as sorbent materials. The results also showed that the existence of CNCs decreased the performance for removing Cr(III) ions. Nevertheless, functionalization by PIAL significantly improved the selectivity of Cr(III) in comperasion with the neat polyHIPE foam.
Cite this article as: Kekevi B, Eslek A, Mert EH. Macroporous thermoset monoliths from glycidyl methacrylate (GMA)-based high internal phase emulsions (HIPEs): Effect of cellulose nanocrystals (CNCs) as filler - Functionalization and removal of Cr(III) from aqueous solu-tions. Environ Res Tec 2021;4:4:358–368.
INTRODUCTION
Morphology is one of the main factors affecting the ap-plication area of polymeric materials. Especially for sepa-
ration science and chromatography, polymeric monoliths that are exhibiting well-defined open-cellular morphology are highly preferred due to their highly permeable structure allowing mass transfer. Apart from the porous structure the
Environ Res Tec, Vol. 4, Issue. 4, pp. 358–368, December 2021 359
other important parameter required for above mentioned applications is of course the chemical functionality. From this point of view a polymer monolith, in which ideal pore morphology combines with the chemical structure com-posed of special functional groups is the perfect material for separation and chromatography applications. To achieve this goal, since the first introduction of high internal phase emulsion (HIPE) templated polystyrene based hierarchical macroporous foams, which are known as poly(high inter-nal phase emulsions) (polyHIPEs), by Unilever researchers Bartl and Bonnin [1], scientists are benefiting from HIPE templating for its versatility [2].
In a HIPE, the volume fraction (φ) of the internal phase (or the droplet phase) is over 0.74. This is the critical volume fraction that described by Ostwald [3, 4]. At this volume ra-tio the mono-disperse hard spheres are packed in the closest manner and deformed into polyhedral droplets over this val-ue [5]. Because the adjacent droplets are separated by the thin film of continuous phase, the resulting emulsions are similar to interconnected foams. If the continuous phase is consisted of polymerizable species, polyHIPEs can be obtained [6].
Although HIPEs can be prepared as water-in-oil (w/o) or oil-in-water (o/w) emulsions depending on the continuous phase, most of the polyHIPEs are synthesized from w/o type HIPEs, which are prepared by using hydrophobic mono-mers [7]. In such HIPEs, the oil phase is usually composed of monomer(s), crosslinker and surfactant(s) whereas the internal phase constitutes of water. Polymerization can be achieved under mild conditions by using an oil or water-sol-uble initiator. Consequently, water act as a porogen and well-defined, interconnected porous structure is achieved by the removal of the porogen upon polymerization [8–10].
So far, styrene is the most common monomer used in the synthesis of polyHIPEs due to its highly hydrophobic struc-ture [6]. Indeed, the main reason of this is preventing the coalescence of emulsion droplets and phase inversion and providing the emulsion stability. Since hydrophilic mono-mers tend to diffuse into the aqueous phase it is more diffi-cult to achieve stable HIPEs by using them. However, more hydrophilic monomers such as acrylamide (AAm), 2-hy-droxyl ethyl acrylate (HEA), ethylene glycol dimethacry-late (EGDMA), glycidyl methacrylate (GMA), and methyl methacrylate (MMA) have been also successfully utilized in HIPE templating [11–14]. Especially, acrylates and meth-acrylates have been served very well in the preparation of functional monoliths to be used as a separation and purifi-cation media, due to their chemical structure open to fur-ther functionalization reactions.
Post-polymerization functionalization is a convenient ap-proach to gain special groups in the monolith structure. In this respect, polyGMA based monoliths offer the advantage of reactive epoxy ring. Particularly in the presence of thi-ols and amines, the epoxy ring can be easily opened under
mild reaction conditions [15–19]. In this respect, Krajnc et al. [20] synthesized poly (GMA-ethylene glycol dimethacry-late) polyHIPE monoliths and functionalized these mono-liths with different amines to investigate their capacity in the chromatographic separation of proteins. Pahovnik et al. [21] prepared hydrogel polyHIPEs through o/w type HIPEs from functionalized-polyGMA and carried out post-function-alization with different amine compounds. Consequently, they revealed the water uptake capacity of the obtained ma-terials. In another study, Mert et al. [22] synthesized poly-HIPE monoliths by the crosslinking of unsaturated polyster resin with GMA and DVB in the w/o type HIPEs. Thereaf-ter, they carried out post-functionalization of the resulting monoliths with several amine ligands. In the end they have shown that resulting materials are highly effective in the re-moval of heavy metal ions. In their following study, Mert and Yıldırım also demonstrated the synthesis, functional-ization and heavy metal ion uptake capacity of poly(unsatu-rated polyester-co-GMA-DVB) polyHIPE beads [23].
In the preparation of polyGMA based polyHIPEs, obtain-ing a material with high amounts of epoxy groups is chal-lenging due to the hydrolysis of epoxy groups during poly-HIPE synthesis to achieve highly functional materials [24]. However, depending on the polymerization temperature, hydrolysis amount of epoxy groups varied. Yang et al. [25] successfully utilized radiation-induced HIPE polymeriza-tion at room temperature to prepare polyGMA monoliths.
Herein, we focused on the preparation of amine function-al poly(GMA-co-DVB) polyHIPE monolith and cellulose nanocrystal (CNC) loaded polyHIPE/CNC composite monoliths. For this purpose, CNC was used as filler during the preparation of polyHIPEs because it offers the advan-tages of biocompatibility and preparing polymers with im-proved properties [26–28]. Moreover, it is a cost-effective material. It is known from previous studies that the ad-sorption capacity of the polymers obtained by reinforcing the polymer matrix with CNC also increases significantly [27, 28]. In this respect, polyHIPE/CNC composite mono-liths were obtained from the precursor HIPEs at which the amount of CNC loading was corresponding to 1, 5 or 7 wt % of the continuous oil phase. Resulting monoliths were in-vestigated in terms of, morphological properties, thermal stability, and mechanical strength. In the end, post-polym-erization functionalization reactions were also conducted by using 2-phenylimidazole (PIAL) and the capacity of the resulting functional polyHIPEs was demonstrated by uti-lizing in the removal of Cr(III) from aqueous solutions. In addition to all, the kinetics of the Cr(III) removal by using the resulting polyHIPE sorbents was also demonstrated. To the best of our knowledge, this is the first study describing the preparation of CNCs supported poly(GMA-co-DVB) polyHIPEs and demonstrating the synergistic influence of functionalization and CNCs loading on the removal of Cr(III) from aqueous environment.
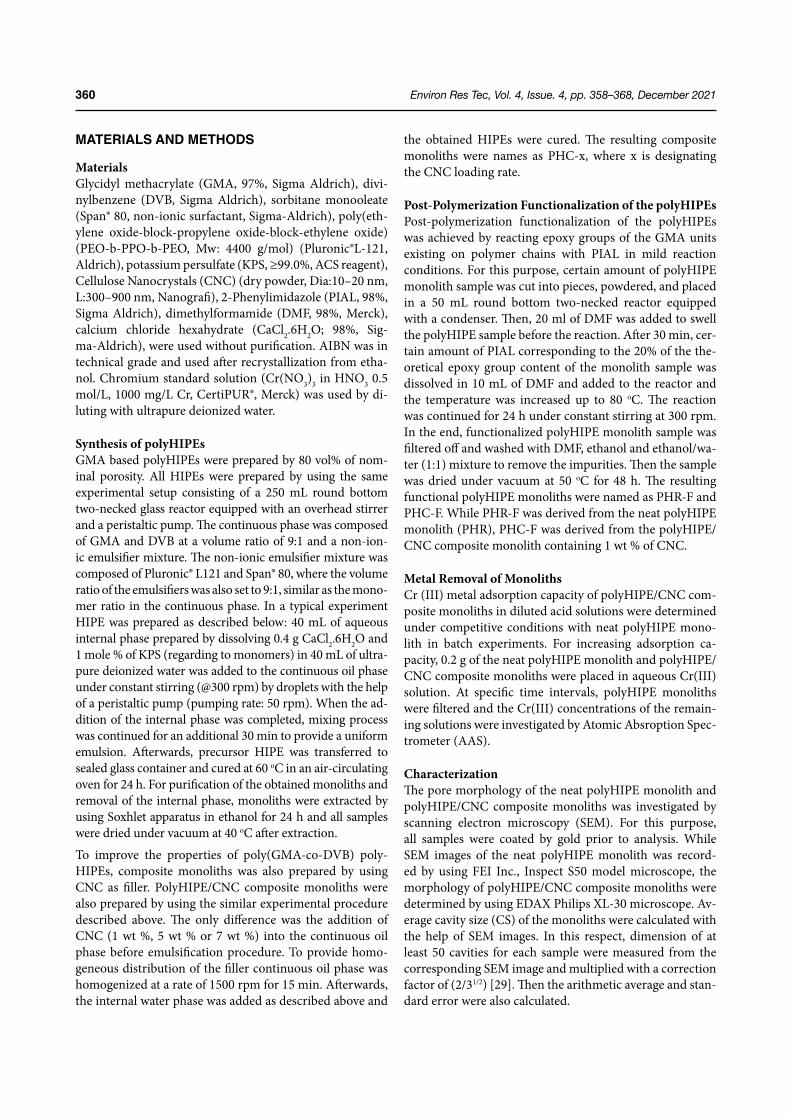
Environ Res Tec, Vol. 4, Issue. 4, pp. 358–368, December 2021360
MATERIALS AND METHODS
MaterialsGlycidyl methacrylate (GMA, 97%, Sigma Aldrich), divi-nylbenzene (DVB, Sigma Aldrich), sorbitane monooleate (Span® 80, non-ionic surfactant, Sigma-Aldrich), poly(eth-ylene oxide-block-propylene oxide-block-ethylene oxide) (PEO-b-PPO-b-PEO, Mw: 4400 g/mol) (Pluronic®L-121, Aldrich), potassium persulfate (KPS, ≥99.0%, ACS reagent), Cellulose Nanocrystals (CNC) (dry powder, Dia:10–20 nm, L:300–900 nm, Nanografi), 2-Phenylimidazole (PIAL, 98%, Sigma Aldrich), dimethylformamide (DMF, 98%, Merck), calcium chloride hexahydrate (CaCl2.6H2O; 98%, Sig-ma-Aldrich), were used without purification. AIBN was in technical grade and used after recrystallization from etha-nol. Chromium standard solution (Cr(NO3)3 in HNO3 0.5 mol/L, 1000 mg/L Cr, CertiPUR®, Merck) was used by di-luting with ultrapure deionized water.
Synthesis of polyHIPEsGMA based polyHIPEs were prepared by 80 vol% of nom-inal porosity. All HIPEs were prepared by using the same experimental setup consisting of a 250 mL round bottom two-necked glass reactor equipped with an overhead stirrer and a peristaltic pump. The continuous phase was composed of GMA and DVB at a volume ratio of 9:1 and a non-ion-ic emulsifier mixture. The non-ionic emulsifier mixture was composed of Pluronic® L121 and Span® 80, where the volume ratio of the emulsifiers was also set to 9:1, similar as the mono-mer ratio in the continuous phase. In a typical experiment HIPE was prepared as described below: 40 mL of aqueous internal phase prepared by dissolving 0.4 g CaCl2.6H2O and 1 mole % of KPS (regarding to monomers) in 40 mL of ultra-pure deionized water was added to the continuous oil phase under constant stirring (@300 rpm) by droplets with the help of a peristaltic pump (pumping rate: 50 rpm). When the ad-dition of the internal phase was completed, mixing process was continued for an additional 30 min to provide a uniform emulsion. Afterwards, precursor HIPE was transferred to sealed glass container and cured at 60 oC in an air-circulating oven for 24 h. For purification of the obtained monoliths and removal of the internal phase, monoliths were extracted by using Soxhlet apparatus in ethanol for 24 h and all samples were dried under vacuum at 40 oC after extraction.
To improve the properties of poly(GMA-co-DVB) poly-HIPEs, composite monoliths was also prepared by using CNC as filler. PolyHIPE/CNC composite monoliths were also prepared by using the similar experimental procedure described above. The only difference was the addition of CNC (1 wt %, 5 wt % or 7 wt %) into the continuous oil phase before emulsification procedure. To provide homo-geneous distribution of the filler continuous oil phase was homogenized at a rate of 1500 rpm for 15 min. Afterwards, the internal water phase was added as described above and
the obtained HIPEs were cured. The resulting composite monoliths were names as PHC-x, where x is designating the CNC loading rate.
Post-Polymerization Functionalization of the polyHIPEs Post-polymerization functionalization of the polyHIPEs was achieved by reacting epoxy groups of the GMA units existing on polymer chains with PIAL in mild reaction conditions. For this purpose, certain amount of polyHIPE monolith sample was cut into pieces, powdered, and placed in a 50 mL round bottom two-necked reactor equipped with a condenser. Then, 20 ml of DMF was added to swell the polyHIPE sample before the reaction. After 30 min, cer-tain amount of PIAL corresponding to the 20% of the the-oretical epoxy group content of the monolith sample was dissolved in 10 mL of DMF and added to the reactor and the temperature was increased up to 80 oC. The reaction was continued for 24 h under constant stirring at 300 rpm. In the end, functionalized polyHIPE monolith sample was filtered off and washed with DMF, ethanol and ethanol/wa-ter (1:1) mixture to remove the impurities. Then the sample was dried under vacuum at 50 oC for 48 h. The resulting functional polyHIPE monoliths were named as PHR-F and PHC-F. While PHR-F was derived from the neat polyHIPE monolith (PHR), PHC-F was derived from the polyHIPE/CNC composite monolith containing 1 wt % of CNC.
Metal Removal of MonolithsCr (III) metal adsorption capacity of polyHIPE/CNC com-posite monoliths in diluted acid solutions were determined under competitive conditions with neat polyHIPE mono-lith in batch experiments. For increasing adsorption ca-pacity, 0.2 g of the neat polyHIPE monolith and polyHIPE/CNC composite monoliths were placed in aqueous Cr(III) solution. At specific time intervals, polyHIPE monoliths were filtered and the Cr(III) concentrations of the remain-ing solutions were investigated by Atomic Absroption Spec-trometer (AAS).
CharacterizationThe pore morphology of the neat polyHIPE monolith and polyHIPE/CNC composite monoliths was investigated by scanning electron microscopy (SEM). For this purpose, all samples were coated by gold prior to analysis. While SEM images of the neat polyHIPE monolith was record-ed by using FEI Inc., Inspect S50 model microscope, the morphology of polyHIPE/CNC composite monoliths were determined by using EDAX Philips XL-30 microscope. Av-erage cavity size (CS) of the monoliths were calculated with the help of SEM images. In this respect, dimension of at least 50 cavities for each sample were measured from the corresponding SEM image and multiplied with a correction factor of (2/31/2) [29]. Then the arithmetic average and stan-dard error were also calculated.
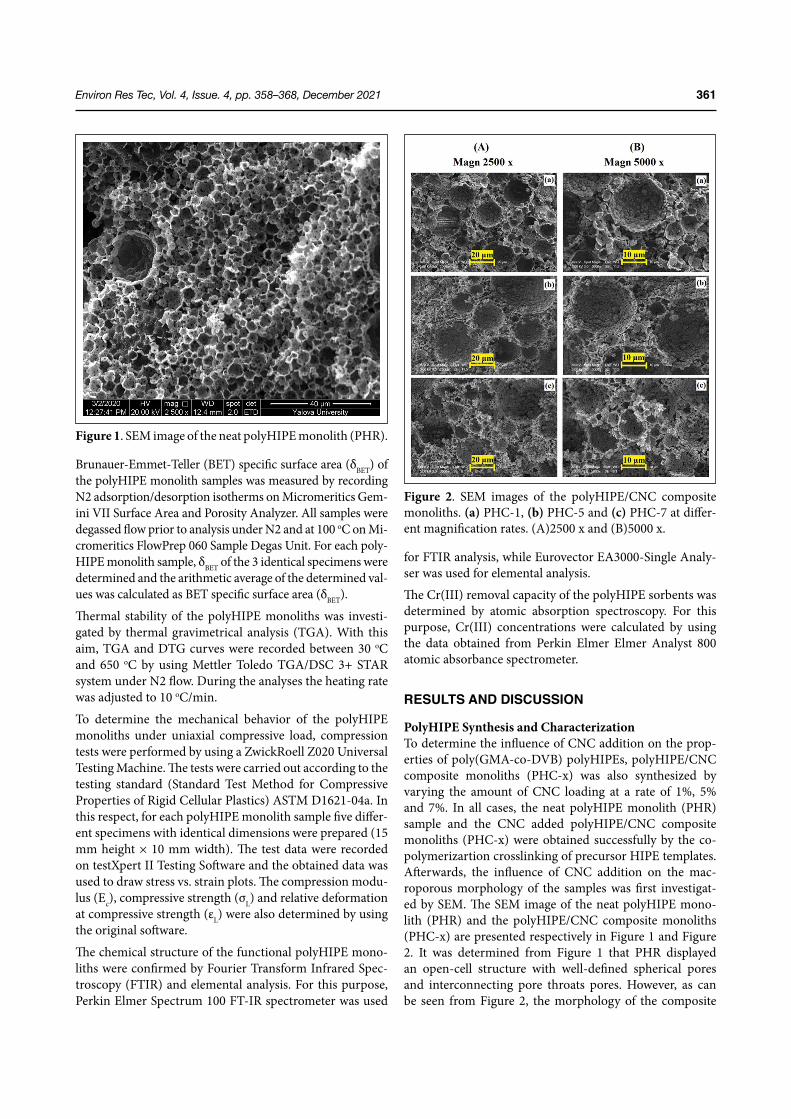
Environ Res Tec, Vol. 4, Issue. 4, pp. 358–368, December 2021 361
Brunauer-Emmet-Teller (BET) specific surface area (δBET) of the polyHIPE monolith samples was measured by recording N2 adsorption/desorption isotherms on Micromeritics Gem-ini VII Surface Area and Porosity Analyzer. All samples were degassed flow prior to analysis under N2 and at 100 oC on Mi-cromeritics FlowPrep 060 Sample Degas Unit. For each poly-HIPE monolith sample, δBET of the 3 identical specimens were determined and the arithmetic average of the determined val-ues was calculated as BET specific surface area (δBET).
Thermal stability of the polyHIPE monoliths was investi-gated by thermal gravimetrical analysis (TGA). With this aim, TGA and DTG curves were recorded between 30 oC and 650 oC by using Mettler Toledo TGA/DSC 3+ STAR system under N2 flow. During the analyses the heating rate was adjusted to 10 oC/min.
To determine the mechanical behavior of the polyHIPE monoliths under uniaxial compressive load, compression tests were performed by using a ZwickRoell Z020 Universal Testing Machine. The tests were carried out according to the testing standard (Standard Test Method for Compressive Properties of Rigid Cellular Plastics) ASTM D1621-04a. In this respect, for each polyHIPE monolith sample five differ-ent specimens with identical dimensions were prepared (15 mm height × 10 mm width). The test data were recorded on testXpert II Testing Software and the obtained data was used to draw stress vs. strain plots. The compression modu-lus (Ec), compressive strength (σL) and relative deformation at compressive strength (εL) were also determined by using the original software.
The chemical structure of the functional polyHIPE mono-liths were confirmed by Fourier Transform Infrared Spec-troscopy (FTIR) and elemental analysis. For this purpose, Perkin Elmer Spectrum 100 FT-IR spectrometer was used
for FTIR analysis, while Eurovector EA3000-Single Analy-ser was used for elemental analysis.
The Cr(III) removal capacity of the polyHIPE sorbents was determined by atomic absorption spectroscopy. For this purpose, Cr(III) concentrations were calculated by using the data obtained from Perkin Elmer Elmer Analyst 800 atomic absorbance spectrometer.
RESULTS AND DISCUSSION
PolyHIPE Synthesis and CharacterizationTo determine the influence of CNC addition on the prop-erties of poly(GMA-co-DVB) polyHIPEs, polyHIPE/CNC composite monoliths (PHC-x) was also synthesized by varying the amount of CNC loading at a rate of 1%, 5% and 7%. In all cases, the neat polyHIPE monolith (PHR) sample and the CNC added polyHIPE/CNC composite monoliths (PHC-x) were obtained successfully by the co-polymerizartion crosslinking of precursor HIPE templates. Afterwards, the influence of CNC addition on the mac-roporous morphology of the samples was first investigat-ed by SEM. The SEM image of the neat polyHIPE mono-lith (PHR) and the polyHIPE/CNC composite monoliths (PHC-x) are presented respectively in Figure 1 and Figure 2. It was determined from Figure 1 that PHR displayed an open-cell structure with well-defined spherical pores and interconnecting pore throats pores. However, as can be seen from Figure 2, the morphology of the composite
Figure 1. SEM image of the neat polyHIPE monolith (PHR).
Figure 2. SEM images of the polyHIPE/CNC composite monoliths. (a) PHC-1, (b) PHC-5 and (c) PHC-7 at differ-ent magnification rates. (A)2500 x and (B)5000 x.
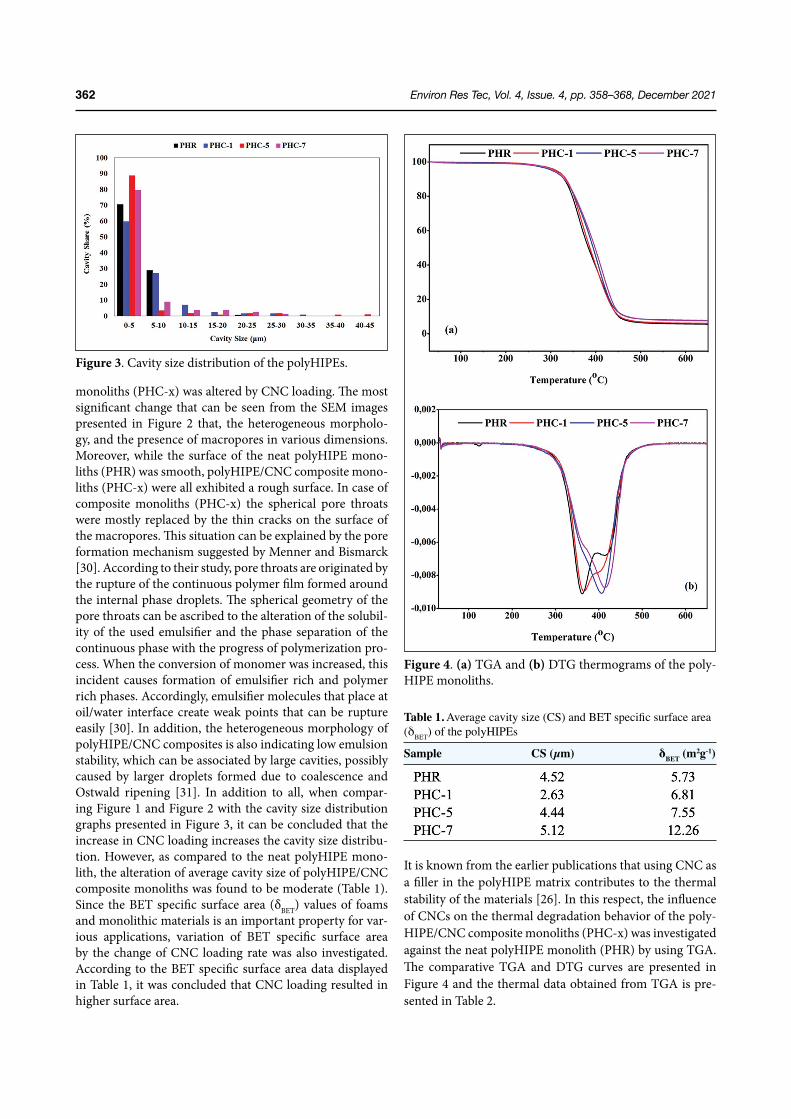
Environ Res Tec, Vol. 4, Issue. 4, pp. 358–368, December 2021362
monoliths (PHC-x) was altered by CNC loading. The most significant change that can be seen from the SEM images presented in Figure 2 that, the heterogeneous morpholo-gy, and the presence of macropores in various dimensions. Moreover, while the surface of the neat polyHIPE mono-liths (PHR) was smooth, polyHIPE/CNC composite mono-liths (PHC-x) were all exhibited a rough surface. In case of composite monoliths (PHC-x) the spherical pore throats were mostly replaced by the thin cracks on the surface of the macropores. This situation can be explained by the pore formation mechanism suggested by Menner and Bismarck [30]. According to their study, pore throats are originated by the rupture of the continuous polymer film formed around the internal phase droplets. The spherical geometry of the pore throats can be ascribed to the alteration of the solubil-ity of the used emulsifier and the phase separation of the continuous phase with the progress of polymerization pro-cess. When the conversion of monomer was increased, this incident causes formation of emulsifier rich and polymer rich phases. Accordingly, emulsifier molecules that place at oil/water interface create weak points that can be rupture easily [30]. In addition, the heterogeneous morphology of polyHIPE/CNC composites is also indicating low emulsion stability, which can be associated by large cavities, possibly caused by larger droplets formed due to coalescence and Ostwald ripening [31]. In addition to all, when compar-ing Figure 1 and Figure 2 with the cavity size distribution graphs presented in Figure 3, it can be concluded that the increase in CNC loading increases the cavity size distribu-tion. However, as compared to the neat polyHIPE mono-lith, the alteration of average cavity size of polyHIPE/CNC composite monoliths was found to be moderate (Table 1). Since the BET specific surface area (δBET) values of foams and monolithic materials is an important property for var-ious applications, variation of BET specific surface area by the change of CNC loading rate was also investigated. According to the BET specific surface area data displayed in Table 1, it was concluded that CNC loading resulted in higher surface area.
It is known from the earlier publications that using CNC as a filler in the polyHIPE matrix contributes to the thermal stability of the materials [26]. In this respect, the influence of CNCs on the thermal degradation behavior of the poly-HIPE/CNC composite monoliths (PHC-x) was investigated against the neat polyHIPE monolith (PHR) by using TGA. The comparative TGA and DTG curves are presented in Figure 4 and the thermal data obtained from TGA is pre-sented in Table 2.
Figure 3. Cavity size distribution of the polyHIPEs.
Figure 4. (a) TGA and (b) DTG thermograms of the poly-HIPE monoliths.
Table 1. Average cavity size (CS) and BET specific surface area (δBET) of the polyHIPEs
Sample CS(µm) δBET (m2g-1)
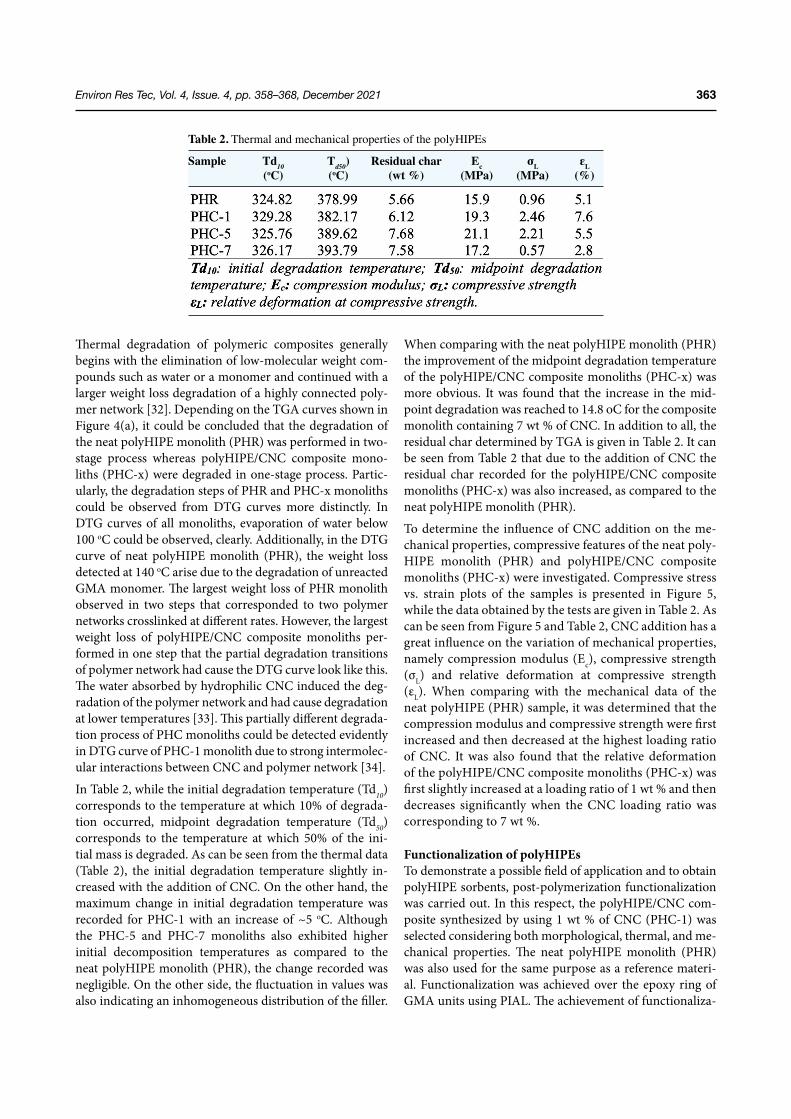
Environ Res Tec, Vol. 4, Issue. 4, pp. 358–368, December 2021 363
Thermal degradation of polymeric composites generally begins with the elimination of low-molecular weight com-pounds such as water or a monomer and continued with a larger weight loss degradation of a highly connected poly-mer network [32]. Depending on the TGA curves shown in Figure 4(a), it could be concluded that the degradation of the neat polyHIPE monolith (PHR) was performed in two-stage process whereas polyHIPE/CNC composite mono-liths (PHC-x) were degraded in one-stage process. Partic-ularly, the degradation steps of PHR and PHC-x monoliths could be observed from DTG curves more distinctly. In DTG curves of all monoliths, evaporation of water below 100 oC could be observed, clearly. Additionally, in the DTG curve of neat polyHIPE monolith (PHR), the weight loss detected at 140 oC arise due to the degradation of unreacted GMA monomer. The largest weight loss of PHR monolith observed in two steps that corresponded to two polymer networks crosslinked at different rates. However, the largest weight loss of polyHIPE/CNC composite monoliths per-formed in one step that the partial degradation transitions of polymer network had cause the DTG curve look like this. The water absorbed by hydrophilic CNC induced the deg-radation of the polymer network and had cause degradation at lower temperatures [33]. This partially different degrada-tion process of PHC monoliths could be detected evidently in DTG curve of PHC-1 monolith due to strong intermolec-ular interactions between CNC and polymer network [34].
In Table 2, while the initial degradation temperature (Td10) corresponds to the temperature at which 10% of degrada-tion occurred, midpoint degradation temperature (Td50) corresponds to the temperature at which 50% of the ini-tial mass is degraded. As can be seen from the thermal data (Table 2), the initial degradation temperature slightly in-creased with the addition of CNC. On the other hand, the maximum change in initial degradation temperature was recorded for PHC-1 with an increase of ~5 oC. Although the PHC-5 and PHC-7 monoliths also exhibited higher initial decomposition temperatures as compared to the neat polyHIPE monolith (PHR), the change recorded was negligible. On the other side, the fluctuation in values was also indicating an inhomogeneous distribution of the filler.
When comparing with the neat polyHIPE monolith (PHR) the improvement of the midpoint degradation temperature of the polyHIPE/CNC composite monoliths (PHC-x) was more obvious. It was found that the increase in the mid-point degradation was reached to 14.8 oC for the composite monolith containing 7 wt % of CNC. In addition to all, the residual char determined by TGA is given in Table 2. It can be seen from Table 2 that due to the addition of CNC the residual char recorded for the polyHIPE/CNC composite monoliths (PHC-x) was also increased, as compared to the neat polyHIPE monolith (PHR).
To determine the influence of CNC addition on the me-chanical properties, compressive features of the neat poly-HIPE monolith (PHR) and polyHIPE/CNC composite monoliths (PHC-x) were investigated. Compressive stress vs. strain plots of the samples is presented in Figure 5, while the data obtained by the tests are given in Table 2. As can be seen from Figure 5 and Table 2, CNC addition has a great influence on the variation of mechanical properties, namely compression modulus (Ec), compressive strength (σL) and relative deformation at compressive strength (εL). When comparing with the mechanical data of the neat polyHIPE (PHR) sample, it was determined that the compression modulus and compressive strength were first increased and then decreased at the highest loading ratio of CNC. It was also found that the relative deformation of the polyHIPE/CNC composite monoliths (PHC-x) was first slightly increased at a loading ratio of 1 wt % and then decreases significantly when the CNC loading ratio was corresponding to 7 wt %.
Functionalization of polyHIPEsTo demonstrate a possible field of application and to obtain polyHIPE sorbents, post-polymerization functionalization was carried out. In this respect, the polyHIPE/CNC com-posite synthesized by using 1 wt % of CNC (PHC-1) was selected considering both morphological, thermal, and me-chanical properties. The neat polyHIPE monolith (PHR) was also used for the same purpose as a reference materi-al. Functionalization was achieved over the epoxy ring of GMA units using PIAL. The achievement of functionaliza-
Table 2. Thermal and mechanical properties of the polyHIPEs
Sample Td10 Td50) Residual char Ec σL εL (oC) (oC) (wt %) (MPa) (MPa) (%)
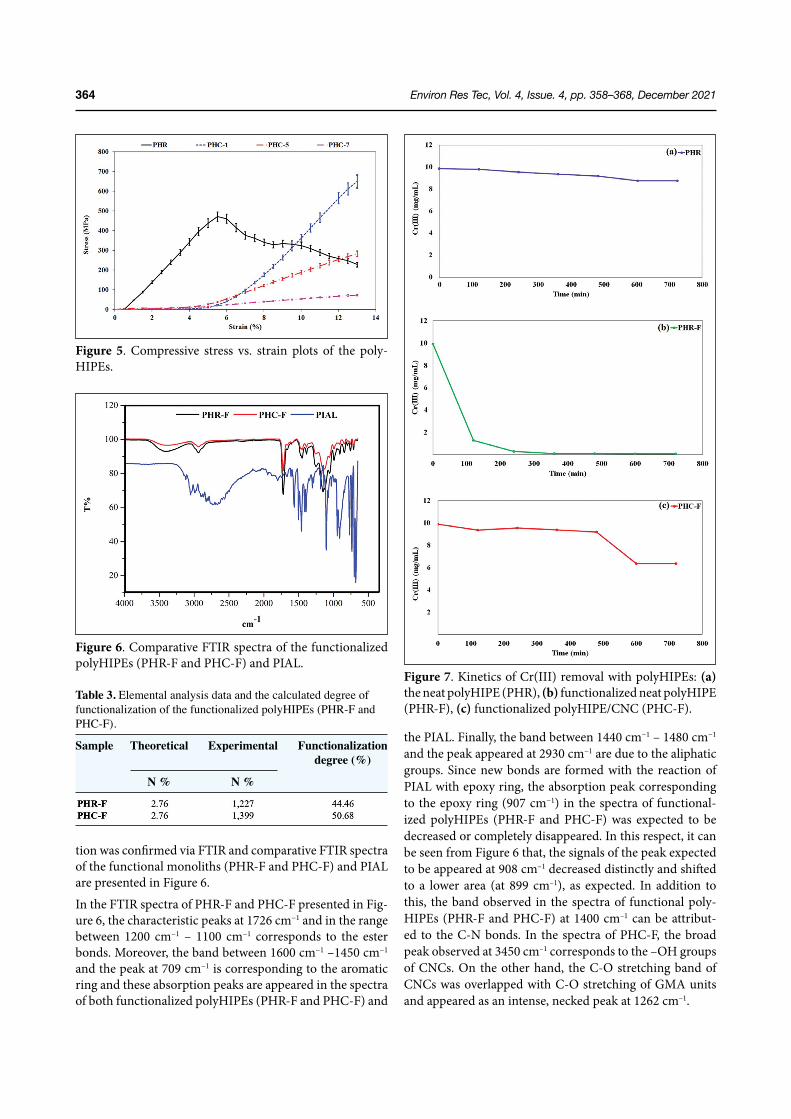
Environ Res Tec, Vol. 4, Issue. 4, pp. 358–368, December 2021364
tion was confirmed via FTIR and comparative FTIR spectra of the functional monoliths (PHR-F and PHC-F) and PIAL are presented in Figure 6.
In the FTIR spectra of PHR-F and PHC-F presented in Fig-ure 6, the characteristic peaks at 1726 cm−1 and in the range between 1200 cm−1 – 1100 cm−1 corresponds to the ester bonds. Moreover, the band between 1600 cm−1 –1450 cm−1 and the peak at 709 cm−1 is corresponding to the aromatic ring and these absorption peaks are appeared in the spectra of both functionalized polyHIPEs (PHR-F and PHC-F) and
the PIAL. Finally, the band between 1440 cm−1 – 1480 cm−1 and the peak appeared at 2930 cm−1 are due to the aliphatic groups. Since new bonds are formed with the reaction of PIAL with epoxy ring, the absorption peak corresponding to the epoxy ring (907 cm−1) in the spectra of functional-ized polyHIPEs (PHR-F and PHC-F) was expected to be decreased or completely disappeared. In this respect, it can be seen from Figure 6 that, the signals of the peak expected to be appeared at 908 cm–1 decreased distinctly and shifted to a lower area (at 899 cm–1), as expected. In addition to this, the band observed in the spectra of functional poly-HIPEs (PHR-F and PHC-F) at 1400 cm–1 can be attribut-ed to the C-N bonds. In the spectra of PHC-F, the broad peak observed at 3450 cm–1 corresponds to the –OH groups of CNCs. On the other hand, the C-O stretching band of CNCs was overlapped with C-O stretching of GMA units and appeared as an intense, necked peak at 1262 cm–1.
Figure 5. Compressive stress vs. strain plots of the poly-HIPEs.
Figure 7. Kinetics of Cr(III) removal with polyHIPEs: (a) the neat polyHIPE (PHR), (b) functionalized neat polyHIPE (PHR-F), (c) functionalized polyHIPE/CNC (PHC-F).
Figure 6. Comparative FTIR spectra of the functionalized polyHIPEs (PHR-F and PHC-F) and PIAL.
Table 3. Elemental analysis data and the calculated degree of functionalization of the functionalized polyHIPEs (PHR-F and PHC-F).
Sample Theoretical Experimental Functionalization degree (%)
N % N %
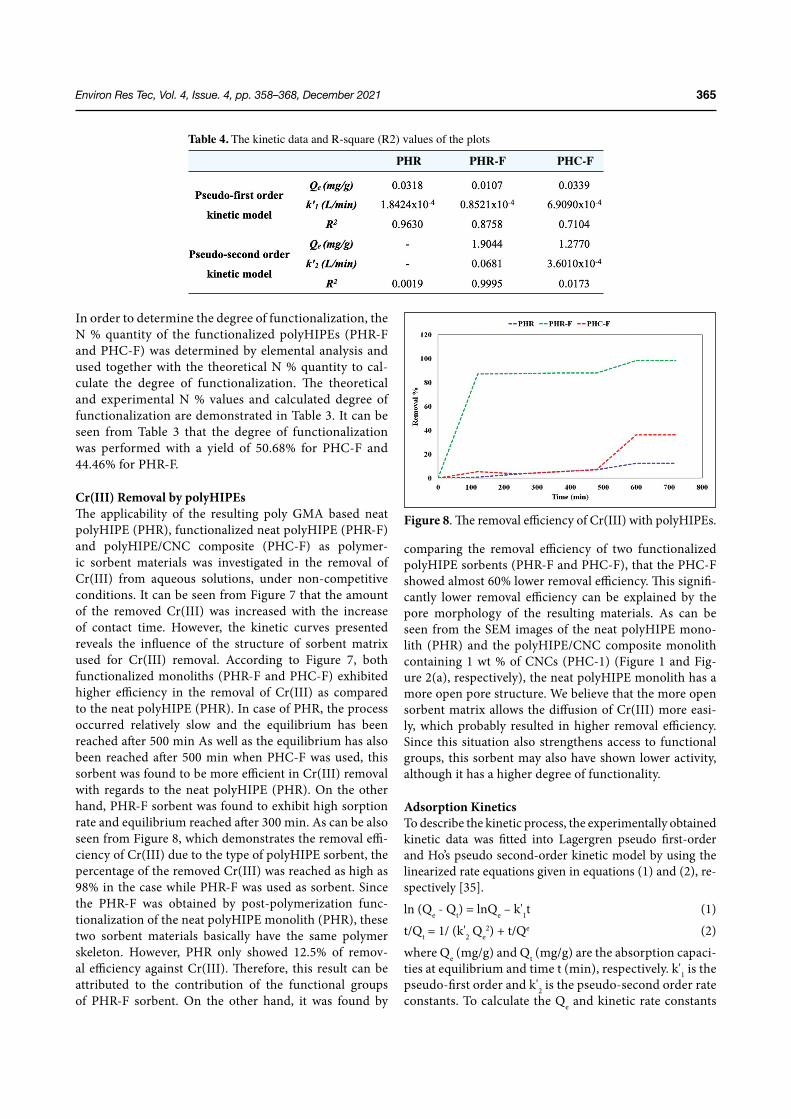
Environ Res Tec, Vol. 4, Issue. 4, pp. 358–368, December 2021 365
In order to determine the degree of functionalization, the N % quantity of the functionalized polyHIPEs (PHR-F and PHC-F) was determined by elemental analysis and used together with the theoretical N % quantity to cal-culate the degree of functionalization. The theoretical and experimental N % values and calculated degree of functionalization are demonstrated in Table 3. It can be seen from Table 3 that the degree of functionalization was performed with a yield of 50.68% for PHC-F and 44.46% for PHR-F.
Cr(III) Removal by polyHIPEsThe applicability of the resulting poly GMA based neat polyHIPE (PHR), functionalized neat polyHIPE (PHR-F) and polyHIPE/CNC composite (PHC-F) as polymer-ic sorbent materials was investigated in the removal of Cr(III) from aqueous solutions, under non-competitive conditions. It can be seen from Figure 7 that the amount of the removed Cr(III) was increased with the increase of contact time. However, the kinetic curves presented reveals the influence of the structure of sorbent matrix used for Cr(III) removal. According to Figure 7, both functionalized monoliths (PHR-F and PHC-F) exhibited higher efficiency in the removal of Cr(III) as compared to the neat polyHIPE (PHR). In case of PHR, the process occurred relatively slow and the equilibrium has been reached after 500 min As well as the equilibrium has also been reached after 500 min when PHC-F was used, this sorbent was found to be more efficient in Cr(III) removal with regards to the neat polyHIPE (PHR). On the other hand, PHR-F sorbent was found to exhibit high sorption rate and equilibrium reached after 300 min. As can be also seen from Figure 8, which demonstrates the removal effi-ciency of Cr(III) due to the type of polyHIPE sorbent, the percentage of the removed Cr(III) was reached as high as 98% in the case while PHR-F was used as sorbent. Since the PHR-F was obtained by post-polymerization func-tionalization of the neat polyHIPE monolith (PHR), these two sorbent materials basically have the same polymer skeleton. However, PHR only showed 12.5% of remov-al efficiency against Cr(III). Therefore, this result can be attributed to the contribution of the functional groups of PHR-F sorbent. On the other hand, it was found by
comparing the removal efficiency of two functionalized polyHIPE sorbents (PHR-F and PHC-F), that the PHC-F showed almost 60% lower removal efficiency. This signifi-cantly lower removal efficiency can be explained by the pore morphology of the resulting materials. As can be seen from the SEM images of the neat polyHIPE mono-lith (PHR) and the polyHIPE/CNC composite monolith containing 1 wt % of CNCs (PHC-1) (Figure 1 and Fig-ure 2(a), respectively), the neat polyHIPE monolith has a more open pore structure. We believe that the more open sorbent matrix allows the diffusion of Cr(III) more easi-ly, which probably resulted in higher removal efficiency. Since this situation also strengthens access to functional groups, this sorbent may also have shown lower activity, although it has a higher degree of functionality.
Adsorption KineticsTo describe the kinetic process, the experimentally obtained kinetic data was fitted into Lagergren pseudo first-order and Ho’s pseudo second-order kinetic model by using the linearized rate equations given in equations (1) and (2), re-spectively [35].
ln (Qe - Qt) = lnQe – k'1t (1)
t/Qt = 1/ (k'2 Qe2) + t/Qe (2)
where Qe (mg/g) and Qt (mg/g) are the absorption capaci-ties at equilibrium and time t (min), respectively. k'1 is the pseudo-first order and k'2 is the pseudo-second order rate constants. To calculate the Qe and kinetic rate constants
Figure 8. The removal efficiency of Cr(III) with polyHIPEs.
Table 4. The kinetic data and R-square (R2) values of the plots
PHR PHR-F PHC-F
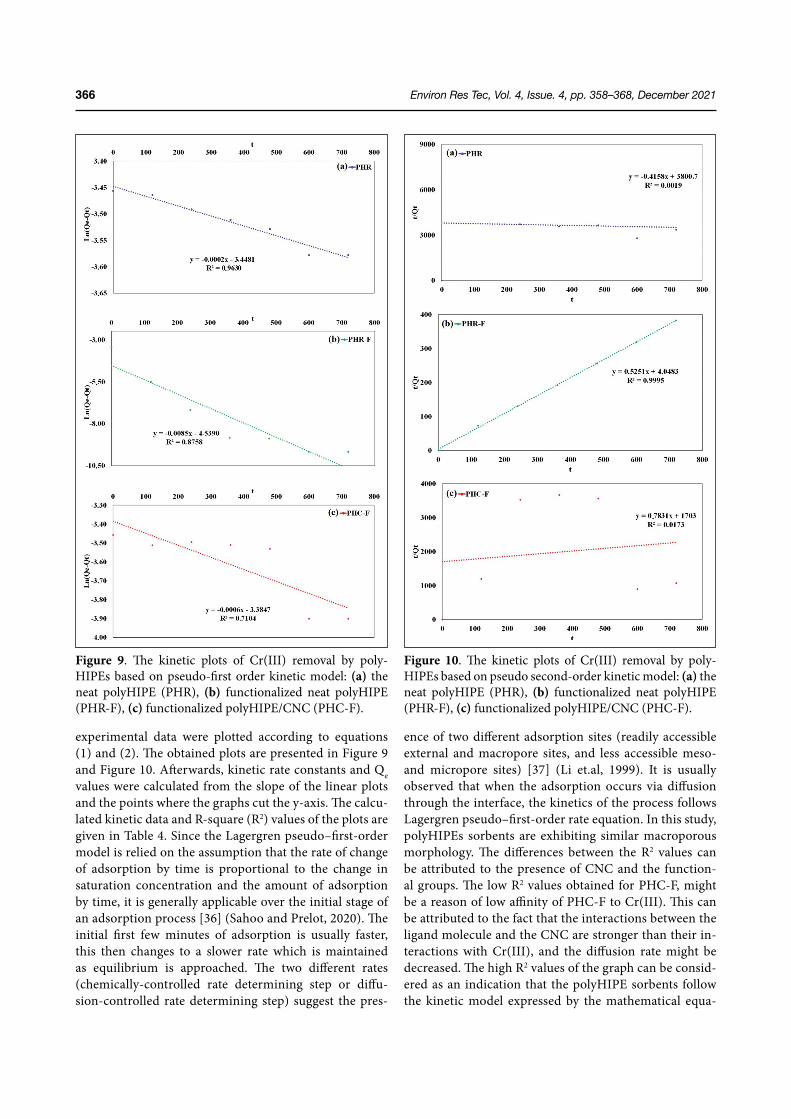
Environ Res Tec, Vol. 4, Issue. 4, pp. 358–368, December 2021366
experimental data were plotted according to equations (1) and (2). The obtained plots are presented in Figure 9 and Figure 10. Afterwards, kinetic rate constants and Qe values were calculated from the slope of the linear plots and the points where the graphs cut the y-axis. The calcu-lated kinetic data and R-square (R2) values of the plots are given in Table 4. Since the Lagergren pseudo–first-order model is relied on the assumption that the rate of change of adsorption by time is proportional to the change in saturation concentration and the amount of adsorption by time, it is generally applicable over the initial stage of an adsorption process [36] (Sahoo and Prelot, 2020). The initial first few minutes of adsorption is usually faster, this then changes to a slower rate which is maintained as equilibrium is approached. The two different rates (chemically-controlled rate determining step or diffu-sion-controlled rate determining step) suggest the pres-
ence of two different adsorption sites (readily accessible external and macropore sites, and less accessible meso- and micropore sites) [37] (Li et.al, 1999). It is usually observed that when the adsorption occurs via diffusion through the interface, the kinetics of the process follows Lagergren pseudo–first-order rate equation. In this study, polyHIPEs sorbents are exhibiting similar macroporous morphology. The differences between the R2 values can be attributed to the presence of CNC and the function-al groups. The low R2 values obtained for PHC-F, might be a reason of low affinity of PHC-F to Cr(III). This can be attributed to the fact that the interactions between the ligand molecule and the CNC are stronger than their in-teractions with Cr(III), and the diffusion rate might be decreased. The high R2 values of the graph can be consid-ered as an indication that the polyHIPE sorbents follow the kinetic model expressed by the mathematical equa-
Figure 9. The kinetic plots of Cr(III) removal by poly-HIPEs based on pseudo-first order kinetic model: (a) the neat polyHIPE (PHR), (b) functionalized neat polyHIPE (PHR-F), (c) functionalized polyHIPE/CNC (PHC-F).
Figure 10. The kinetic plots of Cr(III) removal by poly-HIPEs based on pseudo second-order kinetic model: (a) the neat polyHIPE (PHR), (b) functionalized neat polyHIPE (PHR-F), (c) functionalized polyHIPE/CNC (PHC-F).
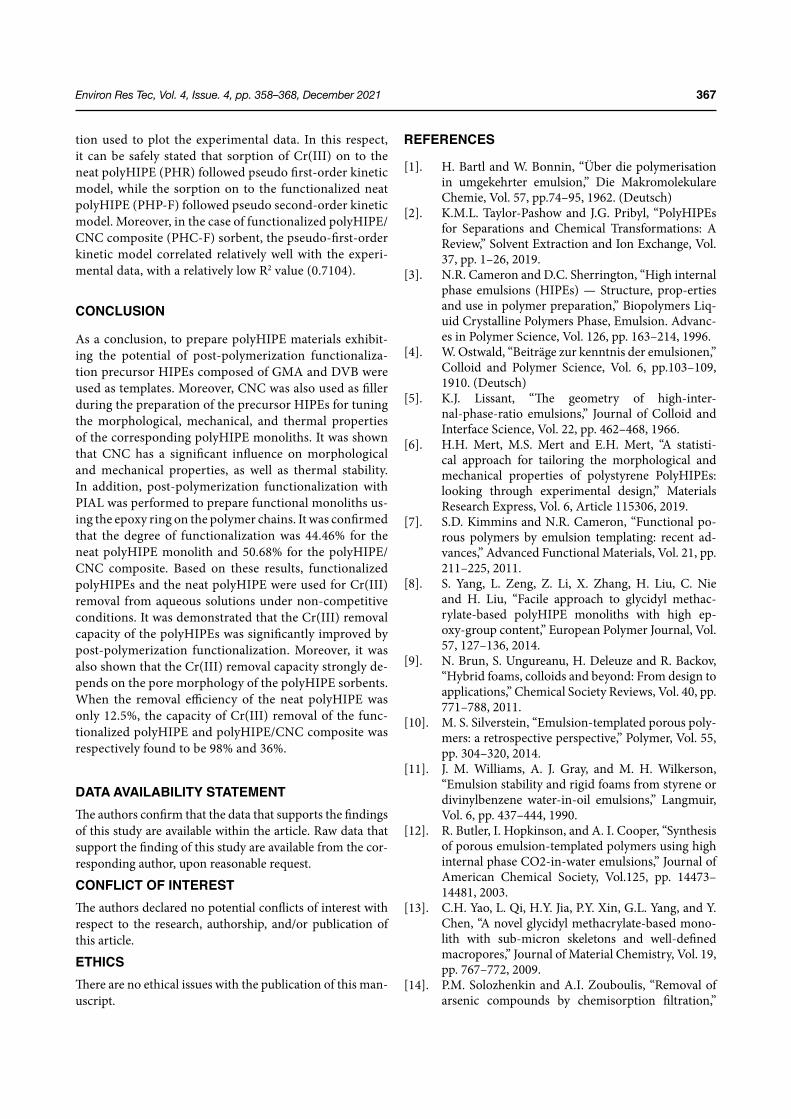
Environ Res Tec, Vol. 4, Issue. 4, pp. 358–368, December 2021 367
tion used to plot the experimental data. In this respect, it can be safely stated that sorption of Cr(III) on to the neat polyHIPE (PHR) followed pseudo first-order kinetic model, while the sorption on to the functionalized neat polyHIPE (PHP-F) followed pseudo second-order kinetic model. Moreover, in the case of functionalized polyHIPE/CNC composite (PHC-F) sorbent, the pseudo-first-order kinetic model correlated relatively well with the experi-mental data, with a relatively low R2 value (0.7104).
CONCLUSION
As a conclusion, to prepare polyHIPE materials exhibit-ing the potential of post-polymerization functionaliza-tion precursor HIPEs composed of GMA and DVB were used as templates. Moreover, CNC was also used as filler during the preparation of the precursor HIPEs for tuning the morphological, mechanical, and thermal properties of the corresponding polyHIPE monoliths. It was shown that CNC has a significant influence on morphological and mechanical properties, as well as thermal stability. In addition, post-polymerization functionalization with PIAL was performed to prepare functional monoliths us-ing the epoxy ring on the polymer chains. It was confirmed that the degree of functionalization was 44.46% for the neat polyHIPE monolith and 50.68% for the polyHIPE/CNC composite. Based on these results, functionalized polyHIPEs and the neat polyHIPE were used for Cr(III) removal from aqueous solutions under non-competitive conditions. It was demonstrated that the Cr(III) removal capacity of the polyHIPEs was significantly improved by post-polymerization functionalization. Moreover, it was also shown that the Cr(III) removal capacity strongly de-pends on the pore morphology of the polyHIPE sorbents. When the removal efficiency of the neat polyHIPE was only 12.5%, the capacity of Cr(III) removal of the func-tionalized polyHIPE and polyHIPE/CNC composite was respectively found to be 98% and 36%.
DATA AVAILABILITY STATEMENTThe authors confirm that the data that supports the findings of this study are available within the article. Raw data that support the finding of this study are available from the cor-responding author, upon reasonable request.
CONFLICT OF INTERESTThe authors declared no potential conflicts of interest with respect to the research, authorship, and/or publication of this article.
ETHICSThere are no ethical issues with the publication of this man-uscript.
REFERENCES
[1]. H. Bartl and W. Bonnin, “Über die polymerisation in umgekehrter emulsion,” Die Makromolekulare Chemie, Vol. 57, pp.74–95, 1962. (Deutsch)
[2]. K.M.L. Taylor-Pashow and J.G. Pribyl, “PolyHIPEs for Separations and Chemical Transformations: A Review,” Solvent Extraction and Ion Exchange, Vol. 37, pp. 1–26, 2019.
[3]. N.R. Cameron and D.C. Sherrington, “High internal phase emulsions (HIPEs) — Structure, prop-erties and use in polymer preparation,” Biopolymers Liq-uid Crystalline Polymers Phase, Emulsion. Advanc-es in Polymer Science, Vol. 126, pp. 163–214, 1996.
[4]. W. Ostwald, “Beiträge zur kenntnis der emulsionen,” Colloid and Polymer Science, Vol. 6, pp.103–109, 1910. (Deutsch)
[5]. K.J. Lissant, “The geometry of high-inter-nal-phase-ratio emulsions,” Journal of Colloid and Interface Science, Vol. 22, pp. 462–468, 1966.
[6]. H.H. Mert, M.S. Mert and E.H. Mert, “A statisti-cal approach for tailoring the morphological and mechanical properties of polystyrene PolyHIPEs: looking through experimental design,” Materials Research Express, Vol. 6, Article 115306, 2019.
[7]. S.D. Kimmins and N.R. Cameron, “Functional po-rous polymers by emulsion templating: recent ad-vances,” Advanced Functional Materials, Vol. 21, pp. 211–225, 2011.
[8]. S. Yang, L. Zeng, Z. Li, X. Zhang, H. Liu, C. Nie and H. Liu, “Facile approach to glycidyl methac-rylate-based polyHIPE monoliths with high ep-oxy-group content,” European Polymer Journal, Vol. 57, 127–136, 2014.
[9]. N. Brun, S. Ungureanu, H. Deleuze and R. Backov, “Hybrid foams, colloids and beyond: From design to applications,” Chemical Society Reviews, Vol. 40, pp. 771–788, 2011.
[10]. M. S. Silverstein, “Emulsion-templated porous poly-mers: a retrospective perspective,” Polymer, Vol. 55, pp. 304–320, 2014.
[11]. J. M. Williams, A. J. Gray, and M. H. Wilkerson, “Emulsion stability and rigid foams from styrene or divinylbenzene water-in-oil emulsions,” Langmuir, Vol. 6, pp. 437–444, 1990.
[12]. R. Butler, I. Hopkinson, and A. I. Cooper, “Synthesis of porous emulsion-templated polymers using high internal phase CO2-in-water emulsions,” Journal of American Chemical Society, Vol.125, pp. 14473–14481, 2003.
[13]. C.H. Yao, L. Qi, H.Y. Jia, P.Y. Xin, G.L. Yang, and Y. Chen, “A novel glycidyl methacrylate-based mono-lith with sub-micron skeletons and well-defined macropores,” Journal of Material Chemistry, Vol. 19, pp. 767–772, 2009.
[14]. P.M. Solozhenkin and A.I. Zouboulis, “Removal of arsenic compounds by chemisorption filtration,”
Environ Res Tec, Vol. 4, Issue. 4, pp. 358–368, December 2021368
Journal of Mining Science, Vol.43, pp. 212–220, 2007.
[15]. S. De and A. Khan, “Efficient synthesis of multifunc-tional polymers via thiol–epoxy “click” chemistry,” Chemical Communications, Vol. 48, pp. 3130–3132, 2012.
[16]. A. Brändle, A. Khan, Thiol–epoxy ‘click’ polymer-ization: efficient construction of reactive and func-tional polymers,” Polymer Chemistry, Vol. 3, pp. 3224–3227, 2012.
[17]. I. Gadwal and A. Khan, “Protecting-group-free synthesis of chain-end multifunctional polymers by combining ATRP with thiol–epoxy ‘click’ chem-istry,” Polymer Chemistry, Vol. 4, pp. 2440–2444, 2013.
[18]. H. Gao, M. Elsabahy, E. V. Giger, D. Li, R. E. Prud’homme, and J.-C. Leroux, “Aminated linear and star-shape poly(glycerol methacrylate)s: synthe-sis and self-assembling properties,” Biomacromole-cules, Vol. 11, pp. 889–895, 2010.
[19]. F. J. Xu, M. Y. Chai, W. B. Li, Y. Ping, G. P. Tang, W. T. Yang, J. Ma and F. S. Liu, “Well-defined poly(2-hy-droxyl-3-(2-hydroxyethylamino)propyl methacry-late) vectors with low toxicity and high gene trans-fection efficiency,” biomacromolecules, Vol.11, pp. 1437–1442, 2010.
[20]. P. Krajnc, N. Leber, D. Štefanec, S. Kontrec, and A. Podgornik, “Preparation and characterisation of poly(high internal phase emulsion) methacrylate monoliths and their application as separation me-dia,” Journal of Chromatography A, Vol. 1065, pp. 69–73, 2005.
[21]. D. Pahnovik, J. Majer, E. Zagar, S. Kovacic, “Synthes-ris of hydrogel polyHIPEs from functionalized gly-cidyl methacrylate,” Polymer Chemistry, Vol. 7, pp. 5132–5138, 2016.
[22]. E. H. Mert, M. A., Kaya, and H. Yıldırım, “Prepa-ration and characterization of polyester–glycidyl methacrylate polyHIPE monoliths to use in heavy metal removal: Functional polyHIPE monoliths as metal sorbent,” Designed Monomers and Polymers, Vol. 15, pp. 113–126, 2012.
[23]. E. H. Mert and H. Yıldırım, “Porous functional poly(unsaturated polyester-co-glycidyl methacry-late-co-divinylbenzene) polyHIPE beads through w/o/w multiple emulsions: preparation, character-ization and application”, E-Polymers, Vol. 14, pp. 65–73, 2014.
[24]. S. Yang, L. Zeng, Y. Wang, X. Sun, P. Sun, H. Liu, C. Nie, and H. Liu, “Facile approach to glycidyl meth-acrylate-based polyHIPE monoliths with high ep-oxy-group content,” Colloid and Polymer Science, Vol. 292, 2563–2570, 2014.
[25]. S. Yang, Y. Wang, Y. Jia, X. Sun, P. Sun, Y. Qin, R. Li, H. Liu, and C. Nie, “Tailoring the morphology and epoxy group content of glycidylmethacrylate-based polyHIPE monoliths via radiation-inducedpolym-
erization at room temperature,” Colloid and Poly-mer Science, Vol. 296, pp. 1005–1016, 2018.
[26]. H.H. Mert, M.R. Moghbeli, S. Sajad and E.H. Mert, “Functionalized cellulose nanocrytals (fCNCs) reinforced PolyHIPEs: Tailoring morphological, mechanical and thermal properties,” Reactive and Functional Polymers, Vol. 151, 104572, 2020.
[27]. L. Jin, Q. Sun, Q. Xu, and Y. Xu, “Adsorptive removal of anionic dyes from aqueous solutions using mi-crogel based on nanocellulose and polyvinylamine,” Bioresource Technology, Vol. 197, pp. 348-355, 2015.
[28]. H. Qiao, Y. Zhou, F. Yu, E. Wang, Y. Min, Q. Huang, L. Pang and T. Ma, “Effective removal of cation-ic dyes using carboxylate-functionalized cellulose nanocrystals,” Chemosphere, Vol. 141, pp. 297-303, 2015.
[29]. A. Barbetta and N.R. Cameron, “Morphology and surface area of emulsion-derived (polyHIPE) solid foams prepared with oil-phase soluble porogenic solvents: span 80 as surfactant,” Macromolecules, Vol. 37, pp. 3188–3201, 2004.
[30]. A. Menner and A. Bismarck, “New evidence for the mechanism of the pore formation in polymerising high internal phase emulsions or why polyHIPEs have an interconnected pore network structure,” Macromolecular Symposia, Vol. 242, pp. 19–24, 2006.
[31]. R.J. Carnachan, M. Bokhari, S.A. Przyborskibc and N.R. Cameron, “Tailoring the morphology of emul-sion-templated porous polymers,” Soft Matter, Vol. 2, pp. 608–616, 2006.
[32]. E. Lizundia, J.L.Vilas and L.M. León, “Crystalliza-tion, structural relaxation and thermal degradation in Poly (L-lactide)/cellulose nanocrystal renewable nanocomposites,” Carbohydrate Polymers, Vol. 123, pp. 256–265, 2015.
[33]. F.J. Kilzer and A. Broido, “Speculations on the na-ture of cellulose pyrolysis,” Pyrodynamics, Vol. 2, pp. 151–163, 1965.
[34]. S. Maiti, J. Jayaramudu, K. Das, S.M. Reddy, R. Sadi-ku, S.S. Ray and D. Liu, “Preparation and characteri-zation of nano-cellulose with new shape from differ-ent precursor,” Carbohydrate Polymers, Vol. 98, pp. 562–567, 2013.
[35]. R. Elangovan, L. Philip and K. Chandraraj, “Bio-sorption of chromium species by aquatic weeds: Ki-netics and mechanism studies,” Journal of Hazard-ous Materials, Vol. 152, pp. 100–112, 2008.
[36]. T.R. Sahoo, B. Prelot, “Nanomaterials for the detec-tion and removal of wastewater pollutants,” Micro and Nano Technologie, pp. 161–222, 2020.
[37]. P.H.Y. Li, R.L. Bruce, M.D. Hobday, “A pseudo first order rate model for the adsorption of an organic adsorbate in aqueous solution,” Journal of Chemical Technology and Biotechnology, Vol. 74, pp. 55-59, 1999.
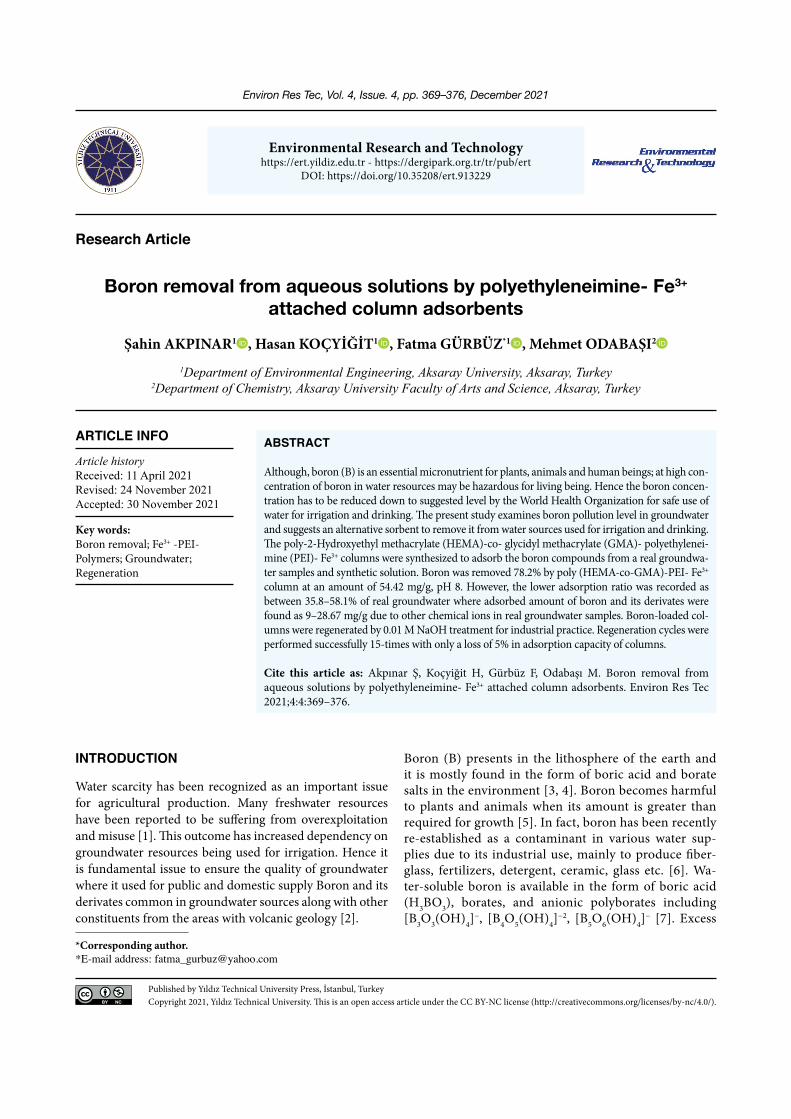
Boron removal from aqueous solutions by polyethyleneimine- Fe3+ attached column adsorbents
Environ Res Tec, Vol. 4, Issue. 4, pp. 369–376, December 2021
Environmental Research and Technologyhttps://ert.yildiz.edu.tr - https://dergipark.org.tr/tr/pub/ert
DOI: https://doi.org/10.35208/ert.913229
Research Article
Şahin AKPINAR1 , Hasan KOÇYİĞİT1 , Fatma GÜRBÜZ*1 , Mehmet ODABAŞI2
1Department of Environmental Engineering, Aksaray University, Aksaray, Turkey2Department of Chemistry, Aksaray University Faculty of Arts and Science, Aksaray, Turkey
*Corresponding author.*E-mail address: [email protected]
Published by Yıldız Technical University Press, İstanbul, TurkeyCopyright 2021, Yıldız Technical University. This is an open access article under the CC BY-NC license (http://creativecommons.org/licenses/by-nc/4.0/).
ARTICLE INFO
Article historyReceived: 11 April 2021Revised: 24 November 2021Accepted: 30 November 2021
Key words:Boron removal; Fe3+ -PEI-Polymers; Groundwater; Regeneration
ABSTRACT
Although, boron (B) is an essential micronutrient for plants, animals and human beings; at high con-centration of boron in water resources may be hazardous for living being. Hence the boron concen-tration has to be reduced down to suggested level by the World Health Organization for safe use of water for irrigation and drinking. The present study examines boron pollution level in groundwater and suggests an alternative sorbent to remove it from water sources used for irrigation and drinking. The poly-2-Hydroxyethyl methacrylate (HEMA)-co- glycidyl methacrylate (GMA)- polyethylenei-mine (PEI)- Fe3+ columns were synthesized to adsorb the boron compounds from a real groundwa-ter samples and synthetic solution. Boron was removed 78.2% by poly (HEMA-co-GMA)-PEI- Fe3+ column at an amount of 54.42 mg/g, pH 8. However, the lower adsorption ratio was recorded as between 35.8–58.1% of real groundwater where adsorbed amount of boron and its derivates were found as 9–28.67 mg/g due to other chemical ions in real groundwater samples. Boron-loaded col-umns were regenerated by 0.01 M NaOH treatment for industrial practice. Regeneration cycles were performed successfully 15-times with only a loss of 5% in adsorption capacity of columns.
Cite this article as: Akpınar Ş, Koçyiğit H, Gürbüz F, Odabaşı M. Boron removal from aqueous solutions by polyethyleneimine- Fe3+ attached column adsorbents. Environ Res Tec 2021;4:4:369–376.
INTRODUCTION
Water scarcity has been recognized as an important issue for agricultural production. Many freshwater resources have been reported to be suffering from overexploitation and misuse [1]. This outcome has increased dependency on groundwater resources being used for irrigation. Hence it is fundamental issue to ensure the quality of groundwater where it used for public and domestic supply Boron and its derivates common in groundwater sources along with other constituents from the areas with volcanic geology [2].
Boron (B) presents in the lithosphere of the earth and it is mostly found in the form of boric acid and borate salts in the environment [3, 4]. Boron becomes harmful to plants and animals when its amount is greater than required for growth [5]. In fact, boron has been recently re-established as a contaminant in various water sup-plies due to its industrial use, mainly to produce fiber-glass, fertilizers, detergent, ceramic, glass etc. [6]. Wa-ter-soluble boron is available in the form of boric acid (H3BO3), borates, and anionic polyborates including [B3O3(OH)4]
−, [B4O5(OH)4]−2, [B5O6(OH)4]
− [7]. Excess
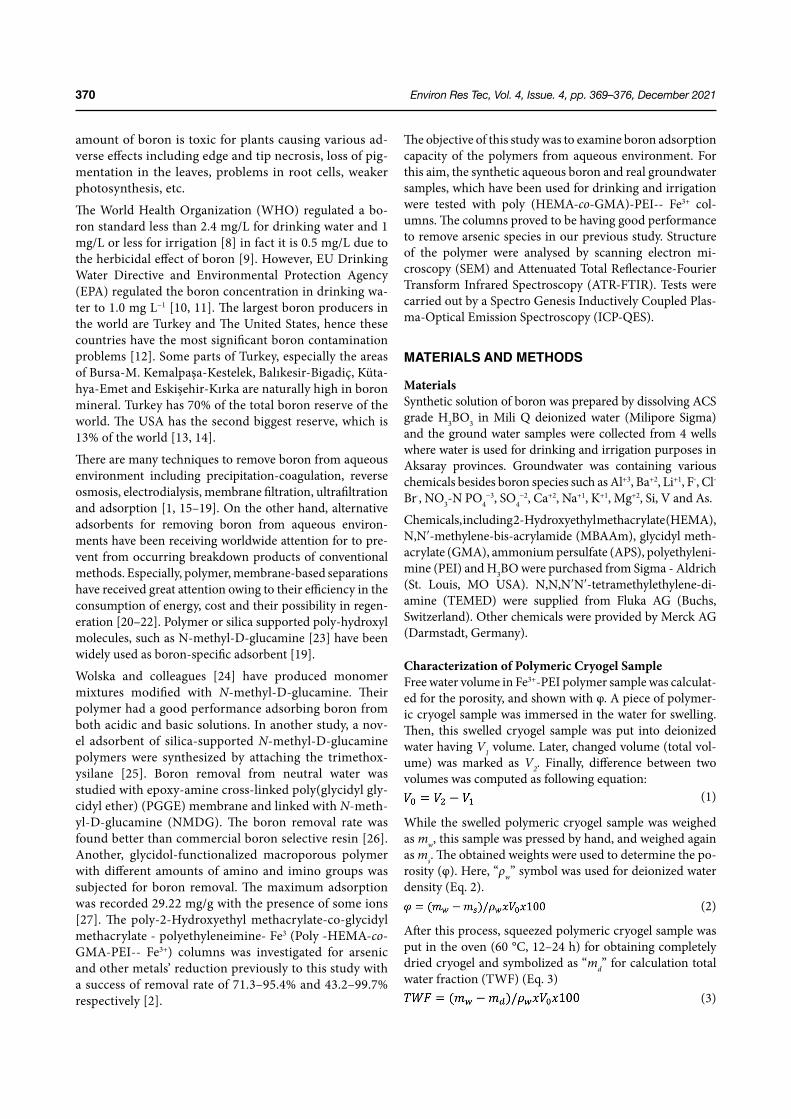
Environ Res Tec, Vol. 4, Issue. 4, pp. 369–376, December 2021370
amount of boron is toxic for plants causing various ad-verse effects including edge and tip necrosis, loss of pig-mentation in the leaves, problems in root cells, weaker photosynthesis, etc.
The World Health Organization (WHO) regulated a bo-ron standard less than 2.4 mg/L for drinking water and 1 mg/L or less for irrigation [8] in fact it is 0.5 mg/L due to the herbicidal effect of boron [9]. However, EU Drinking Water Directive and Environmental Protection Agency (EPA) regulated the boron concentration in drinking wa-ter to 1.0 mg L−1 [10, 11]. The largest boron producers in the world are Turkey and The United States, hence these countries have the most significant boron contamination problems [12]. Some parts of Turkey, especially the areas of Bursa-M. Kemalpaşa-Kestelek, Balıkesir-Bigadiç, Küta-hya-Emet and Eskişehir-Kırka are naturally high in boron mineral. Turkey has 70% of the total boron reserve of the world. The USA has the second biggest reserve, which is 13% of the world [13, 14].
There are many techniques to remove boron from aqueous environment including precipitation-coagulation, reverse osmosis, electrodialysis, membrane filtration, ultrafiltration and adsorption [1, 15–19]. On the other hand, alternative adsorbents for removing boron from aqueous environ-ments have been receiving worldwide attention for to pre-vent from occurring breakdown products of conventional methods. Especially, polymer, membrane-based separations have received great attention owing to their efficiency in the consumption of energy, cost and their possibility in regen-eration [20–22]. Polymer or silica supported poly-hydroxyl molecules, such as N-methyl-D-glucamine [23] have been widely used as boron-specific adsorbent [19].
Wolska and colleagues [24] have produced monomer mixtures modified with N-methyl-D-glucamine. Their polymer had a good performance adsorbing boron from both acidic and basic solutions. In another study, a nov-el adsorbent of silica-supported N-methyl-D-glucamine polymers were synthesized by attaching the trimethox-ysilane [25]. Boron removal from neutral water was studied with epoxy-amine cross-linked poly(glycidyl gly-cidyl ether) (PGGE) membrane and linked with N-meth-yl-D-glucamine (NMDG). The boron removal rate was found better than commercial boron selective resin [26]. Another, glycidol-functionalized macroporous polymer with different amounts of amino and imino groups was subjected for boron removal. The maximum adsorption was recorded 29.22 mg/g with the presence of some ions [27]. The poly-2-Hydroxyethyl methacrylate-co-glycidyl methacrylate - polyethyleneimine- Fe3 (Poly -HEMA-co-GMA-PEI-- Fe3+) columns was investigated for arsenic and other metals’ reduction previously to this study with a success of removal rate of 71.3–95.4% and 43.2–99.7% respectively [2].
The objective of this study was to examine boron adsorption capacity of the polymers from aqueous environment. For this aim, the synthetic aqueous boron and real groundwater samples, which have been used for drinking and irrigation were tested with poly (HEMA-co-GMA)-PEI-- Fe3+ col-umns. The columns proved to be having good performance to remove arsenic species in our previous study. Structure of the polymer were analysed by scanning electron mi-croscopy (SEM) and Attenuated Total Reflectance-Fourier Transform Infrared Spectroscopy (ATR-FTIR). Tests were carried out by a Spectro Genesis Inductively Coupled Plas-ma-Optical Emission Spectroscopy (ICP-QES).
MATERIALS AND METHODS
MaterialsSynthetic solution of boron was prepared by dissolving ACS grade H3BO3 in Mili Q deionized water (Milipore Sigma) and the ground water samples were collected from 4 wells where water is used for drinking and irrigation purposes in Aksaray provinces. Groundwater was containing various chemicals besides boron species such as Al+3, Ba+2, Li+1, F-, Cl- Br-, NO3-N PO4
−3, SO4−2, Ca+2, Na+1, K+1, Mg+2, Si, V and As.
Chemicals, including 2-Hydroxyethyl methacrylate (HEMA), N,N′-methylene-bis-acrylamide (MBAAm), glycidyl meth-acrylate (GMA), ammonium persulfate (APS), polyethyleni-mine (PEI) and H3BO were purchased from Sigma - Aldrich (St. Louis, MO USA). N,N,N′N′-tetramethylethylene-di-amine (TEMED) were supplied from Fluka AG (Buchs, Switzerland). Other chemicals were provided by Merck AG (Darmstadt, Germany).
Characterization of Polymeric Cryogel SampleFree water volume in Fe3+-PEI polymer sample was calculat-ed for the porosity, and shown with φ. A piece of polymer-ic cryogel sample was immersed in the water for swelling. Then, this swelled cryogel sample was put into deionized water having V1 volume. Later, changed volume (total vol-ume) was marked as V2. Finally, difference between two volumes was computed as following equation:
(1)
While the swelled polymeric cryogel sample was weighed as mw, this sample was pressed by hand, and weighed again as ms. The obtained weights were used to determine the po-rosity (φ). Here, “ρw” symbol was used for deionized water density (Eq. 2).
(2)
After this process, squeezed polymeric cryogel sample was put in the oven (60 °C, 12–24 h) for obtaining completely dried cryogel and symbolized as “md” for calculation total water fraction (TWF) (Eq. 3)
(3)
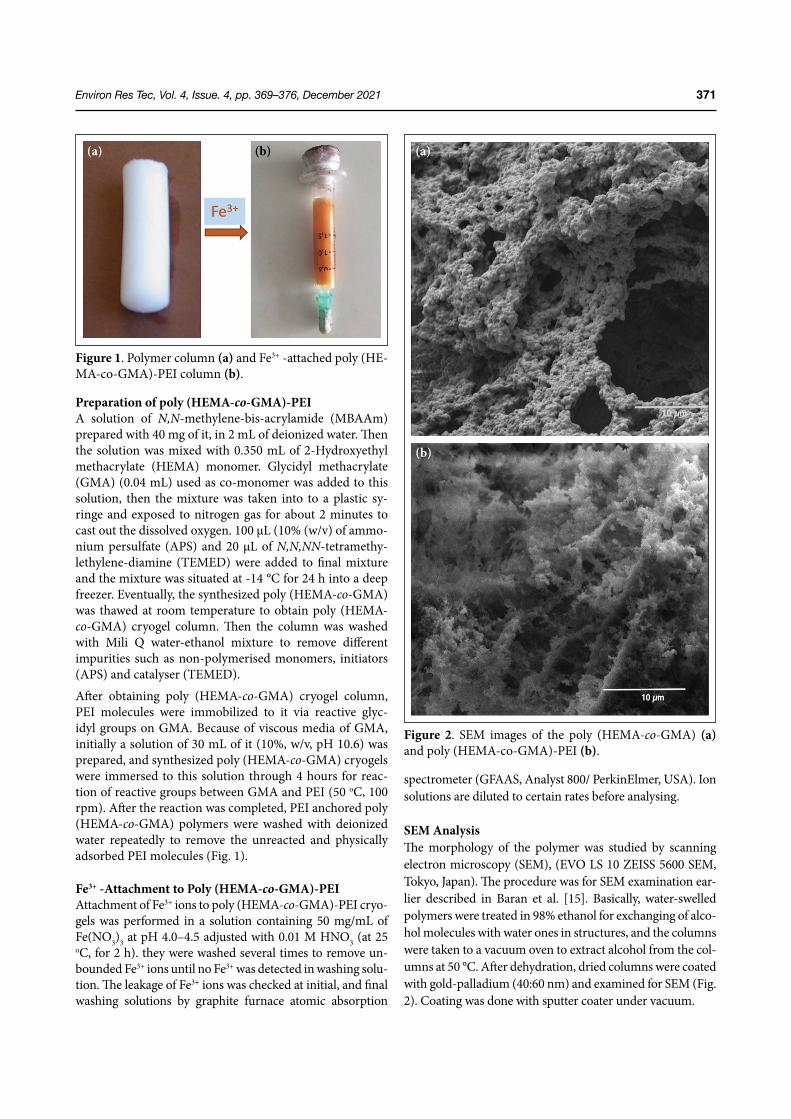
Environ Res Tec, Vol. 4, Issue. 4, pp. 369–376, December 2021 371
Preparation of poly (HEMA-co-GMA)-PEIA solution of N,N-methylene-bis-acrylamide (MBAAm) prepared with 40 mg of it, in 2 mL of deionized water. Then the solution was mixed with 0.350 mL of 2-Hydroxyethyl methacrylate (HEMA) monomer. Glycidyl methacrylate (GMA) (0.04 mL) used as co-monomer was added to this solution, then the mixture was taken into to a plastic sy-ringe and exposed to nitrogen gas for about 2 minutes to cast out the dissolved oxygen. 100 μL (10% (w/v) of ammo-nium persulfate (APS) and 20 μL of N,N,NN-tetramethy-lethylene-diamine (TEMED) were added to final mixture and the mixture was situated at -14 °C for 24 h into a deep freezer. Eventually, the synthesized poly (HEMA-co-GMA) was thawed at room temperature to obtain poly (HEMA-co-GMA) cryogel column. Then the column was washed with Mili Q water-ethanol mixture to remove different impurities such as non-polymerised monomers, initiators (APS) and catalyser (TEMED).
After obtaining poly (HEMA-co-GMA) cryogel column, PEI molecules were immobilized to it via reactive glyc-idyl groups on GMA. Because of viscous media of GMA, initially a solution of 30 mL of it (10%, w/v, pH 10.6) was prepared, and synthesized poly (HEMA-co-GMA) cryogels were immersed to this solution through 4 hours for reac-tion of reactive groups between GMA and PEI (50 oC, 100 rpm). After the reaction was completed, PEI anchored poly (HEMA-co-GMA) polymers were washed with deionized water repeatedly to remove the unreacted and physically adsorbed PEI molecules (Fig. 1).
Fe3+ -Attachment to Poly (HEMA-co-GMA)-PEI Attachment of Fe3+ ions to poly (HEMA-co-GMA)-PEI cryo-gels was performed in a solution containing 50 mg/mL of Fe(NO3)3 at pH 4.0–4.5 adjusted with 0.01 M HNO3 (at 25 oC, for 2 h). they were washed several times to remove un-bounded Fe3+ ions until no Fe3+ was detected in washing solu-tion. The leakage of Fe3+ ions was checked at initial, and final washing solutions by graphite furnace atomic absorption
spectrometer (GFAAS, Analyst 800/ PerkinElmer, USA). Ion solutions are diluted to certain rates before analysing.
SEM AnalysisThe morphology of the polymer was studied by scanning electron microscopy (SEM), (EVO LS 10 ZEISS 5600 SEM, Tokyo, Japan). The procedure was for SEM examination ear-lier described in Baran et al. [15]. Basically, water-swelled polymers were treated in 98% ethanol for exchanging of alco-hol molecules with water ones in structures, and the columns were taken to a vacuum oven to extract alcohol from the col-umns at 50 °C. After dehydration, dried columns were coated with gold-palladium (40:60 nm) and examined for SEM (Fig. 2). Coating was done with sputter coater under vacuum.
Figure 1. Polymer column (a) and Fe3+ -attached poly (HE-MA-co-GMA)-PEI column (b).
(a) (b)
Figure 2. SEM images of the poly (HEMA-co-GMA) (a) and poly (HEMA-co-GMA)-PEI (b).
(a)
(b)
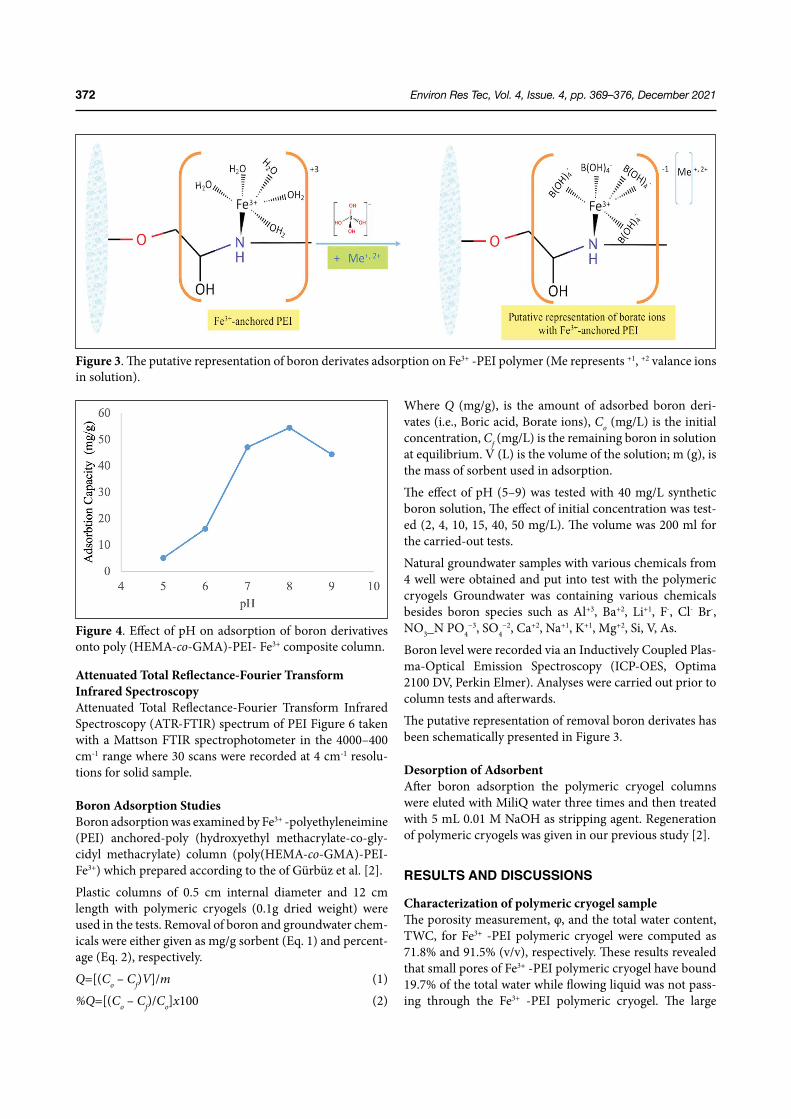
Environ Res Tec, Vol. 4, Issue. 4, pp. 369–376, December 2021372
Attenuated Total Reflectance-Fourier Transform Infrared SpectroscopyAttenuated Total Reflectance-Fourier Transform Infrared Spectroscopy (ATR-FTIR) spectrum of PEI Figure 6 taken with a Mattson FTIR spectrophotometer in the 4000–400 cm-1 range where 30 scans were recorded at 4 cm-1 resolu-tions for solid sample.
Boron Adsorption StudiesBoron adsorption was examined by Fe3+ -polyethyleneimine (PEI) anchored-poly (hydroxyethyl methacrylate-co-gly-cidyl methacrylate) column (poly(HEMA-co-GMA)-PEI- Fe3+) which prepared according to the of Gürbüz et al. [2].
Plastic columns of 0.5 cm internal diameter and 12 cm length with polymeric cryogels (0.1g dried weight) were used in the tests. Removal of boron and groundwater chem-icals were either given as mg/g sorbent (Eq. 1) and percent-age (Eq. 2), respectively.
Q=[(Co – Cf)V]/m (1)
%Q=[(Co – Cf)/Co]x100 (2)
Where Q (mg/g), is the amount of adsorbed boron deri-vates (i.e., Boric acid, Borate ions), Co (mg/L) is the initial concentration, Cf (mg/L) is the remaining boron in solution at equilibrium. V (L) is the volume of the solution; m (g), is the mass of sorbent used in adsorption.
The effect of pH (5–9) was tested with 40 mg/L synthetic boron solution, The effect of initial concentration was test-ed (2, 4, 10, 15, 40, 50 mg/L). The volume was 200 ml for the carried-out tests.
Natural groundwater samples with various chemicals from 4 well were obtained and put into test with the polymeric cryogels Groundwater was containing various chemicals besides boron species such as Al+3, Ba+2, Li+1, F-, Cl- Br-, NO3_N PO4
−3, SO4−2, Ca+2, Na+1, K+1, Mg+2, Si, V, As.
Boron level were recorded via an Inductively Coupled Plas-ma-Optical Emission Spectroscopy (ICP-OES, Optima 2100 DV, Perkin Elmer). Analyses were carried out prior to column tests and afterwards.
The putative representation of removal boron derivates has been schematically presented in Figure 3.
Desorption of AdsorbentAfter boron adsorption the polymeric cryogel columns were eluted with MiliQ water three times and then treated with 5 mL 0.01 M NaOH as stripping agent. Regeneration of polymeric cryogels was given in our previous study [2].
RESULTS AND DISCUSSIONS
Characterization of polymeric cryogel sampleThe porosity measurement, φ, and the total water content, TWC, for Fe3+ -PEI polymeric cryogel were computed as 71.8% and 91.5% (v/v), respectively. These results revealed that small pores of Fe3+ -PEI polymeric cryogel have bound 19.7% of the total water while flowing liquid was not pass-ing through the Fe3+ -PEI polymeric cryogel. The large
Figure 3. The putative representation of boron derivates adsorption on Fe3+ -PEI polymer (Me represents +1, +2 valance ions in solution).
Figure 4. Effect of pH on adsorption of boron derivatives onto poly (HEMA-co-GMA)-PEI- Fe3+ composite column.
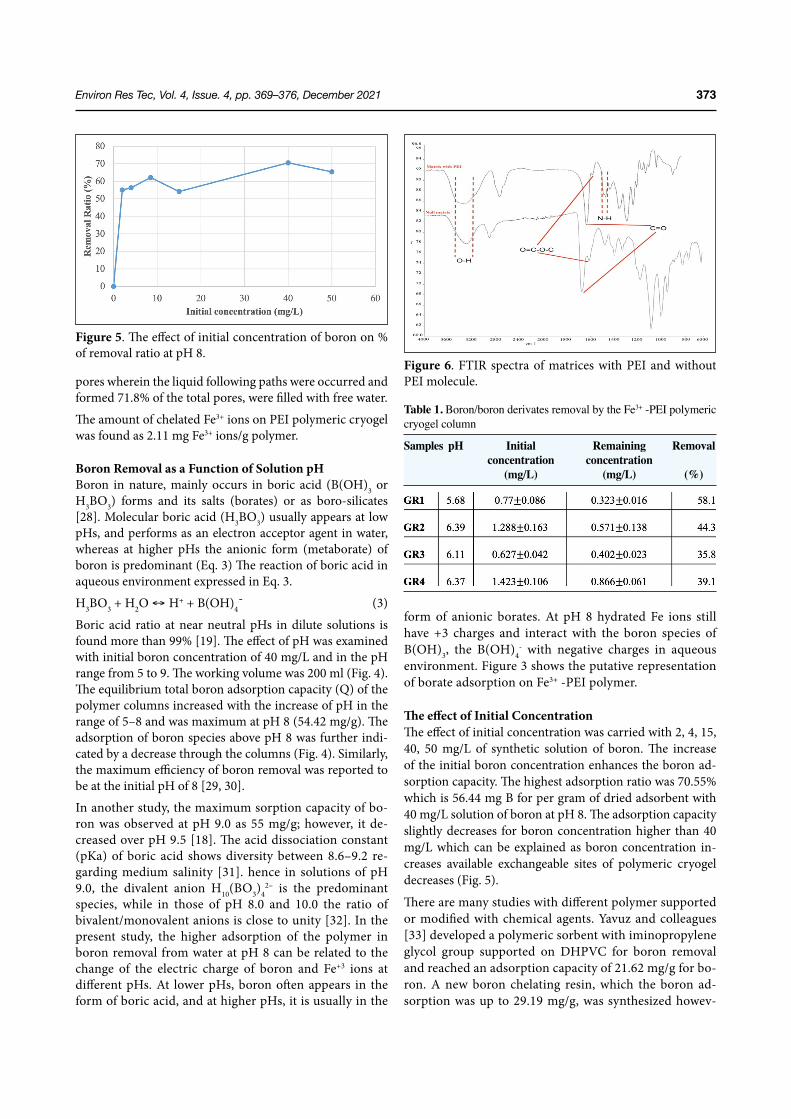
Environ Res Tec, Vol. 4, Issue. 4, pp. 369–376, December 2021 373
pores wherein the liquid following paths were occurred and formed 71.8% of the total pores, were filled with free water.
The amount of chelated Fe3+ ions on PEI polymeric cryogel was found as 2.11 mg Fe3+ ions/g polymer.
Boron Removal as a Function of Solution pHBoron in nature, mainly occurs in boric acid (B(OH)3 or H3BO3) forms and its salts (borates) or as boro-silicates [28]. Molecular boric acid (H3BO3) usually appears at low pHs, and performs as an electron acceptor agent in water, whereas at higher pHs the anionic form (metaborate) of boron is predominant (Eq. 3) The reaction of boric acid in aqueous environment expressed in Eq. 3.
H3BO3 + H2O ↔ H+ + B(OH)4¯ (3)
Boric acid ratio at near neutral pHs in dilute solutions is found more than 99% [19]. The effect of pH was examined with initial boron concentration of 40 mg/L and in the pH range from 5 to 9. The working volume was 200 ml (Fig. 4). The equilibrium total boron adsorption capacity (Q) of the polymer columns increased with the increase of pH in the range of 5–8 and was maximum at pH 8 (54.42 mg/g). The adsorption of boron species above pH 8 was further indi-cated by a decrease through the columns (Fig. 4). Similarly, the maximum efficiency of boron removal was reported to be at the initial pH of 8 [29, 30].
In another study, the maximum sorption capacity of bo-ron was observed at pH 9.0 as 55 mg/g; however, it de-creased over pH 9.5 [18]. The acid dissociation constant (pKa) of boric acid shows diversity between 8.6–9.2 re-garding medium salinity [31]. hence in solutions of pH 9.0, the divalent anion H10(BO3)4
2– is the predominant species, while in those of pH 8.0 and 10.0 the ratio of bivalent/monovalent anions is close to unity [32]. In the present study, the higher adsorption of the polymer in boron removal from water at pH 8 can be related to the change of the electric charge of boron and Fe+3 ions at different pHs. At lower pHs, boron often appears in the form of boric acid, and at higher pHs, it is usually in the
form of anionic borates. At pH 8 hydrated Fe ions still have +3 charges and interact with the boron species of B(OH)3, the B(OH)4
- with negative charges in aqueous environment. Figure 3 shows the putative representation of borate adsorption on Fe3+ -PEI polymer.
The effect of Initial ConcentrationThe effect of initial concentration was carried with 2, 4, 15, 40, 50 mg/L of synthetic solution of boron. The increase of the initial boron concentration enhances the boron ad-sorption capacity. The highest adsorption ratio was 70.55% which is 56.44 mg B for per gram of dried adsorbent with 40 mg/L solution of boron at pH 8. The adsorption capacity slightly decreases for boron concentration higher than 40 mg/L which can be explained as boron concentration in-creases available exchangeable sites of polymeric cryogel decreases (Fig. 5).
There are many studies with different polymer supported or modified with chemical agents. Yavuz and colleagues [33] developed a polymeric sorbent with iminopropylene glycol group supported on DHPVC for boron removal and reached an adsorption capacity of 21.62 mg/g for bo-ron. A new boron chelating resin, which the boron ad-sorption was up to 29.19 mg/g, was synthesized howev-
Figure 5. The effect of initial concentration of boron on % of removal ratio at pH 8.
Figure 6. FTIR spectra of matrices with PEI and without PEI molecule.
Table 1. Boron/boron derivates removal by the Fe3+ -PEI polymeric cryogel column
Samples pH Initial Remaining Removal concentration concentration (mg/L) (mg/L) (%)
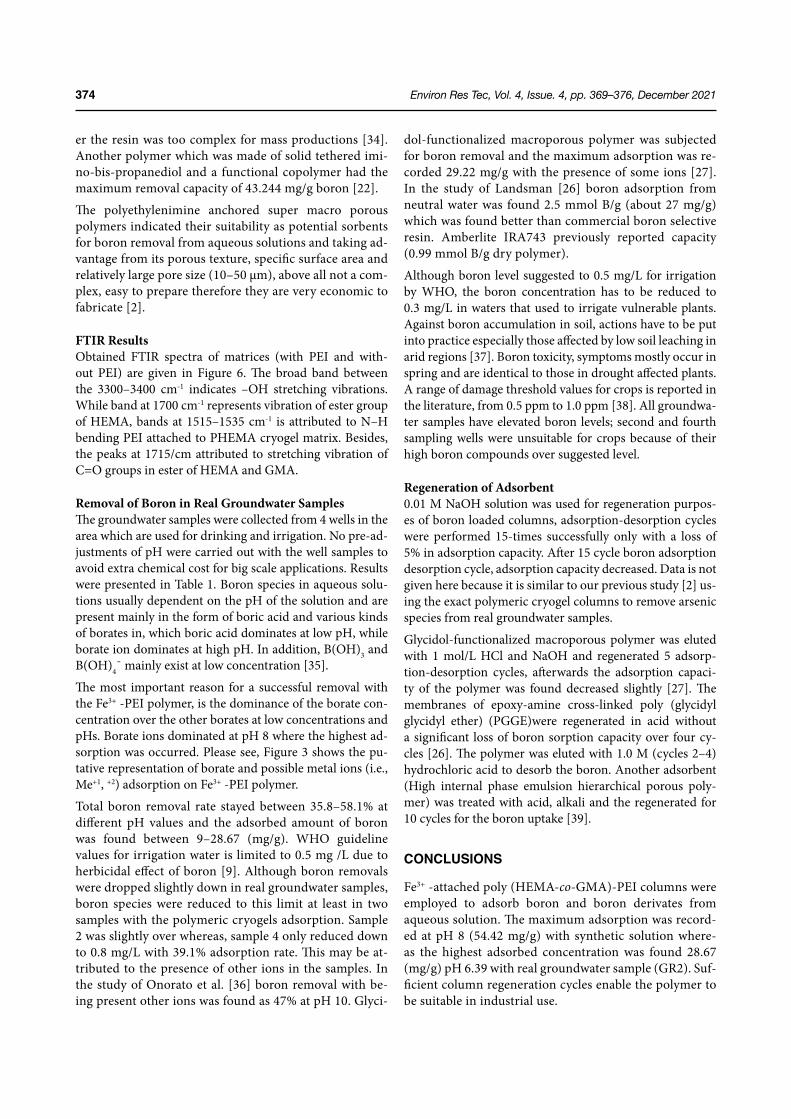
Environ Res Tec, Vol. 4, Issue. 4, pp. 369–376, December 2021374
er the resin was too complex for mass productions [34]. Another polymer which was made of solid tethered imi-no-bis-propanediol and a functional copolymer had the maximum removal capacity of 43.244 mg/g boron [22].
The polyethylenimine anchored super macro porous polymers indicated their suitability as potential sorbents for boron removal from aqueous solutions and taking ad-vantage from its porous texture, specific surface area and relatively large pore size (10–50 µm), above all not a com-plex, easy to prepare therefore they are very economic to fabricate [2].
FTIR ResultsObtained FTIR spectra of matrices (with PEI and with-out PEI) are given in Figure 6. The broad band between the 3300–3400 cm-1 indicates –OH stretching vibrations. While band at 1700 cm-1 represents vibration of ester group of HEMA, bands at 1515–1535 cm-1 is attributed to N–H bending PEI attached to PHEMA cryogel matrix. Besides, the peaks at 1715/cm attributed to stretching vibration of C=O groups in ester of HEMA and GMA.
Removal of Boron in Real Groundwater SamplesThe groundwater samples were collected from 4 wells in the area which are used for drinking and irrigation. No pre-ad-justments of pH were carried out with the well samples to avoid extra chemical cost for big scale applications. Results were presented in Table 1. Boron species in aqueous solu-tions usually dependent on the pH of the solution and are present mainly in the form of boric acid and various kinds of borates in, which boric acid dominates at low pH, while borate ion dominates at high pH. In addition, B(OH)3 and B(OH)4¯ mainly exist at low concentration [35].
The most important reason for a successful removal with the Fe3+ -PEI polymer, is the dominance of the borate con-centration over the other borates at low concentrations and pHs. Borate ions dominated at pH 8 where the highest ad-sorption was occurred. Please see, Figure 3 shows the pu-tative representation of borate and possible metal ions (i.e., Me+1, +2) adsorption on Fe3+ -PEI polymer.
Total boron removal rate stayed between 35.8–58.1% at different pH values and the adsorbed amount of boron was found between 9–28.67 (mg/g). WHO guideline values for irrigation water is limited to 0.5 mg /L due to herbicidal effect of boron [9]. Although boron removals were dropped slightly down in real groundwater samples, boron species were reduced to this limit at least in two samples with the polymeric cryogels adsorption. Sample 2 was slightly over whereas, sample 4 only reduced down to 0.8 mg/L with 39.1% adsorption rate. This may be at-tributed to the presence of other ions in the samples. In the study of Onorato et al. [36] boron removal with be-ing present other ions was found as 47% at pH 10. Glyci-
dol-functionalized macroporous polymer was subjected for boron removal and the maximum adsorption was re-corded 29.22 mg/g with the presence of some ions [27]. In the study of Landsman [26] boron adsorption from neutral water was found 2.5 mmol B/g (about 27 mg/g) which was found better than commercial boron selective resin. Amberlite IRA743 previously reported capacity (0.99 mmol B/g dry polymer).
Although boron level suggested to 0.5 mg/L for irrigation by WHO, the boron concentration has to be reduced to 0.3 mg/L in waters that used to irrigate vulnerable plants. Against boron accumulation in soil, actions have to be put into practice especially those affected by low soil leaching in arid regions [37]. Boron toxicity, symptoms mostly occur in spring and are identical to those in drought affected plants. A range of damage threshold values for crops is reported in the literature, from 0.5 ppm to 1.0 ppm [38]. All groundwa-ter samples have elevated boron levels; second and fourth sampling wells were unsuitable for crops because of their high boron compounds over suggested level.
Regeneration of Adsorbent0.01 M NaOH solution was used for regeneration purpos-es of boron loaded columns, adsorption-desorption cycles were performed 15-times successfully only with a loss of 5% in adsorption capacity. After 15 cycle boron adsorption desorption cycle, adsorption capacity decreased. Data is not given here because it is similar to our previous study [2] us-ing the exact polymeric cryogel columns to remove arsenic species from real groundwater samples.
Glycidol-functionalized macroporous polymer was eluted with 1 mol/L HCl and NaOH and regenerated 5 adsorp-tion-desorption cycles, afterwards the adsorption capaci-ty of the polymer was found decreased slightly [27]. The membranes of epoxy-amine cross-linked poly (glycidyl glycidyl ether) (PGGE)were regenerated in acid without a significant loss of boron sorption capacity over four cy-cles [26]. The polymer was eluted with 1.0 M (cycles 2–4) hydrochloric acid to desorb the boron. Another adsorbent (High internal phase emulsion hierarchical porous poly-mer) was treated with acid, alkali and the regenerated for 10 cycles for the boron uptake [39].
CONCLUSIONS
Fe3+ -attached poly (HEMA-co-GMA)-PEI columns were employed to adsorb boron and boron derivates from aqueous solution. The maximum adsorption was record-ed at pH 8 (54.42 mg/g) with synthetic solution where-as the highest adsorbed concentration was found 28.67 (mg/g) pH 6.39 with real groundwater sample (GR2). Suf-ficient column regeneration cycles enable the polymer to be suitable in industrial use.
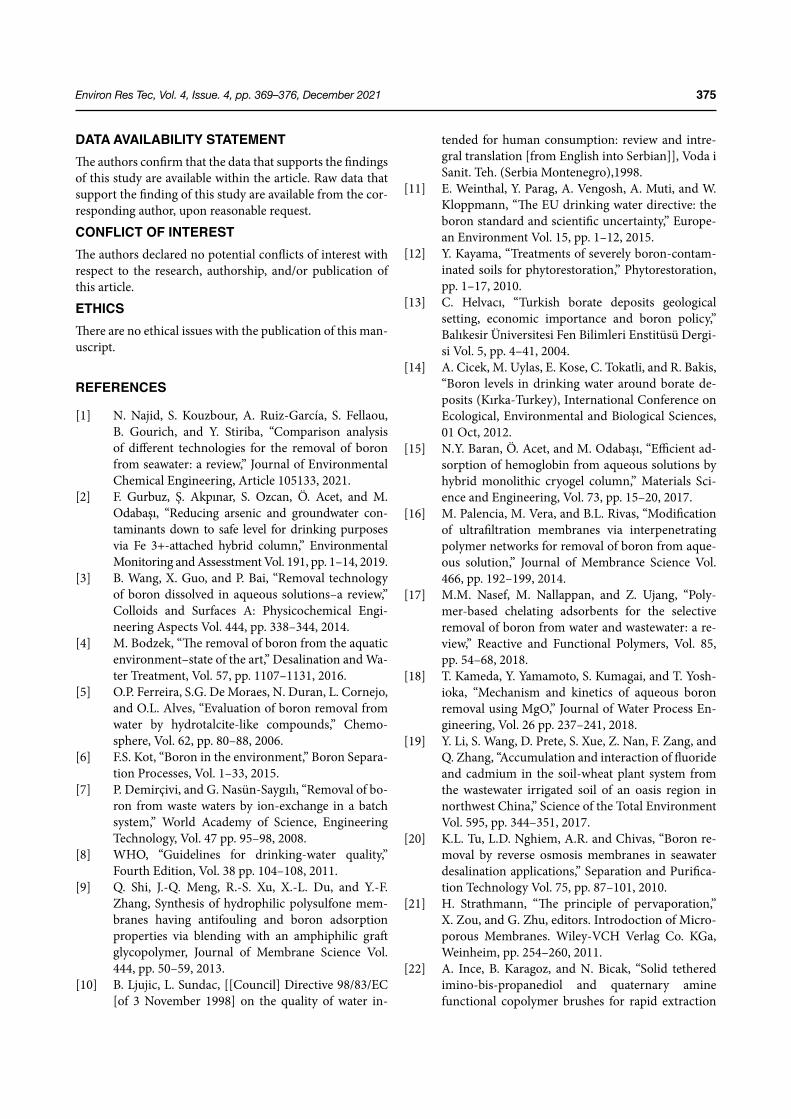
Environ Res Tec, Vol. 4, Issue. 4, pp. 369–376, December 2021 375
DATA AVAILABILITY STATEMENTThe authors confirm that the data that supports the findings of this study are available within the article. Raw data that support the finding of this study are available from the cor-responding author, upon reasonable request.
CONFLICT OF INTERESTThe authors declared no potential conflicts of interest with respect to the research, authorship, and/or publication of this article.
ETHICSThere are no ethical issues with the publication of this man-uscript.
REFERENCES
[1] N. Najid, S. Kouzbour, A. Ruiz-García, S. Fellaou, B. Gourich, and Y. Stiriba, “Comparison analysis of different technologies for the removal of boron from seawater: a review,” Journal of Environmental Chemical Engineering, Article 105133, 2021.
[2] F. Gurbuz, Ş. Akpınar, S. Ozcan, Ö. Acet, and M. Odabaşı, “Reducing arsenic and groundwater con-taminants down to safe level for drinking purposes via Fe 3+-attached hybrid column,” Environmental Monitoring and Assesstment Vol. 191, pp. 1–14, 2019.
[3] B. Wang, X. Guo, and P. Bai, “Removal technology of boron dissolved in aqueous solutions–a review,” Colloids and Surfaces A: Physicochemical Engi-neering Aspects Vol. 444, pp. 338–344, 2014.
[4] M. Bodzek, “The removal of boron from the aquatic environment–state of the art,” Desalination and Wa-ter Treatment, Vol. 57, pp. 1107–1131, 2016.
[5] O.P. Ferreira, S.G. De Moraes, N. Duran, L. Cornejo, and O.L. Alves, “Evaluation of boron removal from water by hydrotalcite-like compounds,” Chemo-sphere, Vol. 62, pp. 80–88, 2006.
[6] F.S. Kot, “Boron in the environment,” Boron Separa-tion Processes, Vol. 1–33, 2015.
[7] P. Demirçivi, and G. Nasün-Saygılı, “Removal of bo-ron from waste waters by ion-exchange in a batch system,” World Academy of Science, Engineering Technology, Vol. 47 pp. 95–98, 2008.
[8] WHO, “Guidelines for drinking-water quality,” Fourth Edition, Vol. 38 pp. 104–108, 2011.
[9] Q. Shi, J.-Q. Meng, R.-S. Xu, X.-L. Du, and Y.-F. Zhang, Synthesis of hydrophilic polysulfone mem-branes having antifouling and boron adsorption properties via blending with an amphiphilic graft glycopolymer, Journal of Membrane Science Vol. 444, pp. 50–59, 2013.
[10] B. Ljujic, L. Sundac, [[Council] Directive 98/83/EC [of 3 November 1998] on the quality of water in-
tended for human consumption: review and intre-gral translation [from English into Serbian]], Voda i Sanit. Teh. (Serbia Montenegro),1998.
[11] E. Weinthal, Y. Parag, A. Vengosh, A. Muti, and W. Kloppmann, “The EU drinking water directive: the boron standard and scientific uncertainty,” Europe-an Environment Vol. 15, pp. 1–12, 2015.
[12] Y. Kayama, “Treatments of severely boron-contam-inated soils for phytorestoration,” Phytorestoration, pp. 1–17, 2010.
[13] C. Helvacı, “Turkish borate deposits geological setting, economic importance and boron policy,” Balıkesir Üniversitesi Fen Bilimleri Enstitüsü Dergi-si Vol. 5, pp. 4–41, 2004.
[14] A. Cicek, M. Uylas, E. Kose, C. Tokatli, and R. Bakis, “Boron levels in drinking water around borate de-posits (Kırka-Turkey), International Conference on Ecological, Environmental and Biological Sciences, 01 Oct, 2012.
[15] N.Y. Baran, Ö. Acet, and M. Odabaşı, “Efficient ad-sorption of hemoglobin from aqueous solutions by hybrid monolithic cryogel column,” Materials Sci-ence and Engineering, Vol. 73, pp. 15–20, 2017.
[16] M. Palencia, M. Vera, and B.L. Rivas, “Modification of ultrafiltration membranes via interpenetrating polymer networks for removal of boron from aque-ous solution,” Journal of Membrance Science Vol. 466, pp. 192–199, 2014.
[17] M.M. Nasef, M. Nallappan, and Z. Ujang, “Poly-mer-based chelating adsorbents for the selective removal of boron from water and wastewater: a re-view,” Reactive and Functional Polymers, Vol. 85, pp. 54–68, 2018.
[18] T. Kameda, Y. Yamamoto, S. Kumagai, and T. Yosh-ioka, “Mechanism and kinetics of aqueous boron removal using MgO,” Journal of Water Process En-gineering, Vol. 26 pp. 237–241, 2018.
[19] Y. Li, S. Wang, D. Prete, S. Xue, Z. Nan, F. Zang, and Q. Zhang, “Accumulation and interaction of fluoride and cadmium in the soil-wheat plant system from the wastewater irrigated soil of an oasis region in northwest China,” Science of the Total Environment Vol. 595, pp. 344–351, 2017.
[20] K.L. Tu, L.D. Nghiem, A.R. and Chivas, “Boron re-moval by reverse osmosis membranes in seawater desalination applications,” Separation and Purifica-tion Technology Vol. 75, pp. 87–101, 2010.
[21] H. Strathmann, “The principle of pervaporation,” X. Zou, and G. Zhu, editors. Introdoction of Micro-porous Membranes. Wiley-VCH Verlag Co. KGa, Weinheim, pp. 254–260, 2011.
[22] A. Ince, B. Karagoz, and N. Bicak, “Solid tethered imino-bis-propanediol and quaternary amine functional copolymer brushes for rapid extraction
Environ Res Tec, Vol. 4, Issue. 4, pp. 369–376, December 2021376
of trace boron,” Desalination, Vol. 310, pp. 60–66, 2013.
[23] S. Nishihama, Y. Sumiyoshi, T. Ookubo, and K. Yoshizuka, “Adsorption of boron using glu-camine-based chelate adsorbents,” Desalination, Vol. 310, pp. 81–86, 2011.
[24] J. Wolska, and M. Bryjak, “Preparation of polymer-ic microspheres for removal of boron by means of sorption-membrane filtration hybrid,” Desalination, Vol. 283 pp. 193–197, 2011.
[25] L. Xu, Y. Liu, H. Hu, Z. Wu, and Q. Chen, “Synthe-sis, characterization and application of a novel silica based adsorbent for boron removal,” Desalination. Vol. 294, pp. 1–7, 2012.
[26] M.R. Landsman, F. Rivers, B.J. Pedretti, B.D. Free-man, D.F. Lawler, N.A. Lynd, and L.E. Katz, “Boric acid removal with polyol-functionalized polyether membranes,” Journal of Membrane Science Vol. 638, Article 119690, 2021.
[27] Q. Luo, M. Zeng, X. Wang, H. Huang, X. Wang, N. Liu, X. Huang, Glycidol-functionalized macropo-rous polymer for boron removal from aqueous solu-tion, Reactive and Functional Polymers Vol. 150, Article 104543, 2020.
[28] J. L. Parks, and M. Edwards, “Boron in the environ-ment,” Critical Reviews Environmental Science and Technology, Vol. 35 pp. 81–114, 2005.
[29] M. Dolati, A.A. Aghapour, H. Khorsandi, and S. Karimzade, “Boron removal from aqueous solutions by electrocoagulation at low concentrations,” Jour-nal of Environmnental Chemecial Engineering, Vol. 5, pp. 5150–5156, 2017.
[30] A.E. Yilmaz, R. Boncukcuoğlu, S. Bayar, B.A. Fil, and M.M. Kocakerim, “Boron removal by means of chemical precipitation with calcium hydroxide and calcium borate formation,” Korean Journal of Chemical Engineering, Vol. 29 pp. 1382–1387, 2012.
[31] N. Kabay, M. Bryjak, and N. Hilal, “Boron Separa-
tion Processes,” Elsevier, Amsretdam, 2015.[32] S. Sarri, and P. Misaelides, D. Zamboulis, J. War-
choł, “Boron removal from aqueous solutions by a polyethylenimine-epichlorohydrin resin,” Journal of the Serbian Chemical Society Vol. 83, pp. 251–264, 2018.
[33] E. Yavuz, Y. Gursel, and B.F. Senkal, “Modification of poly (glycidyl methacrylate) grafted onto cross-linked PVC with iminopropylene glycol group and use for removing boron from water,” Desalination, Vol. 310, pp. 145–150, 2013.
[34] M. Gazi, and S. Shahmohammadi, “Removal of trace boron from aqueous solution using iminobis-(pro-pylene glycol) modified chitosan beads,” Reactive and Functional Polymers, Vol. 72, pp. 680–686, 2012.
[35] Z. Guan, J. Lv, P. Bai, and X. Guo, “Boron removal from aqueous solutions by adsorption—a review,” Desalination, Vol. 383 pp. 29–37, 2016.
[36] C. Onorato, L.J. Banasiak, and A.I. Schäfer, “Inor-ganic trace contaminant removal from real brack-ish groundwater using electrodialysis,” Seperation and Purification Technology Vol. 187, pp. 426–435, 2017.
[37] U.C. Gupta, Y.W. Jame, C.A. Campbell, A.J. Leyshon, W. Nicholaichuk, “Boron toxicity and deficiency: a review,” Canadian Journal of Soil Science, Vol. 65, pp. 381–409, 1985.
[38] M. P. Princi, A. Lupini, F. Araniti, C. Longo, A. Mau-ceri, F. Sunseri, M. R. Abenavoli, “Boron toxicity and tolerance in plants: recent advances and future perspectives,” Plant Metal Interaction, pp. 115–147, 2016.
[39] Z. Wang, K. Ma, Y. Zhang, X. Zhang, H. H. Ngo, J. Meng, L. Du, “High internal phase emulsion hier-archical porous polymer grafting polyol compounds for boron removal,” Journal of Water Process Engi-neering Vol. 41, pp. 102025, 2021.
The agricultural waste inventory on the regional basis in Turkey: Valuation of agricultural waste with zero-waste concept in the scope
of circular economy
Environ Res Tec, Vol. 4, Issue. 4, pp. 377–385, December 2021
Environmental Research and Technologyhttps://ert.yildiz.edu.tr - https://dergipark.org.tr/tr/pub/ert
DOI: https://doi.org/10.35208/ert.858528
Research Article
Simge SERTGÜMEÇ* , Ayşe Nur USTA , Cevat ÖZARPA1Department of Environmental Engineering, İstanbul Technical University, İstanbul, Turkey
*Corresponding author.*E-mail address: [email protected] paper has been presented at EurAsia Waste Management Symposium 2020, İstanbul, Turkey
Published by Yıldız Technical University Press, İstanbul, TurkeyCopyright 2021, Yıldız Technical University. This is an open access article under the CC BY-NC license (http://creativecommons.org/licenses/by-nc/4.0/).
ARTICLE INFO
Article historyReceived: 11 January 2021Revised: 18 November 2021Accepted: 30 November 2021
Key words:Agro-wastes; Anaerobic digestion; Bio-energy; Circular economy; Waste-to-energy; Zero-waste
ABSTRACT
Turkey is an agricultural country. Agriculture has an important share among our livelihoods in Turkey. Apart from the parts that are used as a result of agricultural activities, which have direct economic value and are sent to various industries for processing, there are also non-consumption or unused parts of the agricultural products. Therefore, agricultural activities bring a large amount of agricultural waste with them. However, as long as agricultural wastes are not valued, they can be considered as a significant economic loss. Similar to the increase in world population, the pop-ulation of Turkey increases rapidly. Of course, this growth in the population brings energy needs with it. However, environmental damage caused by greenhouse gas emissions released into the atmosphere due to the use of fossil resources and reserve shortage leads us to look for renewable energy sources. Therefore, biogas production from organic wastes as a sustainable approach allows agricultural wastes formed in high quantities in Turkey, problematic for farmers for different ways and seen as an economic loss to be converted into energy forms. In the study, biogas production was supported by the anaerobic digestion system method in order to convert various agricultur-al wastes in the different regions of Turkey into an energy form. While producing energy from biogas, digestate can be re-fed to agricultural lands as fertilizer. In this study, agricultural waste inventory has been created for seven different regions and suggestions for future have been given.
Cite this article as: Sertgümeç S, Usta AN, Özarpa C. The agricultural waste inventory on the regional basis in Turkey: Valuation of agricultural waste with zero-waste concept in the scope of circular economy. Environ Res Tec 2021;4:4:377–385.
INTRODUCTION
People need foods to sustain their vital activities. And, they will need these foods throughout their lives. For this pur-pose, human beings must provide food regularly. Agriculture is one of the basic activities that provide the foods needed for nutrition, which is the basic need of human beings. There-
fore, it is very difficult to think of a life without agriculture. Also, according to the Chauhan, almost two thirds of the world's population is based on agricultural production [1].
The agricultural sector has an important place on a global scale. Even if it varies from country to country, it affects many areas such as the level of development and social life-style of societies [2].
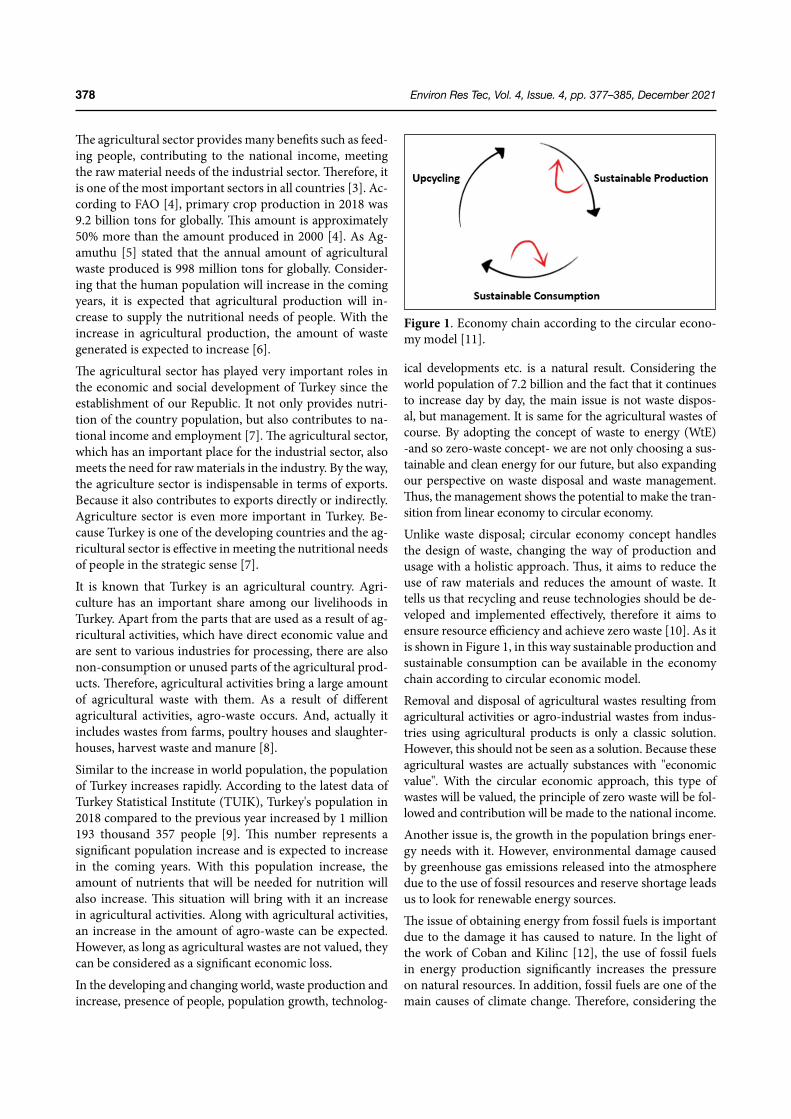
Environ Res Tec, Vol. 4, Issue. 4, pp. 377–385, December 2021378
The agricultural sector provides many benefits such as feed-ing people, contributing to the national income, meeting the raw material needs of the industrial sector. Therefore, it is one of the most important sectors in all countries [3]. Ac-cording to FAO [4], primary crop production in 2018 was 9.2 billion tons for globally. This amount is approximately 50% more than the amount produced in 2000 [4]. As Ag-amuthu [5] stated that the annual amount of agricultural waste produced is 998 million tons for globally. Consider-ing that the human population will increase in the coming years, it is expected that agricultural production will in-crease to supply the nutritional needs of people. With the increase in agricultural production, the amount of waste generated is expected to increase [6].
The agricultural sector has played very important roles in the economic and social development of Turkey since the establishment of our Republic. It not only provides nutri-tion of the country population, but also contributes to na-tional income and employment [7]. The agricultural sector, which has an important place for the industrial sector, also meets the need for raw materials in the industry. By the way, the agriculture sector is indispensable in terms of exports. Because it also contributes to exports directly or indirectly. Agriculture sector is even more important in Turkey. Be-cause Turkey is one of the developing countries and the ag-ricultural sector is effective in meeting the nutritional needs of people in the strategic sense [7].
It is known that Turkey is an agricultural country. Agri-culture has an important share among our livelihoods in Turkey. Apart from the parts that are used as a result of ag-ricultural activities, which have direct economic value and are sent to various industries for processing, there are also non-consumption or unused parts of the agricultural prod-ucts. Therefore, agricultural activities bring a large amount of agricultural waste with them. As a result of different agricultural activities, agro-waste occurs. And, actually it includes wastes from farms, poultry houses and slaughter-houses, harvest waste and manure [8].
Similar to the increase in world population, the population of Turkey increases rapidly. According to the latest data of Turkey Statistical Institute (TUIK), Turkey's population in 2018 compared to the previous year increased by 1 million 193 thousand 357 people [9]. This number represents a significant population increase and is expected to increase in the coming years. With this population increase, the amount of nutrients that will be needed for nutrition will also increase. This situation will bring with it an increase in agricultural activities. Along with agricultural activities, an increase in the amount of agro-waste can be expected. However, as long as agricultural wastes are not valued, they can be considered as a significant economic loss.
In the developing and changing world, waste production and increase, presence of people, population growth, technolog-
ical developments etc. is a natural result. Considering the world population of 7.2 billion and the fact that it continues to increase day by day, the main issue is not waste dispos-al, but management. It is same for the agricultural wastes of course. By adopting the concept of waste to energy (WtE) -and so zero-waste concept- we are not only choosing a sus-tainable and clean energy for our future, but also expanding our perspective on waste disposal and waste management. Thus, the management shows the potential to make the tran-sition from linear economy to circular economy.
Unlike waste disposal; circular economy concept handles the design of waste, changing the way of production and usage with a holistic approach. Thus, it aims to reduce the use of raw materials and reduces the amount of waste. It tells us that recycling and reuse technologies should be de-veloped and implemented effectively, therefore it aims to ensure resource efficiency and achieve zero waste [10]. As it is shown in Figure 1, in this way sustainable production and sustainable consumption can be available in the economy chain according to circular economic model.
Removal and disposal of agricultural wastes resulting from agricultural activities or agro-industrial wastes from indus-tries using agricultural products is only a classic solution. However, this should not be seen as a solution. Because these agricultural wastes are actually substances with "economic value". With the circular economic approach, this type of wastes will be valued, the principle of zero waste will be fol-lowed and contribution will be made to the national income.
Another issue is, the growth in the population brings ener-gy needs with it. However, environmental damage caused by greenhouse gas emissions released into the atmosphere due to the use of fossil resources and reserve shortage leads us to look for renewable energy sources.
The issue of obtaining energy from fossil fuels is important due to the damage it has caused to nature. In the light of the work of Coban and Kilinc [12], the use of fossil fuels in energy production significantly increases the pressure on natural resources. In addition, fossil fuels are one of the main causes of climate change. Therefore, considering the
Figure 1. Economy chain according to the circular econo-my model [11].
Environ Res Tec, Vol. 4, Issue. 4, pp. 377–385, December 2021 379
conditions such as limited reserves, pressure on resources and causing climate change, it turns out that the use of re-newable energy resources is a must.
According to the energy report published by WWF [13], it is not impossible to meet almost all of the universal demand for energy in 2050 by renewable energy. In this context, the world and in Turkey, is continuing efforts for efficient use of renewable energy sources, aimed at increasing the total en-ergy production in the share of renewable energy sources. In 2014, by the Ministry of Energy and Natural Resourc-es "Turkey's National Renewable Energy Action Plan" was prepared. Also, by 2023, the energy used across the country share of renewable energy sources used in Turkey is aimed to increase to 30% in total.
Recently, the concepts of circular economy and energy pro-duction from waste have come to the fore and are important. As D'Amato [14] states that circular economy and bio-econ-omy concepts are sustainable concepts that are put forward in place of the fossil-based economy currently in existence. So, agricultural wastes can be converted into a form of ener-gy and can be evaluated in Turkey. Thus, agricultural wastes, which are a big problem for agricultural fields and farmers, will not be a problem anymore but will also be valued.
If effective management for agro-wastes and correct control for pollution effects on the environment and climate change are provided, all types of waste assessed under waste-to-en-ergy (WtE) technologies tend to have the opportunity to be an important source of energy and to display fuel for a sus-tainable future. In particular, according to UNEP [15], with the biomass, the investment increase in the waste to energy sector only in 2011–2012 is around 186% and there is a total investment of 1 billion USD in this sector.
Among the many technologies included in the concept of energy production from waste, biogas production through the anaerobic treatment process is a very popular subject.
As Askari [16] states that, biogas production is carried out through microorganisms due to the fact that they don’t meet with the air after long periods and create anaerobic conditions. In addition, biogas production can be produced anaerobically via reactors or naturally in landfill areas. Bio-gas production with the help of anaerobic process is a log-ical approach for the evaluation of agricultural wastes. In particular, an agricultural country like Turkey, considering that serious agricultural waste has occurred, it is necessary to evaluate agricultural waste through anaerobic digestion.
As it is explained in perspective of Lier, Mahmoud & Zee-man [17], the anaerobic treatment (AD) of complex wastes involves two main stages; the first stage is basically called the “Acid Fermentation” and in this stage, large compounds, such as carbohydrates, fats, proteins, are broken down into smaller components, namely monomers. And the second stage of the anaerobic treatment (AD) is called the “Meth-
ane Fermentation” [17]. In the second stage, end products of the acid fermentation stage are converted to gaseous form which includes mostly methane.
In the first stage, complex components of the waste, includ-ing fats, proteins and polysaccharides, are hydrolyzed to their component subunits. According to Wilkie [18], this is accomplished by a heterogeneous group of facultative and anaerobic bacteria and these bacteria then subject the prod-ucts of hydrolysis (triglycerides, fatty acids, amino acids and sugars) to fermentation and other metabolic processes leading to the formation of simple organic compounds. Af-ter this step, the large substances are separated into smaller units, which are converted to Volatile Fatty Acids (VFA) during the Acidogenesis step. The overall process up to now is called acid fermentation. After the Acid Fermentation stage, the resulting Volatile Fatty Acids (VFAs) are convert-ed to Acetate. In the second stage, the end products of the first stage are converted to gases (mainly methane and car-bon dioxide) by several different species of strictly anaer-obic bacteria. Thus, it is here that true stabilization of the organic material occurs. This stage is generally referred to as methane fermentation and this is how biogas production occurs. In addition, the digestate formed as a result of the anaerobic digestion process where biogas is produced can also be used as fertilizer [19].
Activity in the fertilizer sector in Turkey is increasing ev-ery year. In fact, it is observed that fertilizer production increases on a yearly basis, but the need increases as con-sumption is very intense [20]. This means that production cannot meet consumption in our country. And, those needs are tried to be met by means of imports in Turkey and less than about 10% of the production is also exported [20].
Turkey may show little change from year to year in fertil-izer consumption because of climatic conditions, product range, economy, etc. But in general, the annual average is 5–6 million tons [20] for the consumption of fertilizer. By the way, sources of raw materials for chemical fertilizers, es-pecially in Turkey are not available; therefore, the chemical fertilizer sector is more than 90% foreign dependent in our country [20]. Considering the statistics, only in 2017 there was 6.3 million tons of chemical fertilizer consumption, and 85% of it was imported [20]. This means approximately 5.4 million tons.
Turkey's import needs to be done to meet the fertilizer means a significant cost. In our country, serious costs arise for the import of chemical fertilizers every year. For example, ac-cording to different fertilizer types the cost varies from 170 USD to 370 USD per ton [21]. Considering that there is an average of 5.5 million tons of imported chemical fertilizers per year, the amount of money we export for a year is serious.
With the approach of evaluation of agricultural wastes through anaerobic digestion, not only energy is obtained by producing biogas from agricultural wastes; but also Turkey
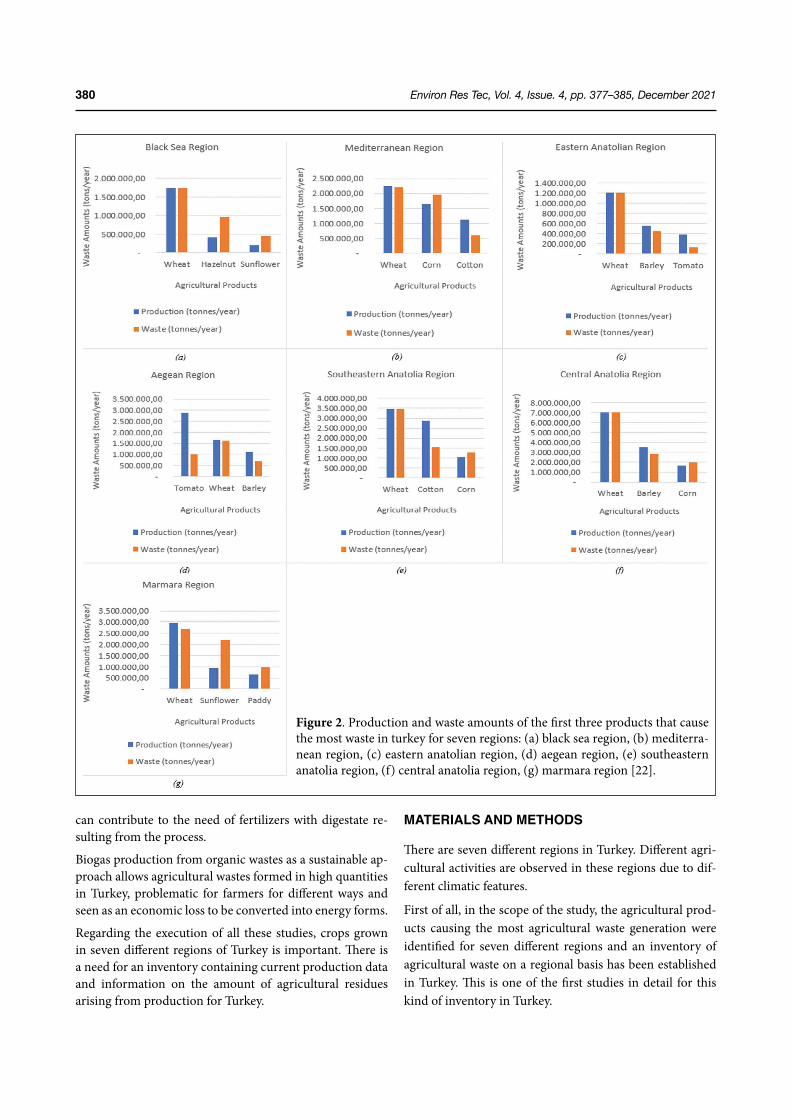
Environ Res Tec, Vol. 4, Issue. 4, pp. 377–385, December 2021380
can contribute to the need of fertilizers with digestate re-sulting from the process.
Biogas production from organic wastes as a sustainable ap-proach allows agricultural wastes formed in high quantities in Turkey, problematic for farmers for different ways and seen as an economic loss to be converted into energy forms.
Regarding the execution of all these studies, crops grown in seven different regions of Turkey is important. There is a need for an inventory containing current production data and information on the amount of agricultural residues arising from production for Turkey.
MATERIALS AND METHODS
There are seven different regions in Turkey. Different agri-cultural activities are observed in these regions due to dif-ferent climatic features.
First of all, in the scope of the study, the agricultural prod-ucts causing the most agricultural waste generation were identified for seven different regions and an inventory of agricultural waste on a regional basis has been established in Turkey. This is one of the first studies in detail for this kind of inventory in Turkey.
Figure 2. Production and waste amounts of the first three products that cause the most waste in turkey for seven regions: (a) black sea region, (b) mediterra-nean region, (c) eastern anatolian region, (d) aegean region, (e) southeastern anatolia region, (f) central anatolia region, (g) marmara region [22].
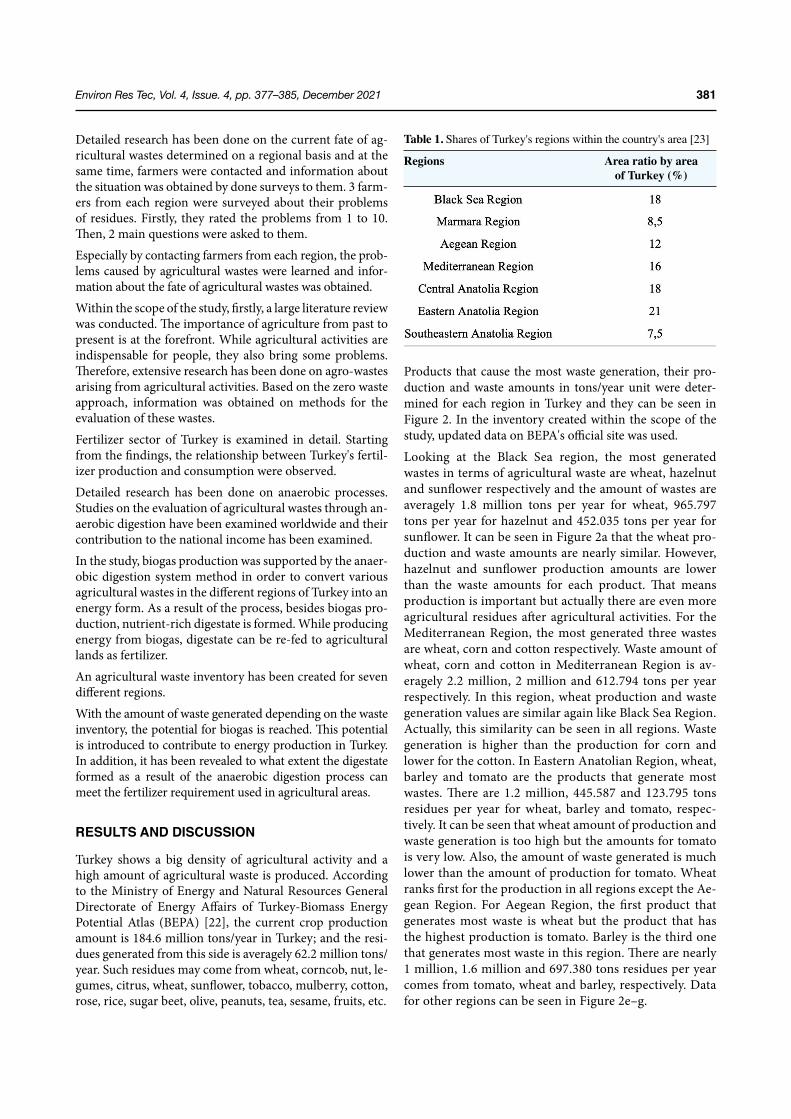
Environ Res Tec, Vol. 4, Issue. 4, pp. 377–385, December 2021 381
Detailed research has been done on the current fate of ag-ricultural wastes determined on a regional basis and at the same time, farmers were contacted and information about the situation was obtained by done surveys to them. 3 farm-ers from each region were surveyed about their problems of residues. Firstly, they rated the problems from 1 to 10. Then, 2 main questions were asked to them.Especially by contacting farmers from each region, the prob-lems caused by agricultural wastes were learned and infor-mation about the fate of agricultural wastes was obtained. Within the scope of the study, firstly, a large literature review was conducted. The importance of agriculture from past to present is at the forefront. While agricultural activities are indispensable for people, they also bring some problems. Therefore, extensive research has been done on agro-wastes arising from agricultural activities. Based on the zero waste approach, information was obtained on methods for the evaluation of these wastes.Fertilizer sector of Turkey is examined in detail. Starting from the findings, the relationship between Turkey's fertil-izer production and consumption were observed.Detailed research has been done on anaerobic processes. Studies on the evaluation of agricultural wastes through an-aerobic digestion have been examined worldwide and their contribution to the national income has been examined.In the study, biogas production was supported by the anaer-obic digestion system method in order to convert various agricultural wastes in the different regions of Turkey into an energy form. As a result of the process, besides biogas pro-duction, nutrient-rich digestate is formed. While producing energy from biogas, digestate can be re-fed to agricultural lands as fertilizer.An agricultural waste inventory has been created for seven different regions. With the amount of waste generated depending on the waste inventory, the potential for biogas is reached. This potential is introduced to contribute to energy production in Turkey. In addition, it has been revealed to what extent the digestate formed as a result of the anaerobic digestion process can meet the fertilizer requirement used in agricultural areas.
RESULTS AND DISCUSSION
Turkey shows a big density of agricultural activity and a high amount of agricultural waste is produced. According to the Ministry of Energy and Natural Resources General Directorate of Energy Affairs of Turkey-Biomass Energy Potential Atlas (BEPA) [22], the current crop production amount is 184.6 million tons/year in Turkey; and the resi-dues generated from this side is averagely 62.2 million tons/year. Such residues may come from wheat, corncob, nut, le-gumes, citrus, wheat, sunflower, tobacco, mulberry, cotton, rose, rice, sugar beet, olive, peanuts, tea, sesame, fruits, etc.
Products that cause the most waste generation, their pro-duction and waste amounts in tons/year unit were deter-mined for each region in Turkey and they can be seen in Figure 2. In the inventory created within the scope of the study, updated data on BEPA's official site was used.Looking at the Black Sea region, the most generated wastes in terms of agricultural waste are wheat, hazelnut and sunflower respectively and the amount of wastes are averagely 1.8 million tons per year for wheat, 965.797 tons per year for hazelnut and 452.035 tons per year for sunflower. It can be seen in Figure 2a that the wheat pro-duction and waste amounts are nearly similar. However, hazelnut and sunflower production amounts are lower than the waste amounts for each product. That means production is important but actually there are even more agricultural residues after agricultural activities. For the Mediterranean Region, the most generated three wastes are wheat, corn and cotton respectively. Waste amount of wheat, corn and cotton in Mediterranean Region is av-eragely 2.2 million, 2 million and 612.794 tons per year respectively. In this region, wheat production and waste generation values are similar again like Black Sea Region. Actually, this similarity can be seen in all regions. Waste generation is higher than the production for corn and lower for the cotton. In Eastern Anatolian Region, wheat, barley and tomato are the products that generate most wastes. There are 1.2 million, 445.587 and 123.795 tons residues per year for wheat, barley and tomato, respec-tively. It can be seen that wheat amount of production and waste generation is too high but the amounts for tomato is very low. Also, the amount of waste generated is much lower than the amount of production for tomato. Wheat ranks first for the production in all regions except the Ae-gean Region. For Aegean Region, the first product that generates most waste is wheat but the product that has the highest production is tomato. Barley is the third one that generates most waste in this region. There are nearly 1 million, 1.6 million and 697.380 tons residues per year comes from tomato, wheat and barley, respectively. Data for other regions can be seen in Figure 2e–g.
Table 1. Shares of Turkey's regions within the country's area [23]
Regions Area ratio by area of Turkey (%)
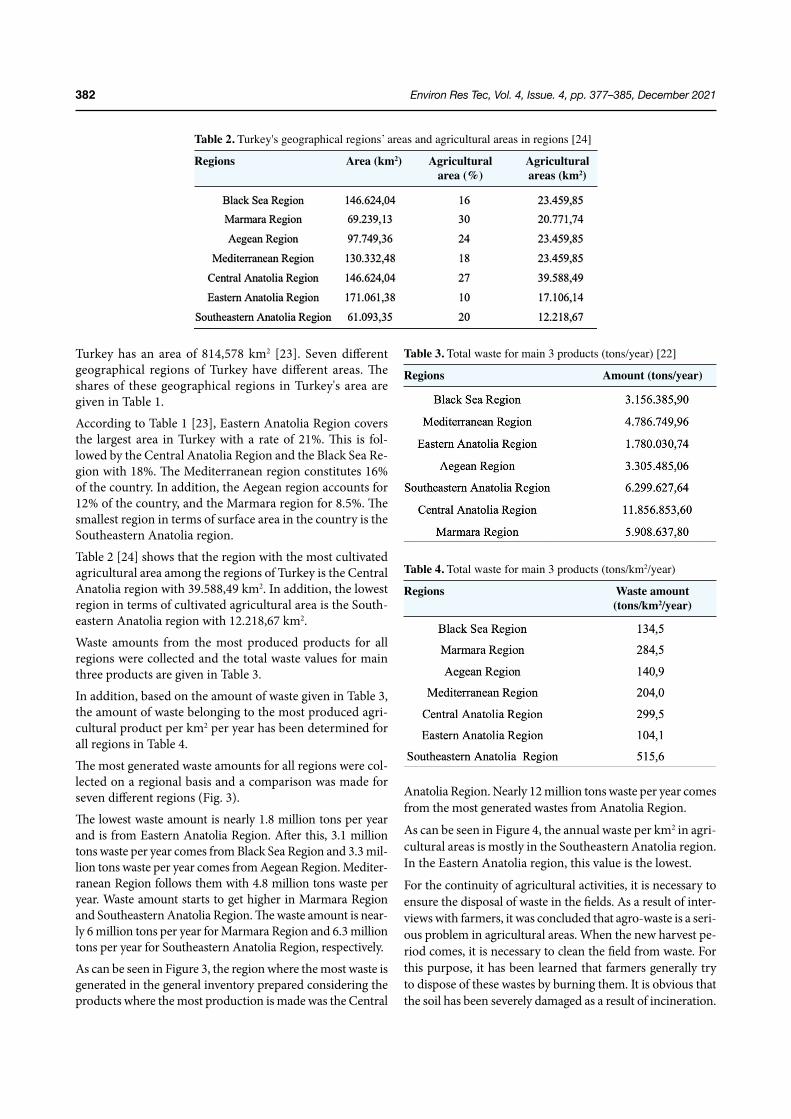
Environ Res Tec, Vol. 4, Issue. 4, pp. 377–385, December 2021382
Turkey has an area of 814,578 km2 [23]. Seven different geographical regions of Turkey have different areas. The shares of these geographical regions in Turkey's area are given in Table 1.According to Table 1 [23], Eastern Anatolia Region covers the largest area in Turkey with a rate of 21%. This is fol-lowed by the Central Anatolia Region and the Black Sea Re-gion with 18%. The Mediterranean region constitutes 16% of the country. In addition, the Aegean region accounts for 12% of the country, and the Marmara region for 8.5%. The smallest region in terms of surface area in the country is the Southeastern Anatolia region.Table 2 [24] shows that the region with the most cultivated agricultural area among the regions of Turkey is the Central Anatolia region with 39.588,49 km2. In addition, the lowest region in terms of cultivated agricultural area is the South-eastern Anatolia region with 12.218,67 km2.Waste amounts from the most produced products for all regions were collected and the total waste values for main three products are given in Table 3.In addition, based on the amount of waste given in Table 3, the amount of waste belonging to the most produced agri-cultural product per km2 per year has been determined for all regions in Table 4.The most generated waste amounts for all regions were col-lected on a regional basis and a comparison was made for seven different regions (Fig. 3).The lowest waste amount is nearly 1.8 million tons per year and is from Eastern Anatolia Region. After this, 3.1 million tons waste per year comes from Black Sea Region and 3.3 mil-lion tons waste per year comes from Aegean Region. Mediter-ranean Region follows them with 4.8 million tons waste per year. Waste amount starts to get higher in Marmara Region and Southeastern Anatolia Region. The waste amount is near-ly 6 million tons per year for Marmara Region and 6.3 million tons per year for Southeastern Anatolia Region, respectively. As can be seen in Figure 3, the region where the most waste is generated in the general inventory prepared considering the products where the most production is made was the Central
Anatolia Region. Nearly 12 million tons waste per year comes from the most generated wastes from Anatolia Region.
As can be seen in Figure 4, the annual waste per km2 in agri-cultural areas is mostly in the Southeastern Anatolia region. In the Eastern Anatolia region, this value is the lowest.
For the continuity of agricultural activities, it is necessary to ensure the disposal of waste in the fields. As a result of inter-views with farmers, it was concluded that agro-waste is a seri-ous problem in agricultural areas. When the new harvest pe-riod comes, it is necessary to clean the field from waste. For this purpose, it has been learned that farmers generally try to dispose of these wastes by burning them. It is obvious that the soil has been severely damaged as a result of incineration.
Table 2. Turkey's geographical regions’ areas and agricultural areas in regions [24]
Regions Area (km2) Agricultural Agricultural area (%) areas (km2)
Table 3. Total waste for main 3 products (tons/year) [22]
Regions Amount (tons/year)
Table 4. Total waste for main 3 products (tons/km2/year)
Regions Waste amount (tons/km2/year)
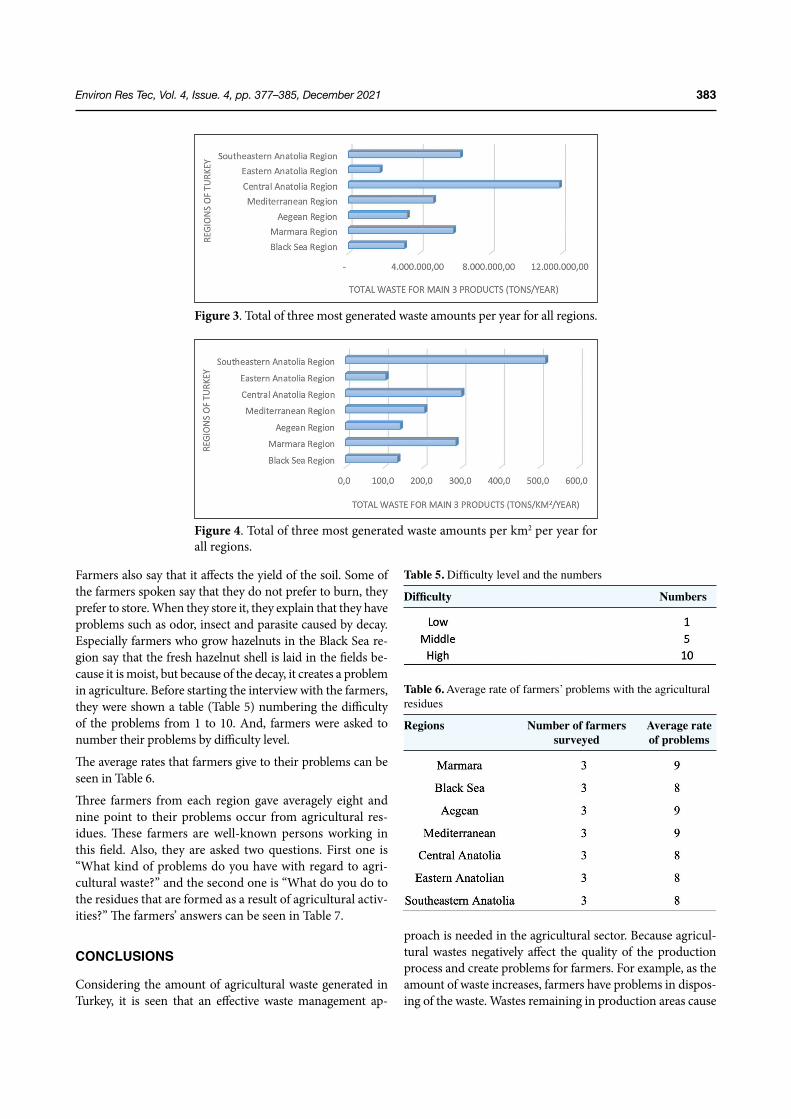
Environ Res Tec, Vol. 4, Issue. 4, pp. 377–385, December 2021 383
Farmers also say that it affects the yield of the soil. Some of the farmers spoken say that they do not prefer to burn, they prefer to store. When they store it, they explain that they have problems such as odor, insect and parasite caused by decay. Especially farmers who grow hazelnuts in the Black Sea re-gion say that the fresh hazelnut shell is laid in the fields be-cause it is moist, but because of the decay, it creates a problem in agriculture. Before starting the interview with the farmers, they were shown a table (Table 5) numbering the difficulty of the problems from 1 to 10. And, farmers were asked to number their problems by difficulty level.
The average rates that farmers give to their problems can be seen in Table 6.
Three farmers from each region gave averagely eight and nine point to their problems occur from agricultural res-idues. These farmers are well-known persons working in this field. Also, they are asked two questions. First one is “What kind of problems do you have with regard to agri-cultural waste?” and the second one is “What do you do to the residues that are formed as a result of agricultural activ-ities?” The farmers’ answers can be seen in Table 7.
CONCLUSIONS
Considering the amount of agricultural waste generated in Turkey, it is seen that an effective waste management ap-
proach is needed in the agricultural sector. Because agricul-tural wastes negatively affect the quality of the production process and create problems for farmers. For example, as the amount of waste increases, farmers have problems in dispos-ing of the waste. Wastes remaining in production areas cause
Figure 3. Total of three most generated waste amounts per year for all regions.
Figure 4. Total of three most generated waste amounts per km2 per year for all regions.
Table 5. Difficulty level and the numbers
Difficulty Numbers
Table 6. Average rate of farmers’ problems with the agricultural residues
Regions Numberoffarmers Averagerate surveyed ofproblems
Environ Res Tec, Vol. 4, Issue. 4, pp. 377–385, December 2021384
problems such as insect infestation and damage to agricul-tural tools. In addition, while the need for agricultural pro-duction increases over time, environmental problems such as climate change cause a decrease in agricultural production. For these reasons, agricultural wastes can be used as raw ma-terials for biogas and organic fertilizers. Thus, agricultural wastes are no longer a problem and can be managed in an economical and environmentally friendly way.
The energy requirement is very low in agricultural activi-ties. At the same time, the share of bioenergy in renewable energy in Turkey is also not high. Therefore, providing ag-ricultural waste management for each region with biogas plants to be built on a regional basis, and conversion of ex-isting agricultural wastes to energy has been proposed.
Electric vehicles can be used during the collection and transportation of agricultural wastes to be used in biogas production to the relevant facilities. These vehicles with low carbon footprint and noise level allow waste collection and
transportation to be carried out without harming the en-vironment. Harmful formations such as odor and patho-gens can also be prevented by storing agricultural wastes in sufficiently ventilated and air-conditioned storage areas prepared according to the amount of waste.
It is known that most of the fertilizer used in agricultural land in Turkey are bought abroad and is also contain chem-icals. Another product that comes out of the proposed bio-gas plants is nutrient-rich digestate. With the use of diges-tate as fertilizer on farmland, it could be saving money paid to fertilizer in Turkey. On the other hand, organic fertilizers provide the nutrients required for agricultural production, such as chemical fertilizers. The most important advantage of organic fertilizers is that they provide soil regulating ef-fects as well as nutrients. Thus, agricultural wastes are val-ued with the zero-waste concept. In addition, it contributes to the country's economy with the energy from biogas and digestate to be obtained through the biogas plants proposed to be established on a regional basis.
Table 7. Answers of farmers
Regions Answer 1 Answer 2
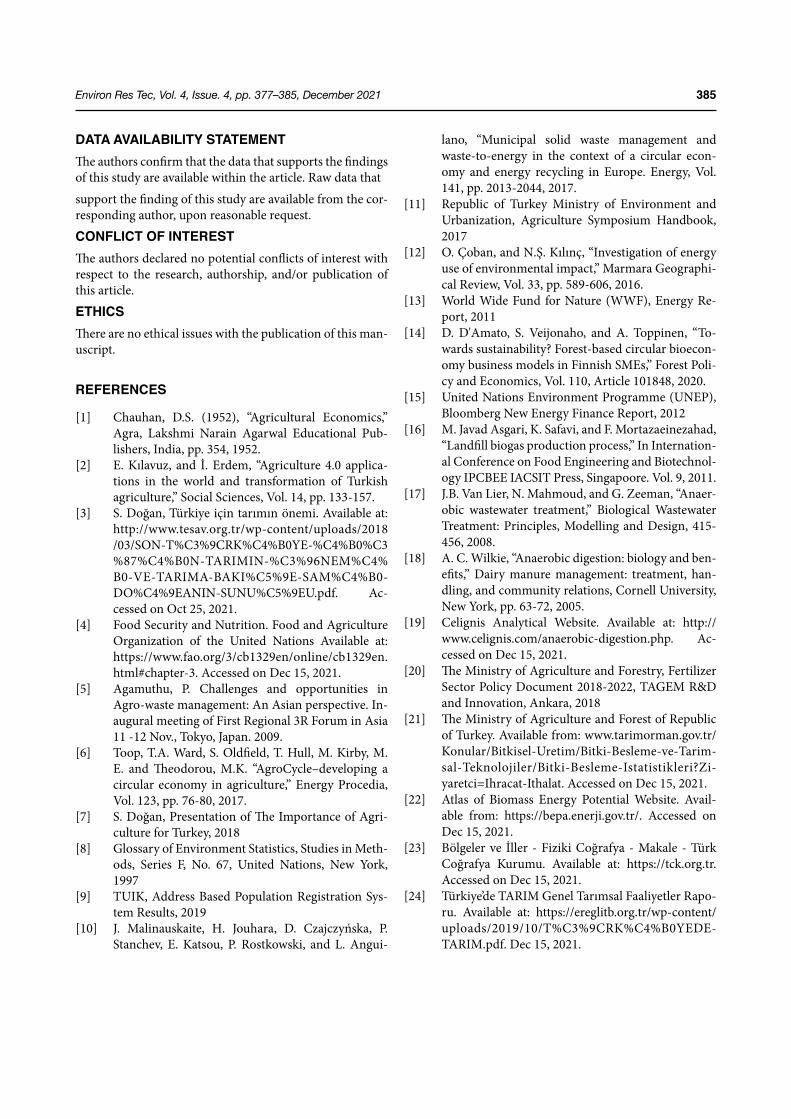
Environ Res Tec, Vol. 4, Issue. 4, pp. 377–385, December 2021 385
DATA AVAILABILITY STATEMENTThe authors confirm that the data that supports the findings of this study are available within the article. Raw data thatsupport the finding of this study are available from the cor-responding author, upon reasonable request.CONFLICT OF INTERESTThe authors declared no potential conflicts of interest with respect to the research, authorship, and/or publication of this article.ETHICSThere are no ethical issues with the publication of this man-uscript.
REFERENCES
[1] Chauhan, D.S. (1952), “Agricultural Economics,” Agra, Lakshmi Narain Agarwal Educational Pub-lishers, India, pp. 354, 1952.
[2] E. Kılavuz, and İ. Erdem, “Agriculture 4.0 applica-tions in the world and transformation of Turkish agriculture,” Social Sciences, Vol. 14, pp. 133-157.
[3] S. Doğan, Türkiye için tarımın önemi. Available at: http://www.tesav.org.tr/wp-content/uploads/2018 /03/SON-T%C3%9CRK%C4%B0YE-%C4%B0%C3 %87%C4%B0N-TARIMIN-%C3%96NEM%C4% B0-VE-TARIMA-BAKI%C5%9E-SAM%C4%B0-DO%C4%9EANIN-SUNU%C5%9EU.pdf. Ac-cessed on Oct 25, 2021.
[4] Food Security and Nutrition. Food and Agriculture Organization of the United Nations Available at: https://www.fao.org/3/cb1329en/online/cb1329en.html#chapter-3. Accessed on Dec 15, 2021.
[5] Agamuthu, P. Challenges and opportunities in Agro-waste management: An Asian perspective. In-augural meeting of First Regional 3R Forum in Asia 11 -12 Nov., Tokyo, Japan. 2009.
[6] Toop, T.A. Ward, S. Oldfield, T. Hull, M. Kirby, M. E. and Theodorou, M.K. “AgroCycle–developing a circular economy in agriculture,” Energy Procedia, Vol. 123, pp. 76-80, 2017.
[7] S. Doğan, Presentation of The Importance of Agri-culture for Turkey, 2018
[8] Glossary of Environment Statistics, Studies in Meth-ods, Series F, No. 67, United Nations, New York, 1997
[9] TUIK, Address Based Population Registration Sys-tem Results, 2019
[10] J. Malinauskaite, H. Jouhara, D. Czajczyńska, P. Stanchev, E. Katsou, P. Rostkowski, and L. Angui-
lano, “Municipal solid waste management and waste-to-energy in the context of a circular econ-omy and energy recycling in Europe. Energy, Vol. 141, pp. 2013-2044, 2017.
[11] Republic of Turkey Ministry of Environment and Urbanization, Agriculture Symposium Handbook, 2017
[12] O. Çoban, and N.Ş. Kılınç, “Investigation of energy use of environmental impact,” Marmara Geographi-cal Review, Vol. 33, pp. 589-606, 2016.
[13] World Wide Fund for Nature (WWF), Energy Re-port, 2011
[14] D. D'Amato, S. Veijonaho, and A. Toppinen, “To-wards sustainability? Forest-based circular bioecon-omy business models in Finnish SMEs,” Forest Poli-cy and Economics, Vol. 110, Article 101848, 2020.
[15] United Nations Environment Programme (UNEP), Bloomberg New Energy Finance Report, 2012
[16] M. Javad Asgari, K. Safavi, and F. Mortazaeinezahad, “Landfill biogas production process,” In Internation-al Conference on Food Engineering and Biotechnol-ogy IPCBEE IACSIT Press, Singapoore. Vol. 9, 2011.
[17] J.B. Van Lier, N. Mahmoud, and G. Zeeman, “Anaer-obic wastewater treatment,” Biological Wastewater Treatment: Principles, Modelling and Design, 415-456, 2008.
[18] A. C. Wilkie, “Anaerobic digestion: biology and ben-efits,” Dairy manure management: treatment, han-dling, and community relations, Cornell University, New York, pp. 63-72, 2005.
[19] Celignis Analytical Website. Available at: http://www.celignis.com/anaerobic-digestion.php. Ac-cessed on Dec 15, 2021.
[20] The Ministry of Agriculture and Forestry, Fertilizer Sector Policy Document 2018-2022, TAGEM R&D and Innovation, Ankara, 2018
[21] The Ministry of Agriculture and Forest of Republic of Turkey. Available from: www.tarimorman.gov.tr/Konular/Bitkisel-Uretim/Bitki-Besleme-ve-Tarim-sal-Teknolojiler/Bitki-Besleme-Istatistikleri?Zi-yaretci=Ihracat-Ithalat. Accessed on Dec 15, 2021.
[22] Atlas of Biomass Energy Potential Website. Avail-able from: https://bepa.enerji.gov.tr/. Accessed on Dec 15, 2021.
[23] Bölgeler ve İller - Fiziki Coğrafya - Makale - Türk Coğrafya Kurumu. Available at: https://tck.org.tr. Accessed on Dec 15, 2021.
[24] Türkiye’de TARIM Genel Tarımsal Faaliyetler Rapo-ru. Available at: https://ereglitb.org.tr/wp-content/uploads/2019/10/T%C3%9CRK%C4%B0YEDE-TARIM.pdf. Dec 15, 2021.
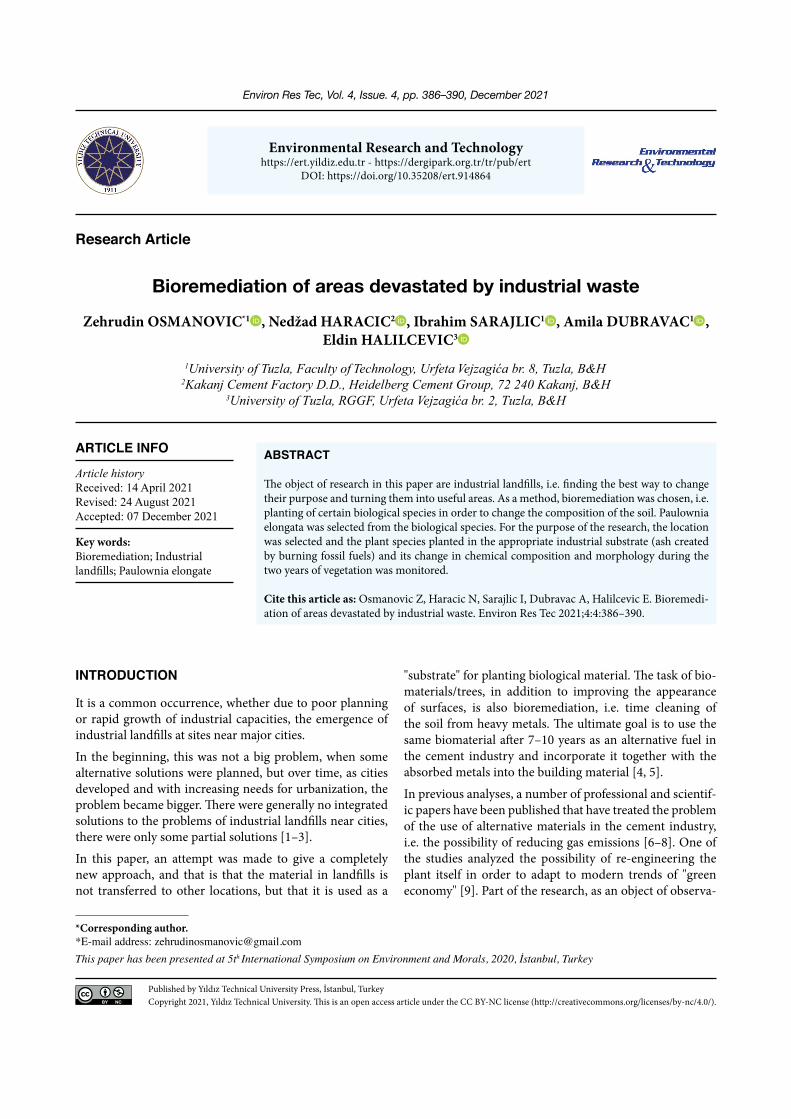
Environ Res Tec, Vol. 4, Issue. 4, pp. 386–390, December 2021
Environmental Research and Technologyhttps://ert.yildiz.edu.tr - https://dergipark.org.tr/tr/pub/ert
DOI: https://doi.org/10.35208/ert.914864
Research Article
Bioremediation of areas devastated by industrial waste
Zehrudin OSMANOVIC*1 , Nedžad HARACIC2 , Ibrahim SARAJLIC1 , Amila DUBRAVAC1 , Eldin HALILCEVIC3
1University of Tuzla, Faculty of Technology, Urfeta Vejzagića br. 8, Tuzla, B&H2Kakanj Cement Factory D.D., Heidelberg Cement Group, 72 240 Kakanj, B&H
3University of Tuzla, RGGF, Urfeta Vejzagića br. 2, Tuzla, B&H
*Corresponding author.*E-mail address: [email protected] paper has been presented at 5th International Symposium on Environment and Morals, 2020, İstanbul, Turkey
Published by Yıldız Technical University Press, İstanbul, TurkeyCopyright 2021, Yıldız Technical University. This is an open access article under the CC BY-NC license (http://creativecommons.org/licenses/by-nc/4.0/).
ARTICLE INFO
Article historyReceived: 14 April 2021Revised: 24 August 2021Accepted: 07 December 2021
Key words:Bioremediation; Industrial landfills; Paulownia elongate
ABSTRACT
The object of research in this paper are industrial landfills, i.e. finding the best way to change their purpose and turning them into useful areas. As a method, bioremediation was chosen, i.e. planting of certain biological species in order to change the composition of the soil. Paulownia elongata was selected from the biological species. For the purpose of the research, the location was selected and the plant species planted in the appropriate industrial substrate (ash created by burning fossil fuels) and its change in chemical composition and morphology during the two years of vegetation was monitored.
Cite this article as: Osmanovic Z, Haracic N, Sarajlic I, Dubravac A, Halilcevic E. Bioremedi-ation of areas devastated by industrial waste. Environ Res Tec 2021;4:4:386–390.
INTRODUCTION
It is a common occurrence, whether due to poor planning or rapid growth of industrial capacities, the emergence of industrial landfills at sites near major cities.
In the beginning, this was not a big problem, when some alternative solutions were planned, but over time, as cities developed and with increasing needs for urbanization, the problem became bigger. There were generally no integrated solutions to the problems of industrial landfills near cities, there were only some partial solutions [1–3].
In this paper, an attempt was made to give a completely new approach, and that is that the material in landfills is not transferred to other locations, but that it is used as a
"substrate" for planting biological material. The task of bio-materials/trees, in addition to improving the appearance of surfaces, is also bioremediation, i.e. time cleaning of the soil from heavy metals. The ultimate goal is to use the same biomaterial after 7–10 years as an alternative fuel in the cement industry and incorporate it together with the absorbed metals into the building material [4, 5].
In previous analyses, a number of professional and scientif-ic papers have been published that have treated the problem of the use of alternative materials in the cement industry, i.e. the possibility of reducing gas emissions [6–8]. One ofthe studies analyzed the possibility of re-engineering theplant itself in order to adapt to modern trends of "greeneconomy" [9]. Part of the research, as an object of observa-
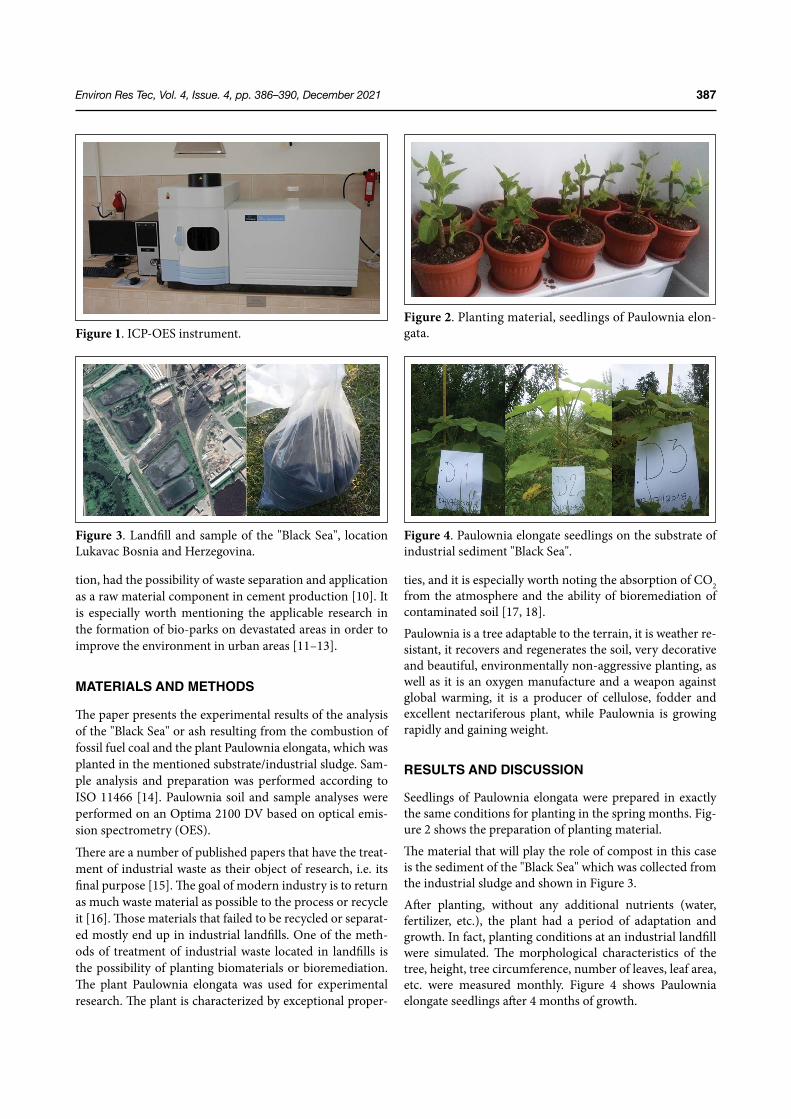
Environ Res Tec, Vol. 4, Issue. 4, pp. 386–390, December 2021 387
tion, had the possibility of waste separation and application as a raw material component in cement production [10]. It is especially worth mentioning the applicable research in the formation of bio-parks on devastated areas in order to improve the environment in urban areas [11–13].
MATERIALS AND METHODS
The paper presents the experimental results of the analysis of the "Black Sea" or ash resulting from the combustion of fossil fuel coal and the plant Paulownia elongata, which was planted in the mentioned substrate/industrial sludge. Sam-ple analysis and preparation was performed according to ISO 11466 [14]. Paulownia soil and sample analyses were performed on an Optima 2100 DV based on optical emis-sion spectrometry (OES).
There are a number of published papers that have the treat-ment of industrial waste as their object of research, i.e. its final purpose [15]. The goal of modern industry is to return as much waste material as possible to the process or recycle it [16]. Those materials that failed to be recycled or separat-ed mostly end up in industrial landfills. One of the meth-ods of treatment of industrial waste located in landfills is the possibility of planting biomaterials or bioremediation. The plant Paulownia elongata was used for experimental research. The plant is characterized by exceptional proper-
ties, and it is especially worth noting the absorption of CO2 from the atmosphere and the ability of bioremediation of contaminated soil [17, 18].
Paulownia is a tree adaptable to the terrain, it is weather re-sistant, it recovers and regenerates the soil, very decorative and beautiful, environmentally non-aggressive planting, as well as it is an oxygen manufacture and a weapon against global warming, it is a producer of cellulose, fodder and excellent nectariferous plant, while Paulownia is growing rapidly and gaining weight.
RESULTS AND DISCUSSION
Seedlings of Paulownia elongata were prepared in exactly the same conditions for planting in the spring months. Fig-ure 2 shows the preparation of planting material.
The material that will play the role of compost in this case is the sediment of the "Black Sea" which was collected from the industrial sludge and shown in Figure 3.
After planting, without any additional nutrients (water, fertilizer, etc.), the plant had a period of adaptation and growth. In fact, planting conditions at an industrial landfill were simulated. The morphological characteristics of the tree, height, tree circumference, number of leaves, leaf area, etc. were measured monthly. Figure 4 shows Paulownia elongate seedlings after 4 months of growth.
Figure 1. ICP-OES instrument.
Figure 3. Landfill and sample of the "Black Sea", location Lukavac Bosnia and Herzegovina.
Figure 4. Paulownia elongate seedlings on the substrate of industrial sediment "Black Sea".
Figure 2. Planting material, seedlings of Paulownia elon-gata.
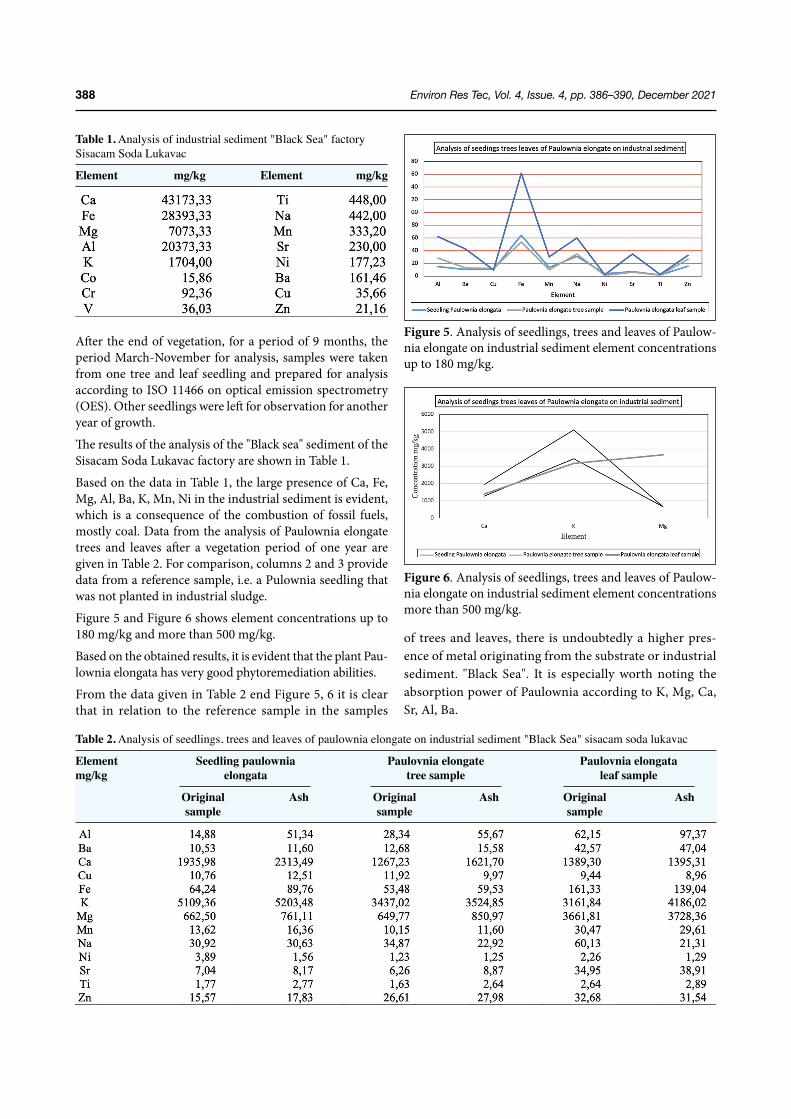
Environ Res Tec, Vol. 4, Issue. 4, pp. 386–390, December 2021388
After the end of vegetation, for a period of 9 months, the period March-November for analysis, samples were taken from one tree and leaf seedling and prepared for analysis according to ISO 11466 on optical emission spectrometry (OES). Other seedlings were left for observation for another year of growth.
The results of the analysis of the "Black sea" sediment of the Sisacam Soda Lukavac factory are shown in Table 1.
Based on the data in Table 1, the large presence of Ca, Fe, Mg, Al, Ba, K, Mn, Ni in the industrial sediment is evident, which is a consequence of the combustion of fossil fuels, mostly coal. Data from the analysis of Paulownia elongate trees and leaves after a vegetation period of one year are given in Table 2. For comparison, columns 2 and 3 provide data from a reference sample, i.e. a Pulownia seedling that was not planted in industrial sludge.
Figure 5 and Figure 6 shows element concentrations up to 180 mg/kg and more than 500 mg/kg.
Based on the obtained results, it is evident that the plant Pau-lownia elongata has very good phytoremediation abilities.
From the data given in Table 2 end Figure 5, 6 it is clear that in relation to the reference sample in the samples
of trees and leaves, there is undoubtedly a higher pres-ence of metal originating from the substrate or industrial sediment. "Black Sea". It is especially worth noting the absorption power of Paulownia according to K, Mg, Ca, Sr, Al, Ba.
Figure 5. Analysis of seedlings, trees and leaves of Paulow-nia elongate on industrial sediment element concentrations up to 180 mg/kg.
Figure 6. Analysis of seedlings, trees and leaves of Paulow-nia elongate on industrial sediment element concentrations more than 500 mg/kg.
Table 1. Analysis of industrial sediment "Black Sea" factory Sisacam Soda Lukavac
Element mg/kg Element mg/kg
Table 2. Analysis of seedlings, trees and leaves of paulownia elongate on industrial sediment "Black Sea" sisacam soda lukavac
Element Seedling paulownia Paulovnia elongate Paulovnia elongata mg/kg elongata tree sample leaf sample
Original Ash Original Ash Original Ash sample sample sample
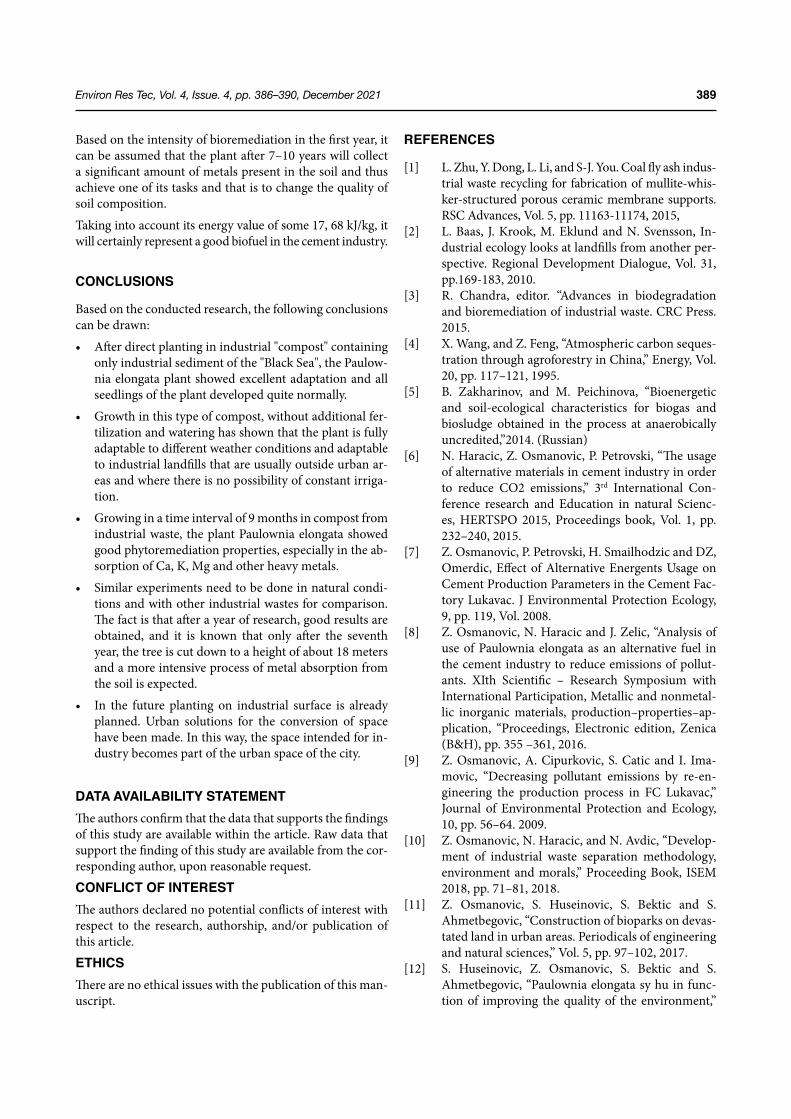
Environ Res Tec, Vol. 4, Issue. 4, pp. 386–390, December 2021 389
Based on the intensity of bioremediation in the first year, it can be assumed that the plant after 7–10 years will collect a significant amount of metals present in the soil and thus achieve one of its tasks and that is to change the quality of soil composition.
Taking into account its energy value of some 17, 68 kJ/kg, it will certainly represent a good biofuel in the cement industry.
CONCLUSIONS
Based on the conducted research, the following conclusions can be drawn:
• After direct planting in industrial "compost" containing only industrial sediment of the "Black Sea", the Paulow-nia elongata plant showed excellent adaptation and all seedlings of the plant developed quite normally.
• Growth in this type of compost, without additional fer-tilization and watering has shown that the plant is fully adaptable to different weather conditions and adaptable to industrial landfills that are usually outside urban ar-eas and where there is no possibility of constant irriga-tion.
• Growing in a time interval of 9 months in compost from industrial waste, the plant Paulownia elongata showed good phytoremediation properties, especially in the ab-sorption of Ca, K, Mg and other heavy metals.
• Similar experiments need to be done in natural condi-tions and with other industrial wastes for comparison. The fact is that after a year of research, good results are obtained, and it is known that only after the seventh year, the tree is cut down to a height of about 18 meters and a more intensive process of metal absorption from the soil is expected.
• In the future planting on industrial surface is already planned. Urban solutions for the conversion of space have been made. In this way, the space intended for in-dustry becomes part of the urban space of the city.
DATA AVAILABILITY STATEMENTThe authors confirm that the data that supports the findings of this study are available within the article. Raw data that support the finding of this study are available from the cor-responding author, upon reasonable request.
CONFLICT OF INTERESTThe authors declared no potential conflicts of interest with respect to the research, authorship, and/or publication of this article.
ETHICSThere are no ethical issues with the publication of this man-uscript.
REFERENCES
[1] L. Zhu, Y. Dong, L. Li, and S-J. You. Coal fly ash indus-trial waste recycling for fabrication of mullite-whis-ker-structured porous ceramic membrane supports. RSC Advances, Vol. 5, pp. 11163-11174, 2015,
[2] L. Baas, J. Krook, M. Eklund and N. Svensson, In-dustrial ecology looks at landfills from another per-spective. Regional Development Dialogue, Vol. 31, pp.169-183, 2010.
[3] R. Chandra, editor. “Advances in biodegradation and bioremediation of industrial waste. CRC Press. 2015.
[4] X. Wang, and Z. Feng, “Atmospheric carbon seques-tration through agroforestry in China,” Energy, Vol. 20, pp. 117–121, 1995.
[5] B. Zakharinov, and M. Peichinova, “Bioenergetic and soil-ecological characteristics for biogas and biosludge obtained in the process at anaerobically uncredited,”2014. (Russian)
[6] N. Haracic, Z. Osmanovic, P. Petrovski, “The usage of alternative materials in cement industry in order to reduce CO2 emissions,” 3rd International Con-ference research and Education in natural Scienc-es, HERTSPO 2015, Proceedings book, Vol. 1, pp. 232–240, 2015.
[7] Z. Osmanovic, P. Petrovski, H. Smailhodzic and DZ, Omerdic, Effect of Alternative Energents Usage on Cement Production Parameters in the Cement Fac-tory Lukavac. J Environmental Protection Ecology, 9, pp. 119, Vol. 2008.
[8] Z. Osmanovic, N. Haracic and J. Zelic, “Analysis of use of Paulownia elongata as an alternative fuel in the cement industry to reduce emissions of pollut-ants. XIth Scientific – Research Symposium with International Participation, Metallic and nonmetal-lic inorganic materials, production–properties–ap-plication, “Proceedings, Electronic edition, Zenica (B&H), pp. 355 –361, 2016.
[9] Z. Osmanovic, A. Cipurkovic, S. Catic and I. Ima-movic, “Decreasing pollutant emissions by re-en-gineering the production process in FC Lukavac,” Journal of Environmental Protection and Ecology, 10, pp. 56–64. 2009.
[10] Z. Osmanovic, N. Haracic, and N. Avdic, “Develop-ment of industrial waste separation methodology, environment and morals,” Proceeding Book, ISEM 2018, pp. 71–81, 2018.
[11] Z. Osmanovic, S. Huseinovic, S. Bektic and S. Ahmetbegovic, “Construction of bioparks on devas-tated land in urban areas. Periodicals of engineering and natural sciences,” Vol. 5, pp. 97–102, 2017.
[12] S. Huseinovic, Z. Osmanovic, S. Bektic and S. Ahmetbegovic, “Paulownia elongata sy hu in func-tion of improving the quality of the environment,”

Environ Res Tec, Vol. 4, Issue. 4, pp. 386–390, December 2021390
Periodicals of Engineering and Natural Sciences, Vol. 5, pp. 117–123, 2017.
[13] Z. Osmanović, S. Osmanović, and S. Ahmetbegov-ic, “Construction of bioparks on devastated land in urban areas, 3rd International symposium on envi-ronment and morality, “ISEM 2016, Proceedings, Alanya, Turkey, pp. 1293–1299, 2016.
[14] ISO, DIN. 11466. “Soil quality—Extraction of trace elements soluble in aqua regia,” 1999.
[15] R.A. Frosch, “Industrial ecology: Minimizing the impact of industrial waste,” Physics Today, Vol. 47, pp. 63–68. 1994,
[16] B. H. S. Philipp, C. T., U.S. Patent No. 5,496,392. Washington, DC: U.S. Patent and Trademark Office, 1996.
[17] J.J Ortega-Calvo, R. Posado-Baquero, J.L. Garcia, and M. Cantos, “Bioavailability of polycyclic aro-matic hydrocarbons in soil as affected by microor-ganisms and plants. Soil biological communities and ecosystem resilience,” pp. 305-319. 2017.
[18] G. C. B. Lazăr, F. Stătescu, and D. Toma, Study of Heavy metal dynamics in soil. Environmental En-gineering & Management Journal, Vol. 19, pp. 359–367, 2020.
Household water consumption behavior during the COVID-19 pandemic and its relationship with COVID-19 cases
Environ Res Tec, Vol. 4, Issue. 4, pp. 391–397, December 2021
Environmental Research and Technologyhttps://ert.yildiz.edu.tr - https://dergipark.org.tr/tr/pub/ert
DOI: https://doi.org/10.35208/ert.953879
Research Article
Esma BİRİŞÇİ* , Ramazan ÖZ
Bursa Uludağ University, Faculty of Economics and Administrative Sciences, Bursa, Turkey
*Corresponding author.*E-mail address: [email protected]
Published by Yıldız Technical University Press, İstanbul, TurkeyCopyright 2021, Yıldız Technical University. This is an open access article under the CC BY-NC license (http://creativecommons.org/licenses/by-nc/4.0/).
ARTICLE INFO
Article historyReceived: 25 July 2021Revised: 22 November 2021Accepted: 25 November 2021
Key words:COVID-19 cases; Rural and urban environment; Water consumption
ABSTRACT
The use of existing water resources and sustainability problems as a result of global warming and climate change became an even bigger problem with the importance of hygiene during the COVID-19 pandemic. In this research, the water consumption behavior will be researched and the correlation between water consumption and COVID-19 case numbers will be investigated in Bursa, Turkey. The monthly mean water consumption for 758,500 domicile subscribers using the central tariff from 2018–2020 was calculated. Results obtained using the SPSS 23 IBM pro-gram observed a 20.18% increase in water consumption in Bursa in general during COVID-19. As Bursa province has both rural and industrial urban structures, when this increase is ex-amined on a county basis, increase rates were 10% in regions with dense industry and mean 34% in rural areas. When the correlation between case numbers during the COVID-19 period (March 2020-January 2021) and water consumption is examined, a negative correlation is nota-ble (Pearson-Correlation=-0.616). As the case numbers increased in the continuing COVID-19 pandemic, the reduction in water consumption may be explained by warnings to citizens to reduce water use through written and oral media due to reservoir fill rates falling below 5%. These results provide beneficial information revealing the effects of COVID-19 on water con-sumption behavior and use of water resources in urban and rural areas.
Cite this article as: Birişçi E, Öz R. Household water consumption behavior during the COVID-19 pandemic and its relationship with COVID-19 cases. Environ Res Tec 2021;4:4:391–397.
INTRODUCTION
The increasing water demands with the rapid and contin-uous development of urbanization, industrialization and globalization have made the imbalance between water re-sources more pronounced in recent periods. At this point, water resources have led to negative effects on regional so-cioeconomic and environmental development. The struc-ture of water consumption is encountered as an application
or criterion for urban sustainability and social inclusion. Regulation of the structure of water consumption is an im-portant point to ensure the optimum allocation of water resources and solve imbalanced situations related to use of water resources [1]. Topics related to water consumption are an increasing problem every day within the framework of sustainability, especially in developing countries. How-ever, development of sustainable water resources has global importance [2]. Management and consumption of water
Environ Res Tec, Vol. 4, Issue. 4, pp. 391–397, December 2021392
resources is encountered as an important topic in recent periods considering factors like one third of the world’s population living in countries without adequate water re-sources, the increase in per person consumption linked to population increase, effects on the environment in line with human activities like climate change [3].
There has been an increase of nearly 1% per year in global water demands from 1980 to the present day linked to pop-ulation increase, socioeconomic development and chang-ing consumption behavior [4]. If the global water demand continues to increase in a similar way until 2050, an in-crease equivalent to 20–30% of current water use is expect-ed linked to increasing demand for industrial and domestic consumption [5]. When this situation is considered, it is probable that severe water shortages will be experienced es-pecially in countries with limited available water resources when increasing water demands cannot be met.
The presence of stable water resources has vital importance in protecting the health of a population, especially when epidemic diseases begin to be observed [6]. In the report published by the World Health Organization (WHO) [7] in 2018, protecting health and improving hygiene were emphasized to prevent at least 9.1% of the global disease burden and 6.3% of possible deaths. For this reason, wa-ter is a basic resource for society which plays an important role in ensuring hygiene conditions, especially during an epidemic, and reducing the spread of disease [8]. The exist-ing water problem continued to grow with the COVID-19 pandemic emerging in Wuhan city in China in 2019. As hand-washing, self-isolation and restrictions were included among precautions with the aim of preventing the spread of the COVID-19 pandemic, it was assumed that societies, communities and households had access to acceptable lev-els of adequate water [4]. However, the distribution of wa-ter resources in the world does not have a fair structure. In African and South Asian countries inhabited by nearly 85% of the world’s population, serious difficulties are faced in terms of accessing clean and potable water [9]. Considering this situation, it is an unavoidable reality that water crises that will be experienced in the future will be more severe, and that the need for water use will continue to increase due to COVID-19 and other diseases that may emerge.
After the emergence of COVID-19, governments in nearly all countries in the world implemented a range of precau-tions aiming to prevent spread of the pandemic. The most important of these precautions was quarantine of individ-uals to minimize the transmission risk. In this pandem-ic period, it was unavoidable that there were increases in consumption of water and electricity linked to individuals spending more time at home. In addition to quarantine, attention was drawn to hygiene conditions for prevention with water use playing an important role in minimizing the spread of the pandemic and preventing and controlling the
spread of COVID-19. Brauer et al. [10] estimates the global access to hand washing with soap and water, and estimates 45%–55% of virus transmission reduced by hand washing. According to the WHO, one of the most effective ways to reduce the risk of transmission of the COVID-19 virus to a person was regular and frequent hand washing with soap and water. The study by Balacco et al. [11] emphasized that hand-washing habits had a determinant effect on water con-sumption. Recent studies considered water consumption due to hand-washing [12–15]. Not only the hand-washing habits of people, but also their general cleaning habits, such that the frequency of showering in a week increase during the pandemic period [16]. Kalbusch et al. [17] researched the effect of preventing the spread of COVID-19 on water consumption in a case study from Joinville city in the south of Brazil. In their sample, when mean water consumption is assessed within the scope of precautions, they conclud-ed there were reductions of 53% in the industrial field, 42% in the commercial field and 30% in the public sector, while there was a mean 11% increase in residential water consumption. Another study was performed in Germany by Lüdtke et al. [18]. They concluded there was a 14.3% increase in daily water consumption during the first lock-down period of 2020 compared to the same period of the previous year. Similarly in Portsmouth in England, there was a 15% increase in water demands in residences during the period of restrictions, while there was a 17% reduction in non-residential water demands [19].
In this study, the water consumption behavior of households in Bursa province was investigated before and during the COVID-19 pandemic period. Although our study is similar to the study of Kalbusch et al [17], we are also aims to in-vestigate the correlation with Covid-19 cases and reservoir fill levels. This research contributes to the literature about water consumption before and during COVID-19 period, it also reveals that how water consumption of household changed with the changes in the reservoir fill levels even in the pandemic period.
MATERIALS AND METHODS
Water ConsumptionIn this study created with the aim of investigating the ef-fect of the pandemic on water consumption behavior, water consumption before and during the pandemic was exam-ined with data obtained from Bursa Water and Sewerage Administration (BUSKI). Monthly water consumption data for 758,500 domicile subscribers between January 2018 and January 2021 were used with mean water consumption per unit subscriber-household calculated. Research data encompassed January 2018 to January 2021 with two data sets created before and during COVID-19 from March 2020 when COVID-19 was first observed in Turkey. When the data are investigated in detail, a fall in water consumption
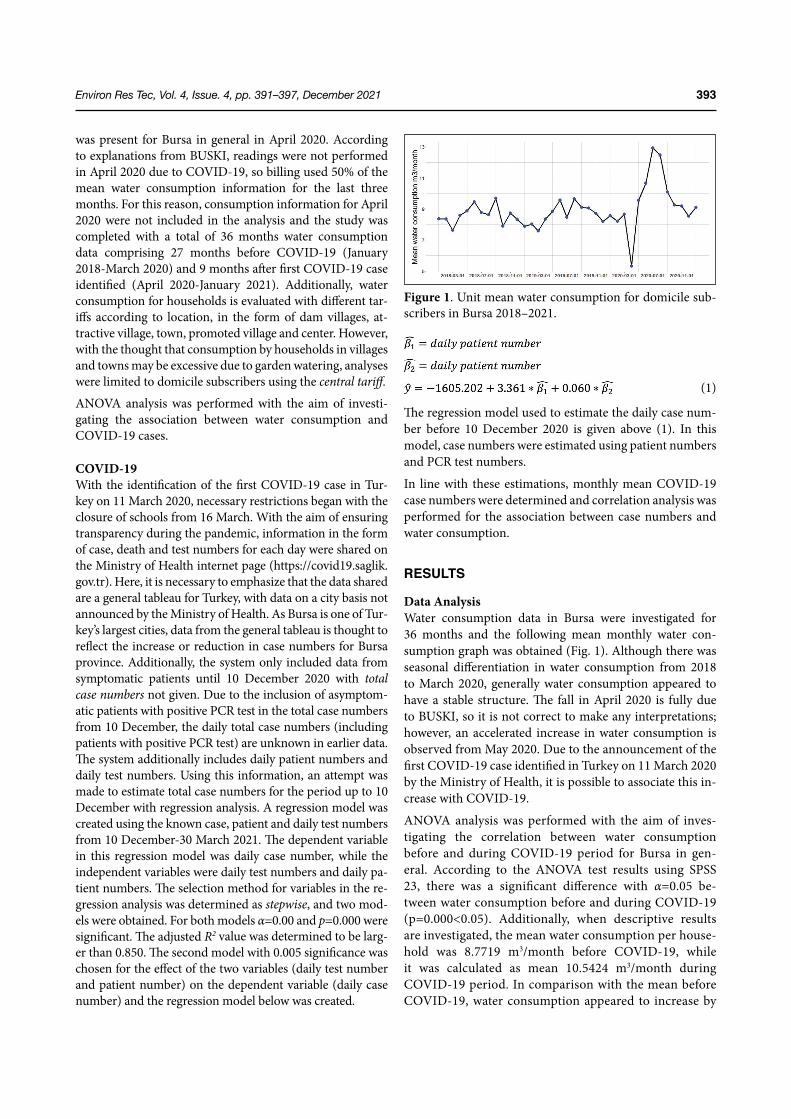
Environ Res Tec, Vol. 4, Issue. 4, pp. 391–397, December 2021 393
was present for Bursa in general in April 2020. According to explanations from BUSKI, readings were not performed in April 2020 due to COVID-19, so billing used 50% of the mean water consumption information for the last three months. For this reason, consumption information for April 2020 were not included in the analysis and the study was completed with a total of 36 months water consumption data comprising 27 months before COVID-19 (January 2018-March 2020) and 9 months after first COVID-19 case identified (April 2020-January 2021). Additionally, water consumption for households is evaluated with different tar-iffs according to location, in the form of dam villages, at-tractive village, town, promoted village and center. However, with the thought that consumption by households in villages and towns may be excessive due to garden watering, analyses were limited to domicile subscribers using the central tariff.
ANOVA analysis was performed with the aim of investi-gating the association between water consumption and COVID-19 cases.
COVID-19With the identification of the first COVID-19 case in Tur-key on 11 March 2020, necessary restrictions began with the closure of schools from 16 March. With the aim of ensuring transparency during the pandemic, information in the form of case, death and test numbers for each day were shared on the Ministry of Health internet page (https://covid19.saglik.gov.tr). Here, it is necessary to emphasize that the data shared are a general tableau for Turkey, with data on a city basis not announced by the Ministry of Health. As Bursa is one of Tur-key’s largest cities, data from the general tableau is thought to reflect the increase or reduction in case numbers for Bursa province. Additionally, the system only included data from symptomatic patients until 10 December 2020 with total case numbers not given. Due to the inclusion of asymptom-atic patients with positive PCR test in the total case numbers from 10 December, the daily total case numbers (including patients with positive PCR test) are unknown in earlier data. The system additionally includes daily patient numbers and daily test numbers. Using this information, an attempt was made to estimate total case numbers for the period up to 10 December with regression analysis. A regression model was created using the known case, patient and daily test numbers from 10 December-30 March 2021. The dependent variable in this regression model was daily case number, while the independent variables were daily test numbers and daily pa-tient numbers. The selection method for variables in the re-gression analysis was determined as stepwise, and two mod-els were obtained. For both models α=0.00 and p=0.000 were significant. The adjusted R2 value was determined to be larg-er than 0.850. The second model with 0.005 significance was chosen for the effect of the two variables (daily test number and patient number) on the dependent variable (daily case number) and the regression model below was created.
(1)
The regression model used to estimate the daily case num-ber before 10 December 2020 is given above (1). In this model, case numbers were estimated using patient numbers and PCR test numbers.
In line with these estimations, monthly mean COVID-19 case numbers were determined and correlation analysis was performed for the association between case numbers and water consumption.
RESULTS
Data AnalysisWater consumption data in Bursa were investigated for 36 months and the following mean monthly water con-sumption graph was obtained (Fig. 1). Although there was seasonal differentiation in water consumption from 2018 to March 2020, generally water consumption appeared to have a stable structure. The fall in April 2020 is fully due to BUSKI, so it is not correct to make any interpretations; however, an accelerated increase in water consumption is observed from May 2020. Due to the announcement of the first COVID-19 case identified in Turkey on 11 March 2020 by the Ministry of Health, it is possible to associate this in-crease with COVID-19.
ANOVA analysis was performed with the aim of inves-tigating the correlation between water consumption before and during COVID-19 period for Bursa in gen-eral. According to the ANOVA test results using SPSS 23, there was a significant difference with α=0.05 be-tween water consumption before and during COVID-19 (p=0.000<0.05). Additionally, when descriptive results are investigated, the mean water consumption per house-hold was 8.7719 m3/month before COVID-19, while it was calculated as mean 10.5424 m3/month during COVID-19 period. In comparison with the mean before COVID-19, water consumption appeared to increase by
Figure 1. Unit mean water consumption for domicile sub-scribers in Bursa 2018–2021.
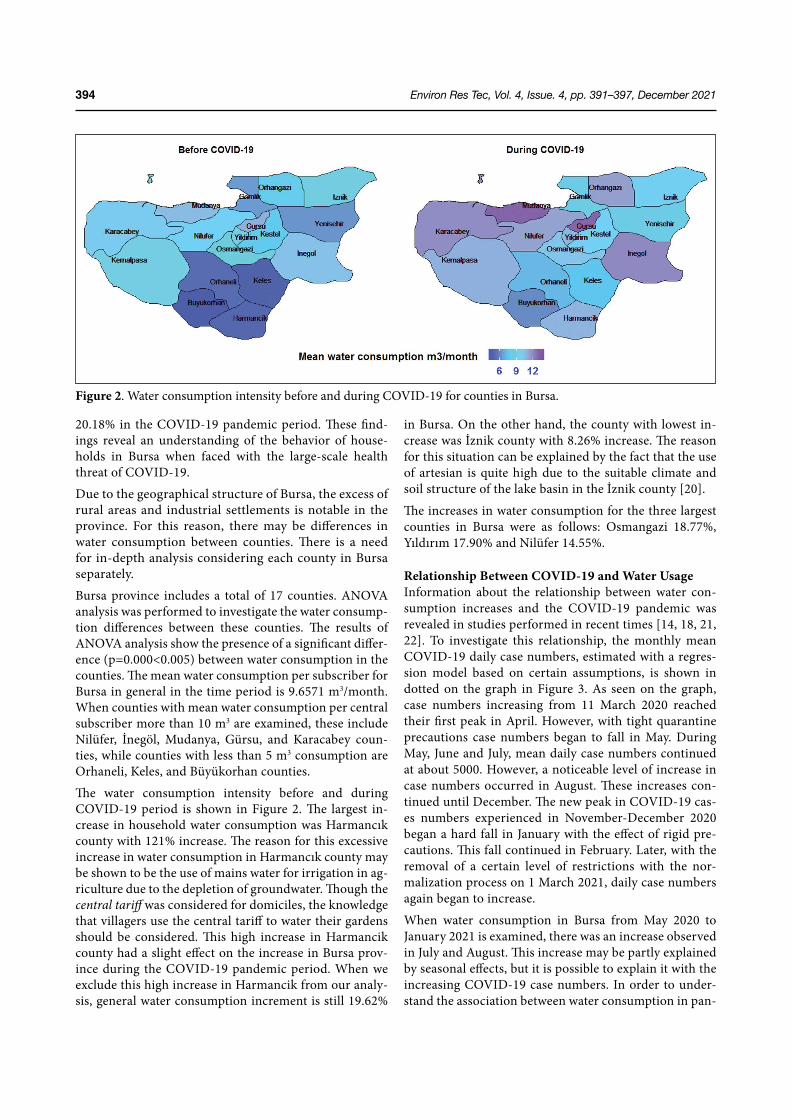
Environ Res Tec, Vol. 4, Issue. 4, pp. 391–397, December 2021394
20.18% in the COVID-19 pandemic period. These find-ings reveal an understanding of the behavior of house-holds in Bursa when faced with the large-scale health threat of COVID-19.Due to the geographical structure of Bursa, the excess of rural areas and industrial settlements is notable in the province. For this reason, there may be differences in water consumption between counties. There is a need for in-depth analysis considering each county in Bursa separately.Bursa province includes a total of 17 counties. ANOVA analysis was performed to investigate the water consump-tion differences between these counties. The results of ANOVA analysis show the presence of a significant differ-ence (p=0.000<0.005) between water consumption in the counties. The mean water consumption per subscriber for Bursa in general in the time period is 9.6571 m3/month. When counties with mean water consumption per central subscriber more than 10 m3 are examined, these include Nilüfer, İnegöl, Mudanya, Gürsu, and Karacabey coun-ties, while counties with less than 5 m3 consumption are Orhaneli, Keles, and Büyükorhan counties.The water consumption intensity before and during COVID-19 period is shown in Figure 2. The largest in-crease in household water consumption was Harmancık county with 121% increase. The reason for this excessive increase in water consumption in Harmancık county may be shown to be the use of mains water for irrigation in ag-riculture due to the depletion of groundwater. Though the central tariff was considered for domiciles, the knowledge that villagers use the central tariff to water their gardens should be considered. This high increase in Harmancik county had a slight effect on the increase in Bursa prov-ince during the COVID-19 pandemic period. When we exclude this high increase in Harmancik from our analy-sis, general water consumption increment is still 19.62%
in Bursa. On the other hand, the county with lowest in-crease was İznik county with 8.26% increase. The reason for this situation can be explained by the fact that the use of artesian is quite high due to the suitable climate and soil structure of the lake basin in the İznik county [20].
The increases in water consumption for the three largest counties in Bursa were as follows: Osmangazi 18.77%, Yıldırım 17.90% and Nilüfer 14.55%.
Relationship Between COVID-19 and Water UsageInformation about the relationship between water con-sumption increases and the COVID-19 pandemic was revealed in studies performed in recent times [14, 18, 21, 22]. To investigate this relationship, the monthly mean COVID-19 daily case numbers, estimated with a regres-sion model based on certain assumptions, is shown in dotted on the graph in Figure 3. As seen on the graph, case numbers increasing from 11 March 2020 reached their first peak in April. However, with tight quarantine precautions case numbers began to fall in May. During May, June and July, mean daily case numbers continued at about 5000. However, a noticeable level of increase in case numbers occurred in August. These increases con-tinued until December. The new peak in COVID-19 cas-es numbers experienced in November-December 2020 began a hard fall in January with the effect of rigid pre-cautions. This fall continued in February. Later, with the removal of a certain level of restrictions with the nor-malization process on 1 March 2021, daily case numbers again began to increase.
When water consumption in Bursa from May 2020 to January 2021 is examined, there was an increase observed in July and August. This increase may be partly explained by seasonal effects, but it is possible to explain it with the increasing COVID-19 case numbers. In order to under-stand the association between water consumption in pan-
Figure 2. Water consumption intensity before and during COVID-19 for counties in Bursa.
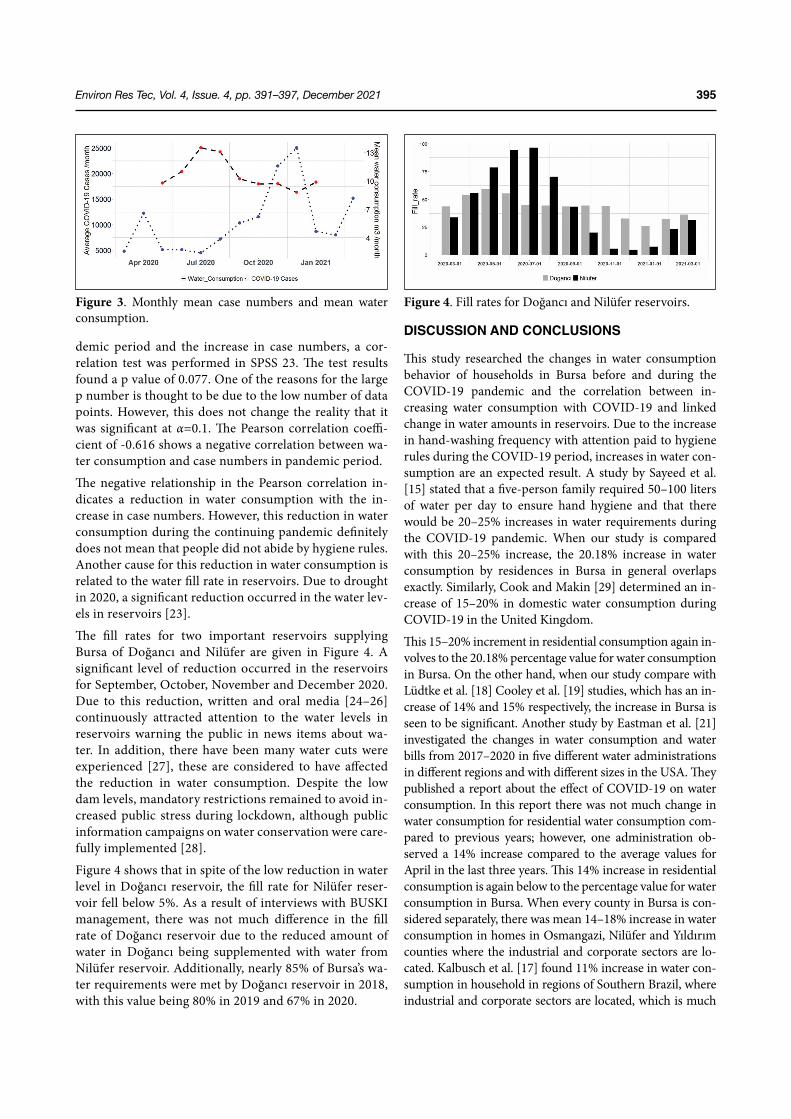
Environ Res Tec, Vol. 4, Issue. 4, pp. 391–397, December 2021 395
demic period and the increase in case numbers, a cor-relation test was performed in SPSS 23. The test results found a p value of 0.077. One of the reasons for the large p number is thought to be due to the low number of data points. However, this does not change the reality that it was significant at α=0.1. The Pearson correlation coeffi-cient of -0.616 shows a negative correlation between wa-ter consumption and case numbers in pandemic period.
The negative relationship in the Pearson correlation in-dicates a reduction in water consumption with the in-crease in case numbers. However, this reduction in water consumption during the continuing pandemic definitely does not mean that people did not abide by hygiene rules. Another cause for this reduction in water consumption is related to the water fill rate in reservoirs. Due to drought in 2020, a significant reduction occurred in the water lev-els in reservoirs [23].
The fill rates for two important reservoirs supplying Bursa of Doğancı and Nilüfer are given in Figure 4. A significant level of reduction occurred in the reservoirs for September, October, November and December 2020. Due to this reduction, written and oral media [24–26] continuously attracted attention to the water levels in reservoirs warning the public in news items about wa-ter. In addition, there have been many water cuts were experienced [27], these are considered to have affected the reduction in water consumption. Despite the low dam levels, mandatory restrictions remained to avoid in-creased public stress during lockdown, although public information campaigns on water conservation were care-fully implemented [28].
Figure 4 shows that in spite of the low reduction in water level in Doğancı reservoir, the fill rate for Nilüfer reser-voir fell below 5%. As a result of interviews with BUSKI management, there was not much difference in the fill rate of Doğancı reservoir due to the reduced amount of water in Doğancı being supplemented with water from Nilüfer reservoir. Additionally, nearly 85% of Bursa’s wa-ter requirements were met by Doğancı reservoir in 2018, with this value being 80% in 2019 and 67% in 2020.
DISCUSSION AND CONCLUSIONS
This study researched the changes in water consumption behavior of households in Bursa before and during the COVID-19 pandemic and the correlation between in-creasing water consumption with COVID-19 and linked change in water amounts in reservoirs. Due to the increase in hand-washing frequency with attention paid to hygiene rules during the COVID-19 period, increases in water con-sumption are an expected result. A study by Sayeed et al. [15] stated that a five-person family required 50–100 liters of water per day to ensure hand hygiene and that there would be 20–25% increases in water requirements during the COVID-19 pandemic. When our study is compared with this 20–25% increase, the 20.18% increase in water consumption by residences in Bursa in general overlaps exactly. Similarly, Cook and Makin [29] determined an in-crease of 15–20% in domestic water consumption during COVID-19 in the United Kingdom.
This 15–20% increment in residential consumption again in-volves to the 20.18% percentage value for water consumption in Bursa. On the other hand, when our study compare with Lüdtke et al. [18] Cooley et al. [19] studies, which has an in-crease of 14% and 15% respectively, the increase in Bursa is seen to be significant. Another study by Eastman et al. [21] investigated the changes in water consumption and water bills from 2017–2020 in five different water administrations in different regions and with different sizes in the USA. They published a report about the effect of COVID-19 on water consumption. In this report there was not much change in water consumption for residential water consumption com-pared to previous years; however, one administration ob-served a 14% increase compared to the average values for April in the last three years. This 14% increase in residential consumption is again below to the percentage value for water consumption in Bursa. When every county in Bursa is con-sidered separately, there was mean 14–18% increase in water consumption in homes in Osmangazi, Nilüfer and Yıldırım counties where the industrial and corporate sectors are lo-cated. Kalbusch et al. [17] found 11% increase in water con-sumption in household in regions of Southern Brazil, where industrial and corporate sectors are located, which is much
Figure 3. Monthly mean case numbers and mean water consumption.
Figure 4. Fill rates for Doğancı and Nilüfer reservoirs.
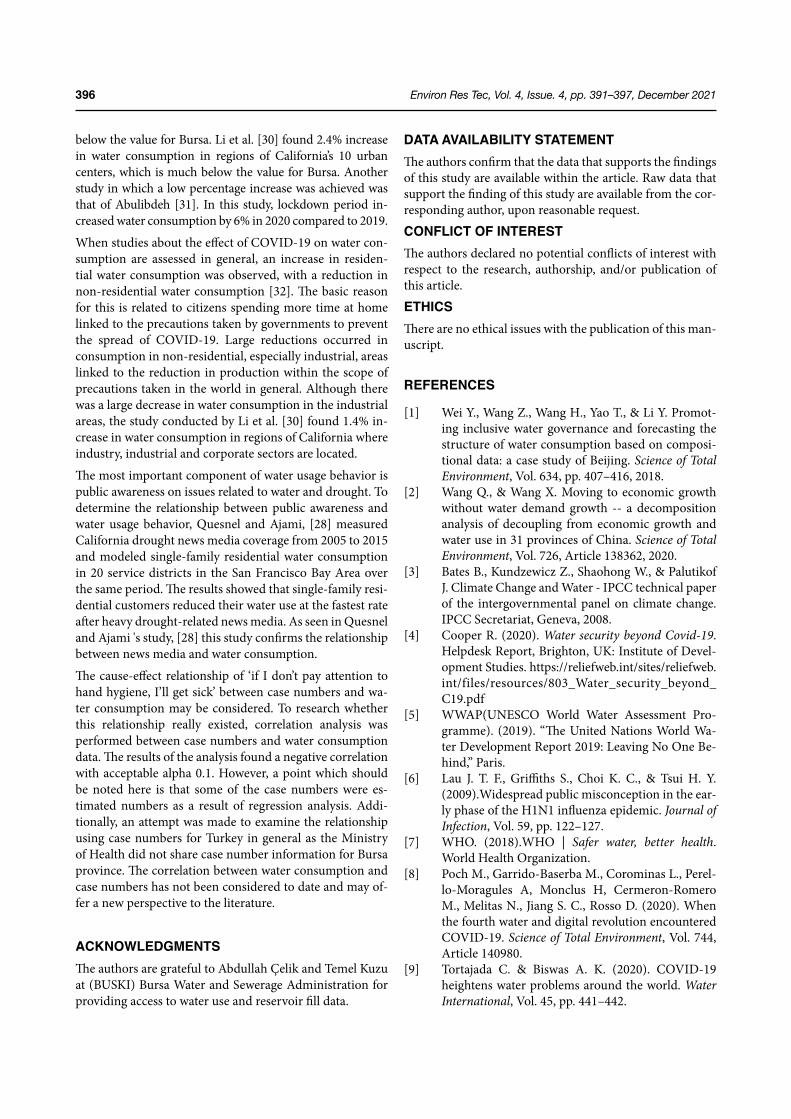
Environ Res Tec, Vol. 4, Issue. 4, pp. 391–397, December 2021396
below the value for Bursa. Li et al. [30] found 2.4% increase in water consumption in regions of California’s 10 urban centers, which is much below the value for Bursa. Another study in which a low percentage increase was achieved was that of Abulibdeh [31]. In this study, lockdown period in-creased water consumption by 6% in 2020 compared to 2019.
When studies about the effect of COVID-19 on water con-sumption are assessed in general, an increase in residen-tial water consumption was observed, with a reduction in non-residential water consumption [32]. The basic reason for this is related to citizens spending more time at home linked to the precautions taken by governments to prevent the spread of COVID-19. Large reductions occurred in consumption in non-residential, especially industrial, areas linked to the reduction in production within the scope of precautions taken in the world in general. Although there was a large decrease in water consumption in the industrial areas, the study conducted by Li et al. [30] found 1.4% in-crease in water consumption in regions of California where industry, industrial and corporate sectors are located.
The most important component of water usage behavior is public awareness on issues related to water and drought. To determine the relationship between public awareness and water usage behavior, Quesnel and Ajami, [28] measured California drought news media coverage from 2005 to 2015 and modeled single-family residential water consumption in 20 service districts in the San Francisco Bay Area over the same period. The results showed that single-family resi-dential customers reduced their water use at the fastest rate after heavy drought-related news media. As seen in Quesnel and Ajami 's study, [28] this study confirms the relationship between news media and water consumption.
The cause-effect relationship of ‘if I don’t pay attention to hand hygiene, I’ll get sick’ between case numbers and wa-ter consumption may be considered. To research whether this relationship really existed, correlation analysis was performed between case numbers and water consumption data. The results of the analysis found a negative correlation with acceptable alpha 0.1. However, a point which should be noted here is that some of the case numbers were es-timated numbers as a result of regression analysis. Addi-tionally, an attempt was made to examine the relationship using case numbers for Turkey in general as the Ministry of Health did not share case number information for Bursa province. The correlation between water consumption and case numbers has not been considered to date and may of-fer a new perspective to the literature.
ACKNOWLEDGMENTSThe authors are grateful to Abdullah Çelik and Temel Kuzu at (BUSKI) Bursa Water and Sewerage Administration for providing access to water use and reservoir fill data.
DATA AVAILABILITY STATEMENTThe authors confirm that the data that supports the findings of this study are available within the article. Raw data that support the finding of this study are available from the cor-responding author, upon reasonable request.
CONFLICT OF INTERESTThe authors declared no potential conflicts of interest with respect to the research, authorship, and/or publication of this article.
ETHICSThere are no ethical issues with the publication of this man-uscript.
REFERENCES
[1] Wei Y., Wang Z., Wang H., Yao T., & Li Y. Promot-ing inclusive water governance and forecasting the structure of water consumption based on composi-tional data: a case study of Beijing. Science of Total Environment, Vol. 634, pp. 407–416, 2018.
[2] Wang Q., & Wang X. Moving to economic growth without water demand growth -- a decomposition analysis of decoupling from economic growth and water use in 31 provinces of China. Science of Total Environment, Vol. 726, Article 138362, 2020.
[3] Bates B., Kundzewicz Z., Shaohong W., & Palutikof J. Climate Change and Water - IPCC technical paper of the intergovernmental panel on climate change. IPCC Secretariat, Geneva, 2008.
[4] Cooper R. (2020). Water security beyond Covid-19. Helpdesk Report, Brighton, UK: Institute of Devel-opment Studies. https://reliefweb.int/sites/reliefweb.int/files/resources/803_Water_security_beyond_C19.pdf
[5] WWAP(UNESCO World Water Assessment Pro-gramme). (2019). “The United Nations World Wa-ter Development Report 2019: Leaving No One Be-hind,” Paris.
[6] Lau J. T. F., Griffiths S., Choi K. C., & Tsui H. Y. (2009).Widespread public misconception in the ear-ly phase of the H1N1 influenza epidemic. Journal of Infection, Vol. 59, pp. 122–127.
[7] WHO. (2018).WHO | Safer water, better health. World Health Organization.
[8] Poch M., Garrido-Baserba M., Corominas L., Perel-lo-Moragules A, Monclus H, Cermeron-Romero M., Melitas N., Jiang S. C., Rosso D. (2020). When the fourth water and digital revolution encountered COVID-19. Science of Total Environment, Vol. 744, Article 140980.
[9] Tortajada C. & Biswas A. K. (2020). COVID-19 heightens water problems around the world. Water International, Vol. 45, pp. 441–442.
Environ Res Tec, Vol. 4, Issue. 4, pp. 391–397, December 2021 397
[10] Brauer M., Zhao J. T, Bennitt F. B., & Stanaway J. D. Global access to handwashing: implications for COVID-19 control in low-income countries. Envi-ronmental Health Perspect, Vol. 128, Article 057005.
[11] Balacco G., Totaro V., Iacobellis V., Manni A., Spag-noletta M., & Piccinni A. F. (2020). Influence of COVID-19 spread on water drinking demand: the case of Puglia region (Southern Italy). Sustainability, Vol. 12, Article 5919.
[12] Amegah A. K. (2020). Improving handwashing habits and household air quality in Africa after COVID-19. Lancet Global Health, Vol. 8, pp. e1110–e1111.
[13] Roshan R., Feroz A. S., Rafique Z., & Virani N. (2020). Rigorous hand hygiene practices among health care workers reduce hospital-associated in-fections during the COVID-19 pandemic. Journal of Primary Care Community Health, Vol. 11, Article 215013272094333.
[14] Sayeed A., Rahman H., Bundschuh J., Herath I., Ahmed F., Bhattacharya P., Tariq M.R., Rahman F., Joy T.I., Abid M.T., & Hasan M.T. (2021). Hand-washing with soap: a concern for overuse of water amidst the COVID-19 pandemic in Bangladesh. Groundwater for Sustainable Development, Vol. 13, Article 100561.
[15] Sayeed A., Kundu S., Al Banna M. H., & Hassan M. N. (2020). COVID-19 outbreak: water loss during handwashing, need more concern? Popular Medi-cine, Vol. 2, pp. 1–2.
[16] Campos M. A. S., Leao S., Melo S.K.,. Gonçalves G.B.F.R, dos Santos J.R., Barros R.L., & Morgado U.T.M.A. (2021). Impact of the COVID-19 pandem-ic on water consumption behaviour. Water Supply, Vol. 21, pp. 4058–4067,
[17] Kalbusch A., Henning E., Brikalski M. P., de Luca F. V., & Konrath A. C. (2020). Impact of coronavirus (COVID-19) spread-prevention actions on urban water consumption. Resources Conservation and Re-cycling, Vol. 163, Article 105098.
[18] Lüdtke D. U., Luetkemeier R., Schneemann M., & Liehr S. (2021). Increase in daily household water demand during the first wave of the covid‐19 pan-demic in Germany. Water, Vol. 13, pp. 260.
[19] Cooley H., Gleick P. H., Abraham S., & Cai W. (2020). Issue brief pacific institute water and the COVID-19 pandemic impacts on municipal water demand. Pesquisa, Article 740056.
[20] Başar H., Gürel S., & Katkat A. V. (2004). Contents of heavy metals in the Lake İznik basin soils irrigat-ed with various water resources. Uludağ Üniversitesi Ziraat Fakültesi Dergisi, Vol. 18, pp. 93–104.
[21] Eastman L., Smull E., Patterson L., & Doyle M. (2020). COVID-19 Impacts on Water Utility
Consumption and Revenues preliminary results. Raftelis. https://nicholasinstitute.duke.edu/sites/de-fault/files/publications/COVID-19-Resources-Im-pacts-on-Water-Utility-Consumption-and-Reve-nues.pdf
[22] Brauner J. M., Mindermann S., Sharma M., Johnston D., Salvatier J, Gavenciak T, Stephonson A. B., Leech G., Altman G., Mikulik V., Norman A. J., Monrad J. T., Besiroğlu T., & Ge H. “Inferring the effectiveness of government interventions against COVID-19,” Science (80-.)., p. eabd9338, Dec. 2020.
[23] Bursa Büyükşehir Belediyesi, “Barajlar doldu, kuyular devre dışı kaldı,” Basın Yayın ve Halk-la İlişkiler Dairesi Başkanlığı, 2021. https://www.bursa.bel.tr/haber/barajlar-doldu-kuyular-devre-di-si-kaldi-29949. Accessed on Dec 23, 2021.
[24] DHA-AA-İHA, “Türkiye’yi bekleyen büyük tehlike! Gün geçtikçe düşüyor,” Cnnturk.com. https://www.cnnturk.com/turkiye/turkiyeyi-bekleyen-buyuk-teh-like-gun-gectikce-dusuyor. Accessed on Dec 23, 2021.
[25] Şahin S., & Özdemir H. Bursa’da barajdaki dolu-luk oranı yüzde 5’e düştü, tarihi köprü orta-ya çıktı. Hurriyet, 2021. https://www.hurriyet.com.tr/gundem/bursada-barajdaki-doluluk-ora-ni-yuzde-5e-dustu-tarihi-kopru-ortaya-cik-ti-41708744. Accessed on Dec 23, 2021.
[26] Ünlü D. E. “Türkiye, 2021’de su kıtlığı yaşayabilir,” Dünya Gazetesi, 2020. https://www.dunya.com/kose-yazisi/turkiye-2021de-su-kitligi-yasayabil-ir/602645. Accessed on Dec 23, 2021.
[27] Buski, “Bursa Su Kesintisi Listesi,” Güncel Kesintiler, 2021. https://guncelkesintiler.com/bursa/su-kesinti-si/. Accessed on Dec 23, 2021.
[28] Qusnel K. J., & Ajami N. K. (2021). Changes in water consumption linked to heavy news media coverage of extreme climatic events. Science Advances, Vol. 3, Art.cle e1700784.
[29] Cook J., & Makin L. Covid water use and the impact on poverty in the UK. 2020. https://www.nea.org.uk/publications/covid-water-use-and-the-impact-on-poverty-in-the-uk/. Accessed on Dec 23, 2021.
[30] Li D., Engel, R.A Ma X., Porse E., Kaplan J.D., Margulis S.A., & Lettenmaier D.P. (2021). Stay-at-home orders during the COVID-19. Environmental Science Technology Letters, Vol. 10, Article acs.es-tlett.0c00979
[31] Abulibdeh A. (2021). Spatiotemporal analysis of water-electricity consumption in the context of the COVID-19 pandemic across six socioeconomic sec-tors in Doha City, Qatar. Applied Energy, Vol. 304, Article 117864.
[32] Memati M. (2020). COVİD-19 and Urban Water Consumption. ARE Update, University of California Giannini Foundation, Vol. 24, pp. 9-11.
Top Related
Copyright © 2022 FDOKUMEN

