


Bahasa
Halaman
Hukum

ww.sciencedirect.com
i n t e r n a t i o n a l j o u r n a l o f h y d r o g e n en e r g y 3 7 ( 2 0 1 2 ) 1 6 8 9e1 6 9 7
Available online at w
journal homepage: www.elsevier .com/locate/he
Energy and exergy analyses of an integrated SOFC and coalgasification system
Rami Salah El-Emama,b,*, Ibrahim Dincer a, Greg F. Naterer a
a Faculty of Engineering and Applied Science, University of Ontario Institute of Technology, 2000 Simcoe Street North, Oshawa,
Ontario L1H 7K4, Canadab Faculty of Engineering, Mansoura University, Mansoura, Egypt
a r t i c l e i n f o
Article history:
Received 16 August 2011
Received in revised form
17 September 2011
Accepted 20 September 2011
Available online 27 October 2011
Keywords:
SOFC
Hydrogen
Coal gasification
Energy
Exergy
Efficiency
* Corresponding author. Faculty of EngineeriNorth, Oshawa, Ontario L1H 7K4, Canada. T
E-mail addresses: [email protected],0360-3199/$ e see front matter Copyright ªdoi:10.1016/j.ijhydene.2011.09.139
a b s t r a c t
This paper examines an integrated gasification and solid oxide fuel cell (SOFC) system with
a gas turbine and steam cycle that uses heat recovery of the gas turbine exhaust. Energy
and exergy analyses are performed with two different types of coal. For the two different
cases, the energy efficiency of the overall system is 38.1% and 36.7%, while the exergy
efficiency is 27% and 23.2%, respectively. The effects of changing the reference temperature
on the exergy destruction and exergy efficiency of different components are also reported.
A parametric study on the effects of changing the pressure ratio on the component
performance is presented.
Copyright ª 2011, Hydrogen Energy Publications, LLC. Published by Elsevier Ltd. All rights
reserved.
1. Introduction The combination of two or more power cycles into one
Integrated energy conversion systems are promising alterna-
tives to fulfill the increasing need for energy sustainability.
There is a wide variety of integrated systems which are very
efficient and have fuel flexibility for combined production of
electricity, hydrogen and heat [1]. An attractive integrated
energy conversion system is one that operates based on
syngas. Coal is a common source of producing syngas [2]. The
composition of syngas generated froma gasification process is
different depending on the gasification method, type of coal
and oxygen purity. Gasification conditions, such as tempera-
ture and pressure, affect the syngas composition [3,4].
ng and Applied Science,el.: þ1 [email protected] (R2011, Hydrogen Energy P
system is a viable option for efficient power generation [5]. It
can also be useful for improving the overall performance of
the energy conversion system and the energy efficiency [6].
One of the current fields of coal gasification is the application
of integrated gasification combined cycles (IGCC). The tech-
nology of coal gasification is well suited to the co-production
of hydrogen and electricity, which may increase the overall
efficiency of the process and provide other economic benefits
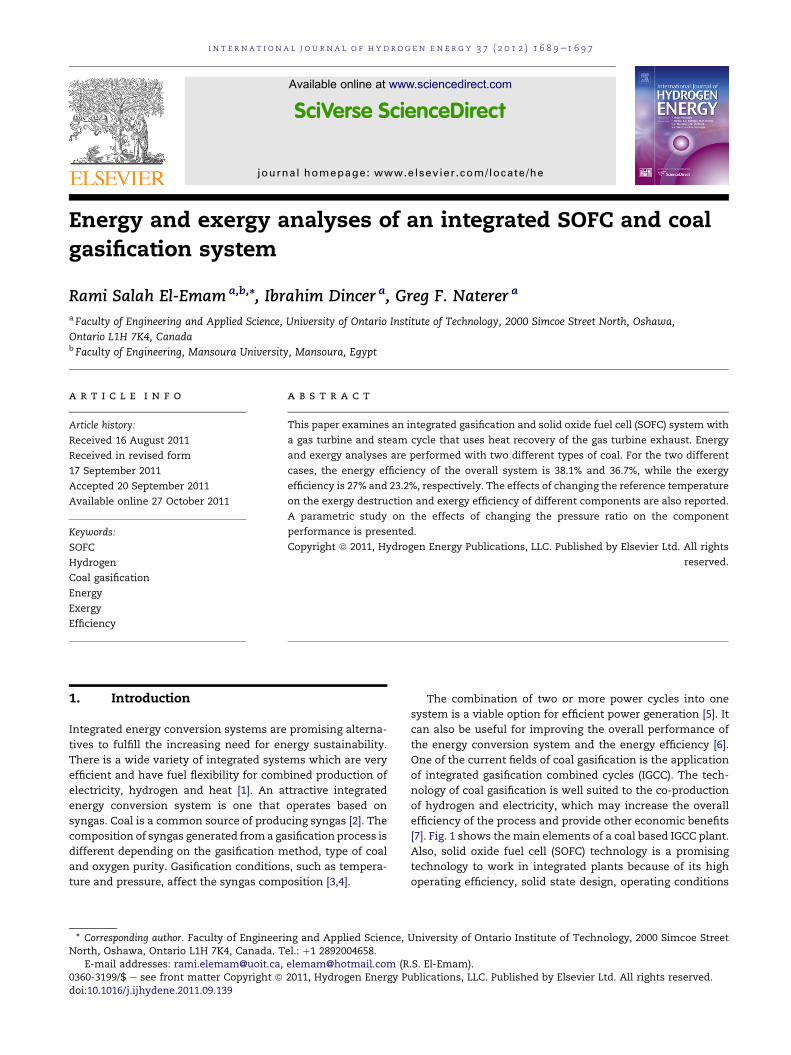
[7]. Fig. 1 shows the main elements of a coal based IGCC plant.
Also, solid oxide fuel cell (SOFC) technology is a promising
technology to work in integrated plants because of its high
operating efficiency, solid state design, operating conditions
University of Ontario Institute of Technology, 2000 Simcoe Street
.S. El-Emam).ublications, LLC. Published by Elsevier Ltd. All rights reserved.
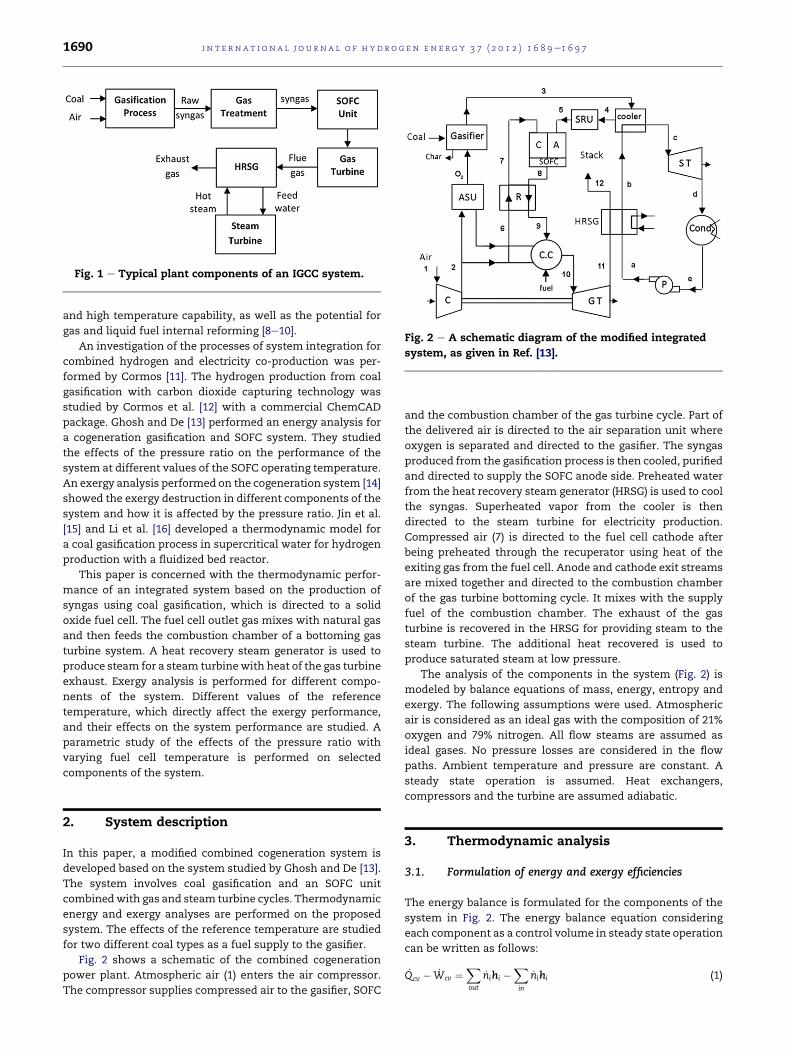
Fig. 1 e Typical plant components of an IGCC system.
Fig. 2 e A schematic diagram of the modified integrated
system, as given in Ref. [13].
i n t e rn a t i o n a l j o u r n a l o f h y d r o g e n en e r g y 3 7 ( 2 0 1 2 ) 1 6 8 9e1 6 9 71690
and high temperature capability, as well as the potential for
gas and liquid fuel internal reforming [8e10].
An investigation of the processes of system integration for
combined hydrogen and electricity co-production was per-
formed by Cormos [11]. The hydrogen production from coal
gasification with carbon dioxide capturing technology was
studied by Cormos et al. [12] with a commercial ChemCAD
package. Ghosh and De [13] performed an energy analysis for
a cogeneration gasification and SOFC system. They studied
the effects of the pressure ratio on the performance of the
system at different values of the SOFC operating temperature.
An exergy analysis performed on the cogeneration system [14]
showed the exergy destruction in different components of the
system and how it is affected by the pressure ratio. Jin et al.
[15] and Li et al. [16] developed a thermodynamic model for
a coal gasification process in supercritical water for hydrogen
production with a fluidized bed reactor.
This paper is concerned with the thermodynamic perfor-
mance of an integrated system based on the production of
syngas using coal gasification, which is directed to a solid
oxide fuel cell. The fuel cell outlet gas mixes with natural gas
and then feeds the combustion chamber of a bottoming gas
turbine system. A heat recovery steam generator is used to
produce steam for a steam turbinewith heat of the gas turbine
exhaust. Exergy analysis is performed for different compo-
nents of the system. Different values of the reference
temperature, which directly affect the exergy performance,
and their effects on the system performance are studied. A
parametric study of the effects of the pressure ratio with
varying fuel cell temperature is performed on selected
components of the system.
2. System description
In this paper, a modified combined cogeneration system is
developed based on the system studied by Ghosh and De [13].
The system involves coal gasification and an SOFC unit
combinedwith gas and steam turbine cycles. Thermodynamic
energy and exergy analyses are performed on the proposed
system. The effects of the reference temperature are studied
for two different coal types as a fuel supply to the gasifier.
Fig. 2 shows a schematic of the combined cogeneration
power plant. Atmospheric air (1) enters the air compressor.
The compressor supplies compressed air to the gasifier, SOFC
and the combustion chamber of the gas turbine cycle. Part of
the delivered air is directed to the air separation unit where
oxygen is separated and directed to the gasifier. The syngas
produced from the gasification process is then cooled, purified
and directed to supply the SOFC anode side. Preheated water
from the heat recovery steam generator (HRSG) is used to cool
the syngas. Superheated vapor from the cooler is then
directed to the steam turbine for electricity production.
Compressed air (7) is directed to the fuel cell cathode after
being preheated through the recuperator using heat of the
exiting gas from the fuel cell. Anode and cathode exit streams
are mixed together and directed to the combustion chamber
of the gas turbine bottoming cycle. It mixes with the supply
fuel of the combustion chamber. The exhaust of the gas
turbine is recovered in the HRSG for providing steam to the
steam turbine. The additional heat recovered is used to
produce saturated steam at low pressure.
The analysis of the components in the system (Fig. 2) is
modeled by balance equations of mass, energy, entropy and
exergy. The following assumptions were used. Atmospheric
air is considered as an ideal gas with the composition of 21%
oxygen and 79% nitrogen. All flow steams are assumed as
ideal gases. No pressure losses are considered in the flow
paths. Ambient temperature and pressure are constant. A
steady state operation is assumed. Heat exchangers,
compressors and the turbine are assumed adiabatic.
3. Thermodynamic analysis
3.1. Formulation of energy and exergy efficiencies
The energy balance is formulated for the components of the
system in Fig. 2. The energy balance equation considering
each component as a control volume in steady state operation
can be written as follows:
_Qcv � _Wcv ¼Xout
_nihi �Xin
_nihi (1)

i n t e r n a t i o n a l j o u r n a l o f h y d r o g e n en e r g y 3 7 ( 2 0 1 2 ) 1 6 8 9e1 6 9 7 1691
where _ni and hi represent the molar flow rate and specific
molar enthalpy of the flow stream into and out from each
component in the system.
Exergy is defined as the maximum work that can be
extracted from a system interacting with a reference envi-
ronment [17]. The exergy balance is formulated for the system
components operating at a steady state condition as follows:
0 ¼X�
1� To
T
�_Qcv � _Wcv þ
Xin
_niexi �Xout
_niexi � _Exdi (2)
where exi is the specificmolar flow exergy for each component
of the inlet and outlet flow streams. It can be defined by
neglecting the kinetic and potential energy changes, as follows:
exi ¼ ðhi � hoÞ � Toðsi � soÞ þ exch (3)
where exch;i is the specific molar chemical exergy of the flow
streams. The specific chemical exergy of different species in
a gas mixture can be written as follows:
exch ¼X
yi:exch;i þ RTo
Xyi:ln yi (4)
where yi is the molar fraction of the gas species ‘i’ in the gas
mixture. The molar specific chemical exergies for the gas
species in the analysis are shown in Table 1 [18]. The enthalpy
and entropy values for each component of the gas are calcu-
lated using polynomial equations as a function of the
temperature [19].
The exergy destruction in component ‘i’, which appears as
‘i’ in the exergy balance equation, is proportional to the
entropy generation, _Exdi , i.e.:
_Exdi ¼ To:Sgen;i (5)
where Sgen;i denotes the entropy generation in each
component.
The energy efficiency can be expressed as a ratio of the
generated power to the lower heating value of the fuel.
hth ¼_W
_nf :LHV(6)
The energy efficiency of the integrated system based on the
heating value of the fuel can be determined as follows:
_Wnet ¼ _WSOFC þ _WGT;net þ _WST � _Wpump (7)
The exergy efficiency for each component is defined based
on the total exergy output to the total exergy input as follows:
j ¼_Exout
_Exin
(8)
Table 1 e Specific chemical exergy values for differentcomponents.
Chemical Exergy, [kJ/kmol]
CH4 836,510 H2O 9340
C2H6 1,504,360 H2 20,340
C3H8 2,163,190 O2 253,680
CO2 27,900 N2 720
CO 275,000
Source: [18].
The total exergy efficiency of system is defined based on fuel
exergy as follows:
j ¼ 1�P _Exd;iP _Exfuel þ _Exair;in
(9)
3.2. Coal gasification
Two different types of coal have been used in the gasifier. The
gasification process occurs at elevated temperatures, and the
pressure was limited to 15 bars. The composition of the coal,
heating value and water content are shown in Table 2.
The chemical exergy of the coal is calculated based on the
following formulawhich is used for solid industrial fossil fuels
[17]:
Exch;fuel ¼�CV0 þw:hfg
�4dry þ 9; 417s (10)
where CV0 is the net calorific value of the fuel, w is the
moisture content of the fuel, hfg is the latent heat of water at To
and s denotes the mass fraction of sulphur in the fuel. Also,
4dry can be defined in terms of the dry organic substances
contained in the coal as follows [18]:
4dry ¼ 0:1882hcþ 0:061
ocþ 0:0404
ncþ 1:0437 (11)
where c, h, o and n represent the mass fractions of carbon,
hydrogen, oxygen and nitrogen in the fuel, respectively. This
formula is applicable with a mass ratio of oxygen to carbon
less than 0.667 [18]. The typical syngas composition exiting
the gasifier as percentage molar compositions is 10.6% CO2,
51.6% CO, 0.1% CH4, 35.1% H2, and 2.6% N2 and others [22]. The
reaction occurs in the gasifier using compressed oxygen,
separated from air in the air separation unit, and it can be
presented as
�ycCþ yH2
H2 þ yH2H2 þ yO2
O2 þ yH2OH2Oþ yN2N2 þ ysSþ ash
�þ X:O2/Y:
�yCO2
CO2 þ yCOCOþ yCH4CH4 þ yH2
H2 þ yN2N2
�þ yH2OH2Oþ Z:Cþ ash
(12)
where yi is the molar fraction of the composition ‘i’, and X, Y
and Z are the mole fractions of oxygen, syngas and char,
which can be calculated from the molar balance equations for
individual elements in the chemical reaction. The syngas
temperature can be determined from the energy balance of
the gasifier.
Table 2 e Ultimate analysis of the coal types in the study.
Coal ultimate analysis wt.% Case 1 Case 2
C 58.8 63.75
H 3.80 4.50
O 12.2 6.88
N 1.30 1.25
S 0.30 2.51
Moisture content 19.6 11.12
LHV (kJ/kg) 21,920 25,886
HHV (kJ/kg) 23,200 27,135
Source: [20,21].

Table 3 e Values of constants for the equilibriumconstant equation.
Reforming Shifting
a �2.6312 � 10�11 5.47 � 10�12
b 1.2406 � 10�7 �2.547 � 10�8
c �2.2523 � 10�4 4.6374 � 10�5
d 0.195027 �3.915 � 10�2
e �66.139488 13.209723
Source: [23].
i n t e rn a t i o n a l j o u r n a l o f h y d r o g e n en e r g y 3 7 ( 2 0 1 2 ) 1 6 8 9e1 6 9 71692
3.3. Solid oxide fuel cell (SOFC)
The solid oxide fuel cell unit, Fig. 3, uses the syngas produced
from the gasification process. The supply fuel is mixed with
circulated gas that exists from the anode side. The steam
reforming process ofmethane and thewater gas shift reaction
occurs in the anode side where the electrochemical reaction
also occurs. The compressed air is directed to the cathode side
as it works as an oxidant. The electrons, which are produced
at the anode side, are directed to the cathode side and reacted
with the oxygenmolecules. The oxide ions produced from this
reaction at the cathode side diffuse to the anode through the
electrolyte layer. The electric current is produced by the flow
of electrons. The SOFC is assumed to be internally reforming,
and the reforming and shifting reactions maintain equilib-
rium conditions.
For the reforming reaction:
CH4 þH2O4COþ 3H2 (13)
For the shifting reaction:
COþH2O4CO2 þH2 (14)
The net electrochemical reaction of the fuel cell is given by:
H2 þ 1=2O2/H2O (15)
where the equilibrium constants can be determined as
a function of the operating temperature. They can also be
formulated as a function of the partial pressure of reactants
and products according to the reactions above as:
Kreform ¼ P3H2PCO
PCH4PH2O
(16)
KShift ¼ PH2PCO2
PCOPH2O(17)
The component partial pressures can be expressed as
a function of their concentrations. The equilibrium constants
can be determined from the following polynomial which
presents the equilibrium constant as a function of the oper-
ating temperature. The values of the constants are shown in
Table 3 for the reforming and shifting reaction [23].
log K ¼ aT4 þ bT3 þ cT2 þ dTþ e (18)
Fig. 3 e Schematic diagram of IR- SOFC.
The equilibrium constants can also be expressed in terms of
the molar composition as follows:
Kreform ¼ y3eq;H2
:yeq;CO
yeq;CH4:yeq;H2O
x
�PPO
�2
(19)
KShift ¼ yeq;H2:yeq;CO2
yeq;CO:yeq;H2O(20)
where yeq;i represents the equilibrium molar concentration of
the compositions. This can be expressed as the ratio of the
equilibrium number of moles of the component to the total
number of moles at equilibrium as follows:
yeq;i ¼_nf3;i
_nf3(21)
For the equilibrium number of moles for each composition,
the following relations are used based on the equilibrium
reactions of reforming, shifting and electrochemical reactions
as follows:
_nf3;CH4¼ _nf2;CH4
� a (22)
_nf3;CO ¼ _nf2;CO þ a� b (23)
_nf3;CO2¼ _nf2;CO2
þ b (24)
_nf3;H2¼ _nf2;H2
þ 3aþ b� c (25)
_nf3;H2O ¼ _nf2;H2O � a� bþ c (26)
The total number of moles at equilibrium can be found by
adding the right sides of the equilibrium number of the
previous molar equations, yielding:
_nf3 ¼ _nf2 þ 2a (27)
where _nf2;i represents the number ofmoles of fuel composition
flowing into the fuel cell at state 2, which is indicated in Fig. 3.
Here a and b represent the extent of conversion of CH4 and CO
in the reforming and shifting reactions, respectively, and c
represents the hydrogen conversion during the electro-
chemical reaction. This is the molar flow rate of hydrogen
utilized in the fuel cell. The value of c can be calculated from
the following equation [24]:
c ¼ Uf :�_nf1;H2O þ 3aþ b
���1� rþ r:Uf
�(28)
where r is the recirculation ratio of the anode outlet, and Uf is
the fuel utilization ratio. The number of moles for the fuel

Fig. 4 e Exergy destruction in the system components for
case 1.
i n t e r n a t i o n a l j o u r n a l o f h y d r o g e n en e r g y 3 7 ( 2 0 1 2 ) 1 6 8 9e1 6 9 7 1693
composition entering the fuel cell at state 2 can be calculated
from the following equation:
_nf2;i ¼ _nf1;i þ yeq;i:r: _nf3 (29)
The electric current produced can be expressed as
j ¼ 2F:c (30)
The fuel cell reversible potential can be calculated from the
Nernst equation [8] as follows:
V ¼ 1:19þ R:T2:F
ln
PH2
:PO21=2
PH2O
!(31)
The potential estimated from the Nernst equation is reduced
because of fuel cell ohmic, activation and concentration losses.
In this study, these losses are neglected [13]. The electric work
produced by the fuel cell can be obtained as follows:
Wel ¼ j:V (32)
In the analysis of the solid oxide fuel cell, it is assumed to be
insulated [24], and the following assumptions are used. The
solid oxide fuel cell works at a steady state condition. The
pressure drop across the fuel cell is neglected. The gasmixture
is leaving the fuel cell at a chemical equilibrium condition.
Finally, the fuel cell is insulated and there is no heat exchange
with the surroundings.
3.4. Gas turbine cycle
The mixed gas exiting from the fuel cell is directed to the
combustionchamberafter itflowsthroughtherecuperator.The
gas is thenmixedwithnatural gas.Theexhaust gas isexpanded
then in the gas turbine, it produces mechanical work. The
natural gas has the following composition: 93.9% CH4, 3.2%
C2H6, 1.1% C3H8, 1% CO2 and 0.8% N2 [20]. Compressed air is
added for thecombustionprocess.Theseparatednitrogen from
theair separationunit is alsomixed in thecombustionchamber
for limiting the temperature at the gas turbine inlet to 1250 �C,and to help reduce the formation of nitrous oxides.
4. Results and discussion
Based on the thermodynamic model of the system, an EES
(Engineering Equation Solver) code is written to study the
Table 4 e Performance data for the system operation inthe base case.
Performance parameters (assumed)
Compressor pressure ratio 15
Gas turbine inlet temperature, K 1450
SOFC operating temperature, K 1273
Steam turbine inlet temperature, K 823
Steam turbine inlet pressure, bar 80
Coal feeding rate, tons/hr 6.69
Gas turbine isentropic efficiency, % 85
Compressor isentropic efficiency, % 85
Pump isentropic efficiency, % 96
Atmospheric air; O2, N2 (% vol.) 21, 79
performance of the system components. Table 4 shows the
performance data in the system analyses. A parametric study
is performed to investigate the effects of changing the pres-
sure ratio through the system on the exergetic performance of
different system components. Comparisons between two
Fig. 5 e Exergy efficiency in the system components for
cases (a) 1 and (b) 2.

Fig. 8 e Exergy efficiency of the system components for
cases 1 and 2 at To [ 20 �C.
Fig. 6 e Exergy destruction in the system components as
a percentage of total exergy destruction for cases (a) 1 and
(b) 2.
Fig. 7 e Exergy destruction as a percentage of the total fuel
exergy input for cases 1 and 2 at To [ 20 �C.
i n t e rn a t i o n a l j o u r n a l o f h y d r o g e n en e r g y 3 7 ( 2 0 1 2 ) 1 6 8 9e1 6 9 71694
different types of supply fuels to the gasifier are performed.
The exergy destruction and exergy efficiency of different
components are studied. Based on an energy analysis of the
system for the case 1 type of fuel, the power produced by the
steam turbine is 5.41 MW. The fuel cell produces 12.8 MW of
electric work at 55.8% energy efficiency. The gas turbine net
work output is 19.3MW. Under the same operating conditions,
the overall energy and exergy efficiencies of the system were
calculated as 38.1% and 27%, respectively. As a comparison
with the overall performance of the integrated system, using
the case 2 type of fuel results in overall energy and exergy
efficiencies of 36.7%, and 23.2%, respectively. The analyses
and results in Figs. 5e9 are performed at a compressor pres-
sure ratio of 15. Table 4 shows the data of systemperformance
and Table 5 shows the gas composition for case 1 at different
states corresponding to Fig. 2.
Exergy destruction in the system component for case 1 is
shown as a percentage of the total exergy destruction in the
whole system in Fig. 4. The most significant exergy destruc-
tion occurs in the fuel cell. Significant exergy destruction can
Fig. 9 e Pressure ratio effect on the performance of the
gasifier.

Table 5 e Gas state point data and composition through the system for case 1.
State Temperature[K]
Mass flowrate [tons/h]
Molar composition, %
CH4 CO2 CO H2 H2O O2 N2
1 293 84.67 0 0 0 0 0 21 79
2 733 84.67 0 0 0 0 0 21 79
3 1885 7.38 0.1 10.6 51.6 35.1 0 0 2.6
4 850 7.38 0.1 10.6 51.6 35.1 0 0 2.6
5 850 7.38 0.1 10.6 51.6 35.1 0 0 2.6
6 733 36.14 0 0 0 0 0 21 79
7 850 36.14 0 0 0 0 0 21 79
8 1273 43.52 0 14.87 0.25 3.13 5.44 8.88 67.43
9 1100 43.52 0 14.87 0.25 3.13 5.44 8.88 67.43
10 1450 117.07 0 9.844 0 0 11.57 1.202 77.38
11 746.6 117.07 0 9.844 0 0 11.57 1.202 77.38
12 435 117.07 0 9.844 0 0 11.57 1.202 77.38
i n t e r n a t i o n a l j o u r n a l o f h y d r o g e n en e r g y 3 7 ( 2 0 1 2 ) 1 6 8 9e1 6 9 7 1695
also be noticed in the gasifier, combustion chamber and the
HRSG as well. Fig. 5 shows the effect of changing the reference
temperature on the exergetic performance of different
components of the system for the two different types of coal.
The performance is characterized by the exergy efficiency of
the devices. Three different values of reference temperature
have been studied: 10, 20 and 30 �C, respectively.In Fig. 6, the devices performance are shown based on the
exergy destruction as a percentage of the total exergy
destruction within the integrated system, at different refer-
ence temperature values, for two different cases. From Fig. 6,
it appears that the exergy destruction is affected by the
change of reference temperature. Exergy destruction
increases with temperature for the gasifier, combustion
chamber and HRSG, however it decreases for the fuel cell, as it
is shown for the two cases. The results shown in Fig. 7
represent a comparison between the exergy destruction as
a percentage of the exergy of the fuels fed for different devices
in cases 1 and 2, at the reference temperature of 20 �C. Fig. 8shows a comparison between the exergy efficiency of
different devices performing in case 1 and 2.
Figs. 9e11 show the effects of changing the pressure ratio
of the gas turbine compressor on the exergetic performance of
the gasifier, fuel cell and combustion chamber, where the
dominant exergy destruction occurred. The exergetic perfor-
mance is presented by the exergy efficiency and the exergy
destruction as a percentage of the exergy of fuel input. Two
Fig. 10 e Pressure ratio effect on the fuel cell performance
at different fuel cell operating temperatures.
different fuel cell operating temperatures are investigated for
the fuel cell and the combustion chamber. The fuel cell
operating temperature has no effect on the gasifier. Fig. 9
shows that increasing the pressure ratio enhances the
exergy efficiency of the gasifier. The output syngas will be at
a higher pressure and temperature, causing a higher exergy
output of the system. For the solid oxide fuel cell, Fig. 10,
increasing the pressure ratio decreases the exergy destruc-
tion. This is might be as a result of the increase of the fuel cell
work with the increase of the pressure ratio, so the exergy
destruction decreases and exergy efficiency increases. On the
other hand, increasing the fuel cell operating temperature
decreases the exergy efficiency of the fuel cell and the exergy
destruction increases.
Fig. 11 shows the effect of pressure ratio variation on the
combustion chamber. Increasing the pressure ratio causes
a decrease in the combustible gases in the exhaust of the
fuel cell, which is directed to the combustion chamber. This
implies a reduction in the extent of combustion, and
decrease in the exergy destruction of the combustion
chamber. However, after a pressure ratio value of 25, the
enhancements of performance become lower, due to mixing
with natural gas fuel in the combustion chamber. Increases
of the fuel cell temperature means an increase of the fuel
cell exhaust gas flow that is delivered to the combustion
chamber. This leads to higher exergy destruction in the
combustion chamber.
Fig. 11 e Pressure ratio effect on the combustion chamber
performance at different fuel cell operating temperatures.

i n t e rn a t i o n a l j o u r n a l o f h y d r o g e n en e r g y 3 7 ( 2 0 1 2 ) 1 6 8 9e1 6 9 71696
5. Conclusions
Coal gasification technology integrated with a solid oxide fuel
cell is a promising alternative for energy sustainability. This
study has performed thermodynamic analyses based on
energy and exergy to investigate the performance of the
integrated system and determine the extent of the system
components to be enhanced for higher efficiency. Two
different types of coal have been used in the gasification
process. The total energy and exergy efficiencies of the system
were calculated as 38.1% and 27%, respectively, for case 1, and
36.7% and 23.2%, respectively, for case 2. The effect of varia-
tions of pressure ratio of the gas turbine compressor on
different devices has also been studied. For the gasifier, SOFC,
and the combustion chamber, increasing the pressure ratio
enhances the performance of these devices. It decreases the
exergy destruction across the device. Increasing the fuel cell
operating temperature causes more exergy destruction in the
combustion chamber and the fuel cell. Three different refer-
ence temperature values are applied to study its effect on the
exergetic performance of different devices.
Acknowledgments
Financial support from the Natural Sciences and Engineering
Research Council of Canada is gratefully acknowledged.
Nomenclature
ex Specific molar exergy, kJ/kmol_Exd Exergy destruction, kW
F Faraday constant
h Specific molar enthalpy, kJ/kmol
j Current density, mA/cm2
K Equilibrium constant_n Molar flow rate, kmol/s
P Partial pressure, pressure, kPa_Q Heat flow rate, kW
r SOFC anode circulation ratio
R Universal gas constant, kJ/kmol K_Sgen Entropy generation, kW/K
s Specific molar entropy, kJ/kmol K
T Temperature, K
U Utilization factor, %
V Cell voltage, V_W Work rate, kW
g Mole fraction
Greek symbols
h Energy efficiency, %
J Exergy efficiency, %
Subscripts
cv Control volume
eq Equilibrium
i State, or device
f Fuel
Acronym
ASU Air separation unit
HHV Higher heating value
HRSG Heat recovery steam generator
IGCC Integrated gasification combined cycle
LHV Lower heating value
SOFC Solid oxide fuel cell
SRU Sulphur removal unit
r e f e r e n c e s
[1] DOE. Clean energy plants for the 21st century. Washington,DC, USA: US Department of Energy; 1999.
[2] Yamashita K, Barreto L. Energyplexes for the 21st century:coal gasification for co-producing hydrogen, electricity andliquid fuels. Energy 2005;30:2453e73.
[3] Liu K, Chunshan S, Subramani V. Hydrogen and syngasproduction and purification technologies. AlChE, Wiley; 2010.
[4] Souza-Santos M. Solid fuels combustion and gasification:modeling, simulation and equipment operation. Taylor &Francis; 2010.
[5] Horlock JH. Combined power plants: past, present andfuture. Transactions of ASME Journal of Engineering GasTurbines and Power 1995;117:608e16.
[6] Kelhofer R. Combined cycle gas and steam power plants.Fairmount Press, Inc; 1991.
[7] Kreutz TG, Williams RH, Socolow RH, Chiesa P, Lozza G.Production of hydrogen and electricity from coal with CO2
capture; 2002. 6th greenhouse gas control conference, Kyoto,Japan.
[8] Massardo AF, Lubelli F. Internal reforming solid oxide fuelcell - gas turbine: part A: cell model and cyclethermodynamic analysis. Journal of Engineering for GasTurbine and Power 2000;122:27e35.
[9] Pangalis MG, Martinez-Botas RF, Brandon NP. Integration ofsolid oxide fuel cells into gas turbine power generationcycles. Part I: fuel cell thermodynamic modeling. Institutionof Mechanical Engineers Part A 2002;216:129e44.
[10] Dincer I, Rosen M, Zamfirescu C. Exergetic performanceanalysis of a gas turbine cycle integrated with a solid oxidefuel cells. Journal of Energy Resources Technology 2009;131:1e11.
[11] Cormos C. Evaluation of energy integration aspects for IGGC-based hydrogen and electricity co-production with carboncapture and storage. International Journal of HydrogenEnergy 2010;35:7485e97.
[12] Cormos C, Starr F, Tzimas E, Peteves S. Innovative conceptsfor hydrogen production processes based on coal gasificationwith CO2 capture. International Journal of Hydrogen Energy2008;33:1286e94.
[13] Ghosh S, De S. Energy analysis of a cogeneration plant usingcoal gasification and solid oxide fuel cell. Energy 2006;31:345e63.
[14] Ghosh S, De S. Exergy analysis of a cogeneration plant usingcoal gasification and solid oxide fuel cell. InternationalJournal of Energy Research 2006;30:647e58.
[15] Jin H, Lu Y, Liao B, Guo L, Zhang X. Hydrogen production bycoal gasification in supercritical water with fluidized bedreactor. International Journal of Hydrogen Energy 2010;35:7151e60.
[16] Li Y, Guo L, Zhang X, Jin H, Lu Y. Hydrogen production fromcoal gasification in supercritical water with continuousflowing system. International Journal of Hydrogen Energy2010;35:3036e45.

i n t e r n a t i o n a l j o u r n a l o f h y d r o g e n en e r g y 3 7 ( 2 0 1 2 ) 1 6 8 9e1 6 9 7 1697
[17] Dincer I, Rosen MA. Exergy: energy, environment andsustainable development. Elsevier; 2007.
[18] Kotas TJ. The exergy method of thermal plant analysis.Florida: Krieger Publishing Co; 1995.
[19] Boles M, Cengel Y. Thermodynamics: an engineeringapproach. 7th ed. McGraw-Hill; 2011.
[20] DOE. National energy technology laboratory, fuel cellhandbook. Honolulu, Hawaii: University Press of the Pacific;2005.
[21] Miller BG. Coal energy systems. Elsevier Academic Press;2005.
[22] DeS,Nag PK. Thermodynamic analysis of a partial gasificationpressurized combustion and supercritical steam combinedcycle. Proceedings of Institution ofMechanical Engineers, PartA: Journal of Power and Energy 2000;214:565e74.
[23] Chan SH, Ho HK, Tian Y. Modelling of simple hybrid solidoxide fuel cell and gas turbine power plant. Journal of PowerSources 2002;109:111e20.
[24] Colpan CO, Dincer I, Hamdullahpur F. Thermodynamicmodeling of direct internal reforming solid oxide fuel cellsoperating with syngas. International Journal of HydrogenEnergy 2007;32:787e95.
Top Related
Copyright © 2022 FDOKUMEN

