


Bahasa
Halaman
Hukum

Electrochemical Analysis of H2S Corrosion on 13% Chromium
Stainless Steel
By Mohammed Abdul Rahman
Thesis submitted
to the School of Graduate Studies in partial fulfillment of the
requirements for the degree of
Master of Engineering
(Department of Mechanical Engineering)
Faculty of Engineering and Applied Sciences
Memorial University of Newfoundland
May 2018
St. John’s Newfoundland and Labrador

i
“Dedicated to my parents
Mohammed Abdul Qayoom Basith and Nasreen Sultana”
ii
ABSTRACT
The chemical reactions between steel and a corrosive environment cause severe corrosion, which
has become a significant concern for the oil and gas industry due to the increase in the number of
oil field shutdowns and equipment failures as the exploration of sour oil fields has considerably
increased in the last decade. This research studies the effect of the hydrogen sulphide (H2S)
environment on 13% chromium stainless steel, one of the most commonly used corrosion resistant
alloy in the oil industry for sour oil fields containing hydrogen sulphide. The corrosion behaviour,
including corrosion rates, the effect of environmental conditions and the formation of protective
films, were examined during the study. A series of experiments was performed using the
conventional electrochemical method to study the effects of temperature, pH and immersion time
on the corrosion behaviour of 13% chromium stainless steel in the H2S environment. Corrosion
behaviour was monitored using the polarisation resistance technique. A scanning electron
microscope (SEM) equipped with energy dispersive X-ray spectroscopy (EDS) was used to
conduct morphological characterization and X-ray diffraction (XRD) was used to study the crystal
structure of corrosion products. This study shows that each environmental parameter has a
significant impact on corrosion behaviour.

iii
ACKNOWLEDGEMENTS
I appreciate and would like to thank my supervisor, Dr. John Shirokoff, for his dedication,
direction, and supervision of my research and academic life. His excellent guidance has helped me
complete my thesis.
Many people have helped me during this research period. Firstly, I would like to thank Mr. Steve
Steele for assisting me in using the corrosion laboratory. Also, I would like to extend my
appreciation to Dr. David Grant and Dr. Wanda Alyward for their help with the SEM and XRD
equipment.
I appreciate Dr. Ali Nasiri for his comments during my experimental setup and Ladan Khaksar
(Ph.D. student) for helping me during the beginning of my research.
I would also like to thank my friend Shams Anwar (Ph.D. student) for helping me write a
MATLAB code to generate graphs.
I am grateful for the financial support provided by Memorial University of Newfoundland and
Suncor Energy.
I am considerably indebted to my family members, especially my parents, for their support and
understanding.
Finally, I would like to thank all my friends and colleagues.
iv
TABLE OF CONTENTS
ABSTRACT………………………………………………………………………………………ii
ACKNOWLEDGMENTS ............................................................................................................. iii
TABLE OF CONTENTS ............................................................................................................... iv
LIST OF TABLES ........................................................................................................................ vii
LIST OF FIGURES ..................................................................................................................... viii
ABBREVIATIONS ....................................................................................................................... xi
NOMENCLATURE ................................................................................................................... xiii
1. INTRODUCTION ...................................................................................................................... 1
1.1. Overview .............................................................................................................................. 1
1.2. Research objective ............................................................................................................... 2
1.3. The organization of thesis .................................................................................................... 2
2. INSTRUMENTATION .............................................................................................................. 4
2.1. Potentiostat ........................................................................................................................... 4
2.2. Scanning electron microscope (SEM) .................................................................................. 5
2.3. Energy dispersive X-ray spectroscopy (EDS) ...................................................................... 6
2.4. X-ray diffraction (XRD) ...................................................................................................... 7
v
3. LITERATURE REVIEW………………………………………………………………...…….9
3.1. Sour oil field exploration ..................................................................................................... 9
3.2. Corrosion problems in sour oil field exploration ................................................................. 9
3.3. Corrosion resistant alloys used in sour oil field exploration .............................................. 10
3.4. Hydrogen sulphide ............................................................................................................. 11
3.4.1. Hydrogen sulphide corrosion………………………………………… …....……12
3.4.2. Effect of temperature……………………………………………………… ........ 13
3.4.3. Effect of pH………………... ................... ………………………………………13
3.4.4. Effect of hydrogen sulphide concentration…………………… .......... …………13
3.4.5. Effect of immersion time……………..…………………………. ...... …………14
3.5. Corrosion product layers in hydrogen sulphide environment ............................................ 14
3.6. Electrochemical methods ................................................................................................... 16
3.6.1. Galvanic corrosion…………. .......... ……………………………………………16
3.6.2. Linear polarisation resistance ............................................................................... 16
3.6.3. Potentiodynamic polarisation technique .............................................................. 19
4. EXPERIMENTAL SETUP……………………………………………………………………22
4.1. Experimental details ........................................................................................................... 22
4.2. The Pourbaix diagram of the chemical bath……………………………………..………..25
4.3. Surface morphology observation and corrosion product analysis……………..……..…..27
vi
5. RESULTS AND DISCUSSION…………………………………………...………..………...28
5.1. Effect of temperature on the corrosion behaviour of 13% chromium stainless steel ......... 28
5.2. Corrosion rate with respect to the change in temperature .................................................. 31
5.3. Effect of pH on the corrosion behaviour of 13% chromium stainless steel ....................... 32
5.4. Corrosion rate with respect to the change in pH value ...................................................... 35
5.5. Effect of immersion time on the corrosion behaviour of 13% chromium stainless steel…36
5.6. Corrosion rate with respect to the change in immersion time ............................................ 39
5.7. Scanning electron microscope (SEM) and Energy dispersive X-ray spectroscopy (EDS)
……...………………………………………………………………………………………….41
5.8. X-ray diffraction (XRD) .................................................................................................... 48
6. CONCLUSION ......................................................................................................................... 51
7. FUTURE WORK AND RECOMMENDATIONS…………………………………..……….52
REFERENCES ............................................................................................................................. 53
APPENDIX ................................................................................................................................... 60
vii
LIST OF TABLES
Table 4.1.1 Experimental parameters .......................................................................................... 22
Table 4.1.2 The chemical composition of the specimen .............................................................. 22
Table 4.1.3 Bath compositions for the corrosion film formation on the steel substrate………….23
Table 4.2.1 List of the conditions for experimental parameters .................................................. 26
viii
LIST OF FIGURES
Figure 2.2.1 Sample image of Scanning electron microscope (SEM image of Iron sulphide
layer)……………………………..………………………………………………………….…5
Figure 2.3.1 Sample image of EDS showing the composition of Iron sulphide layer on the steel
surface……….…………………….…………………………………………………………...6
Figure 2.4.1 XRD pattern of the corrosion sample ......................................................................... 7
Figure 3.6.2.1 Linear polarisation resistance curves .................................................................... 17
Figure 3.6.3.1 Anodic polarisation scan for stainless steel .......................................................... 19
Figure 3.6.3.2 Cathodic polarisation scan for stainless steel ....................................................... 20
Figure 4.1.1 Iron (II) chloride solution ........................................................................................ 24
Figure 4.1.2 Urea solution ........................................................................................................... 24
Figure 4.1.3 Thioacetamide solution ........................................................................................... 24
Figure 4.2.1 Pourbaix diagram for steel substrate immersed in a chemical bath ......................... 25
Figure 5.1.1 Polarisation curves of 13% chromium stainless steel at different temperatures: 40ᴼC
and 50ᴼC at pH2 ...................................................................................................................... 28
Figure 5.1.2 Polarisation curves of 13% chromium stainless steel at different temperatures: 50ᴼC
and 70ᴼC at pH2 ...................................................................................................................... 29
ix
Figure 5.1.3 Polarisation curves of 13% chromium stainless steel at different temperatures: 40ᴼC
and 70ᴼC at pH3 ...................................................................................................................... 30
Figure 5.2.1 Corrosion rates measured at different temperatures having the same pH and
immersion time ......................................................................................................................... 31
Figure 5.3.1 Polarisation curves of 13% chromium stainless steel at different pH values: pH2 and
pH3 at 40ᴼC ............................................................................................................................. 32
Figure 5.3.2 Polarisation curves of 13% chromium stainless steel at different pH values: pH2 and
pH3 at 70ᴼC ............................................................................................................................. 33
Figure 5.3.3 Polarisation curves of 13% chromium stainless steel at different pH values: pH4 and
pH5 at 80ᴼC ............................................................................................................................. 34
Figure 5.4.1 Corrosion rates measured at different pH values having the same temperature and
immersion time ......................................................................................................................... 35
Figure 5.5.1 Polarisation curves of 13% chromium stainless steel at different immersion times: 24
hours and 48 hours at pH2, 40ᴼC ............................................................................................ 36
Figure 5.5.2 Polarisation curves of 13% chromium stainless steel at different immersion times: 24
hours and 48 hours at pH3, 40ᴼC ............................................................................................ 37
Figure 5.5.3 Polarisation curves of 13% chromium stainless steel at different immersion times: 24
hours and 48 hours at pH3, 80ᴼC ............................................................................................ 38
Figure 5.6.1 Corrosion rates measured at different immersion times having the same temperature
and pH value ............................................................................................................................ 39
x
Figure 5.7.1 SEM images and EDS analysis of the corrosion products formed on the steel surface
for (a) original uncorroded sample (b) pH2, 50ᴼC, 24 hours (c) pH2, 70ᴼC, 24 hours ........... 42
Figure 5.7.2 SEM images and EDS analysis of the corrosion products formed on the steel surface
for (d) pH3, 40ᴼC, 48 hours (e) pH3, 70ᴼC, 48 hours (f) pH4, 80ᴼC, 48 hours ....................... 43
Figure 5.7.3 SEM images and EDS analysis of the corrosion products formed on the steel surface
for (g) pH5, 80ᴼC, 48 hours (h) pH6, 50ᴼC, 24 hours (i) pH6, 50ᴼC, 48 hours ....................... 45
Figure 5.8.1 XRD analysis of the corrosion product formed on the steel surface for (a) pH2, 40ᴼC,
24 hours (b) pH2, 40ᴼC, 48 hours (c) pH2, 40ᴼC, 72 hours (d) pH2, 70ᴼC, 24 hours ............. 48
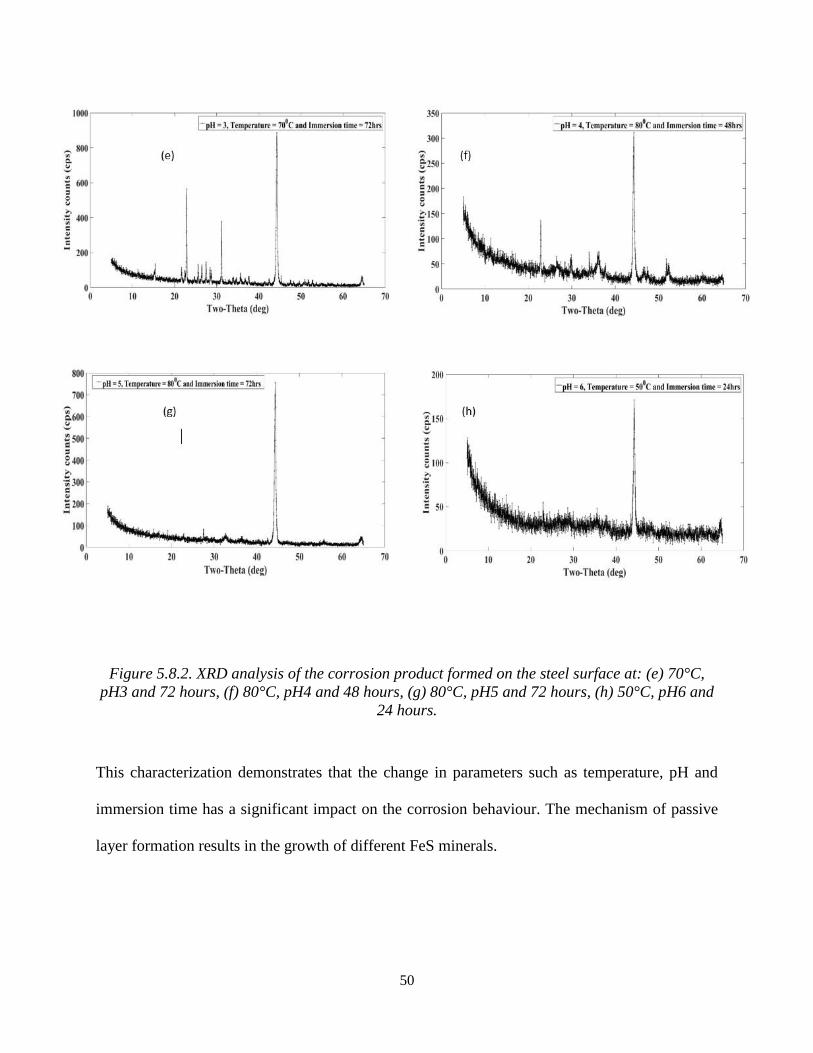
Figure 5.8.2 XRD analysis of the corrosion product formed on the steel surface for (e) pH3, 70ᴼC,
72 hours (f) pH4, 80ᴼC, 48 hours (g) pH5, 80ᴼC, 72 hours (h) pH6, 50ᴼC, 24 hours ............. 50
xi
ABBREVIATIONS
BCC Body Center Cubic
CAMI Coated Abrasive Manufacturers Institute
CE Counter Electrode
RE Reference Electrode
WE Working Electrode
CR Corrosion Rate
CRA Corrosion Resistant Alloy
EDS Energy Dispersive X-ray Spectroscopy
ICDD International Center for Diffraction Data
JCPDS Joint Committee on Powder Diffraction Standards
LPR Linear Polarization Resistance
NACE National Association of Corrosion Engineers
OCP Open Circuit Potential
PDF Powder Diffraction Files
SEM Scanning Electron Microscope
HIC Hydrogen-Induced Cracking
SSC Sulfide Stress Cracking

xii
SOHIC Stress-Oriented Hydrogen Induced Cracking
XRD X-ray Diffraction

xiii
NOMENCLATURE
M Molar
g Gram
L Litre
A Ampere
mA Mili Ampere
nA Nano Ampere
°C Degrees Celsius
V Voltage
i Current
S Second
pH Measure of hydrogen ion concentration
mm Millimeter
cm Centimeter
h Hour
E Potential
Ecorr Corrosion potential
Icorr Corrosion current
1
1. INTRODUCTION
1.1 OVERVIEW
Oil and gas exploration in highly corrosive environments has significantly increased in recent
years, making hydrogen sulphide (H2S) corrosion an important topic of research after several
pipeline failures and due to the safety risks associated with this dangerous gas. Compared to the
number of studies on carbon dioxide (CO2) corrosion, there is a limited amount of experimental
work available on hydrogen sulphide (H2S) corrosion, due to the difficulty in working with
hydrogen sulphide gas [1]. Corrosion resistance alloys (CRA) are used in the H2S environment
due to the passive film formation along with the self-repair nature of those passive films, but these
CRA started corroding once these passive layers stopped forming efficiently [2]. The internal
corrosion of the corrosion resistant alloys is controlled by environmental parameters such as
temperature, pH value, the concentration of H2S in the environment and its immersion time. A
minute change in any of these parameters can cause severe corrosion, causing catastrophic
damages leading to the shutdown of the oilfields. The formation and growth of corrosive films on
the steel surface are directly dependent on these environmental parameters. In some extreme
conditions, the formed corrosion film is not sufficient to protect the underlying steel, which
initiates localized corrosion with high corrosion rates, and very little research has been done related
H2S corrosion in the oil industry [3][4].
Another corrosion concern in the industry is the transportation of the oil and gas. Supply of oil and
gas in huge volumes are being done by pipelines since many decades, as a reliable and economical
method. To achieve the requirements for oil and gas, these pipelines run hundreds of kilometers
and corrosion makes it difficult to maintain the integrity of such large networks. This transportation
is commonly in multiphase form, which contains gases such as CO2, H2S, and a few other particles

2
in the transmission pipelines, these gases and particles will accelerate the corrosion rate of the
pipeline [5]. The corrosion cost has increased to by millions of dollars in recent years [6].
1.2 RESEARCH OBJECTIVE
This research aims to understand the electrochemical behaviour of the most commonly used
corrosion resistant alloy (CRA) in H2S environments, which is 13% chromium stainless steel. This
study includes the corrosion behaviour with the changes in environmental parameters, corrosion
rates for different conditions, the growth of sulphide films under each condition and the impact of
these protective films. This goal will be achieved by investigating a steel sample placed in an
electrochemical cell with different experimental parameters and analyzing the sample after specific
immersion times using the polarisation resistance technique. The morphological properties and
crystalline phase structure of the sample are examined by scanning electron microscope (SEM)
installed with energy dispersive spectroscopy (EDS) and X-ray diffraction (XRD).
1.3 ORGANISATION OF THESIS
This thesis is organized into six chapters which include Introduction, Literature review,
Experimental details, Results and discussions, Conclusion and Future works.
Chapter 1: Introduction, introduces the background and current problems in the oil and gas industry
regarding H2S corrosion, the objective of this research and its organization.
Chapter 2: Instrumentation, describes the instruments used in this research work, such as the
Potentiostat, SEM, EDS and XRD.
3
Chapter 3: Literature Review, reviews oil fields’ exploration and encountering of corrosive gases,
the corrosion problems in the sour oil fields and currently used corrosion resistant alloys. The
techniques and methods used to conduct the experiments are also discussed.
Chapter 4: Experimental details, introduces the experimental setup, the bath preparation, the
electrochemical setup and various parameters used to conduct different experiments.
Chapter 5: Results and discussion, focuses on the results obtained by experiments and the analysis
of a sample using various techniques and equipments. It also discusses the obtained results in the
form of discussion.
Chapter 6: Conclusion, summarises the results of this research and draws a major conclusion from
the obtained findings.
Chapter 7: Future work, suggests the way to further this research work and its findings.
4
2 INSTRUMENTATION
In this research, the instruments needed for the experimentation and characterization of samples
include the Potentiostat, Scanning Electron Microscope (SEM), Energy Dispersive X-ray
Spectroscopy (EDS) and X-ray diffraction (XRD).
2.1 POTENTIOSTAT
A potentiostat is a simple device that depends on operational amplifiers to maintain a desired
potential difference between two electrodes (working and reference electrodes) immersed in a
solution while recording the electrical current that flows between them. Usually, a third electrode
(counter electrode) is added to the system to isolate the electrode used as a potential reference
(reference electrode) from the charge transfer reaction. The potentiostat applies a voltage and
records the current response that is characteristic of the test’s sample [7].
The counter electrode (CE) (also known as an auxiliary electrode), is an electrode which is used
to close the current circuit in the electrochemical cell. It is typically made of an inert material (e.g.
Pt, Au, graphite, glassy carbon) and generally, it does not contribute to the electrochemical
reaction. Since the current is flowing between the WE and the CE, the total surface area of the CE
should be higher than the area of the WE. Therefore, it will not be a limiting factor in the kinetics
of the electrochemical process under examination [8].
The reference electrode (RE) is an electrode with a stable and well-known electrode potential and
is used as a point of reference in the electrochemical cell for the potential control and measurement.
The high stability of the RE potential is usually attained by retaining a redox system with constant
concentrations of each participant of the redox reaction [9]. The current flow through the RE is
5
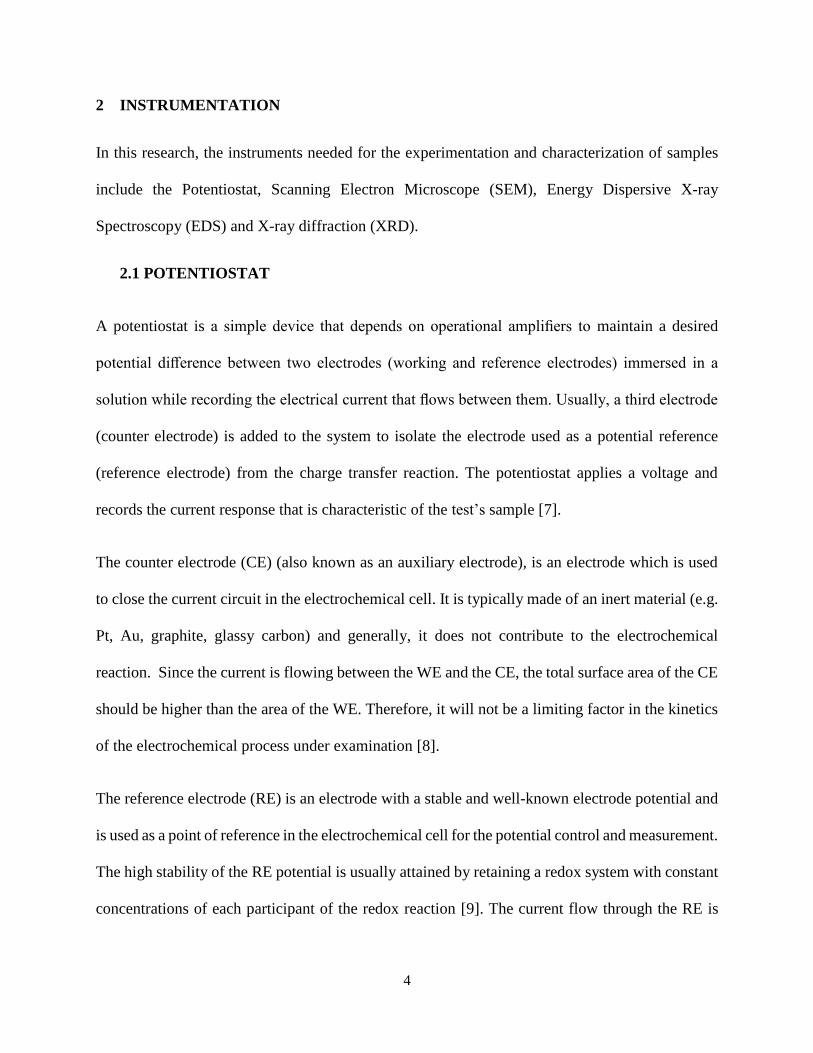
Figure 2.2.1 Sample image of Scanning electron microscope (SEM image of Iron sulphide layer).
kept close to zero, attained by using the CE to close the current circuit in the cell together with a
high input impedance on the electrometer (>100 GOhm).
The working electrode (WE) is the electrode in an electrochemical system on which the reaction
of attention is taking place. Regular WE can be made of inert materials such as gold (Au), silver
(Ag), platinum (Pt), glassy carbon (GC) and mercury (Hg) drop and film electrodes. For corrosion
applications, the material of the WE is the material under investigation. The size and shape of the
WE can also differ, depending on the application [10], [11].
2.2 SCANNING ELECTRON MICROSCOPE (SEM)
Scanning Electron Microscope is used to study the morphological characterization of the corrosion
product formed on the steel surface. It shows a magnified image of the corrosion product,
providing key insights about the corrosion film and its thickness.
6
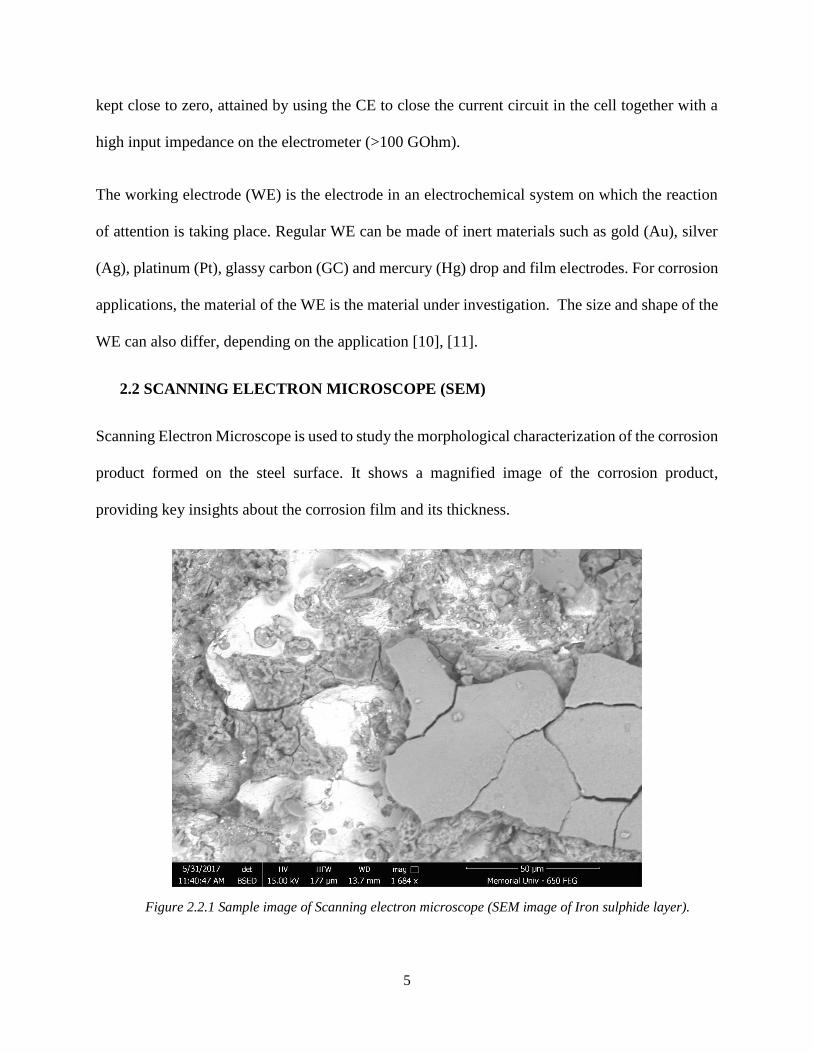
Figure 2.3.1. Sample image of EDS showing composition of Iron sulphide layer formed on the steel
surface.
SEM takes images by scanning the surface with a high beam of electrons. These electrons interact
with the atoms in the steel and send back various signals. These signals contain key morphological
and qualitative composition information of the sample’s surface which generate high-resolution
images known as SEM images [12].
The sample must be electrically conductive to be operational with the SEM equipment.
2.3 ENERGY DISPERSIVE X-RAY SPECTROSCOPY (EDS)
Energy dispersive X-ray spectroscopy, also known as EDS. It is mostly equipped with SEM and
is a tool for compositional analysis of the sample’s surface along with the SEM image.
During this analysis, a high beam of charged electrons or an X-ray beam is bombarded on the
sample surface. This bombardment displaces the inner shell electrons at the focus point and excites
them to the outer shell, emitting back rays which are measured using a spectrometer, resulting in
the compositional information of the focused sample as shown in figure 2.3.1.
7
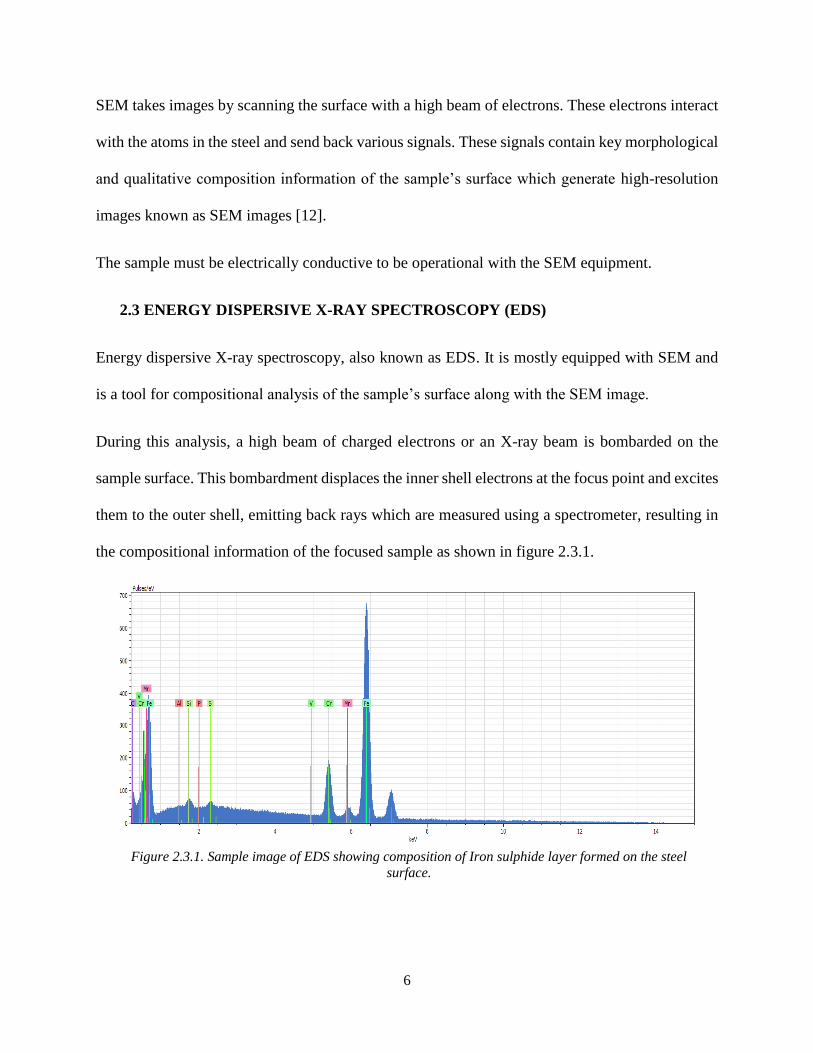
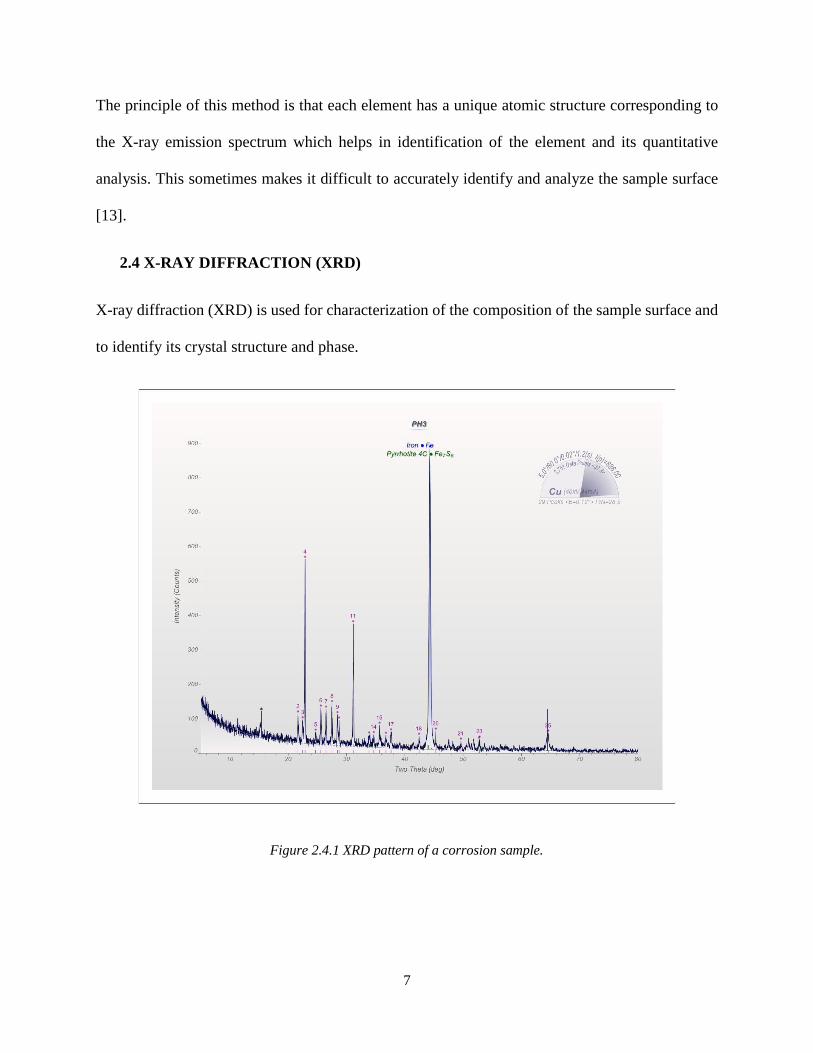
Figure 2.4.1 XRD pattern of a corrosion sample.
The principle of this method is that each element has a unique atomic structure corresponding to
the X-ray emission spectrum which helps in identification of the element and its quantitative
analysis. This sometimes makes it difficult to accurately identify and analyze the sample surface
[13].
2.4 X-RAY DIFFRACTION (XRD)
X-ray diffraction (XRD) is used for characterization of the composition of the sample surface and
to identify its crystal structure and phase.

8
During this procedure, X-ray beams generated from different angles are focused on the sample
surface. When the X-ray encounters the unique crystal structure on the sample, it becomes
diffracted, making an XRD pattern. This unknown pattern is then compared in the database with
similar peaks, which can determine the phase and crystal structure of the sample surface[13].
9
3 LITERATURE REVIEW
3.1 SOUR OIL FIELD EXPLORATION
The exploration of sour oil and gas fields has significantly increased throughout the world,
especially in an extremely corrosive oil field, including production and transportation, has become
a significant concern to the industry due to corrosive environments in sour fields, which cause
material damage and continuous shutdowns [14].
Safety standards call attention to the danger of exposure to harmful gases, mainly hydrogen
sulphide (H2S) present in this type of oil fields. Gases found in sour oil fields are detrimental to
humans. With H2S gas, a low concentration of 10 ppm is sufficient to cause stress in human beings,
and a concentration of 250ppm quickly leads to death [15].
In sour oil production fields, elemental sulphur deposition appears in the fields with high H2S
concentration. H2S is more soluble in the aqueous state compared to other gases found in sour oil
fields. This solid elemental sulphur contacts the steel in the aqueous state, causing severe corrosion
damage to the pipelines. Sour oil corrosion damage has become a major issue in the industry and
researchers are still uncertain about the corrosion mechanism of sour oil fields [16], [17].
3.2 CORROSION PROBLEMS IN SOUR OIL FIELD EXPLORATION
The harmful gases causing severe corrosion problems in sour oil fields are naturally occurring
components of oil and gas and are impenetrable in the rocks during the geothermal changes over
an extended period. The corrosion in sour oil fields is a source of problems for production,
including reduced material strength, equipment failures, leakages and changes in the surface
properties [18]. H2S leads to embrittlement of carbon steel; forms of embrittlement caused by H2S
10
are hydrogen induced cracking (HIC), sulphide stress cracking (SSC), and stress-oriented
hydrogen induced cracking (SOHIC).
Hydrogen-Induced Cracking (HIC): In this type of embrittlement, hydrogen is absorbed from the
aqueous environment, leaving traces of hydrogen on the steel surface which develops pressure and
starts to crack the steel surface.
Sulphide Stress Cracking (SSC): The environmental H2S diffuses hydrogen through a chemical
reaction and attacks the stress-induced areas of the steel surface such as the welded joints. The
chemically released hydrogen starts to form on the stressed areas of the steel surface, initiating
cracks and embrittlement in a direction perpendicular to the stress.
Stress-Oriented Hydrogen Induced Cracking (SOHIC): This is typically a combination of HIC
and SSC, where cracks form perpendicularly to the stress, with a combination of hydrogen induced
cracks on the base metal surface [19][20].
3.3 CORROSION RESISTANT ALLOYS USED IN SOUR OIL FIELDS
EXPLORATION
In a harsh corrosion environment, the low alloy tubular steel has to be changed after a certain
period due to the corrosion of steel in extreme environmental conditions, especially with high
temperatures. This practice is costly to the oil and gas industry.
The finished product of a chemical reaction in an H2S aqueous medium on the steel surface is
written as:
H2S + Fe FeS +H2
11
Therefore, the corrosive H2S media in contact with steel form different corrosive layers of the iron
and sulphur anionic surface [21]. These corrosion products have a catastrophic effect on the low
alloy steel over a period. Therefore, to minimize the expenses, an alternative has been used to
counter the corrosion of the low alloy steel. The corrosion resistant alloys (CRA) were
recommended for tubular use in sour oil fields, they perform slightly better than flat alloy steel due
to the improved chemical composition. The CRA show improvement in withstanding the severe
corrosion in different environmental conditions.
The alloys satisfactory for the H2S environment are the steels with high contents of chromium
(Cr), molybdenum (Mo) or nickel (Ni). These alloys resist different types of corrosion in sour
conditions compared to flat alloy steels. The detailed outline for the selection of corrosion resistant
alloys in the H2S environment is recommended in part 3 of NACE MRO175/ISO1516-3[22], [23],
[24].
3.4 HYDROGEN SULFIDE (H2S)
Hydrogen sulphide (H2S) is a colourless, toxic and highly flammable gas with the odour of rotten
eggs. It occurs naturally in different environments such as sewers, volcanoes, oil and gas and in
some water wells. Human exposure to H2S gas may cause a severe headache, nausea, eye irritation
and insomnia. Exposure to high concentrations can cause loss of consciousness and eventually,
death due to respiratory paralysis [25], [26], [27].
The detection of H2S is enabled by the sensor using different techniques. A risky manual method
to detect H2S is by exposing a paper soaked in lead acetate to the area, the presence of H2S turns
the paper black. The most common in-situ H2S sensor are the thermal conductivity detectors, flame
photometric detectors and sulphur chemiluminescence detectors [28].
12
3.4.1 HYDROGEN SULPHIDE CORROSION
Several studies have been conducted to study H2S corrosion in oil pipelines and the reaction
between hydrogen sulphide (H2S) and water (H2O) is complicated.
The stability of different H2S corrosion products or the sulphur species (S2- or HS-) is dependent
on environmental conditions such as temperature, pH and concentration of H2S. In an H2S
environment, the different types of corrosion products commonly formed are Mackinawite,
Pyrrhotite, Troilite, Pyrite, Greigite and Marcasite.[29], [14].
This chemically deposited iron sulphide layer (FexSy) on the steel surface limits further corrosion
by protecting the steel from exposure to the H2S environment. The first iron sulphide product to
form is Mackinawite, a fragile product due to its sulphur deficiency, and with an increase of
immersion time, mackinawite break and leads to an increase of the corrosion rate and later, the
formation of stable corrosion products[30].
The dissolution of iron sulphide for the film formation can be explained as [31]:
H2S HS- + H+
HS- H+ + S2-
Fe + H2S + H2O FeHS-ad + H3O
+
FeHS-ad FeHS++ 2e-
FeHS+ FeS1-x + xHS- + (1-x)H+
FeHS+ + H3O+ Fe2+ + H2S + H2O
Fe2+ + H2S FeS + 2H+
13
Fe2+ + 2HS- Fe(HS)2
3.4.2 EFFECT OF TEMPERATURE
Temperature has a direct impact on the formation of corrosion products, which in turn changes the
rate of corrosion and type of corrosion associated with a change in temperature. The impact of
temperature has a severe effect over a short period and over long exposure, the temperature does
not have an enormous effect on the H2S corrosion. The behaviour of corrosion is directly dependent
on iron sulphide formation [32]. An increase in temperature up to 80ᴼC can increases the rate of
deposition on the steel surface [33].
3.4.3 EFFECT OF pH
The passive nature and the type of iron sulphide mineral formation are significantly dependent on
the pH value. At lower pH values such as pH2, the solubility of iron sulphide phases increase,
which dissolves iron and sulphide has a minimal effect on the precipitation on the steel surface.
However, with the rise in pH values such as a pH (3-5), the formation of iron sulphide passive
films increases on the steel surface, which inhibits the effect of H2S [34].
3.4.4 EFFECT OF H2S CONCENTRATION
The concentration of H2S has an immense effect on the corrosion behaviour of metal. In
environments with higher H2S concentration, the passive layers of iron sulphide films are loosely
packed, and the formation of blisters leads to a decrease in the protective ability of the passive film
[35].
14
3.4.5 EFFECT OF IMMERSION TIME
The efficacy of a protective barrier of corrosion products in the H2S environment depends on the
immersion time. As the immersion time increases, the passivation decreases, resulting in weak
adherence of the corrosion film to the steel surface. With an increase in immersion time, the passive
layer starts to break, which in turn exposes the surface of the steel to the harsh environment [36],
[37].
3.5 CORROSION PRODUCT LAYER IN H2S ENVIRONMENT
The rate of corrosion is highly dependent on the type of corrosion product formed on the steel
surface. The rate of film formation of the corrosive products and the precipitation rate of these
films depend on several factors, most importantly on the concentration of H2S and the pH of the
environment; different films can be formed based on their composition. The protective nature of
these films determines the rate of corrosion in the metal [38].
Corrosion product formed in the H2S environment are minerals of iron sulphide (FeS). These iron
sulphide films develop either due to precipitation or by direct chemical reaction between the sour
environment and iron (Fe)[35], [39].
The formation of FeS by precipitation:
Fe2+ (aq) +HS-(aq) ⇄ FeS (s) + H+
(aq)
FeS formed by direct chemical reaction
Fe(s) + H2S(g) FeS (s) +H2(g)
The different types of FeS films to form on the surface as corrosion products depend on the
surrounding environmental conditions. There are six different types of naturally occurring FeS
15
minerals: mackinawite (Fe1+xS), pyrrhotite (Fe1-xS), greigite (Fe3S4), smythite (Fe9S11), marcasite
(FeS2), and pyrite (FeS2) [40].
Mackinawite: Mackinawite is a sulphur deficient iron sulphide. The formula for mackinawite is
Fe1+xS where ‘x’ ranges between 0.057 to 0.064. Mackinwaite has a two-dimensional stacked FeS
structure, and it is the first corrosion product to form in low H2S concentrations as it is
thermodynamically unstable and can be converted to other FeS minerals with the addition of
sulphur content [40], [41].
Pyrrhotite: Pyrrhotite is an iron deficient iron sulphide. The formula for pyrrhotite is Fe1-xS. It is
also called Troilite [42].
Greigite: Greigite is named after a mineralogist, Joseph W. Greig. The formula for Greigite is
Fe3S4. It is isostructural, and it is ferromagnetic and semi-conductive [43], [44].
Marcasite: This is also called white iron pyrite. The formula of marcasite is FeS2 and has an
unstable crystalline structure which tends to change with the changes in the environment [13].
Pyrite: Pyrite has a cubic crystal structure and is also called fool’s gold. Its formula is FeS2 and
forms with a high content of sulphur. The structure of pyrite is found to be stable compared to
other H2S minerals.
When these protective films start to break from the surface of the steel, localized corrosion starts
to occur, which forms permanent anodic and cathodic sites on the surface [45], [46].
Environmental conditions such as temperature, pH, elemental sulphur, flow etc. play a significant
role in these processes and some research suggests chlorine ions influence the localized corrosion
in H2S systems [47]. Despite a great deal of research, the mechanism of H2S corrosion is
inadequately understood.
16
3.6 ELECTROCHEMICAL METHODS
3.6.1 GALVANIC CORROSION
Galvanic corrosion occurs between two different metals in an electrochemically active medium.
In galvanic corrosion, the more noble metal becomes cathodic and starts to corrode the less noble
metal, especially in a corrosive environment. Mostly, galvanic corrosion is even and localized at
junctions, depending on the type of alloy and the corrosive medium. If the protective film is not
formed, the corrosion will be severe and becomes chemically difficult.
When two metals are connected electrically in a corrosive medium, the difference between their
corrosion potential will cause the corrosion to initiate both oxidation and reduction processes.
Corrosion potential can determine the nobility of the metal. Hence, the metal which is less noble
will become more anodic, and the metal which is nobler will be cathodic, forming a galvanic series
based on the nobility of the metal. The metal placed at the opposite ends of the galvanic series will
have very high corrosion rate, as one metal is very anodic, and the other metal is very cathodic.
The anodic metal will be electrochemically corroded in the corrosive medium by chemical
reactions, wear and migration of ions from the less noble metal towards the more noble metal; by
this transfer of ions, the more noble metal will become more protective against corrosion in the
corrosive medium. To measure the current galvanic current between two dissimilar metals, a zero
resistance ammeter (ZRA) is used [48].
3.6.2 LINEAR POLARISATION RESISTANCE
Linear polarisation resistance (LPR) is an electrochemical method to determine the reactions in an
electrolytic solution. Corrosion rates and the exchange of current densities can be specified in an
electrochemical experiment using LPR.
17
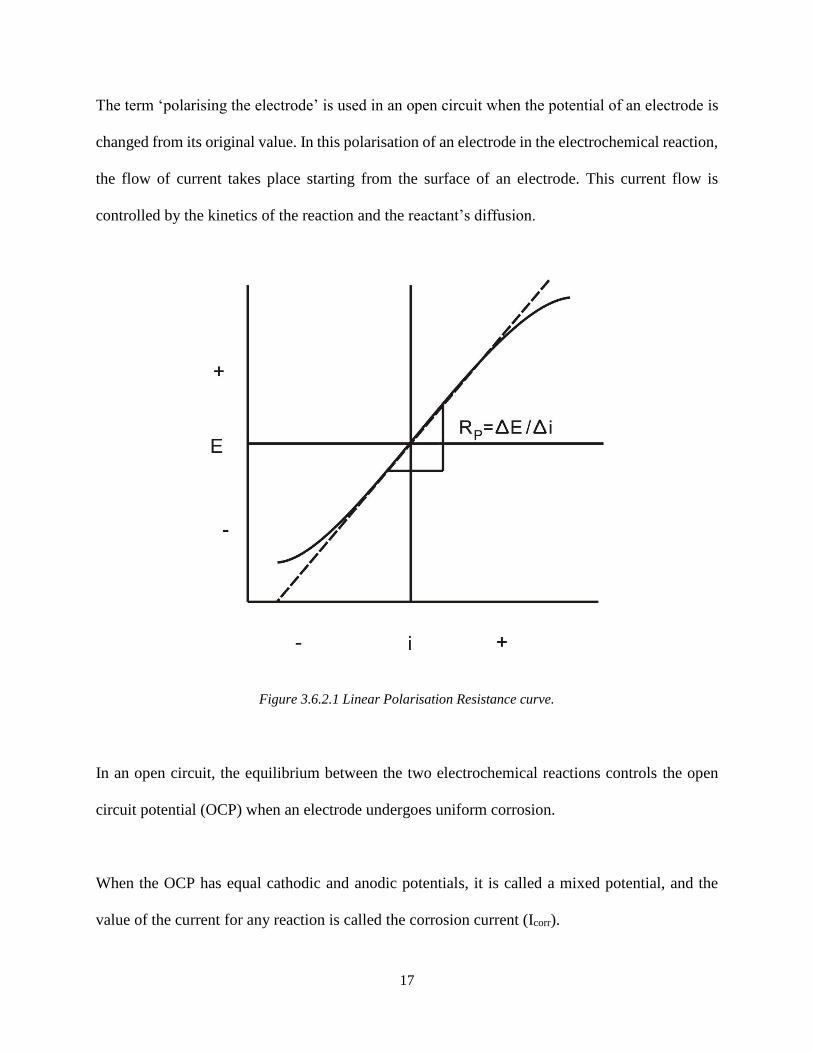
Figure 3.6.2.1 Linear Polarisation Resistance curve.
The term ‘polarising the electrode’ is used in an open circuit when the potential of an electrode is
changed from its original value. In this polarisation of an electrode in the electrochemical reaction,
the flow of current takes place starting from the surface of an electrode. This current flow is
controlled by the kinetics of the reaction and the reactant’s diffusion.
In an open circuit, the equilibrium between the two electrochemical reactions controls the open
circuit potential (OCP) when an electrode undergoes uniform corrosion.
When the OCP has equal cathodic and anodic potentials, it is called a mixed potential, and the
value of the current for any reaction is called the corrosion current (Icorr).

18
𝐼 = 𝐼𝑐𝑜𝑟𝑟 (𝑒2.303(𝐸−𝐸𝑜𝑐𝑝)
𝛽𝑎 − 𝑒2.303(𝐸−𝐸𝑜𝑐𝑝)
𝛽𝑐 )
where:
I = measured current (amperes)
Icorr – corrosion current (amperes)
Eocp – Open circuit potential (volts)
βa – Anodic beta coefficient (volts/decade)
βc – Cathodic beta coefficient (volts/decade)
If a small signal is applied, the above equation can be written as:
𝐼𝑐𝑜𝑟𝑟 =𝛽𝑎𝛽𝑐
2.303(𝛽𝑎 + 𝛽𝑐)∗
1
𝑅𝑝
where:
Rp = Polarisation resistance
Once Tafel constants are known, Icorr can be calculated, which is used to calculate the corrosion
rate.
19
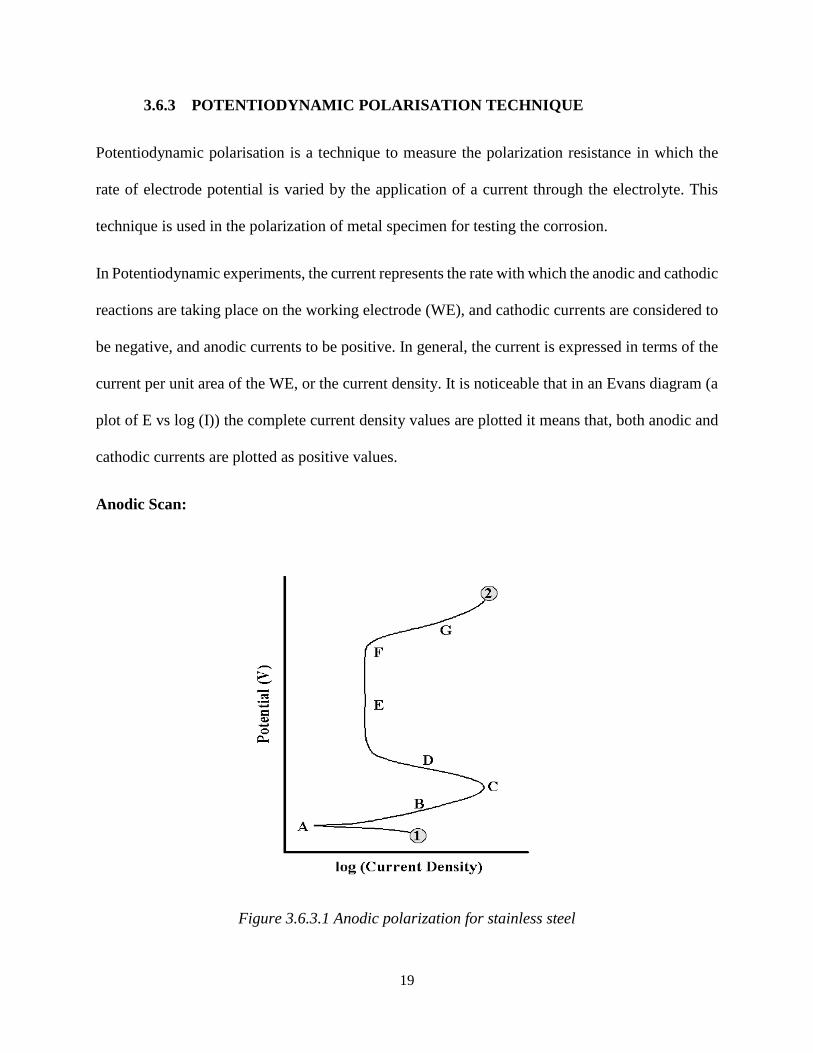
3.6.3 POTENTIODYNAMIC POLARISATION TECHNIQUE
Potentiodynamic polarisation is a technique to measure the polarization resistance in which the
rate of electrode potential is varied by the application of a current through the electrolyte. This
technique is used in the polarization of metal specimen for testing the corrosion.
In Potentiodynamic experiments, the current represents the rate with which the anodic and cathodic
reactions are taking place on the working electrode (WE), and cathodic currents are considered to
be negative, and anodic currents to be positive. In general, the current is expressed in terms of the
current per unit area of the WE, or the current density. It is noticeable that in an Evans diagram (a
plot of E vs log (I)) the complete current density values are plotted it means that, both anodic and
cathodic currents are plotted as positive values.
Anodic Scan:
Figure 3.6.3.1 Anodic polarization for stainless steel

20
A standard schematic anodic scan for stainless steel as shown in Figure 3.6.3.1 The scan rate starts
from point1 and progress in the positive potential direction until the termination at point 2. The
OCP is located at point A. At this potential summation of anodic and cathodic reaction rates on
the electrode surface is zero. The region B is the active region. Point C is known as passivation
potential, and as the applied potential increases above this value then the current density is seen to
be decreased with increasing potential (region D) until a low passive current density is attained
(passive region-region E). Once the potential has reached a suitably positive value (point F, termed
as break-even point), the applied current rapidly increases (region G). This increase in current is
due to several phenomena, depending on the alloy/environment combinations.
Cathodic Scan:
Figure 3.6.3.2 Cathodic polarization scan for stainless steel

21
A standard schematic cathodic scan for stainless steel as shown in Figure 3.6.3.2. The potential is
varied from point1 and progress in the negative potential direction until the termination at point 2.
The OCP is located at point A be determined by the pH and concentration of dissolved oxygen in
the solution, region B may represent the oxygen reduction reaction. Further, decrease in the applied
potential result in no change in the reaction rate, and thus the measured current remained the same
(region C). In the end, the applied potential becomes appropriately negative for another cathodic
reaction to becomes effective such as demonstrated at point D. As the potential and driving force
becomes very large, this reaction may become dominant as illustrated at point E [38], [64].
22
4 EXPERIMENTAL SETUP
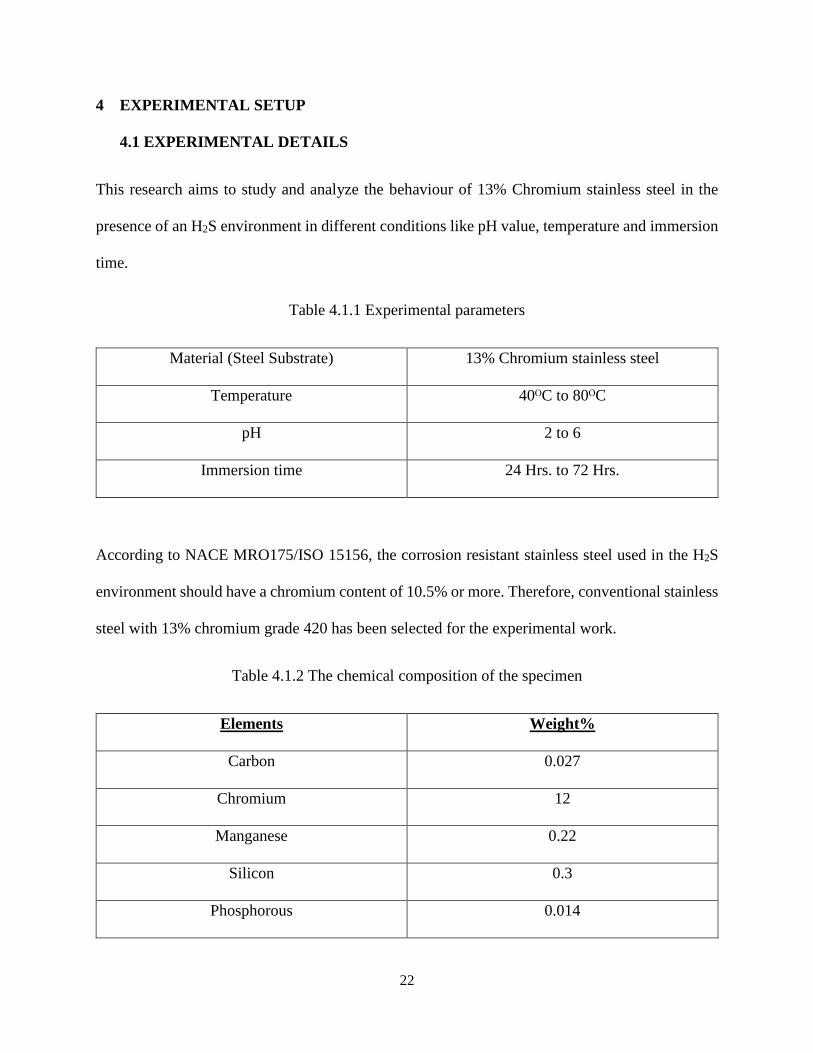
4.1 EXPERIMENTAL DETAILS
This research aims to study and analyze the behaviour of 13% Chromium stainless steel in the
presence of an H2S environment in different conditions like pH value, temperature and immersion
time.
Table 4.1.1 Experimental parameters
Material (Steel Substrate) 13% Chromium stainless steel
Temperature 40ᴼC to 80ᴼC
pH 2 to 6
Immersion time 24 Hrs. to 72 Hrs.
According to NACE MRO175/ISO 15156, the corrosion resistant stainless steel used in the H2S
environment should have a chromium content of 10.5% or more. Therefore, conventional stainless
steel with 13% chromium grade 420 has been selected for the experimental work.
Table 4.1.2 The chemical composition of the specimen
Elements Weight%
Carbon 0.027
Chromium 12
Manganese 0.22
Silicon 0.3
Phosphorous 0.014
23
Sulphur 0.0035
Vanadium 0.041
Iron Balance
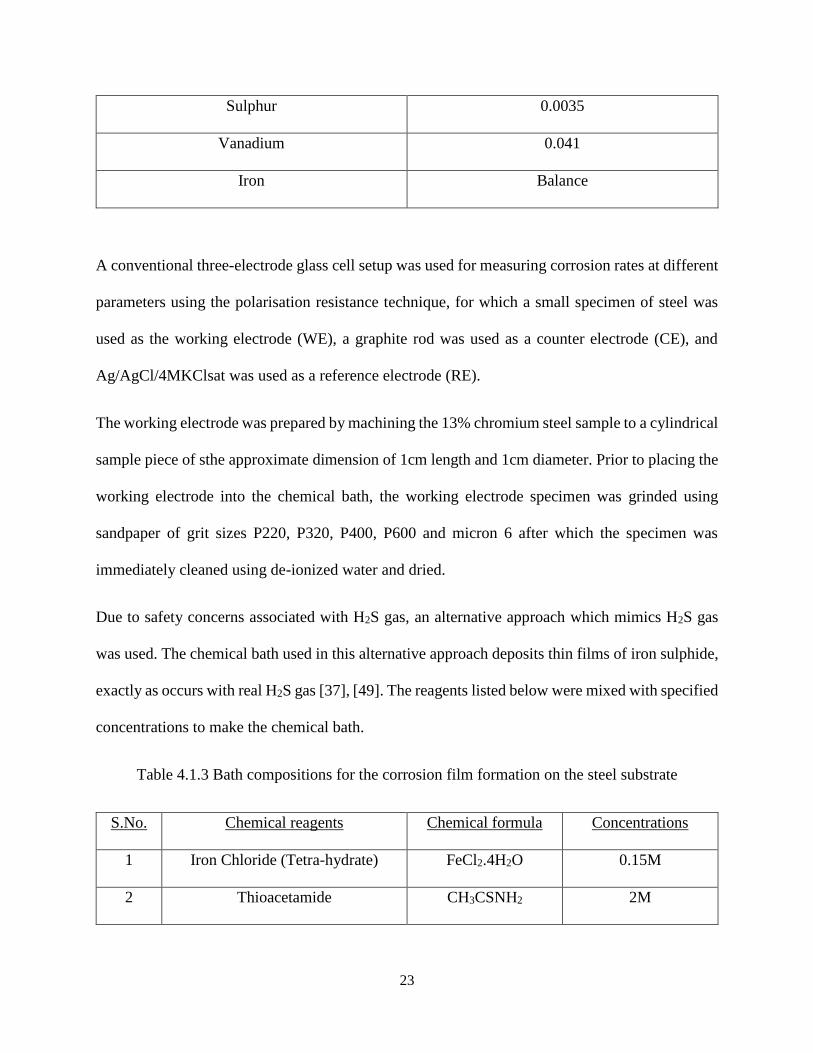
A conventional three-electrode glass cell setup was used for measuring corrosion rates at different
parameters using the polarisation resistance technique, for which a small specimen of steel was
used as the working electrode (WE), a graphite rod was used as a counter electrode (CE), and
Ag/AgCl/4MKClsat was used as a reference electrode (RE).
The working electrode was prepared by machining the 13% chromium steel sample to a cylindrical
sample piece of sthe approximate dimension of 1cm length and 1cm diameter. Prior to placing the
working electrode into the chemical bath, the working electrode specimen was grinded using
sandpaper of grit sizes P220, P320, P400, P600 and micron 6 after which the specimen was
immediately cleaned using de-ionized water and dried.
Due to safety concerns associated with H2S gas, an alternative approach which mimics H2S gas
was used. The chemical bath used in this alternative approach deposits thin films of iron sulphide,
exactly as occurs with real H2S gas [37], [49]. The reagents listed below were mixed with specified
concentrations to make the chemical bath.
Table 4.1.3 Bath compositions for the corrosion film formation on the steel substrate
S.No. Chemical reagents Chemical formula Concentrations
1 Iron Chloride (Tetra-hydrate) FeCl2.4H2O 0.15M
2 Thioacetamide CH3CSNH2 2M

24
3 Urea CH4N2O 1M
The process of making this chemical bath involves three reagents, i.e. Iron (II) Chloride (0.15M),
Urea (1M) and Thioacetamide (2M). Each reagent has to be mixed with de-ionized water, making
three different solutions, and each solution has to be stirred at a speed of 350 rpm for approximately
30 minutes.
These three solutions were mixed and stirred for 2 hours at a speed of 350 rpm so that a
homogenous electrolyte solution was achieved. The reaction mechanism involves the release of
iron and sulphur ions, which help in the deposition of the iron sulphide (FeS) layer on the working
electrode.
Figure 4.1.1 Iron (II)
Chloride solution
Figure 4.1.3.
Thioacetamide Solution Figure 4.1.2. Urea Solution
25
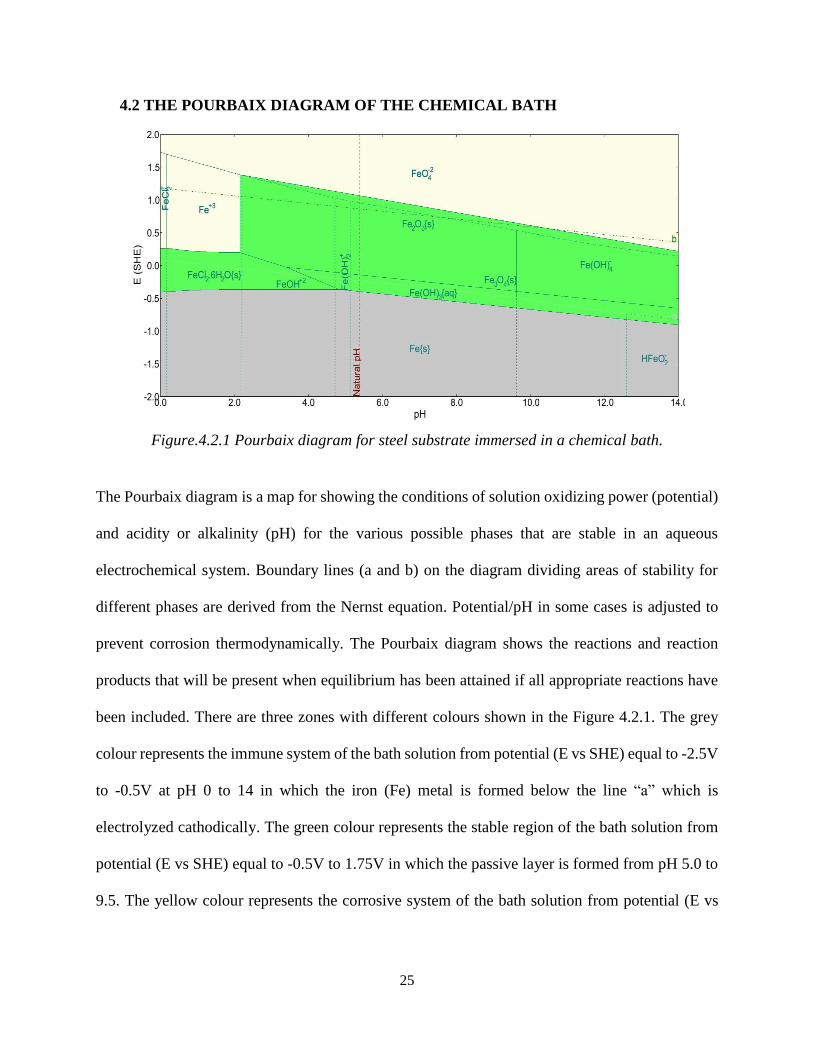
4.2 THE POURBAIX DIAGRAM OF THE CHEMICAL BATH
Figure.4.2.1 Pourbaix diagram for steel substrate immersed in a chemical bath.
The Pourbaix diagram is a map for showing the conditions of solution oxidizing power (potential)
and acidity or alkalinity (pH) for the various possible phases that are stable in an aqueous
electrochemical system. Boundary lines (a and b) on the diagram dividing areas of stability for
different phases are derived from the Nernst equation. Potential/pH in some cases is adjusted to
prevent corrosion thermodynamically. The Pourbaix diagram shows the reactions and reaction
products that will be present when equilibrium has been attained if all appropriate reactions have
been included. There are three zones with different colours shown in the Figure 4.2.1. The grey
colour represents the immune system of the bath solution from potential (E vs SHE) equal to -2.5V
to -0.5V at pH 0 to 14 in which the iron (Fe) metal is formed below the line “a” which is
electrolyzed cathodically. The green colour represents the stable region of the bath solution from
potential (E vs SHE) equal to -0.5V to 1.75V in which the passive layer is formed from pH 5.0 to
9.5. The yellow colour represents the corrosive system of the bath solution from potential (E vs
26
SHE) equal to 0.25V to 2.0V in which Fe+3 ions are formed from pH 0 to 2 and Fe(O4)-2 is formed
above line “b” which is electrolyzed anodically to form oxygen gas.
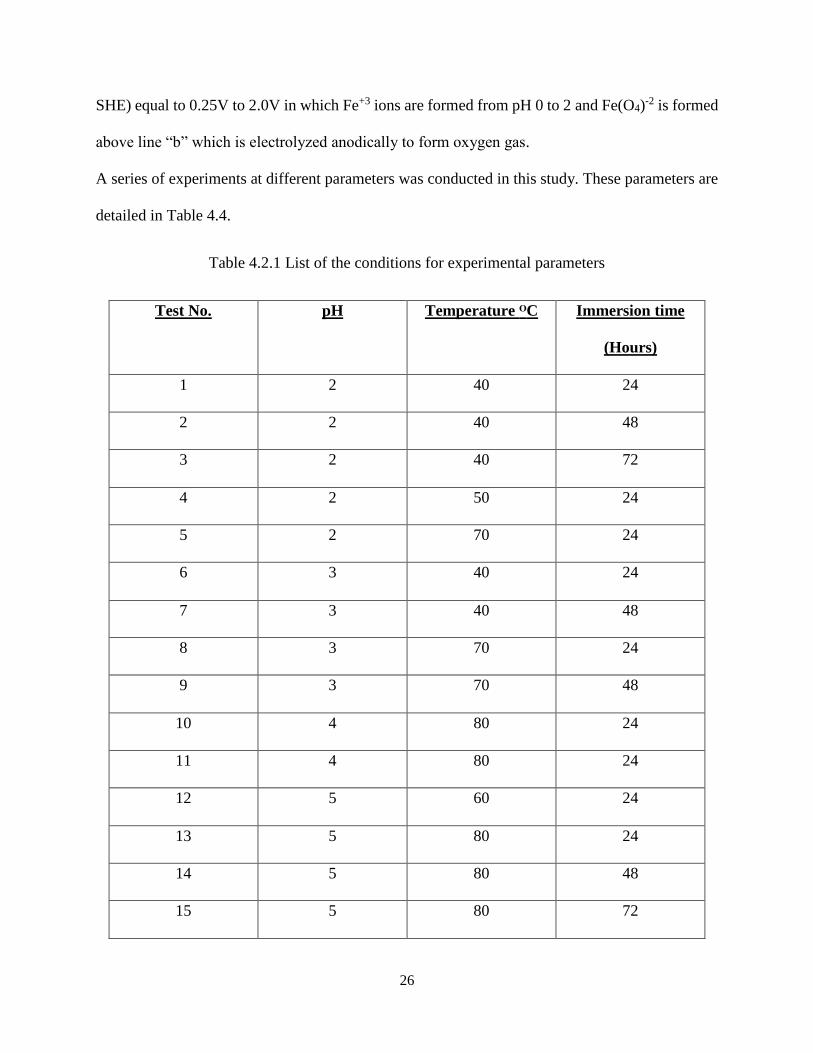
A series of experiments at different parameters was conducted in this study. These parameters are
detailed in Table 4.4.
Table 4.2.1 List of the conditions for experimental parameters
Test No. pH Temperature ᴼC Immersion time
(Hours)
1 2 40 24
2 2 40 48
3 2 40 72
4 2 50 24
5 2 70 24
6 3 40 24
7 3 40 48
8 3 70 24
9 3 70 48
10 4 80 24
11 4 80 24
12 5 60 24
13 5 80 24
14 5 80 48
15 5 80 72
27
16 6 50 24
17 6 50 48
For each test, the desired parameters were used to conduct the experiment, the pH of the electrolyte
solution was adjusted by drop-wise addition of Hydrochloric acid (HCl), and temperatures were
maintained on a laboratory hot plate for the respective immersion times.
Electrochemical measurements were performed using a potentiostat (Ivium Compactact
Potentiostat) monitoring system connected to a computer for data acquisition and also connected
to a three-electrode glass cell set up by applying potential to record the generated readings. The
potential range for polarisation resistance technique measurements was from -0.03 V to +0.03 V
at a scan rate of 0.125 mV/s.
4.3 SURFACE MORPHOLOGY OBSERVATION AND CORROSION PRODUCT
ANALYSIS
After the completion of the electrochemical investigation, samples were taken for morphological
and crystal structure characterization. Morphological characterization was done using an FEI MLA
650F Scanning Electron Microscope (SEM) for the high-resolution surface, the Scanning Electron
Microscope (SEM) was running at 15 kV, low vacuum mode and images were acquired using a
Back-scattered Electron detector (BSED). Bruker Xflash SSD X-ray detectors (EDS) were used
for the elementary chemical analysis of the corrosion products. The crystal structure of the
corrosion products was characterized by X-ray diffraction (XRD) using a Rigaku Ultima IV X-ray
diffractometer with a copper X-ray source (Cu-K-α radiation) operating at 40kV and 44mA and a
scintillation counter detector.
28
5 RESULTS AND DISCUSSION
5.1 EFFECT OF TEMPERATURE ON THE CORROSION BEHAVIOUR OF 13%
CHROMIUM STAINLESS STEEL
The polarisation resistance is a useful technique to evaluate and measure the electrochemical
behaviour and corrosion rate of stainless steel. It monitors the relationship between
electrochemical potential and current generated between electrically charged electrodes in a bath
solution to calculate the corrosion rate. The corrosion current density (Icorr), corrosion potential
(Ecorr) and anodic and cathodic Tafel slopes (βa and βc) were calculated from the intercept on the
Tafel slope by the extrapolation process and obtained with reference to saturated silver and silver
chloride with potassium chloride as a salt bridge (Ag/AgCl/4MKClsat) electrode.
The corrosive activity of steel in a corrosive solution is directly related to the corrosion potentials.
Structural morphologies, chemical and phase compositions of the samples are directly related to
the corrosion resistance of the steel [50]. Below, graphs are the set of experiments showing the
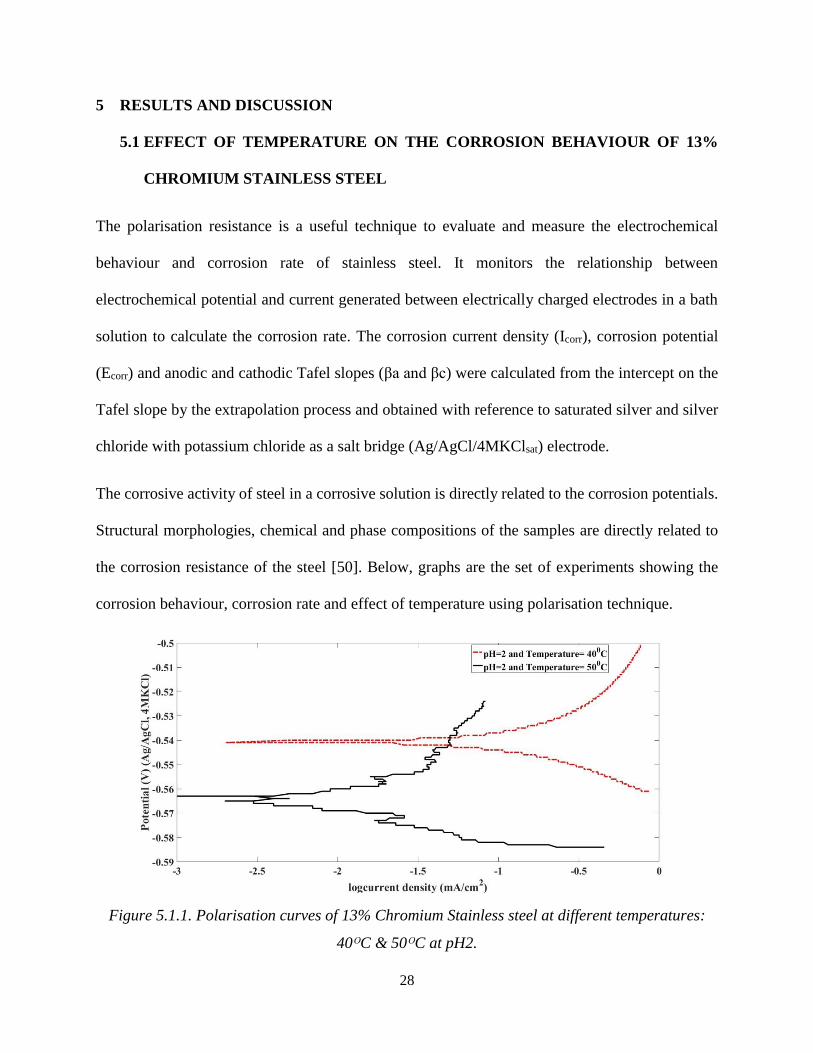
corrosion behaviour, corrosion rate and effect of temperature using polarisation technique.
Figure 5.1.1. Polarisation curves of 13% Chromium Stainless steel at different temperatures:
40ᴼC & 50ᴼC at pH2.
29
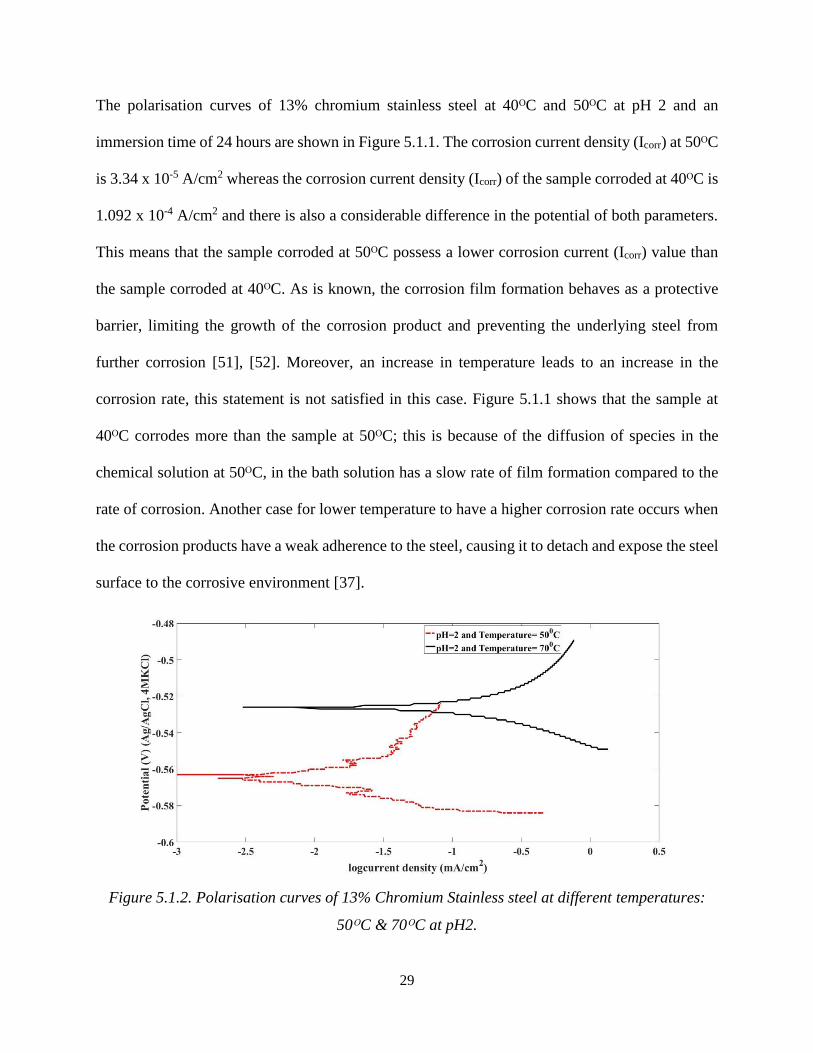
The polarisation curves of 13% chromium stainless steel at 40ᴼC and 50ᴼC at pH 2 and an
immersion time of 24 hours are shown in Figure 5.1.1. The corrosion current density (Icorr) at 50ᴼC
is 3.34 x 10⁻⁵ A/cm2 whereas the corrosion current density (Icorr) of the sample corroded at 40ᴼC is
1.092 x 10⁻⁴ A/cm2 and there is also a considerable difference in the potential of both parameters.
This means that the sample corroded at 50ᴼC possess a lower corrosion current (Icorr) value than
the sample corroded at 40ᴼC. As is known, the corrosion film formation behaves as a protective
barrier, limiting the growth of the corrosion product and preventing the underlying steel from
further corrosion [51], [52]. Moreover, an increase in temperature leads to an increase in the
corrosion rate, this statement is not satisfied in this case. Figure 5.1.1 shows that the sample at
40ᴼC corrodes more than the sample at 50ᴼC; this is because of the diffusion of species in the
chemical solution at 50ᴼC, in the bath solution has a slow rate of film formation compared to the
rate of corrosion. Another case for lower temperature to have a higher corrosion rate occurs when
the corrosion products have a weak adherence to the steel, causing it to detach and expose the steel
surface to the corrosive environment [37].
Figure 5.1.2. Polarisation curves of 13% Chromium Stainless steel at different temperatures:
50ᴼC & 70ᴼC at pH2.
30
In Figure 5.1.2, the polarisation curves of 13% chromium stainless steel at 50ᴼC and 70ᴼC at pH
2 and an immersion time of 24 hours are shown. The corrosion current density (Icorr) at 70ᴼC is
5.711 x 10⁻⁵ A/cm2 whereas, the corrosion current density (Icorr) of the sample corroded at 50ᴼC
is 3.34 x 10⁻⁵ A/cm2. Therefore, the sample corroded at 70ᴼC possesses a higher ICorr value than
the sample at 50ᴼC. The formation of FeS films acts as a protective barrier, forming faster at a
lower temperature and the growth of corrosion product hinders the steel from further
corrosion[38]. At a higher temperature, the diffusion of ions takes places more quickly and
generates weak passive layer on the metals. Furthermore, there is an increase in the flow of the
positive charge from the anodic (oxidation) site toward the cathodic (reduction) site, affecting the
dissolution of the steel surface, indicating that the 13% Cr. stainless steel corrodes faster at a higher
temperature.
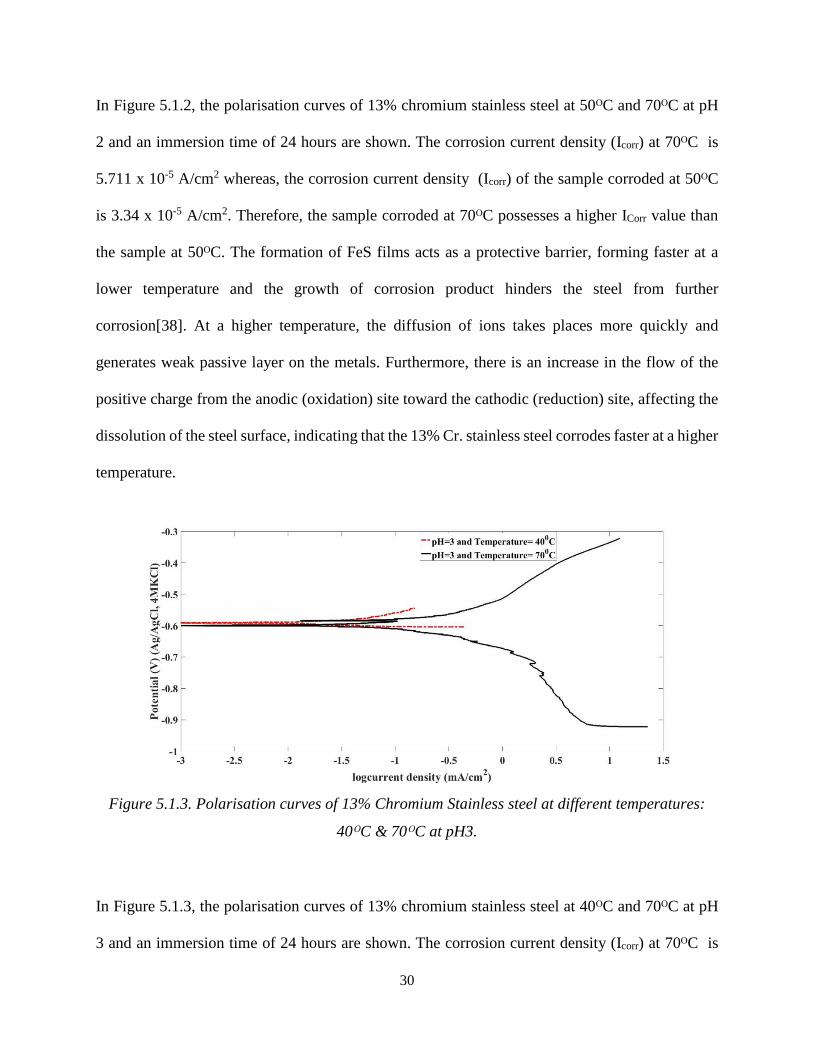
Figure 5.1.3. Polarisation curves of 13% Chromium Stainless steel at different temperatures:
40ᴼC & 70ᴼC at pH3.
In Figure 5.1.3, the polarisation curves of 13% chromium stainless steel at 40ᴼC and 70ᴼC at pH
3 and an immersion time of 24 hours are shown. The corrosion current density (Icorr) at 70ᴼC is
31
7.048 x 10⁻⁵ A/cm2; however, the corrosion current density of the sample corroded at 40ᴼC is 2.189
x 10-6 A/cm2. Therefore, the sample corroded at 40ᴼC possess a lower Icorr value than the sample
at 70ᴼC. The formation of FeS films as the passive layer has an impact on the rate of corrosion,
the film forms faster at a lower temperature and the growth of corrosion product limits the steel
from further corrosion[38]. At a higher temperature, the chemical reactivity within the corrosive
solution increases, which exposes the direct metal surface to the corrosive environment. this also
leads to increase in the migration of the charges and the dissolution of the steel surface, implying
that the 13% Cr. stainless steel corrodes faster at a high temperature.
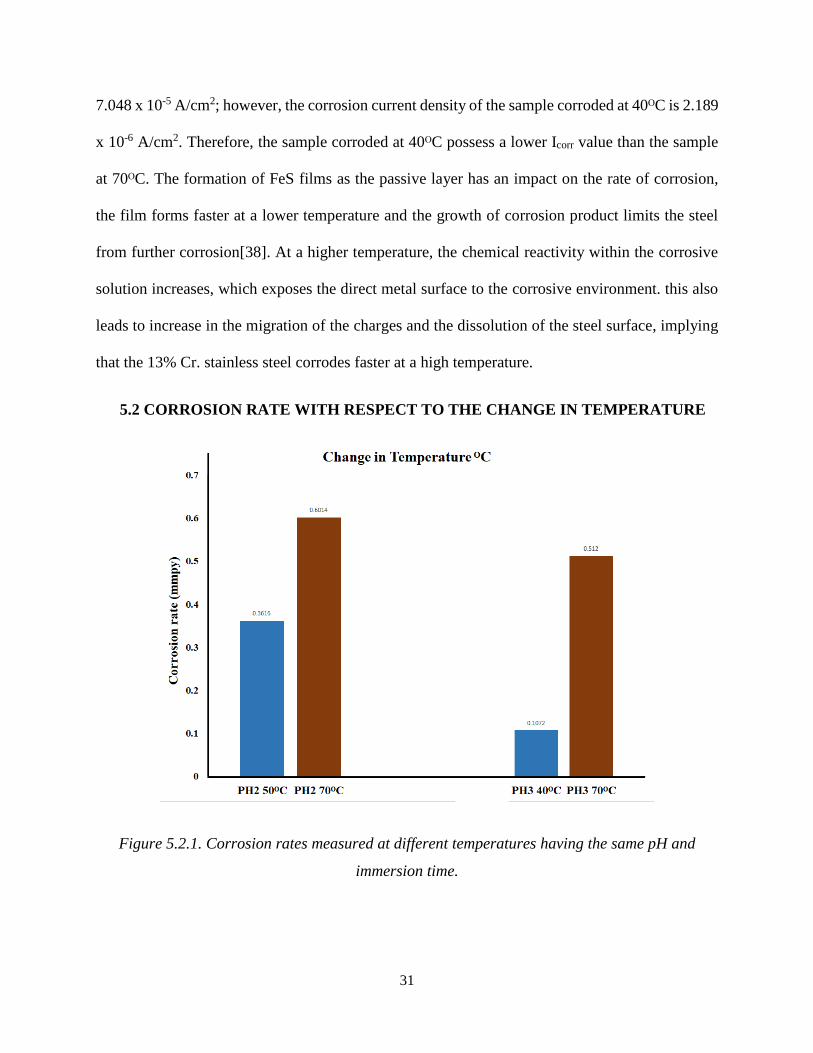
5.2 CORROSION RATE WITH RESPECT TO THE CHANGE IN TEMPERATURE
Figure 5.2.1. Corrosion rates measured at different temperatures having the same pH and
immersion time.
32
Figure 5.2.1 shows the corrosion rates at 40ᴼC, 50ᴼC and 70ᴼC with the same immersion time and
pH values. An elevated rate of corrosion is observed with the increase in temperature. The
corrosion rate recorded by the potentiostat using the polarisation resistance technique at pH2 and
50ᴼC is 0.3616mmpy, whereas the corrosion rate recorded at pH2 and 70ᴼC is 0.6014 mmpy.
which occurs due to increased reactivity in the electrolytic solution at a high temperature, causing
the polarisation of ions [19].
5.3 EFFECT OF PH VALUE ON THE CORROSION BEHAVIOUR OF 13%
CHROMIUM STAINLESS STEEL
The graphs below are the set of experiments showing the corrosion behaviour, corrosion rate and
the effect of pH.
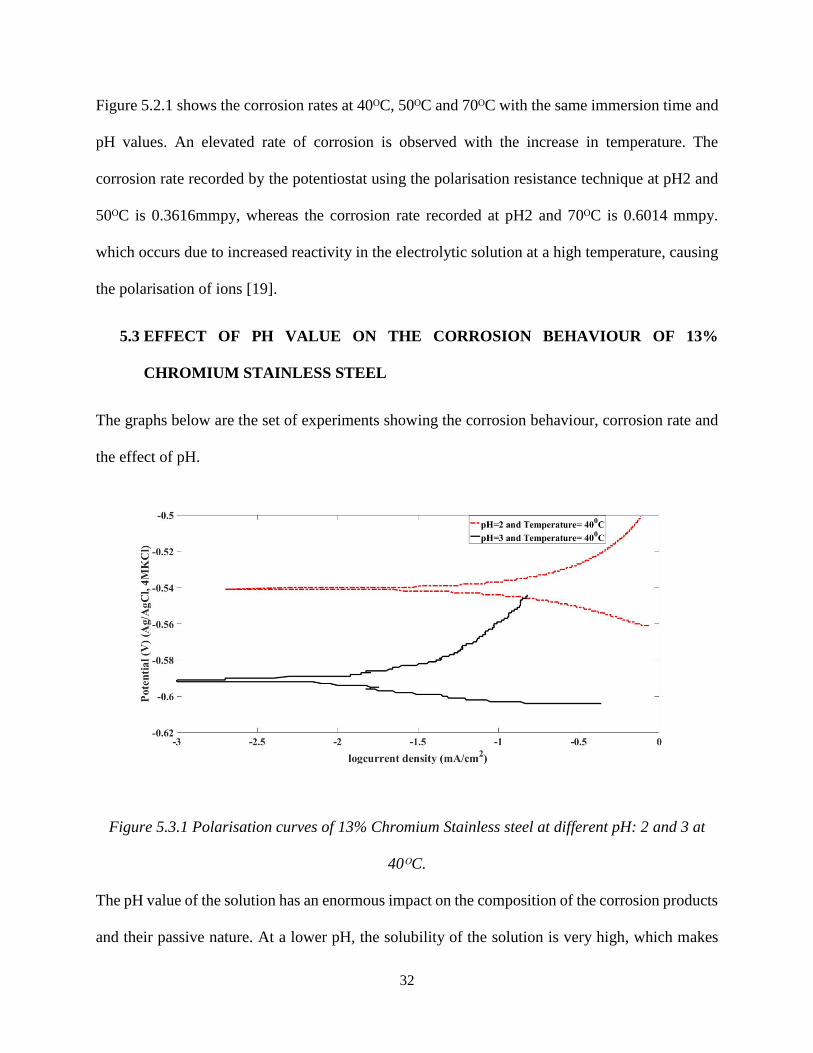
Figure 5.3.1 Polarisation curves of 13% Chromium Stainless steel at different pH: 2 and 3 at
40ᴼC.
The pH value of the solution has an enormous impact on the composition of the corrosion products
and their passive nature. At a lower pH, the solubility of the solution is very high, which makes
33
the precipitation of iron sulphide (FeS) difficult on the steel surfaces [53]. Due to this, the passive
layer formation is minimal or weak, which increases the corrosion rate. This can also be explained
by the increased corrosion current density (Icorr). Figure 5.3.1 shows the polarisation curves of 13%
chromium stainless steel at pH 2 and pH 3 at 40ᴼC and an immersion time of 24 hours. A lower
pH 2 value has a corrosion current density (Icorr) of 1.092 x 10⁻⁴ A/cm2, whereas the corrosion
current density (Icorr) of the sample at higher pH 3 is 2.189 x 10⁻⁶ A/cm2. Therefore, the sample at
pH 2 corrodes more than the sample at pH 3.
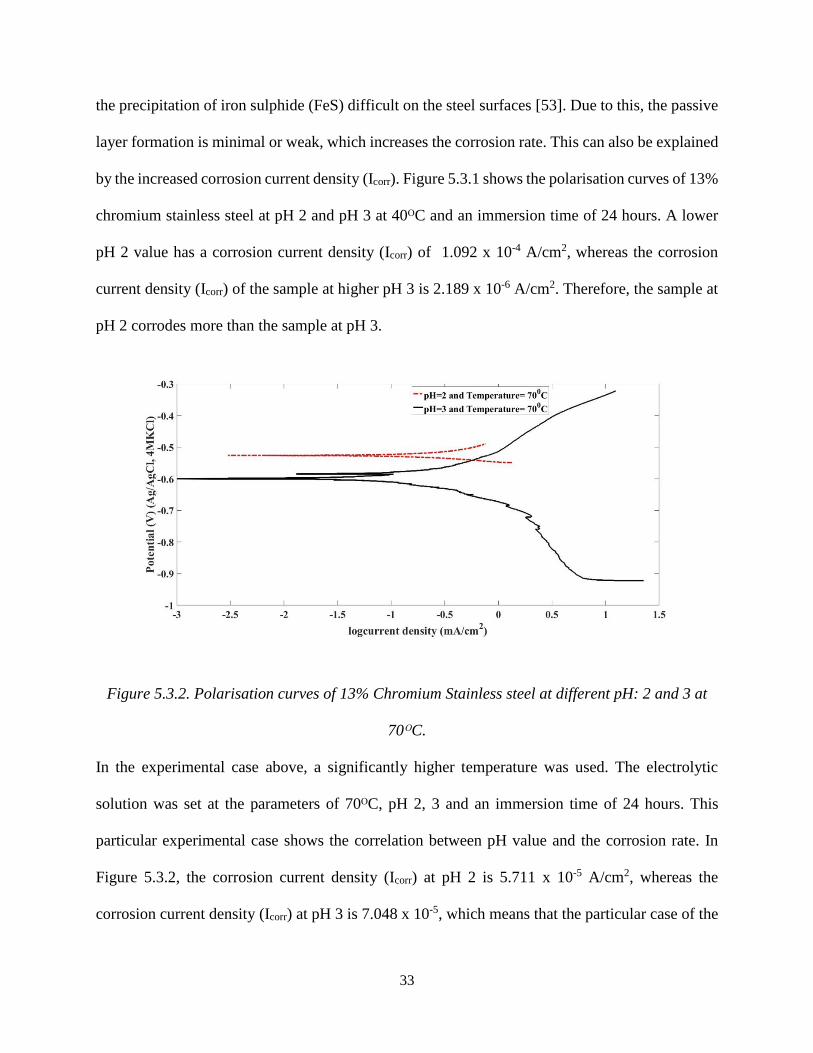
Figure 5.3.2. Polarisation curves of 13% Chromium Stainless steel at different pH: 2 and 3 at
70ᴼC.
In the experimental case above, a significantly higher temperature was used. The electrolytic
solution was set at the parameters of 70ᴼC, pH 2, 3 and an immersion time of 24 hours. This
particular experimental case shows the correlation between pH value and the corrosion rate. In
Figure 5.3.2, the corrosion current density (Icorr) at pH 2 is 5.711 x 10⁻⁵ A/cm2, whereas the
corrosion current density (Icorr) at pH 3 is 7.048 x 10⁻⁵, which means that the particular case of the
34
sample at pH 3 is more corroded than the sample at pH 2 and 70ᴼC. This indicates that at pH 3,
the dissolution of chemical species in the solution has formed a fragile passive layer which has
easily detached from the steel surface, exposing the underlying steel in the highly corrosive
environment [52], [54].
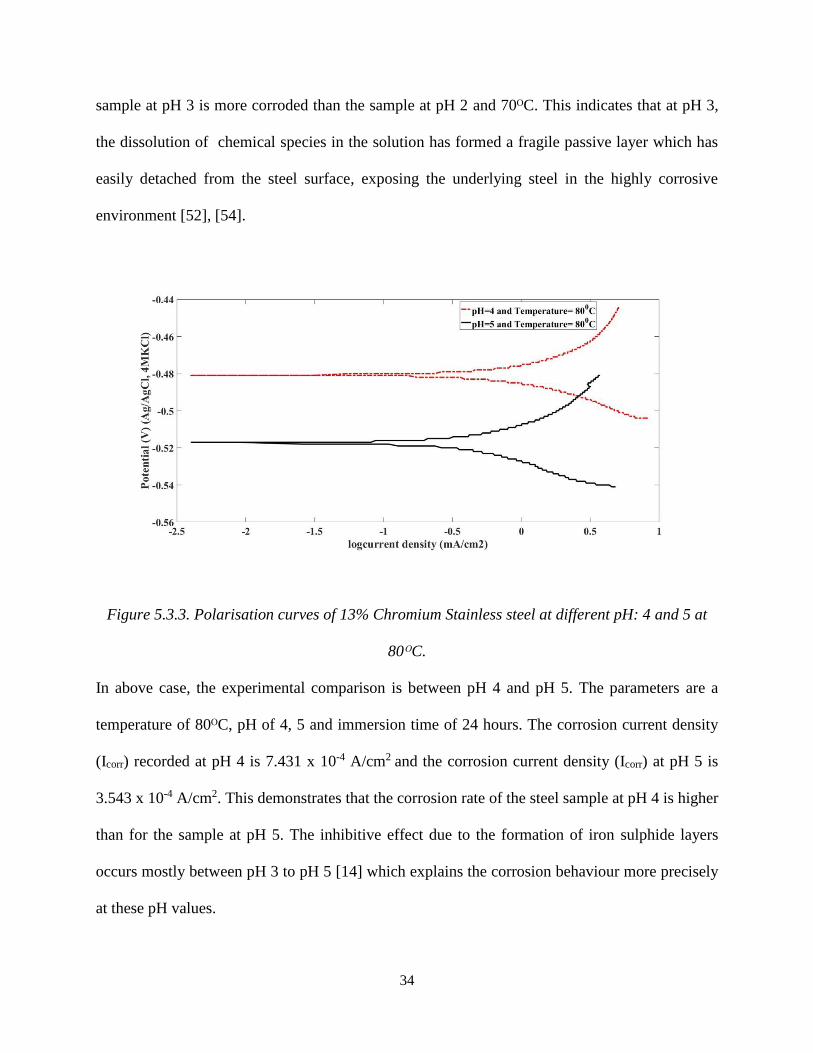
Figure 5.3.3. Polarisation curves of 13% Chromium Stainless steel at different pH: 4 and 5 at
80ᴼC.
In above case, the experimental comparison is between pH 4 and pH 5. The parameters are a
temperature of 80ᴼC, pH of 4, 5 and immersion time of 24 hours. The corrosion current density
(Icorr) recorded at pH 4 is 7.431 x 10⁻⁴ A/cm2 and the corrosion current density (Icorr) at pH 5 is
3.543 x 10⁻⁴ A/cm2. This demonstrates that the corrosion rate of the steel sample at pH 4 is higher
than for the sample at pH 5. The inhibitive effect due to the formation of iron sulphide layers
occurs mostly between pH 3 to pH 5 [14] which explains the corrosion behaviour more precisely
at these pH values.
35
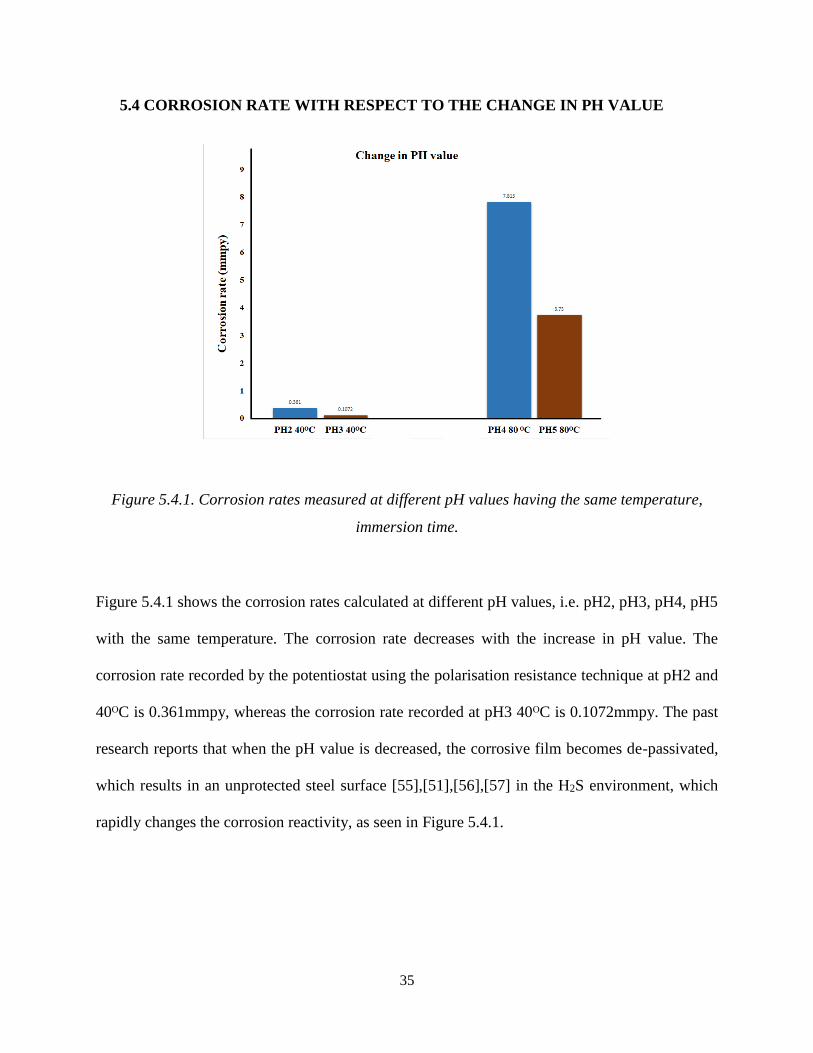
5.4 CORROSION RATE WITH RESPECT TO THE CHANGE IN PH VALUE
Figure 5.4.1. Corrosion rates measured at different pH values having the same temperature,
immersion time.
Figure 5.4.1 shows the corrosion rates calculated at different pH values, i.e. pH2, pH3, pH4, pH5
with the same temperature. The corrosion rate decreases with the increase in pH value. The
corrosion rate recorded by the potentiostat using the polarisation resistance technique at pH2 and
40ᴼC is 0.361mmpy, whereas the corrosion rate recorded at pH3 40ᴼC is 0.1072mmpy. The past
research reports that when the pH value is decreased, the corrosive film becomes de-passivated,
which results in an unprotected steel surface [55],[51],[56],[57] in the H2S environment, which
rapidly changes the corrosion reactivity, as seen in Figure 5.4.1.
36
5.5 EFFECT OF IMMERSION TIME ON THE CORROSION BEHAVIOUR OF 13%
CHROMIUM STAINLESS STEEL
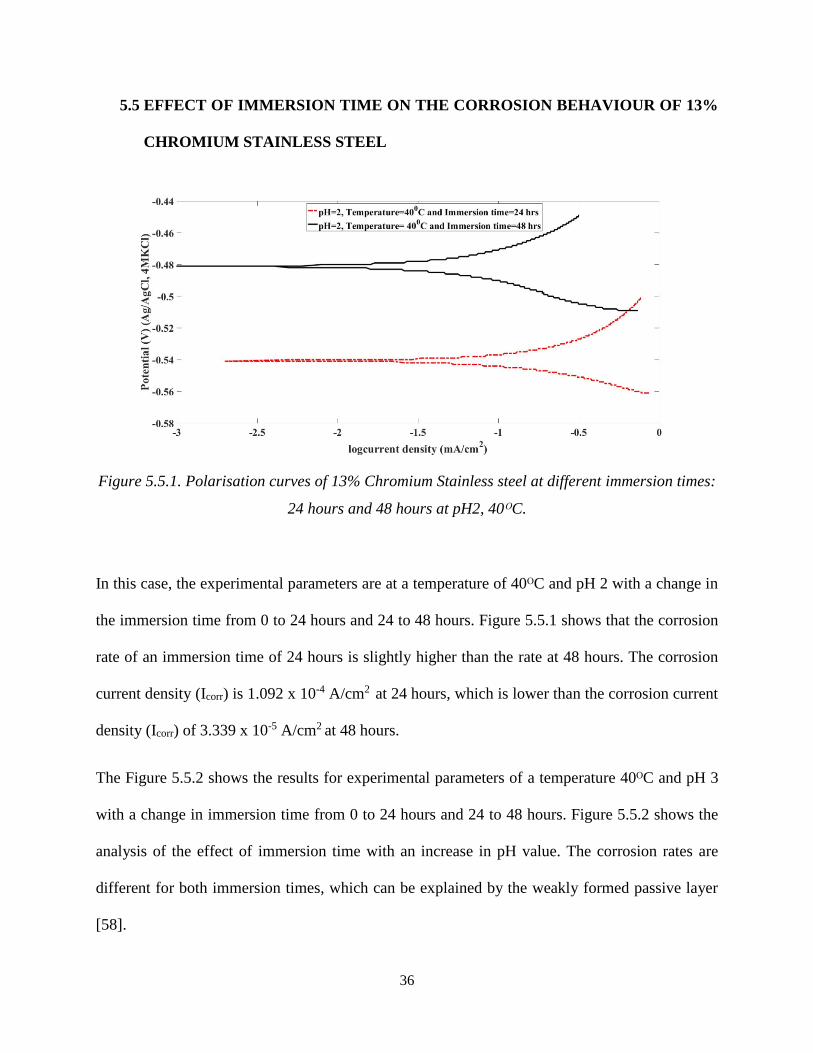
Figure 5.5.1. Polarisation curves of 13% Chromium Stainless steel at different immersion times:
24 hours and 48 hours at pH2, 40ᴼC.
In this case, the experimental parameters are at a temperature of 40ᴼC and pH 2 with a change in
the immersion time from 0 to 24 hours and 24 to 48 hours. Figure 5.5.1 shows that the corrosion
rate of an immersion time of 24 hours is slightly higher than the rate at 48 hours. The corrosion
current density (Icorr) is 1.092 x 10⁻⁴ A/cm2 at 24 hours, which is lower than the corrosion current
density (Icorr) of 3.339 x 10⁻⁵ A/cm2 at 48 hours.
The Figure 5.5.2 shows the results for experimental parameters of a temperature 40ᴼC and pH 3
with a change in immersion time from 0 to 24 hours and 24 to 48 hours. Figure 5.5.2 shows the
analysis of the effect of immersion time with an increase in pH value. The corrosion rates are
different for both immersion times, which can be explained by the weakly formed passive layer
[58].
37
Figure 5.5.2. Polarisation curves of 13% Chromium Stainless steel at different immersion times:
24 hours and 48 hours at pH3, 40ᴼC.
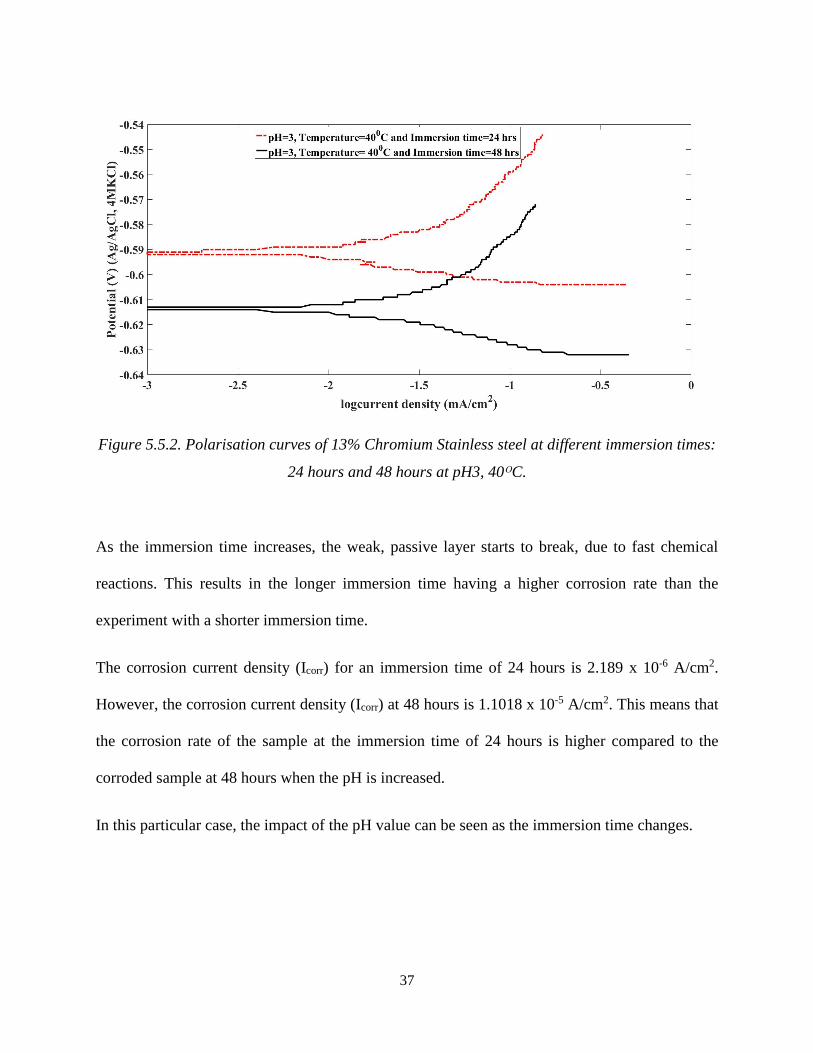
As the immersion time increases, the weak, passive layer starts to break, due to fast chemical
reactions. This results in the longer immersion time having a higher corrosion rate than the
experiment with a shorter immersion time.
The corrosion current density (Icorr) for an immersion time of 24 hours is 2.189 x 10⁻⁶ A/cm2.
However, the corrosion current density (Icorr) at 48 hours is 1.1018 x 10⁻⁵ A/cm2. This means that
the corrosion rate of the sample at the immersion time of 24 hours is higher compared to the
corroded sample at 48 hours when the pH is increased.
In this particular case, the impact of the pH value can be seen as the immersion time changes.
38
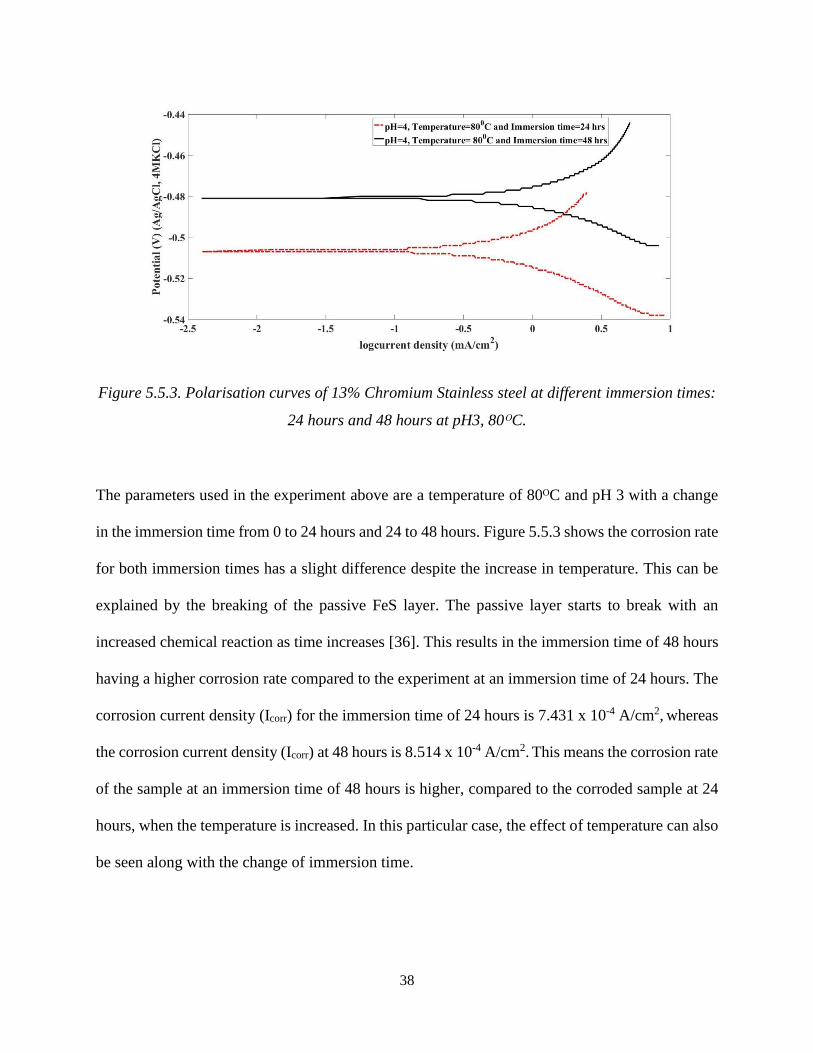
Figure 5.5.3. Polarisation curves of 13% Chromium Stainless steel at different immersion times:
24 hours and 48 hours at pH3, 80ᴼC.
The parameters used in the experiment above are a temperature of 80ᴼC and pH 3 with a change
in the immersion time from 0 to 24 hours and 24 to 48 hours. Figure 5.5.3 shows the corrosion rate
for both immersion times has a slight difference despite the increase in temperature. This can be
explained by the breaking of the passive FeS layer. The passive layer starts to break with an
increased chemical reaction as time increases [36]. This results in the immersion time of 48 hours
having a higher corrosion rate compared to the experiment at an immersion time of 24 hours. The
corrosion current density (Icorr) for the immersion time of 24 hours is 7.431 x 10⁻⁴ A/cm2, whereas
the corrosion current density (Icorr) at 48 hours is 8.514 x 10⁻⁴ A/cm2. This means the corrosion rate
of the sample at an immersion time of 48 hours is higher, compared to the corroded sample at 24
hours, when the temperature is increased. In this particular case, the effect of temperature can also
be seen along with the change of immersion time.
39
5.6 CORROSION RATE WITH RESPECT TO THE CHANGE IN IMMERSION
TIME
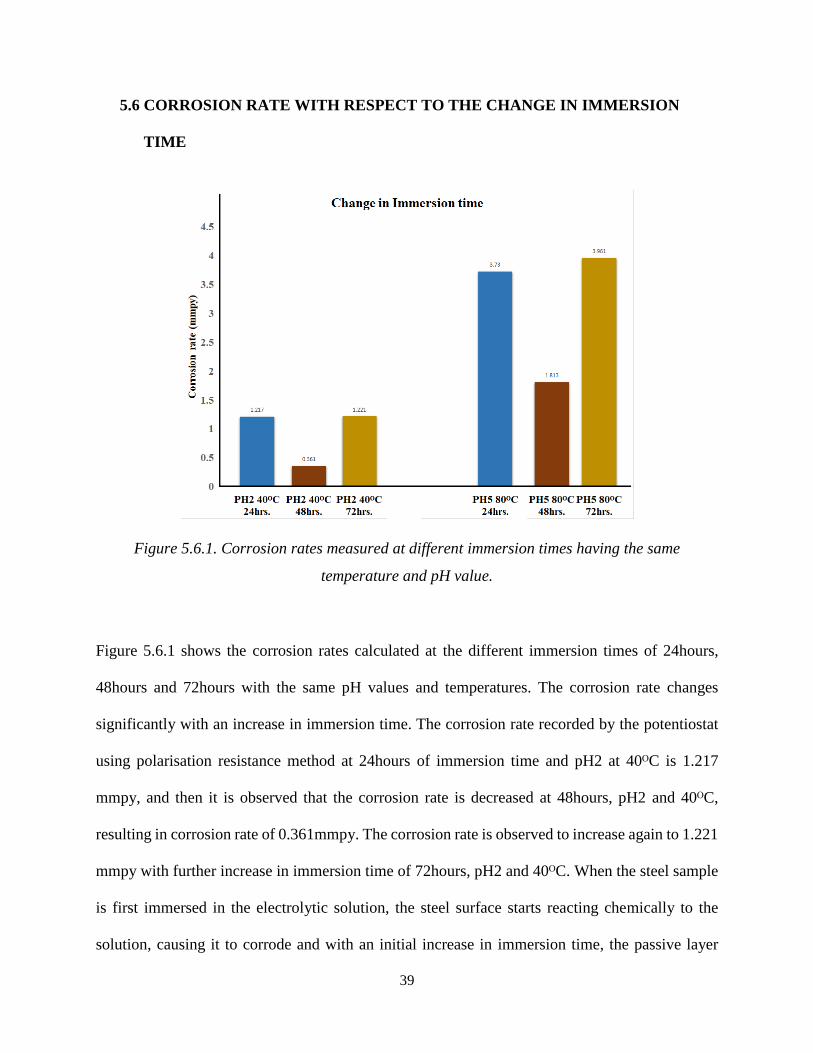
Figure 5.6.1. Corrosion rates measured at different immersion times having the same
temperature and pH value.
Figure 5.6.1 shows the corrosion rates calculated at the different immersion times of 24hours,
48hours and 72hours with the same pH values and temperatures. The corrosion rate changes
significantly with an increase in immersion time. The corrosion rate recorded by the potentiostat
using polarisation resistance method at 24hours of immersion time and pH2 at 40ᴼC is 1.217
mmpy, and then it is observed that the corrosion rate is decreased at 48hours, pH2 and 40ᴼC,
resulting in corrosion rate of 0.361mmpy. The corrosion rate is observed to increase again to 1.221
mmpy with further increase in immersion time of 72hours, pH2 and 40ᴼC. When the steel sample
is first immersed in the electrolytic solution, the steel surface starts reacting chemically to the
solution, causing it to corrode and with an initial increase in immersion time, the passive layer

40
begins to form on the steel surface. The passive layer acts as a barrier between the steel and
electrolytic solution, resulting in a decrease in corrosion rate, but when the immersion time is
further increased, the passive layer starts depassivating, due to which the corrosion rate increases
even more, as seen in Figure 5.6.1[59].

41
5.7 SCANNING ELECTRON MICROSCOPE (SEM) AND ENERGY DISPERSIVE X-
RAY SPECTROSCOPY (EDS)
The SEM analysis was conducted to study the morphological characterization of the corrosion
products in different H2S environmental conditions. Figure 5.7.1(a) shows the SEM image of an
original uncorroded sample. EDS analysis has determined the composition of the substrate, which
matches the chemical composition of steel reported in Table 4.2.
S.N. Smith (2002) reported that the sequential resistance of corrosion products, mainly FeS,
formed in the H2S environment are as follows: Mackinawite < Troilite < Pyrrohotite < Pyrite [60].
42
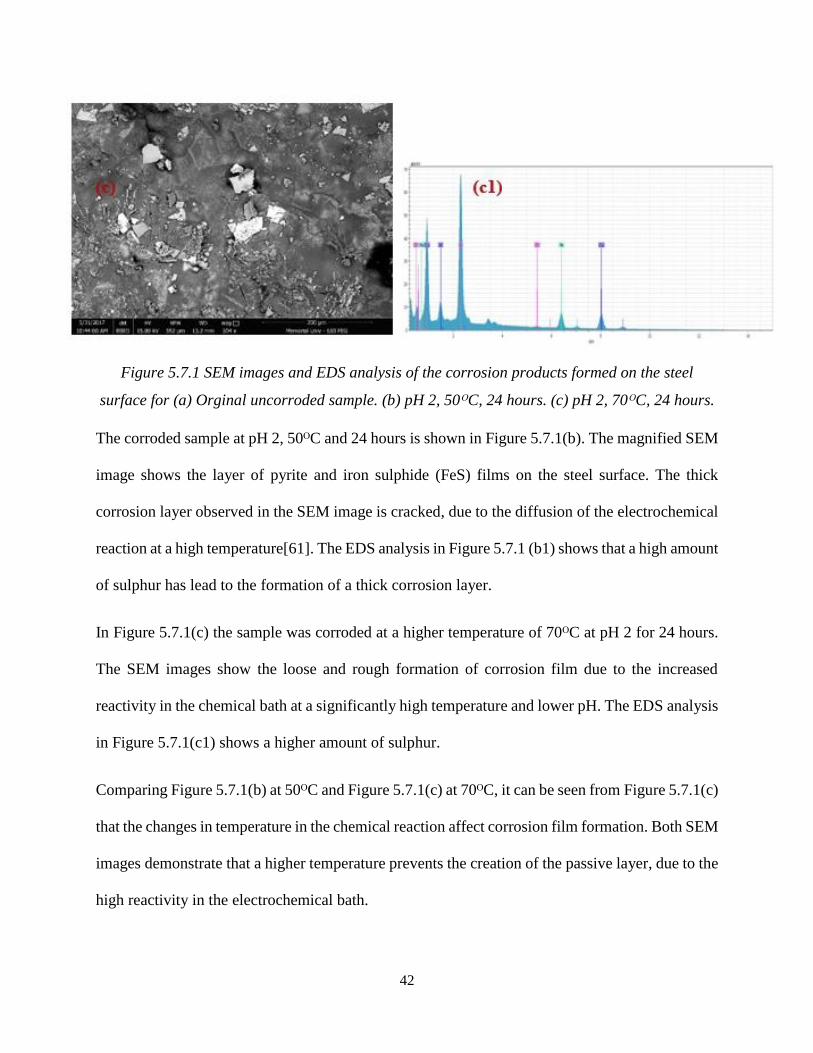
Figure 5.7.1 SEM images and EDS analysis of the corrosion products formed on the steel
surface for (a) Orginal uncorroded sample. (b) pH 2, 50ᴼC, 24 hours. (c) pH 2, 70ᴼC, 24 hours.
The corroded sample at pH 2, 50ᴼC and 24 hours is shown in Figure 5.7.1(b). The magnified SEM
image shows the layer of pyrite and iron sulphide (FeS) films on the steel surface. The thick
corrosion layer observed in the SEM image is cracked, due to the diffusion of the electrochemical
reaction at a high temperature[61]. The EDS analysis in Figure 5.7.1 (b1) shows that a high amount
of sulphur has lead to the formation of a thick corrosion layer.
In Figure 5.7.1(c) the sample was corroded at a higher temperature of 70ᴼC at pH 2 for 24 hours.
The SEM images show the loose and rough formation of corrosion film due to the increased
reactivity in the chemical bath at a significantly high temperature and lower pH. The EDS analysis
in Figure 5.7.1(c1) shows a higher amount of sulphur.
Comparing Figure 5.7.1(b) at 50ᴼC and Figure 5.7.1(c) at 70ᴼC, it can be seen from Figure 5.7.1(c)
that the changes in temperature in the chemical reaction affect corrosion film formation. Both SEM
images demonstrate that a higher temperature prevents the creation of the passive layer, due to the
high reactivity in the electrochemical bath.

43
Figure 5.7.2 SEM images and EDS analysis of the corrosion products formed on the steel
surface for (d) pH 3, 40ᴼC, 48 hours. (e) pH 3, 70ᴼC, 48 hours. (f) pH 4, 80ᴼC, 48 hours.
44
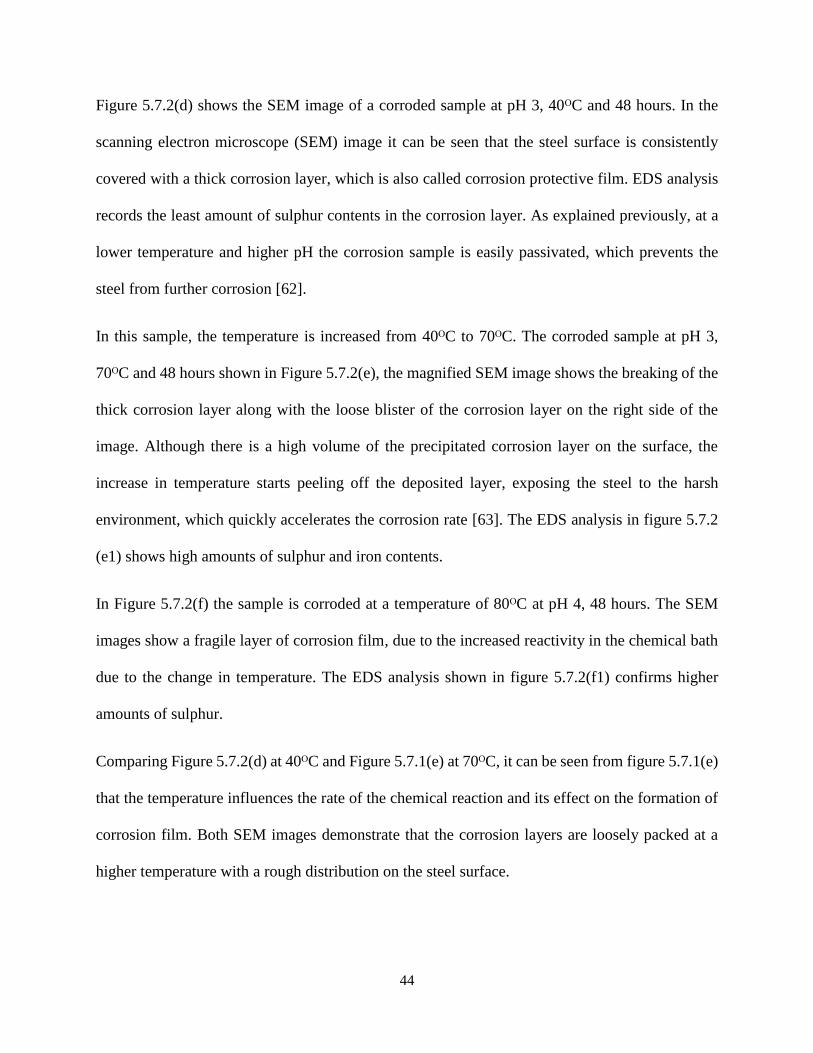
Figure 5.7.2(d) shows the SEM image of a corroded sample at pH 3, 40ᴼC and 48 hours. In the
scanning electron microscope (SEM) image it can be seen that the steel surface is consistently
covered with a thick corrosion layer, which is also called corrosion protective film. EDS analysis
records the least amount of sulphur contents in the corrosion layer. As explained previously, at a
lower temperature and higher pH the corrosion sample is easily passivated, which prevents the
steel from further corrosion [62].
In this sample, the temperature is increased from 40ᴼC to 70ᴼC. The corroded sample at pH 3,
70ᴼC and 48 hours shown in Figure 5.7.2(e), the magnified SEM image shows the breaking of the
thick corrosion layer along with the loose blister of the corrosion layer on the right side of the
image. Although there is a high volume of the precipitated corrosion layer on the surface, the
increase in temperature starts peeling off the deposited layer, exposing the steel to the harsh
environment, which quickly accelerates the corrosion rate [63]. The EDS analysis in figure 5.7.2
(e1) shows high amounts of sulphur and iron contents.
In Figure 5.7.2(f) the sample is corroded at a temperature of 80ᴼC at pH 4, 48 hours. The SEM
images show a fragile layer of corrosion film, due to the increased reactivity in the chemical bath
due to the change in temperature. The EDS analysis shown in figure 5.7.2(f1) confirms higher
amounts of sulphur.
Comparing Figure 5.7.2(d) at 40ᴼC and Figure 5.7.1(e) at 70ᴼC, it can be seen from figure 5.7.1(e)
that the temperature influences the rate of the chemical reaction and its effect on the formation of
corrosion film. Both SEM images demonstrate that the corrosion layers are loosely packed at a
higher temperature with a rough distribution on the steel surface.

45
Figure 5.7.3 SEM images and EDS analysis of the corrosion products formed on the steel
surface for (g) pH 5, 80ᴼC, 48 hours. (h) pH 6, 50ᴼC, 24 hours. (i) pH 6, 50ᴼC, 48 hours.
46
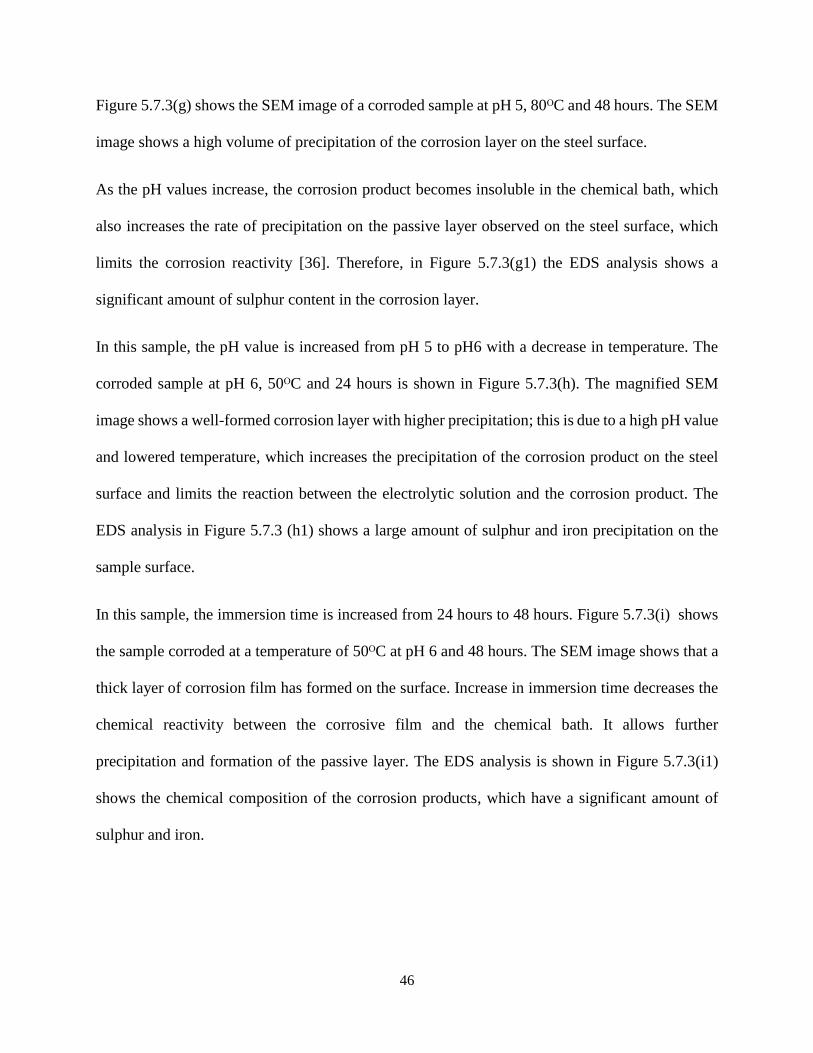
Figure 5.7.3(g) shows the SEM image of a corroded sample at pH 5, 80ᴼC and 48 hours. The SEM
image shows a high volume of precipitation of the corrosion layer on the steel surface.
As the pH values increase, the corrosion product becomes insoluble in the chemical bath, which
also increases the rate of precipitation on the passive layer observed on the steel surface, which
limits the corrosion reactivity [36]. Therefore, in Figure 5.7.3(g1) the EDS analysis shows a
significant amount of sulphur content in the corrosion layer.
In this sample, the pH value is increased from pH 5 to pH6 with a decrease in temperature. The
corroded sample at pH 6, 50ᴼC and 24 hours is shown in Figure 5.7.3(h). The magnified SEM
image shows a well-formed corrosion layer with higher precipitation; this is due to a high pH value
and lowered temperature, which increases the precipitation of the corrosion product on the steel
surface and limits the reaction between the electrolytic solution and the corrosion product. The
EDS analysis in Figure 5.7.3 (h1) shows a large amount of sulphur and iron precipitation on the
sample surface.
In this sample, the immersion time is increased from 24 hours to 48 hours. Figure 5.7.3(i) shows
the sample corroded at a temperature of 50ᴼC at pH 6 and 48 hours. The SEM image shows that a
thick layer of corrosion film has formed on the surface. Increase in immersion time decreases the
chemical reactivity between the corrosive film and the chemical bath. It allows further
precipitation and formation of the passive layer. The EDS analysis is shown in Figure 5.7.3(i1)
shows the chemical composition of the corrosion products, which have a significant amount of
sulphur and iron.

47
Comparing between Figure 5.7.3(g), Figure 5.7.3(h) and Figure 5.7.3(i), it is observed that when
there is an increase in pH value or an increase in the immersion time, the volume of precipitation
of the corrosion product on the steel surface also increases, forming a thick corrosion layer.
48
5.8 X-RAY DIFFRACTION (XRD)
The corrosion products formed on the steel surface are characterized using X-ray diffraction
(XRD). The crystal phase characterization of the corrosion products identifies the peaks. Different
databases are used, such as Powdered diffraction files (PDF), RDB Minerals and the International
Centre for Diffraction database (ICDD).
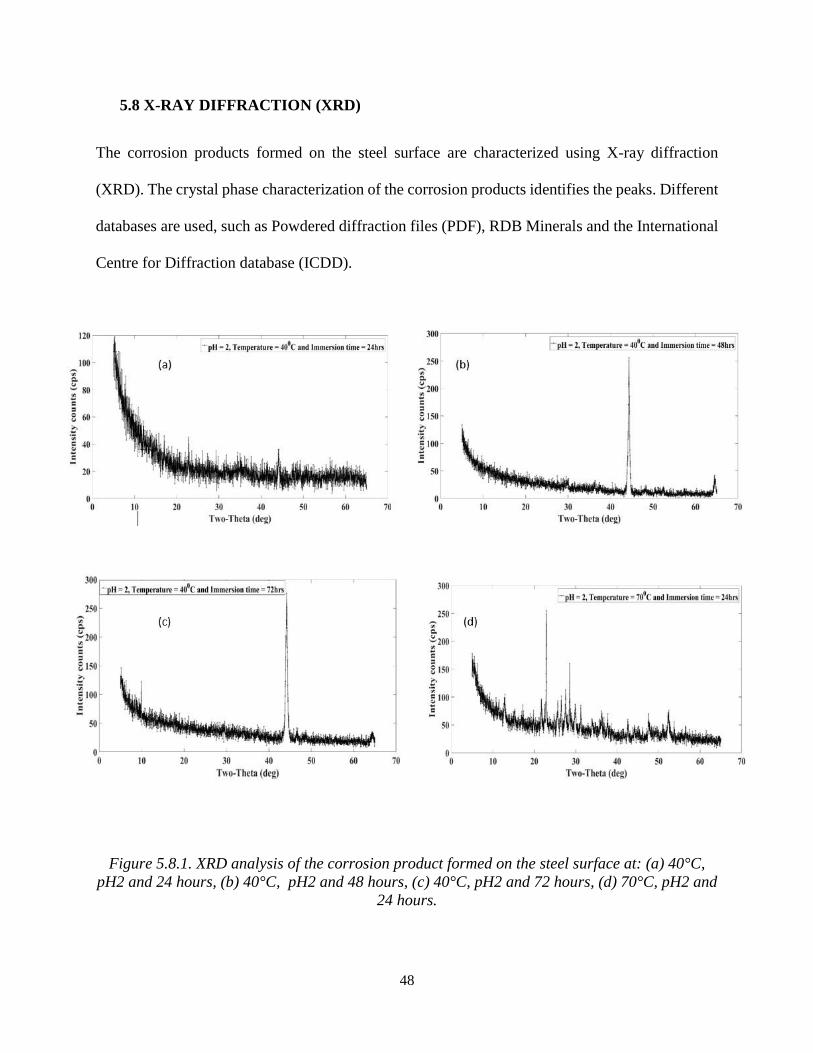
Figure 5.8.1. XRD analysis of the corrosion product formed on the steel surface at: (a) 40°C,
pH2 and 24 hours, (b) 40°C, pH2 and 48 hours, (c) 40°C, pH2 and 72 hours, (d) 70°C, pH2 and
24 hours.
49
In Figure 5.8.1(a) the peaks are matched by the PDF #[00-006-0696]. Identifying the iron (Fe) as
a body centred cubic (BCC) structure, XRD peaks in the figure 5.8.1(b) match the PDF # [00-016-
0713] identifying the corrosion product as Greigite (Fe3S4) with a cubic crystal structure; this
suggests that the corroded sample after an increase in the immersion time, formed a corrosion
product on the steel surface. In Figure 5.8.1(c) the peaks are identified as iron (Fe) [00-006-0696]
as the cubic crystal structure, pyrite (FeS2) [00-042-1340] as the cubic structure and iron sulphide
(FeS) [0-065-1984] as the orthorhombic crystal structure.
In Figure 5.8.1(d), the corrosion products formed on the steel surface are identified as iron sulphide
(FeS) [98-001-1763], iron (Fe) [00-006-0696] and pyrite (FeS2) [98-002-0637]. These corrosion
products are minerals of iron sulphide (FeS) which have been precipitated on the steel surface in
various H2S environmental parameters [3], [60].
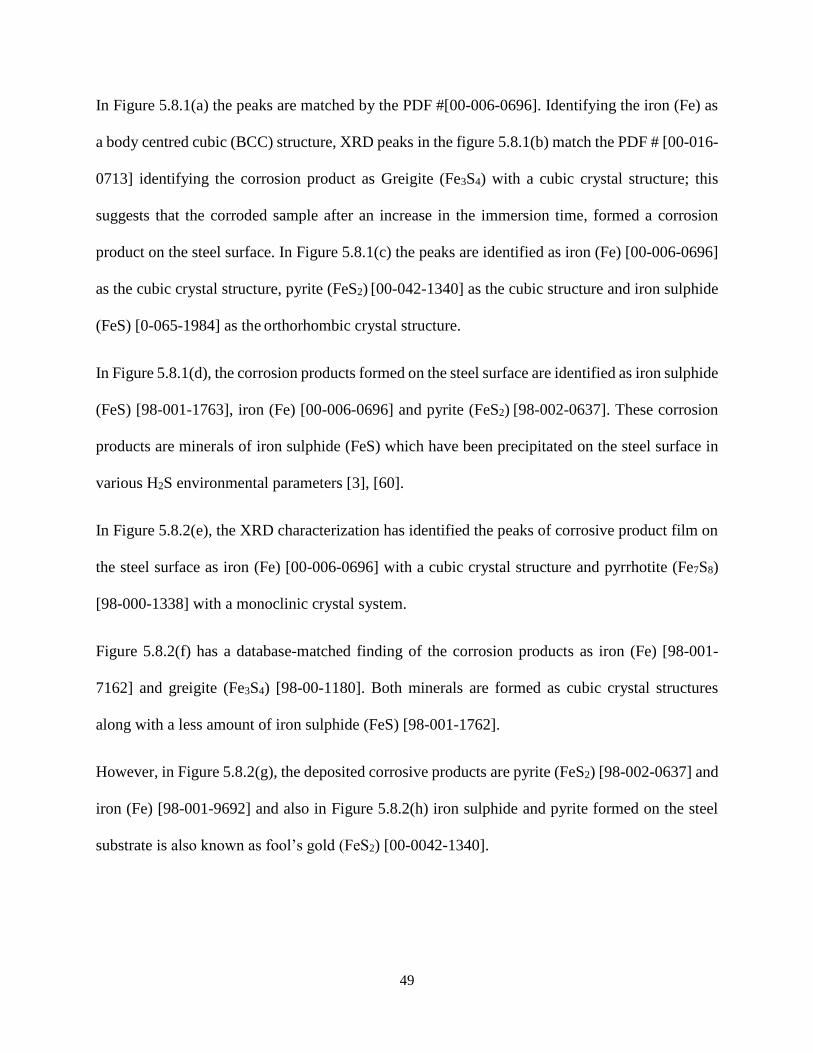
In Figure 5.8.2(e), the XRD characterization has identified the peaks of corrosive product film on
the steel surface as iron (Fe) [00-006-0696] with a cubic crystal structure and pyrrhotite (Fe7S8)
[98-000-1338] with a monoclinic crystal system.
Figure 5.8.2(f) has a database-matched finding of the corrosion products as iron (Fe) [98-001-
7162] and greigite (Fe3S4) [98-00-1180]. Both minerals are formed as cubic crystal structures
along with a less amount of iron sulphide (FeS) [98-001-1762].
However, in Figure 5.8.2(g), the deposited corrosive products are pyrite (FeS2) [98-002-0637] and
iron (Fe) [98-001-9692] and also in Figure 5.8.2(h) iron sulphide and pyrite formed on the steel
substrate is also known as fool’s gold (FeS2) [00-0042-1340].
50
Figure 5.8.2. XRD analysis of the corrosion product formed on the steel surface at: (e) 70°C,
pH3 and 72 hours, (f) 80°C, pH4 and 48 hours, (g) 80°C, pH5 and 72 hours, (h) 50°C, pH6 and
24 hours.
This characterization demonstrates that the change in parameters such as temperature, pH and
immersion time has a significant impact on the corrosion behaviour. The mechanism of passive
layer formation results in the growth of different FeS minerals.
51
6 CONCLUSION
The results of this work are important findings with respect to the corrosion behaviour in sour
environments.
• In an H2S environment, the corrosion rate increases with the increase in temperature but
after 70ᴼC the effect of temperature lessens.
• The corrosion rates decrease with an increase in the pH value and the pH of the
environment has a huge impact on the corrosion rate and the formation of protective films
on the steel surface.
• For a short period of time the corrosion rates decrease with an increase in immersion
time, but over an extended period the protective layer becomes weak and starts to corrode
the steel beneath the protective film
• The formation of a film on a steel surface is dependent on the pH and temperature of the
environment. Lower temperature and higher pH form thick and uniform protective films
which eventually decrease the corrosion rate and protect the steel from exposure to the
corrosive media.
• Different types of oxides formed on the surface have different effects on the corrosive
resistivity of the steel and the formation of stable oxides lowers the rate of corrosion.

52
7 FUTURE WORK AND RECOMMENDATIONS
This thesis has many limitations due to the safety concerns associated with the H2S gas and the
lab’s suitability.
• Further research is needed to enhance the findings using H2S gas with better provisions for
safety.
• The concentration of H2S should also be considered for the development of this research.
• Corrosion behaviour at a very high temperature is still unclear, and more research is needed
for better understanding of corrosion behaviour with elevated temperatures.
• The experimental time in this thesis is a maximum of 72 hours, which could be increased
in future research work.
• Study of each FeS oxide is needed to study the growth mechanism of protective films.
53
REFERENCES
[1] J. Fritz and D. H. Russ, “H2S Multiphase Flow Loop: CO2 Corrosion in the Presence of
Trace Amounts of Hydrogen Sulfide,” Eng. Technol., November, 2004.
[2] W. Yan, P. Zhu, and J. Deng, “Corrosion behaviors of SMSS 13Cr and DSS 22Cr in
H2S/CO2-oil-water environment,” Int. J. Electrochem. Sci., vol. 11, no. 11, pp. 9542–9558,
2016.
[3] A. F. Goncharov et al., “Hydrogen sulfide at high pressure: Change in stoichiometry,” Phys.
Rev. B, vol. 93, no. 17, p. 174105, 2016.
[4] G. Xian Zhao, X. Hong Lu, J. Min Xiang, and Y. Han, “Formation Characteristic of CO2
Corrosion Product Layer of P110 Steel Investigated by SEM and Electrochemical
Techniques,” J. Iron Steel Res. Int., vol. 16, no. 4, pp. 89–94, 2009.
[5] S.D. Kapusta, B.F.M. Pots and R.A. Connell, “Corrosion Management of Wet Gas
Pipelines,” in Proc. Corrosion, 1999.
[6] R. Heidersbach, “Metallurgy and Corrosion Control in Oil and Gas Production.,” John
Wiley and Sons, 2011.
[7] L. R. Faulkner, A. J. Bard, “Electrochemical Methods: Fundamentals and Applications,”
John Wiley and Sons, Edition 2, pp. 24–25, 2001.
[8] Gabriel N. Meloni, “Building a Microcontroller Based Potentiostat: an Inexpensive and
Versatile Platform for Teaching Electrochemistry and Instrumentation,” pp. 1320–1322,
2016.
[9] M. Vergani, “Electronic Instrumentation for Electrochemical Cell Monitoring in Lab-on-
54
Chip Devices,” 2012.
[10] M. A. P. Henry Fu, Henry Chow, Michael Lew, Shruti Menon and Craig Scratchley, “An
Electrochemical Potentiostat Interface for Mobile Devices: Enabling Remote Medical
Diagnostics,” pp. 1–5, 2015.
[11] Autolab Application Note EC08, “Basic overview of the working principle of a
potentiostat/galvanostat (PGSTAT) – Electrochemical cell setup,” Metrohm Autolab.B.V,
pp. 1–3, 2011.
[12] D. McMullan, “Scanning Electron Microscopy,” in 51st Annual Meeting of the Microscopy
Society of America, 1965.
[13] Haitao Fang, "Investigation of Localized Corrosion of Carbon Steel in H2S
Environments,"Ph.D. Thesis, Russ College of Engineering and Technology of Ohio
University, March, 2012.
[14] B. Valery, “Effect of Pre-exposure of Sulfur and Iron Sulfide on H2S Corrosion at Different
Temperatures,” pp. 1–68, Master's Thesis, University of Stavanger, June, 2011.
[15] Y. Zheng, “Electrochemical Mechanism and Model of H2S Corrosion in Carbon steels,”
Ph.D. Thesis, Russ College of Engineering and Technology of Ohio University, May, 2015.
[16] H. Fang, D. Young, and S. Nešić, “Elemental Sulfur Corrosion of Mild Steel At High
Concentrations of Sodium Chloride,” NACE Int., Paper No. 2592, pp. 1–16, 2009.
[17] N. Yaakob, “Top of the Line Corrosion in CO2/H2S Environments,” pp. 1–198, Ph.D.
Thesis, Russ College of Engineering and Technology of Ohio University, May, 2015.
[18] A. Narasimhavarman, “Engaging Degradation Mechanisms Of Materials In A Tourney. An
55
Investigation Into The Philosophy Of Material Selection As A Mitigating Measure and
Strategy,” Master's Thesis, University of Stavanger 2013.
[19] H. Taheri, S. Kakooei, M. C. Ismail, and A. Dolati, “The Effect of H2S Concentration and
Temperature on Corrosion Behavior of Pipeline Steel A516-Gr70,” Caspian Journal of
Applied Sciences Research, vol. 1, no. 5, pp. 41–47, 2012.
[20] S. Zheng, C. Chen and L. Chen, “Influence of S Contents on the Hydrogen Blistering and
Hydrogen Induced Cracking of A350LF2 Steel,” Mater. Sci. Appl., vol. 2, no. 7, pp. 917–
921, 2011.
[21] S. N. Smith and W. Michael, “Corrosion of carbon steel by H2S in CO2 containing oil field
Environments,” NACE Int., Paper No.06115, 2006.
[22] J. T. Report, “Corrosion resistant high Cr steel for oil and gas wells,” JFE Tech. Rep., no.
18, pp. 63–65, 2013.
[23] NACE, ISO 15156-2: Petroleum and natural gas industries — Materials for use in H2S-
containing environments in oil and gas production, 2009.
[24] H. Kurahashi, T. Kurisu, Y. Sone, K. Wada, and Y. Nakai, “Stress Corrosion Cracking of
13Cr Steels in CO2 H2S-CI Environments,” Corrosion, vol. 41, no. 4, pp. 211–219, 1985.
[25] P. Patnaik, A Comprehensive Guide to the Hazardous Properties of Chemical Substances.
Wiley, Third Edition,2007.
[26] L. Skrtic, “Hydrogen Sulfide, Oil and Gas, and People’s Health,” Energy, pp. 1–77, May,
2006.
[27] J. G. Speight, “Fuel Science and Technology Handbook,” in Fuel Science and Technology
56
Handbook, New York: Marcel Dekker, 1990, pp. 137–149.
[28] K. O. Xue, M. R. Chitrakar and K. Sakane, “Screening of Adsorbents for Removal of H2S
at Room Temperature,” Green Chemistry, Issue 5, 2003.
[29] W. Sun and S. Nesic, “A Mechanistic Model of H2S Corrosion of Mild Steel,” NACE Int. -
Corros. Conf. Expo, no. 7655, 2007.
[30] J. Kvarekva. J. Amri, “Simulation of Solid-state Growth of Iron Sulfide in Sour Corrosion
Conditions,” NACE Corros., Paper No.11078, 2011.
[31] D. P. Li, L. Zhang, J. W. Yang, M. X. Lu, J. H. Ding, and M. L. Liu, “Effect of H2S
concentration on the corrosion behavior of pipeline steel under the coexistence of H2S and
CO2,” Int. J. Miner. Metall. Mater., vol. 21, no. 4, pp. 388–394, 2014.
[32] M. L. Zhang, W. Zhong, J. Yang and T. Gu, X. Xiao, “Effects of Temperature and Partial
Pressure on H₂S/CO₂ Corrosion of Pipeline Steel in Sour Conditions,” Corrosion, Paper No.
11079, 2011.
[33] A. L. Young and R. C. John, “New Understanding on Corrosion of Alloys in High-
Temperature Sulfidizing Gases,” Corrosion, Paper No. 02486, 2002.
[34] L. N. Houyi Ma, Cheng Xiaoliang and Guiqiu Li, “The influence of hydrogen sulfide on
corrosion of iron under different conditions,” Corros. Sci., pp. 1669–1683, 1999.
[35] D. W. Shoesmith, “The Formation of Ferrous Monosulfide Polymorphs during the
Corrosion of Iron by Aqueous Hydrogen Sulfide at 21°C,” J. Electrochem. Soc., vol. 127,
no. 5, p. 1007, 1980.
[36] L. Khaksar and J. Shirokoff, “Effect of elemental sulfur and sulfide on the corrosion
57
behavior of Cr-Mo low alloy steel for tubing and tubular components in oil and gas
industry,” Materials (Basel)., vol. 10, no. 4, 2017.
[37] L. Khaksar, G. Whelan and J. Shirokoff, “Electrochemical and microstructural analysis of
FeS films from acidic chemical bath at varying temperatures, pH, and Immersion Time,”
Int. J. Corros., 2016.
[38] M. Koteeswaran, “CO2 and H2S Corrosion in Oil Pipelines,” M.S. Thesis, Faculty of
Mathematics and Natural Science, University of Stavanger, Norway, June, 2010.
[39] S. N. Smith, “Predicting Corrosion in Slightly Sour Environments,” Mater. Perform. -
Mater. Sel. Desing, no. 241, pp. 60–64, 2002.
[40] J. S. Smith and J. D. A. Miller, “Nature of Sulphides and Their Corrosive Effect on Ferrous
Metals: A Review,” Br. Corros. J., vol. 10, no. 3, pp. 136–143, 1975.
[41] R. A. Berner, “Thermodynamic Stability of Sedimentary Iron Sulfides,” American Journal
Science., vol. 265, pp. 773–785, 1967.
[42] R. G. Arnold and L. E. Reichen, “Measurement of the Metal Content of Naturally
Occurring, Metal-Deficient, Hexagonal Pyrrhotite by an X-ray Spacing Method,” Am.
Mineral., vol. 47, pp. 105–112, 1962.
[43] B. J. Skinner, R. C. Erd and F. S. Grimaldi “Greigite, the Thio-spinel of Iron; A New
Mineral”,” Am. Mineral., vol. 49, pp. 543–555, 1964.
[44] J. A. Morice, L. V. C. Rees. and D. T. Rickard, “Mössbauer Studies of Iron Sulphides,”
Inorg. Nucl. Chem., vol. 31, pp. 3797–3802, 1969.
[45] F. Pessu, R. Barker, and A. Neville, “Early stages of pitting corrosion of UNS K03014
58
carbon steel in sour corrosion environments : The influence of CO2 , H2S and temperature.,”
NACE Int. - Corros. Conf. Expo, Paper no. 5583, 2015.
[46] W. Sun, D. V Pugh, and R. J. Franco, “A Parametric Study of Sour Corrosion of Carbon
Steel,” NACE Int., Paper no. 10278, pp. 1–20, 2010.
[47] A. I. Almarshad and D. Jamal, “Electrochemical Investigations of Pitting Corrosion
Behaviour of Type UNS S31603 Stainless Steel in Thiosulfate-Chloride Environment,” J.
Appl. Electrochem., vol. 34, no. 1, pp. 67–70, 2004.
[48] Pourbaix. Marcel, “Atlas of Electrochemical Equilibria in Aqueous Solutions.,” NACE Int.,
1966.
[49] M. Saeed Akhtar, A. Alenad, and M. Azad Malik, “Synthesis of mackinawite FeS thin films
from acidic chemical baths,” Mater. Sci. Semicond. Process., vol. 32, pp. 1–5, 2015.
[50] F. Mansfeld, H. Shih, C.H.Tsai, and H. Greene, “Analysis of EIS Data for Common
Corrosion Processes,” Am. Soc. Test. Mater., vol. 1188, pp. 37–53, 1993.
[51] Wei Sun and Srdjan Nesic., “Kinetics of Iron sulphide and Mixed Iron Sulphide / Carbonate
scale precipitation in CO2/H2S Corrosion.” Corrosion, Paper No. 06644, 2006
[52] K. Lee, “A mechanistic modeling of CO2 corrosion of mild steel in the presence of H2S,”
Ph.D. Thesis, Russ College of Engineering and Technology of Ohio Univeristy, November,
2004.
[53] H. Ma et al., “The influence of hydrogen sulfide on corrosion of iron under different
conditions,” Corros. Sci., vol. 42, no. 10, pp. 1669–1683, 2000.
[54] W. Sun, S. Nešić, and S. Papavinasam, “Kinetics of corrosion layer formation. Part 2 - Iron
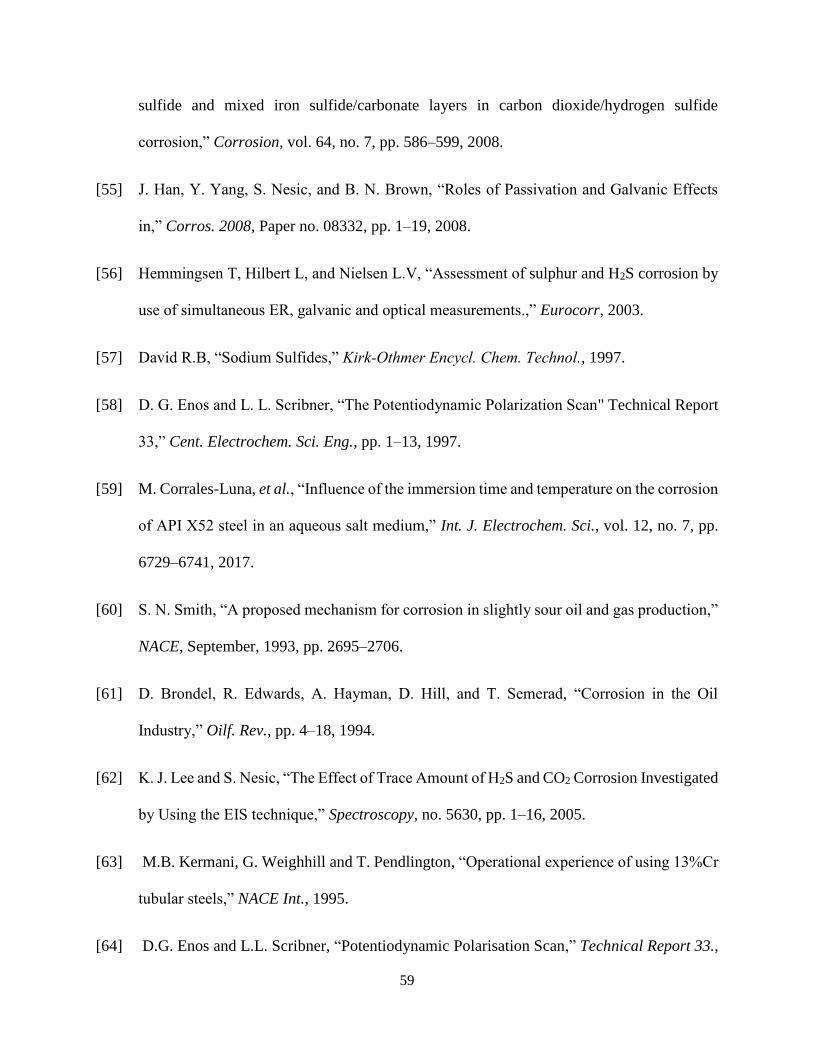
59
sulfide and mixed iron sulfide/carbonate layers in carbon dioxide/hydrogen sulfide
corrosion,” Corrosion, vol. 64, no. 7, pp. 586–599, 2008.
[55] J. Han, Y. Yang, S. Nesic, and B. N. Brown, “Roles of Passivation and Galvanic Effects
in,” Corros. 2008, Paper no. 08332, pp. 1–19, 2008.
[56] Hemmingsen T, Hilbert L, and Nielsen L.V, “Assessment of sulphur and H2S corrosion by
use of simultaneous ER, galvanic and optical measurements.,” Eurocorr, 2003.
[57] David R.B, “Sodium Sulfides,” Kirk‐Othmer Encycl. Chem. Technol., 1997.
[58] D. G. Enos and L. L. Scribner, “The Potentiodynamic Polarization Scan" Technical Report
33,” Cent. Electrochem. Sci. Eng., pp. 1–13, 1997.
[59] M. Corrales-Luna, et al., “Influence of the immersion time and temperature on the corrosion
of API X52 steel in an aqueous salt medium,” Int. J. Electrochem. Sci., vol. 12, no. 7, pp.
6729–6741, 2017.
[60] S. N. Smith, “A proposed mechanism for corrosion in slightly sour oil and gas production,”
NACE, September, 1993, pp. 2695–2706.
[61] D. Brondel, R. Edwards, A. Hayman, D. Hill, and T. Semerad, “Corrosion in the Oil
Industry,” Oilf. Rev., pp. 4–18, 1994.
[62] K. J. Lee and S. Nesic, “The Effect of Trace Amount of H2S and CO2 Corrosion Investigated
by Using the EIS technique,” Spectroscopy, no. 5630, pp. 1–16, 2005.
[63] M.B. Kermani, G. Weighhill and T. Pendlington, “Operational experience of using 13%Cr
tubular steels,” NACE Int., 1995.
[64] D.G. Enos and L.L. Scribner, “Potentiodynamic Polarisation Scan,” Technical Report 33.,

60
University of Virginia, January, 1997.
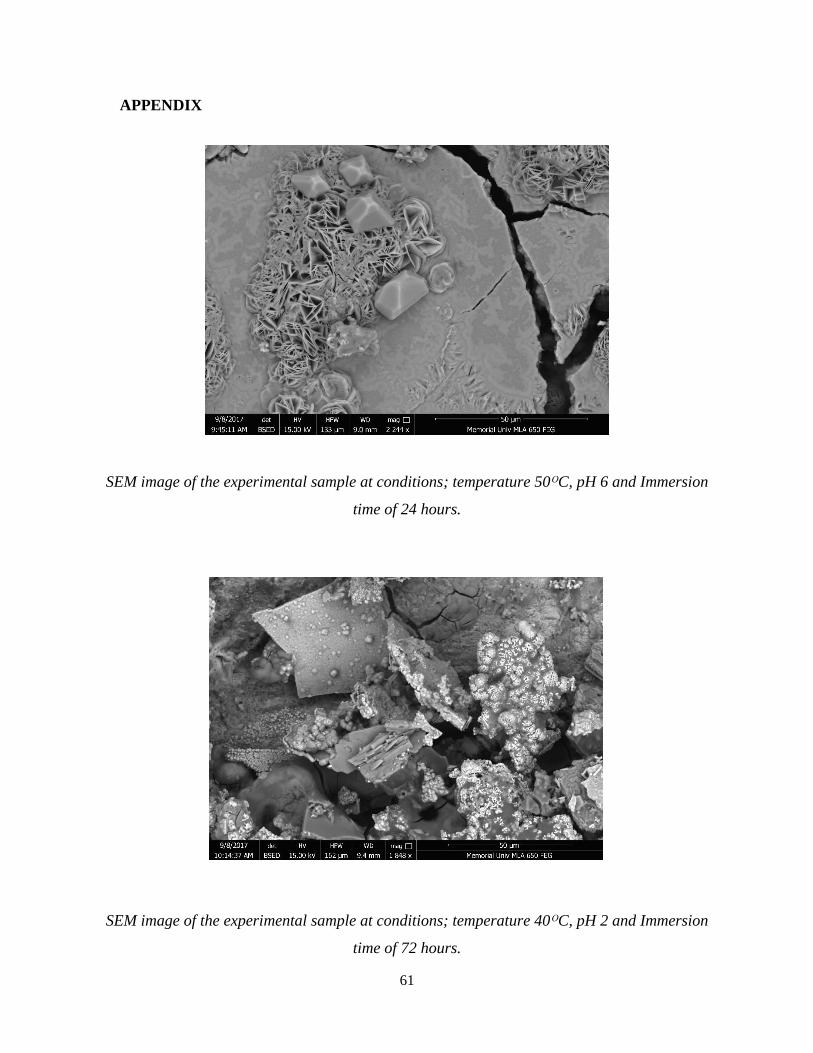
61
APPENDIX
SEM image of the experimental sample at conditions; temperature 50ᴼC, pH 6 and Immersion
time of 24 hours.
SEM image of the experimental sample at conditions; temperature 40ᴼC, pH 2 and Immersion
time of 72 hours.
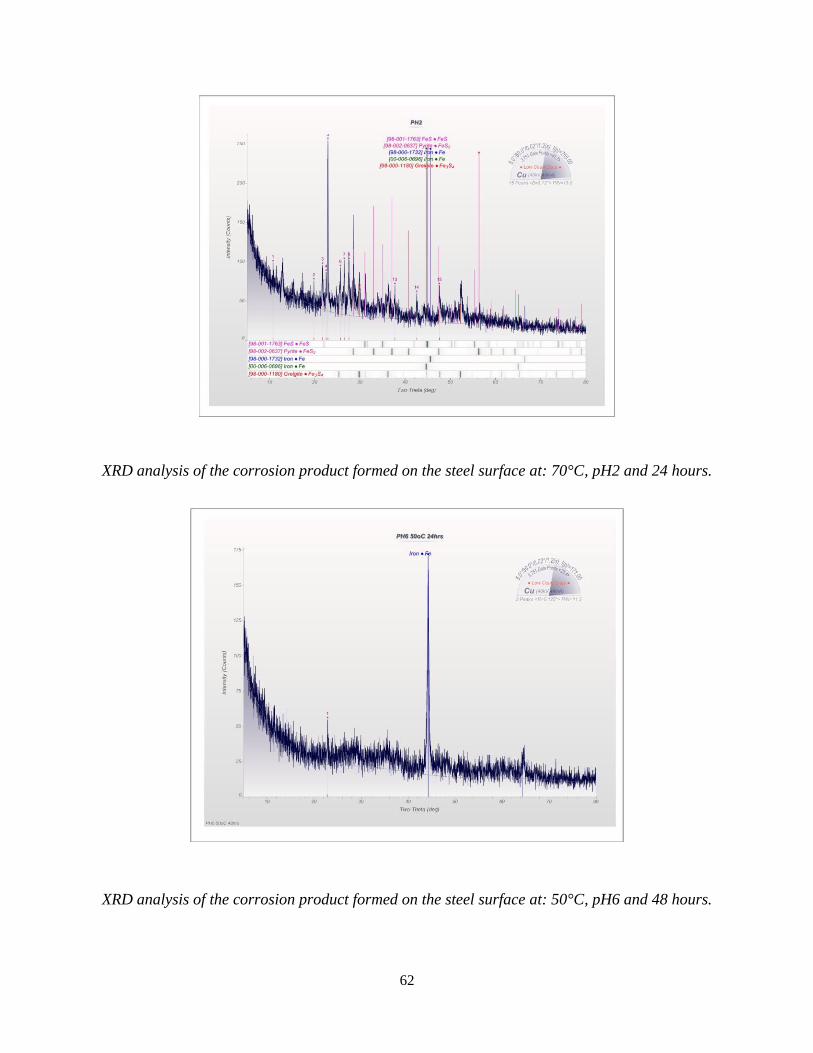
62
XRD analysis of the corrosion product formed on the steel surface at: 70°C, pH2 and 24 hours.
XRD analysis of the corrosion product formed on the steel surface at: 50°C, pH6 and 48 hours.
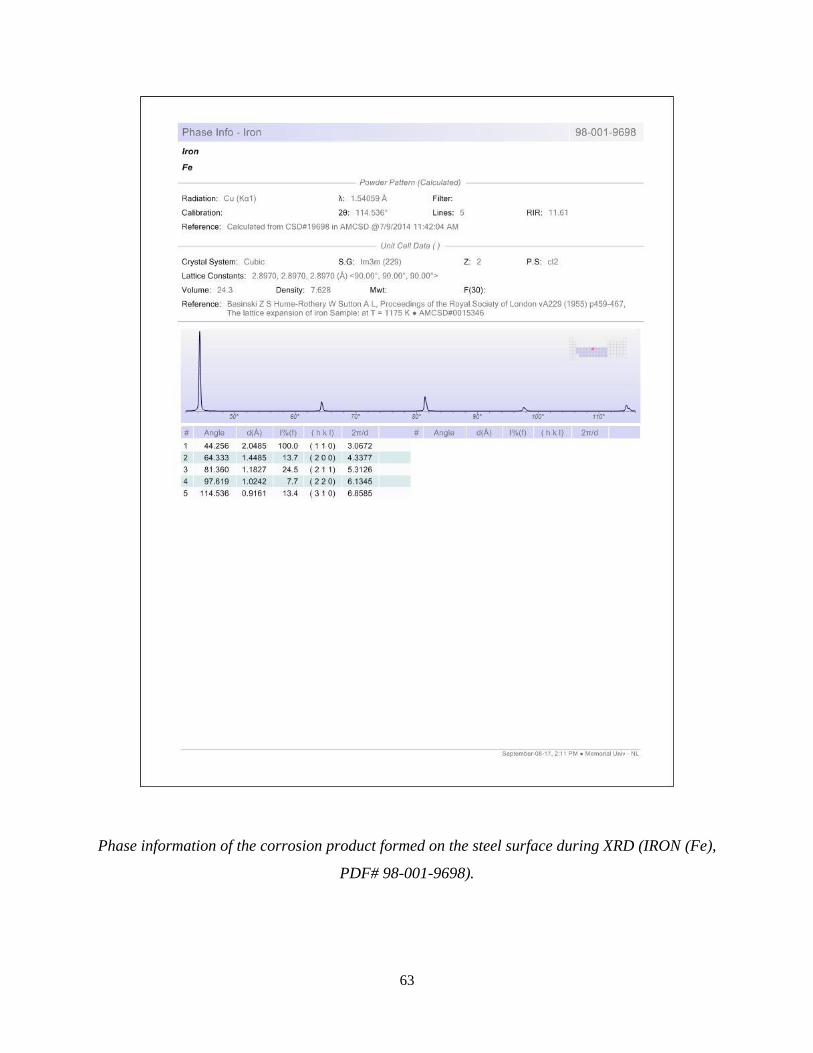
63
Phase information of the corrosion product formed on the steel surface during XRD (IRON (Fe),
PDF# 98-001-9698).
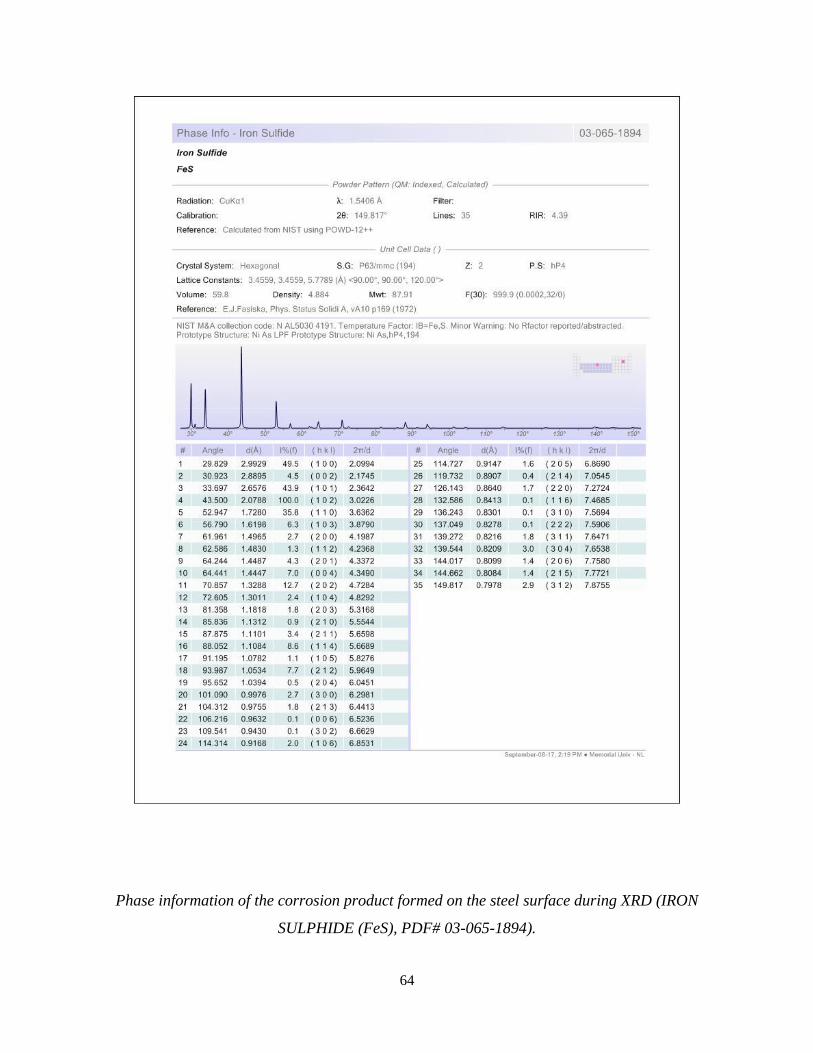
64
Phase information of the corrosion product formed on the steel surface during XRD (IRON
SULPHIDE (FeS), PDF# 03-065-1894).

65
Phase information of the corrosion product formed on the steel surface during XRD (PYRITE
(FeS2), PDF# 00-042-1340).
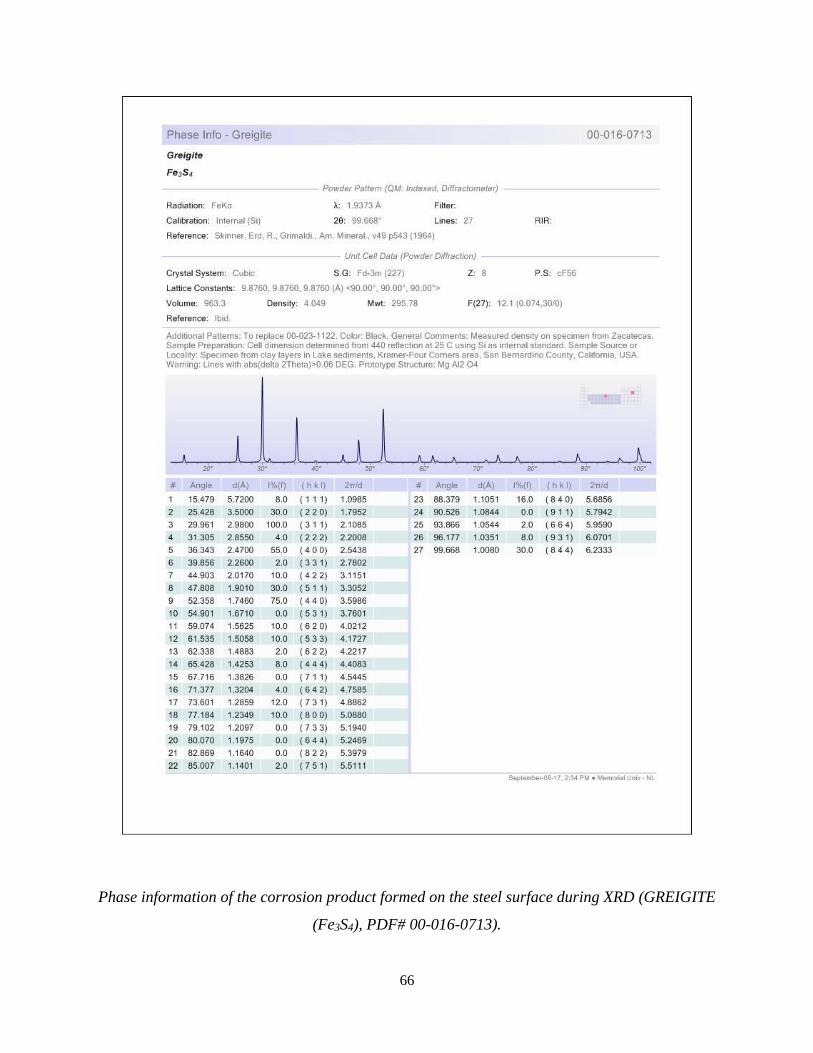
66
Phase information of the corrosion product formed on the steel surface during XRD (GREIGITE
(Fe3S4), PDF# 00-016-0713).
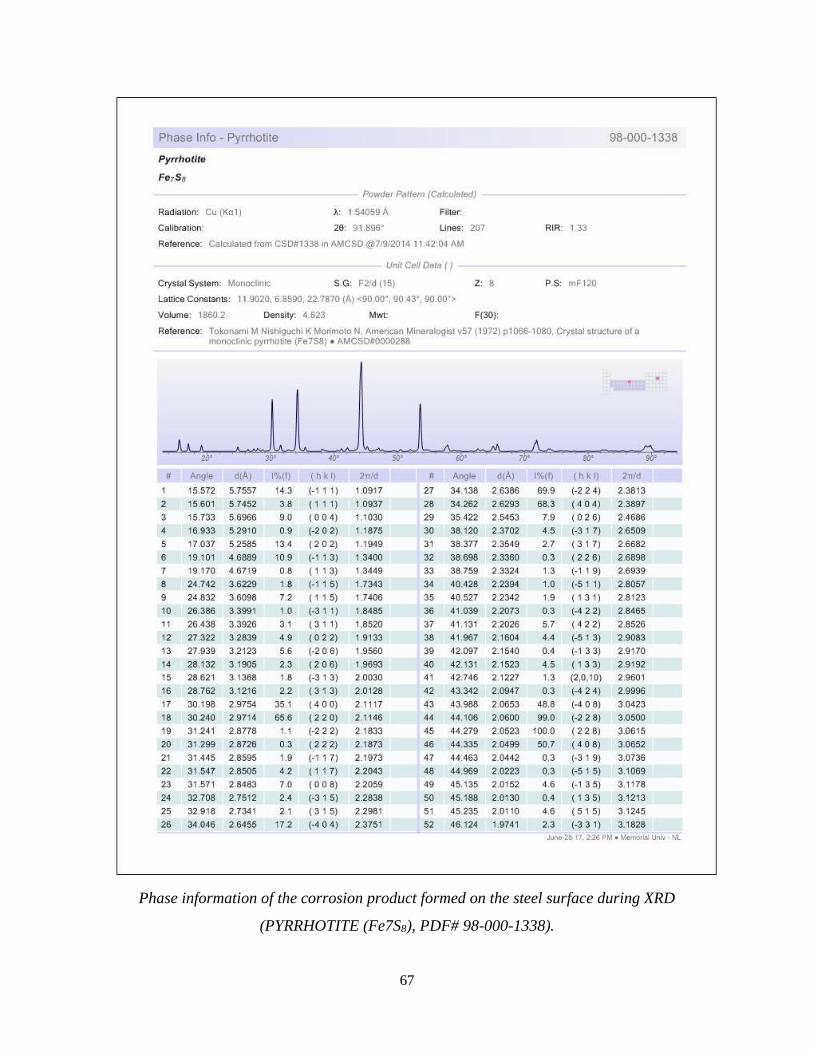
67
Phase information of the corrosion product formed on the steel surface during XRD
(PYRRHOTITE (Fe7S8), PDF# 98-000-1338).
Top Related
Copyright © 2022 FDOKUMEN

