


Bahasa
Halaman
Hukum

-4
Effects of Detergent Use on Water Quality in Kathmandu, Nepal
by
Amanda Richards
BS Chemical EngineeringCornell University, 2002
Submitted to the Department of Civil and Environmental Engineering in PartialFulfillment of the Requirements for the Degree of
Master of Engineeringin Civil and Environmental Engineering
at theMassachusetts Institute of Technology
June, 2003
02003 Amanda RichardsAll rights reserved.
hereby grants to MIT permission to reproduce and to distribute publicly paper andelectronic copies of this thesis document in whole and in part.
Signature of AuthorDepartment of Civil and Environmental Engineering
May 09, 2003
Certified by
Lecturer, Department of Civil
Susan MurcottThesis Supervisor
and Environmental Engineering
Accepted byr . ' fOral Buyukozturk
Chairman, Departmental tommittee on Graduate Studies
MASSACHUSETTS INSTITUTEOF TECHNOLOGY
JUN 0 2 2003
LIBRARIES
The author


Effects of Detergent Use on Water Quality in Kathmandu, Nepal
by
Amanda Richards
Submitted to the Department of Civil and Environmental Engineeringon May 09, 2003 in Partial Fulfillment of the
Requirements for the Degree of Master of Engineering inEnvironmental Engineering
ABSTRACTThe Guheshwori wastewater treatment plant in Kathmandu, Nepal, experiences foaming
problems. Engineers from the facility attribute the foaming to synthetic detergent use,suspecting that the anionic surfactants used in local laundry detergents exhibit poorbiodegradation properties. In particular, the use of the highly branched form of alkylbenzenesulfonate (ABS) is assumed.
Eighteen synthetic laundry detergents were collected from around Kathmandu,representing 10 companies and 3 countries of origin. The detergent analysis followed themethylene blue active substance (MBAS) procedure. The representative total anionic surfactantconcentration is estimated to be 6.6 weight percent. After two weeks of degradation, the averageremaining surfactant concentration is 0.5 weight percent. The author suggests that this level isenough to play some, but not a significant role in the foaming at the Guheshwori WWTP.Potential major contributors to foaming at the Guheshwori facility are industrial detergents,especially those used by the textile and carpet industry and filamentous bacteria.
The detergent samples were also examined for orthophosphates, with a representativeconcentration of 402 mg/kg detergent. This value was compared to monitoring data from theBagmati River, as part of the South Asia Trans-boundary Water Quality Monitoring Program(SATWQM). The author concludes from the data that phosphates from synthetic detergents donot significantly contribute to eutrophication of the Bagmati River.
Thesis Supervisor: Susan MurcottTitle: Lecturer, Department of Civil and Environmental Engineering

-A

Acknowledgements
First and foremost, thanks to Will for his incredible patience, supportand love. You are my everything, and I am tingly with anticipationwhen I think of the wonders the next few weeks hold in store for us.Thanks also to my family and soon-to-be family, whose endlessencouragement and prayers have been and continue to be immeasurablyvaluable. Thanks to Susan for her tireless leadership, advice andguidance. Thanks to the entire Nepal-03 Team, and especially theWastewater Group for the camaraderie and great memories. Thanksfinally to the staff at ENPHO for making us feel so welcome andcomfortable during our visit to Nepal.


Table of Contents
List of Figures page 9
1. Introduction page 11
1.1 Description of Bagmati River 11
1.2 Overall Wastewater Treatment Situation in Kathmandu 14
1.3 Guheshwori Wastewater Treatment Plant 17
1.4 Thesis Objective 21
2. South Asia Trans-Boundary Water Quality Monitoring Program page 22
2.1 Program Overview 22
2.2 Monitoring Equipment 24
2.3 Data and Analysis 24
3. Foaming in WWTP's and Surface Waters page 31
3.1 Foaming Overview 31
3.2 Causes of Foaming - Filamentous Bacteria 34
3.3 Causes of Foaming - Surfactants 34
3.4 Control Mechanisms 36
4. History and Regulations of Surfactants in Synthetic Detergents page 40
4.1 History of Synthetic Detergents 40
4.2 Regulations Concerning Alkylbenzene Sulfonate 41
4.3 Introduction of Linear Alkylbenzene Sulfonate 42
4.4 Current Controversy Surrounding Linear Alkylbenzene Sulfonate 43
4.5 LAS Regulations in Europe 44
5. Phosphates in Synthetic Detergents and Eutrophication page 46
5.1 Role of Phosphates in Synthetic Detergents 46
5.2 Eutrophication 47
5.3 Regulation History 50
6. Detergent Analysis page 52
6.1 Materials 52
6.2 ABS Analysis 53
7

6.3 Orthophosphate Analysis 587. Results and Discussion page 63
7.1 Conclusions Regarding Detergents and Foaming 63
7.2 Conclusions Regarding Detergents and Eutrophication 66
Works Cited page 67
Appendix A: SATWQM Data page 70
Appendix B: Surfactant Analysis Data page 72
Appendix C: Phosphate Analysis Data page 83
8
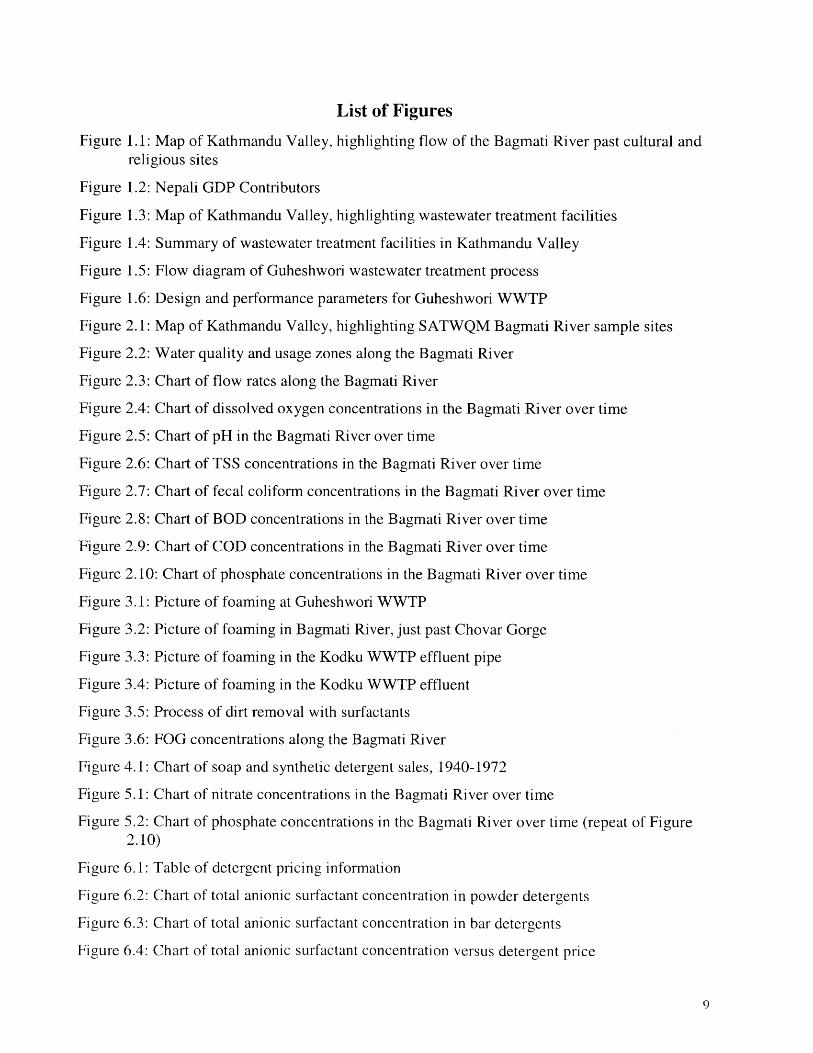
List of Figures
Figure 1.1: Map of Kathmandu Valley, highlighting flow of the Bagmati River past cultural andreligious sites
Figure 1.2: Nepali GDP Contributors
Figure 1.3: Map of Kathmandu Valley, highlighting wastewater treatment facilities
Figure 1.4: Summary of wastewater treatment facilities in Kathmandu Valley
Figure 1.5: Flow diagram of Guheshwori wastewater treatment process
Figure 1.6: Design and performance parameters for Guheshwori WWTP
Figure 2.1: Map of Kathmandu Valley, highlighting SATWQM Bagmati River sample sites
Figure 2.2: Water quality and usage zones along the Bagmati River
Figure 2.3: Chart of flow rates along the Bagmati River
Figure 2.4: Chart of dissolved oxygen concentrations in the Bagmati River over time
Figure 2.5: Chart of pH in the Bagmati River over time
Figure 2.6: Chart of TSS concentrations in the Bagmati River over time
Figure 2.7: Chart of fecal coliform concentrations in the Bagmati River over time
Figure 2.8: Chart of BOD concentrations in the Bagmati River over time
Figure 2.9: Chart of COD concentrations in the Bagmati River over time
Figure 2.10: Chart of phosphate concentrations in the Bagmati River over time
Figure 3.1: Picture of foaming at Guheshwori WWTP
Figure 3.2: Picture of foaming in Bagmati River, just past Chovar Gorge
Figure 3.3: Picture of foaming in the Kodku WWTP effluent pipe
Figure 3.4: Picture of foaming in the Kodku WWTP effluent
Figure 3.5: Process of dirt removal with surfactants
Figure 3.6: FOG concentrations along the Bagmati River
Figure 4.1: Chart of soap and synthetic detergent sales, 1940-1972
Figure 5.1: Chart of nitrate concentrations in the Bagmati River over time
Figure 5.2: Chart of phosphate concentrations in the Bagmati River over time (repeat of Figure2.10)
Figure 6.1: Table of detergent pricing information
Figure 6.2: Chart of total anionic surfactant concentration in powder detergents
Figure 6.3: Chart of total anionic surfactant concentration in bar detergents
Figure 6.4: Chart of total anionic surfactant concentration versus detergent price
9

Figure 6.5: Chart of anionic surfactants before and after degradation in powder detergents
Figure 6.6: Chart of anionic surfactants before and after degradation in bar detergents
Figure 6.7: Chart of phosphate concentration in powder detergents
Figure 6.8: Chart of phosphate concentration in bar detergents
Figure 6.9: Chart of phosphate concentration versus detergent price
Figure 6.10: Chart of phosphate concentration versus total anionic surfactant level
Figure 7.1: Chart of flow rates along the Bagmati River (repeat of Figure 2.3)
Figure A. 1: SATWQM Data from April to August, 2002
Figure A.2: SATWQM Data from September to December, 2002
Figure C. 1: Calibration Curves for Phosphate Analysis
10

1. Introduction
1.1 Description of Bagmati River
The Bagmati River is one of Nepal's most important and culturally significant bodies of
water. Not only is it the largest river in Kathmandu Valley, it holds special religious value for
both Hindus and Buddhists. Flowing from its sources in the foothills northeast of Kathmandu
through the Terai and into India, the banks of the Bagmati River accommodate several notable
centers of worship. Upstream of Kathmandu Valley, the pristine river tumbles over the boulders
at Sundarijal, the site of a 13th century cave shrine to Mahadevi (Great Goddess).
A few miles downstream the Bagmati River runs through the Gokarna Mahadev (Great
God) Temple Complex. The Hindu god Shiva's secret goddess, Shatidevi, and other female
deities are worshipped at the Guheshwori Temple, and just downstream Shiva himself is
worshipped at Pashupatinath. The dead are cremated daily on the riverbanks at Pashupatinath,
one of the most holy religious centers for all Hindus.
As the Bagmati River enters the city of Patan (Lalitpur) just south of Kathmandu, it flows
past numerous Buddhist temples, monasteries and stupas. Where the river finally leaves
Kathmandu Valley at the Chovar Gorge, it passes the Jal Binayak Temple dedicated to the Hindu
elephant god, Ganesh. Figure 1.1 displays the path of the Bagmati River as it flows through
Kathmandu Valley, highlighting many of the locations mentioned above.
I1

Figure 1.1: Map of Bagmati River flowing through Kathmandu Valley'
Gokarna Sundarijal
KATHMANDU
Pashupatinath Guheshwori
TribuhavenInternational
AirportBHAKTAPUR
Tilganga
KIRTIPUR THIMI
PATANSundarighat 4
Map LegendChovar
Bagmati River RO Major Roads
-Other Rivers CITY NAME, Site
Kathmandu Valley is comprised of five cities: Nepal's capital city, Kathmandu, Patan,
Bhaktapur, Kirtipur and Thimi. These cities appear above in Figure 1.1. As of February 2000,
the Valley claimed about 1.3 million residents, with a projected population growth of 4 to 5
percent yearly (Metcalf & Eddy, 2000). The City of Kathmandu contains approximately
500,000 of these residents and covers more than 31.5 mi2 (50.7 km2) (Finlay, 2001). The growth
of both Kathmandu Valley and Kathmandu City are attributed to high birth rates, but also to a
heavy influx of families from outlying and rural areas.
Approximately 90% of Nepal's population lives in rural areas, existing as subsistence
farmers with little or no participation in the cash economy (Finlay, 2001). As of 2000, Nepal's
per capita GDP is only $240 US. Figure 1.2 shows the major contributors to Nepal's gross
domestic product (GDP) 2.
Figure 1.1 is a reproduction of Figure IV-2, from Metcalf & Eddy, 20002 Data used in Figure 1.2 comes from Finlay, 2001.
12
Figure 1.2: Nepali GDP Contributors2
Other (8%)Tourism (22%) Agriculture (40%)
Manufacturing andService Industry (30%)
Industrial development in Nepal is still in an early stage. As shown in Figure 1.2, the
first major industry of Nepal is tourism, accounting for approximately 22% of the kingdom's
GDP. The second major industry of Nepal is the carpet business. The success of carpet
manufacturers has waned in recent years, however, largely due economic hardship, especially a
decline in tourism. Other factors include negative publicity connecting the industry with child
labor practices and the use of dangerous synthetic dyes (Finlay, 2001). MIT Nepal Project team
member, Hillary Green, examined Nepal's carpet industry and its effects on water quality in her
thesis "The Effects of Carpet Dye on the Bagmati River" (2003). Other industries worthy of
mention include garments and textiles, leather products, paper and cement. Some production
takes place in large, modem factories, but most businesses are small-scale, often run out of
cottages or open areas protected by makeshift, sheet metal fences.
As Kathmandu Valley continues to develop industrially and as the city grows in
population and expands into outlying areas, the Bagmati River and other urban surface waters
are becoming more and more polluted. Quality of life in Kathmandu has not advanced
proportionately with industrial development. One reason among others is that Kathmandu lacks
13
adequate solid waste and wastewater collection and treatment systems. The February 2000 ADB
Report of Urban Water Supply Reforms in the Kathmandu Valley maintains that the current
wastewater collection system covers only 35 percent of households in the Valley (Metcalf &
Eddy, 2000).
Kathmandu also does not have proper drinking water treatment and supply systems. Tap
water and public water sources are generally contaminated but still essential. "Some households
receive water for only 1-2 hours per day in the dry season - and some receive none at all"
(Metcalf & Eddy, 2000). Shortages during the dry season, leaks in distribution pipelines and
illegal taps into water mains are some of the principal causes leading to a continual deficiency.
Those without other resources rely on local surface water, namely the Bagmati River, for
bathing, washing clothes and food, and even for drinking and as a public toilet. Furthermore, the
River has become a sewage discharge site for municipal wastewater and an industrial dumping
grounds for local businesses with no other means of disposal.
1.2 Overall Wastewater Treatment Situation in Kathmandu
Kathmandu Valley currently has five municipal wastewater treatment facilities: an
activated sludge plant at Guheshwori, non-aerated lagoons at Kodku and Dhobighat, and aerated
lagoons at Sallaghari and Hanumanghat. Of the five, the only wastewater treatment plant in
operation as of January 2003 is the activated sludge system at Guheshwori (discussed in detail
below in Section 1.3).
The wastewater treatment plants at Kodku and Dhobighat were constructed under the
World Bank-funded "Water Supply and Sewage Project" in 1978. This project marked the
introduction of a modem sewage collection and treatment system in Kathmandu (Darnal, 2002).
Kodku lies along the Bagmati River in the city of Patan (Figure 1.3). The Kodku plant is
a non-aerated lagoon facility with a design capacity of 1.1 MLD (Metcalf & Eddy, 2000). The
2000 ADB Report lists the plant's status as "partially operational." In his report "Wastewater in
the Greater Kathmandu," MIT Nepal Project member Tetsuji Arata confirms the operational
status of the Kodku WWTP in January 2003, observing that effluent discharged into the Bagmati
River "was bubbling" and smelled "just like that of sewer water" (Arata, 2003).
14
The Dhobighat facility is positioned downstream from Kodku, in the southwest area of
Kathmandu Valley (Figure 1.3). As such, the wastewater treatment plant at Dhobighat is the
furthest downstream of the five treatment facilities in Greater Kathmandu. Designed in 1978, the
plant was built with a capacity of 15.4 MLD (Metcalf & Eddy, 2000). Today, estimated sewage
flow for the area exceeds 120 MLD (Darnal, 2002). In this plant, gravity-driven sewage flows to
a sump well in Sundarighat, where it is pumped to the plant at Dhobighat, consisting two non-
aerated lagoons and one facultative pond. The pump station at Sundarighat, the pump main and
the interceptors along the Bagmati and Bishnumati Rivers are all broken in places, so untreated
wastewater drains directly into the Rivers (Darnal, 2002). As of January 2003, this plant was
used as a pasture for cattle (Arata, 2003).
Figure 1.3: Map of Wastewater Treatment Plants in Kathmandu Valley 3
Map Legend
Bagmati River
-Other RiversGuheshwori
"a"Maior Roads KAT AND WWTP
OWWTP Location
CITY NAME, Site Tiuae HKTribuhaven BHAKTAPURInternational -
Airport
SallaghariWWTP
KIRTIPUR PATAN THIMIKodkuWWTP
DhobighiatWWTPHannianhat HanumanteWWTP anumaghat River
WWTP
Sallaghari and Hanumanghat both lie along the Hanumante River in Bhaktapur, upstream
from its junction with the Bagmati River near Kodku (Figure 1.3). These treatment facilities
were designed as aerated lagoons, with capacities of 2.0 and 0.5 MLD, respectively (Metcalf &
3 Figure 1.3 is a reproduction of Figure IV-2 from Metcalf & Eddy, 2000.
15

Eddy, 2000). The 2000 ADB Report describes both plants as partially operating and in need of
rehabilitation.
Tetsuji Arata observes in January 2003 that the aeration systems from both facilities were
removed and sold. He describes that the Sallaghari plant originally had two collection mains: a
northern main with a pump feed, and a southern one using gravity feed. Since the shutdown of
the plant, local farmers have removed the pump from the northern main and plugged the southern
main so that inflowing, untreated wastewater could be used for irrigation purposes. Also, the
Hanumanghat site is now used as a crop field (Arata, 2003).
Figure 1.4 summarizes the reported capacities and present operating status of the
wastewater treatment facilities discussed above. A small discrepancy exists between the
capacity of the Guheshwori WWTP reported in Metcalf & Eddy, 2000 (shown in Figure 1.4 as
4.6 MGD) and that reported in the BASP Introduction Pamphlet, 2002 (listed in Figure 1.6 as 4.3
MGD). The author of this thesis uses 4.3 MGD as the capacity of the Guheshwori treatment
facility.
Figure 1.4: Operating Capacity and Status of WWTP in Kathmandu Valley4
Reported StatusPlant Capacity MLD ADB Report, Feb 2000 MIT Nepal Team, Jan 2003
Guheshwori 17.3 (4.6 MGD) Under Construction OperatingHanumanghat 0.5 (0.13 MGD) Partially Operating Not OperatingSallaghari 2.0 (0.53 MGD) Partially Operating Not OperatingKodku 1.1 (0.29 MGD) Partially Operating Partially OperatingDhobighat 15.4 (4.1 MGD) Not Operating Not Operating
In addition to the collection systems noted above, Kathmandu Valley contains 43,000
septic tanks. Eight collection vehicles with a capacity of 1.5 m3/vehicle service the tanks, and
the septage is treated using low-energy treatment systems. Upwards of 35 truckloads of sewage
a day should be collected, but "septic tank cleaning is generally performed too infrequently"
(Metcalf & Eddy, 2000).
One such low-energy treatment method gaining popularity in Kathmandu and elsewhere
is the constructed wetland system. Constructed wetlands treatment systems are designed to
mimic and optimize the natural removal processes of wetlands. In such systems, suspended
solids are filtered as the wastewater flows through the wetland soil. Also, bacteria, fungi and
other organisms indigenous to wetlands decompose biodegradable compounds in the wastewater.
16

Aquatic plants take an active role in wastewater treatment, acting as a source of oxygen and a
sink for nitrogen, phosphorus and other nutrients.
These systems are gaining popularity throughout Nepal and other developing nations
because of their low cost and maintenance requirements. MIT Nepal Project team member,
Saik-Choon Poh, explores constructed wetlands in his thesis "Assessment of Constructed
Wetland Systems in Nepal" (2003) and their applicability in developing countries like Nepal.
1.3 Guheshwori Wastewater Treatment Plant
In 1995 the Nepali government developed a Master Plan with the goal of monitoring and
rehabilitating the Bagmati River and established a "High Powered Committee for
Implementation and Monitoring of the Bagmati Area Sewerage Construction and Rehabilitation
Project (BASP)". The Committee designated the section of the Bagmati between Gokama and
Tilganga as its highest priority, as this is an area of both heavy human use and of great religious
importance. In particular, the temple areas of Pashupatinath and Guheshwori fall within this
section. Figure 1.1 illustrates a layout of the area between Gokarna and Tilganga. To address
the area's pollution problem, the Committee installed interceptor drains to reduce the flow of raw
sewage into the Bagmati River. These sewers run from Gokarna and Mitrapark and connect to a
municipal wastewater treatment plant near the Guheshwori Temple.
In operation since January 2001, the wastewater treatment plant at Guheshwori is the first
municipal treatment plant of its size in Nepal. Up to 0.19 m3/s (4.3 MGD) wastewater is treated
here using an activated sludge process, but the design lacks a primary sedimentation tank. The
plant's project manager, Ram Deep Shah, explains that primary sedimentation was neglected by
the Committee to avoid having to invest in costly anaerobic sludge digesters (Shah, 2003).
Figure 1.5 provides a layout of the unit processes involved in treatment at the Guheshwori
WWTP.
When the wastewater first enters the treatment plant, a mechanical bar rack removes large
particles from the influent. The facility has a manual back-up rack should the mechanical one
fail. The removed particles are dumped onto the ground, and the wastewater continues to the grit
chamber.
4 Data for Figure 1.4 from Metcalf & Eddy, 2000 and Arata. 2003.
17
In the grit chamber, smaller particles such as sand settle to the bottom of the tank. The
settled matter is mechanically scraped from the bottom of the tank and dumped on the ground
adjacent to the tank.
The wastewater is next biologically treated. The plant at Guheshwori has two carrousel-
type oxidation ditches each with three aerators. With a capacity of 10,400 m3 water, the total
oxygen demand is 355 kg/hr. 60 HP are required to drive the aerators.
Wastewater flows from the biological unit to two secondary sedimentation clarifiers. Up
to 2,500 MLSS sludge is pumped from the clarifiers back to the oxidation ditches to be
metabolized by microorganisms, and any excess sludge is diverted to one of fourteen drying
beds. According to plant personnel, sludge production has not exceeded 2,500 MLSS since the
plant has been in operation, so the drying beds have seen no use. It is improbable that all of the
sludge is utilized in the oxidation ditches, so the solids are likely either building up in the
oxidation ditches or leaving the treatment facility with the effluent.
The municipal wastewater treatment plant has a design capacity of 0.19 m3/s (4.3 MGD),
but the actual flow of sewage often exceeds this rate during the monsoon season. Sewage and
stormwater collection systems are not separated, so the wastewater flow attains a maximum of
0.5 m3/s (11.3 MGD) during Nepal's wet season. Untreated water in excess of 0.19 m3/s (4.3
MGD) bypasses around the wastewater treatment plant and mixed with the treated effluent. The
treated and untreated water is pumped underground through a tunnel from the treatment facility
and joins the Bagmati River at a location 572 m downstream from the plant. This is done reduce
the pollution to the most holy areas of the Bagmati River, those adjacent to the Guheshwori and
Pashupatinath temples.
18

8. Primary TreatmentSewer Line from GokamaSewer Line from MitraparkBy Pass Sewerline
A1 -w
B18283
Mechanical Bar ScreenSewage PumpMechanical Grit Removal System &Flow Measurement
A2
e
C40
0
a
rj
To the tunnel
Trickled Wa
C. Biological TreatmentC1 Oxidation DitchC2 Secondary clarifierC3 Recirculation
Dried Sludge
ter
B3
D1 0
C2
D, Effuent lineD1 Effuent ChanneD2 Flow measurement
To theTunne
C
CL
U
tb-C7
A. Influent Line
AlA2A3
A3

Figure 1.6: Design and Performance Parameters for Guheshwori WWTP6
Guheshwori WWTP Design Parameters
Service Area 5.37 km 2 (3.28 mi2)
Service Population (1996) 58,000
Projected Population (2021) 198,000
Wastewater Produced 80 L/cap-d
WWTP Footprint 51 m2 (164 ft2)
Energy Consumption 2.3 KW-hr/kg BOD
Annual Operating Costs $167,000 USDesign Flow 0.19 m3/s (4.3 MGD)
MLSS 3,500 mg/L
F/M 0.34
Guheshwori WWTP Performance
Parameter Influent Effluent Removal
BOD5 270 mg/L 25 mg/L 91%
COD 1150 mg/L 250 mg/L 78%
TSS 216 mg/L 100 mg/L 54%
TKN 48 mg/L 30 mg/L 38%
NH 4-N 41.7 mg/L 22.1 mg/L 47%
P 6.71 mg/L 3.2 mg/L 52%
It is a hotly debated question among wastewater professionals whether conventional
activated sludge wastewater treatment plants are appropriate treatment technologies suitable for
developing countries like Nepal (Harleman, 2001). Operation and maintenance of the facility at
Guheshwori costs an estimated 12.5 million NRs/year ($167,000 US/year) (BASP Introduction
Pamphlet, 2002). With costs like this, it is unclear how much longer the plant will be in
operation (Shrestha, 2003). The major reason that operation costs of the Guheshwori WWTP are
so high is because electricity is very expensive in Nepal. Electricity costs 7 NRs ($0.01 US) per
unit (kW-hr) in Nepal, averaging 1,000 NRs ($13 US) per month for residents whose monthly
income is only 5,000 NRs ($67 US) (Phuyal, 2002). Nepal has few exploitable fossil fuel
sources, so electricity production efforts have been primarily focused on hydroelectric plants.
Even this source, however, is largely untapped.
In addition to financial concerns, a few serious technical issues arise in the Guheshwori
treatment plant. Touring the wastewater treatment plant, an observer notices a thin film of
feathers floating atop the water in the oxidation ditches. The feathers from slaughtered chickens
and other birds are washed into the Bagmati River and into sewer drains, and the feathers are
carried all the way to the treatment plant. The presence of feathers in treated effluent is
dangerous, because they can harbor harmful microorganisms in otherwise clean water. The two
major removal processes employed at the Guheshwori plant are ineffective against feathers. The
20

feather structure prevents it from sinking like grit, and microorganisms are not effective in
breaking feathers down. Because the facility has no mechanism for their removal, feathers are
presently manually skimmed from the oxidation ditches.
A second technical issue, and the one on which this thesis focuses, is the problem of
foaming. On cold nights and mornings, especially during the winter season, the 3.5 m (10.9 ft)
deep oxidation tanks have up to 1 m (3.3 ft) of foam on the water surface. This is a problem,
because wastewater foaming prevents oxygen transfer. Also, foam can be blown around by
wind, creating dangerous and slippery working conditions for plant workers as well as an
airborne source of recontamination downstream. As with the feathers, operators and technicians
make-do with manual and temporary solutions to the problem. Every morning they spray water
from hoses at the foam to dissipate it. Ram Deep Shah attributes this foaming to the use of
synthetic detergents, both on a household level and by industries, namely carpet and textile
manufacture (Shah, 2003). Because industrial wastewater pretreatment and treatment are rare in
Kathmandu, the carpet and garment industries, including wool dyeing and washing, contribute
high levels of detergents and fine textile fibers to receiving waters, which aid in foaming (Shah,
2002).
1.4 Thesis Objective
This thesis considers two types of water pollution possibly arising from the use of
synthetic laundry detergents in Kathmandu, Nepal. The author first seeks to confirm or refute a
connection between foaming problems in the Guheshwori Wastewater Treatment Plant and the
anionic surfactants present in synthetic laundry detergents locally sold in Kathmandu. In
particular, the author analyzes these laundry detergents for the branched and linear forms of the
surfactant alkylbenzene sulfonate (ABS and LAS, respectively) and estimates the load of each to
the Guheshwori WWTP and to the Bagmati River.
The author further examines controversy surrounding synthetic laundry detergents by
comparing phosphate concentrations in these detergents to those in the Bagmati River and by
evaluating the contribution of laundry washing to nutrient loading and eutrophication of the
River.
21
6 Figure 1.6 is a compilation of data from BASP, 2002; Shah. 2002 and Darnal, 2002.
2. South Asia Trans-Boundary Water Quality Monitoring Program
2.1 Program Overview
Water quality management and water pollution abatement are significant and complex
issues. These concerns become even more complicated when one considers that many of a
nation's rivers and streams are not fully contained by that single nation, but are trans-boundary
waters. A particular country must contend not only with pollution originating within its
boundaries, but it must also anticipate the flux of pollution to and from neighboring nations
through air and water flow.
With these concerns in mind, researchers and organizations from four South Asian
nations joined Sandia National Laboratories' Cooperative Monitoring Center in establishing an
experimental trans-boundary monitoring program. Since February of 2002, Bangladesh, India,
Nepal and Pakistan have been monitoring rivers that act as major tributaries to the Indus and
Ganges Rivers. Specifically, the South Asia Trans-Boundary Water Quality Monitoring
Program (SATWQM) has focused on the Bagmati and Narayani Rivers flowing between Nepal
and India and the Ganges River flowing between Bangladesh and India, and the Ravi River
flowing between Pakistan and India (Sandia National Laboratories, undated).
The non-government organization ENPHO (Environment and Public Health
Organization) is responsible for data collection in Nepal. ENPHO engineers and staff monitor
the Narayani River monthly at seven locations and the Bagmati River monthly at six locations.
The monitoring sites for the Bagmati River are at Sundarijal, Pashupati, Tilganga, Sundarighat,
Chovar and Gaur, shown in Figure 2.1.
The first Bagmati River sampling location is at Sundarijal, an area upstream of
Kathmandu Valley with low levels of anthropogenic pollution. The Pashupatinath Temple
described in Chapter 1 is in a section of Kathmandu called Pashupati, the second sampling site.
This location along the Bagmati River is heavily used by Hindus, but is also a priority site for
restoration by the Nepali government. Tilganga lies in the heart of Kathmandu and suffers much
human pollution; it is also the site where the effluent from the Guheshwori WWTP mixes with
the River. Sundarighat, the fourth sampling location, is in the southwest part of the Greater
Kathmandu Urban Area, Chovar at the outlet from Kathmandu Valley, and Gaur in the Terai
near the Indian border. Figure 2.2 displays the water quality parameters exceeding WHO (World

Health Organization) guidelines for these sites and lists the suggested uses of the Bagmati River
from each location.
Figure 2.1: SATWQM Sampling Locations along the Bagmati River7
Sundarijal
KATHMANDUPashupati
TilgangaTribuhavenTi__ganga International
AirportBHAKTAPUR
KIRTIPUR PA TAN THIMI /r
Sundarigha None dikn Mawp Legend
... PBagmati River ec Major RoadsGaur Chovar
TnOther Rivers CITY NAME, Site Name
Figure 2.2: General Water Quality and Usage Zones along the Bagmati River 8
Potential Use Based
Sampling Site Parameters exceeding WHO Standards on Pollution LevelSundarijal None drinking water supply
Pashupati COD, P04 recreation, fish breeding
Tilganga COD, NH3, P04 and conductivity industrial use, irrigation
Sundarighat COD, BOD, NH 3, P0 4, NO 3, Cl and conductivity industrial use, irrigation
Chovar COD, BOD, NH 3 no assigned use
The data presented in Section 2.2 of this thesis was collected as part of SATWQM. The
data is intended as public information and will be made available on the Sandia National9Laboratories web site, http://sandia.gov
7 Figure 2.1 is a reproduction of Figure IV-2 from Metcalf & Eddy, 2000.Data for Figure 2.2 compiled using Shakya, 2001 and Upadhyay, 1999.
23

2.2 Monitoring Equipment
In the analysis of the SATWQM samples, ENPHO staff first visited each site to take
measurements using a MiniSonde* 4a Hydrolab® multiprobe. This equipment is capable of
measuring many parameters simultaneously, including the following: water temperature,
dissolved oxygen (DO) concentration, water salinity, pH, specific conductivity and redox
potential at the sampling site. Also, turbidity is measured on location using a turbidity tube. For
the determination of nitrate, ammonia, phosphate, fecal coliform, BOD and COD concentrations,
samples are collected and brought back to ENPHO's lab.
2.3 Data and Analysis
The following section displays eight plots of water quality characteristics of the Bagmati
River, stressing variations between sampling points and throughout the year. The water quality
parameters addressed and discussed below include flow rate, dissolved oxygen (DO)
concentration, pH, total suspended solids (TSS), fecal coliform concentration, biological oxygen
demand (BOD), chemical oxygen demand (COD), and orthophosphate concentration.
Figure 2.3 10 plots flow rate of the Bagmati River for Gokarna, Pashupati and Sundarighat.
The River flow is relatively low during winter (January) and dry season (May) sampling and
peaks during monsoon (July) and post-monsoon (October) sampling. Flow through Gokarna and
Pashupati is very low compared to that at Sundarighat, especially during the monsoon season.
Besides the fact that Sundarighat is the furthest downstream of the three sites, the large flow rate
at Sundarighat can be attributed to the junction of the Bagmati River with the Hanumante River
(see Figures 1.3 and 2.1) upstream from Sundarighat.
24
9 We are grateful to Anjali Manandhar, Juna Shrestha and Nirita Girl at ENPHO for their generosity in sharing thedata for use in this thesis and for allowing the author to accompany them in taking samples.10 Data for Figure 2.3 comes from Metcalf & Eddy, 2000.

Figure 2.310: Flow Rates along the Bagmati River
70 -
60 -
50 -
40 -
30 -
20 -
10
0Apr-99 Jul-99 Oct-99 Jan-00
Date
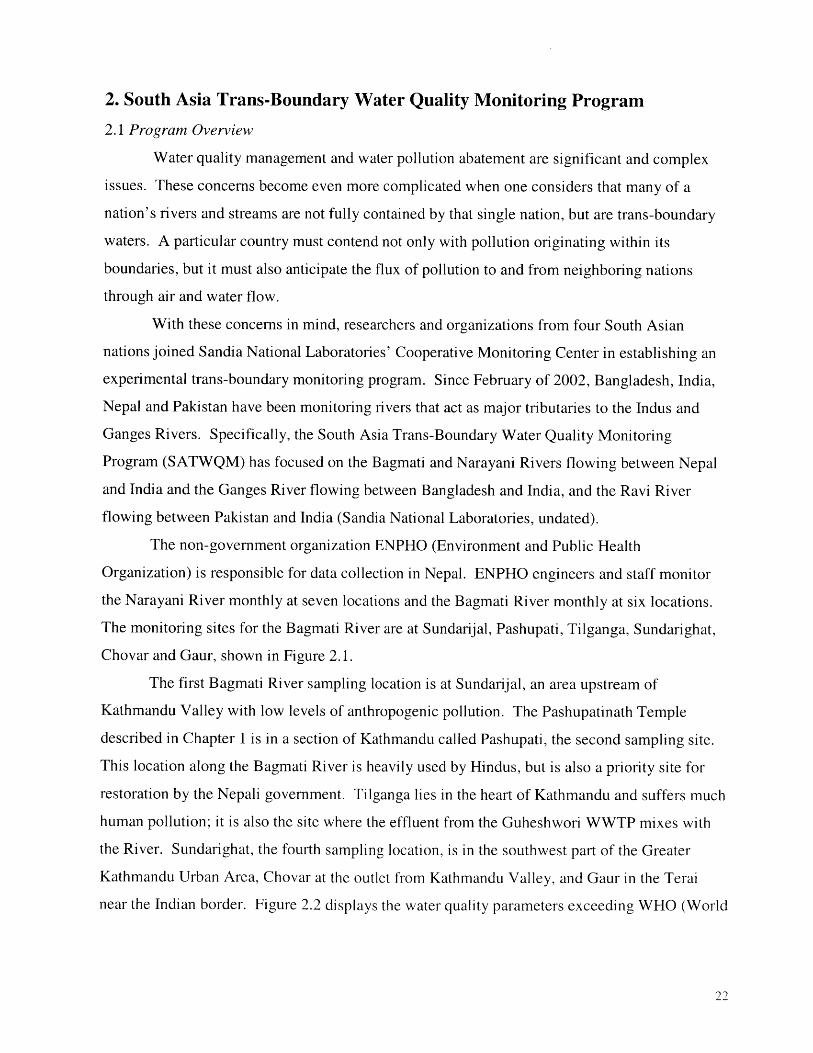
Figure 2.4 below plots dissolved oxygen concentration against sample month for the six
Bagmati River monitoring sites. As expected, the DO levels are highest at Sundarijal where the
water is very clean and pollution levels are low. Dissolved oxygen concentrations decrease as
the River flows through Kathmandu and reach a minimum at Sundarighat. At Chovar, the
dissolved oxygen levels have rebounded to some extent, and the River is almost completely
restored of dissolved oxygen at Gaur. It is also worthwhile to note the large peak in dissolved
oxygen at Sundarighat from July until October. This period is monsoon season in Nepal, so the
large amount of rainfall serves to dilute the effect of the water pollution and contribute oxygen to
anaerobic waters.
25
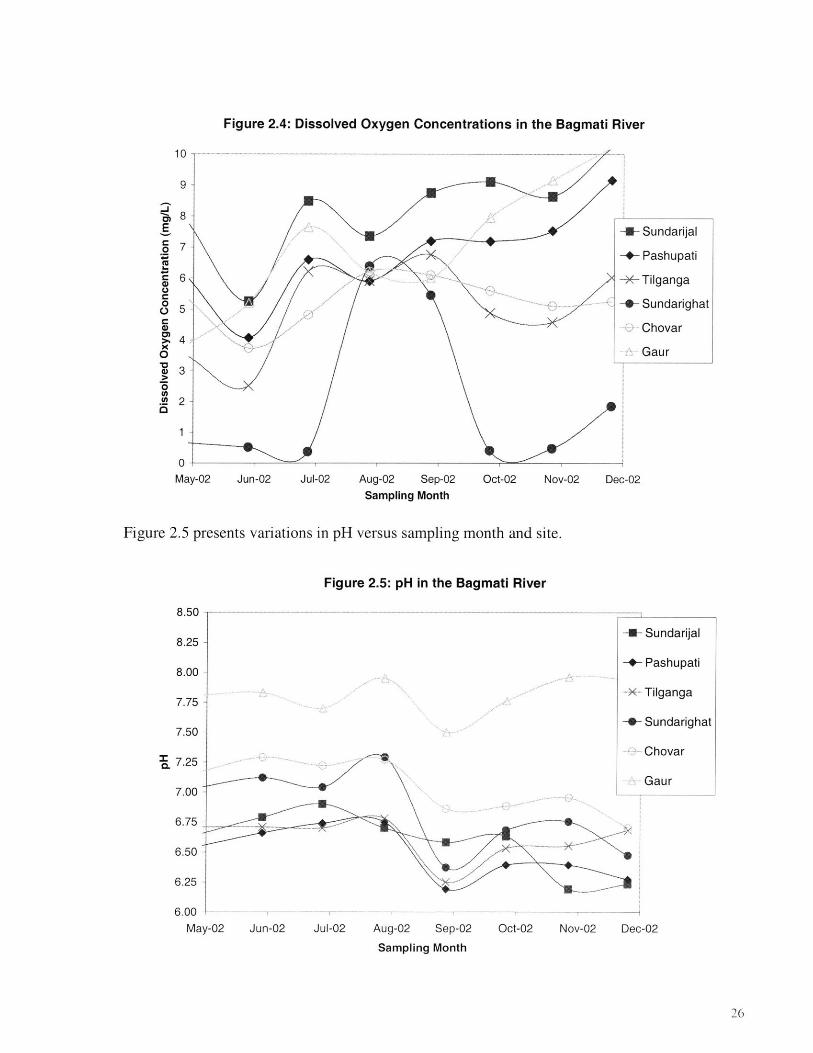
Figure 2.4: Dissolved Oxygen Concentrations in the Bagmati River
-U1- Sundarijal
Pashupati
-X- Tilganga
-- Sundarighat
Chovar
Gaur
Jun-02 Jul-02 Aug-02 Sep-02Sampling Month
Oct-02 Nov-02 Dec-02
Figure 2.5 presents variations in pH versus sampling month and site.
Figure 2.5: pH in the Bagmati River
-4
--
........ +.
Sundarijal
Pashupati
Tilganga
Sundarighat
Chovar
Gaur
Jun-02 Jul-02 Aug-02 Sep-02
Sampling Month
Oct-02 Nov-02 Dec-02
10-
9
8
7-
6S
5-
4]
3
2
0MMay
0
0
0
0A2a)
-02
8.50
8.25
8.00
7.75
7.50
C 7.25
7.00
6.75
6.50
6.25
6.00 1May-02
26
At all sampling sites, the pH is fairly stable between 6.5 and 8 throughout the period of
monitoring. One visible trend is the pH increase in August followed by a decrease in September
for all sampling sites.
Figure 2.6 shows total suspended solids (TSS) concentrations for all the Bagmati
sampling sites except Gaur. TSS values are fairly consistent from one monitoring site to another,
though higher in Chovar than at the other areas. The Bagmati River flows through Chovar
Gorge just upstream of this site, so it is reasonable that the turbulent water flow kicks up
sediment from the river bed.
Figure 2.6: TSS Concentrations in the Bagmati River
600 --- - - -- -_- --_- -_- -- - - - - - - - -- -
+ Sundarijal
500 - + Pashupati
-X Tilganga
400 - -- Sundarighat
0~ Chovar
300-
0
0
Cn 200-
100
May-02 Jun-02 Jul-02 Aug-02 Sep-02 Oct-02 Nov-02 Dec-02Sampling Month
It is interesting to note that Tilganga, Sundarighat and Chovar peak in TSS concentrations
during the month of August, while Sundarijal and Pashupati peak in September. One might
expect the upstream sampling sites, Sundarijal and Pashupati, to experience a disturbance in TSS
levels before the downstream sites, Tilganga, Sundarighat and Chovar. One explanation for this
behavior is that the disturbances causing peak TSS levels in Tilganga, Sundarighat and Chovar
originate after the Pashupati sampling site. Also, the disturbance causing peaks in September for
Sundarijal and Pashupati may have dissipated before reaching Tilganga.
27
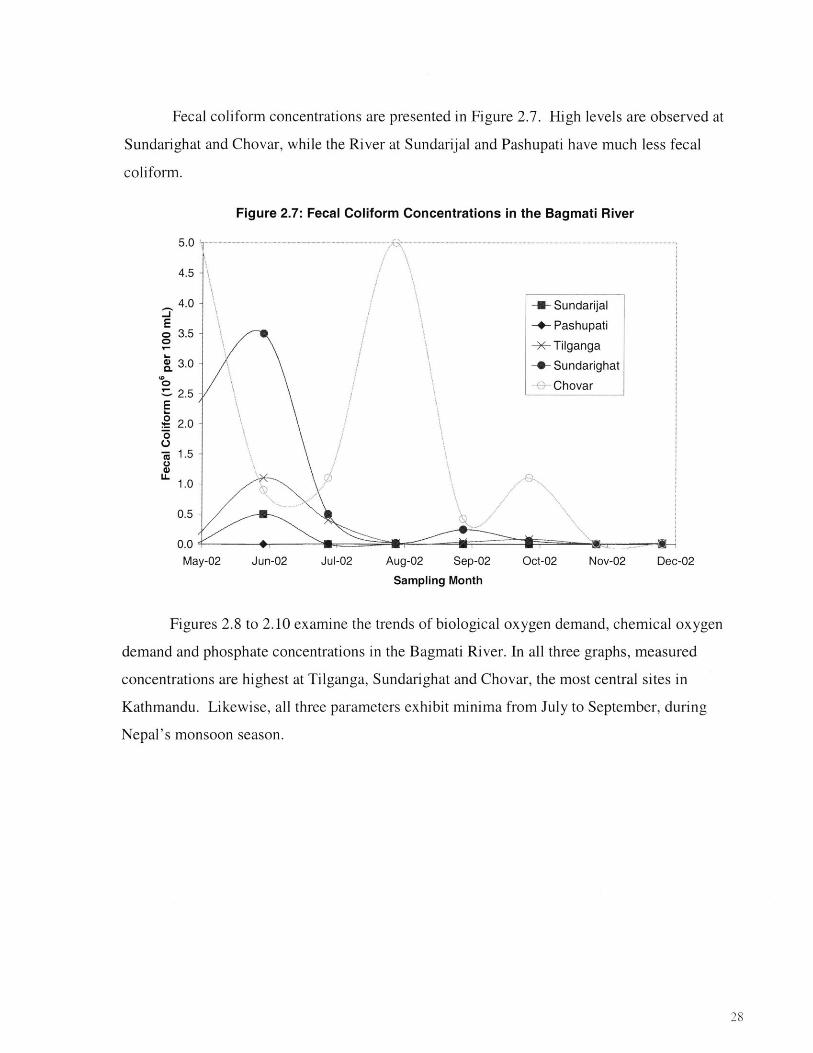
Fecal coliform concentrations are presented in Figure 2.7. High levels are observed at
Sundarighat and Chovar, while the River at Sundarijal and Pashupati have much less fecal
coliform.
Figure 2.7: Fecal Coliform Concentrations in the Bagmati River
5.0 1
EE
0
a)
U.E
0)
4.5 -
4.0 -
3.5 -
3.0 -
2.5 -
2.0 -
1.5 -
1.0 -
0.5
-Su+ Pa
-X- Til
+ Su
Ch
.. ... ..
ndarijal
shupati
ganga
ndarighat
ovar
Jun-02 Jul-02 Aug-02 Sep-02
Sampling Month
Oct-02 Nov-02 Dec-02
Figures 2.8 to 2.10 examine the trends of biological oxygen demand, chemical oxygen
demand and phosphate concentrations in the Bagmati River. In all three graphs, measured
concentrations are highest at Tilganga, Sundarighat and Chovar, the most central sites in
Kathmandu. Likewise, all three parameters exhibit minima from July to September, during
Nepal's monsoon season.
28
U.U r-
May-02
-

Figure 2.8: BOD Concentrations in the Bagmati River
May-02 Jun-02 Jul-02 Aug-02 Sep-02 Oct-02 Nov-02 Dec-02Sampling Month
Figure 2.9: COD Concentrations in the Bagmati River
/
--- - _ -
240
200 -
E 160
0
120-
U0
40
0'
-I- Sundarijal+ PashupatiX- Tilganga
-- Sundarighat
Chovar
300
250
E 200 -
U)
0
.~150-
0
10000
50
0
Sundarijal
Pashupati
Tilganga
Sundarighat
Chovar
Gaur
May-02 Jun-02 Jul-02 Aug-02 Sep-02 Oct-02 Nov-02 Dec-02Sampling Month
29
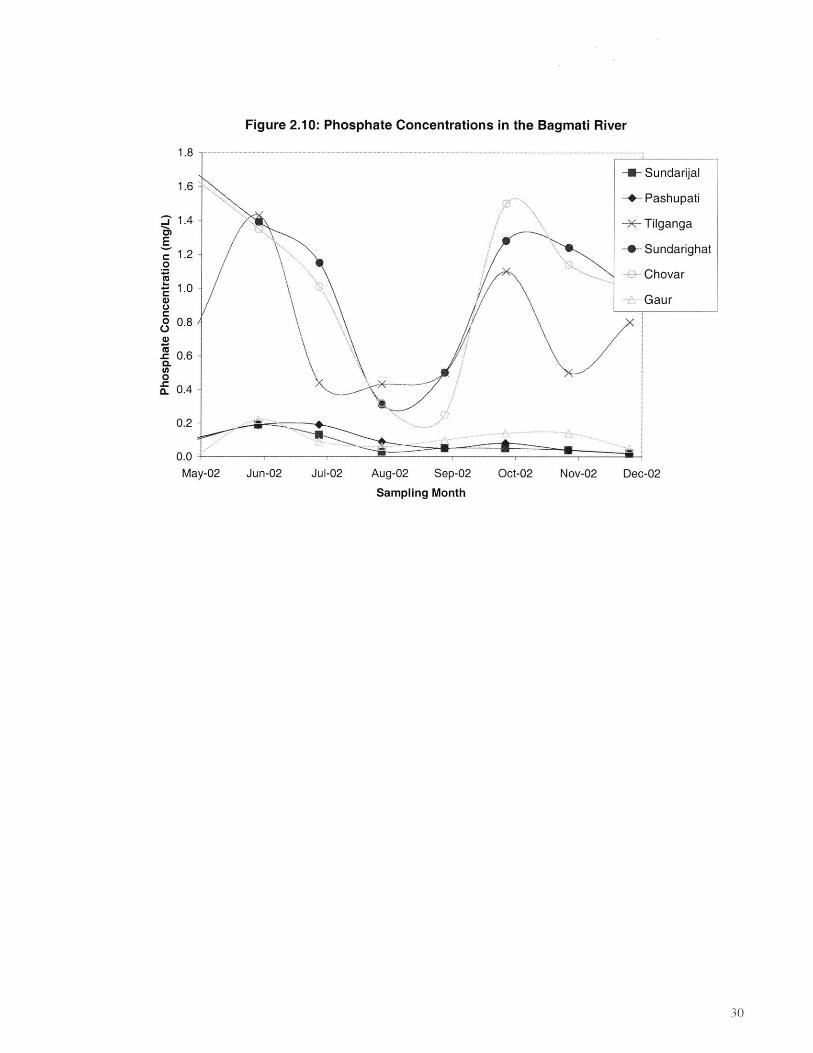
Figure 2.10: Phosphate Concentrations in the Bagmati River
1 .8 -....... .... ...
-U- Sundarijal1.6
-+- Pashupati
1.4 -X- Tilganga
0)~1.2 -4-- Sundarighat
ChovarS1.0-
Gaur
0 0.8/
0.60*
IL 0.60.4
0.0-1May-02 Jun-02 Jul-02 Aug-02 Sep-02 Oct-02 Nov-02 Dec-02
Sampling Month
30
3. Foaming in WWTP's and Surface Water
3.1 Foaming Overview
Foaming is a major operational problem in wastewater treatment, especially in activated
sludge treatment plants. It occurs mostly in aerated units, where oxygen is supplied to the
wastewater to support microbial activity. In activated sludge treatment facilities, two common
mechanisms exist for wastewater aeration: bubbling of air or oxygen through the wastewater and
agitation of wastewater at the air/water interface (Metcalf & Eddy, 2003). Either way, the aim is
to maximize the interfacial area between the wastewater and the oxygen to promote the
dissolution of oxygen into the water.
Microorganisms and certain molecules with hydrophobic properties can attach bubbles of
air at an air/water interface. If enough such microbes and molecules fasten to a single bubble,
they can form a net around the bubble to stabilize it at the air/water interface. The stable bubbles
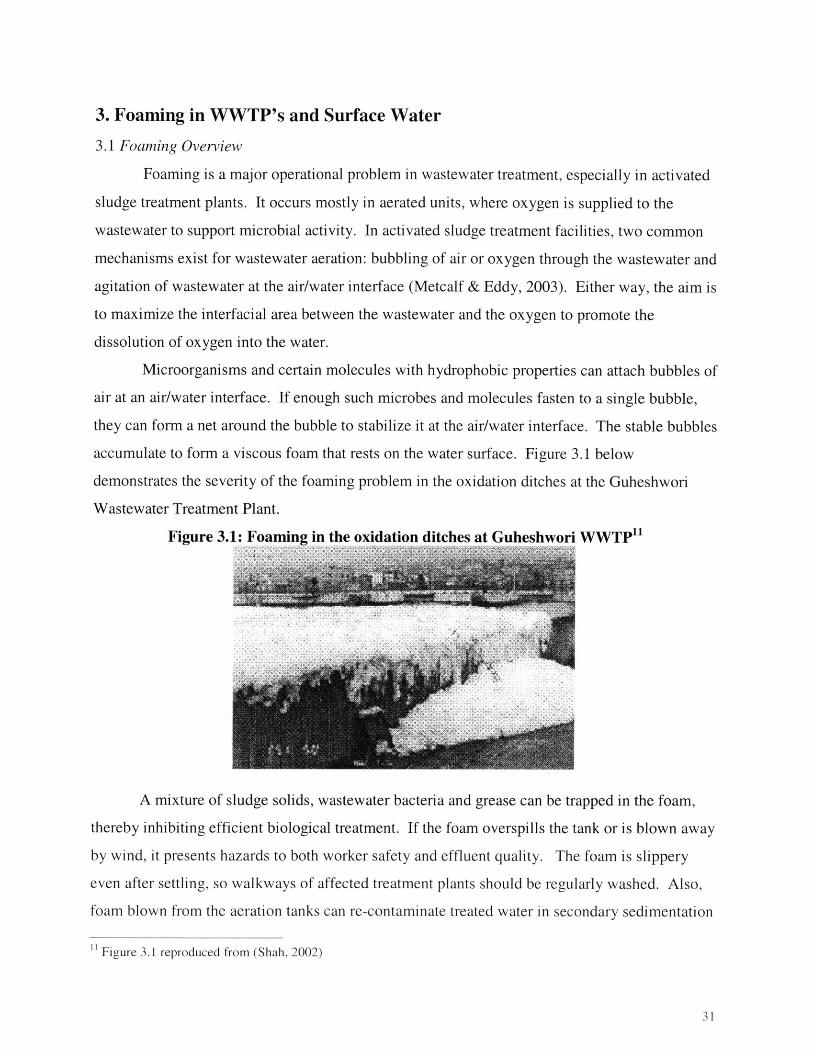
accumulate to form a viscous foam that rests on the water surface. Figure 3.1 below
demonstrates the severity of the foaming problem in the oxidation ditches at the Guheshwori
Wastewater Treatment Plant.
Figure 3.1: Foaming in the oxidation ditches at Guheshwori WWTP"
A mixture of sludge solids, wastewater bacteria and grease can be trapped in the foam,
thereby inhibiting efficient biological treatment. If the foam overspills the tank or is blown away
by wind, it presents hazards to both worker safety and effluent quality. The foam is slippery
even after settling, so walkways of affected treatment plants should be regularly washed. Also,
foam blown from the aeration tanks can re-contaminate treated water in secondary sedimentation
I Figure 3.1 reproduced from (Shah, 2002)
31
tanks. In addition to extra maintenance, effluent quality and the spread of pathogens, foaming is
connected with reduction in oxygen transfer (Metcalf & Eddy, 2003).
The microorganisms and molecules responsible for foaming in wastewater plants are
often not removed in activated sludge treatment. In this case, the lakes and rivers acting as
receiving waters for treated wastewater can experience foaming similar to that in treatment
facilities. The foaming is especially noticeable in receiving waters in areas of turbulent flow,
where the water is well mixed with air.
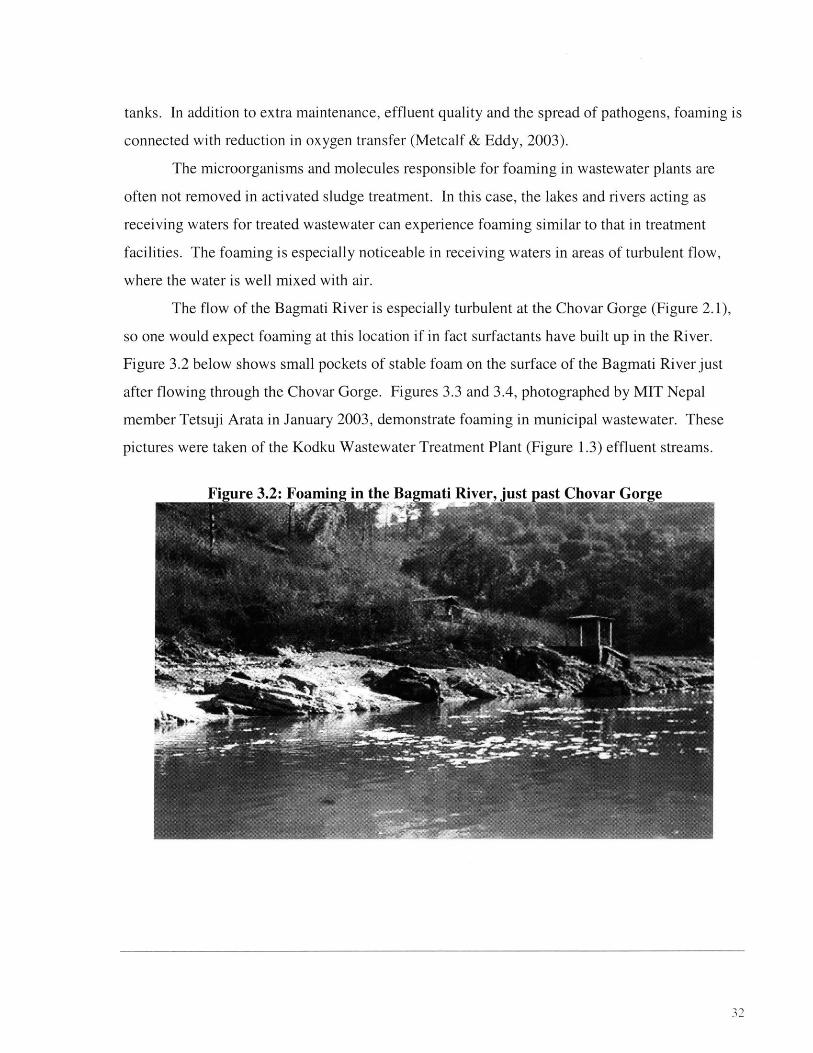
The flow of the Bagmati River is especially turbulent at the Chovar Gorge (Figure 2.1),
so one would expect foaming at this location if in fact surfactants have built up in the River.
Figure 3.2 below shows small pockets of stable foam on the surface of the Bagmati River just
after flowing through the Chovar Gorge. Figures 3.3 and 3.4, photographed by MIT Nepal
member Tetsuji Arata in January 2003, demonstrate foaming in municipal wastewater. These
pictures were taken of the Kodku Wastewater Treatment Plant (Figure 1.3) effluent streams.
mati River. iust nast Chovar Gor
32
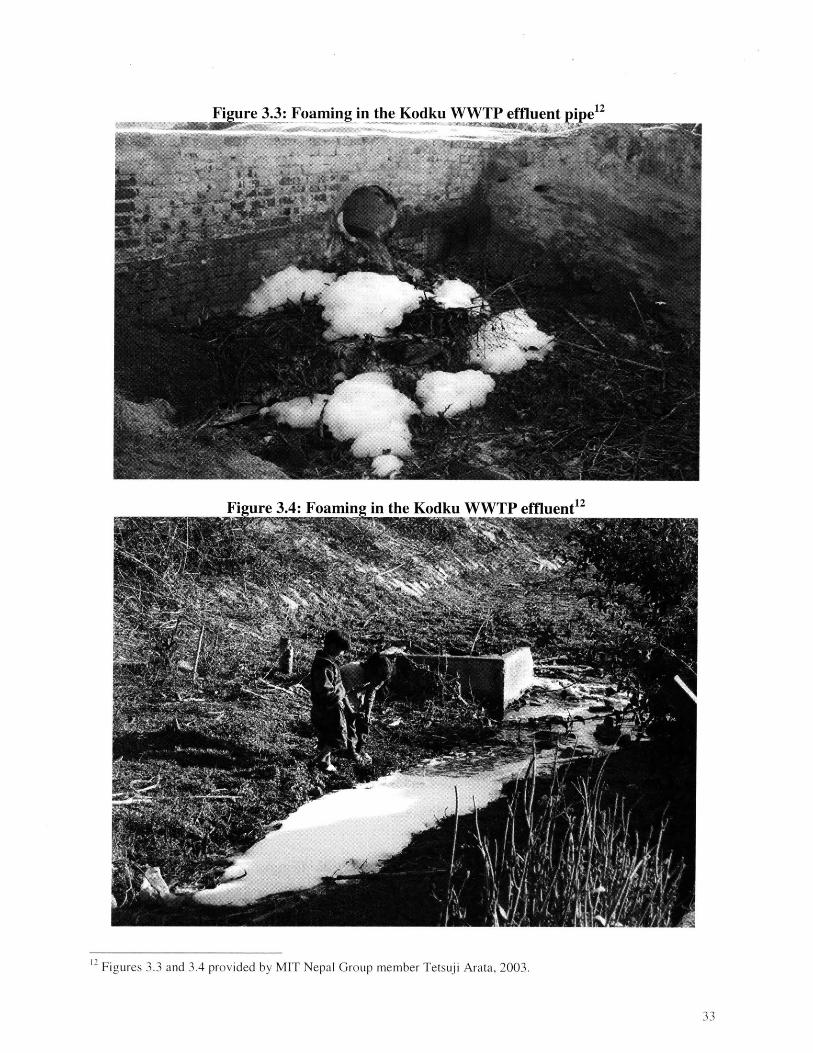
-e 3.3: Foaming in the Kodku WWTP effluent pipe12
in the Kodku WWTP effluent 12
2 Figures 3.3 and 3.4 provided by MIT Nepal Group member Tetsuji Arata, 2003.
33

3.2 Causes of Foaming - Filamentous Bacteria
As mentioned above, the phenomena of foaming occurs when microorganisms and
molecules with hydrophobic end groups trap air bubbles and prevent them from fully escaping
the water. The microorganisms most commonly responsible for this behavior include two types
of filamentous bacteria: Microthrix parvicella and Gordona amarae-like organisms (GALO,
formerly classified as Nocardia) (Khanal, 2002). These bacteria are especially active in
conditions of high oil and grease concentrations, low F/M (food to microorganism) ratio or long
sludge age.
Microthrix parvicella are long, unbranched filamentous bacteria. Filaments of M.
parvicella can grow to as long as 400 tm long. They have been described as "irregularly curved,
appearing like spaghetti" (Santa Cruz Productions, 2000). When present in an activated sludge
process, M. parvicella is often found outside the floc tangled with other structures. These
microorganisms are non-pathogenic and most prevalent in foams throughout Europe, Australia
and South Africa (Santa Cruz Productions, 2000).
GALO are shorter filaments than M. parvicella (at 10-20 Vtm) that branch at
approximately right angles. Accounts describe the appearance of these organisms as "tumble
weeds." (Santa Cruz Productions, 2000). Like M. parvicella, GALO are also non-pathogenic
(Soddell, 1998).
3.3 Causes of Foaming - Surfactants
Foaming can be troublesome in wastewater treatment plants even when GALO and
Microthrixparvicella growth is controlled. Municipal and industrial wastewaters usually contain
synthetic detergents and cleansers - products containing chemicals specifically designed to foam.
Detergents in wastewaters come from residences in the form of household detergents, from
agricultural runoff in the form of herbicides and insecticides and from certain industries,
including textiles, leather dying and finishing, and detergent and carpet manufacture ("The
Pollution of Water by Detergents", 1964).
The detergent additives especially active in wastewater treatment plants are known as
surface active agents, or surfactants. In particular, the highly branched anionic surfactant
alkylbenzene sulfonate (ABS) foams at concentrations above 0.5 mg/L in wastewater. The
branching of ABS makes it resistant to biological degradation and accounts for foaming in
34
wastewater treatment plants and surface waters (Richard, 2003). Chapter 4 (page 32) examines
ABS in greater detail and discusses measures taken by the United States and by other selected
nations to minimize the foaming effect of surfactants.
3.3.1 Surfactant Chemistry
The word "detergent" is sometimes used to refer specifically to synthetic detergents, but
in this thesis, "detergent" applies to any substance with cleaning abilities. Soaps are natural
detergents, then, and man-made agents like laundry powders and dish-washing liquids are
synthetic detergents.
Surfactants are organic chemicals added to synthetic detergents to decrease the surface
tension of water. A successful surfactant contains at least one hydrophilic end (water-loving)
and at least one hydrophobic end (water-hating). The free energy state of a
surfactant/water/soiled clothing system is minimized when the surfactants exist at the interface of
the organic material (oil, grease, dirt to be washed away) and the water. In this configuration,
the hydrophilic remains in close contact with water molecules while the hydrophobic end avoids
contact with water. In the same way, the free energy of a surfactant/water/air mixture is
optimized when the hydrophilic part of the surfactant is in the water phase and the hydrophobic
end is not in the water phase. This property allows surfactants to hold bubbles of air at the water
surface.
Mechanical agitation loosens the hold between the dirt and the article being washed, and
the arrangement of surfactant around the clumps of organic material prevents redeposition (Koch,
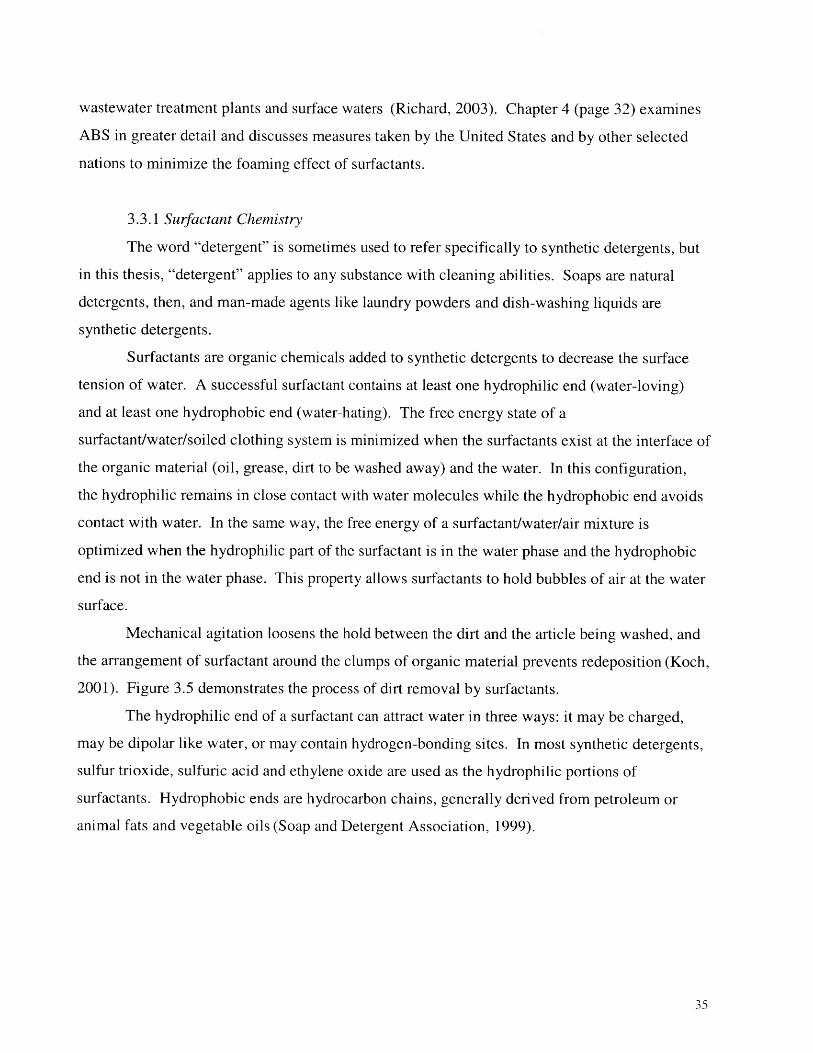
2001). Figure 3.5 demonstrates the process of dirt removal by surfactants.
The hydrophilic end of a surfactant can attract water in three ways: it may be charged,
may be dipolar like water, or may contain hydrogen-bonding sites. In most synthetic detergents,
sulfur trioxide, sulfuric acid and ethylene oxide are used as the hydrophilic portions of
surfactants. Hydrophobic ends are hydrocarbon chains, generally derived from petroleum or
animal fats and vegetable oils (Soap and Detergent Association, 1999).
35
Figure 3.5: Process of Dirt Removal by Surfactants
Surfactant Molecule water
hydrophobi
hydrophilic a Z%
dirt
Surfactants are classified as anionic, nonionic, cationic or amphoteric by their ionic
activity in water. Anionic surfactants carry a negative charge in aqueous solutions, giving them
excellent cleaning properties and high foaming capabilities. These are most commonly used in
synthetic laundry and hand dishwashing detergents, also in household cleaners.
Nonionic surfactants are used as rinse aids in synthetic laundry detergents, and cationic
surfactants exist in fabric softeners and as disinfecting agents in some household cleaners.
Amphoteric surfactants can behave as anionic, nonionic or cationic surfactants in water,
depending on the pH of the solution. They are used as household cleaning items (Soap and
Detergent Association, 1999).
3.4 Foaming Control Mechanisms
3.4.1 Regulation of Fats, Oils and Grease (FOG's)
The filaments of GALO and Microthrix parvicella grow on oil and grease in the
wastewater. Typical FOG concentrations range from 50 mg/L in low strength wastewaters to
100 mg/L in high strength wastewaters (Metcalf & Eddy, 2003). Communities that enforce
grease and oil limitations or industries with low grease and oil waste content, then, experience
less filamentous foaming than those without such regulations. Primary settling tanks remove
grease and oil early in the treatment process, so treatment facilities without these units suffer
greater filamentous foaming problems than those with (Richard, 2003). A variation in FOG
concentration does not affect surfactant foaming.
As mentioned in Chapter 1, the Guheshwon Wastewater Treatment Plant lacks a primary
setting tank. Primary clarifiers become less economical as wastewater plants get smaller, so this
is not unusual in smaller treatment facilities, especially those utilizing oxidation ditches. A
36
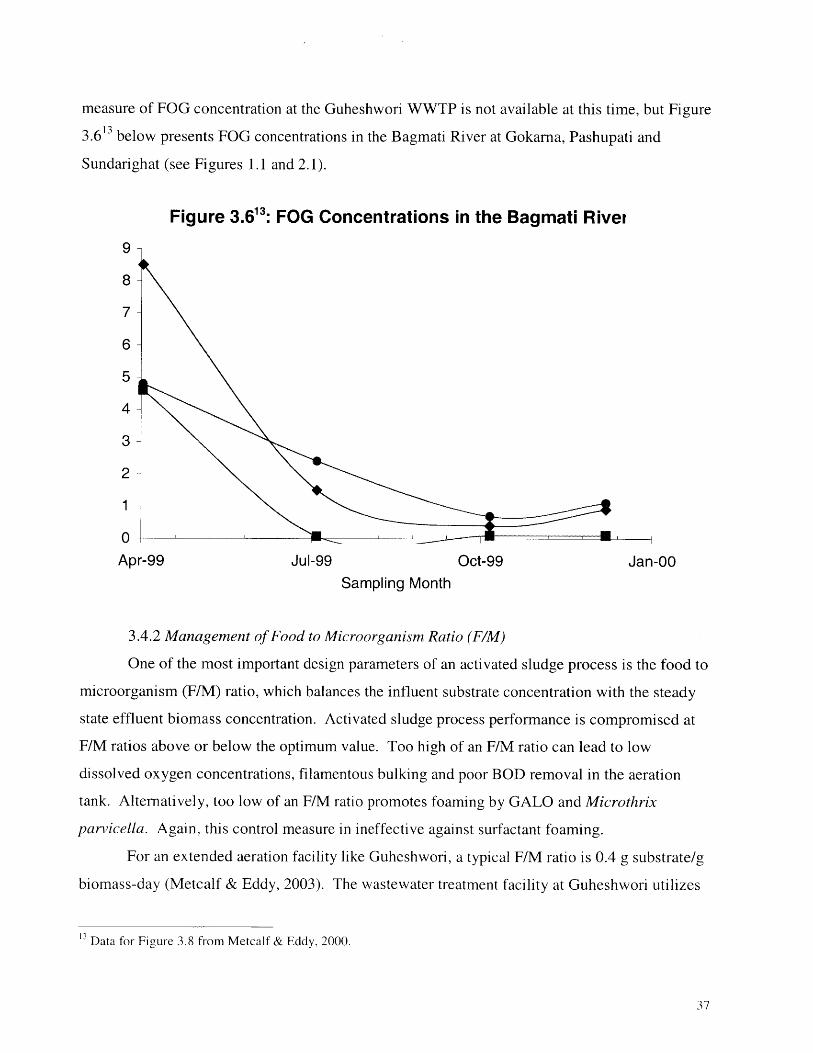
measure of FOG concentration at the Guheshwori WWTP is not available at this time, but Figure
3.6 below presents FOG concentrations in the Bagmati River at Gokarna, Pashupati and
Sundarighat (see Figures 1.1 and 2.1).
Figure 3.6:13 FOG Concentrations in the Bagmati River
9-
8 -
7 -
6 -
5
4
3 -
2
1 -
0Apr-99 Jul-99 Oct-99 Jan-00
Sampling Month
3.4.2 Management of Food to Microorganism Ratio (F/M)
One of the most important design parameters of an activated sludge process is the food to
microorganism (F/M) ratio, which balances the influent substrate concentration with the steady
state effluent biomass concentration. Activated sludge process performance is compromised at
F/M ratios above or below the optimum value. Too high of an F/M ratio can lead to low
dissolved oxygen concentrations, filamentous bulking and poor BOD removal in the aeration
tank. Alternatively, too low of an F/M ratio promotes foaming by GALO and Microthrix
parvicella. Again, this control measure in ineffective against surfactant foaming.
For an extended aeration facility like Guheshwori, a typical F/M ratio is 0.4 g substrate/g
biomass-day (Metcalf & Eddy, 2003). The wastewater treatment facility at Guheshwori utilizes
13 Data for Figure 3.8 from Metcalf & Eddy, 2000.
37
extended aeration, and reported F/M ratios at Guheshwori are 0.41 g substrate/ g biomass-day for
the period from February to April 2002 and 0.27 g substrate/ g biomass-day for the period from
May to June 2002 (Shah, 2002).
3.4.3 Adjustment of Mean Cell Residence Time (MCRT)
Filamentous foaming is commonly controlled by lowering the mean cell residence time
(MCRT) of the affected tank. MCRT or sludge age is a ratio of biomass in the reactor to the rate
of biomass leaving the reactor. The mean cell residence time is manipulated by varying the flow
rate of wastewater into and out of biological treatment unit. Typical MCRT values for activated
sludge treatment plants are 5 to 15 days for conventional treatment and 20 to 30 days for
extended aeration treatment (Metcalf & Eddy, 2003).
When the mean cell residence time is reduced, problematic microorganisms like GALO
and Microthrix parvicella can be washed out of the affected tank, depending on the growth rate
of the particular organism. GALO's have a wide range of growth rates, so elimination by
washout is difficult (Soddell, 1998). GALO is controlled in cold and moderate climates by
MCRT reduction to less than 8 days, and by a reduction to less than 3 days in warmer climates
(Barber, 1995). M. parvicella grow slowly, so decreasing sludge age is usually effective in
removing the organisms (Soddell, 1998). To control Microthrixparvicella foaming, the New
York State Department of Environmental Conservation suggests reducing a plant's MCRT to
between 8 and 10 days (Barber, 1995). Reduction of sludge age is ineffective in eliminating
surfactant foaming.
3.4.4 Chemical Additives
Antifoaming chemicals are not effective against GALO or M. parvicella, because the
filaments of both bacteria physically interlock to form the foam. RAS chlorination is useful
against Microthrix parvicella, but less so against GALO. This is because GALO are found
within flocs, so chlorine doses high enough to reach the bacteria destroy the activated sludge floc
in the process (Richard, 2003).
38

3.4.5 Mechanical Removal
The most effective means of eliminating foam caused by surfactants is to spray the foam
with water. Drops of water act to dissipate the bubbles, especially when the spray hits the water
surface at an angle of less than 45 degrees (Prat, 1964). In this case, "the foam is thus sliced at
its base" (Prat, 1964). To reduce manual labor, small turbines can be used to spray water at the2foam at a pressure of 5 to 6 kg/cm (15 to 18 psi) (Prat, 1964). In addition to physically
liberating the air bubble from the hold of surfactants, the addition of water assists by diluting the
concentration of surfactants in the wastewater. Dilution to below the foaming threshold, which
is largely dependant on the water composition and quality characteristics, eliminates the foaming
problem.
39
4. History and Regulations of Surfactants in Synthetic Detergents
4.1 History of Synthetic Detergents
Animal and vegetable fats and oils were in short supply during the First World War, so
the soap industry found itself in competition with the food and feed industries for the limited
resources. Fat and oil prices rose so highly that soap making became uneconomical. Due to this
struggle and natural soap's poor cleaning ability in hard waters, German scientists and engineers
began experimenting with synthetic detergents. The products they developed, short-chain
alkylnaphthalene sulfonates, were successful surfactants but second-rate detergents.
The petroleum industry was rapidly developing in the 1930s, and refinery waste products
were generally disposed of by combustion. It was discovered, however, that propylene, a
kerosene fraction, could be converted to a long chain 2-alkene, which then could be reacted with
benzene and sulfuric acid. The product of this was neutralized with sodium hydroxide to form
alkylbenzene sulfonate or ABS, which quickly became the favorite surfactant in synthetic
laundry detergents (Kevlam, undated).
In the years following the Second World War, carboxymethylcellulose (CMC) was added
to synthetic detergents to reduce the redeposition of dirt, and orthophosphates were added to
respond to calcium and magnesium cations in hard water. With these additions, the "detergent
industry established itself and has never looked back." In the thirty years following the Second
World War, soap sales in the United States decreased by a factor of two, and synthetic detergent
sales increased a thousand-fold ("Detergent Chemistry - History", undated).
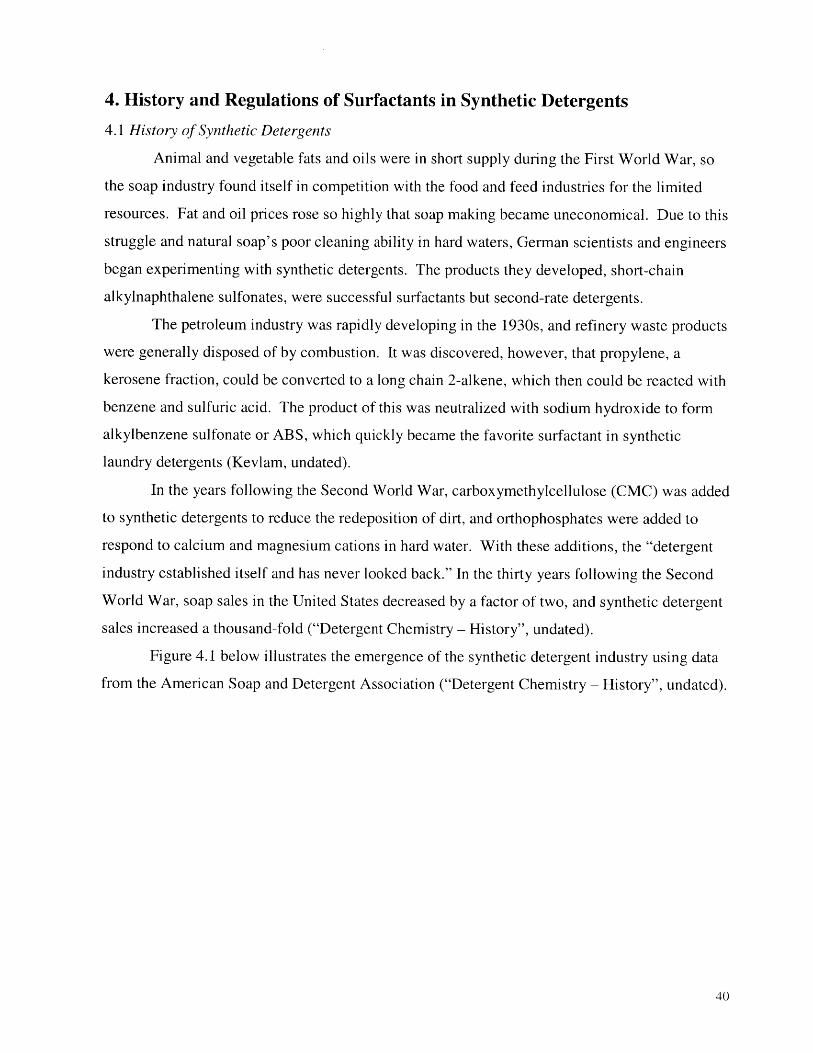
Figure 4.1 below illustrates the emergence of the synthetic detergent industry using data
from the American Soap and Detergent Association ("Detergent Chemistry - History", undated).
40

Figure 4.1: Soap and Synthetic Detergent Sales in the US1940 to 1972
4000 -Synthetic Detergent Sales
3500-U)C 300000 2500-0
2000
1500
1000
5000 Soap Sales
1940 1945 1950 1955 1960 1965 1970 1975
Year
4.2 Regulations Concerning Alkylbenzene Sulfonate
In the early 1950s, natural surface waters all over America and Europe were beginning to
foam. In fact, "wherever water tumbled over stones or waterfalls, wherever winds rippled the
surface, accumulations of bubbly froth were building up" (ReVelle, 1988). This is believable, as
nearly 1 billion kg/yr (2.2 billion lbs/yr) of detergents were being used to wash clothes in the
United States by the mid-1950s, and ABS was the major surfactant used in synthetic laundry
detergent manufacture. Moreover, extensive testing showed that ABS's highly branched
structure rendered it almost completely resistant to biological degradation, so only small amounts
of the surfactant were removed in typical wastewater treatment facilities. Thirty-two American
cities were monitored in 1959 for ABS, and "surface water-generated potable waters" averaged
between 15 and 34 ptg/L (Eichhorn, 2001).
Legal restrictions were quick to follow, led by the German Detergent Act of 1962
mandating primary degradation of anionic surfactants. Primary degradation refers to a loss of
surfactant properties. In the United States, ABS was voluntarily banned by industry (Eichhorn,
2001). The United Kingdom also responded with a voluntary industrial initiative and passed
legal requirements for biodegradability and laboratory test methods in 1973.
41
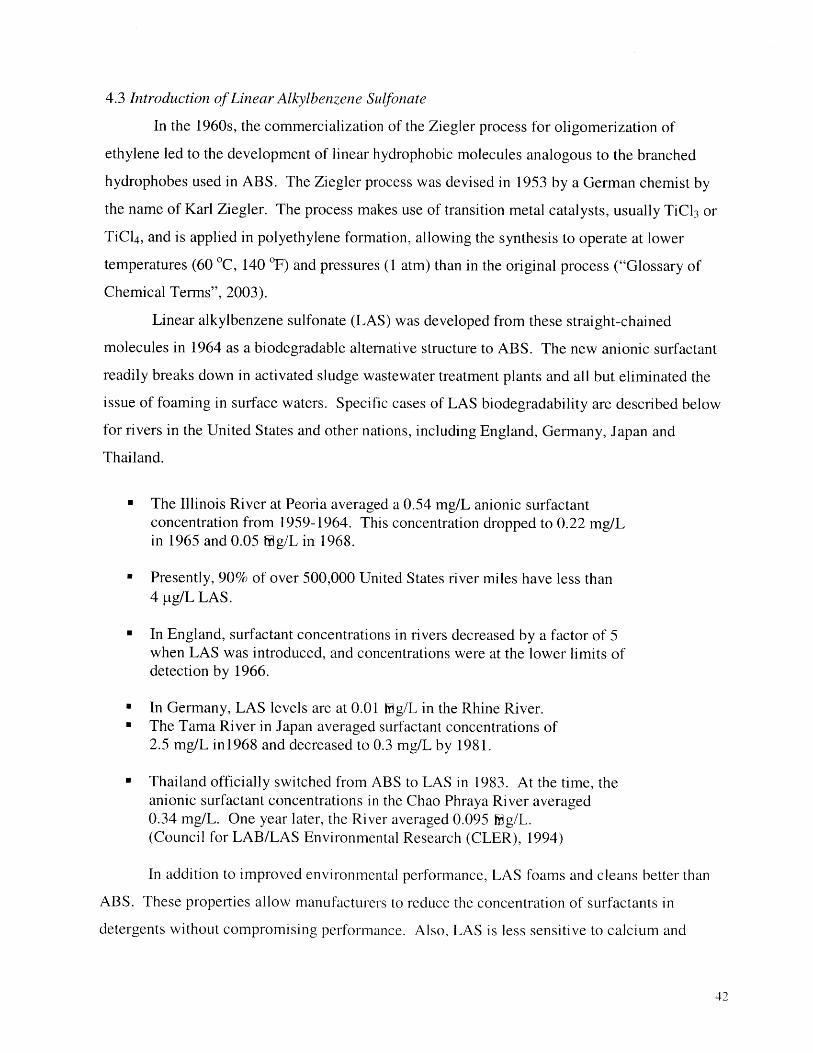
4.3 Introduction of Linear Alkylbenzene Sulfonate
In the 1960s, the commercialization of the Ziegler process for oligomerization of
ethylene led to the development of linear hydrophobic molecules analogous to the branched
hydrophobes used in ABS. The Ziegler process was devised in 1953 by a German chemist by
the name of Karl Ziegler. The process makes use of transition metal catalysts, usually TiCl3 or
TiCl4 , and is applied in polyethylene formation, allowing the synthesis to operate at lower
temperatures (60 0C, 140 F) and pressures (1 atm) than in the original process ("Glossary of
Chemical Terms", 2003).
Linear alkylbenzene sulfonate (LAS) was developed from these straight-chained
molecules in 1964 as a biodegradable alternative structure to ABS. The new anionic surfactant
readily breaks down in activated sludge wastewater treatment plants and all but eliminated the
issue of foaming in surface waters. Specific cases of LAS biodegradability are described below
for rivers in the United States and other nations, including England, Germany, Japan and
Thailand.
" The Illinois River at Peoria averaged a 0.54 mg/L anionic surfactantconcentration from 1959-1964. This concentration dropped to 0.22 mg/Lin 1965 and 0.05 iyg/L in 1968.
- Presently, 90% of over 500,000 United States river miles have less than4 ptg/L LAS.
- In England, surfactant concentrations in rivers decreased by a factor of 5when LAS was introduced, and concentrations were at the lower limits ofdetection by 1966.
" In Germany, LAS levels are at 0.01 Mg/L in the Rhine River.- The Tama River in Japan averaged surfactant concentrations of
2.5 mg/L in 1968 and decreased to 0.3 mg/L by 1981.
- Thailand officially switched from ABS to LAS in 1983. At the time, theanionic surfactant concentrations in the Chao Phraya River averaged0.34 mg/L. One year later, the River averaged 0.095 Mg/L.(Council for LAB/LAS Environmental Research (CLER), 1994)
In addition to improved environmental performance, LAS foams and cleans better than
ABS. These properties allow manufacturers to reduce the concentration of surfactants in
detergents without compromising performance. Also, LAS is less sensitive to calcium and
42

magnesium ions than ABS, permitting reduced levels of phosphate-based builders in detergents
(phosphate use discussed in Chapter 5). One important advantage of ABS is that raw materials
for its production are less expensive than those for LAS. For this reason, branched alkylbenzene
sulfonate is still used extensively in developing countries despite the enhanced performance of
LAS (Eichhorn, 2001).
4.4 Current Controversy Surrounding Linear Alkylbenzene Sulfonate
4.4.1 Biodegradability In Anoxic and Anaerobic Conditions
Under aerobic conditions, LAS is readily biodegradable. In fact, a 1995 study
determined the removal of LAS by municipal wastewater treatment plants in England to be
99.9%. Similar monitoring tests in Germany, Spain and the Netherlands demonstrated an
average of 99.2% LAS removal. In developing nations like Nepal, clothes are regularly washed
right in the local surface waters. In addition, untreated wastewater frequently finds its way to
nearby surface waters. As a result, the receiving waters can have low dissolved oxygen
concentrations (see SATWQM Data in Chapter 2), and aquatic activity is anoxic or anaerobic.
Under anoxic conditions, LAS biodegrades very slowly; the surfactant is stable in anaerobic
situations (Folke, 1999). In such cases, LAS can build up in receiving waters and cause foaming
just as ABS does. If oxygen is reintroduced into anoxic waters, however, LAS biodegradation
will resume.
4.4.2 Adsorption to Sediments
The partitioning of LAS among environmental media can be calculated by equating the
fugacities at steady state. As a result, 97.5% of LAS is found to be distributed in water, 2% in
sediments, suspended solids and biota, and small amounts in the soil and air (Folke, 1999). So
while most of the LAS remains in the aqueous phase, the same surfactant properties that make it
effective in grease and dirt removal cause LAS to build up on sediments and in aquatic
organisms. Further, sorption of LAS onto solid particles is an irreversible process (Petrovic,
2002). In sewage treatment plants, considerable amounts of LAS adsorb onto wastewater solids
and are removed in primary clarification. In activated sludge and other aerobic processes, the
adsorbed LAS and aqueous LAS are both degraded by microorganisms. LAS content in these
sludges is low, but sludge from anaerobic processes can contain as much as 10 g/kg LAS
43

(Petrovic, 2002). Anaerobic sludge with high levels of LAS can be rendered unsuitable for soil
improvement and fertilization and must ultimately be incinerated or sent to a landfill. In areas
with inadequate wastewater treatment, the sediments of receiving waters can accumulate high
levels of LAS.
4.4.3 LAS and Byproduct Toxicity
The primary degradation intermediates of LAS are sulfophenylcarboxylic acids (SPC).
SPC's are more polar than LAS and do not retain their surfactant properties, so they do not sorb
as readily to sediments as LAS do (Gonzalez-Mazo, 2002). Neither LAS nor SPC are toxic to
humans, but they affect aquatic organisms at concentrations above 10 tg/L (Barber, 1995).
4.5 LAS Regulations in Europe
In Denmark, LAS has been named an "unwanted substance" and limitations have been
placed on LAS content in sludge. As of July of 2000, sludges intended for agricultural use could
not exceed LAS concentrations of 1.3 g/kg dry sludge. Almost no anaerobic sewage sludge
satisfies these limits, so incineration and landfilling are the major alternatives. This limitation is
somewhat controversial, because it seems to contradict objectives adopted both by the EU and
Denmark, especially for the sustainable management of waste. This legislation calls for the
reuse of organic wastes like sewage sludge. Other quality criteria established in Denmark are 1.5
g LAS/kg soil for the protection of human health, 5 mg LAS/kg soil for the protection of aquatic
organisms and 0.1 mg/L water (measured as sulfate) as drinking water limits (Folke, 1999).
The "Swan Eco-Label" is an environmental product label established by the
Scandinavian organization Nordic Swan. One requirement of the label is that approved products
be anaerobically as well as aerobically biodegradable, so detergents containing LAS are not
endorsed by the organization.
The strongest competitor for LAS in the world market today is the anionic surfactant
methyl ester sulfonate (MES), developed from palm oils, coconut oils and tallow. The
alternative surfactant has better degradation properties than LAS has, though historically MES is
more expensive. Synthetic detergent manufacturers have recently begun adding MES to the total
surfactant concentration or replacing fractions of LAS with MES. In addition to environmental
incentives, studies demonstrate that LAS/MES blends perform better in terms of detergency than
44
either surfactant alone. Other popular anionic surfactants include alcohol ether sulfates, alcohol
sulfates and alpha-olefin sulfonates (Graff, 2003).
45

5. Phosphates in Synthetic Detergents and Eutrophication
5.1 Role of Phosphates in Synthetic Detergents
As mentioned in Chapter 3, surfactants or surface active agents are chemicals added to
synthetic detergents to enhance the washing capability of water. Surfactants decrease the surface
tension of water and are responsible for the suds that help remove grease and oil from the items
being washed. When synthetic detergents are used in hard water, calcium and magnesium ions
form strong and insoluble complexes with surfactants and precipitate out of solution (Folke,
1999). This reaction is undesired, because it compromises the cleaning ability of the detergent
and forms a solid scum on the items being washed. To counter these effects of washing in hard
waters, synthetic detergent manufacturers can either increase surfactant concentrations in
detergents or add a constituent called a builder, with which calcium and magnesium ions
preferentially react.
Surfactants are often the most expensive and sometimes the most toxic chemicals in
detergents, so builders were developed as a means of dampening the effects of hard water ions
without raising the product's price or threatening the user's health. Builders accomplish this task
using one of several different mechanisms. Common reaction mechanisms between a builder
and calcium and magnesium ions include sequestration, precipitation and ion exchange.
Sequestration is the formation of stable, soluble complexes with metal ions. In this way,
calcium and magnesium ions remain in the aqueous solution, but they pose no threat to
surfactants. Common sequestration builders include sodium tripolyphosphates and sodium
citrates (Soap and Detergent Association, 1999).
Precipitating agents work by forming insoluble salts with the unwanted metal cations.
This mechanism differs from sequestration in that the hard water ions are completely removed
from the wash solution. Examples include sodium carbonate and sodium silicate (Soap and
Detergent Association, 1999).
In the ion exchange process, an exchange occurs between cations in solution and cationic
species attached to the builder. For example, a builder of the form NaX can react with Ca 2+ in
solution to form CaX2 and 2Na+. The calcium and magnesium remain in solution, but no longer
in cationic form. The zeolite builder sodium aluminosilicate is a popular ion exchange builder
(Soap and Detergent Association, 1999).
46
Sodium tripolyphosphate (Na5 P30 10), traditionally the builder of choice, works by
sequestration. In addition to its water softening properties, sodium tripolyphosphates have good
buffering properties and a low toxicity. STPP is broken down easily into biologically available
phosphates, and typical secondary wastewater treatment plants remove only a small percentage
of phosphates from the water. With that level of treatment, much of the phosphates eventually
end up in rivers and lakes and contribute to eutrophication.
5.2 Eutrophication
Eutrophication is a natural process in which surface waters are enriched with nutrients
vital to the growth of plants and animals. The oversupply of these nutrients favors certain
organisms over others, so while it increases biological activity of a lake or river, it tends also to
decrease biodiversity. Opportunistic species like algae take advantage of the favorable
conditions by rapidly reproducing. As a result, these organisms and their predators can overrun
the rest of the lake population.
Algal blooms can have several negative effects on a body of water. Surface waters
overpopulated with algae are aesthetically unpleasant and can be scummy or a cloudy green
color. Also, decaying algae that has been washed or blown onto shore can cause foul odors.
Algal blooms spread on the water surface to capture sunlight and photosynthesize, preventing
light from reaching underwater photosynthesizing plants. These plants serve as food and shelter
for various other aquatic organisms, so the damage is widespread throughout the lake or river
ecosystem. When the algae complete their short life span, the organic matter accumulates and is
eventually decomposed by bacteria. This process is aerobic and depletes a surface water's
dissolved oxygen levels. Organisms sensitive to oxygen concentrations cannot survive in the
anoxic conditions, so the presence and decay of algal blooms can severely diminish the diversity
and number of lake organisms.
5.2.1 Causes of Eutrophication
Carbon, hydrogen, oxygen, nitrogen as nitrates and phosphorus as phosphates are among
the nutrients essential to plant growth (ReVelle, 1988). Carbon, hydrogen and oxygen are
abundant in natural waters containing organic matter, so the nutrients capable of controlling plant
and algae growth are nitrates and phosphates. In most freshwater systems, phosphates limit the
47

rate of algal growth, even though algae cells are less than 1% phosphorus (Knud-Hansen, 1994).
In fact, 1 kg (0.45 lb) of phosphorus is sufficient to grow 700 kg (318 lb) algae (Knud-Hansen,
1994).
Lakes often contain low nitrate and phosphate levels when first formed. After thousands
of years of rainfall, erosion and seepage, high concentrations of nutrients accumulate, and the
lakes become eutrophic. Through the process of algal growth and decay, lakes eventually fill
with decaying organic matter and transform from marshland to dry land. This process is referred
to as natural lake aging.
The eutrophication of lakes today is usually the result of human pollution and occurs over
a much shorter time frame than natural lake aging. Nitrates and phosphates are components of
the wastewater discharged by point sources such as municipal wastewater treatment plants and
industry outlets or by non-point sources including agricultural areas and the atmosphere
(McGucken, 2000).
Nitrates comprise of about half of human and animal wastes, so sewage and animal
feedlots are major sources of nitrates in surface waters. Fertilizers also contain high nitrate
levels, which can runoff into lakes and rivers. In addition, some blue-green algae can convert
nitrogen from the atmosphere into nitrates.
Figure 5.1 displays nitrate levels in the Bagmati River since May 2002. The data for this
chart comes from the South Asia Trans-boundary Water Quality Monitoring Project (SATWQM,
see Chapter 2). Nitrate levels rapidly increase from November to December 2002. This trend is
consistent with Figures 2.3 to 2.10 (Chapter 2), where variations in water quality are more
dramatic during the dry winter season. Samples in August and September, however, are very
high, in spite of the fact that these points fall during the rainy season. One explanation for this is
that the heavy rains during the monsoon season increase the amount of nitrogen run-off from
nonpoint sources.
According to the sources of nitrates addressed above, one might expect nitrate levels to
be the highest as the Bagmati River flows through heavily populated areas like Tilganga,
Sundarighat and Chovar. With the exception of Chovar in September, the nitrate levels seem to
vary by only small amounts between heavily and lightly populated locations.
48
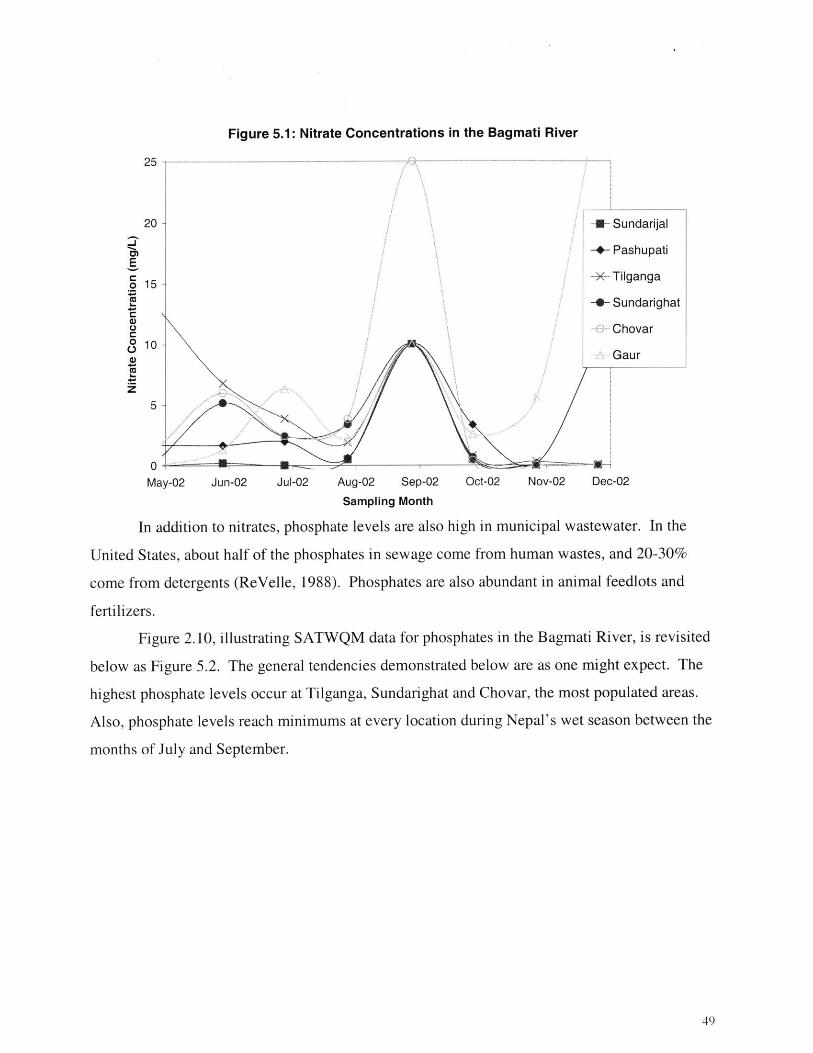
Figure 5.1: Nitrate Concentrations in the Bagmati River
25
20 - + Sundarijal
-+- Pashupati
15 -X- Tilganga
Sundarighat
Chovar
0 10
a
Gaur
z5
0 ~
May-02 Jun-02 Jul-02 Aug-02 Sep-02 Oct-02 Nov-02 Dec-02
Sampling Month
In addition to nitrates, phosphate levels are also high in municipal wastewater. In the
United States, about half of the phosphates in sewage come from human wastes, and 20-30%
come from detergents (ReVelle, 1988). Phosphates are also abundant in animal feedlots and
fertilizers.
Figure 2.10, illustrating SATWQM data for phosphates in the Bagmati River, is revisited
below as Figure 5.2. The general tendencies demonstrated below are as one might expect. The
highest phosphate levels occur at Tilganga, Sundarighat and Chovar, the most populated areas.
Also, phosphate levels reach minimums at every location during Nepal's wet season between the
months of July and September.
49

Figure 5.2 (also 2.10): Phosphate Concentrations in the Bagmati River
1.8 --I- Sundarijal
1.6 Pashupati
1.-4 -X- Tilganga
1.2 -- Sundarighat
Chovar*1.0 -
Gaur
0 0.8/0
0.6-0.X
.8 0.4-
0.2
0.0May-02 Jun-02 Jul-02 Aug-02 Sep-02 Oct-02 Nov-02 Dec-02
Sampling Month
Eutrophication is a complex process that cannot correctly be reduced to a function of
nitrate and phosphate concentrations; it depends on many water quality parameters of the lake or
river in question, including levels of other nutrients present, hydrological patterns and climatic
factors. As such, it is difficult to conclude from Figures 5.1 and 5.2 alone whether or not the
nitrate and phosphate levels in Bagmati River are sufficient to cause eutrophication. In a 1966
study considering eutrophication in Europe's inland waters, however, evidence suggested that a
water body is "in danger" if it exhibits nitrate levels of 0.2 to 0.3 mg/L and phosphate levels of
0.01 mg/L (McGucken, 2000). Using these criteria, nitrate and phosphate concentrations are
indeed great enough to cause eutrophication problems in the Bagmati River.
5.3 Regulatory History
By 1959, laundry detergents used in the United States contained between 14 and 57
weight percent sodium tripolyphosphate (STPP), and automatic dishwashing detergents
contained from 35 to 55 weight percent (McGucken, 2000). This corresponds to between 4 and
15 weight percent phosphorus. The production of phosphate builder at the time was over
700,000 tons in the United States (McGucken, 2000). In addition, wastewater was often
50
discharged directly into waterways, as many communities lacked wastewater treatment facilities.
Consequently, rivers and lakes throughout the United States and other developed nations were
choked with algae.
In the late 1960's, public concern about the nation's waterways was growing, and a
suspicious eye was being cast toward the detergent industry. Waste streams from industrial and
municipal sources accounted for half of the phosphorus flow into Lake Erie and Lake Ontario,
and detergents comprised between 50 and 70% of these streams (Knud-Hansen, 1994). The
public expected the detergent industry to rectify the algae problem as easily as it had the foaming
problem a few years earlier, but the detergent industry maintained that it had no suitable
replacement at the time.
With public and government pressure to reduce phosphate concentrations in laundry
detergents, the synthetic detergent industry in the United States began phasing out phosphates as
builders. The builder that would replace STPP was sodium nitrilotriacetate (NTA,
N(CH 2CHONa)3) (McGucken, 2000). In 1966, Proctor & Gamble began marketing in select
areas an experimental laundry detergent product with NTA as 25% of the total builder
concentration. Within two years, 10% of Proctor & Gamble detergents had this formulation, and
use of the new builder was on the rise.
On December 18, 1970, however, the Surgeon General of the United States ordered that
NTA use be suspended until further tests could be performed. NTA degradation products were
suspected carcinogens, and in 1980 it was established that the cancer risk associated with NTA in
drinking water was two in a million. The EPA deemed this risk too small for regulatory action to
follow (Knud-Hansen, 1994).
The same year, the detergent industry voluntarily agreed to reduce phosphorus
concentrations to 8.7 weight percent. In 1971, Connecticut, Florida, Indiana, Maine, Michigan
and New York passed laws setting phosphorus limits in detergents at 8.7 percent, while certain
municipalities in Indiana, New York, Vermont and Wisconsin totally banned phosphorus
builders (ReVelle, 1988). Since 1971, certain states have also banned the use of NTA.
In light of the toxicity of alternative builders and the spread of advanced secondary and tertiary
municipal wastewater treatment plants, the controversy surrounding STPP has faded to some
extent, and the phosphate builder is still very common in laundry detergents. Alternative
builders include sodium carbonate, sodium silicate and sodium aluminosilicate (zeolite).
51

6. Detergent Analysis
6.1 Materials
As described in Chapters 3 and 5, chemicals known as surfactants and builders are
essential constituents of synthetic detergents. As such, surfactants and builders of different kinds
are used in a range of proportions in synthetic detergents, depending on the manufacturer and the
intended detergent user and purpose. This thesis focuses on laundry detergents intended for use
in Nepalese households, especially in the Kathmandu Valley. Eighteen laundry detergents and
one dishwashing detergent representing ten manufacturers from three countries of origin were
collected from markets around Kathmandu. The analyzed detergents were in both bar and
powder form and ranged from very inexpensive, 7 NRs ($0.09 US) for a 500-g (1.1-lb) bag of
detergent, to rather pricey, 145 NRs ($1.93 US) for 500-g. Figure 6.1 below lists basic pricing
information for each detergent analyzed.
Figure 6.1: Detergent Pricing InformationDetergent Form Company, Country Price Price/1 00 grams
Wheel powder Nepal Lever 16 NRs/500 g 3 NRs ($0.04 US)Wheel w/ lemon powder Nepal Lever 16 NRs/500 g 3 NRs ($0.04 US)Wheel w/ lemon bar Nepal Lever 7 NRs/250 g 3 NRs ($0.04 US)Vim bar Nepal Lever 10 NRs/200 g 5 NRs ($0.07 US)OK bar Nepal Lever 8 NRs/200 g 4 NRs ($0.05 US)Surf Excel powder Hindustan Lever, India 53 NRs/200 g 27 NRs ($0.35 US)Ariel bar Proctor & Gamble, India 50 NRs/250 g 20 NRs ($0.27 US)Ariel powder Proctor & Gamble, India 145 NRs/500 g 29 NRs ($0.39 US)Tide powder Proctor & Gamble, India 70 NRs/500 g 14 NRs ($0.19 US)Mr. White powder Henkel, India 32 NRs/500 g 6 NRs ($0.09 US)Henko Megastar powder Henkel, India 5 NRs/20 g 25 NRs ($0.33 US)Diyo powder Aarti Detergent, Nepal 14 NRs/200 g 7 NRs ($0.09 US)Diyo w/ lemon bar Aarti Detergent, Nepal 7 NRs/200 g 4 NRs ($0.05 US)Diyo bar Aarti Detergent, Nepal 7 NRs/200 g 4 NRs ($0.05 US)Fighter powder Polo Chemicals, Nepal 7 NRs/500 g 1 NRs ($0.02 US)Super Current powder Goga Industries, Nepal 30 NRs/200 g 15 NRs ($0.20 US)GoGo powder Nepal 25 NRs/500 g 5 NRs ($0.07 US)Super Chek bar Detergents, India Limited 7 NRs/125 g 6 NRs ($0.07 US)Jimnao powder China 24 NRs/300 g 8 NRs ($0.11 US)
52
6.2 ABS Analysis
6.2.1 ABS Procedure
Analysis of detergents for total anionic surfactants was performed using Hach® Procedure
8028. This test procedure makes use of crystal violet, a cationic triphenylmethane dye that
complexes with the anionic surfactant molecules present in the detergent sample. The complexes
prefer benzene to water as a solvent, so the dyed sample is extracted with benzene to isolate the
surfactants from the rest of the aqueous phase. Using a spectrophotometer, one can identify the
surfactant concentration from the coloration of the dyed benzene. Estimated detection limits
range from 0.002-mg/L to 0.275-mg/L anionic surfactant using a Hach* DR2010
spectrophotometer.
It is vital in this thesis for the reader to recognize that ABS and other poorly degradable
anionic surfactants cause foaming problems in wastewater treatment plants and receiving waters,
while LAS and other easily biodegradable surfactants do not under aerobic conditions. In the
analysis and discussion that follows, anionic surfactants present in the synthetic detergent
samples are classified as non-biodegradable (or rather very slowly biodegradable) and readily
biodegradable. These groups are notated ABS and LAS, respectively. While ABS and LAS are
the most prevalent of the "hard" and "soft" surfactants, it is possible that additional anionic
surfactants are used in the specific laundry detergents analyzed. This thesis does not address that
possibility, but rather lumps other surfactants together with ABS and LAS.
Synthetic detergent samples are prepared and analyzed according to the following
procedure:
1. Sample solution preparationa. Dissolve 0.4 g sample detergent in 100 mL tap water to make a 4 mg/mL solution.b. Add 10 mL of detergent solution prepared in step la to 290 mL Charles River
water.c. Add 3 mL of detergent solution prepared in step lb to 297 mL Charles River
water.d. Each time Charles River water is collected, the raw water should be analyzed to
measure background surfactants.
2. Extraction of surfactants with benzenea. Pour 10 mL sulfate buffer solution (Hach* #452-49) and solution prepared in step
Ic to 500 mL separatory funnel. Shake funnel to mix solutions.b. Add I reagent powder pillow (Hacho #1008-68) to the funnel. Shake the funnel
to dissolve the powder.
53

c. Add 30 mL benzene to the solution in the funnel. Shake to thoroughly mix thelayers, but do not shake excessively, as an emulsion may form.
d. Wait 30 minutes for the organic and aqueous layers to separate.e. Drain the bottom aqueous layer, and discard into an appropriate organic waste
container.
3. Sample analysis using Hach* DR2010 Spectrophotometera. Choose program 710 when prompted. Turn dial to 605 nm.b. Zero with a pure benzene blank.c. Drain the top organic layer from the separatory funnel into a spectrophotometer
sample cell and read.d. Discard benzene and organic layer into appropriate organic waste containers.
4. Detergent solution storage for monitoring of surfactant degradationa. Add 5 mL solution prepared in step lb to 95 mL Charles River water.b. Prepare and store 2 such solutions from step 4a for each detergent analyzed.c. Shake stored samples several times a day, and leave containers open to the
atmosphere to encourage aeration.
5. Analysis of stored detergent solutionsa. Add 1 stored sample prepared in step 4a to 200 mL tap water.b. Follow procedures outlines in steps 2 and 3 to analyze surfactant concentrations in
stored samples.
6.2.2 ABS Results
Figures 6.2 and 6.3 below illustrate the total anionic surfactant concentrations in the
detergents analyzed. From the two charts, it appears that most detergents analyzed contain
between 4 and 8 weight percent anionic surfactants. Detergents with considerably higher
surfactant concentrations include Henko, Tide and the two varieties of Ariel. Using the pricing
information listed in Figure 6.1, these detergents are also among the most expensive brands.
54
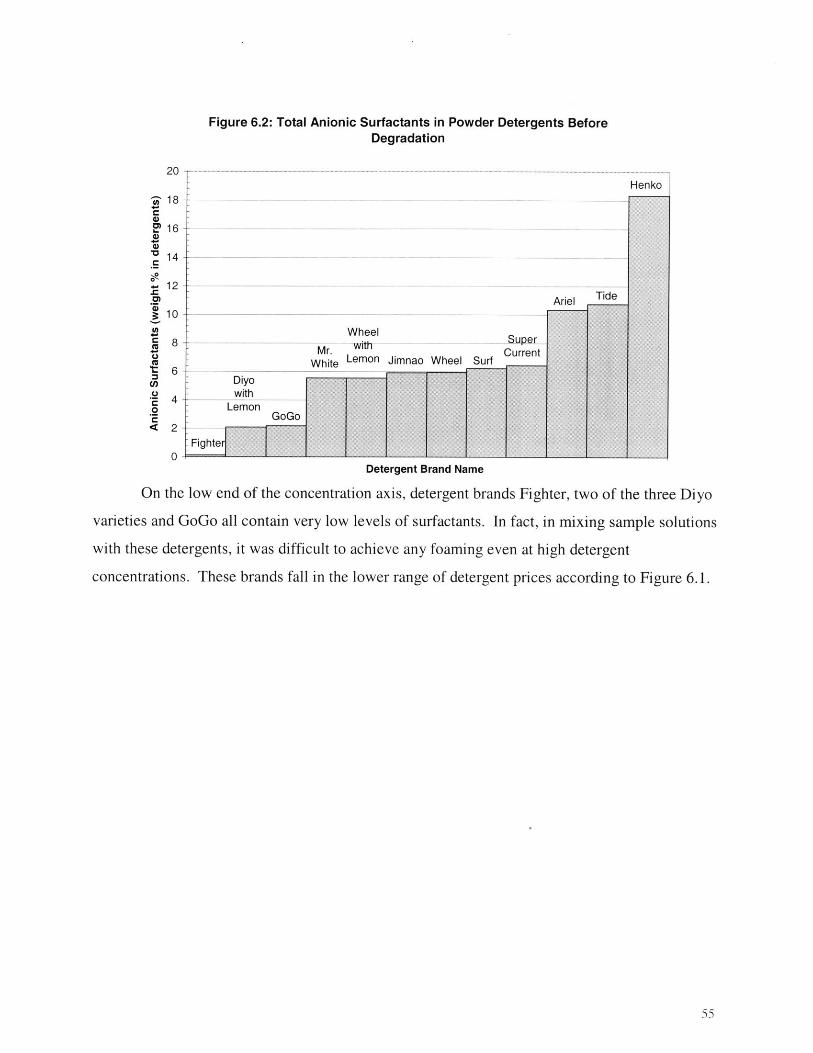
Figure 6.2: Total Anionic Surfactants in Powder Detergents BeforeDegradation
0ZE
0
18
16
14-
12-
10-
8-
6
4
2
0
Ariel Tide
WheelMr. - Super_
Mr. withCurrentWhite Lemon Jimnao Wheel SurfCurn
Diyowith
Lemon GoGo
Fighter
Detergent Brand Name
On the low end of the concentration axis, detergent brands Fighter, two of the three Diyo
varieties and GoGo all contain very low levels of surfactants. In fact, in mixing sample solutions
with these detergents, it was difficult to achieve any foaming even at high detergent
concentrations. These brands fall in the lower range of detergent prices according to Figure 6.1.
55
20 T-r-
Henko

Figure 6.3: Total Anionic Surfactants in Bar Detergents BeforeDegradation
14 - - - - Ariel
12 -- _-
10Wheel with0-
- Lemon
SuperS 8 -Diyo witi Ch ik
Lemon
0U)
2 4
0"C
Diyo0-
Detergent Brand Name
Figure 6.4 below compares price with surfactant concentration for all detergents tested.
Figure 6.4: Detergent Price vs Anionic Surfactant Concentration
0 .3 --------
0.25 -+-_-_-
C0. 0.2 ------
0.15
0.1
0.05
0 ....0 2 4 6 8 10 12 14 16 18 20
Anionic Surfactants (weight % in detergents)
The graph exhibits an overall increase in detergent price with surfactant concentrations.
This trend is reasonable, as surfactants are some of the more costly detergent components.
56
. - :' 777-77777 7 - -.- -

A second round of detergents tests showed extensive amounts of surfactant degradation
in all the detergent samples. Figures 6.5 and 6.6 illustrate the total anionic surfactant levels (also
shown in Figures 6.2 and 6.3) and the concentrations remaining at the time of the second round
of detergent tests.
Figure 6.5: Degraded and Non-degraded Fractions of AnionicSurfactants in Powder Detergents
20- -- Henko
- 18 Degraded Anionic Surfactant Henk_
0 16 Non-Degraded Surfactant
~14
12 Ariel Td10 -
WheelSpr
White L Jimnao Wheel
DiyoC,,
( 4 with. Lemon0
GoGo1~ 2 gter
Detergent Brand Name
57

Figure 6.6: Degraded and Non-degraded Fractions of AnionicSurfactants in Bar Detergents
14 Degraded - --- --- --S--- --tant
12 -FEEDegraded Anionic Surfactant
Non-Degraded Surfactant
10 -- Wheel with
Lemon
0
W SuperM Diyo with Chek
Lemon
6 -
C cc Vim
2_ -.0
Diyo
Detergent Brand Name
Regardless of total anionic surfactant concentration, almost all the samples degraded to
less than 1 weight percent surfactant by the second round of testing. The exception to this trend
is Wheel powder, which degraded to 2.4 weight percent surfactant by the second round of testing
and to 0.45 weight percent in a third test.
From Figures 6.2 and 6.3, the average concentration of anionic surfactants among the
detergents tested is 6.6 weight percent. Further, the average amount of persistent anionic
surfactant (shown in Figures 6.5 and 6.6) among the detergents is 0.5 weight percent. In this
thesis, these average concentrations are considered to be representative of detergents used in
Nepali households.
6.3 Orthophosphate Analysis
6.3.1 Orthophosphate Procedure
Analysis of detergents for orthophosphates was performed at ENPHO according to the
following procedure:
1. Dissolve 1.0 g detergent sample in 100 mL deionized water to make a 10 mg/mLsolution.
58

2. Add 10 mL of detergent solution prepared in step 1 to 40 mL deionized water tomake 50 mL of 2 mg/mL detergent solution.
3. Prepare 0.1 mg/L, 0.2 mg/L, 0.4 mg/L and 0.8 mg/L of standard P0 4 solutionusing ENPHO's stock 100 mg/L P0 4 solution.
a. Add 10 mL of 100 mg/L stock P0 4 solution to 90 mL deionized water tomake 100 mL of 10 mg/L P0 4 solution.
i. ENPHO's stock P0 4 solution prepared by dissolving 4.39 gKH2PO 4 in deionized water to 1000 mL of solution
b. Add 0.5 mL of the solution prepared in step 3a to 49.5 mL deionized waterto make 50 mL of 0.1 mg/L solution.
c. Add 1.0 mL of the solution prepared in step 3a to 49 mL deionized waterto make 50 mL of 0.2 mg/L solution.
d. Add 2.0 mL of the solution prepared in step 3a to 48 mL deionized waterto make 50 mL of 0.4 mg/L solution.
e. Add 4.0 mL of the solution prepared in step 3a to 46 mL deionized waterto make 50 mL of 0.8 mg/L solution.
4. Prepare reagenta. For every 100 mL reagent needed, dissolve 1.08 g ascorbic acid in 20 mL
deionized water.b. Add solution prepared in step 4a to 80 mL ENPHO's stock reagent.
i. ENPHO's stock reagent prepared by first dissolving 3.75 gH24Mo7 N6 0 24 in 400 mL deionized water.
ii. 0.2150 g C4H4KO 7 Sb added to solution prepared in 4bi.iii. While stirring and cooling, 44 mL concentrated H2 SO 4 added to
solution prepared in step 4bii.iv. Stock reagent stored in amber glass bottle and refrigerated.
5. Add 8 mL reagent to each detergent sample, each standard solution and the blank(50 mL deionized water).
6. After 1 hr, analyze solutions using a spectrophotometer at 880 nm.
6.3.2 Orthophosphate Results
Figures 6.7 and 6.8 below illustrate the orthophosphate levels in the detergents
analyzed. Phosphate concentrations range from almost zero to over 1,000 mg/kg. These
concentrations are considerably lower than expected. A cluster exists among the powdered
detergents around 100 mg/kg phosphates, but phosphate levels in the detergent bars display no
such corelation.
59

Figure 6.7: Phosphate Concentration in Powder Detergents
1000 t
-ide~
GoGoSurf
-_SuperMr. Ariel CurrentWheeIl- DiyoWhite Fighter
:Lemon Wheel
Detergent Brand
In Chapter 5, the author makes reference to regulations passed by individual states within
the United States to limit phosphates in detergents to 8.7 weight percent. This is 87,000 mg
phosphates/kg detergent - much higher than any values observed in these samples.
Figure 6.8: Phosphate Concentrations in Bar Detergents
Arie+.1100
1000
900
800
700
600
500
400
300
200
100
0
Detergent Brand
60
1100 -r- - - - -
900 i
Henko I
a0
0
0.
0
C.
800 -
700
600
500-
400
300
200
100
0-
0)
00
4)
0.
77=

From Figures 6.7 and 6.8, the average phosphate concentration among the detergents
tested is 402 mg/kg. As discussed in section 6.2.2, the characteristic detergent for the purposes
of this thesis, then, contains 402 mg/kg orthophosphates.
Figure 6.9: Detergent Price vs Phosphate Concentration
0.30
0.25 -
U)M 0.20z
0.1
0.150
0.05 -
0 00
0 200 400 600 800 1000 1200
Orthophosphates (ppm)
Unlike with anionic surfactants, no direct relationship exists between phosphate
concentration and detergent price, as displayed in Figure 6.9. Furthermore, in Figure 6.10,
anionic surfactant levels are only weakly related to phosphate levels in the detergents tested.
61
*
i i i

Figure 6.10: Anionic Surfactant vs Orthophosphate Concentration
20 - -- -- -
S18
16
S14
12
10
8--
6
0
0 II
0 100 200 300 400 500 600 700 800 900 1000 1100
Orthophosphate Concentration (mg/kg)
It is interesting to note that from Figure 6.10, the laundry detergents with the two highest
surfactant concentrations, Henko Megastar and the bar form of Ariel, also have the two highest
phosphate concentrations. This observation seems counterintuitive, because the role of
phosphates as builders is to prevent hardness ions from complexing with surfactants - high
phosphate levels should lower the required surfactant level.

7. Results and Discussion
7.1 Conclusions Regarding Detergents and Foaming
Using the manufacturers' recommendations on the detergent labels, a typical load of
wash water is approximately 25 g (1 handful) detergent in 4 L (half bucket) of water. From the
average total and non-biodegradable anionic surfactant levels estimated in Chapter 6,
characteristic wash water for one load of laundry contains 6.25 g detergent/L, 413 mg total
anionic surfactant/L and 32 mg ABS/L.
The minimum concentration at which anionic surfactants foam depends on both the
medium and the level of pollution. For example, in distilled water, the foaming limit is 5 mg
ABS/L. In typical wastewaters, surfactant foaming ceases at levels below 0.5 mg/L.
As mentioned in Chapter 1, Kathmandu City has a population of approximately 500,000
residents (Finlay, 2001). The average family size in Nepal is 6 people, so Kathmandu City is
home to approximately 83,000 families. If one load of laundry is washed per family every week,
using 4 L water for a load of laundry, 333 m3 wash water is generated every week in Kathmandu
City, or 5x10 4 m3/s (0.011 MGD).
Figure 7.1 (repeat of Figure 2.3) displays flow rate data for specific sites along the
Bagmati River. The lowest flow rates occur during the dry season (April) for all three sampling
sites, at which time the Bagmati River flows at a rate of less than 1 m3/s (22.6 MGD). If the
worst case scenario is assumed, such that all of the wastewater generated by laundry washing is
discharged into the Bagmati River, the wash water is diluted by a factor of about 2000. In such
as case, the resulting total anionic surfactant concentration in the Bagmati River is about 0.2
mg/L, and the ABS concentration 0.016 mg/L, both below the limit of foaming.
For total anionic surfactant levels in the River to reach 0.5 mg/L, each family unit would
have to wash 2.5 loads of laundry per week during the dry season. ADB estimates that residents
of Kathmandu City use 25 L water/day-person (1,050 L water/week-family) (Metcalf & Eddy,
2000). It is entirely possible, then, that families would sacrifice 10 L/week for 2.5 loads of
laundry/week.
The Bagmati River flow rates are at their highest between July and October, reaching
peak flows of 4.6 m3/s (104 MGD) at Pashupati and 65 m3/s (1,470 MGD) at Sundarighat. For
foaming problems to occur in the River at these flow rates, families would have to average more
63
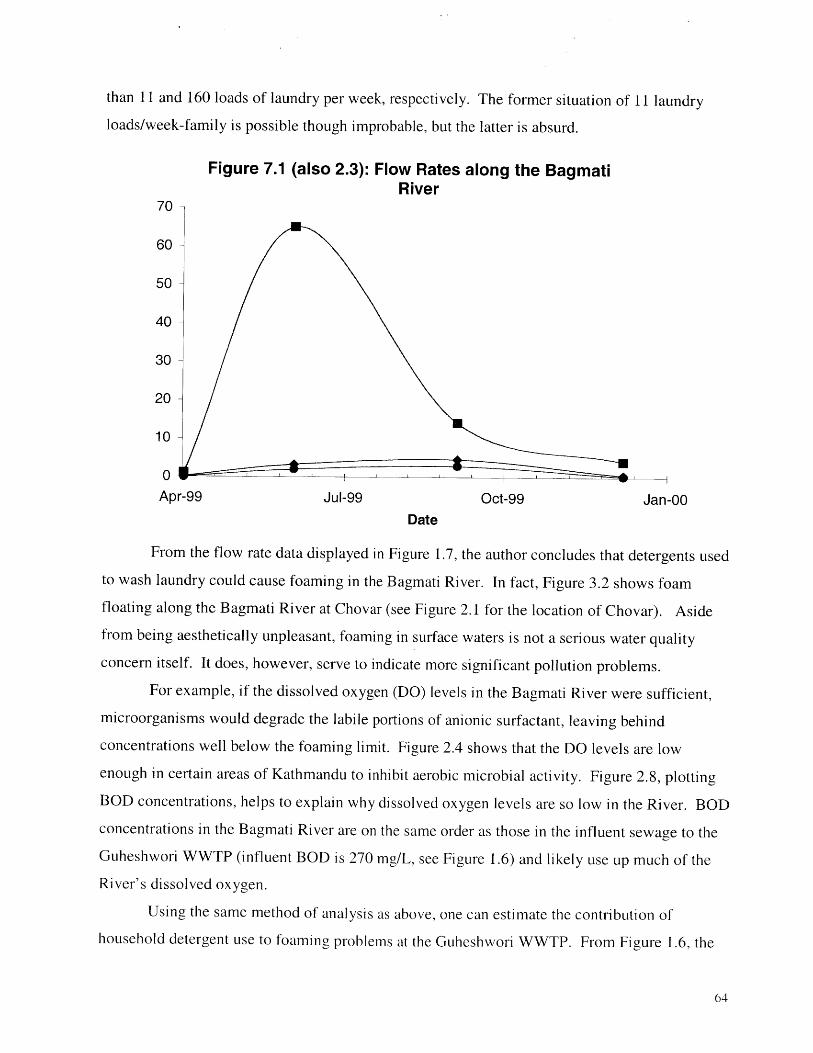
than 11 and 160 loads of laundry per week, respectively. The former situation of 11 laundry
loads/week-family is possible though improbable, but the latter is absurd.
Figure 7.1 (also 2.3): Flow Rates along the BagmatiRiver
70
60 -
50 -
40 -
30 -
20 -
10 -
0 -
Apr-99 Jul-99 Oct-99 Jan-00Date
From the flow rate data displayed in Figure 1.7, the author concludes that detergents used
to wash laundry could cause foaming in the Bagmati River. In fact, Figure 3.2 shows foam
floating along the Bagmati River at Chovar (see Figure 2.1 for the location of Chovar). Aside
from being aesthetically unpleasant, foaming in surface waters is not a serious water quality
concern itself. It does, however, serve to indicate more significant pollution problems.
For example, if the dissolved oxygen (DO) levels in the Bagmati River were sufficient,microorganisms would degrade the labile portions of anionic surfactant, leaving behind
concentrations well below the foaming limit. Figure 2.4 shows that the DO levels are low
enough in certain areas of Kathmandu to inhibit aerobic microbial activity. Figure 2.8, plotting
BOD concentrations, helps to explain why dissolved oxygen levels are so low in the River. BOD
concentrations in the Bagmati River are on the same order as those in the influent sewage to the
Guheshwori WWTP (influent BOD is 270 mg/L, see Figure 1.6) and likely use up much of the
River's dissolved oxygen.
Using the same method of analysis as above, one can estimate the contribution of
household detergent use to foaming problems at the Guheshwori WWTP. From Figure 1.6, the
64
Guheshwori treatment plant was designed in 1996 to serve a population of 58,000. Also, the
facility has a treatment capacity of 0.19 m3/s (4.3 MGD). If we again assume families of 6, then
the wastewater facility serves 9,700 families. As before, 1 load of laundry/week-family
contributes 5x10 4 m3/s (0.011 MGD) wash water to the wastewater. The wash water is diluted
390 times in the wastewater influent, so the concentration of total anionic surfactant in the
influent stream is 1.1 mg/L. Once the wastewater is aerated and labile surfactants degrade, 0.08
mg/L ABS remains in the waste stream.
For the ABS to cause foaming in the Guheshwori WWTP, 6 loads of laundry/week-
family are required. As in the analysis of household detergent in the Bagmati River, it is
certainly possible that surfactants exist in high enough concentrations to cause foaming in
receiving waters. The author is skeptical, however, that the non-degraded surfactant portions
reported in Chapter 6 are actually ABS. The test conditions under which the surfactants were
analyzed ensured an aerobic environment, but they are not adequate for predicting the
biodegradation of the surfactants in activated sludge treatment plant. Two important differences
in the processes are the oxygen transfer rate and the bacterial concentration.
I believe that surfactants in household laundry detergents do play a role in the foaming
problems at the Guheshwori WWTP, albeit a small one. Perhaps more serious contributors are
surfactants from industrial detergents, especially those used in the carpet and textile industries.
The author seeks to stress at this point that the environmental advantages associated with the use
of LAS instead of ABS are only applicable in situations of adequate wastewater treatment and
high quality receiving waters. LAS is readily biodegradable only under aerobic conditions; in
anoxic and anaerobic circumstances, LAS is as stable as ABS.
Wastewater treatment is the best way of ensuring that waste streams contain adequate
levels of dissolved oxygen, especially when alternative receiving waters like the Bagmati River
are highly polluted. If the surfactants are not degraded, concentrations will accumulate until they
surpass the foaming limit, and turbulent flow will result in foaming by LAS and ABS alike.
The real issue with foaming in the Guheshwori WWTP and in places along the Bagmati
River is not a matter of the use of LAS versus ABS, but an indication of more serious water
quality problems, namely poor surface water quality and inadequate wastewater treatment.
Moreover, the failure of the Guheshwori WWTP and of activated sludge treatment
facilities in general to remove surfactants from wastewater illuminates a startling trend in foods,
65
health and beauty products and cleaning agents alike. Consumer products and medicines are
becoming ever-increasingly sophisticated and complex in chemical structure, and many
constituents of these products pass right through treatment facilities without being detected,
removed or changed in any way. These chemicals retain the properties that make them so useful
in consumer products and have the potential to behave in the environment in ways we never
intended. The passing of anionic surfactants through wastewater treatment plants and into rivers
and lakes is hardly more than an aesthetic issue, but when considering prescription drugs or
disinfecting agents, the issue can become a serious problem.
7.2 Conclusions Regarding Detergents and Eutrophication
Using, again, the manufacturer's recommendations from Section 7.1 (6.25 g detergent/ L
wash water) and the representative phosphate concentration from Chapter 6 (402 mg
orthophosphate/kg detergent), the wash water from an average load of laundry contains 2.5 mg/L
orthophosphates.
If each family in Kathmandu City were to wash 1 load of laundry/week during the dry
season (Bagmati River flow is about 1 m3/s or 22.6 MGD) and discharge all their wash water
into the Bagmati River, household laundry detergents would contribute 10-3 mg phosphates/L to
the River. From Figure 2.10, phosphate levels in the Bagmati River were as high as 1.6 mg/L
during May, 2001. Each family in Kathmandu would need to wash 100 loads of laundry per
week even to contribute 0.1 mg/L to this 1.6 mg/L phosphates.
During other seasons of the year, the flow rate of the Bagmati River increases, so
phosphates in laundry detergents pose even less of a threat. From these figures, I would
conclude that household detergents do contribute to phosphate loading in the Bagmati River.
66

Works Cited
Arata, Tetsuji; "Wastewater in the Greater Kathmandu", Japan Association of Environment andSociety for the 21st Century, March 2003.
Barber, L. and J. Leenheer et al; "Organic Contamination of the Mississippi River fromMunicipal and Industrial Wastewater,http://water.usgs.gov/pubs/circ/circII33/organic.html, 1995.
BASP Introduction Pamphlet, 2002
Council for LAB/LAS Environmental Research (CLER), "CLER Fact Sheet - Environmentaland other Benefits of Replacing ABS with LAS",
http://www.cler.com/facts/environ.html,October, 1994.
Darnal, Kiran; "Wastewater System in Kathmandu Valley: An Overview", Development Insight,August-October 2002.
"Detergent Chemistry - History", http://www.chemistry.co.nz.detergenthistory.htm, undated.
Eichhorn, P. and M. E. Flavier et al; "Occurrence and fate of linear and branchedalkylbenzenesulfonates and their metabolites in surface waters in the Philippines," TheScience of the Total Environment, 269 (2001) 75-85.
Finlay, Hugh; Nepal, 5 th Edition; Lonely Planet Publications, August 2001.
Folke, Jens and Lars Landner, "The Principle Precautionary Action and its Application forDetergents", http://www.akira.ruc.dk/-mfg/PDF files/LAS & Principle of PA.pdf,1999.
"Glossary of Chemical Terms",http://www.ktf-split.hr/periodni/en/abc/z.html#Ziegler%20process, March 26, 2003.
Gonzales-Mazo, A. and V.M. Leon, et al; "Occurrence and distribution of linear alkylbenzenesulfonates and sulfophenylcarboxylic acids in several Iberian littoral ecosystems", TheScience of the Total Environment, 288 (2002) 215-226.
Graff, Gordon; "Reformulations agitate market for cleaning ingredients", Chemforecast,http://www.manufacturing.net/pur/index.asp?layout=articleWebzine&articleid=CA269140, January 16, 2003.
Harleman, D and Murcott, S; "An Innovative Approach to Urban Wastewater Treatment in theDeveloping World", Water 21: Magazine of the International Water Association, June2001.
67
Kevlam, J; "The use and science of laundry detergents",http://www.ub.rug.nl/eldoc/dis/science/j.kevelam/cl..pdf, undated.
Khanal, A. B. and B. Paudel and N. B. Khanal; " Operational Problems in the Bagmati SewageTreatment Plant", Development Insight, August-October, 2002.
Knud-Hansen, Chris; "Historical Perspective of the Phosphate Detergent Conflict",http://www.personal.psu.edu/faculty/g/w/gwr5/envphil/phosphate.htm, 1994.
Koch, Donald. Lecture notes from ChemE 644 (Colloids and Aerosols), Cornell University, Fall2001.
McGucken, William; Lake Erie Rehabilitated, The University of Akron Press, Ohio, 2000.
Metcalf & Eddy; Wastewater Engineering Treatment and Reuse, 4th Edition, 2003.
Metcalf & Eddy, Inc. with CEMAT Consultants, Ltd; ADB TA Number 2998 - NEP, "UrbanWater Supply Reforms in the Kathmandu Valley", Volume 1, February 18, 2000.
Petrovic, Mira and Amadeo Rodrigez Fernandez-Alba, et al; "Occurrence and Distribution ofNonionic Surfactants, their Degradation Products, and Linear Alkylbenzene Sulfonates inCoastal Waters and Sediments in Spain," Environmental Toxicology and Chemistry,Volume 21, Issue 1; pp. 37-46, 2002.
Phuyal, Surendra, "Believe it or not, electricity costs may come down", Kathmandu Post,January 29, 2002,http://www.nepalnews.com.np/contents/englishdaily/ktmpost/2002/jan/jan3O/.
ReVelle, Penelope and Charles ReVelle; The Environment: Issues and Choicesfor Society, Jonesand Bartlett Publishers, Boston, 1988.
Richard, Michael; "Practical Control Methods for Activated Sludge Bulking and Foaming",http://www.dec.state.ny.us/website/dow/bwcp/ta sludbulk.html, April 17, 2003.
Sandia National Laboratories "South Asia Environmental Monitoring Project",http://sa-env.cmc.sandia.gov/, undated.
Santa Cruz Productions, "Microthrix parvicella Physical Characteristics",http://homel.gte.net/vsjslsk1/microthrix.htm, January 19, 2000.
Shah, Ram Deep and Das Sunil Kumar; "Performance of deep oxidation ditch" 281h WEDCConference, 2002.
Shah, Ram Deep, Personal conference, January 2003.
68

Shakya, Suman K, "Alarming Trends of River Pollution in Kathmandu, Nepal", A Journal of theEnvironment, Volume 6, Number 7, 2001.
Shrestha, Roshan, Personal conference, January 2003.
Soap and Detergent Association (SDA), "Cleaning Products Overview",http://www.sdahq.org/cleaning/soaps-and-detergents.html, June 15, 1999.
Socialtours.com, "A Guide to Nepal", http://www.socialtours.com/guide/, undated.
Soddell, Jacques; "Bacteria that Float" The Activated Sludge Pages,http://www.scitrav.com/wwater/aspI/float.htm, 1998.
Upadhyay, Lakshman Prasad and Dev Raj Regmi, "River Water Quality Management in Nepal:Problems and Solutions", Water Quality of Selected Rivers in Asia: Protection andRehabilitation, United Nations, 1999.
69
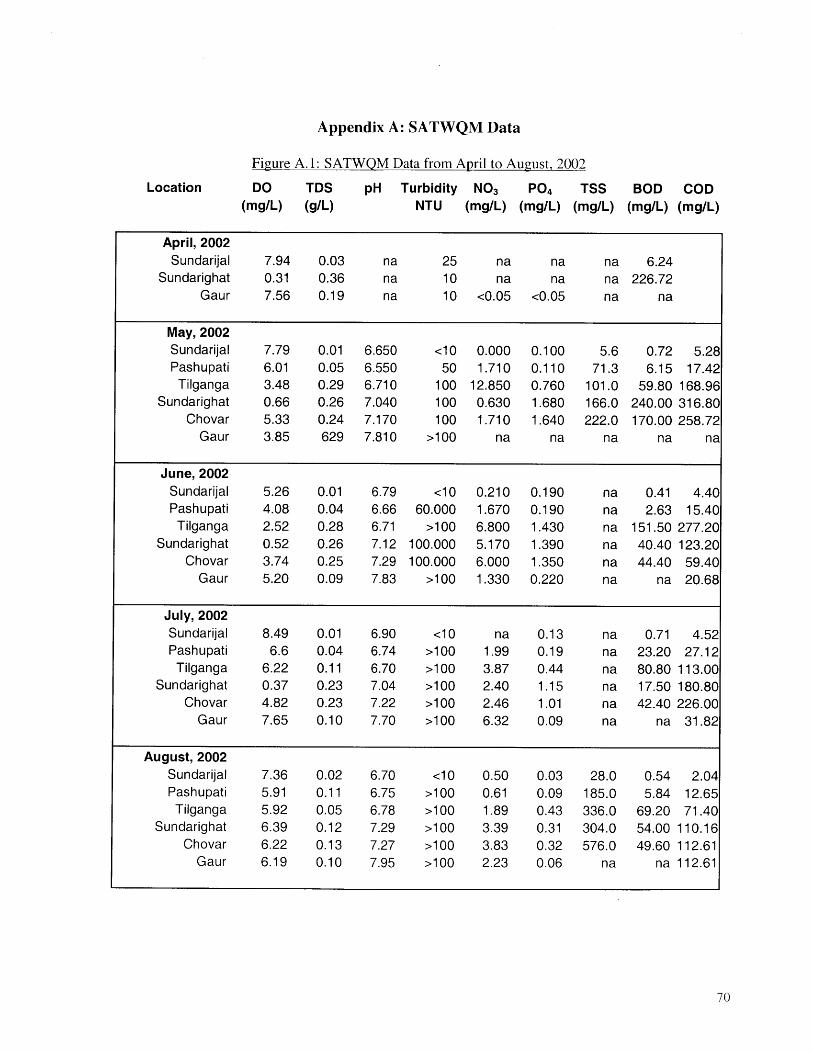
Appendix A: SATWQM Data
Figure A. 1: SATWQM Data from April to August, 2002
Location DO TDS pH Turbidity NO 3 P0 4 TSS BOD COD(mg/L) (g/L) NTU (mg/L) (mg/L) (mg/L) (mg/L) (mg/L)
April, 2002Sundarijal 7.94 0.03 na 25 na na na 6.24
Sundarighat 0.31 0.36 na 10 na na na 226.72Gaur 7.56 0.19 na 10 <0.05 <0.05 na na
May, 2002Sundarijal 7.79 0.01 6.650 <10 0.000 0.100 5.6 0.72 5.28Pashupati 6.01 0.05 6.550 50 1.710 0.110 71.3 6.15 17.42Tilganga 3.48 0.29 6.710 100 12.850 0.760 101.0 59.80 168.96
Sundarighat 0.66 0.26 7.040 100 0.630 1.680 166.0 240.00 316.80Chovar 5.33 0.24 7.170 100 1.710 1.640 222.0 170.00 258.72
Gaur 3.85 629 7.810 >100 na na na na na
June, 2002Sundarijal 5.26 0.01 6.79 <10 0.210 0.190 na 0.41 4.40Pashupati 4.08 0.04 6.66 60.000 1.670 0.190 na 2.63 15.40
Tilganga 2.52 0.28 6.71 >100 6.800 1.430 na 151.50 277.20Sundarighat 0.52 0.26 7.12 100.000 5.170 1.390 na 40.40 123.20
Chovar 3.74 0.25 7.29 100.000 6.000 1.350 na 44.40 59.40Gaur 5.20 0.09 7.83 >100 1.330 0.220 na na 20.68
July, 2002Sundarijal 8.49 0.01 6.90 <10 na 0.13 na 0.71 4.52Pashupati 6.6 0.04 6.74 >100 1.99 0.19 na 23.20 27.12
Tilganga 6.22 0.11 6.70 >100 3.87 0.44 na 80.80 113.00Sundarighat 0.37 0.23 7.04 >100 2.40 1.15 na 17.50 180.80
Chovar 4.82 0.23 7.22 >100 2.46 1.01 na 42.40 226.00Gaur 7.65 0.10 7.70 >100 6.32 0.09 na na 31.82
August, 2002Sundarijal 7.36 0.02 6.70 <10 0.50 0.03 28.0 0.54 2.04Pashupati 5.91 0.11 6.75 >100 0.61 0.09 185.0 5.84 12.65Tilganga 5.92 0.05 6.78 >100 1.89 0.43 336.0 69.20 71.40
Sundarighat 6.39 0.12 7.29 >100 3.39 0.31 304.0 54.00 110.16Chovar 6.22 0.13 7.27 >100 3.83 0.32 576.0 49.60 112.61
Gaur 6.19 0.10 7.95 >100 2.23 0.06 na na 112.61
70
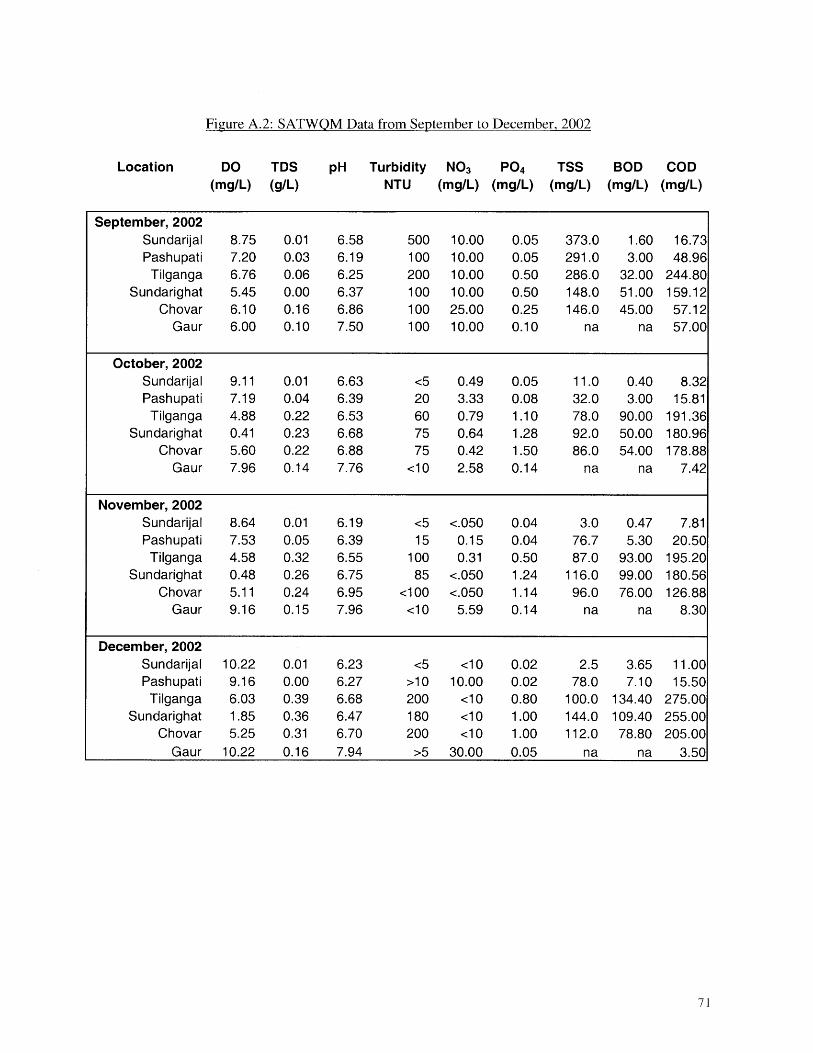
Figure A.2: SATWOM Data from September to December, 2002
pH Turbidity NO 3 P0 4 TSSNTU (mg/L) (mg/L) (mg/L)
BOD COD(mg/L) (mg/L)
71
Location DO(mg/L)
TDS(g/L)
September, 2002Sundarijal 8.75 0.01 6.58 500 10.00 0.05 373.0 1.60 16.73Pashupati 7.20 0.03 6.19 100 10.00 0.05 291.0 3.00 48.96
Tilganga 6.76 0.06 6.25 200 10.00 0.50 286.0 32.00 244.80Sundarighat 5.45 0.00 6.37 100 10.00 0.50 148.0 51.00 159.12
Chovar 6.10 0.16 6.86 100 25.00 0.25 146.0 45.00 57.12Gaur 6.00 0.10 7.50 100 10.00 0.10 na na 57.00
October, 2002Sundarijal 9.11 0.01 6.63 <5 0.49 0.05 11.0 0.40 8.32Pashupati 7.19 0.04 6.39 20 3.33 0.08 32.0 3.00 15.81Tilganga 4.88 0.22 6.53 60 0.79 1.10 78.0 90.00 191.36
Sundarighat 0.41 0.23 6.68 75 0.64 1.28 92.0 50.00 180.96Chovar 5.60 0.22 6.88 75 0.42 1.50 86.0 54.00 178.88
Gaur 7.96 0.14 7.76 <10 2.58 0.14 na na 7.42
November, 2002Sundarijal 8.64 0.01 6.19 <5 <.050 0.04 3.0 0.47 7.81Pashupati 7.53 0.05 6.39 15 0.15 0.04 76.7 5.30 20.50Tilganga 4.58 0.32 6.55 100 0.31 0.50 87.0 93.00 195.20
Sundarighat 0.48 0.26 6.75 85 <.050 1.24 116.0 99.00 180.56Chovar 5.11 0.24 6.95 <100 <.050 1.14 96.0 76.00 126.88
Gaur 9.16 0.15 7.96 <10 5.59 0.14 na na 8.30
December, 2002Sundarijal 10.22 0.01 6.23 <5 <10 0.02 2.5 3.65 11.00Pashupati 9.16 0.00 6.27 >10 10.00 0.02 78.0 7.10 15.50
Tilganga 6.03 0.39 6.68 200 <10 0.80 100.0 134.40 275.00Sundarighat 1.85 0.36 6.47 180 <10 1.00 144.0 109.40 255.00
Chovar 5.25 0.31 6.70 200 <10 1.00 112.0 78.80 205.00Gaur 10.22 0.16 7.94 >5 30.00 0.05 na na 3.50

Appendix B: Data from Surfactant Testing
3/25/03Charles River Water: no dilution; spectrophotometer reading of 0.036 mg/L
Wheel:spectrophotometer reading of 0.168 mg/L0.0595 g surfactant/g detergent
0.4 g detergentadded to 100 mL tap waterto make solution 1: 4b mg detergent/L
2$9 mg surfactant/L10 mL solution 1
added to 290 mL river waterto make solution 2: 8.0 mg surfactant/L
5 mL solution 2added to 295 mL river waterto make solution 3: 0.18 mg surfactant/L
Tide:spectrophotometer reading of 0.179 mg/L0.1075 g surfactant/g detergent
0.4 g detergentadded to 100 mL tap water
to make solution 1: 4000 mg detergent/L430 mg surfactant/L
10 mL solution 1added to 290 mL river water
to make solution 2: 14.4 mg surfactant/L3 mL solution 2
added t 297 mL river waterto make solution 3: 0.179 mg surfactant/L
Henko Megastar:spectrophotometer reading of 0.280 mg/L0.1833 g surfactant/g detergent
0.4 g detergentadded to 100 mL tap waterto make solution 1: 4000 mg detergent/L
733.2 mg surfactant/L10 mL solution 1
added to 290 mL river waterto make solution 2: 24.5 mg surfactant/L
3 mL solution 2added to 297 mL river waterto make solution 3: 0.280 mg surfactant/L
3/26/03Charles River Water: no dilution; spectrophotometer reading of 0.059 mg/L
72
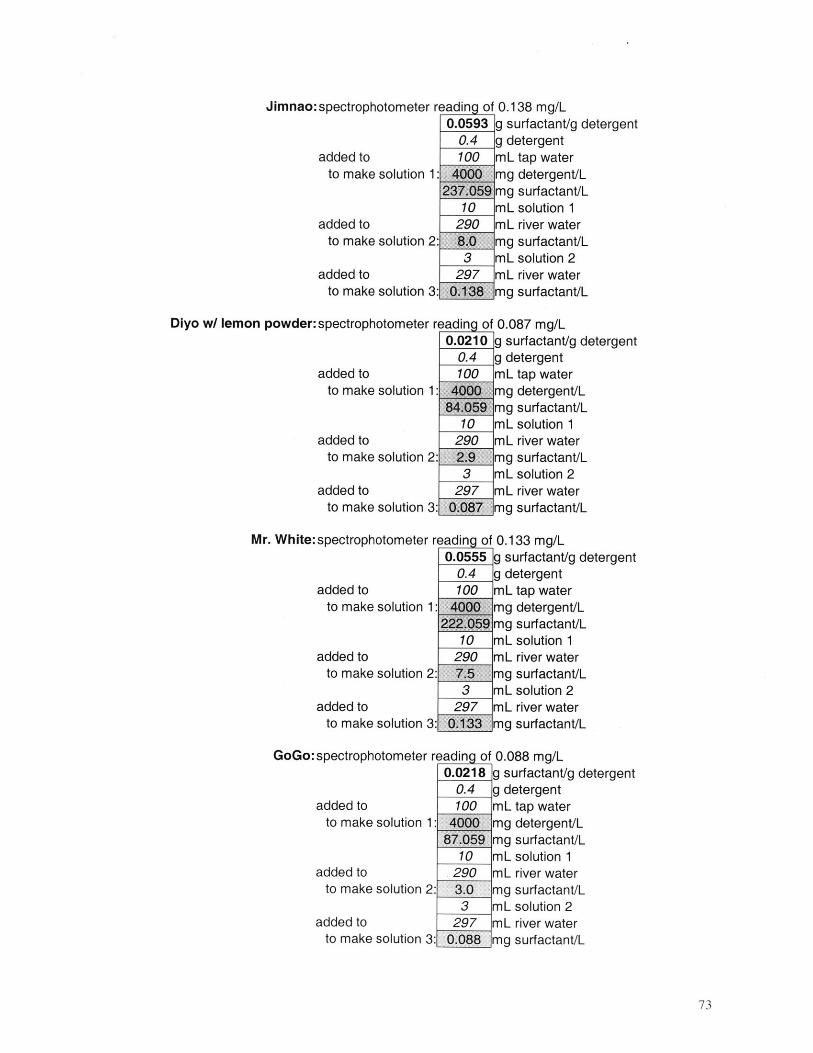
Jimnao: spectrophotometer reading of 0.138 mg/L0.0593 g surfactant/g detergent
0.4 g detergentadded to 100 mL tap water
to make solution 1: 4000 mg detergent/L237.059 mg surfactant/L
10 mL solution 1added to 290 mL river water
to make solution 2: 8.0 mg surfactant/L3 mL solution 2
added to 297 mL river waterto make solution 3: 0.138 mg surfactant/L
Diyo w/ lemon powder: spectrophotometer reading of 0.087 mg/L0.0210 g surfactant/g detergent
0.4 g detergentadded to 100 mL tap water
to make solution 1: 4000 mg detergent/L84.059 mg surfactant/L
10 mL solution 1added to 290 mL river water
to make solution 2: 2.9 _mg surfactant/L3 mL solution 2
added to 297 mL river waterto make solution 3: 0.087 mg surfactant/L
Mr. White:spectrophotometer reading of 0.133 mg/L0.0555 g surfactant/g detergent
0.4 g detergentadded to 100 mL tap water
to make solution 1: 4000 mg detergent/L222.059 mg surfactant/L
10 mL solution 1added to 290 mL river water
to make solution 2: 7.5 mg surfactant/L3 mL solution 2
added to 297 mL river waterto make solution 3: 0.133 mg surfactant/L
GoGo:spectrophotometer readin of 0.088 mg/L0.0218 g surfactant/g detergent
0.4 _g detergentadded to 100 mL tap water
to make solution 1: 4000 mg detergent/L87.059 mg surfactant/L
10 mL solution 1added to 290 mL river water
to make solution 2: 3.0 mg surfactant/L3 mL solution 2
added to 297 mL river waterto make solution 3: 0.088 mg surfactant/L
73
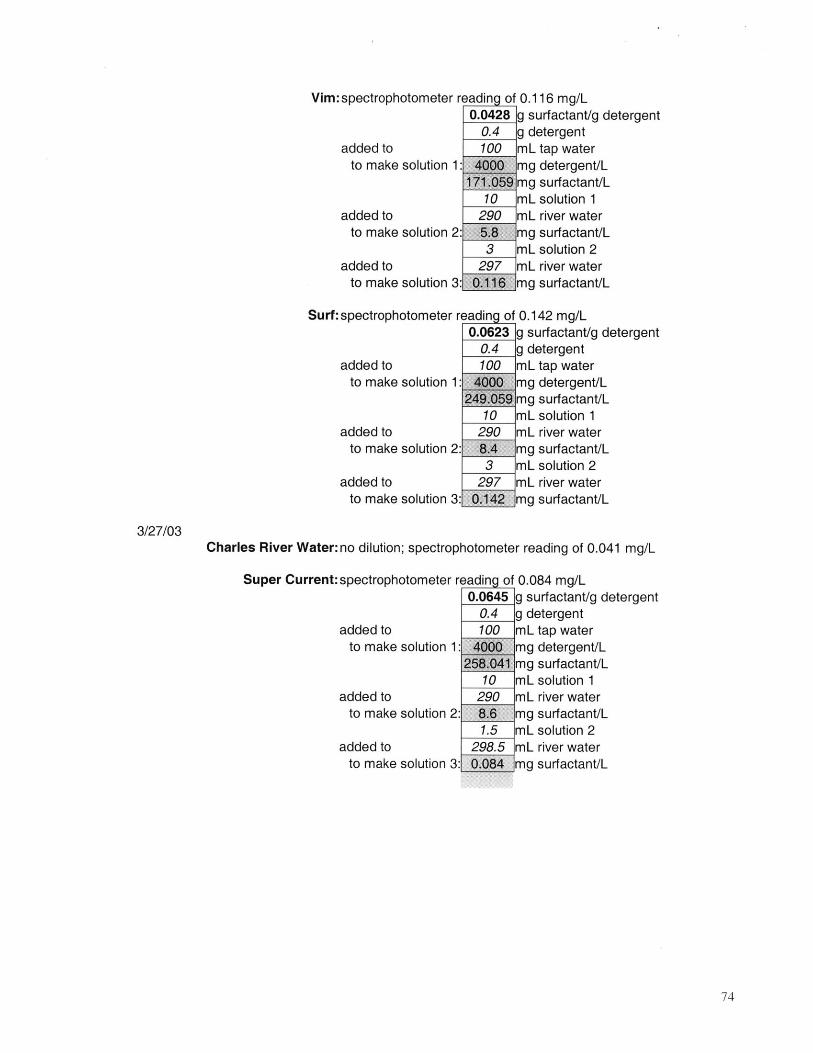
Vim:spectrophotometer reading of 0.116 mg/L0.0428 g surfactant/g detergent
0.4 g detergentadded to 100 mL tap water
to make solution 1: 4000 mg detergent/L171.059 mg surfactant/L
10 mL solution 1added to 290 mL river water
to make solution 2: 5.8 mg surfactant/L3 mL solution 2
added to 297 mL river waterto make solution 3: 0116 mg surfactant/L
Surf:spectrophotometer reading of 0.142 mg/L0.0623 g surfactant/g detergent
0.4 g detergentadded to 100 mL tap water
to make solution 1: 4000 mg detergent/L249.059 mg surfactant/L
10 mL solution 1added to 290 mL river water
to make solution 2: 8.4 mg surfactant/L3 mL solution 2
added to 297 mL river waterto make solution 3: 0.142 mg surfactant/L
3/27/03Charles River Water: no dilution; spectrophotometer reading of 0.041 mg/L
Super Current: spectrophotometer reading of 0.084 mg/L0.0645 g surfactant/g detergent
0.4 g detergentadded to 100 mL tap water
to make solution 1: 4000 mg detergent/L258.041 mg surfactant/L
10 mL solution 1added to 290 mL river water
to make solution 2: 8.6 mg surfactant/L1.5 mL solution 2
added to 298.5 mL river waterto make solution 3: 0.084 mg surfactant/L
74
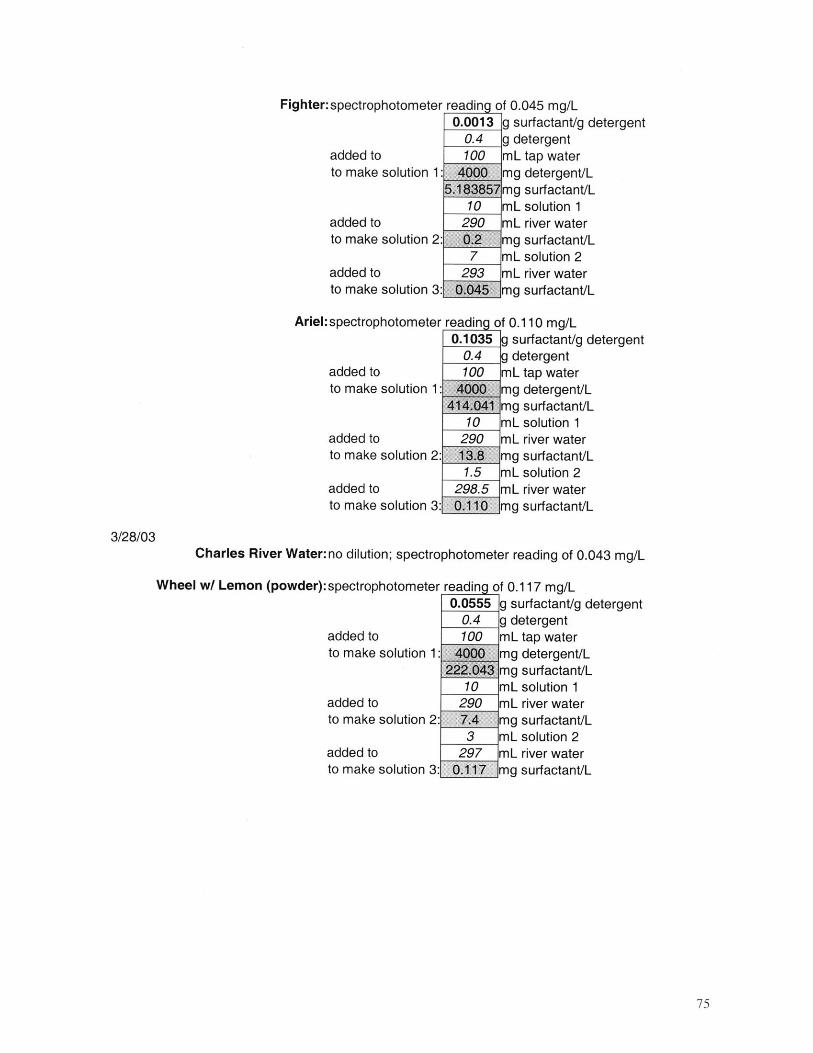
Fighter: spectrophotometer reading of 0.045 mg/L0.0013 g surfactant/g detergent
0.4 g detergentadded to 100 mL tap waterto make solution 1: 4000 mg detergent/L
5.183857mg surfactant/L10 mL solution 1
added to 290 mL river waterto make solution 2: 0.2 mg surfactant/L
7 mL solution 2added to 293 mL river waterto make solution 3: 0.045 mg surfactant/L
Ariel:spectrophotometer reading of 0.110 mg/L0.1035 g surfactant/g detergent
0.4 g detergentadded to 100 mL tap waterto make solution 1: 4000 mg detergent/L
414.041 mg surfactant/L10 mL solution 1
added to 290 mL river waterto make solution 2: 13.8 mg surfactant/L
1.5 mL solution 2added to 298.5 mL river waterto make solution 3: 0.110 mg surfactant/L
3/28/03Charles River Water: no dilution; spectrophotometer reading of 0.043 mg/L
Wheel w/ Lemon (powder):spectrophotometer reading of 0.117 mg/L0.0555 g surfactant/g detergent
0.4 g detergentadded to 100 mL tap waterto make solution 1: 4000 mg detergent/L
222.043 mg surfactant/L10 mL solution 1
added to 290 mL river waterto make solution 2: 7.4 mg surfactant/L
3 mL solution 2added to 297 mL river waterto make solution 3: 0.117 mg surfactant/L
75
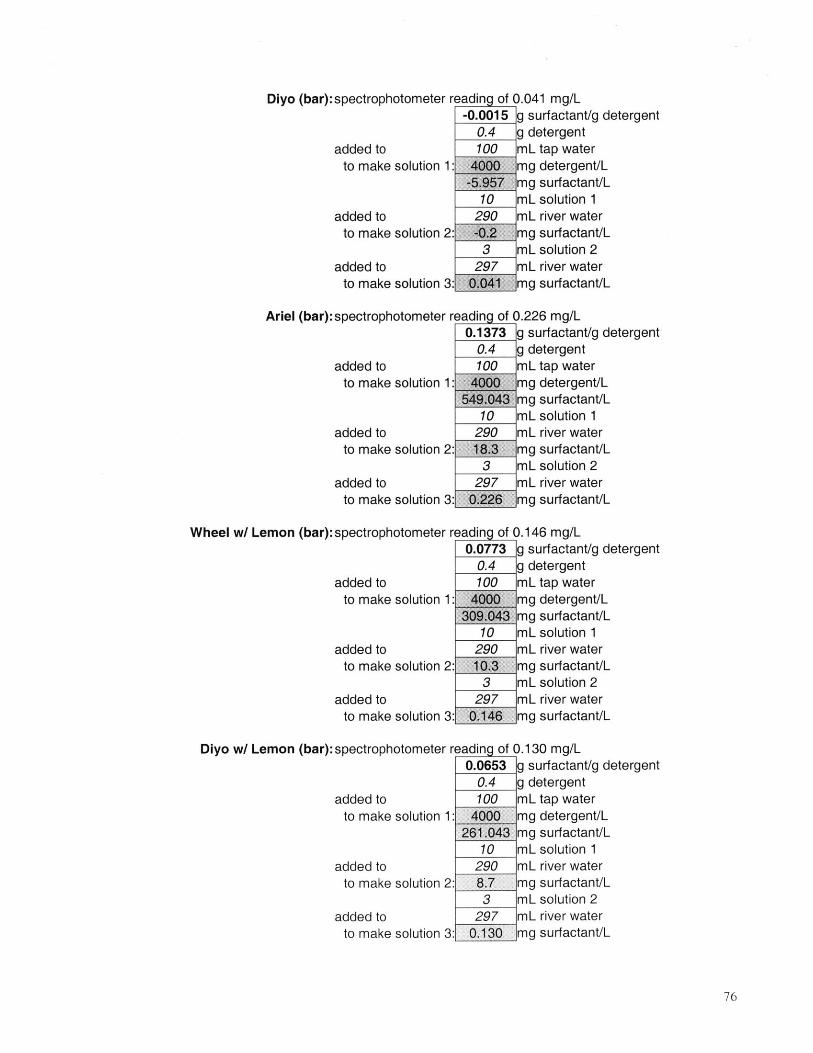
Diyo (bar):spectrophotometer reading of 0.041 mg/L-0.0015 g surfactant/g detergent
0.4 g detergentadded to 100 mL tap water
to make solution 1: 4000 mg detergent/L-5 957 mg surfactant/L
10 mL solution 1added to 290 mL river water
to make solution 2: -, mg surfactant/L3 mL solution 2
added to 297 mL river waterto make solution 3: 0.-Q41 mg surfactant/L
Ariel (bar):spectrophotometer reading of 0.226 mg/L0.1373 g surfactant/g detergent
0.4 g detergentadded to 100 mL tap water
to make solution 1: 4 4 mg detergent/L549i043 mg surfactant/L
10 mL solution 1added to 290 mL river water
to make solution 2: 18.3 mg surfactant/L3 mL solution 2
added to 297 mL river waterto make solution 3: 0.2 mg surfactant/L
Wheel w/ Lemon (bar):spectrophotometer reading of 0.146 mg/L0.0773 g surfactant/g detergent
0.4 g detergentadded to 100 mL tap water
to make solution 1: 4000 mg detergent/L309.043 mg surfactant/L
10 mL solution 1added to 290 mL river water
to make solution 2: 10.3 mg surfactant/L3 mL solution 2
added to 297 mL river waterto make solution 3: 014$ mg surfactant/L
Diyo w/ Lemon (bar):spectrophotometer reading of 0.130 mg/L
added toto make solution 1:
added toto make solution 2:
added toto make solution 3:
0.06530.4100
4000261.043
102908.73
2970.130
g surfactant/g detergentg detergentmL tap watermg detergent/Lmg surfactant/LmL solution 1mL river watermg surfactant/LmL solution 2mL river watermg surfactant/L
76
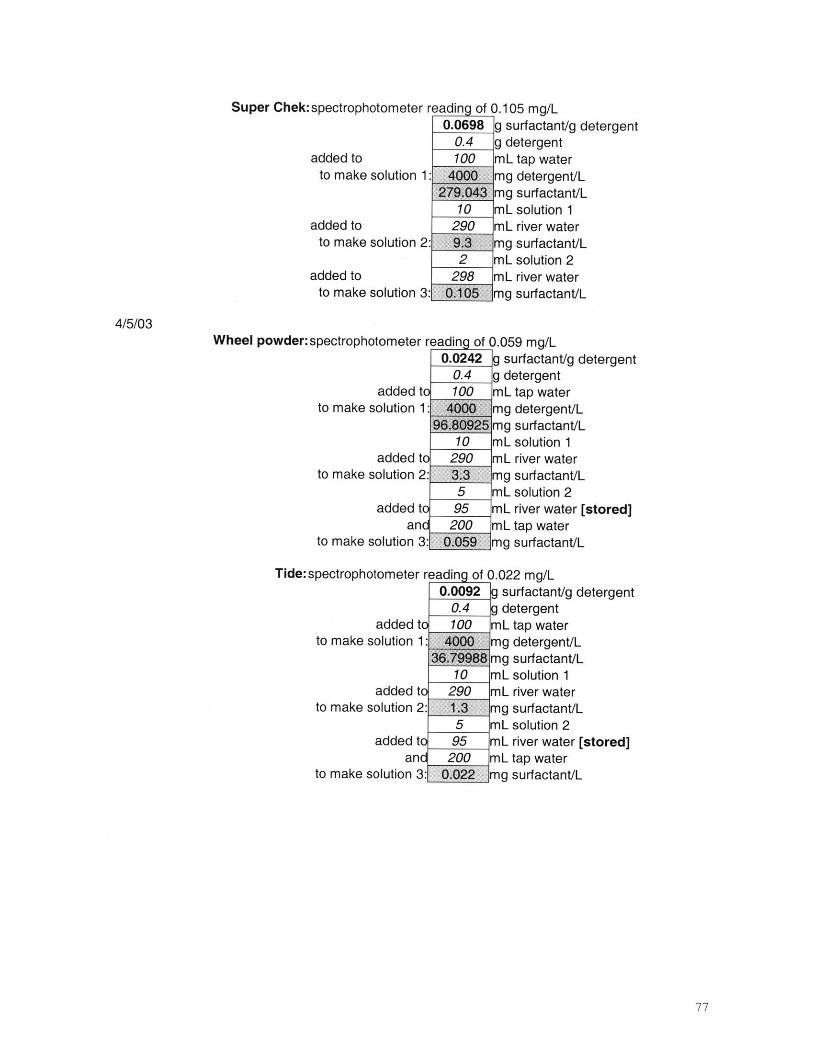
Super Chek:spectrophotometer reading of 0.105 mg/L0.0698 g surfactant/g detergent
0.4 g detergentadded to 100 mL tap water
to make solution 1: 4000 mg detergent/L279.043 mg surfactant/L
10 mL solution 1added to 290 mL river water
to make solution 2: 9.3 mg surfactant/L2 mL solution 2
added to 298 mL river waterto make solution 3: 0.105 mg surfactant/L
4/5/03Wheel powder: spectrophotometer reading of 0.059 mg/L
0.0242 g surfactant/g detergent0.4 g detergent
addedto 100 mL tap waterto make solution 1: 4000 mg detergent/L
96.80925 mg surfactant/L10 mL solution 1
added to 290 mL river waterto make solution 2: 3.3 mg surfactant/L
5 mL solution 2added to 95 mL river water [stored]
and 200 mL tap waterto make solution 3: 0.059 mg surfactant/L
Tide: spectrophotometer reading of 0.022 mg/L0.0092 g surfactant/g detergent
0.4 g detergentaddedto 100 mL tap water
to make solution 1: 4000 mg detergent/L36.79988 mg surfactant/L
10 mL solution 1added to 290 mL river water
to make solution 2: 1.3 mg surfactant/L5 mL solution 2
added to 95 mL river water [stored]and 200 mL tap water
to make solution 3: 0022 mg surfactant/L
77

Diyo with lemon:spectrophotometer reading of 0.026 mg/L0.0082 g surfactant/g detergent
0.4 g detergentadded to 100 mL tap water
to make solution 1: 4000 mg detergent/L32 75189 mg surfactant/L
10 mL solution 1added to 290 mL river water
to make solution 2: 1.1 mg surfactant/L5 mL solution 2
added to 95 mL river water [stored]and
to make solution 3:200
0.026mL tap watermg surfactant/L
Ariel:spectrophotometer reading of 0.022 mg/L0.0092 g surfactant/g detergent
0.4 g detergentadded to 100 mL tap water
to make solution 1: 4000 mg detergent/L36.79988 mg surfactant/L
10 mL solution 1added to 290 mL river water
to make solution 2: 1.3 mg surfactant/L5 mL solution 2
added to 95 mL river water [stored]and 200 mL tap water
to make solution 3: 0.022 mg surfactant/L
Wheel w/ lemon (bar): spectrophotometer reading of 0.014 mg/L0.0055 g surfactant/g detergent
0.4 g detergentaddedto 100 mL tap water
to make solution 1: 4000 mg detergent/L22.1929 mg surfactant/L
10 mL solution 1added to 290 mL river water
to make solution 2: 0.8 mg surfactant/L5 mL solution 2
added to 95 mL river water [stored]and 200 mL tap water
to make solution 3: 0.014 mg surfactant/L
4/7/03
4/9/03
78

Wheel w/ lemon (powder): spectrophotometer reading of 0.013 mg/L0.0050 g surfactant/g detergent
0.4 g detergentadded to 100 mL tap water
to make solution 1: 4000 mg detergent/L19.95076 mg surfactant/L
10 mL solution 1added to 290 mL river water
to make solution 2: 0.7 mg surfactant/L5 mL solution 2
added t 95 mL river water [stored]an 200 mL tap water
to make solution 3: 0.013 mg surfactant/L
Diyo w/ lemon (bar):spectrophotometer reading of 0.014 mg/L0.0055 g surfactant/g detergent
0.4 g detergentadded to 100 mL tap water
to make solution 1: 4000 mg detergent/L21.89703 mg surfactant/L
10 mL solution 1added to 290 mL river water
to make solution 2: 0.8 mg surfactant/L5 mL solution 2
added to 95 mL river water [stored]and 200 mL tap water
to make solution 3: 0.014 mg surfactant/L
Ariel (bar): spectrophotometer reading of 0.015 mg/L0.0061 g surfactant/g detergent
0.4 g detergentadded to 100 mL tap water
to make solution 1: 4000 mg detergent/L24.3057 mg surfactant/L
10 mL solution 1added to 290 mL river water
to make solution 2: 0.9 mg surfactant/L5 mL solution 2
added tc 95 mL river water [stored]and 200 mL tap water
to make solution 3: 0.015 mg surfactant/L
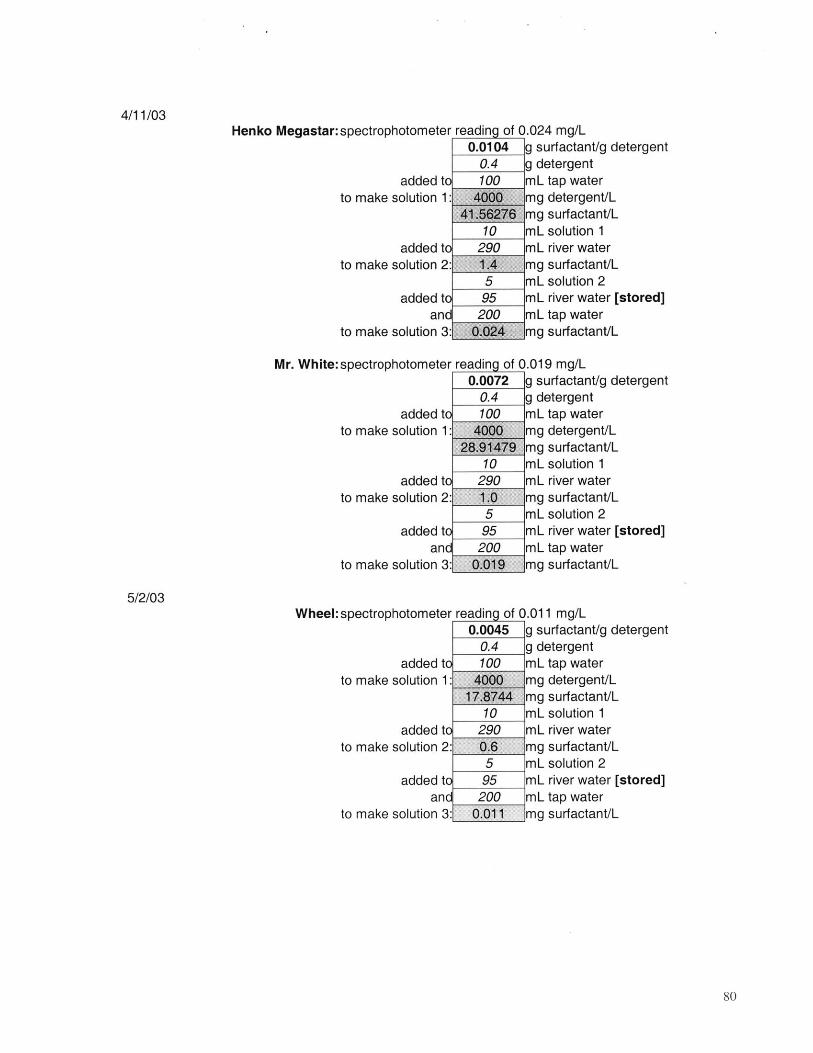
4/11/03Henko Megastar:spectrophotometer reading of 0.024 mg/L
0.0104 g surfactant/g detergent
0.4 g detergentaddedto 100 mL tap water
to make solution 1: 46b@ mg detergent/L41.,6276 mg surfactant/L
10 mL solution 1added to 290 mL river water
to make solution 2: 1.4 mg surfactant/L5 mL solution 2
added to 95 mL river water [stored]and 200 mL tap water
to make solution 3: 0.024 mg surfactant/L
Mr. White: spectrophotometer reading of 0.019 mg/L0.0072 g surfactant/g detergent
0.4 g detergentaddedto 100 mL tap water
to make solution 1: 4000 mg detergent/L28.91479 mg surfactant/L
10 mL solution 1added to 290 mL river water
to make solution 2: 1.0 mg surfactant/L5 mL solution 2
added to 95 mL river water [stored]and 200 mL tap water
to make solution 3: 0.019 mg surfactant/L
5/2/03Wheel:spectrophotometer reading of 0.011 mg/L
0.0045 g surfactant/g detergent0.4 g detergent
added to 100 mL tap waterto make solution 1: 4000 mg detergent/L
17.8744 mg surfactant/L10 mL solution 1
added to 290 mL river waterto make solution 2: 0.6 mg surfactant/L
5 mL solution 2added to 95 mL river water [stored]
and 200 mL tap waterto make solution 3: 0.011 mg surfactant/L
80

Vim:spectrophotometer reading of 0.007 mg/L0.0023 g surfactant/g detergent
0.4 g detergentadded to 100 mL tap water
to make solution 1: 4000 mg detergent/L9.099959 mg surfactant/L
10 mL solution 1added to 290 mL river water
to make solution 2: 0.4 mg surfactant/L5 mL solution 2
added to 95 mL river water [stored]and 200 mL tap water
to make solution 3: 0.007 mg surfactant/L
Surf:spectrophotometer reading of 0.016 mg/L0.0057 g surfactant/g detergent
0.4 g detergentadded to 100 mL tap water
to make solution 1: 4000 mg detergent/L22.8409 mg surfactant/L
10 mL solution 1added to 290 mL river water
to make solution 2: 0.8 mg surfactant/L5 mL solution 2
added to 95 mL river water [stored]and 200 mL tap water
to make solution 3: 0.015 mg surfactant/L
5/3/03Jimnao:spectrophotometer reading of 0.009 mg/L
0.0032 g surfactant/g detergent0.4 g detergent
added to 100 mL tap waterto make solution 1: 4000 mg detergent/L
12.68891 mg surfactant/L10 mL solution 1
added to 290 mL river waterto make solution 2: 0.5 mg surfactant/L
5 mL solution 2added tc 95 mL river water [stored]
and 200 mL tap waterto make solution 3: 0.009 mg surfactant/L
81
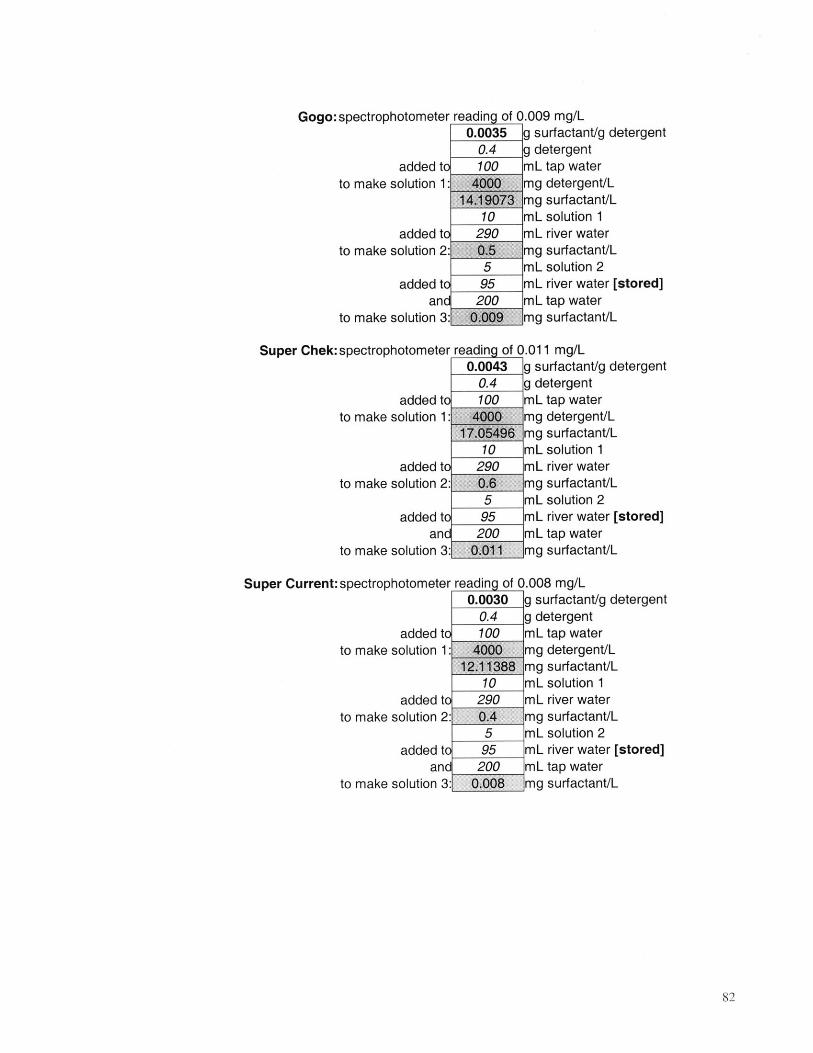
Gogo:spectrophotometer reading of 0.009 mg/L0.0035 g surfactant/g detergent
0.4 g detergentaddedto 100 mL tap water
to make solution 1: 4000 mg detergent/L14.19073 mg surfactant/L
10 mL solution 1added to 290 mL river water
to make solution 2: 0.5 mg surfactant/L5 mL solution 2
added to 95 mL river water [stored]and 200 mL tap water
to make solution 3: 0.009 mg surfactant/L
Super Chek:spectrophotometer reading of 0.011 mg/L0.0043 g surfactant/g detergent
0.4 g detergentaddedto 100 mL tap water
to make solution 1: 400 mg detergent/L17.05496 mg surfactant/L
10 mL solution 1added to 290 mL river water
to make solution 2: 0.6 mg surfactant/L5 mL solution 2
added to 95 mL river water [stored]and 200 mL tap water
to make solution 3: 0.011 mg surfactant/L
Super Current: spectrophotometer reading of 0.008 mg/L0.0030 g surfactant/g detergent
0.4 g detergentaddedto 100 mL tap water
to make solution 1: 4000 mg detergent/L12.11388 mg surfactant/L
10 mL solution 1added to 290 mL river water
to make solution 2: 0.4 mg surfactant/L5 mL solution 2
added to 95 mL river water [stored]and 200 mL tap water
to make solution 3: 0.008 mg surfactant/L
82

Appendix C: Phosphate Analysis DataPhosphate readings were calibrated against ENPHO stock phosphate solutions, and
Figure C. 1 shows the calibration curves used to convert absorbance readings into phosphate
concentrations.
Figure C.1: Calibration Curve for Phosphate Analysis
2
1.8
1.6
1.4-
1.2-
1 -
0.8 -
0.6 -
0.4 -
0.2 -
I-
'K,
A''
0 0.5 1 1.5 2 2.5P0 4 concentration (mg/L)
Calibration, Jan 10P0 4 conc (mg/L)absorbance @ 880 nm
blank 0 0stock 0.1 0.028stock 0.2 0.091stock 0.4 0.191stock 0.8 0.427Diyo 0.131 0.046Super Current 0.230 0.105Ariel 0.221 0.102Wheel 0.044 0.01Fighter 0.166 0.069
83
0c
-C
10-Jano Data from 10-Jan
14-JanA Data from 14-Jan
16-Janm Data from 16-Jan
Poly. (14-Jan)Poly. (16-Jan)
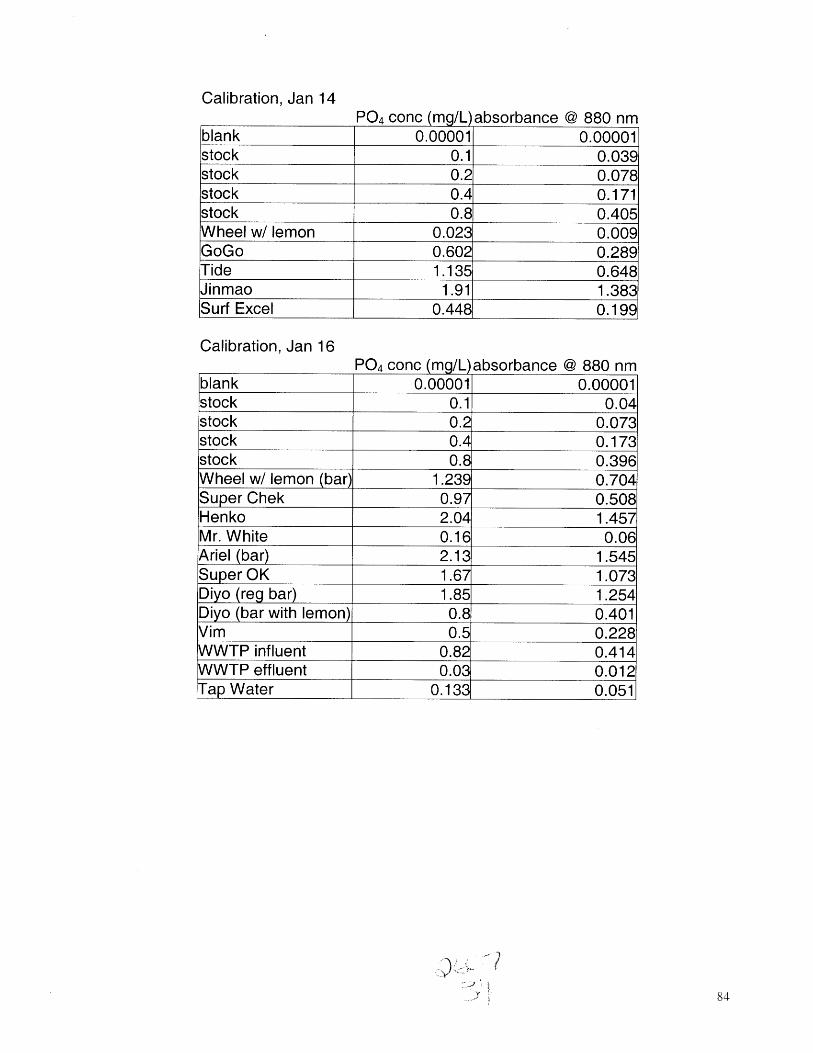
Calibration, Jan 14P0 4 conc (mg/L)absorbance @ 880 nm
blank 0.00001 0.00001stock 0.1 0.039stock 0.2 0.078stock 0.4 0.171stock 0.8 0.405Wheel w/ lemon 0.023 0.009GoGo 0.602 0.289Tide 1.135 0.648Jinmao 1.91 1.383Surf Excel 0.448 0.199
Calibration, Jan 16P0 4 conc (mg/L)absorbance @ 880 nm
blank 0.00001 0.00001stock 0.1 0.04stock 0.2 0.073stock 0.4 0.173stock 0.8 0.396Wheel w/ lemon (bar) 1.239 0.704Super Chek 0.97 0.508Henko 2.04 1.457Mr. White 0.16 0.06Ariel (bar) 2.13 1.545Super OK 1.67 1.073Diyo (reg bar) 1.85 1.254Diyo (bar with lemon) 0.8 0.401Vim 0.5 0.228WWTP influent 0.82 0.414WWTP effluent 0.03 0.012Tap Water 0.133 0.051
2)
84
Top Related
Copyright © 2022 FDOKUMEN

