


Bahasa
Halaman
Hukum

EFFECTS OF COAL-BED METHANE DISCHARGE WATERSON THE VEGETATION AND SOIL ECOSYSTEM IN POWDER
RIVER BASIN, WYOMING†
M. STEARNS1,∗, J. A. TINDALL1, G. CRONIN2, M. J. FRIEDEL3 and E. BERGQUIST4
1U.S. Geological Survey, National Research Program, MS 413, Box 25046, Federal Center, Denver,Colorado 80225; 2Dept. Biology, Univ. Colorado, Denver 80217; 3U.S. Geological Survey,
Geologic Division, MS 964, Box 25046, Federal Center, Denver, Colorado 80225; 4Departmentof Natural Resource Ecology Laboratory, Colorado State University, Ft. Collins 80523(∗author for correspondence, e-mail: maria [email protected]; Tel: 303-235-5005,
Fax: 303-236-5034)
(Received 2 March 2005; accepted 1 July 2005)
Abstract. Coal-bed methane (CBM) co-produced discharge waters in the Powder River Basin ofWyoming, resulting from extraction of methane from coal seams, have become a priority for chemical,hydrological and biological research during the last few years. Soil and vegetation samples were takenfrom affected and reference sites (upland elevations and wetted gully) in Juniper Draw to investigate theeffects of CBM discharge waters on soil physical and chemical properties and on native and introducedvegetation density and diversity. Results indicate an increase of salinity and sodicity within local soilecosystems at sites directly exposed to CBM discharge waters. Elevated concentrations of sodium inthe soil are correlated with consistent exposure to CBM waters. Clay-loam soils in the study area havea much larger specific surface area than the sandy soils and facilitate a greater sodium adsorption.However, there was no significant relation between increasing water sodium adsorption ratio (SAR)values and increasing sediment SAR values downstream; however, soils exposed to the CBM waterranged from the moderate to severe SAR hazard index. Native vegetation species density was highestat the reference (upland and gully) and CBM affected upland sites. The affected gully had the greatestpercent composition of introduced vegetation species. Salt-tolerant species had the greatest richnessat the affected gully, implying a potential threat of invasion and competition to established nativevegetation. These findings suggest that CBM waters could affect agricultural production operationsand long-term water quality.
Keywords: atmospheric methane, aquifer contamination, coal bed methane, reservoirs, water quality
Introduction
The Powder River coalfield within the Powder River Basin of Wyoming andMontana has the largest coal resources in the United States (Bartos and Ogle,2002). Resources developed in the basin include oil, conventional natural gas, coal,uranium, and coal-bed methane (CBM) (Bartos and Ogle, 2002). Coal-bed methanewas first developed in the San Juan Basin, Colorado, in the late 1980s and continued
†The use of firm, trade, or brand names in this paper is for identification purposes only and doesnot constitute endorsement by the U.S. Geological Survey.
Water, Air, and Soil Pollution (2005) 168: 33–57 C© Springer 2005
34 M. STEARNS ET AL.
to emerge throughout the country as an economically viable source for methaneextraction (Rice et al., 2000). Since 1993, active exploitation of CBM resources hasresulted in the rapid expansion of CBM development in the Powder River Basin inWyoming (Flores et al., 2001; Rice et al., 2000). On a national scale, productionof natural gas associated with coal beds accounts for approximately 7% of totalnatural gas produced annually in the United States (USGS FS-110-01, 2001).
With the increasing demand for natural gas, the potential for detrimental effectsto both the environment and local ecosystems has become pronounced. Environ-mental research on the potential effects of the development of CBM is limitedbecause CBM development is relatively recent. Research on the potential impact ofCBM development encompasses a diversity of environmental concerns, includingthe threat of invasive plants that outcompete native vegetation (Bergquist et al.,2004), and concerns about effects on the soil physical properties and chemicalcharacteristics of soils that are in direct contact with the CBM discharged waters.
Methane is extracted from coal seams by pumping groundwater from CBMproduction wells installed in the coal beds. This pumping causes a drop in pressureand forces methane gas upward to the surface where it is more easily extracted(Flores et al., 2001). Surface discharge and disposal of CBM produced water, whichis currently allowed in both Montana and Wyoming (Schneider, 2001), varies inquantity and quality and poses potentially irreversible threats to water and soil-quality.
Coal beds contain many joints and pores that can store comparatively largevolumes of water; therefore, the amount of water produced from CBM wells canbe large (USGS, 2000). For example, the expected life span of one CBM well inWyoming is 7–10 years. Currently, water production is in the range of about 1.28million barrels (40.32 million gallons) per day pumped to land surface in the PowderRiver Basin, covering an area (currently composed of native soil and grassland) of31,080 km2 (Rice et al., 2000). The effects of pumping such large volumes of water(which is expected to increase considerably as new wells are installed) that aredischarged onto the soil surface include lowering of the water levels in aquifers,erosion of soils, contamination of existing surface waters, and disruption of naturalwater flows (Schneider, 2001; Powder River Basin Resource Council, 2003).
Potential consequences of polluting surface water include harmful effects onirrigation sources, streams, agricultural ponds, riparian plant communities, aquaticresources, wildlife and farm habitats, and biodiversity and sustainability (Horpestad,2001a). The controversy concerning these problems in the Powder River Basin haspitted farmers, ranchers, and environmentalists against the oil and gas industry andhas grown so intense that the problem has gained national attention (CBS News 60Minutes, 2005).
The direct discharge of the CBM co-produced waters to the land surface posespotential negative effects to the immediate environment in contact with CBM de-velopment. The co-produced water is typically saline when pumped from the coalseams (Rice et al., 2000). CBM development and its rapid discharge of groundwater
EFFECTS OF COAL-BED METHANE DISCHARGE WATERS 35
to the land surface have created flowing perennial streams where there were pre-viously none. Co-produced CBM waters contain high salinity at numerous sites(Powder River Basin Resource Council, 2003), which salinity has resulted in theswelling and dispersion of clayey soils characteristic of those found in Montanaand Wyoming. These discharge waters have the potential to increase the concen-tration of total dissolved solids in soils, which could interfere with nutrient uptakeby plants, possibly resulting in a decline in growth of agricultural crops and nativeplants and grasses (Horpestad, 2001b). For example, salinity becomes a problem,especially for plants at the germination, emergence, and seedling stages (Ayers,1976; Horpestad et al., 2001). Plants will expend greater amounts of energy to ex-tract water from soil as salinity of the soil water increases (Horpestad, 2001a). Thisincreased soil salinity decreases yields of agricultural crops and growth of nativevegetation.
High concentrations of sodium in soils cause both dispersion of soil colloids anddeterioration of soil structure, making it difficult for roots to penetrate the subsurfaceand extract necessary nutrients and water to support plant life (Foth et al., 1977;Chaudhari, 2001). Further, introduced vegetation species that are tolerant of highsodium concentrations may sustain these conditions making it easier for them toinvade and outcompete local native vegetation. Introduced species can also beharmful to local wildlife (Bashkin et al., 2003), elevating the level of concern tovegetation sustainability in Juniper Draw Basin (a sub basin within Powder RiverBasin).
The main purpose of this study was to assess the effects of CBM co-produceddischarge waters on the soil and vegetation ecosystem in Juniper Draw. The datacollected and analyzed were used to: (1) determine if CBM discharge waters in-crease salinity and sodicity in the soils; (2) investigate growth and distributionpatterns of native, invasive, and salt-tolerant plant species in relation to soil salinityand sodicity from CBM discharge waters; and (3) extrapolate the results of waterchemistry analyses to soil analyses to determine the effect of CBM discharge waterson local soil systems.
Materials and Methods
STUDY SITE
The Powder River Basin encompasses a vast area in Wyoming (31,080 km2), in-cluding Sheridan, Johnson and Campbell counties. The basin is bounded by theYellowstone River to the north, the Laramie and Casper Mountains to the southand the Bighorn Mountains to the west (Bartos and Ogle, 2002; Bergquist, 2003).All tributaries within the basin flow into the Powder River and provide most of thewater for agricultural and domestic use, including stock-water supplies (Bergquist,2003). The predominant land use of the basin is for rangeland, which is composed
36 M. STEARNS ET AL.
of primarily grass-shrub vegetation utilized for grazing and wildlife habitat (Floreset al., 2001; Bureau of Land Management (BLM), 2002).
For purposes of this study, “riparian control sites” are reference sites for compar-isons to the “riparian affected sites.” Both riparian (control) and riparian affectedsites contain a gully and an upland site (a natural draw) or basin, and an ele-vated landscape). However, only the affected gullies contain the co-produced CBMdischarge waters associated with perennial flow. Affected upland includes areasaffected by CBM construction development, including roads or fences, but doesnot include CBM discharge waters.
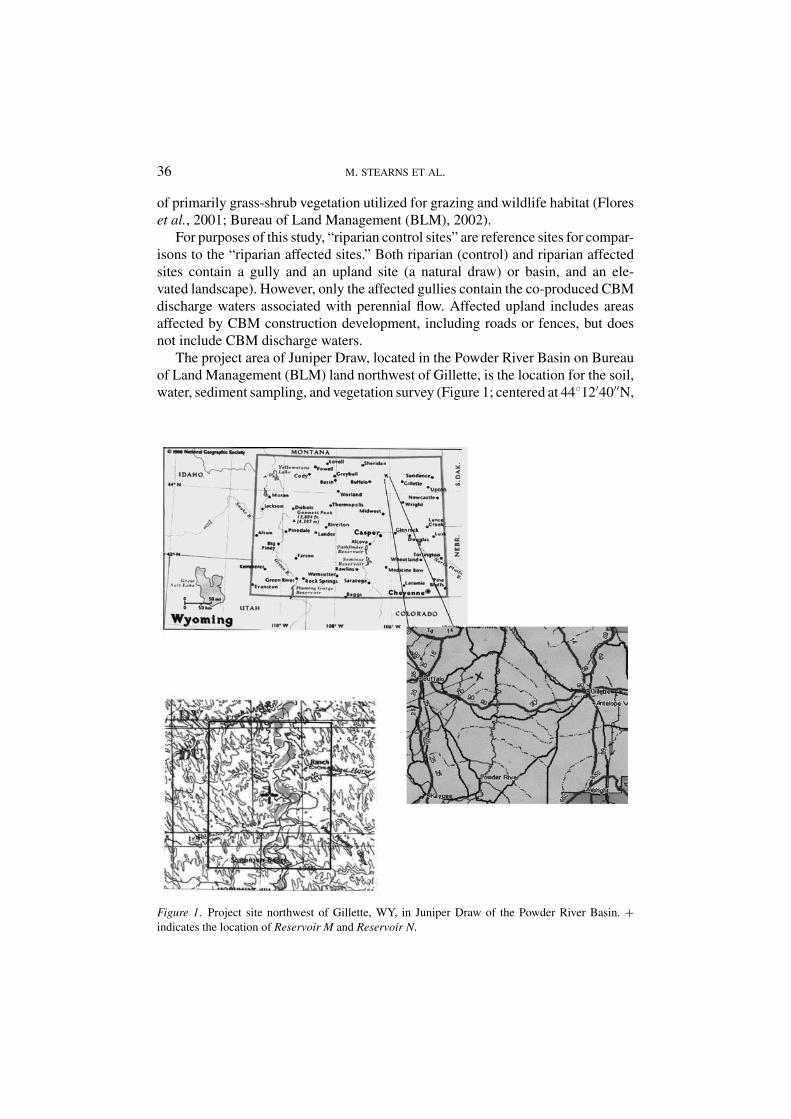
The project area of Juniper Draw, located in the Powder River Basin on Bureauof Land Management (BLM) land northwest of Gillette, is the location for the soil,water, sediment sampling, and vegetation survey (Figure 1; centered at 44◦12′40′′N,
Figure 1. Project site northwest of Gillette, WY, in Juniper Draw of the Powder River Basin. +indicates the location of Reservoir M and Reservoir N.
EFFECTS OF COAL-BED METHANE DISCHARGE WATERS 37
106◦9′30′′W). Recently, Juniper Draw has emerged as one of many sites usedfor expelling CBM co-produced waters to the land surface. CBM well water atJuniper Draw discharges through pipes into two impoundment reservoirs that draindownstream in the direction of Dry Creek (which drains into the Powder River). Thetwo reservoirs (unnamed) are referred to as Reservoir M (106◦67′35′′N, 40◦30′36′′E)and Reservoir N (106◦58′11′′N, 40◦19′00′′E).
All soil, sediment, and water samples were collected over a two-week period inJune of 2003, in conjunction with the vegetation sampling. Soil, sediment and watersamples were placed in ice chests and transported back to the laboratory for refrig-eration storage. Sampling occurred at several sites in Juniper Draw of the PowderRiver Basin, northwest of Gillette. The study plots were divided into two categories;(1) riparian areas upstream from CBM water discharge for reference sites and (2) ri-parian areas downstream from CBM water discharge for “affected” sites. The areassampled included the selected sites of the CSU graduate survey on vegetation, al-lowing for the comparison of vegetation and soil data to investigate patterns relatedto soil salinity and sodicity. Water was sampled at the Juniper Draw reservoirs andat various locations in the stream channels between the reservoirs and Dry Creek.
Soils
SOILS COLLECTION
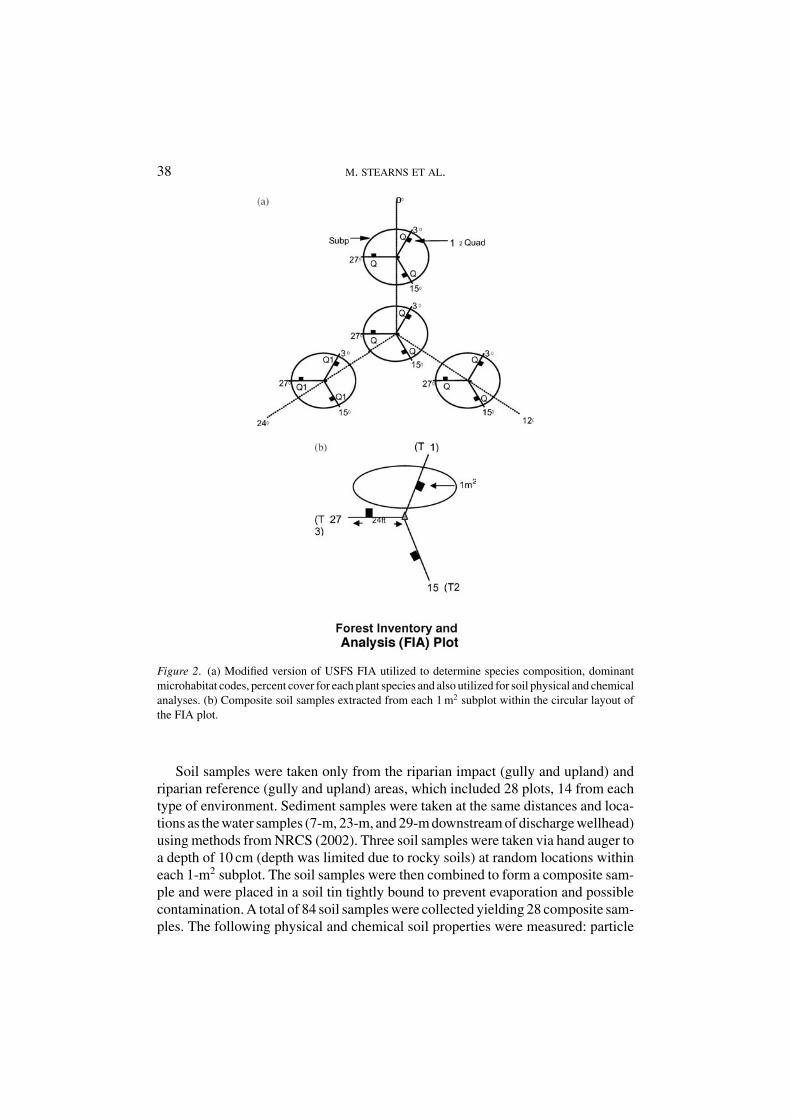
Soil samples were collected in conjunction with a vegetation survey (Bergquist,2003) that acquired data related to the distribution, diversity, and abundance of na-tive and non-native flora. The vegetation survey used 40 modified Forest Inventoryand Analysis (FIA) plots, a method utilized by the United States Forest Service(USFS). The FIA plots are an upgraded version of the original Forest Health Mon-itoring (FHM) plots utilized in the past, circa 1930 (Bergquist, 2003). Figure 2ais a graphical depiction of the modified version of the USFS FIA that was usedin the CSU vegetation survey to determine species composition, microhabitat, andpercent cover for each plant species (Bergquist, 2003). In this project, the FIA plotswere also utilized for soil sampling purposes to correlate patterns of salinity andsodicity with native and non-native vegetation diversity and abundance.
Subplots measuring 1-m2 were located within the perimeter of the FIA plotsto provide in-depth analysis of plant diversity. Soil samples were taken within thesubplots. Methods used for soil collection in relation to vegetation diversity andabundance were obtained from the soil sampling field book distributed by the Na-tional Resource Conservation Service (NRCS, 2002). For purposes of the vegetationsurvey, 40 plots were used for sampling from each area of disturbance includingroads, pipelines, pads, riparian areas upstream and downstream of discharge waters,and localized near reservoirs (Bergquist, 2003).
38 M. STEARNS ET AL.
Figure 2. (a) Modified version of USFS FIA utilized to determine species composition, dominantmicrohabitat codes, percent cover for each plant species and also utilized for soil physical and chemicalanalyses. (b) Composite soil samples extracted from each 1 m2 subplot within the circular layout ofthe FIA plot.
Soil samples were taken only from the riparian impact (gully and upland) andriparian reference (gully and upland) areas, which included 28 plots, 14 from eachtype of environment. Sediment samples were taken at the same distances and loca-tions as the water samples (7-m, 23-m, and 29-m downstream of discharge wellhead)using methods from NRCS (2002). Three soil samples were taken via hand auger toa depth of 10 cm (depth was limited due to rocky soils) at random locations withineach 1-m2 subplot. The soil samples were then combined to form a composite sam-ple and were placed in a soil tin tightly bound to prevent evaporation and possiblecontamination. A total of 84 soil samples were collected yielding 28 composite sam-ples. The following physical and chemical soil properties were measured: particle
EFFECTS OF COAL-BED METHANE DISCHARGE WATERS 39
size; pH; electrical conductivity (EC); and SAR. Chemical properties of a soil-waterextract from each sample were also measured: pH; EC; and SAR. Soil texture wasdetermined using the hydrometer method (Gee and Bauder, 1986). Texture variedbetween sites, with clay loam representing the dominant texture at the affected sitesand a range from mostly loam soils to sandy loam at the reference sites.
SOILS METHODS
Using the FIA plots, fourteen plots were randomly selected at riparian areas up-stream from CBM discharge for the reference sites and another 14 plots were ran-domly selected 10 m downstream from CBM water discharge (Bergquist, 2003).Each plot was marked at the center point with a flag, and for the subplot distribution,three transect lines were constructed (T1, T2, T3) located by compass marking 30◦,150◦, and 270◦ azimuths from the center point flag (Figure 2b). Each transect was7.32 m (24 ft) in length from the center point and the three 1-m2 subplots were lo-cated along the three transect lines at 4.57 m (15 ft) and 5.57 m (18.3 ft) (Bergquist,2003).
SOIL pH AND EC
All composite soil samples were subjected to laboratory analysis for pH and elec-trical conductivity (EC). Both analyses required the extraction of a 5-g air-driedsoil sample, combined with 5-mL pure deionized water, be mixed into a slurry(Page et al., 1982). Both pH and EC were determined using a pH/ion/conductivitymeter that was calibrated prior to each measurement. Duplicate measurements withtwo different slurries were conducted on every third sample for quality assurancepurposes. Descriptive statistics (min, max, mean and standard deviation) were com-puted for pH and EC for both affected and non-affected soils because the protocolrequired three or more readings for accuracy. The laboratory EC analyses (µs/cm)were used to determine the soil salinity hazard classification (Table I).
TABLE I
Soil survey manual (Soil Survey Division Staff, 1993) classifi-cation scheme for salinity hazard index of soils
Electrical conductivityClass dS/m (mmhos/cm) µS/cm
0 Non saline 0–2 0–2000
1 Very slightly saline 2–4 2000–4000
2 Slightly saline 4–8 4000–8000
3 Moderately saline 8–16 8000–16000
4 Strongly saline ≥16 ≥16000
40 M. STEARNS ET AL.
SOIL CATIONS
Soil samples were also analyzed to determine concentrations of calcium, magne-sium, and sodium cations for calculation of SAR values. Analysis was performedusing ion chromatography with duplicate samples; concentration was measuredin µg/L. Cations were extracted from a saturated paste as described by Page et al.(1982). The paste was prepared as described by US Salinity Laboratory Staff (1954).The soil sample was centrifuged for 15 min and filtered using a 0.45 µm membrane.The resulting 5-mL extraction was added to the ion chromatography auto-sampler,after appropriate dilutions were applied to the volume to lessen the potential con-tamination impact to the ion analysis column. Dilutions, either 1:5 or 1:10, werebased on the electrical conductivity of the sample.
Cation concentrations were averaged for replicates only, with uncertainty anal-ysis applied to all Mg2+ concentrations due to fluctuations in accuracy with thestandard runs during ion chromatography analyses. SAR values were calculatedbut reported without the uncertainty analysis since values were consistently lessthan ±4%. To assess statistical significance of the relationship between the treat-ment sites and the independent soil chemical variables, a one-way ANOVA test wascomputed at α = 0.05 significance. Discriminative analysis was used to aid in theprediction of future soil chemical analyses for areas affected by CBM co-produceddischarge waters.
SOIL TEXTURE
Analysis of soil physical properties included determination of soil texture (% sand,% silt and % clay). Particle size analysis was performed to determine the soiltexture, using the hydrometer procedure (Gee and Bauder, 1986; Day, 1965). Soiltexture was determined by referencing the soil texture triangle (Tindall and Kunkel,1999).
CBM Water
WATER COLLECTION
Twelve water samples were collected in Juniper Draw for pH, EC and cation anal-yses. Three samples were collected from the CBM discharge waters in the dis-charge channel 7, 23 and 29 m downstream of the discharge wellhead at Reser-voir N. Three samples were collected further downstream of Reservoir N, at 5,90 and 186 m below the man-made road/dike. Three samples were collected at5, 40 and 94 m downstream from Reservoir M in the discharge channel locateddirectly north of the dam. Finally, three samples were obtained in the discharge
EFFECTS OF COAL-BED METHANE DISCHARGE WATERS 41
channel at 5, 17 and 34 m downstream from the man-made dike further north ofReservoir M.
WATER pH, EC, AND CATIONS
pH and electrical conductivity were analyzed from 10–20 mL of water from eachsample using a calibrated Denver Instrument AP50 pH/ion/conductivity meter andstandard buffers. Replicates were taken on every third sample, with means and stan-dard deviation calculated. Descriptive statistics (minimum, maximum, mean andstandard deviation) were computed and recorded. Water samples were filtered in thelaboratory (0.45 µm) and analyzed for Ca, Mg, and Na using ion chromatography.Samples were diluted 1:10 using DI water for analysis. Prior to analysis, an ionchromatograph (IC) was calibrated with standards of 1, 10, 100, and 200 ppm man-ufactured by Fisher Scientific. A blind standard was included for every 10 samplesanalyzed.
Vegetation
VEGETATION SURVEY
Vegetation data, reported by Bergquist et al. (2004), were grouped into percent cover(native, introduced, salt-tolerant) and by density (native, introduced, salt-tolerantand total number) categories. Analysis included percent cover of native species,percent cover of introduced species, and species density. Data for percent cover ofsalt-tolerant species (native and introduced) was computed for this project utilizingthe USDA U.S. Salinity Laboratory Halophyte Database, updated and available on-line (Yenson, 2004). Density was determined by mean number of native species,mean number of introduced species, mean number of salt-tolerant species and totalnumber of all species/density. Vegetation data were analyzed as percent cover andspecies density to provide an assessment of community structure and diversity,respectively.
To assess the vegetation diversity among the treatment sites, statistical anal-ysis (multiple regression) was performed using both mean percent compositionand number of native, introduced and salt-tolerant species. The main goal of thevegetation survey was to determine relations between soil chemistry and vegeta-tion, particularly any effects leading to an increase in dominance of salt-tolerantnative or introduced species, mainly in the affected gullies. Multiple regressionswere computed with each type of vegetation as the dependent variable, includingboth community composition and number of vegetation species, with the three soilchemical properties (SAR, pH and EC) as the independent variables. Results de-termine which independent soil chemical property had the greatest influence onvegetation diversity in the affected versus reference treatment sites.
42 M. STEARNS ET AL.
Statistical Analysis
Statistical analyses were conducted for the soils, vegetation, and water chemistrydata. Descriptive statistics (minimum, maximum, mean and standard deviation)were computed for the soil data for both affected and non-affected soils, and for thewater data above and below the CBM discharge points. To determine any overalleffect of disturbance on exposed soils, including all soil chemical variables, one-way analysis of variance (ANOVA), the Fischer MCT test was used to identify anysignificant differences between the reference (upland and gully) and the affected(upland and gully) sites at α = 0.05. Reference gully, reference upland and theaffected upland site were unaffected by CBM co-produced waters. Affected up-land includes areas affected by CBM construction development, including roadsor fences, but does not include CBM discharge waters. The affected gully includesthose soils submerged by perennial CBM discharge waters.
Multiple regressions were performed with the SAR as the independent variableand pH and EC as the dependent variables in four separate categories: (1) with soils,incorporating all treatment sites (reference and affected), to determine significancebetween the variables, (2) combining the CBM water data from all four channelsdownstream of Reservoirs N and M as discussed earlier (including trends), (3) todetermine significance between the variables in the sediment saturated with CBMco-produced waters taken at the same distance intervals as the water samples, and(4) to determine any significance between the variables incorporating both CBMco-produced waters and the affected sediment.
One-way ANOVA tests were used to determine any statistically significant dif-ferences between relationships (α = 0.05). Categories included plant species com-position (a measure of the plant community structure) and plant species density(an estimate of species diversity) at all reference and affected sites. The followingdependent variables were used for the species composition category: mean percentnative species, mean percent introduced species, and percent salt-tolerant specieswith treatment as the analysis factor. Dependent variables for species density in-cluded mean number of native species, mean number of introduced species, meannumber of salt-tolerant species and mean species count/density. Multiple compar-isons were made to determine which means were significantly different from others;comparisons are represented by alphabet letters illustrated on the vegetation charts(composition and density – Figures 3 and 4).
Multiple regression analyses were performed with the vegetation and soil chem-istry data to determine any significance of independent soil chemical variables(SAR, pH and EC) and vegetation species composition and density at α = 0.05,between reference and affected treatment sites. More specifically, these analyseswere primarily applied to determine any increase in salt-tolerant native or non-nativespecies for each site type. Discriminative analysis was performed with ‘treatment’as the classification factor, including soil chemical parameters for the data to beanalyzed.
EFFECTS OF COAL-BED METHANE DISCHARGE WATERS 43
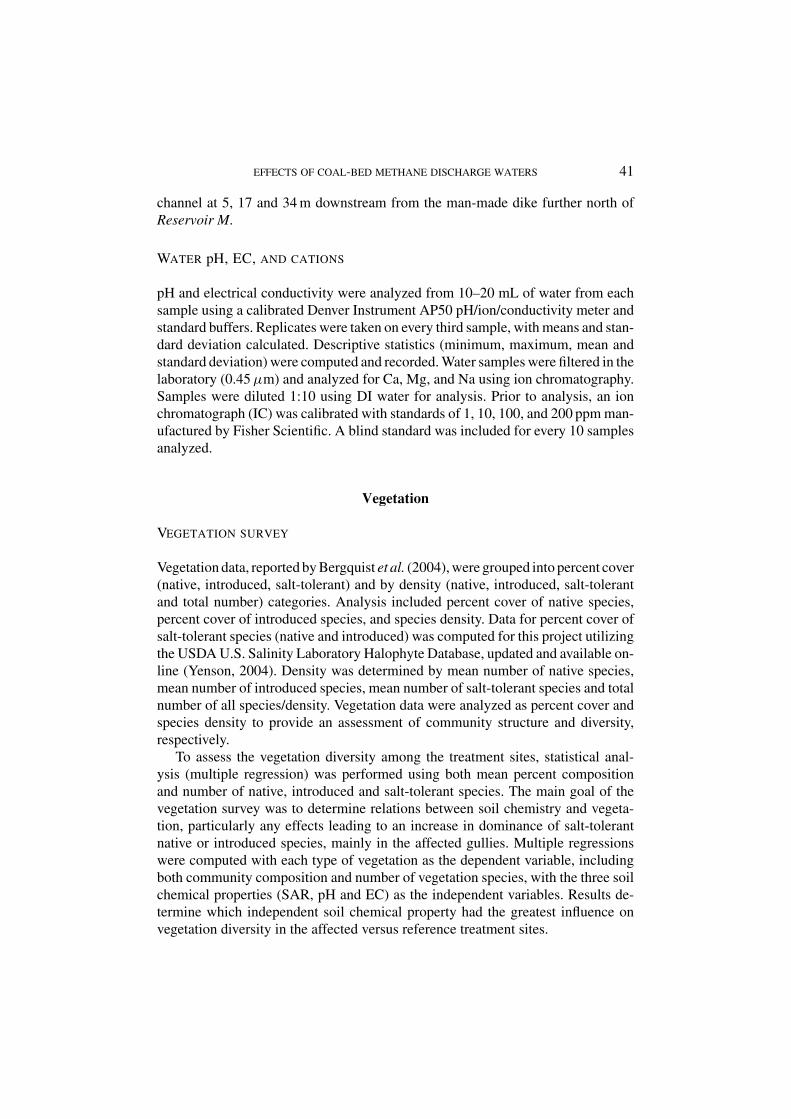
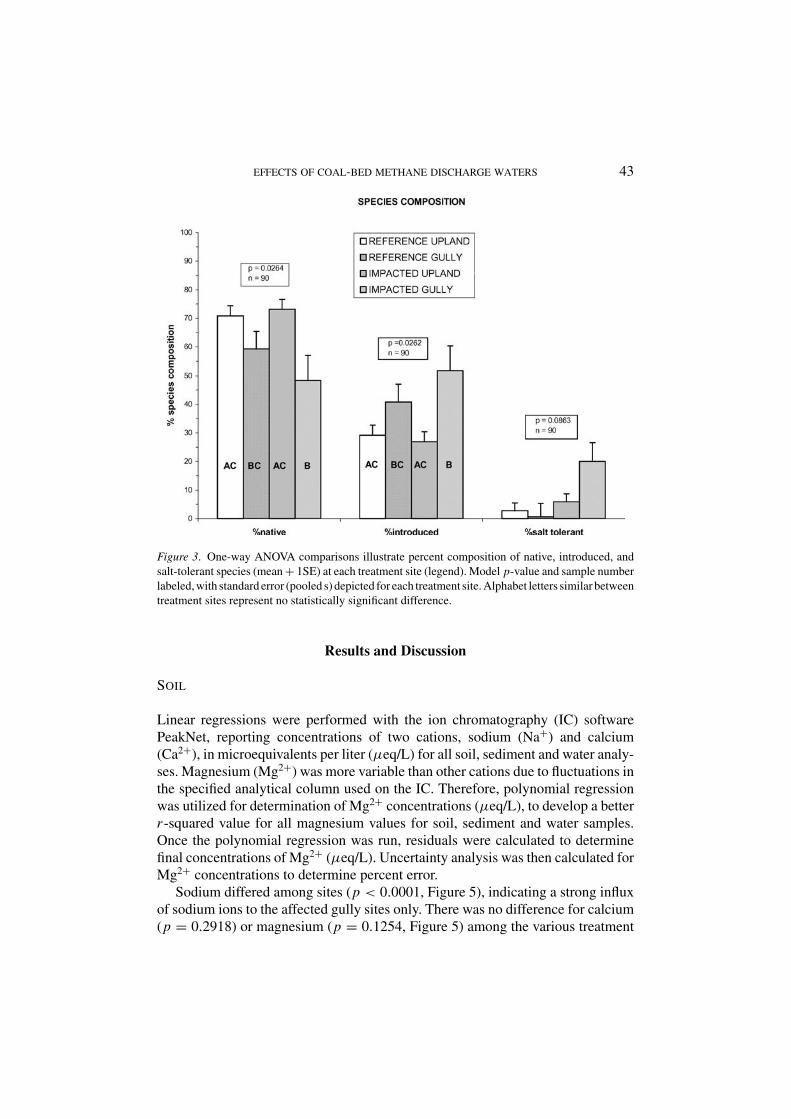
Figure 3. One-way ANOVA comparisons illustrate percent composition of native, introduced, andsalt-tolerant species (mean + 1SE) at each treatment site (legend). Model p-value and sample numberlabeled, with standard error (pooled s) depicted for each treatment site. Alphabet letters similar betweentreatment sites represent no statistically significant difference.
Results and Discussion
SOIL
Linear regressions were performed with the ion chromatography (IC) softwarePeakNet, reporting concentrations of two cations, sodium (Na+) and calcium(Ca2+), in microequivalents per liter (µeq/L) for all soil, sediment and water analy-ses. Magnesium (Mg2+) was more variable than other cations due to fluctuations inthe specified analytical column used on the IC. Therefore, polynomial regressionwas utilized for determination of Mg2+ concentrations (µeq/L), to develop a betterr -squared value for all magnesium values for soil, sediment and water samples.Once the polynomial regression was run, residuals were calculated to determinefinal concentrations of Mg2+ (µeq/L). Uncertainty analysis was then calculated forMg2+ concentrations to determine percent error.
Sodium differed among sites (p < 0.0001, Figure 5), indicating a strong influxof sodium ions to the affected gully sites only. There was no difference for calcium(p = 0.2918) or magnesium (p = 0.1254, Figure 5) among the various treatment
44 M. STEARNS ET AL.
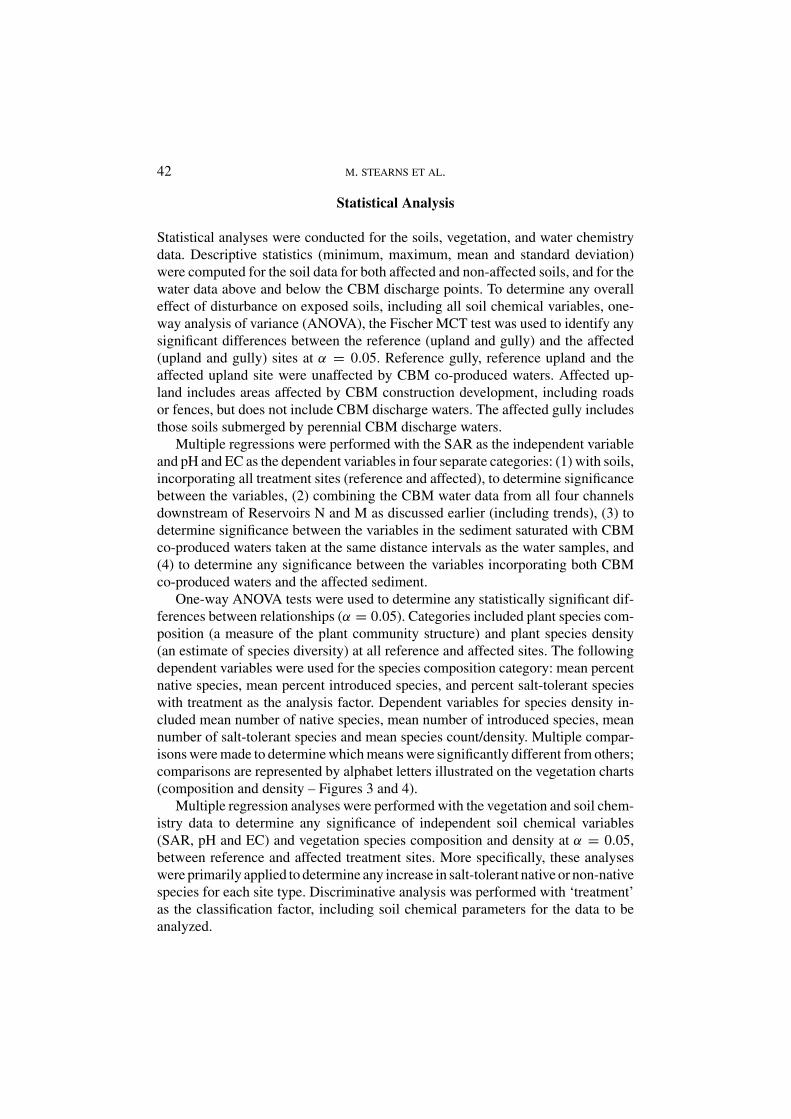
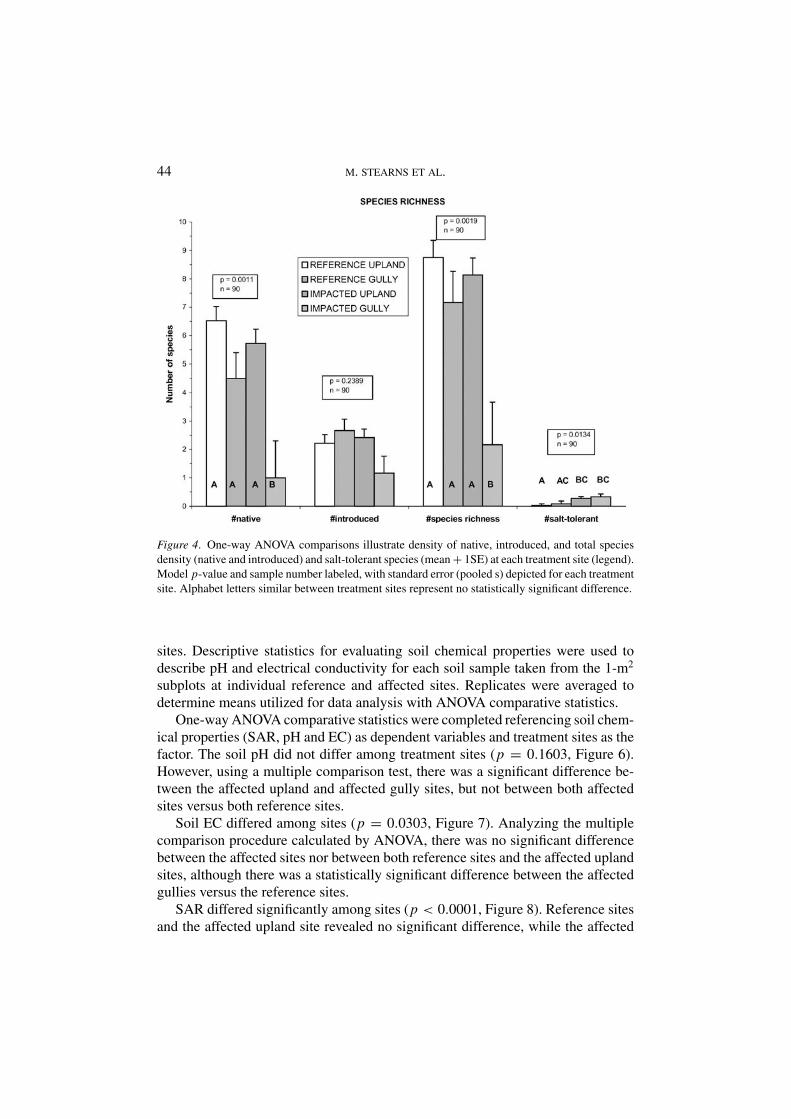
Figure 4. One-way ANOVA comparisons illustrate density of native, introduced, and total speciesdensity (native and introduced) and salt-tolerant species (mean + 1SE) at each treatment site (legend).Model p-value and sample number labeled, with standard error (pooled s) depicted for each treatmentsite. Alphabet letters similar between treatment sites represent no statistically significant difference.
sites. Descriptive statistics for evaluating soil chemical properties were used todescribe pH and electrical conductivity for each soil sample taken from the 1-m2
subplots at individual reference and affected sites. Replicates were averaged todetermine means utilized for data analysis with ANOVA comparative statistics.
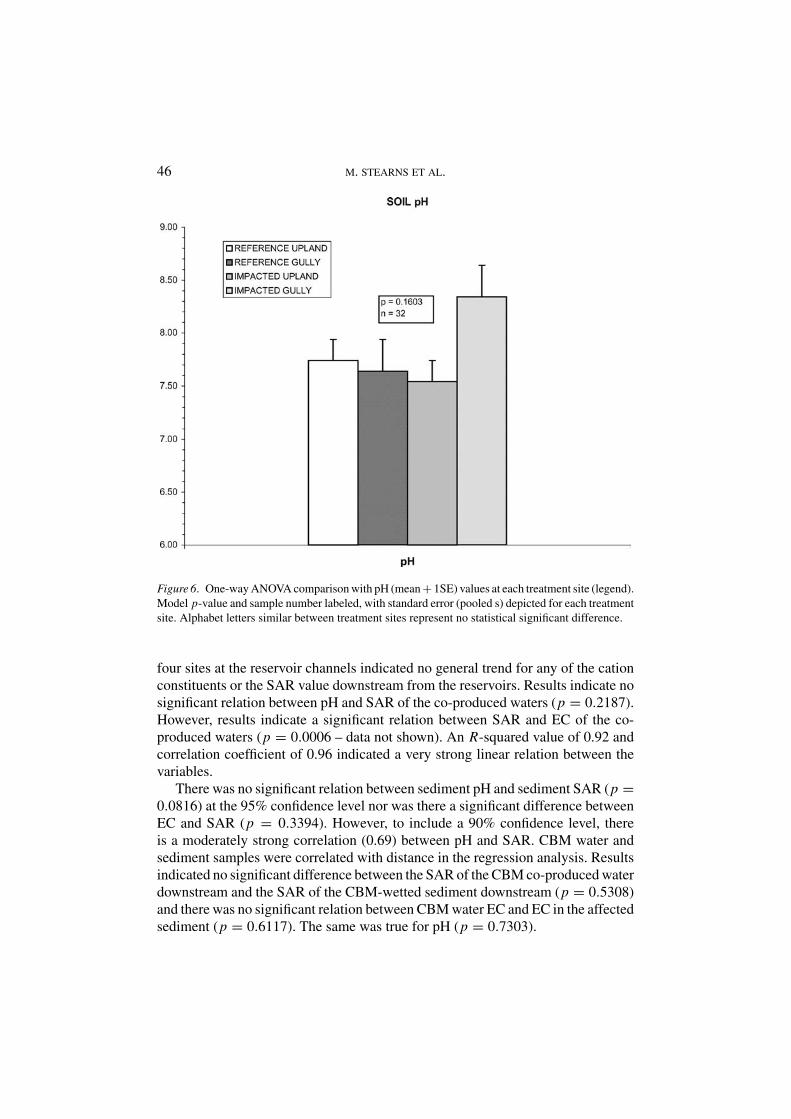
One-way ANOVA comparative statistics were completed referencing soil chem-ical properties (SAR, pH and EC) as dependent variables and treatment sites as thefactor. The soil pH did not differ among treatment sites (p = 0.1603, Figure 6).However, using a multiple comparison test, there was a significant difference be-tween the affected upland and affected gully sites, but not between both affectedsites versus both reference sites.
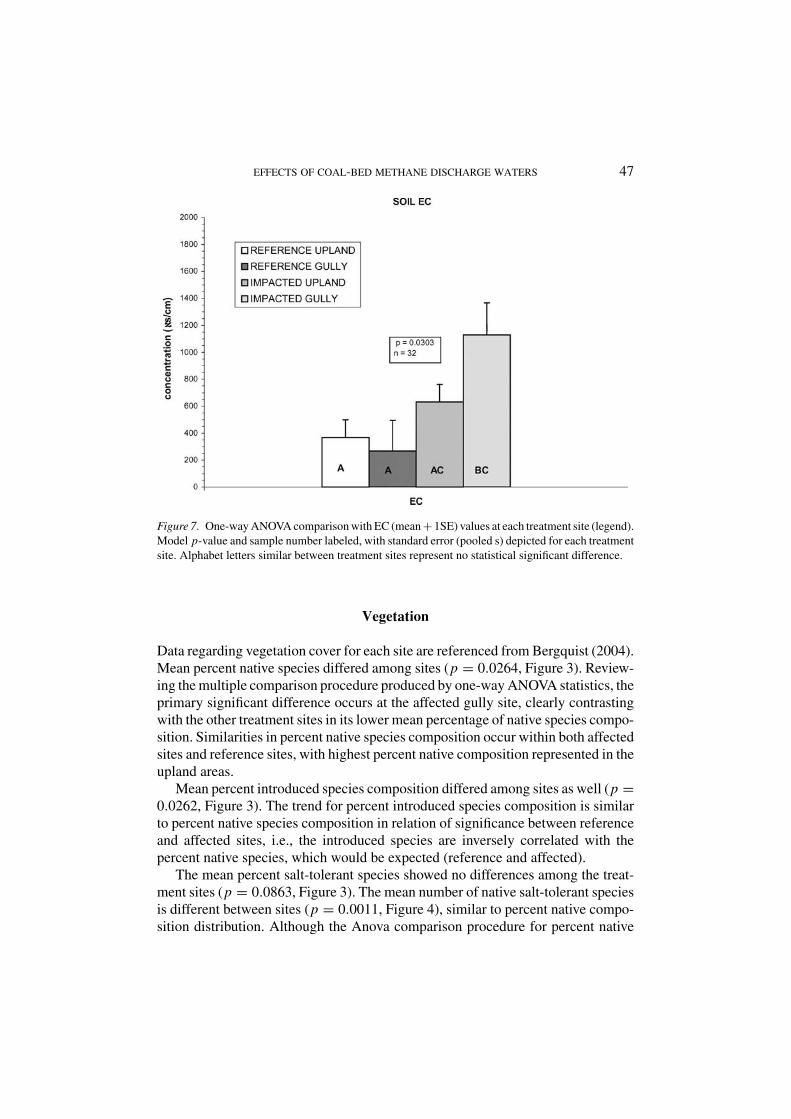
Soil EC differed among sites (p = 0.0303, Figure 7). Analyzing the multiplecomparison procedure calculated by ANOVA, there was no significant differencebetween the affected sites nor between both reference sites and the affected uplandsites, although there was a statistically significant difference between the affectedgullies versus the reference sites.
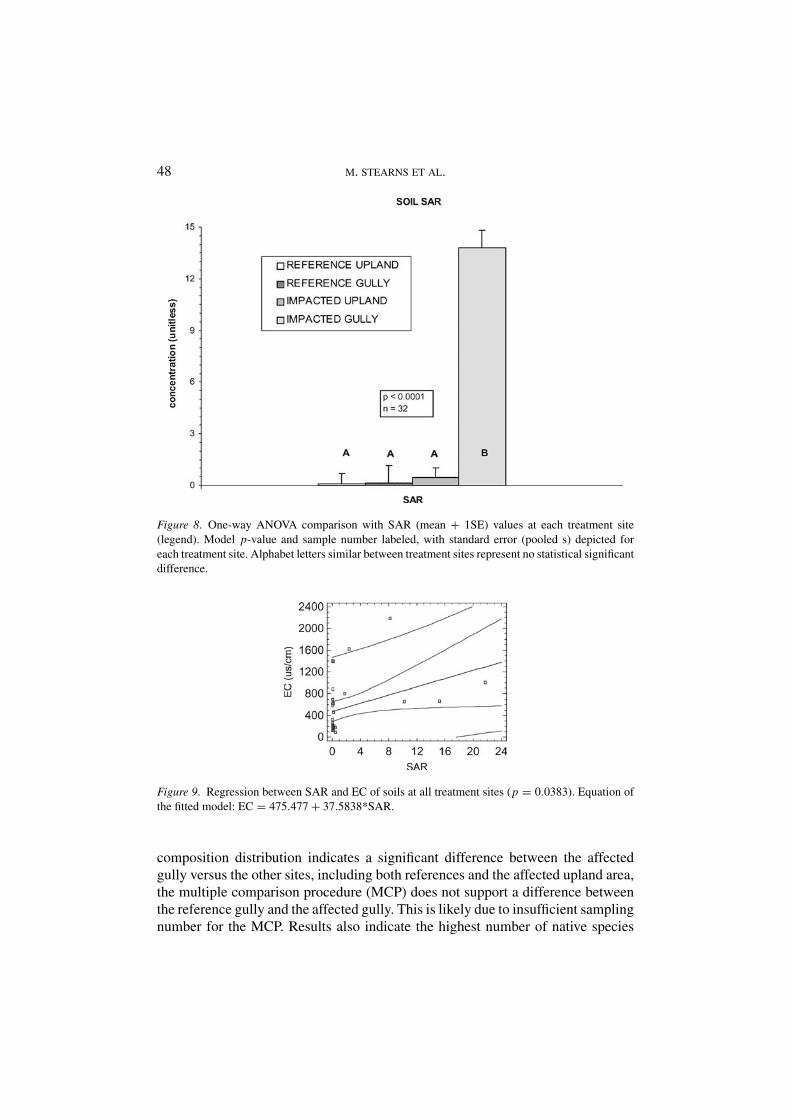
SAR differed significantly among sites (p < 0.0001, Figure 8). Reference sitesand the affected upland site revealed no significant difference, while the affected

EFFECTS OF COAL-BED METHANE DISCHARGE WATERS 45
Figure 5. One-way ANOVA comparison with cation concentration (mean + 1SE) values at eachtreatment site (legend). Model p-value and sample number labeled, with standard error (pooled s) de-picted for each treatment site. Alphabet letters similar between treatment sites represent no statisticallysignificant difference.
gully site was statistically different from both reference sites and the affected uplandsite. Regression with SAR as the independent variable and pH and EC as thedependent variables were run for all soils incorporating all treatment sites (referenceand affected).
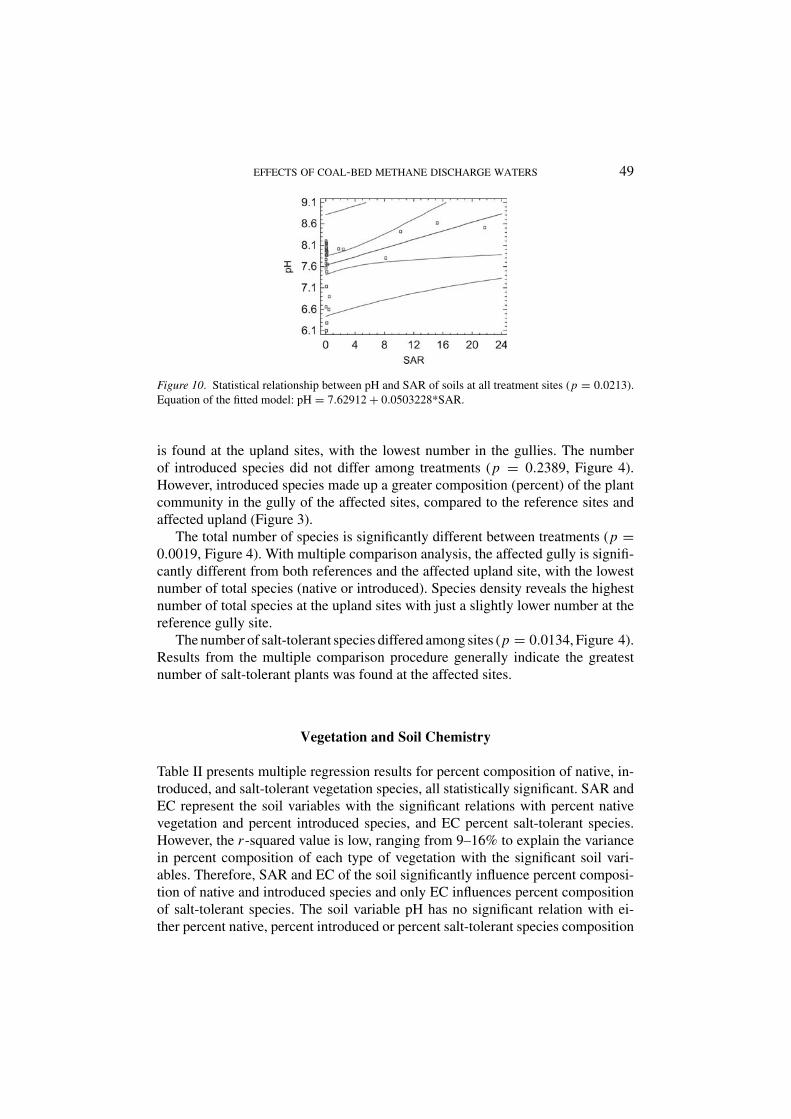
SAR and EC were significantly correlated (p = 0.0383, Figure 9); as SARincreased, the EC of the soil increased. The regression reveals, however, a relativelyweak correlation between the variables (0.38) and explains only approximately14% of the variability in EC (r2 = 13.5%) at all treatment sites. There was asignificant difference between SAR and pH among all treatment sites as well (p =0.0213, Figure 10). However, there was a relatively weak correlation between thevariables (0.41) with r -squared value indicating that SAR explains only 16.5% ofthe variability in pH.
CBM Waters
Descriptive statistics including min, max, mean (x), and standard deviation (σ ) wereused to describe pH and salinity for each water sample taken at various distancesat four affected sites (data not shown). Cations (mmol/L) were calculated in thesame way as the soil cations with replicates averaged, along with SAR values. All
46 M. STEARNS ET AL.
Figure 6. One-way ANOVA comparison with pH (mean + 1SE) values at each treatment site (legend).Model p-value and sample number labeled, with standard error (pooled s) depicted for each treatmentsite. Alphabet letters similar between treatment sites represent no statistical significant difference.
four sites at the reservoir channels indicated no general trend for any of the cationconstituents or the SAR value downstream from the reservoirs. Results indicate nosignificant relation between pH and SAR of the co-produced waters (p = 0.2187).However, results indicate a significant relation between SAR and EC of the co-produced waters (p = 0.0006 – data not shown). An R-squared value of 0.92 andcorrelation coefficient of 0.96 indicated a very strong linear relation between thevariables.
There was no significant relation between sediment pH and sediment SAR (p =0.0816) at the 95% confidence level nor was there a significant difference betweenEC and SAR (p = 0.3394). However, to include a 90% confidence level, thereis a moderately strong correlation (0.69) between pH and SAR. CBM water andsediment samples were correlated with distance in the regression analysis. Resultsindicated no significant difference between the SAR of the CBM co-produced waterdownstream and the SAR of the CBM-wetted sediment downstream (p = 0.5308)and there was no significant relation between CBM water EC and EC in the affectedsediment (p = 0.6117). The same was true for pH (p = 0.7303).
EFFECTS OF COAL-BED METHANE DISCHARGE WATERS 47
Figure 7. One-way ANOVA comparison with EC (mean + 1SE) values at each treatment site (legend).Model p-value and sample number labeled, with standard error (pooled s) depicted for each treatmentsite. Alphabet letters similar between treatment sites represent no statistical significant difference.
Vegetation
Data regarding vegetation cover for each site are referenced from Bergquist (2004).Mean percent native species differed among sites (p = 0.0264, Figure 3). Review-ing the multiple comparison procedure produced by one-way ANOVA statistics, theprimary significant difference occurs at the affected gully site, clearly contrastingwith the other treatment sites in its lower mean percentage of native species compo-sition. Similarities in percent native species composition occur within both affectedsites and reference sites, with highest percent native composition represented in theupland areas.
Mean percent introduced species composition differed among sites as well (p =0.0262, Figure 3). The trend for percent introduced species composition is similarto percent native species composition in relation of significance between referenceand affected sites, i.e., the introduced species are inversely correlated with thepercent native species, which would be expected (reference and affected).
The mean percent salt-tolerant species showed no differences among the treat-ment sites (p = 0.0863, Figure 3). The mean number of native salt-tolerant speciesis different between sites (p = 0.0011, Figure 4), similar to percent native compo-sition distribution. Although the Anova comparison procedure for percent native
48 M. STEARNS ET AL.
Figure 8. One-way ANOVA comparison with SAR (mean + 1SE) values at each treatment site(legend). Model p-value and sample number labeled, with standard error (pooled s) depicted foreach treatment site. Alphabet letters similar between treatment sites represent no statistical significantdifference.
Figure 9. Regression between SAR and EC of soils at all treatment sites (p = 0.0383). Equation ofthe fitted model: EC = 475.477 + 37.5838*SAR.
composition distribution indicates a significant difference between the affectedgully versus the other sites, including both references and the affected upland area,the multiple comparison procedure (MCP) does not support a difference betweenthe reference gully and the affected gully. This is likely due to insufficient samplingnumber for the MCP. Results also indicate the highest number of native species
EFFECTS OF COAL-BED METHANE DISCHARGE WATERS 49
Figure 10. Statistical relationship between pH and SAR of soils at all treatment sites (p = 0.0213).Equation of the fitted model: pH = 7.62912 + 0.0503228*SAR.
is found at the upland sites, with the lowest number in the gullies. The numberof introduced species did not differ among treatments (p = 0.2389, Figure 4).However, introduced species made up a greater composition (percent) of the plantcommunity in the gully of the affected sites, compared to the reference sites andaffected upland (Figure 3).
The total number of species is significantly different between treatments (p =0.0019, Figure 4). With multiple comparison analysis, the affected gully is signifi-cantly different from both references and the affected upland site, with the lowestnumber of total species (native or introduced). Species density reveals the highestnumber of total species at the upland sites with just a slightly lower number at thereference gully site.
The number of salt-tolerant species differed among sites (p = 0.0134, Figure 4).Results from the multiple comparison procedure generally indicate the greatestnumber of salt-tolerant plants was found at the affected sites.
Vegetation and Soil Chemistry
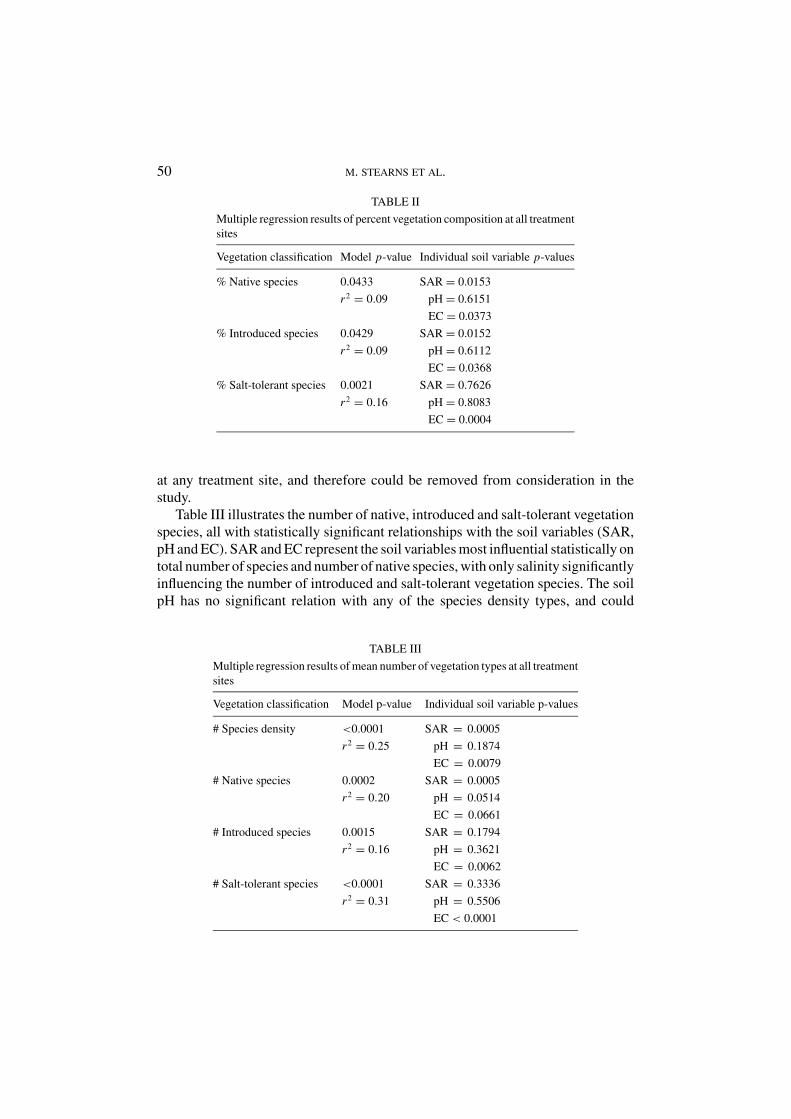
Table II presents multiple regression results for percent composition of native, in-troduced, and salt-tolerant vegetation species, all statistically significant. SAR andEC represent the soil variables with the significant relations with percent nativevegetation and percent introduced species, and EC percent salt-tolerant species.However, the r -squared value is low, ranging from 9–16% to explain the variancein percent composition of each type of vegetation with the significant soil vari-ables. Therefore, SAR and EC of the soil significantly influence percent composi-tion of native and introduced species and only EC influences percent compositionof salt-tolerant species. The soil variable pH has no significant relation with ei-ther percent native, percent introduced or percent salt-tolerant species composition
50 M. STEARNS ET AL.
TABLE II
Multiple regression results of percent vegetation composition at all treatmentsites
Vegetation classification Model p-value Individual soil variable p-values
% Native species 0.0433 SAR = 0.0153
r 2 = 0.09 pH = 0.6151
EC = 0.0373
% Introduced species 0.0429 SAR = 0.0152
r 2 = 0.09 pH = 0.6112
EC = 0.0368
% Salt-tolerant species 0.0021 SAR = 0.7626
r 2 = 0.16 pH = 0.8083
EC = 0.0004
at any treatment site, and therefore could be removed from consideration in thestudy.
Table III illustrates the number of native, introduced and salt-tolerant vegetationspecies, all with statistically significant relationships with the soil variables (SAR,pH and EC). SAR and EC represent the soil variables most influential statistically ontotal number of species and number of native species, with only salinity significantlyinfluencing the number of introduced and salt-tolerant vegetation species. The soilpH has no significant relation with any of the species density types, and could
TABLE III
Multiple regression results of mean number of vegetation types at all treatmentsites
Vegetation classification Model p-value Individual soil variable p-values
# Species density <0.0001 SAR = 0.0005
r 2 = 0.25 pH = 0.1874
EC = 0.0079
# Native species 0.0002 SAR = 0.0005
r 2 = 0.20 pH = 0.0514
EC = 0.0661
# Introduced species 0.0015 SAR = 0.1794
r 2 = 0.16 pH = 0.3621
EC = 0.0062
# Salt-tolerant species <0.0001 SAR = 0.3336
r 2 = 0.31 pH = 0.5506
EC < 0.0001
EFFECTS OF COAL-BED METHANE DISCHARGE WATERS 51
be removed from the regression model. The r -squared values were much highercompared to percent composition of vegetation, ranging from 20–30% to explainthe variability in number, or density, of each type of vegetation with the significantsoil variables.
Discriminant Analysis
A multivariate method was utilized to define or distinguish the soil variables (SAR,pH, EC, Na+, Ca2+, and Mg2+) between four ‘treatment’ sites including referenceupland, reference gully, affected upland and affected gully. The affected gully wasthe only treatment site directly affected by the CBM co-produced water. ‘Treatment’was the classification factor used to group the observations. The data included allsoil variables, including the independent submerged sediment samples taken inconjunction with the water sampling, to accurately depict which soil variables havethe greatest influence on the soil chemistry in Juniper Draw Basin.
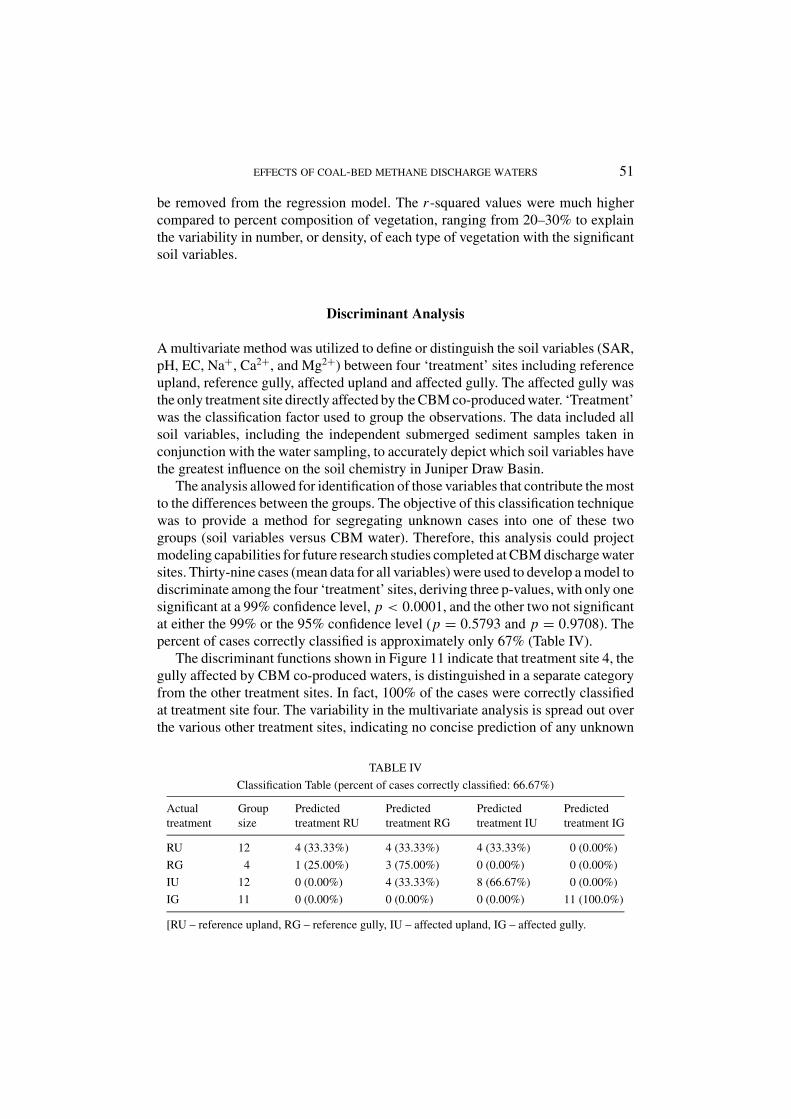
The analysis allowed for identification of those variables that contribute the mostto the differences between the groups. The objective of this classification techniquewas to provide a method for segregating unknown cases into one of these twogroups (soil variables versus CBM water). Therefore, this analysis could projectmodeling capabilities for future research studies completed at CBM discharge watersites. Thirty-nine cases (mean data for all variables) were used to develop a model todiscriminate among the four ‘treatment’ sites, deriving three p-values, with only onesignificant at a 99% confidence level, p < 0.0001, and the other two not significantat either the 99% or the 95% confidence level (p = 0.5793 and p = 0.9708). Thepercent of cases correctly classified is approximately only 67% (Table IV).
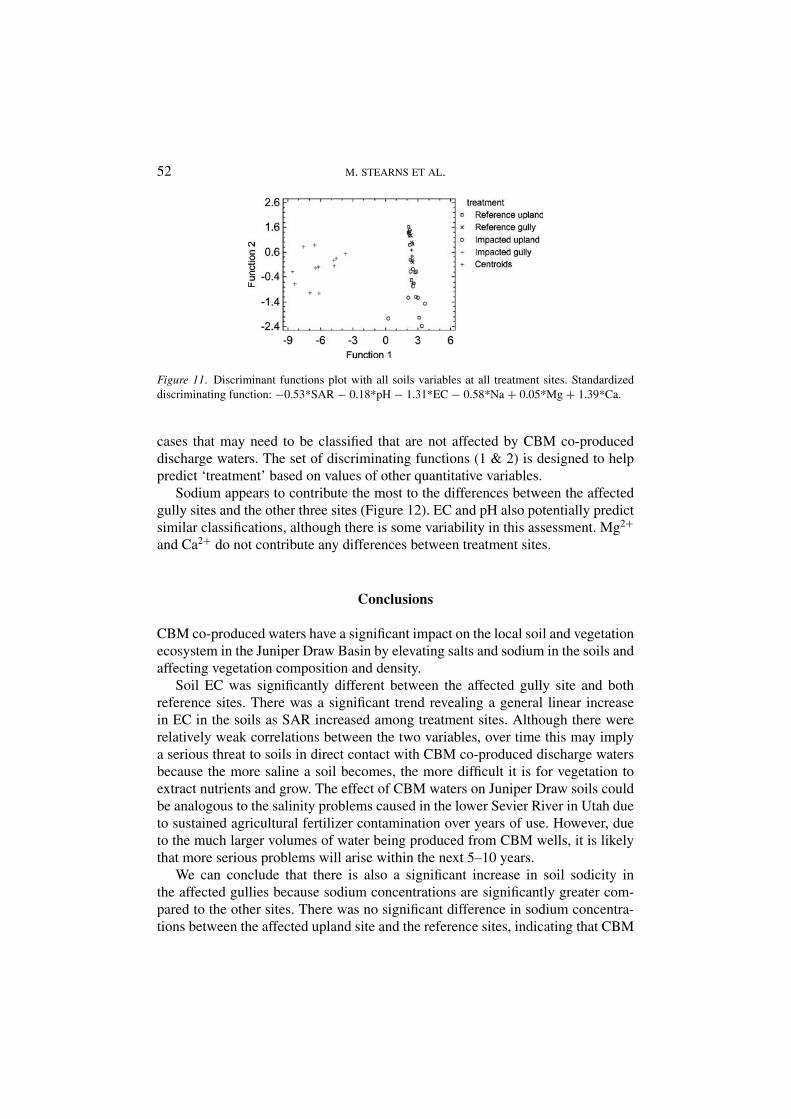
The discriminant functions shown in Figure 11 indicate that treatment site 4, thegully affected by CBM co-produced waters, is distinguished in a separate categoryfrom the other treatment sites. In fact, 100% of the cases were correctly classifiedat treatment site four. The variability in the multivariate analysis is spread out overthe various other treatment sites, indicating no concise prediction of any unknown
TABLE IV
Classification Table (percent of cases correctly classified: 66.67%)
Actual Group Predicted Predicted Predicted Predictedtreatment size treatment RU treatment RG treatment IU treatment IG
RU 12 4 (33.33%) 4 (33.33%) 4 (33.33%) 0 (0.00%)
RG 4 1 (25.00%) 3 (75.00%) 0 (0.00%) 0 (0.00%)
IU 12 0 (0.00%) 4 (33.33%) 8 (66.67%) 0 (0.00%)
IG 11 0 (0.00%) 0 (0.00%) 0 (0.00%) 11 (100.0%)
[RU – reference upland, RG – reference gully, IU – affected upland, IG – affected gully.
52 M. STEARNS ET AL.
Figure 11. Discriminant functions plot with all soils variables at all treatment sites. Standardizeddiscriminating function: −0.53*SAR − 0.18*pH − 1.31*EC − 0.58*Na + 0.05*Mg + 1.39*Ca.
cases that may need to be classified that are not affected by CBM co-produceddischarge waters. The set of discriminating functions (1 & 2) is designed to helppredict ‘treatment’ based on values of other quantitative variables.
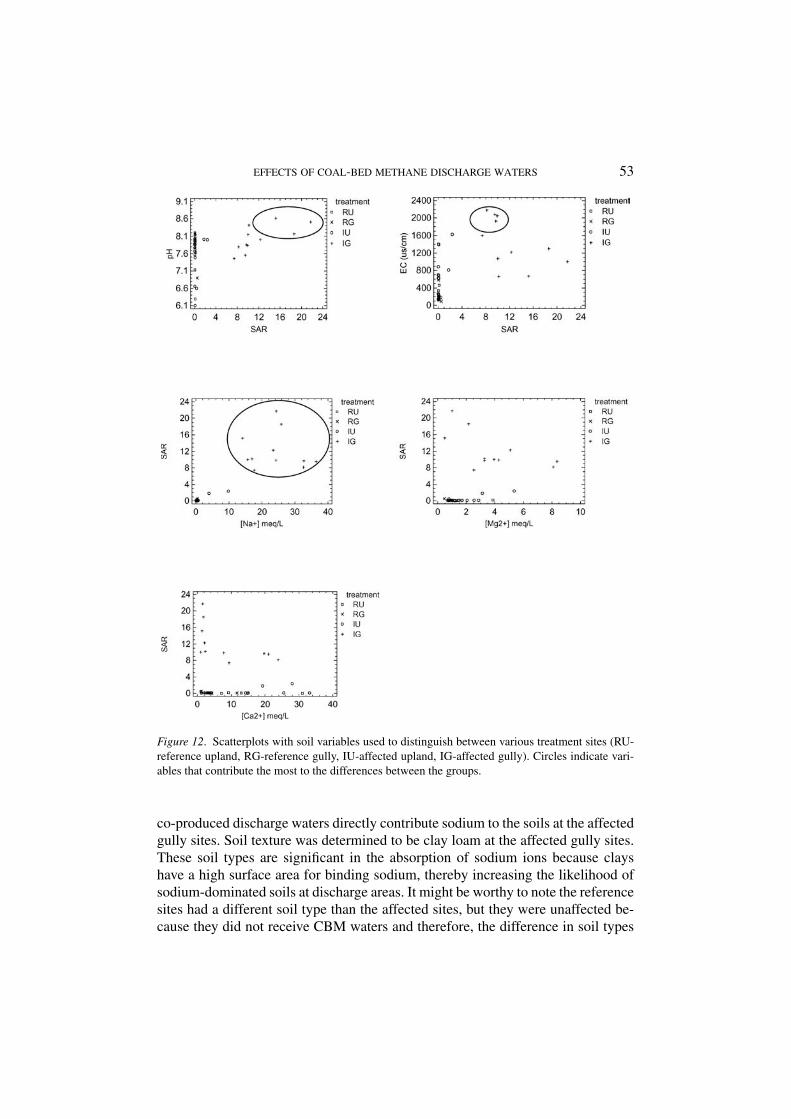
Sodium appears to contribute the most to the differences between the affectedgully sites and the other three sites (Figure 12). EC and pH also potentially predictsimilar classifications, although there is some variability in this assessment. Mg2+
and Ca2+ do not contribute any differences between treatment sites.
Conclusions
CBM co-produced waters have a significant impact on the local soil and vegetationecosystem in the Juniper Draw Basin by elevating salts and sodium in the soils andaffecting vegetation composition and density.
Soil EC was significantly different between the affected gully site and bothreference sites. There was a significant trend revealing a general linear increasein EC in the soils as SAR increased among treatment sites. Although there wererelatively weak correlations between the two variables, over time this may implya serious threat to soils in direct contact with CBM co-produced discharge watersbecause the more saline a soil becomes, the more difficult it is for vegetation toextract nutrients and grow. The effect of CBM waters on Juniper Draw soils couldbe analogous to the salinity problems caused in the lower Sevier River in Utah dueto sustained agricultural fertilizer contamination over years of use. However, dueto the much larger volumes of water being produced from CBM wells, it is likelythat more serious problems will arise within the next 5–10 years.
We can conclude that there is also a significant increase in soil sodicity inthe affected gullies because sodium concentrations are significantly greater com-pared to the other sites. There was no significant difference in sodium concentra-tions between the affected upland site and the reference sites, indicating that CBM
EFFECTS OF COAL-BED METHANE DISCHARGE WATERS 53
Figure 12. Scatterplots with soil variables used to distinguish between various treatment sites (RU-reference upland, RG-reference gully, IU-affected upland, IG-affected gully). Circles indicate vari-ables that contribute the most to the differences between the groups.
co-produced discharge waters directly contribute sodium to the soils at the affectedgully sites. Soil texture was determined to be clay loam at the affected gully sites.These soil types are significant in the absorption of sodium ions because clayshave a high surface area for binding sodium, thereby increasing the likelihood ofsodium-dominated soils at discharge areas. It might be worthy to note the referencesites had a different soil type than the affected sites, but they were unaffected be-cause they did not receive CBM waters and therefore, the difference in soil types
54 M. STEARNS ET AL.
does not bias these results. We could postulate however, that should these soiltypes receive CBM waters, since they have a lower CEC, would eventually becomeas impacted as the affected gully sites with time (US Salinity Laboratory Staff,1954).
The affected gully site differed from all other treatment sites in having the highestsoil SAR values. The mean soil SAR values ranged from 7–22 at the affectedgully and channel sites, indicating a moderate to severe sodic hazard to the soils.These high SAR values appear to be influenced and elevated by the CBM co-produced waters, which have SAR values ranging from 26–35. The SAR hazardindex indicates that a SAR value >13 poses significant threats to the soil ecosystem,causing dispersion of soils, thereby making it extremely difficult for vegetation rootsto penetrate the soil and extract water or nutrients. In fact, a study completed byMace and Amrhein (2001) found that even lower water SAR values, between 5 and8, indicated an irreversible plugging of soil pores and internal swelling, resultingin adverse affects to the soil structure. Consequently, the high CBM water SARvalues directly threaten the health of the local soil and vegetation ecosystem byconcentrating increased amounts of sodium in the soils. Elevated SAR values affectsoil stability, and high concentrations of sodium are toxic to various vegetationspecies, both of which may affect local plant community density, diversity andsustainability.
Vegetation analysis indicated greatest species richness (native and introduced)occurred at both reference sites and the affected upland sites; in contrast, low-est numbers of species were found at the affected gully sites. Because CBM co-produced waters affect only the affected gully sites, it can be assumed that dischargewaters have a significant impact on species density in Juniper Draw Basin. Further,EC and SAR values have a significant relationship with species density. This be-comes an increasing concern because local soils affected by CBM waters haveincreases in accumulation of salts and sodium.
With respect to differences in vegetation community structure and diversitybetween native and introduced vegetation in Juniper Draw, native species consis-tently were more abundant at upland areas (reference and affected) while introducedspecies were more abundant compositionally in the gullies (reference and affected),but with highest mean percent at the affected gully site, which was significantlydifferent from the reference upland and affected upland sites. This is an indicationof a potential increase in an introduced species invasion at the CBM water dis-charge channels. There was no significant difference in community compositionalstructure associated with salt-tolerant species among sites (Figure 3); however,salt-tolerant species richness (p = 0.01, Figure 4) was generally higher at theaffected sites, with a trend toward greatest mean at the affected gully site. Withan increase in composition of introduced species, it is evident that the introducedspecies are probably able to invade because they can tolerate increasing salineand sodic-soil conditions. The introduced species, predominantly common yarrow(Achillea millefolium) with some nettleleaf goosefoot (Chenopodium murale), are
EFFECTS OF COAL-BED METHANE DISCHARGE WATERS 55
all salt tolerant. At the affected upland sites, there was an even distribution betweennative greasewood (Sarcobatus vermiculatus), and introduced common yarrow,salt-tolerant species. The reference upland sites contained only the native salt-tolerant species greasewood, whereas the reference gullies were spotted with theintroduced salt-tolerant species common yarrow.
CBM discharge waters revealed extremely high SAR values (26–30) and highEC concentrations (>3000 µs/cm). As a result, the co-produced waters dischargingin the Juniper Draw Basin can be termed ‘saline-sodic’ waters. There was no generaltrend for increasing or decreasing values of SAR of the water downstream in thechannel. As the SAR values in the water increased, there was a significant increasein EC, yet no significant increase in pH. This increase resulted from a spatialdifference in water chemistry between the Reservoir M and N sites.
Using a 90% confidence level there is a significant relation between increasingpH and increasing SAR in the affected sediment, which suggests that CBM dis-charge waters are more sodic than saline, because increasing salt concentrationstypically decrease pH in soils through displacement of hydrogen and aluminumby the cations in solution, hydrolyzing the aluminum ion (Phelps and Bauder,forthcoming). Simple regression with sediment salinity and sediment SAR illus-trated no significant relation between the variables, indicating that the submergedsoils are more sodic than saline. However, there was no significant correlationbetween SAR and pH in the CBM water or in the affected sediment sampleddownstream in the channels. This implies that there is no general trend down-stream in increasing sediment chemical properties resulting from the CBM water.Assuming there is an impact to the sediments with increases in salinity and sod-icity when comparing to other treatment sites, a greater sample size at furtherdistances down channel is needed for a more accurate prediction of significantrelations.
These results do indicate the possibility of significant impact of CBM dischargewaters on both soils and vegetation in Powder River Basin, but are not conclusive andtherefore, substantiate the call for further research in this area. Also, as the numberof CBM wells increases, the number of affected areas will also increase, probablyin a dramatic fashion due to the number of wells currently planned. Currently, theWyoming Department of Environmental Quality is inundated with CBM dischargepermits because of the continued increase in development of methane extraction.As production of CBM continues, substantial threats to the soil, vegetation, andsurrounding environment will become more pronounced. Although BLM has anenvironmental impact statement (EIS) that has been heavily scrutinized in regardto protecting the environment, attempts to manage CBM water-quality have beencomplicated and expensive (reverse osmosis, aeration techniques for removal ofmetals, and impoundments/reservoirs). Additionally, current regulations are limitedand confusing, and with continuing development, there is a critical need for adequatemonitoring and management of CBM discharge waters. It is urgent that this researchbe continued.
56 M. STEARNS ET AL.
Acknowledgement
Special thanks to Rick Healy and the Unsaturated Zone Field Studies Group,National Research Program, U.S. Geological Survey, Denver, Colorado. Also toTimberley Roane, Dept. Biology, Univ. Colorado at Denver and Paul Evangelistaand Nate Alley at NREL, Colorado State University, Ft. Collins, Colorado.
References
Ayers, R. S.: 1976, ‘Water quality for agriculture’, Food and Agriculture Organization of the UnitedNations 29, 1–97.
Bartos, T. T. and Ogle, K. M.: 2002, Water Quality and Environmental Isotopic Analyses of Ground-Water Samples Collected from the Wasatch and Fort Union Formations in Areas of CoalbedMethane Development – Implications to Recharge and Ground-Water Flow, Eastern PowderRiver Basin, Wyoming. Water-Resources Investigations Report 02-4045. U.S. Department of theInterior. U.S. Geological Survey (USGS).
Bashkin, M., Stohlgren, T. J., Otsuki, Y., Lee, M., Evangelista, P. and Belnap, J.: 2003, ‘Soil character-istics and plant exotic species invasions in the Grand Staircase – Escalante National Monument,Utah, USA’, Applied Soil Ecology 22, 67–77.
Bergquist, E., Evangelista, P., Stohlgren, T. J. and Alley, N.: 2004, Invasive Species and Coal BedMethane Development in the Powder River Basin, Wyoming. Submitted to BLM Jan 04, 27pp. Ab-stract online, http://lamar.colostate.edu/∼ecosym/ SubmittedAbstracts2004.html, accessed June22, 2005.
Bergquist, E.: 2003, Vegetative Survey Quantifying the Effects of Large-Scale Coalbed MethaneDevelopment on Native and Non-Native Flora in the Powder River Basin, Wyoming. M.S. Thesis(forthcoming), Dept. of Natural Resource Ecology Laboratory, Colorado State University. FortCollins, CO.
Bureau of Land Management (BLM): 2002, Final Environmental Impact Statement and ProposedPlan Amendment for the Powder River Basin Oil and Gas Project. United States Department ofthe Interior. WY-070-02-065. Buffalo Field Office, WY.
CBS News 60 Minutes: 2005, Showdown in Wyoming over Gas. Aired February 6 as special report.Internet url: (http://www.cbsnews.com/stories/2005/01/11/60II/main666150.shtml). CBS News60 Minutes, CBS Broadcasting, Inc. 524 W. 57th St., New York, NY, 10019.
Chaudhari, S. K.: 2001, ‘Saturated hydraulic conductivity, dispersion, swelling and exchangeablesodium percentage of different textured soils as influenced by water quality’, Community of SoilScience and Plant Analysis 32(15/16), 2439–2455.
Day, P. R.: 1965, ‘Particle fractionation and particle size analysis’, in C. A. Black, F. E. Clark, L.G. Ensmiger, D. D. Evans and J. L. White (eds), Methods of Soil Analysis, Part I, Madison, WI.American Society of Agronomy, pp. 454–567.
Flores, R., Stricker, G., Meyer, J., Doll, T., Norton P. Jr., Livingston, R. and Jennings, M.C.: 2001,A Field Conference on Effects of Coalbed Methane Development in the Powder River Basin,Wyoming. USGS Denver, CO. Open-File Report 01–126.
Foth, H. D., Withee, L. V., Jacobs, H. S. and Thien, S.J.: 1977, Laboratory Manual for IntroductorySoil Science (4th ed), WM.C. Brown Company Publishers, Dubuque, Iowa.
Gee, G. W. and Bauder, J. W.: 1986, Methods of Soil Analysis, Part 1, Physical and MineralogicalMethods, Second Edition, Soil Science Society of America Book Series. American Society ofAgronomy, Inc. and Soil Science Society of America, Inc. Madison, Wisconsin. pp. 404–410.
EFFECTS OF COAL-BED METHANE DISCHARGE WATERS 57
Horpestad, A.: 2001a, Water Quality Criteria for Irrigation in CBM Areas, Montana Dept. of Envi-ronmental Quality (DEQ) Report. http://www.deq.state.mt.us/, pp. 1–13.
Horpestad, A.: 2001b, Water Quality Analysis of the Effects of CBM Produced Water on Soils, CropYields and Aquatic Life, Montana DEQ Report. http://www.deq.state.mt.us/, pp. 1–8.
Horpestad, A., Skaar, D. and Dawson, H.: 2001, Water Quality Effects from Coalbed Methane De-velopment in the Powder River Basin, Wyoming and Montana, Water Quality Technical Report.http://www.deq.state.mt.us/, pp. 1–45.
Mace, J. E. and Amrhein, C.: 2001, ‘Leaching and reclamation of a soil irrigated with moderate SARwaters’, Soil Science Society of America Journal 65(1), 199–209.
National Resource Conservation Service (NRCS): 2002, Field Book for Describing and SamplingSoils. National Soil Survey Center. United States Department of Agriculture (USDA).
Page, A. L., Miller, R. H. and Keeney, D. R.: 1982, Methods of Soil Analysis – Part 2 – Chemical andMicrobiological Properties (2nd ed), Agronomy: NO.9, Part 2. American Society of Agronomy,Inc. and Soil Science Society of America, Inc., Madison, WI.
Phelps, S. D. and Bauder, J. W.: forthcoming, The Role of Plants in Bioremediation of Coal BedMethane Product Water.
Powder River Basin Resource Council: 2003, Coalbed Methane Gas Wyoming-PowderRiverBasin.org. http://www.powderriverbasin.org.
Rice, C. A., Ellis, M. S. and Jr. Bullock, J. H.: 2000. Water Co-produced with Coalbed Methanein the Powder River Basin, Wyoming: Preliminary compositional data. USGS Open-File Report00–372.
Schneider, T. J.: 2001, Coalbed Methane Produced Water Reinjection, Montana Public Service Com-mission, Report. http://www.deq.state.mt.us/, pp. 1–10.
Soil Survey Division Staff: 1993, Soil Survey Manual, Soil Conservation Service. U.S. Departmentof Agriculture (USDA) handbook 18.
Tindall, J. A. and Kunkel, J. R.: 1999, Unsaturated Zone Hydrology for Scientists and Engineers,Prentice-Hall, Inc. NJ.
U.S. Salinity Laboratory Staff: 1954, Diagnosis and Improvement of Saline and Alkali Soils. USDAAgriculture Handbook No. 60. U.S. Govt. Printing Office, Washington, DC.
U.S. Geological Survey (USGS): 2000, Water Produced with Coal-bed Methane. USGS Fact SheetFS-156-00, http://www.usgs.gov, pp. 1–2.
U.S. Geological Survey (USGS): 2001, ‘Coal-bed gas resources of the rocky mountain region’, USGSFact Sheet FS-110-01, http://www.usgs.gov, p. 1–2.
Wild, Alan (ed).: 1988, Russell’s Soil Conditions and Plant Growth (11th ed), Longman Scientific &Technical, UK. Co-publisher, JohnWiley & Sons, Inc., NY.
Yenson, N. P.: 2004, Halophyte Database: Salt-Tolerant Plants and Their Uses, USDA, ARS,U.S. Salinity Laboratory, and Nypa International, http://www.ussl.ars.usda.gov/pls/caliche/Halophyte.quer
Top Related
Copyright © 2022 FDOKUMEN

