


Bahasa
Halaman
Hukum

Effect of Transmission Setting and Mixed SpeciesInfections on Clinical Measures of Malaria in MalawiMarian C. Bruce1*, Allan Macheso2, Louise A. Kelly-Hope3, Standwell Nkhoma4, Alex McConnachie5,
Malcolm E. Molyneux3,4
1 Division of Infection and Immunity, Institute of Biomedical and Life Sciences, Glasgow Biomedical Research Centre, Glasgow University, Glasgow, United Kingdom,
2 Ministry of Health and Population, Government of Malawi, Lilongwe, Malawi, 3 Liverpool School of Tropical Medicine, University of Liverpool, Liverpool, United Kingdom,
4 Malawi-Liverpool-Wellcome Trust Clinical Research Programme, College of Medicine, Blantyre, Malawi, 5 Robertson Centre for Biostatistics, Glasgow University,
University Avenue, Glasgow, United Kingdom
Abstract
Background: In malaria endemic regions people are commonly infected with multiple species of malaria parasites but theclinical impact of these Plasmodium co-infections is unclear. Differences in transmission seasonality and transmissionintensity between endemic regions have been suggested as important factors in determining the effect of multiple speciesco-infections.
Principal Findings: In order to investigate the impact of multiple-species infections on clinical measures of malaria wecarried out a cross-sectional community survey in Malawi, in 2002. We collected clinical and parasitological data from 2918participants aged .6 months, and applied a questionnaire to measure malaria morbidity. We examined the effect oftransmission seasonality and intensity on fever, history of fever, haemoglobin concentration ([Hb]) and parasite density, bycomparing three regions: perennial transmission (PT), high intensity seasonal transmission (HIST) and low intensity seasonaltransmission (LIST). These regions were defined using multi-level modelling of PCR prevalence data and spatial and geo-climatic measures. The three Plasmodium species (P. falciparum, P. malariae and P. ovale) were randomly distributedamongst all children but not adults in the LIST and PT regions. Mean parasite density in children was lower in the HISTcompared with the other two regions. Mixed species infections had lower mean parasite density compared with singlespecies infections in the PT region. Fever rates were similar between transmission regions and were unaffected by mixedspecies infections. A history of fever was associated with single species infections but only in the HIST region. Reducedmean [Hb] and increased anaemia was associated with perennial transmission compared to seasonal transmission. Childrenwith mixed species infections had higher [Hb] in the HIST region.
Conclusions: Our study suggests that the interaction of Plasmodium co-infecting species can have protective effects againstsome clinical outcomes of malaria but that this is dependent on the seasonality and intensity of malaria transmission.
Citation: Bruce MC, Macheso A, Kelly-Hope LA, Nkhoma S, McConnachie A, et al. (2008) Effect of Transmission Setting and Mixed Species Infections on ClinicalMeasures of Malaria in Malawi. PLoS ONE 3(7): e2775. doi:10.1371/journal.pone.0002775
Editor: Colin J. Sutherland, London School of Hygiene & Tropical Medicine, United Kingdom
Received February 15, 2008; Accepted June 20, 2008; Published July 23, 2008
Copyright: � 2008 Bruce et al. This is an open-access article distributed under the terms of the Creative Commons Attribution License, which permitsunrestricted use, distribution, and reproduction in any medium, provided the original author and source are credited.
Funding: This research was funded by a Wellcome Trust Junior Biodiversity Fellowship to Marian Bruce, Reference 060446.
Competing Interests: The authors have declared that no competing interests exist.
* E-mail: [email protected]
Introduction
Infection with multiple Plasmodium species is common in malaria
endemic regions. It has been suggested that interactions between
different species, in conjunction with differences in seasonality and
intensity of malaria transmission may underlie variation in the
epidemiology and clinical presentation of malaria [1]. Of the four
human malaria species, Plasmodium falciparum causes the greatest
morbidity and mortality but most malaria endemic regions are co-
endemic for some or all of the other three human species: P. malariae,
P. vivax and P. ovale. Individually, these species cause less severe
morbidity and fewer deaths than P. falciparum but they are
commonly found as co-infections with P. falciparum [2,3]. The effect
of multiple species co-infections on the clinical outcomes of malaria
is unclear. Most clinical surveys of malaria focus on P. falciparum
without reference to the potential effects of co-infecting species.
Only a few studies have documented the effects of co-infection
on uncomplicated clinical malaria [4–9]. Prior or co-infection with
P. malariae has been implicated in protecting against fevers caused
by P. falciparum in children in Cote d’Ivoire [4] and in reducing the
density of asexual stages and preventing fevers in Tanzanian
children [5]. These epidemiological studies of P. malariae are
supported by experimental data from malaria-therapy infections in
humans carried out in the 1940’s, in which prior infection with P.
malariae reduced fever caused by P. falciparum [6]. Prior P. vivax
infection reduced morbidity from subsequent P. falciparum
infections in Vanuatu [7] and in Papua New Guinea, prior
infection with P. vivax or P. malariae protected against P. falciparum
fevers [8]. In contrast to these reports of the protective clinical
effects of co-infection, an adverse effect has been described in at
least one report; carriage of multiple species was associated with
greater levels of anaemia than single-species infections in Nigerian
PLoS ONE | www.plosone.org 1 July 2008 | Volume 3 | Issue 7 | e2775
children [9]. As well as affecting clinical outcome, interactions
between co-infecting species can modify the within-host dynamics
of co-infecting malaria parasites [10,11] and alter the transmission
potential of human hosts [12] thereby impacting on the
epidemiology of malaria.
In this study we examined the relationship of Plasmodium co-
infections and clinical measures of malaria under different
epidemiological conditions. We compared two districts of Malawi
with perennial (Mangochi) and seasonal (Dedza) malaria trans-
mission and examined the effect of transmission intensity by
comparing two distinct transmission regions within Dedza District.
We used PCR detection of parasites to examine the prevalence
and age-distribution of multiple Plasmodium species in these diverse
regions. In Malawi, as in most of sub-Saharan Africa, the most
common sympatric malaria combination is P. falciparum, P. malariae
and P. ovale. Previous studies using PCR diagnosis have
demonstrated that the prevalence of P. malariae and P. ovale are
greatly underestimated by microscopy especially when these are
present in mixed infections with P. falciparum [13–16]. We
investigated the associations between mixed-species infections
and fever, history of fever, haemoglobin concentrations and
Plasmodium densities, to determine how carriage of multiple
Plasmodium species relates to clinical outcomes of malaria.
Materials and Methods
Study sites and populationThe study was carried out between March and April 2002 in
two districts of Malawi: Dedza in Central Region (14u229South
34u199East) and Mangochi in Southern Region (14u289South
35u159East). Dedza district lies in a mountainous, semi-forested
region at an altitude of .1000 m on the Rift Valley escarpment,
bordering Mozambique. Mangochi lies 100 km to the east of
Dedza, adjacent to the south western shore of Lake Nyasa, at a
lower altitude of approximately 500 m. Annual rainfall is
approximately 900 mm in both districts, with the rainy season
November–March, during which .90% of rain falls. Dedza
temperatures range from 10uC to 28uC, humidity 75% in the wet
season and 3uC to 25uC, humidity 60% in the dry season. Annual
mean temperature minima and maxima in Dedza are 7uC lower
than for Mangochi and wet and dry season humidity values are
77% and 58% respectively [17].
The total population of the two districts at the time of the study
was 544,334 for Dedza and 671,102 for Mangochi, within a total
Malawi population of 11 million. Outside of the district towns, the
populations of both districts reside in dispersed rural settlements
where most dwellings are of traditional mud and wood
construction with thatched roofs. The predominant occupation
in both districts is subsistence farming and in villages adjacent to
Lakes Malawi and Malombe, fishing provides additional income.
The predominant ethnic group in Dedza is Chewa, who are part
of the Nyanja group of Bantu, whilst the population in Mangochi
is predominantly of the Yao tribe [18,19].
Malaria transmission in Dedza district is restricted to the wet
season. During the dry season in Dedza, temperature falls below
the minimum for development of Plasmodium in the vector [20,21].
An. arabiensis and An. gambiae s.s. are the major vectors [22]. In
contrast, malaria transmission in Mangochi is perennial. Mosquito
breeding sites are present throughout the year, owing to the
presence of low-lying marshy areas near the lakeshore and the
cultivation of rice. The number of infectious bites per person per
year has been estimated at 27 but this was made in a year where
rainfall in Mangochi was lower than usual [22]. A value of 180
infectious bites per person per year, as measured in other low
altitude areas of Malawi, may be more representative [23].
Although transmission is perennial in Mangochi, the transmission
intensity varies markedly throughout the year owing to seasonal
variation in rainfall, being as much as 6 times greater during the
wet season than the dry. The main vectors are An. gambiae s.l. and
An. funestus [22].
Official statistics show that the number of clinical malaria cases
and malaria deaths were more than three times greater in Mangochi
than in Dedza (annual figures 2004, clinical cases Dedza 116,661,
Mangochi 374,995, deaths Dedza 150, Mangochi 498 [24]).
Retrospective analysis of paediatric ward admission books from
Dedza and Mangochi district hospitals for January–December 2004
(Mangochi n = 1579; Dedza n = 1165) showed that there were also
significant differences in the features of malaria-related admissions
between the two districts. Children admitted with malaria in
Mangochi were younger (Mangochi, mean age 19.4 months,
Dedza, 31.9 months, p,0.0001), had more anaemia diagnoses
(Mangochi, 39.8%; Dedza, 22.4%, p,0.0001) and had more blood
transfusions (Mangochi, 10.3%; Dedza, 4.3%, p,0.0001) than
children in Dedza. Children admitted to hospital for malaria in
Dedza were older, had more cerebral malaria diagnoses (Dedza,
3.1%; Mangochi, 1.7%, p = 0.016) and had higher hospital case
fatality rates (Dedza, 9.6%; Mangochi, 7.3%, p = 0.036) than
children admitted in Mangochi (S. Nkhoma, M. Bruce, M.
Molyneux, unpublished observations).
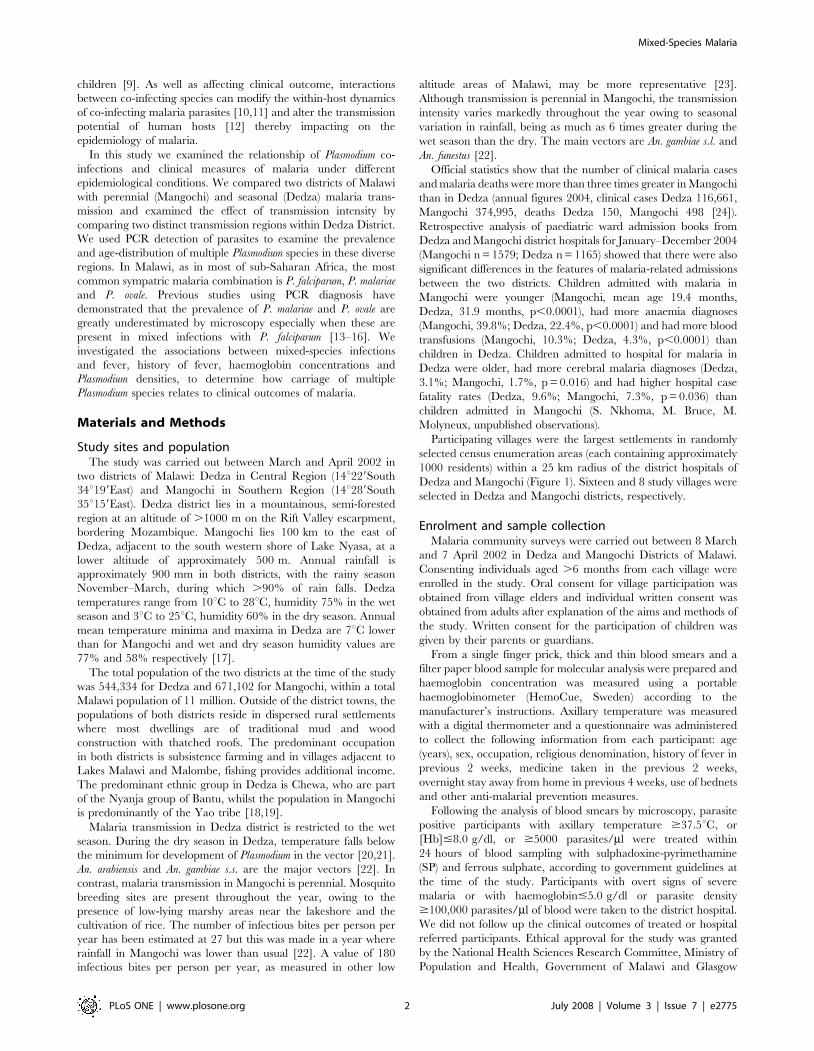
Participating villages were the largest settlements in randomly
selected census enumeration areas (each containing approximately
1000 residents) within a 25 km radius of the district hospitals of
Dedza and Mangochi (Figure 1). Sixteen and 8 study villages were
selected in Dedza and Mangochi districts, respectively.
Enrolment and sample collectionMalaria community surveys were carried out between 8 March
and 7 April 2002 in Dedza and Mangochi Districts of Malawi.
Consenting individuals aged .6 months from each village were
enrolled in the study. Oral consent for village participation was
obtained from village elders and individual written consent was
obtained from adults after explanation of the aims and methods of
the study. Written consent for the participation of children was
given by their parents or guardians.
From a single finger prick, thick and thin blood smears and a
filter paper blood sample for molecular analysis were prepared and
haemoglobin concentration was measured using a portable
haemoglobinometer (HemoCue, Sweden) according to the
manufacturer’s instructions. Axillary temperature was measured
with a digital thermometer and a questionnaire was administered
to collect the following information from each participant: age
(years), sex, occupation, religious denomination, history of fever in
previous 2 weeks, medicine taken in the previous 2 weeks,
overnight stay away from home in previous 4 weeks, use of bednets
and other anti-malarial prevention measures.
Following the analysis of blood smears by microscopy, parasite
positive participants with axillary temperature $37.5uC, or
[Hb]#8.0 g/dl, or $5000 parasites/ml were treated within
24 hours of blood sampling with sulphadoxine-pyrimethamine
(SP) and ferrous sulphate, according to government guidelines at
the time of the study. Participants with overt signs of severe
malaria or with haemoglobin#5.0 g/dl or parasite density
$100,000 parasites/ml of blood were taken to the district hospital.
We did not follow up the clinical outcomes of treated or hospital
referred participants. Ethical approval for the study was granted
by the National Health Sciences Research Committee, Ministry of
Population and Health, Government of Malawi and Glasgow
Mixed-Species Malaria
PLoS ONE | www.plosone.org 2 July 2008 | Volume 3 | Issue 7 | e2775
University Ethics Committee for Non-clinical Research Involving
Human Subjects.
Mapping and Remotely Sensed DataVillage location (latitude and longitude) was determined using
ground GPS readings (Etrex 12 channel, Garmin Ltd, Kansas,
USA) and maps were drawn using ArcInfo 9.1 (Environmental
Systems Research Institute, Inc., California, USA). Data on
national boundaries, district hospitals, elevation, forested areas,
water bodies, marshland and tributaries were obtained from
scanned maps [17], datasets and satellite imagery (NASA/
Earthsat 1 km and Global 29 Elevation Data, ETOPO2) available
from Environmental Systems Research Institute, Inc. (ESRI;
Redlands, CA) and public websites (http://earth.google.com/;
http://www.geographynetwork.com). As no climate data were
available, vegetation cover was used as a proxy of greenness (leaf-
top photosynthesis) and precipitation availability [25]. Data were
obtained from Normalised Difference Vegetation Index (NDVI)
values, extracted from MODIS images at 250 m spatial resolution
(NASA. http://modis.gsfc.nasa.gov/). Differences between wet
and dry seasons were examined and based on values from images
14–29 September 2001 (dry season), NDVI 30 September–15
October 2001 (dry season), NDVI 6–21 March 2002 (wet season),
NDVI 22 March–6 April 2002 (wet season).
All epidemiological and environmental data were imported and
geo-referenced in the geographical information system software
ArcInfo 9.1. Maps were drawn showing each village location and
P. falciparum prevalence in relation to district hospitals and key
environmental characteristics. The following geo-climatic vari-
ables were available for each village and extracted for statistical
analysis: elevation, latitude, longitude, distance from district
hospital, mean dry season NDVI, mean wet season NDVI, and
difference between mean wet and dry season NDVI. Additional
analysis in relation to elevation was undertaken by visualising
topographical/contour differences between each village on a 3D
wireframe map created in the surface mapping programme Surfer
7.0 (Golden Software Inc., Golden, CO).
Detection of Plasmodium speciesPrimary malaria diagnosis was carried out within 24 hours of
blood sampling by microscopic examination of thick and thin
blood smears. Blood smears were fixed with methanol (thin smear
only) and stained with giemsa. Smears were initially graded for the
presence/absence of Plasmodium and approximate parasite density,
then parasite density counts per 200 leukocytes were made from
positive smears. Parasite density per ml of blood was calculated
assuming a standard leukocyte count of 8000 per ml of blood. In
order to assess the reproducibility of microscopy, a random
selection of 10% of smears from each district were re-read.
To confirm microscopy results and detect parasites below the
limit of microscopy (around 40 parasites/ml of blood) a retrospec-
tive, species-specific PCR [26,27] was carried out using DNA
extracted from filter paper blood samples, as previously described
[28]. Samples from 3 villages from each district were tested for all 4
human Plasmodium species (P. falciparum, P. vivax, P. malariae and P.
ovale) whilst the remainder were tested only for P. falciparum, P.
malariae and P. ovale. An estimated parasite density of 10 parasites per
ml of blood was assigned per species detected by PCR in those
samples that were microscopy negative. [The value of 10 parasites
per ml is the approximate parasite detection level of PCR. In
microscopy negative samples containing all 3 species detected by
PCR in the study area (P. falciparum, P. malariae and P. ovale) the use of
this estimate results in an density value below the microscopy
sensitivity level of 40 parasites per ml]. To assess the reproducibility
of PCR detection a random selection of 5% of samples from each
district were re-analysed (from the sample DNA extraction) for the
presence of P. falciparum, P. malariae and P. ovale.
Statistical methodsData were analysed using SPSS v10.0 (Chicago, USA). Data for
each district were compared using Pearson’s Chi squared test for
categorical variables and Mann-Whitney U test for continuous
variables. Log10 transformation was carried out to normalise
parasite density data. Univariate and bivariate regression models
(accounting for district and transmission region) were used to
determine which variables were associated with the following
clinical outcomes measured during community surveys: haemo-
globin concentration ([Hb] g/dl), moderate anaemia ([Hb]#
8.0 g/dl) and fever (axillary temperature $37.5uC). Linear
regression was used for [Hb] and logistic regression for the binary
outcomes of anaemia and fever. In the linear regression analyses
continuous variables were included as co-variates whilst categor-
ical variables were included as fixed factors.
Mixed effects logistic regression models were fitted for whether
or not each individual had PCR-detectable infection, using the
statistical software package MIwiN v2.01 (Centre for Multilevel
Figure 1. Location of study areas in Dedza and Mangochi districts. (A) relative to the national and district administrative boundaries ofMalawi and (B) showing enlargement of study region with position of villages (see Table 3 for 3-letter codes) and district hospitals (marked H).doi:10.1371/journal.pone.0002775.g001
Mixed-Species Malaria
PLoS ONE | www.plosone.org 3 July 2008 | Volume 3 | Issue 7 | e2775
Modelling, University of Bristol, UK). The log odds of being
infected was allowed to vary at random between villages and
between households within villages, according to a Normal
distribution. A series of models was fitted: firstly, without
covariates, to estimate the degree of variation between and within
villages; secondly, allowing for individual-level fixed effects of sex
and age (adult vs. child); thirdly, allowing for village-level fixed
effects of elevation above sea level and the mean wet and dry
season normalised difference vegetation index (NDVI) in each
village; and lastly, allowing for both individual- and village-level
fixed effects. Additionally, the final model was refitted allowing for
separate random and fixed effects in each district (Dedza or
Mangochi). For each model, the variation between villages and
between households within villages are reported in terms of the
variance in log odds of being infected, and in terms of the
estimated odds ratio between units (villages or households) at the
75th and 25th percentiles of the assumed distribution of units. Also
reported are the fixed effect estimates, in terms of the associated
odds ratio estimates, with 95% confidence intervals. Finally, for
the model allowing separate fixed and random effects in each
region, p-values are reported for the comparisons of model
parameters between villages.
The multiple-kind lottery model was applied to determine if the
distribution amongst individuals of Plasmodium species (P. falciparum,
P. malariae and P. ovale) detected by PCR, differed from an
independent random distribution [29]. The following categories
were used for analysis of multi-species data: negative, one species,
mixed species (ie .1 species). Data for P. malariae and P. falciparum
were also analysed in the absence of the least prevalent species, P.
ovale (categories: negative, P. malariae only, P. falciparum only, P.
malariae and P. falciparum). We calculated ROE Mixed, ROE Negative or
ROE Pm the ratio of observed/expected (and 95% CI) amongst values
that deviated from expected mixed, negative or P. malariae samples,
as a measure of the magnitude of the deviation from randomness.
In order to evaluate all possible associations between clinical
measurements and the presence of multiple Plasmodium infections
in three transmission settings it has been necessary to use multiple
testing. Unadjusted p values are reported throughout in order not
to obscure possible associations and therefore individual p values
should be interpreted with this in mind.
Results
Clinical measurements and blood samples for parasitological
analysis were collected between March and April 2002, from 2918
participants residing in 16 villages within Dedza District and 8
villages within Mangochi District, Malawi (Figure 1). Demograph-
ic and malaria data obtained by questionnaire were available from
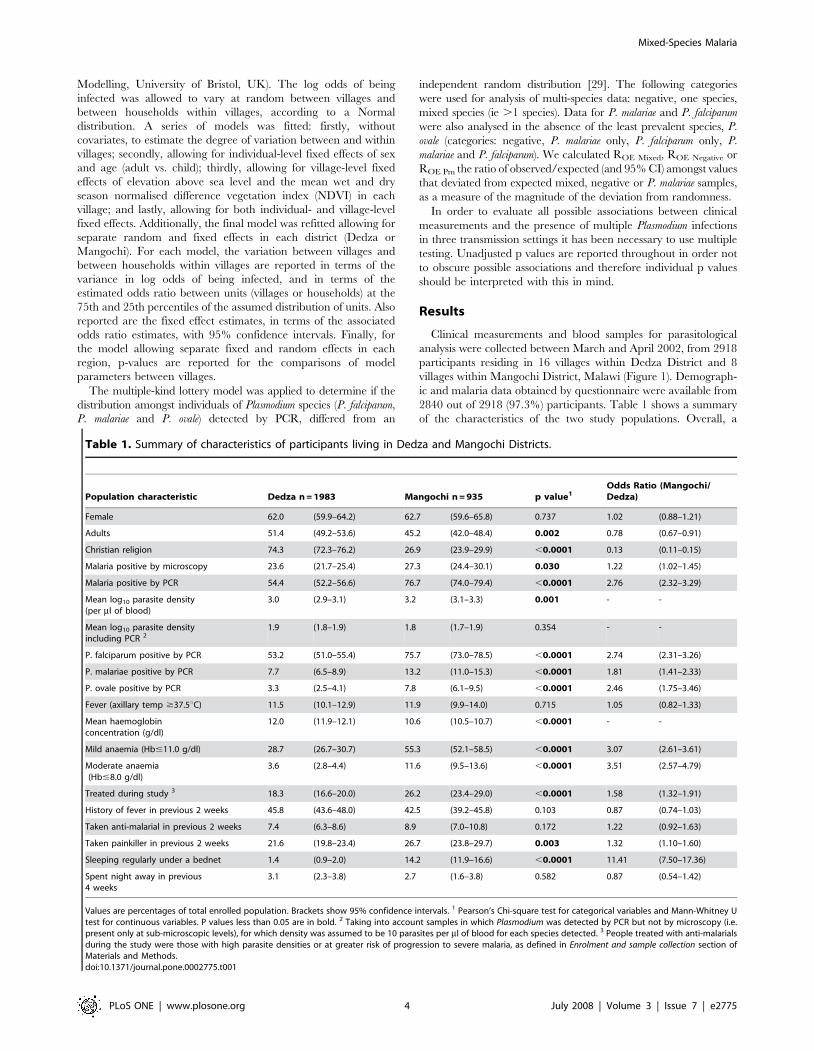
2840 out of 2918 (97.3%) participants. Table 1 shows a summary
of the characteristics of the two study populations. Overall, a
Table 1. Summary of characteristics of participants living in Dedza and Mangochi Districts.
Population characteristic Dedza n = 1983 Mangochi n = 935 p value1Odds Ratio (Mangochi/Dedza)
Female 62.0 (59.9–64.2) 62.7 (59.6–65.8) 0.737 1.02 (0.88–1.21)
Adults 51.4 (49.2–53.6) 45.2 (42.0–48.4) 0.002 0.78 (0.67–0.91)
Christian religion 74.3 (72.3–76.2) 26.9 (23.9–29.9) ,0.0001 0.13 (0.11–0.15)
Malaria positive by microscopy 23.6 (21.7–25.4) 27.3 (24.4–30.1) 0.030 1.22 (1.02–1.45)
Malaria positive by PCR 54.4 (52.2–56.6) 76.7 (74.0–79.4) ,0.0001 2.76 (2.32–3.29)
Mean log10 parasite density(per ml of blood)
3.0 (2.9–3.1) 3.2 (3.1–3.3) 0.001 - -
Mean log10 parasite densityincluding PCR 2
1.9 (1.8–1.9) 1.8 (1.7–1.9) 0.354 - -
P. falciparum positive by PCR 53.2 (51.0–55.4) 75.7 (73.0–78.5) ,0.0001 2.74 (2.31–3.26)
P. malariae positive by PCR 7.7 (6.5–8.9) 13.2 (11.0–15.3) ,0.0001 1.81 (1.41–2.33)
P. ovale positive by PCR 3.3 (2.5–4.1) 7.8 (6.1–9.5) ,0.0001 2.46 (1.75–3.46)
Fever (axillary temp $37.5uC) 11.5 (10.1–12.9) 11.9 (9.9–14.0) 0.715 1.05 (0.82–1.33)
Mean haemoglobinconcentration (g/dl)
12.0 (11.9–12.1) 10.6 (10.5–10.7) ,0.0001 - -
Mild anaemia (Hb#11.0 g/dl) 28.7 (26.7–30.7) 55.3 (52.1–58.5) ,0.0001 3.07 (2.61–3.61)
Moderate anaemia(Hb#8.0 g/dl)
3.6 (2.8–4.4) 11.6 (9.5–13.6) ,0.0001 3.51 (2.57–4.79)
Treated during study 3 18.3 (16.6–20.0) 26.2 (23.4–29.0) ,0.0001 1.58 (1.32–1.91)
History of fever in previous 2 weeks 45.8 (43.6–48.0) 42.5 (39.2–45.8) 0.103 0.87 (0.74–1.03)
Taken anti-malarial in previous 2 weeks 7.4 (6.3–8.6) 8.9 (7.0–10.8) 0.172 1.22 (0.92–1.63)
Taken painkiller in previous 2 weeks 21.6 (19.8–23.4) 26.7 (23.8–29.7) 0.003 1.32 (1.10–1.60)
Sleeping regularly under a bednet 1.4 (0.9–2.0) 14.2 (11.9–16.6) ,0.0001 11.41 (7.50–17.36)
Spent night away in previous4 weeks
3.1 (2.3–3.8) 2.7 (1.6–3.8) 0.582 0.87 (0.54–1.42)
Values are percentages of total enrolled population. Brackets show 95% confidence intervals. 1 Pearson’s Chi-square test for categorical variables and Mann-Whitney Utest for continuous variables. P values less than 0.05 are in bold. 2 Taking into account samples in which Plasmodium was detected by PCR but not by microscopy (i.e.present only at sub-microscopic levels), for which density was assumed to be 10 parasites per ml of blood for each species detected. 3 People treated with anti-malarialsduring the study were those with high parasite densities or at greater risk of progression to severe malaria, as defined in Enrolment and sample collection section ofMaterials and Methods.doi:10.1371/journal.pone.0002775.t001
Mixed-Species Malaria
PLoS ONE | www.plosone.org 4 July 2008 | Volume 3 | Issue 7 | e2775
greater proportion of females than males were enrolled in both
districts (62.0% and 62.7% for Dedza and Mangochi respectively).
This resulted from a deficit in the enrolment of adult males, who
were absent from households because sampling took place during
daylight hours (Table 1). Amongst children, the sex ratio was
equitable between districts (% female children, 52.2% and 51.0%
for Dedza and Mangochi respectively, p = 0.660) but the
proportion of children in the study was greater in Mangochi
(54.8%) than in Dedza (48.6%, Table 1). There was a difference in
the religious denomination of the two populations. Dedza was
predominantly Christian, whilst the majority faith in Mangochi
was Islam, reflecting differences in the geopolitical history in the
two regions.
Relationship of malaria prevalence with geographicalfeatures
The mean prevalence of malaria parasites (any Plasmodium
species) detected by microscopy in the two districts was remarkably
similar during our wet season survey, given the variation in
geography and difference in malaria transmission in the two areas.
In Dedza, where transmission is seasonal, the mean microscopy
prevalence was 23.6% whilst in Mangochi where perennial
transmission occurs, prevalence was only slightly higher, 27.3%,
a difference significant only at the 0.05 level (Table 1). PCR
detection of parasites increased prevalence in Dedza by a factor of
2.3 and in Mangochi by 2.8, giving PCR prevalences of 54.4%
and 76.7% respectively (Table 1). Reproducibility of PCR
detection was 93.8%. Reproducibility of microscopy was 86.4%
for presence/absence of parasites and 79.4% for density grading.
The variation in prevalence observed between villages was greater
in Dedza than in Mangochi when either microscopy (Dedza: range
2.2–58.4%, standard deviation (S.D.) 13.6; Mangochi: range 15.8–
42.3%, S.D. 8.4) or PCR detection was used (Dedza range 17.6–
90.3, S.D. 22.4; Mangochi range 65.5–84.6, S.D. 7.7). Examina-
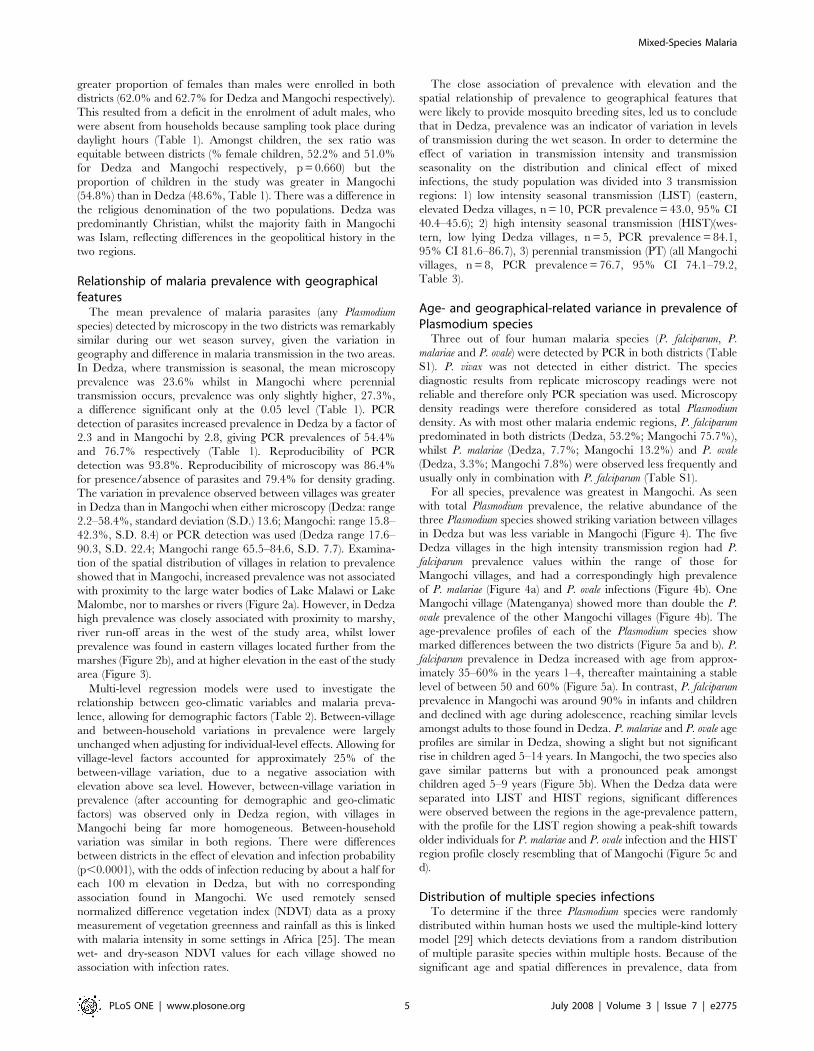
tion of the spatial distribution of villages in relation to prevalence
showed that in Mangochi, increased prevalence was not associated
with proximity to the large water bodies of Lake Malawi or Lake
Malombe, nor to marshes or rivers (Figure 2a). However, in Dedza
high prevalence was closely associated with proximity to marshy,
river run-off areas in the west of the study area, whilst lower
prevalence was found in eastern villages located further from the
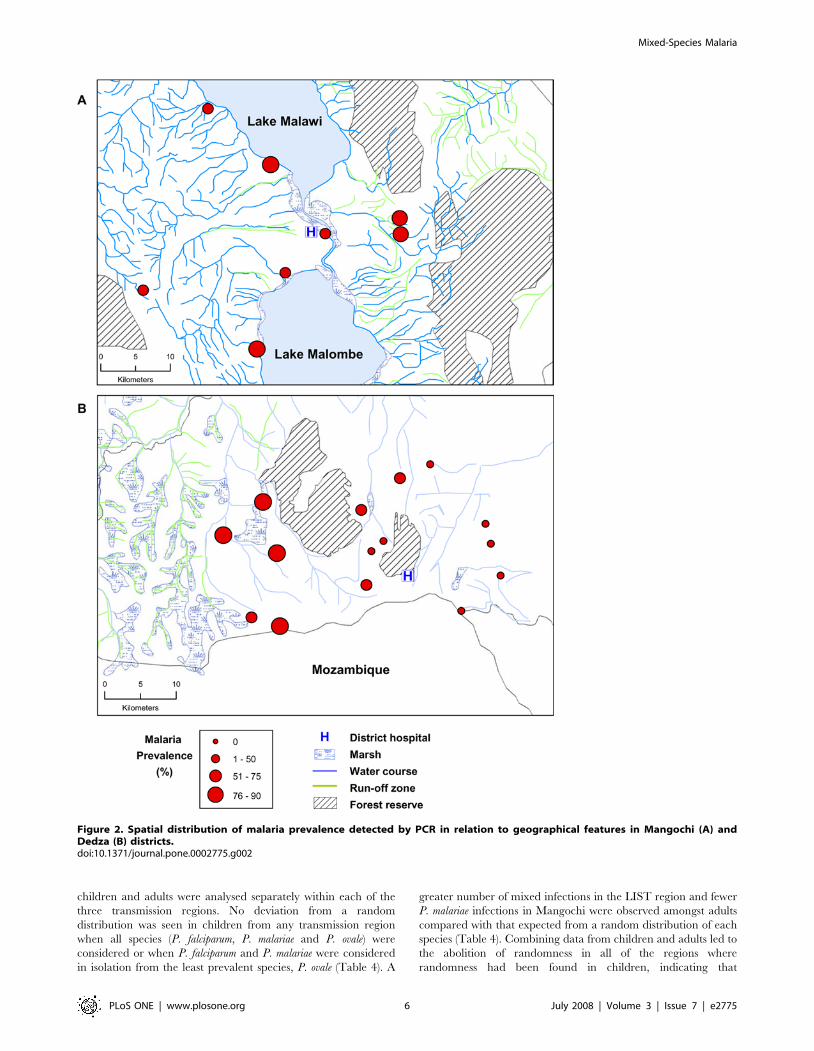
marshes (Figure 2b), and at higher elevation in the east of the study
area (Figure 3).
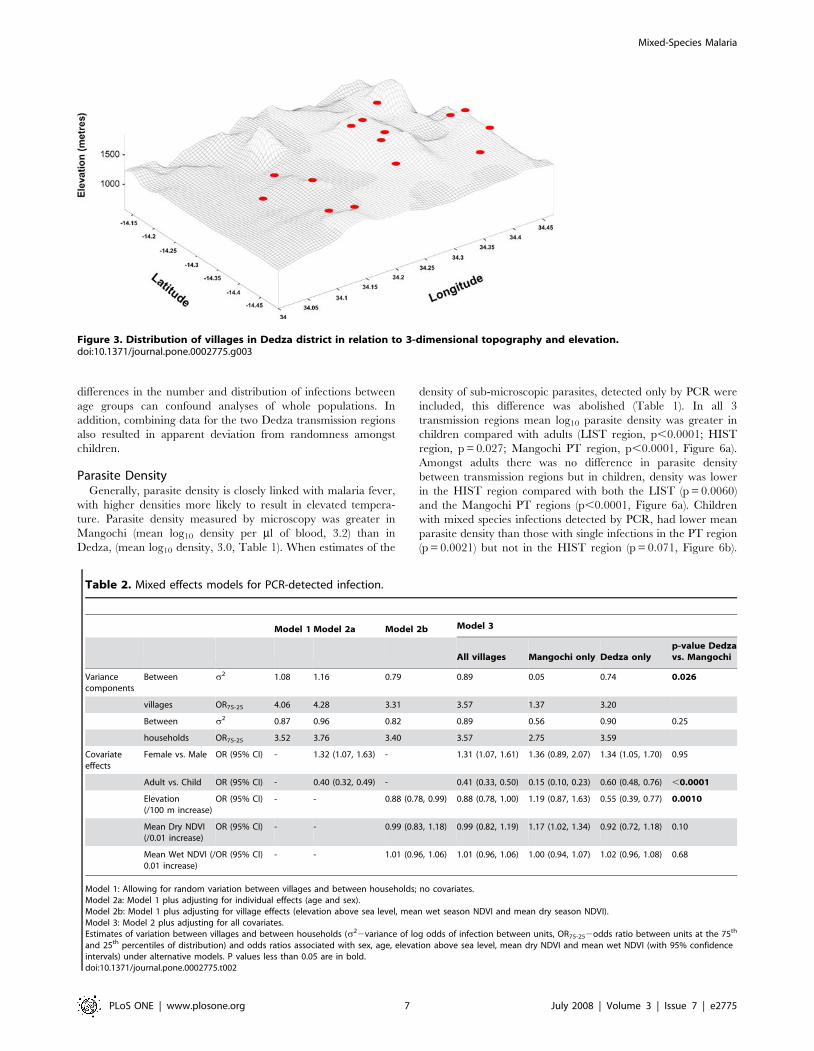
Multi-level regression models were used to investigate the
relationship between geo-climatic variables and malaria preva-
lence, allowing for demographic factors (Table 2). Between-village
and between-household variations in prevalence were largely
unchanged when adjusting for individual-level effects. Allowing for
village-level factors accounted for approximately 25% of the
between-village variation, due to a negative association with
elevation above sea level. However, between-village variation in
prevalence (after accounting for demographic and geo-climatic
factors) was observed only in Dedza region, with villages in
Mangochi being far more homogeneous. Between-household
variation was similar in both regions. There were differences
between districts in the effect of elevation and infection probability
(p,0.0001), with the odds of infection reducing by about a half for
each 100 m elevation in Dedza, but with no corresponding
association found in Mangochi. We used remotely sensed
normalized difference vegetation index (NDVI) data as a proxy
measurement of vegetation greenness and rainfall as this is linked
with malaria intensity in some settings in Africa [25]. The mean
wet- and dry-season NDVI values for each village showed no
association with infection rates.
The close association of prevalence with elevation and the
spatial relationship of prevalence to geographical features that
were likely to provide mosquito breeding sites, led us to conclude
that in Dedza, prevalence was an indicator of variation in levels
of transmission during the wet season. In order to determine the
effect of variation in transmission intensity and transmission
seasonality on the distribution and clinical effect of mixed
infections, the study population was divided into 3 transmission
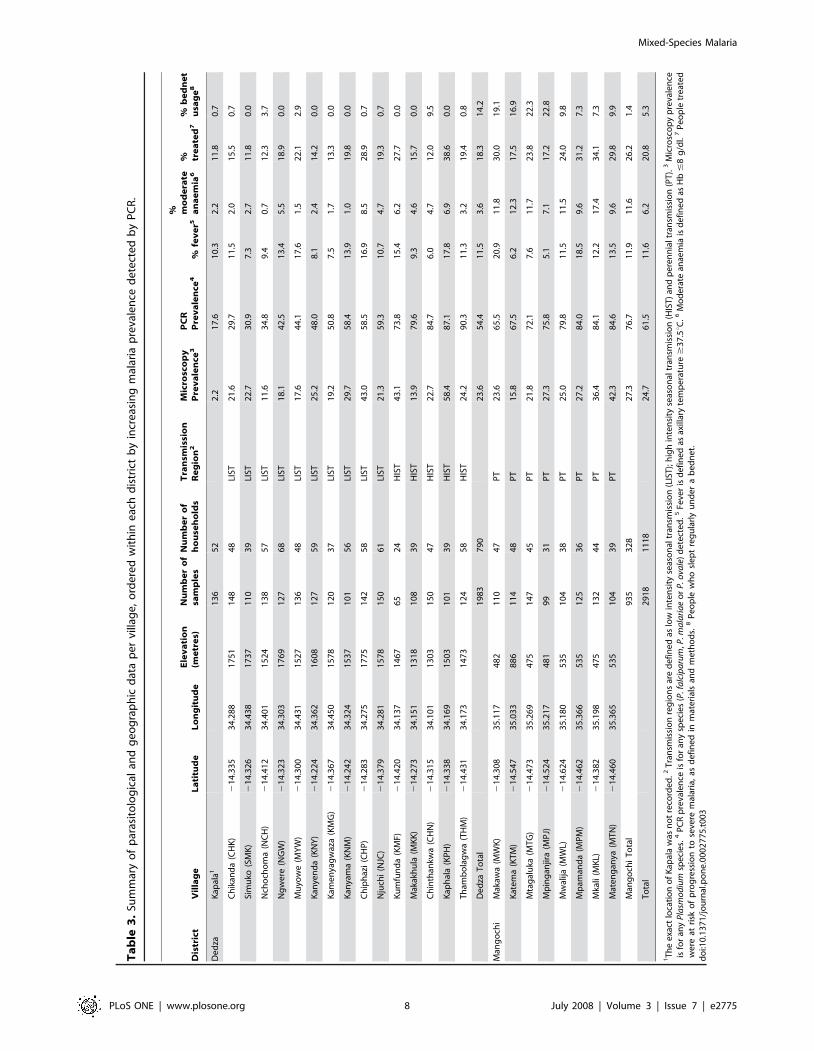
regions: 1) low intensity seasonal transmission (LIST) (eastern,
elevated Dedza villages, n = 10, PCR prevalence = 43.0, 95% CI
40.4–45.6); 2) high intensity seasonal transmission (HIST)(wes-
tern, low lying Dedza villages, n = 5, PCR prevalence = 84.1,
95% CI 81.6–86.7), 3) perennial transmission (PT) (all Mangochi
villages, n = 8, PCR prevalence = 76.7, 95% CI 74.1–79.2,
Table 3).
Age- and geographical-related variance in prevalence ofPlasmodium species
Three out of four human malaria species (P. falciparum, P.
malariae and P. ovale) were detected by PCR in both districts (Table
S1). P. vivax was not detected in either district. The species
diagnostic results from replicate microscopy readings were not
reliable and therefore only PCR speciation was used. Microscopy
density readings were therefore considered as total Plasmodium
density. As with most other malaria endemic regions, P. falciparum
predominated in both districts (Dedza, 53.2%; Mangochi 75.7%),
whilst P. malariae (Dedza, 7.7%; Mangochi 13.2%) and P. ovale
(Dedza, 3.3%; Mangochi 7.8%) were observed less frequently and
usually only in combination with P. falciparum (Table S1).
For all species, prevalence was greatest in Mangochi. As seen
with total Plasmodium prevalence, the relative abundance of the
three Plasmodium species showed striking variation between villages
in Dedza but was less variable in Mangochi (Figure 4). The five
Dedza villages in the high intensity transmission region had P.
falciparum prevalence values within the range of those for
Mangochi villages, and had a correspondingly high prevalence
of P. malariae (Figure 4a) and P. ovale infections (Figure 4b). One
Mangochi village (Matenganya) showed more than double the P.
ovale prevalence of the other Mangochi villages (Figure 4b). The
age-prevalence profiles of each of the Plasmodium species show
marked differences between the two districts (Figure 5a and b). P.
falciparum prevalence in Dedza increased with age from approx-
imately 35–60% in the years 1–4, thereafter maintaining a stable
level of between 50 and 60% (Figure 5a). In contrast, P. falciparum
prevalence in Mangochi was around 90% in infants and children
and declined with age during adolescence, reaching similar levels
amongst adults to those found in Dedza. P. malariae and P. ovale age
profiles are similar in Dedza, showing a slight but not significant
rise in children aged 5–14 years. In Mangochi, the two species also
gave similar patterns but with a pronounced peak amongst
children aged 5–9 years (Figure 5b). When the Dedza data were
separated into LIST and HIST regions, significant differences
were observed between the regions in the age-prevalence pattern,
with the profile for the LIST region showing a peak-shift towards
older individuals for P. malariae and P. ovale infection and the HIST
region profile closely resembling that of Mangochi (Figure 5c and
d).
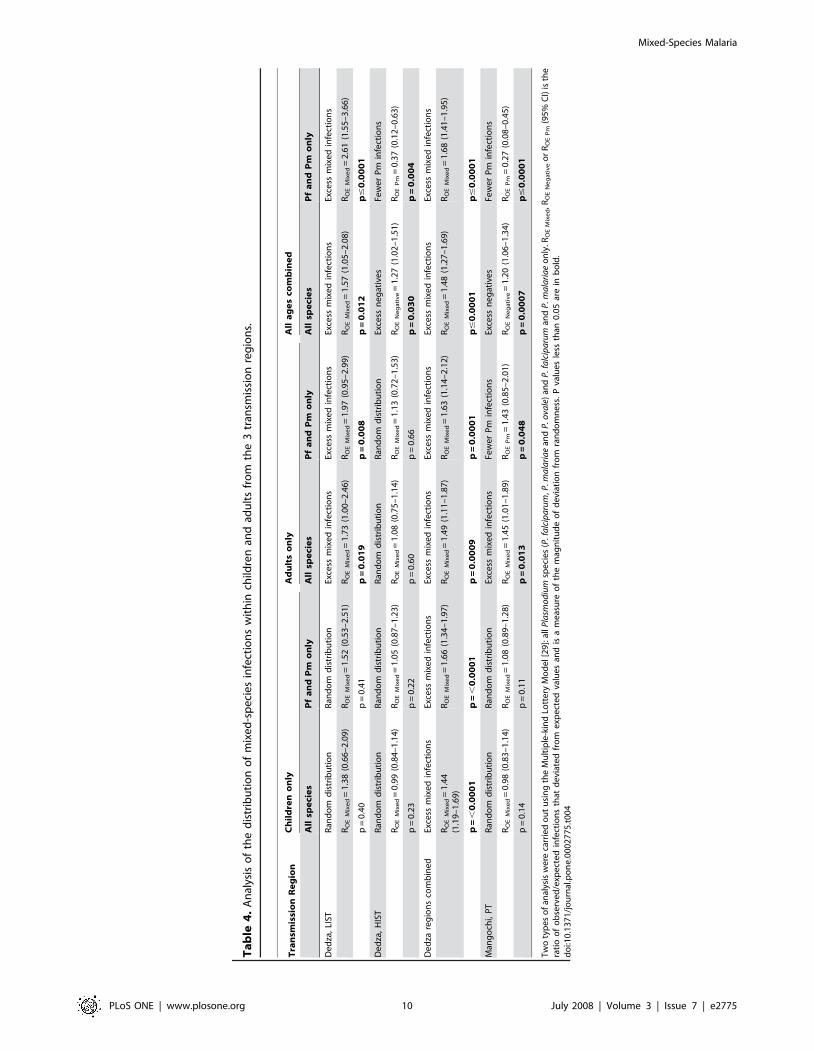
Distribution of multiple species infectionsTo determine if the three Plasmodium species were randomly
distributed within human hosts we used the multiple-kind lottery
model [29] which detects deviations from a random distribution
of multiple parasite species within multiple hosts. Because of the
significant age and spatial differences in prevalence, data from
Mixed-Species Malaria
PLoS ONE | www.plosone.org 5 July 2008 | Volume 3 | Issue 7 | e2775
children and adults were analysed separately within each of the
three transmission regions. No deviation from a random
distribution was seen in children from any transmission region
when all species (P. falciparum, P. malariae and P. ovale) were
considered or when P. falciparum and P. malariae were considered
in isolation from the least prevalent species, P. ovale (Table 4). A
greater number of mixed infections in the LIST region and fewer
P. malariae infections in Mangochi were observed amongst adults
compared with that expected from a random distribution of each
species (Table 4). Combining data from children and adults led to
the abolition of randomness in all of the regions where
randomness had been found in children, indicating that
Figure 2. Spatial distribution of malaria prevalence detected by PCR in relation to geographical features in Mangochi (A) andDedza (B) districts.doi:10.1371/journal.pone.0002775.g002
Mixed-Species Malaria
PLoS ONE | www.plosone.org 6 July 2008 | Volume 3 | Issue 7 | e2775
differences in the number and distribution of infections between
age groups can confound analyses of whole populations. In
addition, combining data for the two Dedza transmission regions
also resulted in apparent deviation from randomness amongst
children.
Parasite DensityGenerally, parasite density is closely linked with malaria fever,
with higher densities more likely to result in elevated tempera-
ture. Parasite density measured by microscopy was greater in
Mangochi (mean log10 density per ml of blood, 3.2) than in
Dedza, (mean log10 density, 3.0, Table 1). When estimates of the
density of sub-microscopic parasites, detected only by PCR were
included, this difference was abolished (Table 1). In all 3
transmission regions mean log10 parasite density was greater in
children compared with adults (LIST region, p,0.0001; HIST
region, p = 0.027; Mangochi PT region, p,0.0001, Figure 6a).
Amongst adults there was no difference in parasite density
between transmission regions but in children, density was lower
in the HIST region compared with both the LIST (p = 0.0060)
and the Mangochi PT regions (p,0.0001, Figure 6a). Children
with mixed species infections detected by PCR, had lower mean
parasite density than those with single infections in the PT region
(p = 0.0021) but not in the HIST region (p = 0.071, Figure 6b).
Figure 3. Distribution of villages in Dedza district in relation to 3-dimensional topography and elevation.doi:10.1371/journal.pone.0002775.g003
Table 2. Mixed effects models for PCR-detected infection.
Model 1 Model 2a Model 2b Model 3
All villages Mangochi only Dedza onlyp-value Dedzavs. Mangochi
Variancecomponents
Between s2 1.08 1.16 0.79 0.89 0.05 0.74 0.026
villages OR75-25 4.06 4.28 3.31 3.57 1.37 3.20
Between s2 0.87 0.96 0.82 0.89 0.56 0.90 0.25
households OR75-25 3.52 3.76 3.40 3.57 2.75 3.59
Covariateeffects
Female vs. Male OR (95% CI) - 1.32 (1.07, 1.63) - 1.31 (1.07, 1.61) 1.36 (0.89, 2.07) 1.34 (1.05, 1.70) 0.95
Adult vs. Child OR (95% CI) - 0.40 (0.32, 0.49) - 0.41 (0.33, 0.50) 0.15 (0.10, 0.23) 0.60 (0.48, 0.76) ,0.0001
Elevation(/100 m increase)
OR (95% CI) - - 0.88 (0.78, 0.99) 0.88 (0.78, 1.00) 1.19 (0.87, 1.63) 0.55 (0.39, 0.77) 0.0010
Mean Dry NDVI(/0.01 increase)
OR (95% CI) - - 0.99 (0.83, 1.18) 0.99 (0.82, 1.19) 1.17 (1.02, 1.34) 0.92 (0.72, 1.18) 0.10
Mean Wet NDVI (/0.01 increase)
OR (95% CI) - - 1.01 (0.96, 1.06) 1.01 (0.96, 1.06) 1.00 (0.94, 1.07) 1.02 (0.96, 1.08) 0.68
Model 1: Allowing for random variation between villages and between households; no covariates.Model 2a: Model 1 plus adjusting for individual effects (age and sex).Model 2b: Model 1 plus adjusting for village effects (elevation above sea level, mean wet season NDVI and mean dry season NDVI).Model 3: Model 2 plus adjusting for all covariates.Estimates of variation between villages and between households (s22variance of log odds of infection between units, OR75-252odds ratio between units at the 75th
and 25th percentiles of distribution) and odds ratios associated with sex, age, elevation above sea level, mean dry NDVI and mean wet NDVI (with 95% confidenceintervals) under alternative models. P values less than 0.05 are in bold.doi:10.1371/journal.pone.0002775.t002
Mixed-Species Malaria
PLoS ONE | www.plosone.org 7 July 2008 | Volume 3 | Issue 7 | e2775
Ta
ble
3.
Sum
mar
yo
fp
aras
ito
log
ical
and
ge
og
rap
hic
dat
ap
er
villa
ge
,o
rde
red
wit
hin
eac
hd
istr
ict
by
incr
eas
ing
mal
aria
pre
vale
nce
de
tect
ed
by
PC
R.
Dis
tric
tV
illa
ge
La
titu
de
Lo
ng
itu
de
Ele
va
tio
n(m
etr
es)
Nu
mb
er
of
sam
ple
sN
um
be
ro
fh
ou
seh
old
sT
ran
smis
sio
nR
eg
ion
2M
icro
sco
py
Pre
va
len
ce3
PC
RP
rev
ale
nce
4%
fev
er5
% mo
de
rate
an
ae
mia
6% tr
ea
ted
7%
be
dn
et
usa
ge
8
De
dza
Kap
ala1
13
65
22
.21
7.6
10
.32
.21
1.8
0.7
Ch
ikan
da
(CH
K)
21
4.3
35
34
.28
81
75
11
48
48
LIST
21
.62
9.7
11
.52
.01
5.5
0.7
Sim
uko
(SM
K)
21
4.3
26
34
.43
81
73
71
10
39
LIST
22
.73
0.9
7.3
2.7
11
.80
.0
Nch
och
om
a(N
CH
)2
14
.41
23
4.4
01
15
24
13
85
7LI
ST1
1.6
34
.89
.40
.71
2.3
3.7
Ng
we
re(N
GW
)2
14
.32
33
4.3
03
17
69
12
76
8LI
ST1
8.1
42
.51
3.4
5.5
18
.90
.0
Mu
yow
e(M
YW
)2
14
.30
03
4.4
31
15
27
13
64
8LI
ST1
7.6
44
.11
7.6
1.5
22
.12
.9
Kan
yen
da
(KN
Y)
21
4.2
24
34
.36
21
60
81
27
59
LIST
25
.24
8.0
8.1
2.4
14
.20
.0
Kam
en
yag
waz
a(K
MG
)2
14
.36
73
4.4
50
15
78
12
03
7LI
ST1
9.2
50
.87
.51
.71
3.3
0.0
Kan
yam
a(K
NM
)2
14
.24
23
4.3
24
15
37
10
15
6LI
ST2
9.7
58
.41
3.9
1.0
19
.80
.0
Ch
iph
azi
(CH
P)
21
4.2
83
34
.27
51
77
51
42
58
LIST
43
.05
8.5
16
.98
.52
8.9
0.7
Nju
chi
(NJC
)2
14
.37
93
4.2
81
15
78
15
06
1LI
ST2
1.3
59
.31
0.7
4.7
19
.30
.7
Ku
mfu
nd
a(K
MF)
21
4.4
20
34
.13
71
46
76
52
4H
IST
43
.17
3.8
15
.46
.22
7.7
0.0
Mak
akh
ula
(MK
K)
21
4.2
73
34
.15
11
31
81
08
39
HIS
T1
3.9
79
.69
.34
.61
5.7
0.0
Ch
inth
ankw
a(C
HN
)2
14
.31
53
4.1
01
13
03
15
04
7H
IST
22
.78
4.7
6.0
4.7
12
.09
.5
Kap
hal
a(K
PH
)2
14
.33
83
4.1
69
15
03
10
13
9H
IST
58
.48
7.1
17
.86
.93
8.6
0.0
Th
amb
ola
gw
a(T
HM
)2
14
.43
13
4.1
73
14
73
12
45
8H
IST
24
.29
0.3
11
.33
.21
9.4
0.8
De
dza
To
tal
19
83
79
02
3.6
54
.41
1.5
3.6
18
.31
4.2
Man
go
chi
Mak
awa
(MW
K)
21
4.3
08
35
.11
74
82
11
04
7P
T2
3.6
65
.52
0.9
11
.83
0.0
19
.1
Kat
em
a(K
TM
)2
14
.54
73
5.0
33
88
61
14
48
PT
15
.86
7.5
6.2
12
.31
7.5
16
.9
Mta
gal
uka
(MT
G)
21
4.4
73
35
.26
94
75
14
74
5P
T2
1.8
72
.17
.61
1.7
23
.82
2.3
Mp
ing
anjir
a(M
PJ)
21
4.5
24
35
.21
74
81
99
31
PT
27
.37
5.8
5.1
7.1
17
.22
2.8
Mw
alija
(MW
L)2
14
.62
43
5.1
80
53
51
04
38
PT
25
.07
9.8
11
.51
1.5
24
.09
.8
Mp
aman
da
(MP
M)
21
4.4
62
35
.36
65
35
12
53
6P
T2
7.2
84
.01
8.5
9.6
31
.27
.3
Mka
li(M
KL)
21
4.3
82
35
.19
84
75
13
24
4P
T3
6.4
84
.11
2.2
17
.43
4.1
7.3
Mat
en
gan
ya(M
TN
)2
14
.46
03
5.3
65
53
51
04
39
PT
42
.38
4.6
13
.59
.62
9.8
9.9
Man
go
chi
To
tal
93
53
28
27
.37
6.7
11
.91
1.6
26
.21
.4
To
tal
29
18
11
18
24
.76
1.5
11
.66
.22
0.8
5.3
1T
he
exa
ctlo
cati
on
of
Kap
ala
was
no
tre
cord
ed
.2T
ran
smis
sio
nre
gio
ns
are
de
fin
ed
aslo
win
ten
sity
seas
on
altr
ansm
issi
on
(LIS
T);
hig
hin
ten
sity
seas
on
altr
ansm
issi
on
(HIS
T)
and
pe
ren
nia
ltr
ansm
issi
on
(PT
).3
Mic
rosc
op
yp
reva
len
ceis
for
any
Pla
smo
diu
msp
eci
es.
4P
CR
pre
vale
nce
isfo
ran
ysp
eci
es
(P.f
alc
ipa
rum
,P.m
ala
ria
eo
rP
.ova
le)
de
tect
ed
.5Fe
ver
isd
efi
ne
das
axill
ary
tem
pe
ratu
re$
37
.5uC
.6M
od
era
tean
aem
iais
de
fin
ed
asH
b#
8g
/dl.
7P
eo
ple
tre
ate
dw
ere
atri
sko
fp
rog
ress
ion
tose
vere
mal
aria
,as
de
fin
ed
inm
ate
rial
san
dm
eth
od
s.8
Pe
op
lew
ho
sle
pt
reg
ula
rly
un
de
ra
be
dn
et.
do
i:10
.13
71
/jo
urn
al.p
on
e.0
00
27
75
.t0
03
Mixed-Species Malaria
PLoS ONE | www.plosone.org 8 July 2008 | Volume 3 | Issue 7 | e2775
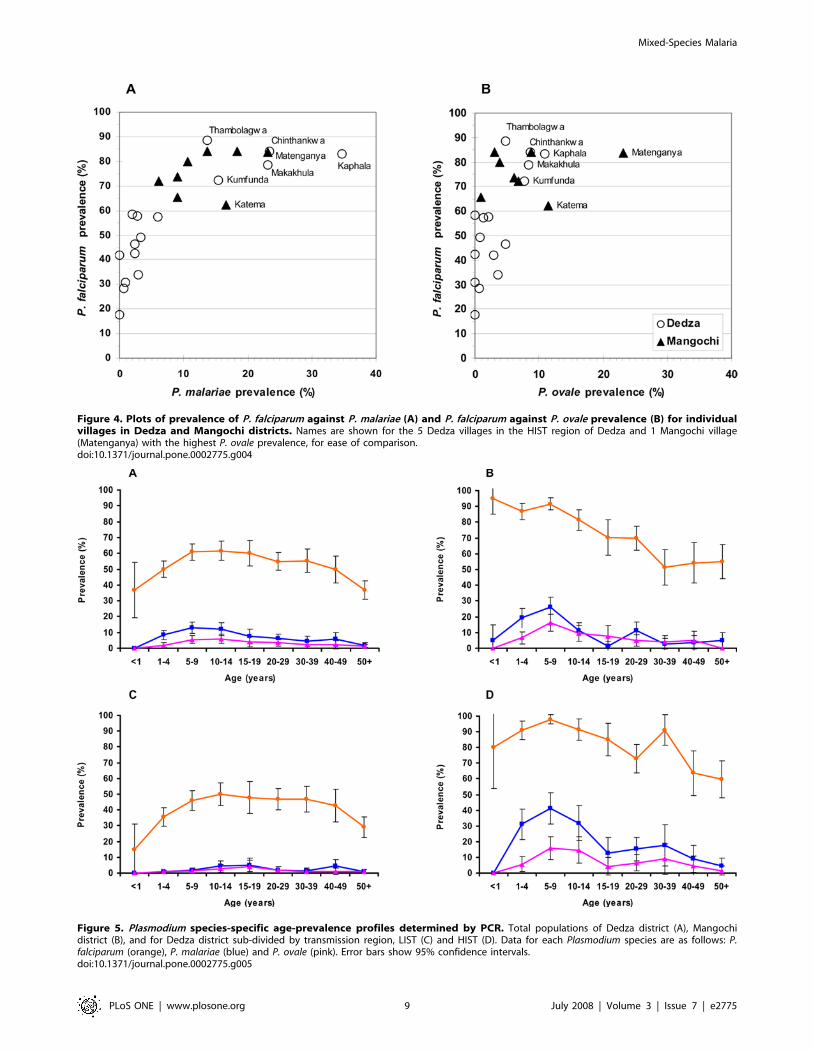
Figure 4. Plots of prevalence of P. falciparum against P. malariae (A) and P. falciparum against P. ovale prevalence (B) for individualvillages in Dedza and Mangochi districts. Names are shown for the 5 Dedza villages in the HIST region of Dedza and 1 Mangochi village(Matenganya) with the highest P. ovale prevalence, for ease of comparison.doi:10.1371/journal.pone.0002775.g004
Figure 5. Plasmodium species-specific age-prevalence profiles determined by PCR. Total populations of Dedza district (A), Mangochidistrict (B), and for Dedza district sub-divided by transmission region, LIST (C) and HIST (D). Data for each Plasmodium species are as follows: P.falciparum (orange), P. malariae (blue) and P. ovale (pink). Error bars show 95% confidence intervals.doi:10.1371/journal.pone.0002775.g005
Mixed-Species Malaria
PLoS ONE | www.plosone.org 9 July 2008 | Volume 3 | Issue 7 | e2775
Ta
ble
4.
An
alys
iso
fth
ed
istr
ibu
tio
no
fm
ixe
d-s
pe
cie
sin
fect
ion
sw
ith
inch
ildre
nan
dad
ult
sfr
om
the
3tr
ansm
issi
on
reg
ion
s.
Tra
nsm
issi
on
Re
gio
nC
hil
dre
no
nly
Ad
ult
so
nly
All
ag
es
com
bin
ed
All
spe
cie
sP
fa
nd
Pm
on
lyA
llsp
eci
es
Pf
an
dP
mo
nly
All
spe
cie
sP
fa
nd
Pm
on
ly
De
dza
,LI
STR
and
om
dis
trib
uti
on
Ran
do
md
istr
ibu
tio
nEx
cess
mix
ed
infe
ctio
ns
Exce
ssm
ixe
din
fect
ion
sEx
cess
mix
ed
infe
ctio
ns
Exce
ssm
ixe
din
fect
ion
s
RO
EM
ixe
d=
1.3
8(0
.66
–2
.09
)R
OE
Mix
ed
=1
.52
(0.5
3–
2.5
1)
RO
EM
ixe
d=
1.7
3(1
.00
–2
.46
)R
OE
Mix
ed
=1
.97
(0.9
5–
2.9
9)
RO
EM
ixe
d=
1.5
7(1
.05
–2
.08
)R
OE
Mix
ed
=2
.61
(1.5
5–
3.6
6)
p=
0.4
0p
=0
.41
p=
0.0
19
p=
0.0
08
p=
0.0
12
p#
0.0
00
1
De
dza
,H
IST
Ran
do
md
istr
ibu
tio
nR
and
om
dis
trib
uti
on
Ran
do
md
istr
ibu
tio
nR
and
om
dis
trib
uti
on
Exce
ssn
eg
ativ
es
Few
er
Pm
infe
ctio
ns
RO
EM
ixe
d=
0.9
9(0
.84
–1
.14
)R
OE
Mix
ed
=1
.05
(0.8
7–
1.2
3)
RO
EM
ixe
d=
1.0
8(0
.75
–1
.14
)R
OE
Mix
ed
=1
.13
(0.7
2–
1.5
3)
RO
EN
eg
ati
ve
=1
.27
(1.0
2–
1.5
1)
RO
EP
m=
0.3
7(0
.12
–0
.63
)
p=
0.2
3p
=0
.22
p=
0.6
0p
=0
.66
p=
0.0
30
p=
0.0
04
De
dza
reg
ion
sco
mb
ine
dEx
cess
mix
ed
infe
ctio
ns
Exce
ssm
ixe
din
fect
ion
sEx
cess
mix
ed
infe
ctio
ns
Exce
ssm
ixe
din
fect
ion
sEx
cess
mix
ed
infe
ctio
ns
Exce
ssm
ixe
din
fect
ion
s
RO
EM
ixe
d=
1.4
4(1
.19
–1
.69
)R
OE
Mix
ed
=1
.66
(1.3
4–
1.9
7)
RO
EM
ixe
d=
1.4
9(1
.11
–1
.87
)R
OE
Mix
ed
=1
.63
(1.1
4–
2.1
2)
RO
EM
ixe
d=
1.4
8(1
.27
–1
.69
)R
OE
Mix
ed
=1
.68
(1.4
1–
1.9
5)
p=
,0
.00
01
p=
,0
.00
01
p=
0.0
00
9p
=0
.00
01
p#
0.0
00
1p
#0
.00
01
Man
go
chi,
PT
Ran
do
md
istr
ibu
tio
nR
and
om
dis
trib
uti
on
Exce
ssm
ixe
din
fect
ion
sFe
we
rP
min
fect
ion
sEx
cess
ne
gat
ive
sFe
we
rP
min
fect
ion
s
RO
EM
ixe
d=
0.9
8(0
.83
–1
.14
)R
OE
Mix
ed
=1
.08
(0.8
9–
1.2
8)
RO
EM
ixe
d=
1.4
5(1
.01
–1
.89
)R
OE
Pm
=1
.43
(0.8
5–
2.0
1)
RO
EN
eg
ati
ve
=1
.20
(1.0
6–
1.3
4)
RO
EP
m=
0.2
7(0
.08
–0
.45
)
p=
0.1
4p
=0
.11
p=
0.0
13
p=
0.0
48
p=
0.0
00
7p
#0
.00
01
Tw
oty
pe
so
fan
alys
isw
ere
carr
ied
ou
tu
sin
gth
eM
ult
iple
-kin
dLo
tte
ryM
od
el[
29
]:al
lPla
smo
diu
msp
eci
es
(P.f
alc
ipa
rum
,P.m
ala
ria
ean
dP
.ova
le)
and
P.f
alc
ipa
rum
and
P.m
ala
ria
eo
nly
.RO
EM
ixe
d,R
OE
Ne
ga
tiv
eo
rR
OE
Pm
(95
%C
I)is
the
rati
oo
fo
bse
rve
d/e
xpe
cte
din
fect
ion
sth
atd
evi
ate
dfr
om
exp
ect
ed
valu
es
and
isa
me
asu
reo
fth
em
agn
itu
de
of
de
viat
ion
fro
mra
nd
om
ne
ss.
Pva
lue
sle
ssth
an0
.05
are
inb
old
.d
oi:1
0.1
37
1/j
ou
rnal
.po
ne
.00
02
77
5.t
00
4
Mixed-Species Malaria
PLoS ONE | www.plosone.org 10 July 2008 | Volume 3 | Issue 7 | e2775
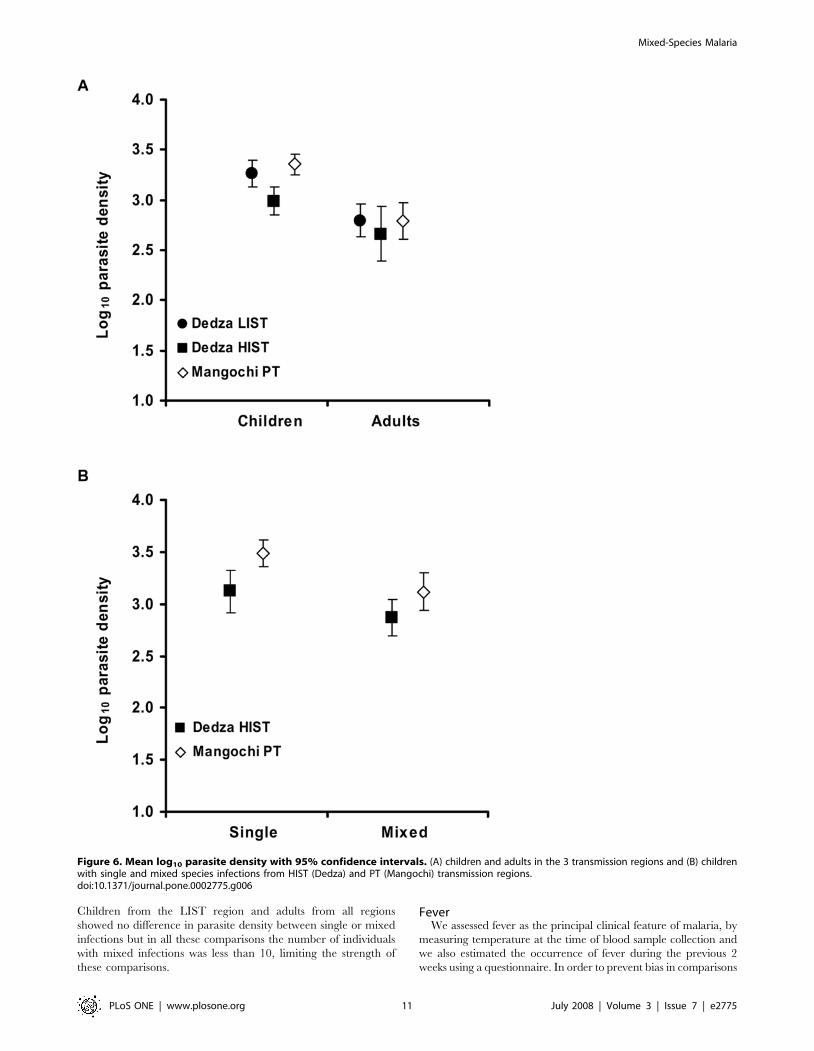
Children from the LIST region and adults from all regions
showed no difference in parasite density between single or mixed
infections but in all these comparisons the number of individuals
with mixed infections was less than 10, limiting the strength of
these comparisons.
FeverWe assessed fever as the principal clinical feature of malaria, by
measuring temperature at the time of blood sample collection and
we also estimated the occurrence of fever during the previous 2
weeks using a questionnaire. In order to prevent bias in comparisons
Figure 6. Mean log10 parasite density with 95% confidence intervals. (A) children and adults in the 3 transmission regions and (B) childrenwith single and mixed species infections from HIST (Dedza) and PT (Mangochi) transmission regions.doi:10.1371/journal.pone.0002775.g006
Mixed-Species Malaria
PLoS ONE | www.plosone.org 11 July 2008 | Volume 3 | Issue 7 | e2775
across regions and between single and mixed infections, we chose
not to define regional- and age-specific clinical thresholds of fever
and parasite density [30,31], instead comparing fever alone and
fever along with standard density thresholds.
Despite the differences in Plasmodium prevalence and species
distribution between districts, the proportion of individuals with
measured fever was very similar (Dedza, 11.5%, Mangochi,
11.9%, Table 1). Likewise, there was no difference in fever rates
between the HIST and LIST transmission regions (LIST, 11.6%;
HIST, 11.1%, p = 0.770). In both districts fever rates were higher
in children than in adults (Dedza: children, 14.0%; adults 9.1%,
OR 1.64 (95% CI 1.23–2.17) p = 0.0005); Mangochi: children
14.3%, adults 9.0%, OR 1.69 (95% CI 1.11–2.56), p = 0.013).
However, there was no difference between districts or transmission
regions in the child or adult fever rates (data not shown).
Fever was seen in 209 out of 1426 (14.6%) people with P.
falciparum only, compared with 30 out of 203 (14.8%) people with
mixed P. falciparum & P. malariae infections and 8 out of 79 (10.1%)
people with mixed P. falciparum and P. ovale infections. These data
showed no deviation from expected fever rates in either district
when data from all age groups or children (aged ,1–14 years) only
were analysed (data not shown). There were insufficient data from
each of the two Dedza transmission regions for these to be
analysed separately. No significant deviations from expected fever
rates amongst P. falciparum only and mixed-species infections were
seen when clinical malaria was defined more stringently as
temperature $37.5uC or 38.0uC along with a positive microscopy
reading or along with parasite density $1000 parasites/ml (data
not shown). Only when clinical malaria was defined more
stringently as temperature $37.5uC along with parasite density
$5000 parasites/ml, was there a negative association of mixed
infections with clinical malaria, and this was seen in children only
(OR 0.43 (95% CI 0.19–0.96) p = 0.035).
Univariate logistic regression was used to investigate the
variables associated with measured fever. The variables district
and transmission region were not significantly associated but 14 out of
25 other variables were (Table S2). Multivariate logistic regression
modelling revealed that the best predictor of fever was log10
parasite density in the absence of all other factors but this model
accounted only for 8.2% of the variability in fever (Table 5).
A history of fever during the 2 weeks previous to the community
survey was self-reported by more than 40% of people in both
districts (Dedza, 45.8%, Mangochi, 42.5%, Table 1). The HIST
region showed a slightly greater rate of history of fever (50.6%) than
both the LIST (43.9%) or PT regions (42.5%) (HIST cf LIST, OR
1.31 (95% CI 1.07–1.60), p = 0.0076; HIST cf PT, OR 1.39 (95%
CI 1.12–1.72), p = 0.0028). The LIST region showed a higher rate
of history of fever in adults (47.5%) compared with children (40.2%),
(OR 1.34 (95% CI 1.09–1.66), p = 0.0057) whereas no difference
between age groups was seen in the other transmission regions (data
not shown). People reporting a history of fever were less likely to
have mixed species infection than expected by chance in the HIST
region (OR 0.63 (95% CI 0.42–0.94), p = 0.025) but this was not the
case in the LIST or Mangochi regions (data not shown). Almost one
quarter of the variability in the history of fever (23.0%) could be
predicted using multivariate logistic regression modelling (Table 5).
This is in contrast to measured fever, which was poorly predicted by
such analysis.
Antimalarial treatment, drug and bednet useDuring the community surveys, we gave antimalarial treatment
(see Materials and Methods for clinical treatment criteria) to a
greater proportion of people in Mangochi (26.2%) than in Dedza
(18.3%, Table 1). Children were more likely than adults to meet
treatment criteria in both districts (Dedza: children 24.0%, adults
13.0%; Mangochi: children 33.6%, adults 17.3%) and both
children and adults in Mangochi were more likely to require
treatment than equivalent individuals in Dedza (children, OR 1.60
(95% CI 1.27–2.03), p = ,0.0001; adults, OR 1.40 (95% CI 1.03–
1.91), p = 0.033). There was no association between meeting
treatment criteria and carriage of multiple species infection;
individuals who were treated had no more or less mixed species
infections than expected by chance alone when data were analysed
by district, transmission region or age (data not shown).
Drug use by each participant in the two weeks previous to the
community survey was estimated via a questionnaire. There was
no difference between districts in the proportion of people that had
taken the anti-malarial drugs SP or quinine (Dedza 7.4%,
Mangochi 8.9%) but more people in Mangochi had taken
painkillers (Dedza 21.6%, Mangochi 26.7%, Table 1). In both
Dedza and Mangochi districts, people who had taken antimalarial
treatment in the previous 2 weeks were less likely to have a mixed
species infection (Dedza, OR 0.10 (95% CI 0.02–0.40), p,0.0001;
Mangochi, OR 0.31 (95% CI 0.11–0.89), p = 0.022).
Bednet usage varied between the two districts. Only 1.4% of
individuals in Dedza slept under a bednet regularly, compared
with 14.2% in Mangochi (Table 1). In Mangochi, people who slept
regularly under a bednet were less likely to have a Plasmodium
infection detected by PCR (OR 0.43, 95% CI 0.29–0.65,
p,0.0001) and had fewer mixed species infections than expected
by chance alone (OR 0.22, 95% CI 0.09–0.55, p = 0.0004). There
was a near-significant association between bednet use and reduced
current fever rate (OR 0.52, 95% CI 0.26–1.07, p = 0.07) but
surprisingly, those using bednets were more likely to have a history
of fever than those without (OR 1.82, 95% CI 1.24–2.69,
p = 0.002). The low numbers of bednet users prevented similar
analyses for Dedza district.
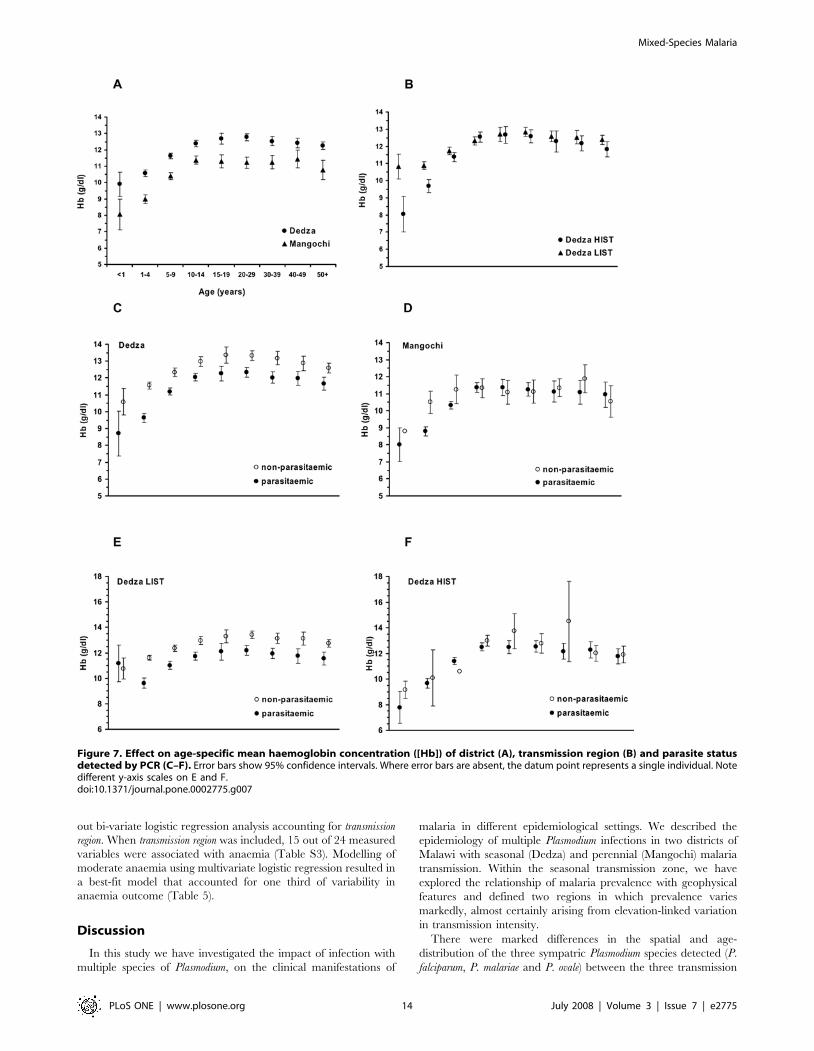
Haemoglobin concentration and anaemiaOverall, mean haemoglobin concentration ([Hb]) in Mangochi
(10.6 g/dl) was significantly lower than Dedza (12.0 g/dl, Table 1).
Correspondingly, levels of anaemia were different in the two
districts. Mild anaemia ([Hb]#11 g/dl) affected 55% of people in
Mangochi, but was only half as prevalent in Dedza. Levels of
moderate anaemia ([Hb]#8 g/dl) in Mangochi were three times
higher than in Dedza (Table 1). Mean haemoglobin concentration
increased with age in both districts, stabilising in adulthood but
was consistently lower (by approximately 1.5 g/dl) across all age
groups in Mangochi (Figure 7a). When the two Dedza
transmission regions were considered separately, a higher mean
[Hb] was found in the LIST region compared with the HIST
region in children less than 5 years old, but in older children and
adults there was no difference (Figure 7b).
Mean haemoglobin concentration was lower in parasitaemic
individuals than in those without parasitaemia across all age
groups in Dedza (Figure 7c). When analysed separately, the LIST
region mean [Hb] was reduced by around 1 g/dl in parasitaemic
individuals across ages except for the youngest age group (children
,1 year, Figure 7e). In contrast, mean [Hb] in parasitaemic
people of all ages was indistinguishable from those without
parasitaemia in the HIST region (Figure 7f). In Mangochi, there
was no difference in mean [Hb] between parasitaemic and non-
parasitaemic individuals, except for children aged 1–4 in whom
mean [Hb] was around 2 g/dl lower amongst parasitised children
(Figure 7d). There was no difference in mean [Hb] in adults with
single compared with mixed species infections in all transmission
regions and in children in the LIST and PT transmission regions.
However, in the HIST region, children with mixed species
Mixed-Species Malaria
PLoS ONE | www.plosone.org 12 July 2008 | Volume 3 | Issue 7 | e2775
infections had greater mean [Hb] compared with those carrying a
single species (single, 10.7 g/dl, n = 147, mixed 11.4 g/dl, n = 101,
p,0.01).
Adults sleeping regularly under a bednet had higher mean [Hb]
than those without bednets in Mangochi (mean [Hb] without net,
11.0 g/dl; with net, 11.7 g/dl, p = 0.018). In children, mean [Hb]
did not differ with bednet use (mean [Hb] without net, 10.1 g/dl;
with net, 10.2 g/dl, p = 0.540). The impact of bednet usage on
[Hb] could not be analysed within Dedza district because so few
people in this district used bednets (n = 28).
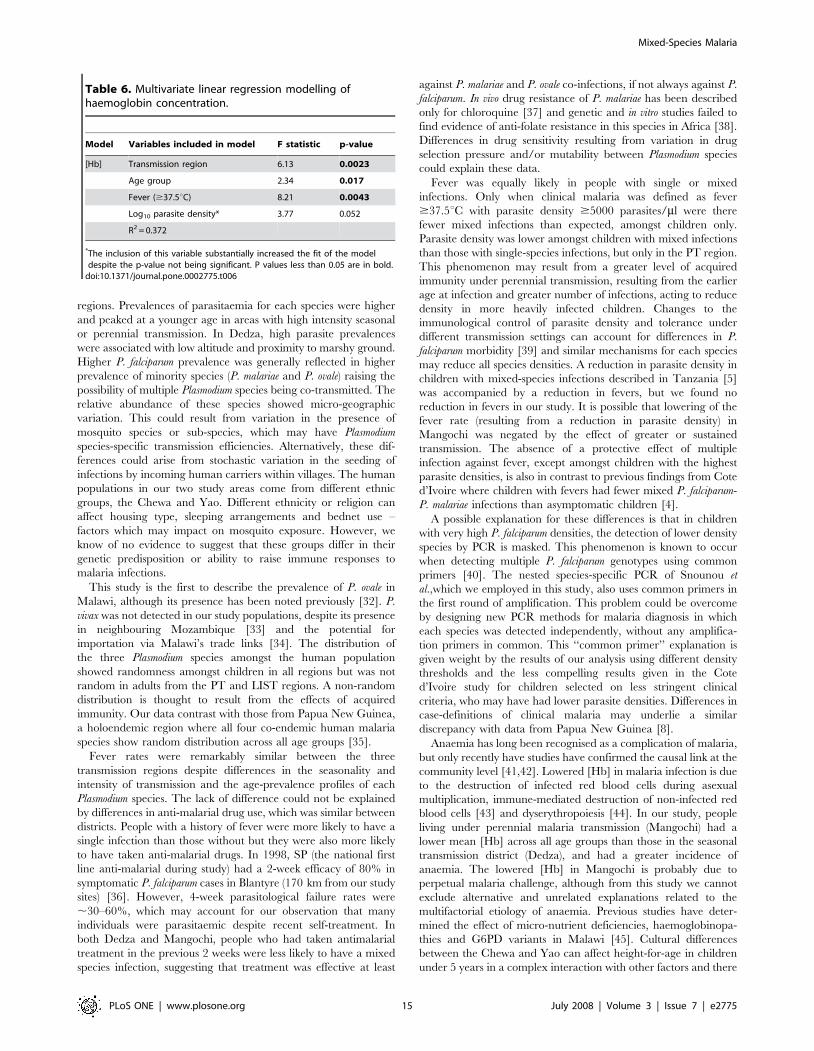
In order to determine associations between haemoglobin
concentration and any of the variables that we measured,
regression analyses were carried out. In a univariate regression
analysis of [Hb], transmission region was strongly associated
(R2 = 0.094, p,0.0001) therefore we carried out bi-variate
regression analyses accounting for transmission region. All but 3 of
the 24 measured variables showed significant association with
haemoglobin level. There were significant interactions between
transmission region and several variables (Table S3). Modelling of
[Hb] using multivariate linear regression resulted in a best-fit
model that explained 37.2% of the variability in [Hb] (Table 6).
Transmission region was also strongly associated with the binary
clinical outcome of moderate anaemia ([Hb]#8.0 g/dl) in
univariate logistic regression (p,0.0001) and therefore we carried
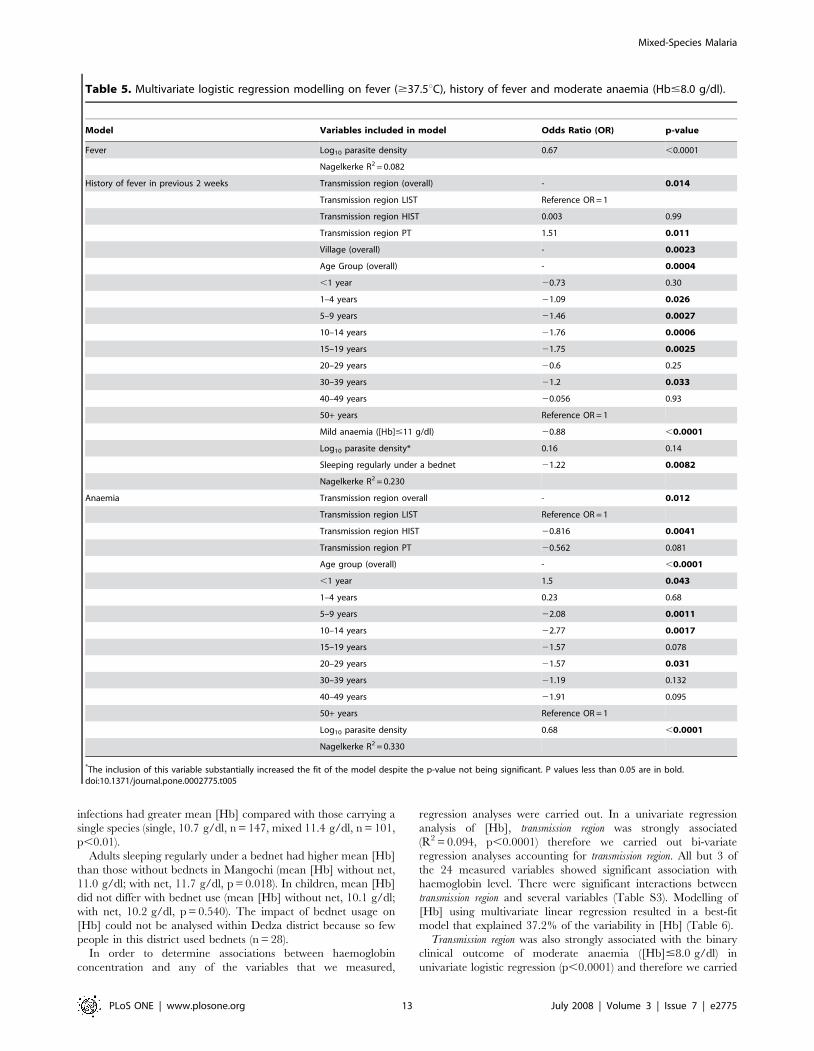
Table 5. Multivariate logistic regression modelling on fever ($37.5uC), history of fever and moderate anaemia (Hb#8.0 g/dl).
Model Variables included in model Odds Ratio (OR) p-value
Fever Log10 parasite density 0.67 ,0.0001
Nagelkerke R2 = 0.082
History of fever in previous 2 weeks Transmission region (overall) - 0.014
Transmission region LIST Reference OR = 1
Transmission region HIST 0.003 0.99
Transmission region PT 1.51 0.011
Village (overall) - 0.0023
Age Group (overall) - 0.0004
,1 year 20.73 0.30
1–4 years 21.09 0.026
5–9 years 21.46 0.0027
10–14 years 21.76 0.0006
15–19 years 21.75 0.0025
20–29 years 20.6 0.25
30–39 years 21.2 0.033
40–49 years 20.056 0.93
50+ years Reference OR = 1
Mild anaemia ([Hb]#11 g/dl) 20.88 ,0.0001
Log10 parasite density* 0.16 0.14
Sleeping regularly under a bednet 21.22 0.0082
Nagelkerke R2 = 0.230
Anaemia Transmission region overall - 0.012
Transmission region LIST Reference OR = 1
Transmission region HIST 20.816 0.0041
Transmission region PT 20.562 0.081
Age group (overall) - ,0.0001
,1 year 1.5 0.043
1–4 years 0.23 0.68
5–9 years 22.08 0.0011
10–14 years 22.77 0.0017
15–19 years 21.57 0.078
20–29 years 21.57 0.031
30–39 years 21.19 0.132
40–49 years 21.91 0.095
50+ years Reference OR = 1
Log10 parasite density 0.68 ,0.0001
Nagelkerke R2 = 0.330
*The inclusion of this variable substantially increased the fit of the model despite the p-value not being significant. P values less than 0.05 are in bold.doi:10.1371/journal.pone.0002775.t005
Mixed-Species Malaria
PLoS ONE | www.plosone.org 13 July 2008 | Volume 3 | Issue 7 | e2775
out bi-variate logistic regression analysis accounting for transmission
region. When transmission region was included, 15 out of 24 measured
variables were associated with anaemia (Table S3). Modelling of
moderate anaemia using multivariate logistic regression resulted in
a best-fit model that accounted for one third of variability in
anaemia outcome (Table 5).
Discussion
In this study we have investigated the impact of infection with
multiple species of Plasmodium, on the clinical manifestations of
malaria in different epidemiological settings. We described the
epidemiology of multiple Plasmodium infections in two districts of
Malawi with seasonal (Dedza) and perennial (Mangochi) malaria
transmission. Within the seasonal transmission zone, we have
explored the relationship of malaria prevalence with geophysical
features and defined two regions in which prevalence varies
markedly, almost certainly arising from elevation-linked variation
in transmission intensity.
There were marked differences in the spatial and age-
distribution of the three sympatric Plasmodium species detected (P.
falciparum, P. malariae and P. ovale) between the three transmission
Figure 7. Effect on age-specific mean haemoglobin concentration ([Hb]) of district (A), transmission region (B) and parasite statusdetected by PCR (C–F). Error bars show 95% confidence intervals. Where error bars are absent, the datum point represents a single individual. Notedifferent y-axis scales on E and F.doi:10.1371/journal.pone.0002775.g007
Mixed-Species Malaria
PLoS ONE | www.plosone.org 14 July 2008 | Volume 3 | Issue 7 | e2775
regions. Prevalences of parasitaemia for each species were higher
and peaked at a younger age in areas with high intensity seasonal
or perennial transmission. In Dedza, high parasite prevalences
were associated with low altitude and proximity to marshy ground.
Higher P. falciparum prevalence was generally reflected in higher
prevalence of minority species (P. malariae and P. ovale) raising the
possibility of multiple Plasmodium species being co-transmitted. The
relative abundance of these species showed micro-geographic
variation. This could result from variation in the presence of
mosquito species or sub-species, which may have Plasmodium
species-specific transmission efficiencies. Alternatively, these dif-
ferences could arise from stochastic variation in the seeding of
infections by incoming human carriers within villages. The human
populations in our two study areas come from different ethnic
groups, the Chewa and Yao. Different ethnicity or religion can
affect housing type, sleeping arrangements and bednet use –
factors which may impact on mosquito exposure. However, we
know of no evidence to suggest that these groups differ in their
genetic predisposition or ability to raise immune responses to
malaria infections.
This study is the first to describe the prevalence of P. ovale in
Malawi, although its presence has been noted previously [32]. P.
vivax was not detected in our study populations, despite its presence
in neighbouring Mozambique [33] and the potential for
importation via Malawi’s trade links [34]. The distribution of
the three Plasmodium species amongst the human population
showed randomness amongst children in all regions but was not
random in adults from the PT and LIST regions. A non-random
distribution is thought to result from the effects of acquired
immunity. Our data contrast with those from Papua New Guinea,
a holoendemic region where all four co-endemic human malaria
species show random distribution across all age groups [35].
Fever rates were remarkably similar between the three
transmission regions despite differences in the seasonality and
intensity of transmission and the age-prevalence profiles of each
Plasmodium species. The lack of difference could not be explained
by differences in anti-malarial drug use, which was similar between
districts. People with a history of fever were more likely to have a
single infection than those without but they were also more likely
to have taken anti-malarial drugs. In 1998, SP (the national first
line anti-malarial during study) had a 2-week efficacy of 80% in
symptomatic P. falciparum cases in Blantyre (170 km from our study
sites) [36]. However, 4-week parasitological failure rates were
,30–60%, which may account for our observation that many
individuals were parasitaemic despite recent self-treatment. In
both Dedza and Mangochi, people who had taken antimalarial
treatment in the previous 2 weeks were less likely to have a mixed
species infection, suggesting that treatment was effective at least
against P. malariae and P. ovale co-infections, if not always against P.
falciparum. In vivo drug resistance of P. malariae has been described
only for chloroquine [37] and genetic and in vitro studies failed to
find evidence of anti-folate resistance in this species in Africa [38].
Differences in drug sensitivity resulting from variation in drug
selection pressure and/or mutability between Plasmodium species
could explain these data.
Fever was equally likely in people with single or mixed
infections. Only when clinical malaria was defined as fever
$37.5uC with parasite density $5000 parasites/ml were there
fewer mixed infections than expected, amongst children only.
Parasite density was lower amongst children with mixed infections
than those with single-species infections, but only in the PT region.
This phenomenon may result from a greater level of acquired
immunity under perennial transmission, resulting from the earlier
age at infection and greater number of infections, acting to reduce
density in more heavily infected children. Changes to the
immunological control of parasite density and tolerance under
different transmission settings can account for differences in P.
falciparum morbidity [39] and similar mechanisms for each species
may reduce all species densities. A reduction in parasite density in
children with mixed-species infections described in Tanzania [5]
was accompanied by a reduction in fevers, but we found no
reduction in fevers in our study. It is possible that lowering of the
fever rate (resulting from a reduction in parasite density) in
Mangochi was negated by the effect of greater or sustained
transmission. The absence of a protective effect of multiple
infection against fever, except amongst children with the highest
parasite densities, is also in contrast to previous findings from Cote
d’Ivoire where children with fevers had fewer mixed P. falciparum-
P. malariae infections than asymptomatic children [4].
A possible explanation for these differences is that in children
with very high P. falciparum densities, the detection of lower density
species by PCR is masked. This phenomenon is known to occur
when detecting multiple P. falciparum genotypes using common
primers [40]. The nested species-specific PCR of Snounou et
al.,which we employed in this study, also uses common primers in
the first round of amplification. This problem could be overcome
by designing new PCR methods for malaria diagnosis in which
each species was detected independently, without any amplifica-
tion primers in common. This ‘‘common primer’’ explanation is
given weight by the results of our analysis using different density
thresholds and the less compelling results given in the Cote
d’Ivoire study for children selected on less stringent clinical
criteria, who may have had lower parasite densities. Differences in
case-definitions of clinical malaria may underlie a similar
discrepancy with data from Papua New Guinea [8].
Anaemia has long been recognised as a complication of malaria,
but only recently have studies have confirmed the causal link at the
community level [41,42]. Lowered [Hb] in malaria infection is due
to the destruction of infected red blood cells during asexual
multiplication, immune-mediated destruction of non-infected red
blood cells [43] and dyserythropoiesis [44]. In our study, people
living under perennial malaria transmission (Mangochi) had a
lower mean [Hb] across all age groups than those in the seasonal
transmission district (Dedza), and had a greater incidence of
anaemia. The lowered [Hb] in Mangochi is probably due to
perpetual malaria challenge, although from this study we cannot
exclude alternative and unrelated explanations related to the
multifactorial etiology of anaemia. Previous studies have deter-
mined the effect of micro-nutrient deficiencies, haemoglobinopa-
thies and G6PD variants in Malawi [45]. Cultural differences
between the Chewa and Yao can affect height-for-age in children
under 5 years in a complex interaction with other factors and there
Table 6. Multivariate linear regression modelling ofhaemoglobin concentration.
Model Variables included in model F statistic p-value
[Hb] Transmission region 6.13 0.0023
Age group 2.34 0.017
Fever ($37.5uC) 8.21 0.0043
Log10 parasite density* 3.77 0.052
R2 = 0.372
*The inclusion of this variable substantially increased the fit of the modeldespite the p-value not being significant. P values less than 0.05 are in bold.
doi:10.1371/journal.pone.0002775.t006
Mixed-Species Malaria
PLoS ONE | www.plosone.org 15 July 2008 | Volume 3 | Issue 7 | e2775
are differences in the levels of growth stunting in these two ethnic
groups, suggestive of differences in nutrition [46]. HIV and
helminth infections are also known to be important factors in
anaemia. There is little difference in the prevalence of soil
transmitted helminths between the two study districts but there are
higher levels of schistosomiasis in lakeside compared with highland
areas [47]. There is a large difference in the prevalence of HIV,
which is twice as high in Mangochi as in Dedza, according to
official statistics [24].
An association of anaemia with perennial malaria transmission
[48] is consonant with a greater proportion of severe anaemia and
greater rate of blood transfusion amongst paediatric admissions in
Mangochi compared with Dedza (unpublished observations). It is
likely that persistent malaria pressure resulting in lowered [Hb]
puts children at risk of life-threatening anaemia, especially when
compounded with other factors such as micronutrient deficiency.
The presence of malaria parasites was a useful indicator of [Hb] at
the individual level in the LIST region but not in the HIST or PT
regions. The apparent lack of effect of parasitaemia on [Hb] in the
higher transmission regions (other than in young children) is likely
to be because detection of parasites in cross-sectional sampling is a
poor predictor of parasitaemia status in older children and adults,
in whom low density, chronic infections are not always detectable
[49–51].
The higher parasite density found in children compared to
adults in all transmission regions may account for the lower mean
[Hb] in children relative to adults. Children with mixed species
infections had on average greater [Hb] than children with single
infections, suggestive of a protective effect of multiple infections.
However, this finding was only seen in the HIST region. The
functional mechanism for this may be specific to immunity
generated through seasonal, compared to perennial infection. The
counter-intuitive, lower parasite density found in mixed species
infections could result from the inherent bias in the PCR species
diagnosis, in which mixed infections may be more likely to be
detected in patients where the density of each species is equitable.
P. malariae and P. ovale produce lower density parasitaemia than P.
falciparum and therefore mixed infections with P. falciparum may be
more likely to be detected at lower overall densities.
The use of insecticide treated bednets is now a central focus of
anti-malarial campaigns [52]. Bednet use at the time of our study
in 2002 was very low although this increased considerably in
subsequent years [53]. Bednet users in Mangochi had fewer mixed
species infections than those not using nets, in keeping with
previous data indicating the role of bednets in preventing new
infections [54]. Use of a bednet was associated with a higher mean
[Hb] in adults but surprisingly not in children in Mangochi,
despite this effect having been described in children in other
studies in Malawi [55] and other African countries [56]. Bednet
use gave no protection against fever and those with bednets were
more likely to have a history of fever than those without, in
contradiction to the multiple studies showing the clinical benefit of
bednets against malaria. These results may be due to poor power
in this study resulting from the limited number of bednet users.
This study took place during the peak of malaria transmission in
the wet season. Dry season data would allow a greater
understanding of the differences between the perennial and
seasonal transmission regions. It would be useful to clarify the
relationship between the HIST and LIST regions to establish the
dynamics of carriage of each species during the dry season in these
populations. An understanding of how the prevalence of each
Plasmodium species decays during the dry season, and the
corresponding effect on [Hb] and fever would give valuable
insights into the dynamics of the relationships between these
factors. Our study suggests that the interaction of multiple
Plasmodium species can have protective effects against some clinical
outcomes of malaria. This protection appears to be highly
dependent on the level and seasonality of malaria transmission
and most likely results from differences in the dynamics of
acquired immunity. Our data will be informative in predicting the
effects of anti-malarial intervention strategies on the clinical
outcomes of malaria and on Plasmodium population dynamics
across multiple transmission settings.
Supporting Information
Table S1 The number of samples in which each combination of
Plasmodium species was detected by PCR for each of the 3
transmission regions.
Found at: doi:10.1371/journal.pone.0002775.s001 (0.05 MB
DOC)
Table S2 Univariate logistic regression analysis on fever (axillary
temperature $37.5uC).
Found at: doi:10.1371/journal.pone.0002775.s002 (0.07 MB
DOC)
Table S3 Bi-variate linear regression analysis on haemoglobin
concentration and bi-variate logistic regression on moderate
anaemia ([Hb]#8.0 g/dl), accounting for transmission region.
Found at: doi:10.1371/journal.pone.0002775.s003 (0.09 MB
DOC)
Acknowledgments
Our thanks go to the people of Dedza and Mangochi Districts who
enthusiastically agreed to participate in the study. We are grateful to the
Ministry of Health and Population of the Government of Malawi for the
provision of vehicles and drivers and to the District Health Officers of
Dedza and Mangochi District hospitals for the use of laboratory and office
accommodation during the study. We are greatly indebted to the nurses,
laboratory staff and environmental officers of Dedza and Mangochi
Districts who carried out the community surveys; we thank them for their
hard work and dedication. We are also indebted to Keith Scott, Liz Peat
and Fiona McMonagle for excellent technical support in Glasgow. We
thank Pietro N. Ceccato from The International Research Institute for
Climate and Society, The Earth Institute, Columbia University, USA for
downloading MODIS images and extracting NDVI values from the
satellite data and we are grateful to Andy Tait, University of Glasgow and
Phil McCall, University of Liverpool, for useful discussions.
Author Contributions
Conceived and designed the experiments: MB AM MEM. Performed the
experiments: MB AM SN. Analyzed the data: MB LAKH SN AM.
Contributed reagents/materials/analysis tools: MB MEM. Wrote the
paper: MB LAKH AM MEM.
References
1. Ritchie TL (1988) Interactions between malaria parasites infecting the samevertebrate hosts. Parasitology 96: 607–639.
2. Collins WE, Jeffery GM (2007) Plasmodium malariae: parasite and disease. ClinMicrobiol Rev 20: 579–592.
3. Mueller I, Zimmerman PA, Reeder JC (2007) Plasmodium malariae and Plasmodium
ovale - the ‘‘bashful’’ malaria parasites. Trends Parasitol 23: 278–283.
4. Black J, Hommel M, Snounou G, Pinder M (1994) Mixed infections withPlasmodium falciparum and P. malariae and fever in malaria. Lancet 343: 1095.
5. Alifrangis M, Lemnge MM, Moon R, Theisen M, Bygbjerg I, et al. (1999) IgGreactivities against recombinant Rhoptry-Associated Protein-1 (rRAP-1) are
associated with mixed Plasmodium infections and protection against disease in
Tanzanian children. Parasitology 119: 337–342.
Mixed-Species Malaria
PLoS ONE | www.plosone.org 16 July 2008 | Volume 3 | Issue 7 | e2775
6. Collins W, Jeffery G (1999) A retrospective examination of sporozoite- and
trophozoite-induced infections with Plasmodium falciparum in patients previouslyinfected with heterologous species of Plasmodium: effect on development of
parasitologic and clinical immunity. Am J Trop Med Hyg 61: 36–43.
7. Maitland K, Williams TN, Newbold CI (1997) Plasmodium vivax and P. falciparum:Biological interactions and the possibility of cross-species immunity. Parasitol
Today 13: 227–231.8. Smith T, Genton B, Baea K, Gibson N, Narara A, et al. (2001) Prospective risk
of morbidity in relation to malaria infection in an area of high endemicity of
multiple species of Plasmodium. Am J Trop Med Hyg 64: 262–267.9. May J, Falusi AG, Mockenhaupt FP, Ademowo OG, Olumese PE, et al. (2000)
Impact of subpatent multi-species and multi-clonal plasmodial infections onanaemia in children from Nigeria. Trans R Soc Trop Med Hyg 94: 399–403.
10. Bruce MC, Day KP (2003) Cross-species regulation of Plasmodium parasitaemiain semi-immune children from Papua New Guinea. Trends Parasitol 19:
271–277.
11. Bruce MC, Donnelly CA, Alpers MP, Galinski MR, Barwell JW, et al. (2000)Cross-species interactions between malaria parasites in humans. Science 287:
845–848.12. McKenzie FE, Jeffery GM, Collins WE (2002) Plasmodium malariae infection
boosts Plasmodium falciparum gametocyte production. Am J Trop Med Hyg 67:
411–414.13. Kawamoto F, Liu Q, Ferreira M, Tantular I (1999) How Prevalant are
Plasmodium ovale and P. malariae in East Asia? Parasitol Today 15: 422–426.14. Mehlotra RK, Lorry K, Kastens W, Miller SM, Alpers MP, et al. (2000)
Random distribution of mixed species malaria infections in Papua New Guinea.Am J Trop Med Hyg 62: 225–231.
15. Tobian AA, Mehlotra RK, Malhotra I, Wamachi A, Mungai P, et al. (2000)
Frequent umbilical cord-blood and maternal-blood infections with Plasmodium
falciparum, P. malariae, and P. ovale in Kenya. J Infect Dis 182: 558–563.
16. Scopel KK, Fontes CJ, Nunes AC, Horta MF, Braga EM (2004) Highprevalence of Plamodium malariae infections in a Brazilian Amazon endemic area
(Apiacas-Mato Grosso State) as detected by polymerase chain reaction. Acta
Trop 90: 61–64.17. The National Atlas of Malawi. Malawi (1984) Department of Surveys,
Government of Malawi.18. Northrup N (1986) The migrations of Yao and Kololo into Southern Malawi:
aspects of migrations in nineteenth century Africa. The International Journal ofAfrican Historical Studies 19: 59–75.
19. Thorold A (1993) Metamorphoses of the Yao Muslims. Thorold, A. In:
Brenner L, ed. Muslim Identity and Social Change in Sub-Saharan Africa.Bloomington: Indiana University Press. pp 79–90.
20. Haworth J (1988) The global distribution of malaria and the present controleffort. In: Wernsdorfer WH, McGregor I, eds. Malaria: principles and practice.
London: Churchill Livingstone. pp 1379–1420.
21. Garnham PCC (1966) Malaria Parasites and Other Haemosporidia. Oxford:Blackwell.
22. Hawley W, Sexton J, Steketee R (1992) Malaria vector assessment, MalawiOctober 1991–September 1992. Centres for Disease Control, USA.
23. Mzilahowa T (2005) Malaria Transmission intensity and the populationstructure of Plasmodium falciparum in the lower Shire Valley, Southern Malawi.:
PhD Thesis, University of Liverpool.
24. The Ministry of Health and Population (2004) HIV/AIDS, malaria, TB andunder 5 five diarrhoea by number of cases, admissions and deaths by Districts
and Regions. The National Statistical Office of Malawi.25. Hay SI, Snow RW, Rogers DJ (1998) Predicting malaria seasons in Kenya using
multitemporal meteorological satellite sensor data. Trans R Soc Trop Med Hyg
92: 12–20.26. Snounou G, Viriyakosol S, Zhu XP, Jarra W, Pinheiro L, et al. (1993) High
sensitivity of detection of human malaria parasites by the use of nestedpolymerase chain reaction. Mol Biochem Parasitol 61: 315–320.
27. Singh B, Bobogare A, Cox-Singh J, Snounou G, Shukri Abdullah M, et al.
(1999) A genus- and species-specific nested polymerase chain reaction malariadetection assay for epidemiologic studies. Am J Trop Med Hyg 60: 687–692.
28. Bruce MC, Macheso A, Galinski MR, Barnwell JW (2007) Characterization andapplication of multiple genetic markers for Plasmodium malariae. Parasitology 134:
637–650.29. Janovy JJ, Clopton RE, Clopton DA, Snyder SD, Efting A, et al. (1995) Species
density distributions as null models for ecologically significant interactions of
parasite species in an assemblage. Ecol Modell 77: 189–196.30. Smith T, Schellenberg JA, Hayes R (1994) Attributable fraction estimates and
case definitions for malaria in endemic areas. Stat Med 13: 2345–2358.31. Smith T, Hurt N, Teuscher T, Tanner M (1995) Is fever a good sign for clinical
malaria in surveys of endemic communities? Am J Trop Med Hyg 52: 306–310.
32. Richter J, Hoppenheit B, Muller-Stover I, Gobels K, Haussinger D (2004) Casereport: Plasmodium ovale infection acquired in Malawi. Trans R Soc Trop Med
Hyg 98: 751–752.
33. Peragallo MS, Sabatinelli G, Majori G, Cali G, Sarnicola G (1997) Prevention
and morbidity of malaria in non-immune subjects; a case-control study amongItalian troops in Somalia and Mozambique, 1992–1994. Trans R Soc Trop Med
Hyg 91: 343–346.
34. Rosenberg R (2007) Plasmodium vivax in Africa: hidden in plain sight? TrendsParasitol 23: 193–196.
35. Mehlotra RK, Kasehagen LJ, Baisor M, Lorry K, Kazura JW, et al. (2002)Malaria infections are randomly distributed in diverse holoendemic areas of
Papua New Guinea. Am J Trop Med Hyg 67: 555–562.
36. Plowe CV, Kublin JG, Dzinjalamala FK, Kamwendo DS, Mukadam RA, et al.(2004) Sustained clinical efficacy of sulfadoxine-pyrimethamine for uncompli-
cated falciparum malaria in Malawi after 10 years as first line treatment: fiveyear prospective study. BMJ 328: 545.
37. Maguire JD, Sumawinata IW, Masbar S, Laksana B, Prodjodipuro P, et al.(2002) Chloroquine-resistant Plasmodium malariae in south Sumatra, Indonesia.
Lancet 360: 58–60.
38. Tanomsing N, Imwong M, Pukrittayakamee S, Chotivanich K, Looareesuwan S,et al. (2007) Genetic analysis of the dihydrofolate reductase-thymidylate synthase
gene from geographically diverse isolates of Plasmodium malariae. AntimicrobAgents Chemother 51: 3523–3530.
39. Smith T, Ross A, Maire N, Rogier C, Trape JF, et al. (2006) An epidemiologic
model of the incidence of acute illness in Plasmodium falciparum malaria. Am J TropMed Hyg 75: 56–62.
40. Farnert A, Arez AP, Babiker HA, Beck HP, Benito A, et al. (2001) Genotyping ofPlasmodium falciparum infections by PCR: a comparative multicentre study.
Trans R Soc Trop Med Hyg 95: 225–232.41. Geerligs PD, Brabin BJ, Eggelte TA (2003) Analysis of the effects of malaria
chemoprophylaxis in children on haematological responses, morbidity and
mortality. Bull World Health Org 81: 205–216.42. Korenromp EL, Armstrong-Schellenberg JR, Williams BG, Nahlen BL,
Snow RW (2004) Impact of malaria control on childhood anaemia in Africa -a quantitative review. Trop Med Int Health 9: 1050–1065.
43. Jakeman GN, Saul A, Hogarth WL, Collins WE (1999) Anaemia of acute
malaria infections in non-immune patients primarily results from destruction ofuninfected erythrocytes. Parasitology 119: 127–133.
44. Phillips RE, Looareesuwan S, Warrell DA, Lee SH, Karbwang J, et al. (1986)The importance of anaemia in cerebral and uncomplicated falciparum malaria:
role of complications, dyserythropoiesis and iron sequestration. Q J Med 58:305–323.
45. Brabin BJ, Prinsen-Geerligs PD, Verhoeff FH, Fletcher KA, Chimsuku LH, et
al. (2004) Haematological profiles of the people of rural southern Malawi: anoverview. Ann Trop Med Parasitol 98: 71–83.
46. Pelletier DL, Msukwa LA (1991) The use of national sample surveys fornutritional surveillance: lessons from Malawi’s National Sample Survey of
Agriculture. Soc Sci Med 32: 887–898.
47. Bowie C, Purcell B, Shaba B, Makaula P, Perez M (2004) A national survey ofthe prevalence of schistosomiasis and soil transmitted helminths in Malawi.
BMC Infect Dis 4: 49.48. Carneiro IA, Smith T, Lusingu JP, Malima R, Utzinger J, et al. (2006) Modeling
the relationship between the population prevalence of Plasmodium falciparum
malaria and anemia. Am J Trop Med Hyg 75: 82–89.
49. Bruce MC, Donnelly CA, Packer M, Lagog M, Gibson N, et al. (2000) Age- and
species-specific duration of infection in asymptomatic malaria infections in anendemic population in Papua New Guinea. Parasitology 121: 247–256.
50. Bruce MC, Galinski M, Barnwell JW, Donnelly CA, Walmsley M, et al. (2000)Genetic diversity and dynamics of P. falciparum and P. vivax populations in
multiply infected children with asymptomatic malaria infections in Papua New
Guinea. Parasitology 121: 257–272.51. Farnert A, Snounou G, Rooth I, Bjorkman A (1997) Daily dynamics of
Plasmodium falciparum subpopulations in asymptomatic children in a holoendemicarea. Am J Trop Med Hyg 56: 538–547.
52. Binka F, Akweongo P (2006) Prevention of malaria using ITNs: potential for
achieving the millennium development goals. Curr Mol Med 6: 261–267.53. Stevens W, Wiseman V, Ortiz J, Chavasse D (2005) The costs and effects of a
nationwide insecticide-treated net programme: the case of Malawi. Malar J 4:22.
54. Smith T, Felger I, Fraser-Hurt N, Beck HP (1999) Effect of insecticide-treatedbed nets on the dynamics of multiple Plasmodium falciparum infections. Trans R Soc
Trop Med Hyg 93 Suppl 1: 53–57.
55. Mathanga DP, Campbell CH, Taylor TE, Barlow R, Wilson ML (2006) Sociallymarketed insecticide-treated nets effectively reduce Plasmodium infection and
anaemia among children in urban Malawi. Trop Med Int Health 11:1367–1374.
56. Fraser-Hurt N, Felger I, Edoh D, Steiger S, Mashaka M, et al. (1999) Effect of
insecticide-treated bed nets on haemoglobin values, prevalence and multiplicityof infection with Plasmodium falciparum in a randomized controlled trial in
Tanzania. Trans R Soc Trop Med Hyg 93 Suppl 1: 47–51.
Mixed-Species Malaria
PLoS ONE | www.plosone.org 17 July 2008 | Volume 3 | Issue 7 | e2775
Top Related
Copyright © 2022 FDOKUMEN

