


Bahasa
Halaman
Hukum

Volume 1 Issue 2 July 2013
SCHOLARS WORLD-INTERNATIONAL REFEREED MULTIDISCIPLINARY JOURNAL OF CONTEMPORARY RESEARCH EISSN 2320-3145, ISSN 2319-5789
Website: www.scholarsworld.net E-mail: [email protected]
Editor
DDrr.. MMaannoojj KKaammaatt ((IInnddiiaa))
Managing Editor
IIsshhttiiyyaaqquuee AAhhmmeedd ((IInnddiiaa))
Disclaimer:
The views articulated in the journal are those of author(s) and not the publisher or the
Editorial Board. The readers are informed, authors, editors or the publisher do not owe
any responsibility for any damage or loss to any person for the result of any action
taken on the basis of the work. © The articles/papers published in the journal are
subject to copyright of the publisher. No part of the publication can be copied or
reproduced without the permission of the publisher.
Published By:
Maaz Publications
H.No.117, S.No.170, Zaitoon Pura, Malegaon Nasik, Maharashtra, India, 423203
SCHOLARS WORLD-INTERNATIONAL REFEREED MULTIDISCIPLINARY JOURNAL OF CONTEMPORARY RESEARCH EISSN 2320-3145, ISSN 2319-5789
www.scholarsworld.net [email protected] Volume.1, Issue.2, July 2013
CONTENTS
1.
English Literature
01-10 Learning English through Collaborative projects: A case study
Mr. Abderrahmane BASSOU,((AAllggeerriiaa))
2.
Human Behavior
11-23 A Sociolinguistic Study of Interruptions as a Cause of Conflicts in Mixed-Sex Conversations
Maliha Khadidja Meziane ,((AAllggeerriiaa))
3.
Business Management
24-31 Mapping The landscape: Corporate Social Responsibility For Universal Market Access
Dr. S.N.Pgupta, Dr. Rakhi gupta ,Dr. Divya gupta choudhry, ((IInnddiiaa))
4.
English Literature
32-47 A Genre Analysis Of Business English E-Mails The Case Of A Multinational’s Algerian Employees
Amina Kerkeb ,((AAllggeerriiaa))
5.
Finance
48-56 Factors influencing the purchase of Private labels: a case study on Croma
Dr.Prashant Rastogi, ((IInnddiiaa))
6.
Geography
57-65 Employment Rate And Socio-Economic Status of Beggars In Rural Areas of Aligarh District
Dr. Jabir Hasan Khan, Dr. Menka, Dr. Falak Butool, ((IInnddiiaa))
7.
Urdu Literature
66-78 Traditions of Patriotism in Urdu poetry: A critical study with special reference to the Poet of the east
Allama Iqbal and his poetry
Dr. Md Yahya, ((IInnddiiaa))
8.
Management
79-88 An analytical study on performance measurement system of supply chain Management in HLL life
Care Ltd, Trivandrum
Dr. S. Raja Mohan, E.V. Rigin ((IInnddiiaa))
9.
English Literature
89-94 Lost Dreams and Unbroken Threads in Tea by Velina Hasu Houston
Imene Zellat-Henry, ((AAllggeerriiee))
10.
Computer Science
95-106 A Comparative Study of Two Operating Systems: Windows 7 And Windows 8
Vivek Sen Saxena, Kalpana Gupta, Barkha Kakkar ((IInnddiiaa))
11.
Banking
107-126 Comparative Financial Performance of HDFC Bank and ICICI Bank
Dr. K. Srinivas,L. Saroja,((IInnddiiaa))
12.
Business Management
127-132 Case of Logistics and Information System (LIS) VIS a VIS Mc Donald’s
DrAnubha Vashisht, DrAakanksha Uppal, ((IInnddiiaa))
13.
Mutual Fund
133-142 Risk Adjusted Performance Evaluation of Selected Balanced Mutual Fund Schemes in India
H. Ranjeeta Rani, Dr. K. Mallikarjuna Rao ((IInnddiiaa))
14.
History
143-153 ‘Partition and the Sikh Diasporic Consciousnesses in Anita Rau Badami’s can you Hear the Nightbird
Call?
Meera Bharwani, Phd ((IInnddiiaa))
15.
Book Review (Politics)
154-155 Conversations with Thaksin – from Exile to Deliverance: Thailand’s Populist Tycoon Tells his Story
William J. Jones (TThhaaiillaanndd)
16
Education
156-161 ICT- A Catalyst of Teaching – Learning Process
Dr. Sneha Amre, Prof. Shashi Gupta ((IInnddiiaa))

SCHOLARS WORLD-INTERNATIONAL REFEREED MULTIDISCIPLINARY JOURNAL OF CONTEMPORARY RESEARCH EISSN 2320-3145, ISSN 2319-5789
www.scholarsworld.net [email protected] Volume.1, Issue.2, July 2013 [1]
LEARNING ENGLISH THROUGH
COLLABORATIVE PROJECTS: A CASE STUDY
MR. ABDERRAHMANE BASSOU,
EFL Teacher (MAA)
Faculty of letters and Languages,
Department of Foreign Languages,English Section.
The University of Tlemcen, Algeria
ABSTRACT
English language learning and teaching in Algeria is noticing a considerable shift in the way it is
taught. More emphasis is put on the learner and on the ways that might make him responsible of
his own learning. To do, the Competency Based Approach has been adopted, and ELT Text-
books have been shaped in such a way to meet its most basic principles. These text-books are
arranged in the form of units ending up in a learners’ classroom presentation of a collaborative
project. The spirit of this task is deeply rooted in the Vygotskian socio-constructive learning
theory that encourages interdependence and scaffolding among the members of the same group.
In this study the researcher tries to see whether learners really collaborate while working on their
projects and thus scaffold one another’s learning and construct new knowledge. The study was
conducted through two questionnaires and a classroom observation. One questionnaire was
administered to 35 Secondary school teachers, and the second to 39 first year secondary school
learners. The learners belonged to the same class and were divided into seven groups of five
members and one of four. After analyzing the data, the researcher has come to the conclusion that
teachers’ classroom practices do not facilitate the integration of social learning principles such as
collaboration, scaffolding, negotiation of meaning, self evaluation, and reflective learning among
their learners. This fact would not enable the learners build classroom habits that they may take
and use when they are working together on their projects out of the school walls. In addition to
that, the learners recognize not to collaborate while working on their projects, and they rather rely
on one or two of their peers to do the whole work and hand it to the teacher to have a look at it
before the final presentation in the form of a ‘reading aloud session’ in front of their classmates.
Thus, it is up to these findings that the researcher has suggested a project model as a key solution
to maximize the benefits from such a language learning task, and pave the way to a more
rewarding collaborative learning activity.
Keywords: English language learning, socio-constructive learning, ELT Text-books, language
learning task
SCHOLARS WORLD-INTERNATIONAL REFEREED MULTIDISCIPLINARY JOURNAL OF CONTEMPORARY RESEARCH EISSN 2320-3145, ISSN 2319-5789
www.scholarsworld.net [email protected] Volume.1, Issue.2, July 2013 [2]
INTRODUCTION:
The educational reform that was launched in Algeria during the academic year 2002/2003 noticed a change in
the teaching methodology of all subjects taught throughout the different school levels. This newly introduced
approach is: competency based. This approach tries to help the pupil give a sense to his learning, make him
acquire intellectual competencies and develop diverse and necessary processes for assimilating and using these
knowledge beyond the school walls. This is why a shift in the teaching methodology of the English language is
being noticed. It is no more a matter of filling the learner with knowledge, but rather a question of trying to
help him take part in and become responsible of his own learning by giving him the chance to find answers to
questions related to his everyday life experiences, to adopt responsible and more autonomous behaviours. To
achieve this, ELT text-books designers have adopted the philosophy of collaborative projects, among other
tasks, as a learning activity. The word “project” is used through this paper to refer to the type of assignments
that the pupils are required to do in small groups outside the school walls. A project is launched at the
beginning of each unit and develops along with the fulfillment of the lessons. It is presented when the unit is
over. The challenge is that how could teachers make good profit from this learning activity to encourage social
learning. To carry out this study, the researcher has set up three research questions:
1. Do teachers’ classroom practices prepare learners to collaborate beyond the school walls?
2. Do learners really meet when school is over to work on their projects?
3. Does the teachers’ project assessment encourage collaboration to take place?
And three hypotheses:
1. Since it’s a newly introduced approach, secondary school teachers have not yet developed the right teaching
techniques to handle it so as to encourage collaboration.
2. Learners can’t always meet out of school to work collaboratively for the preparation of their project.
Therefore, not all the group members participate in the realisation of the work.
3. Teachers’ project evaluation is not done in the way that encourages learners to collaborate.
Before proposing a model on how to handle this learning activity, I would like to shed some light on the
literature that governs both notions, ‘Social learning’ and ‘Collaborative Projects’, and discuss the case study
held with first year secondary school pupils.
PEER LEARNING THEORY:
Underlying Vygotsky’s peer learning theory is the belief that human beings are social by nature, and thus,
human cognition develops first through social interaction. King (1999) explains that development occurs as a
novice or a child and an adult or a more capable peer engage in dialogic interactions in which the more capable
participants guide the learners in accomplishing specific tasks. Through their regular interactions over time,
learners internalize the skills and abilities needed to be able to function independently. This process of
interaction between the child and a more competent other is said to affect development if the interaction occurs
within the child's zone of proximal development. According to Vigotsky (1978) the ZPD is “the distance
between the actual developmental level as determined by independent problem solving and the level of potential
development as determined through problem solving under adult guidance or in collaboration with more
capable peers”. What children can do with the assistance and help of others is more beneficial to their mental
development than while working alone.
WHAT IS A PROJECT?
Projects are intensive experiences in which learners deal with activities that are interesting to them and crucial
to their course (s) of study. Project work provides learners with opportunities to recycle known language and
skills in a relatively natural context.They can involve community members and settings, and they often end up
in an exhibition or product for a real-world purpose or audience. Project ideas can be developed by teachers or
learners, either individually or in teams. Community members may contribute to it as being resource persons or
mentors. Research and experiences outside the school building give the opportunity to the learners to learn
about their community and learn about the characteristics that make it unique. (Flemming, 2000)
SCHOLARS WORLD-INTERNATIONAL REFEREED MULTIDISCIPLINARY JOURNAL OF CONTEMPORARY RESEARCH EISSN 2320-3145, ISSN 2319-5789
www.scholarsworld.net [email protected] Volume.1, Issue.2, July 2013 [3]
BENEFITS OF THE PROJECT:
Using the project as a tool to language learning in school environments holds many benefits among which the
following can be listed; these being regarded as the most important:
� Increased motivation: learners “own the questions” and spend more time working on projects outside the
school walls.
� Increased autonomy: Pupils become more responsible and self-directed learners.
� Collaboration and support: Projects encourage the learners of different abilities to work co-operatively
on tasks of the same importance for the project achievement.
� Language re-integration: It is common use to see foreign language classes breaking down language into
its constituent parts-structures, functions, vocabulary, pronunciation and skills. In such circumstances,
projects provide a natural context in which these apparently separate parts can be re-integrated in
students’ minds. This is very important if pupils are to trust themselves in exploiting their abilities to use
English in real situations in the outside world. (Haines, 1989)
FIELD STUDY:
During this phase the researcher gathered data to see whether learners really collaborate while working on their
projects. The data collection was carried out in an analytic approach as described by (Seliger, 2000:27) "…by
analytic we mean an approach that will identify and investigate a single factor or a cluster of factors which at
some level are constituents of one of the major systems." Thus, the researcher has collected information to
analyse the way teachers deal with the project and see whether they are engaging the right techniques so as to
foster social learning. That was done through a questionnaire to the learners, another one to the teachers, and a
teacher classroom observation. Data about learners' collaborative activities during classroom sessions was also
gathered through observation. In theory it is argued that scaffolding is the result of interdependent learning
between a learner and a more competent other. This more competent other can be the teacher or another learner
as is the case with members collaborating to realize the project. Thus, this collaborative way of learning that is
supposed to pave the way to social learning has to be inculcated in the classroom through introducing
collaborative activities. These classroom collaborative activities are very essential to launch the social learning
process among learners which they are going to carry out with them outside the classroom while working away
from the teacher's presence. The researcher has tried to find out the way the learners work out of school. What
sources of information they use for the completion of their tasks and the way they treat this information to
prepare their projects. The researcher has also gathered information about learners’ schedule in school and the
difficulties the learners face to meet and work together. The researcher has also tried to see how teachers assess
the project and whether they give importance to the project as a process or as a product; and what their attitude
towards the project is. All these data have been treated, analysed and conclusions have been drawn.
FINDINGS:
Since the project is a ‘newly- implemented’ activity, and secondary school teachers are still not well prepared
to it, It can come true that some of them would rather avoid assigning it and keep teaching their learners the
way they used to do before the implementation of the competency-based approach. Fortunately, this is not the
case here since (88.55%) of the teachers recognise to assign this activity to their pupils. However, (22.85%)
admit not to do. This actually represents a high rate if we consider the central role played by the project within
the competency-based approach.
Although the layout of the project in the pupils’ text-book is positioned at the end of the unit, project work is
assumed to run in parallel with the unfolding of the courses. Therefore, it is the teachers’ role to present it to
their learners at the beginning of the unit so as to allow them applies in the project what they learn in class.
Announcing the project at the beginning of the unit aims at raising the learner's awareness about his
responsibility to take in charge his own learning at least for the project realization. That will make him start to
think, altogether with his peers, about what to do, where to get the information from, how to organize it, and
what language forms to use from the very beginning of the unit. This is, in fact, what most of the teachers
(68.57%) are actually doing according to their responses in the questionnaire and also the notes taken during the
classroom observation.
However, this presentation of the project at the beginning of the unit will remain inefficient as far as fostering
social learning is concerned if other practices aren’t taken into account. For instance, setting the learners free to
SCHOLARS WORLD-INTERNATIONAL REFEREED MULTIDISCIPLINARY JOURNAL OF CONTEMPORARY RESEARCH EISSN 2320-3145, ISSN 2319-5789
www.scholarsworld.net [email protected] Volume.1, Issue.2, July 2013 [4]
join the group they want, and allowing them to divide the labour among themselves are very recommended
behaviours towards creating safe settings for shy learners . When a learner chooses his own group, he is supposed
to cope better with his peers than when placed in a group recommended by the teacher. He will be more efficient,
less anxious, more motivated, and willing to take risks and collaborate with the members of his group. Kohonen
(1992) claims the benefit of collaborative learning as being a means of increasing learner motivation: “learners
work together to accomplish shared goals…..since all group members now share a common goal, they are
motivated to work together for mutual benefit”. Unfortunately, the data collected shows that (54.30%) of the
informants decide about the group formation, and (62.85%) tell their pupils which tasks to perform.
Besides, the competency based approach favours discovery learning, in that the teacher does not provide the
knowledge to the learner, but builds scaffolds to allow him discover the language point to be learnt in class. If this
language point is to be re-exploited within the group, then it is the teacher’s responsibility to remind the learners to
bear it in mind so as to apply it in their projects. Therefore, it is very important that the teachers keep reminding
their pupils of the project tasks they have to do whenever they are well equipped in terms of skills to do so.
Actually, teachers aren’t aware of this point, since (57.15%) admit not to do and even the teacher with whom the
researcher attended the lessons of the whole unit doesn’t seem to grant this aspect the importance it deserves.
A major factor that paves the way to collaboration outside the school is the teachers' introduction of
collaborative activities to his learners in class. That is to say, this habit of working in groups and interacting in
social-like situations should be inculcated by the teachers in their learners until it becomes a well established
habit which they will carry out of school and work in small groups to scaffold one another’s learning away from
the teachers' help while working on the project. As Littlewoods (1993) puts it, “learners can not be prepared for
communication unless their classroom experiences, too, include forms of interaction in which they participate
autonomously to the development of discourse.” Although (51.43%) of the teachers recognise to plan
collaborative activities, the classroom observation and the data collected in the learners’ questionnaire prove the
contrary. In fact (61.53%) of the pupils recognise not to meet while working on their projects and (25.64%) of
them affirm to do with very low frequency of meetings.
A ready- made project is a work which does not involve the learners at any level of its realization except from
copying it down from a book or printing it from the internet and then handing it to the teacher or reading it for
class mates. This way of doing the project will undoubtedly not benefit the learners nor would it render them
more self- confident, responsible and efficient language learners. Their language proficiency may not improve
since they do not collaborate to construct the project and practice the language forms seen in the classroom.
Thus, no zone of proximal development will be available for the learners to enable scaffolding and
interdependence happen. Therefore, no cognitive development is launched and the individual learner may still
be unable to do alone what he is supposed to be able to do in group; consequently, hindering the way to social
learning and cognitive development. The data collected about this fact show that (10.25%) of the pupils who
use the Internet to collect information do their own research on the Internet, (17.94%) get helped by the cyber
space owners or by a member of the family, (43.58%) rely totally on others (cyber space owners, family
members) and do not even sit in front of the computer to do their research, whereas the rest of the informants
(28.20%) haven’t even answered this question. Moreover, (61.53%) of the informants recognize not to meet to
work on their projects, and (48.71%) of them recognise not to summarise in their own Words what they have
found in books or in the Internet.
Stressing the importance of the project as a product over the project as a process makes the teacher announce
the topic of the research at the beginning of the unit and forgets all about it until its end where he asks his
learners to present their work to the class if ever they have prepared anything to read. However, giving
importance to the process, would keep the learners out of sight but in mind of the teacher who gives continuous
advice and discusses the difficulties encountered by his pupils all along the realisation of their work until its
presentation while completed. This would certainly benefit the learners as they grow using the target language
to work in small groups away from the supervision of their teacher.
Actually, the data collected shows that (48.57%) of the teachers give consideration to the final product and
(37.57%) of them give more importance to the process. Nevertheless, even those who admit to favour the process
over the product don’t seem to deal correctly with the evaluation practices that are the main part of that process.
The way the teachers evaluate the project is definitely decisive in shaping the learners ' manner of doing their
collaborative work. Teachers should keep a close eye on the process while evaluating, i.e., the way the learners
proceed while realizing their project, rather than simply considering the product and grading it. Thus, it is
fundamental that teachers give an evaluation grid to the learners, so that they know what to give more
SCHOLARS WORLD-INTERNATIONAL REFEREED MULTIDISCIPLINARY JOURNAL OF CONTEMPORARY RESEARCH EISSN 2320-3145, ISSN 2319-5789
www.scholarsworld.net [email protected] Volume.1, Issue.2, July 2013 [5]
importance to, and what to spend more time on beforehand. Besides, it will enable them evaluate themselves as
they progress towards the achievement of their planned objectives. On the other hand, if teachers are to favour
collaboration instead of competition, they have to give a single mark to the whole group. In doing so, teachers
push learners to help one another realise something collectively so as to come to the end of a shared objective.
Evaluation does not stand at this level, but goes beyond it and takes into consideration the following factors: the
choice of the way the work should be presented (wall posters presentation, data show presentation, classical
classroom presentation, or even acting it as a play); how well the learners present their work in front of their
audience; how far they can go into reflecting on their projects. The fact of being able to spot their mistakes,
weaknesses and decide to avoid doing or bring improvements on them in the coming projects is an enormous step
towards taking responsibility for their own learning. This of course will require individual and collective reflection
and effort and can lead to more responsibility, interdependence, interaction, negotiation of meaning, scaffolding,
and may pave the way to social learning and cognitive development. Actually, the data collected shows that
(57.14%) of the informants give the same mark to the whole group, which is a good thing to note. Yet, (90%) of
them don’t give evaluation grids to their pupils. In addition to that, (68.58%) admit not to encourage their learners
to reflect on their works and the same observation was done during the classroom observation.
The teacher's questionnaire ends up in a question that measures the attitude towards the project. It goes without
saying that teachers who have a negative attitude towards the project, are likely not to handle the project as it
has to be done. They may have a negative influence on their learners, who will not seize this opportunity to
practice the target language collaboratively with their group members away from their stance. This is also true
with learners having negative attitudes who may be less collaborative and less willing to get involved in the
project realisation. Unexpectedly, the data collected in this context shows that (48.57%) of the teachers have a
positive attitude and (37.15%) had a negative one, whereas (14.28%) haven’t shown their opinion.
Bearing in mind our research questions and the hypotheses set to shape and conduct this study, the findings
have almost totally validated the doubts concerning the teachers’ practices and the learners’ ways of dealing
with the project work as a means to promote social learning at the level of secondary school education. In fact,
most of the teachers seem not to have prior knowledge on the way the project should be handled. Confined to
their classical ways of teaching, they don’t even give the impression to know that one of the objectives of
assigning project works is to render the learners more responsible about their own learning and thus initiating
them to more interaction and collaboration. The high rate of the teachers having a negative attitude towards the
project work clearly shows how strong some of them fight against the change and keep enjoying their status of
classroom rulers and knowledge holders. One remark that really strikes was that made by a teacher stating that
“…the project isn’t worth the trouble”. This goes without saying that learners are the first victims and their
learning processes will be directly affected. Awkwardly guided, they appear to be in a ‘no man’s land’, not
knowing where to go and how to reach their destination. In the minds of their teachers they are working in
groups, fairly dividing the tasks among themselves, doing their own research, and collaborating out of school to
shape and construct their projects, but the reality revealed in the data has proved the contrary.
This study has shown that teachers are only satisfied by the project as a final product and even assessment isn’t
done in a way that favours the realisation of the project as a process and therefore compelling the learners to
work together towards a final common objective. All in all, we can conclude that first year secondary school
pupils aren’t given the full ingredients of classroom practices that make of them more collaborative and
interactive while working together on their projects.
PROJECT MODEL FOR ALGERIAN SECONDARY SCHOOL LEARNERS:
Competency-based Learning is motivated by the idea that the classroom should prepare learners for life. It
enables Learners to acquire knowledge and develop skills and strategies that help them complete the kind of
tasks they would do in real life. The actual English syllabi for all school levels require from learners to prepare
a project for each unit to show that they have learnt something in class and that they can apply it in their
collaborative projects away from their teacher’s stance. As it is commonly agreed upon by many scholars such
as Stoller (1997) and Papanderou(1994), preparing learners to realize a successful project starts before its
assignment and goes along with the unfolding of the unit until it is totally completed. Here is a model that the
researcher has developed to guide teachers better use this language learning tool.(1997) and
Papanderou(1994), preparing learners to realize a successful project starts before its assignment and goes along
with the unfolding of the unit until it is totally completed. Here is a model that the researcher has developed to
guide teachers better use this language learning tool.

SCHOLARS WORLD-INTERNATIONAL REFEREED MULTIDISCIPLINARY JOURNAL OF CONTEMPORARY RESEARCH EISSN 2320-3145, ISSN 2319-5789
www.scholarsworld.net [email protected] Volume.1, Issue.2, July 2013 [6]
� STEP ONE: BEFORE THE ANNOUNCEMENT:
While preparing the unit plan, the teacher has to continuously keep in mind the project requirements and plans
his lessons accordingly so as to meet the learners language needs in terms of project realization. Here is a list of
activities the teacher should consider while planning his lessons:
� Activities where learners alone or in collaboration with their peers discover and practise:
• Grammatical forms that are supposed to be re- used during the project writing.
• Most common vocabulary that learners may use in their project.
• Questioning, answering, agreeing, disagreeing, paraphrasing and reporting (in case they have to do survey
for instance).
� Activities where learners are involved in discussing, negotiating, and sharing ideas to engage social
learning and to develop creative writings.
� Activities that require whole class cooperation and sharing.
� Activities where learners are involved in answering and comparing their answers with those of their mates.
The list of tasks is not exhaustive and the teacher should think of introducing those which encourage discovery
learning, collaboration, negotiation of meaning, thinking and sharing. Otherwise, unless the teacher introduces
those fundamental functions within his lessons, learners will probably have a difficult time working in groups,
and social learning will in no way have a chance to be fostered.
� STEP TWO: WHILE ANNOUNCING:
Although the layout of the project in most of the ELT text-books is positioned at the end of the unit, project
work is assumed to run in parallel with the unfolding of the lessons. Therefore, it is the teachers’ role to present
it to their learners at the beginning of the unit so as to allow them to put into practice what they have learnt in
class. Announcing the project at the beginning of the unit aims at raising the learner's awareness about his
responsibility to take in charge his own learning at least for the project realization. That will make him start to
think, altogether with his partners, about what to do, where to bring the information from, how to organize
them, and what language forms to use from the very beginning of the unit. The teacher's role during the project
realization is multifaceted. Here are some of the roles the teacher and learners should assume to succeed a
project that may foster social learning:
• The teacher should refer the learners to the text-book page where the project is positioned and set them in
small groups to read its instructions.
• While they have finished reading, the teacher launches a discussion with the learners about what they are
supposed to do during this project. This step will allow pupils talk, explain, ask for clarifications and get
things clearer for the project preparation.
• The learners should talk about the different tasks of the project and their gradation.
• Teachers should set the learners free to change the gradation of the project tasks and add any other task
they see enriching to their project realization.
• While things are made clear, the teacher asks the learners to rejoin their groups and spot the things they
know, the things they don’t know and where they intend to bring the information from. The teacher can help
by drawing the following table on the board that the learners will complete in their respective groups.
TABLE 1 TASK, SOURCES OF INFORMATION AND MATERIAL NEEDED FOR THE PROJECT
Things we know Things we don’t know Source of information Material we need.
(example)
-part one in task two
-part two and four in
task three
(example)
-the remaining tasks
(example)
- library
-internet
-history text-book
-ask Ahmed’s father
who is specialist in the
field
(example)
-pens
-Writing paper
-hard paper
-glue
-the school video
-the school data show
-a tape recorder
SCHOLARS WORLD-INTERNATIONAL REFEREED MULTIDISCIPLINARY JOURNAL OF CONTEMPORARY RESEARCH EISSN 2320-3145, ISSN 2319-5789
www.scholarsworld.net [email protected] Volume.1, Issue.2, July 2013 [7]
• After learners complete the table, they should divide the labour ,i.e.; the tasks. At this level the teacher
should not tell each pupil within the group what to do but ought to set them free to decide who will do
what as this may certainly be a step towards taking responsibility for their own decisions. It is advisable
that learners provide the teacher with the names of the learners within the groups and the task assigned to
each of them so as the teacher knows who will do what and to avoid that the same pupils perform the
same tasks for the coming project. It won’t be of any help if a slow learner keeps doing only the non
linguistic tasks such as drawing or finding photos, those will be convenient starting activities to involve
him in the process of social learning, but should move on towards more challenging tasks as he shifts
away from one project to another.
• After deciding who will do what, pupils should agree about a time table to meet out of the classroom.
Here also they are required to decide when and where they should meet to read, check and correct one
another’s work. If a group finds difficulties to meet, the teacher should get involved in the discussion and
tries to propose practical solutions such as talking to the head master of the school to allow them stay in
the classroom or in the library when they have a free time to work on their projects.
• Bearing in mind the nature and the objectives of the project, learners and teacher determine its final
outcome (example: bulletin board display, written report, debate, brochure, letter, handbook, oral
presentation, video, multimedia presentation, theatrical performance).
• Now that everything is decided, pupils should make an action plan with priorities and deadlines, i.e. they should
decide which tasks to do first, which to do later on and when to prepare every task and finish the whole work.
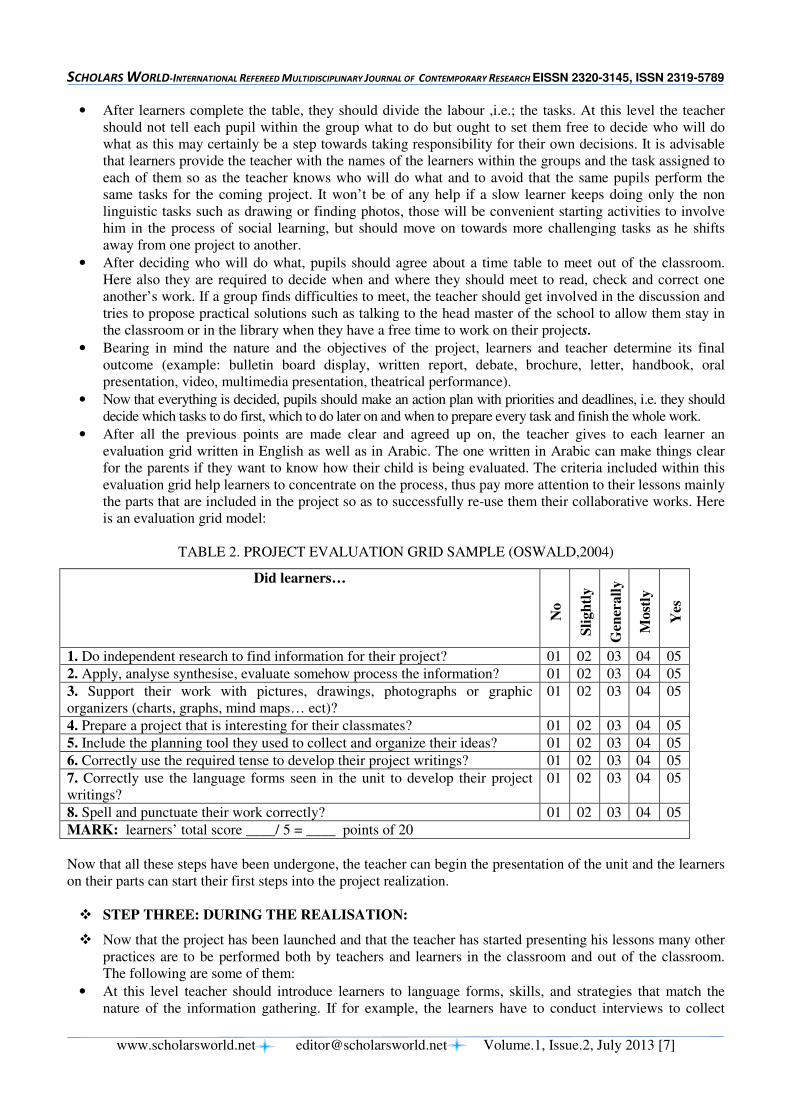
• After all the previous points are made clear and agreed up on, the teacher gives to each learner an
evaluation grid written in English as well as in Arabic. The one written in Arabic can make things clear
for the parents if they want to know how their child is being evaluated. The criteria included within this
evaluation grid help learners to concentrate on the process, thus pay more attention to their lessons mainly
the parts that are included in the project so as to successfully re-use them their collaborative works. Here
is an evaluation grid model:
TABLE 2. PROJECT EVALUATION GRID SAMPLE (OSWALD,2004)
Did learners…
No
Sli
gh
tly
Gen
erall
y
Most
ly
Yes
1. Do independent research to find information for their project? 01 02 03 04 05
2. Apply, analyse synthesise, evaluate somehow process the information? 01 02 03 04 05
3. Support their work with pictures, drawings, photographs or graphic
organizers (charts, graphs, mind maps… ect)?
01 02 03 04 05
4. Prepare a project that is interesting for their classmates? 01 02 03 04 05
5. Include the planning tool they used to collect and organize their ideas? 01 02 03 04 05
6. Correctly use the required tense to develop their project writings? 01 02 03 04 05
7. Correctly use the language forms seen in the unit to develop their project
writings?
01 02 03 04 05
8. Spell and punctuate their work correctly? 01 02 03 04 05
MARK: learners’ total score ____/ 5 = ____ points of 20
Now that all these steps have been undergone, the teacher can begin the presentation of the unit and the learners
on their parts can start their first steps into the project realization.
� STEP THREE: DURING THE REALISATION:
� Now that the project has been launched and that the teacher has started presenting his lessons many other
practices are to be performed both by teachers and learners in the classroom and out of the classroom.
The following are some of them:
• At this level teacher should introduce learners to language forms, skills, and strategies that match the
nature of the information gathering. If for example, the learners have to conduct interviews to collect

SCHOLARS WORLD-INTERNATIONAL REFEREED MULTIDISCIPLINARY JOURNAL OF CONTEMPORARY RESEARCH EISSN 2320-3145, ISSN 2319-5789
www.scholarsworld.net [email protected] Volume.1, Issue.2, July 2013 [8]
information, the teacher may plan activities in which the learners form questions, requests, clarifications
and take notes. If the learners are supposed to write letters, the teacher should review the way letters are
conceived. If they have to apply for a job, teacher may introduce the way applications are written.
• Teacher should remind the learners about the project whenever they are well equipped in terms of skills
to do so. That is to say, when ever learners come across a language point or a writing technique that is
supposed to be used in the project, then it is the teacher’s responsibility to keep them aware of the fact.
• Following the stage of practicing the skills, strategies, and language forms needed for gathering
information, learners are ready to gather information and organize it. At this level, the learners need to
master the language skills, and strategies required for the compilation, the analysis, and syntheses of the
information they have gathered from different sources. Teacher prepares learners to do this on their own
through activities that involve, for example, categorization, making comparisons, and using graphic
organizers such as charts.
• Whenever a pupil has performed a task he should meet with his group members to discuss, check and
correct the mistakes or even bring improvements on it.
• Teacher should encourage the learners to use diaries to keep track and record of their work when they
meet. This document can help teachers have evidence of the learners’ meetings out of school and also on
their on-going planning. These diaries can include the following information:
Date/Place: .......................................
Timing: ...........................................
Task Performer: ............................
Project Title: ..................................
Task Title: ……………..………….
The original copy of the task performed by the pupil
..........................................................................................................................
...........................................................................................................................
...........................................................................................................................
...........................................................................................................................
........................................................................................................................... .
The Collective corrected version of the task
..........................................................................................................................
...........................................................................................................................
...........................................................................................................................
...........................................................................................................................
Remarks: This part may include types of mistakes the learner did.
a. Grammatical mistakes: (for example, tense used when narrating is the simple past rather than the simple
present)
b. Spelling mistakes: (refer to dictionary)
c. Format of writing: (refer to lesson done in the classroom for example about how to write a letter, an
application, an invitation…)
What have we done in this meeting? a. We have...........................
b. We have...........................
What have we learnt in this meeting? a. We have..........................
b. We have..........................
Next task to be prepared and corrected: …………………… (Title)
Name of the Performer: ……………………
Meeting Date/Place: …………………
Timing: ……………………
SCHOLARS WORLD-INTERNATIONAL REFEREED MULTIDISCIPLINARY JOURNAL OF CONTEMPORARY RESEARCH EISSN 2320-3145, ISSN 2319-5789
www.scholarsworld.net [email protected] Volume.1, Issue.2, July 2013 [9]
• Though the over loaded syllabus does not permit teachers to spend full sessions to deal with the project in
the class room, teachers should devote at least half an hour a week to interact with learners about their
project development and see what they have achieved. It’s true that the project is aimed to be prepared
out of the teacher’s sight but should not be out of his mind otherwise the aim behind it wouldn’t be
achieved. Before handing in their project to the teacher, learners should check if their project meets all the
necessary criteria (correct use of grammar, creative work, visual support of information…) and change it
if necessary.
• After the teacher spots the mistakes and gives back the works to the pupils, they must meet again
somewhere to correct and rewrite their final works.
STEP FOUR: DURING THE PRESENTATION:
Now that the learners have read, corrected and completed their project, they can present it in front of their
classmates and the guests they have decided to invite. However, the learners should prepare themselves
beforehand to their class mates’ questions. To get around their friends tricky questions learners can follow the
strategies below:
• Before presenting the project learners can predict a list of questions that their class mates may ask and
work on them to provide the suitable answers.
• Every pupil within the same group reads his partner’s work and asks questions to the whole group
members. This will allow them practice questions, explanations and negotiation of meaning before
presenting the work.
� STEP FIVE: AFTER THE PRESENTATION:
Although teacher and learners view that the presentation of the collaborative work as the final stage of the
project work process, it is almost very beneficial to ask learners reflect on this experience as the last step.
Learners reflect on the language mastered to complete the project, the content that they have learned about the
targeted topic, the steps that they have followed to fulfill their work, and the effectiveness of their final product.
(Stoller, 1997). Learners can suggest new things for coming projects and answer questions such as: what did
you do in this project, what was the easiest part of the project, what was the most difficult
one, what did you like the most/the least in the project and why? Would you like to change anything next time -
if so what? What advice would you give to another group doing the same project? As learners reflect on what
worked well, what did not, and how they can learn from their experiences, they become better monitors of their
own learning; they develop more confidence and self-awareness as they use their own strength to demonstrate
learning and understanding rather than simply showing their ability to recall memorized information during a
formal class situation. (Douglas, 2000:5)
CONCLUSION:
Using collaborative projects to implement curricular objectives puts the focus on the learner and promotes
experiential learning. The discourse generated by the project helps the student to grow, maturing both as a
learner of English and as human being, whose social needs are not disregarded. When applied at the right time
and in the right way, the project not only successfully achieves the learning outcomes identified in the school
curriculum, among which is empowering social learning, but also “consolidates and extends learning, increases
motivation, enhances classroom dynamics, and promotes learner- autonomy.” (Sandy, 2006).
REFERENCES:
1. Douglas. H, Brown (1980): Principles of Language Learning and Teaching. Prentice-Hall, Michigan
University
2. Douglas S. Fleming (2000): A Teacher’s guide to project-based learning. AEL, Inc. The Office of
Educational Research and Improvement ,US Department.
3. Haines, H. (1989): Projects. Thomas and Sons Limited.
4. King, A & O'Donnel.M .Angela (1999): Cognitive perspectives on peer learning. Mahwah,NJ.
Publications

SCHOLARS WORLD-INTERNATIONAL REFEREED MULTIDISCIPLINARY JOURNAL OF CONTEMPORARY RESEARCH EISSN 2320-3145, ISSN 2319-5789
www.scholarsworld.net [email protected] Volume.1, Issue.2, July 2013 [10]
5. Kohonen, V. (1992a): Experiential language learning: second language learning as cooperative learner
education. In D. Nunan (Ed.). (1992a) Collaborative language learning and teaching. Cambridge:
Cambridge University Press, 37-56.
6. Littlewood, W.(1999): Defining and developing autonomy in East Asian contexts. Applied Linguistics 20
/1:71-94.oxford: Oxford University Press.
7. Sandy, C. (2006). Student projects in the EFL classroom - why and how? Available at:
http://www.eltcalendar.com/events/details/313
8. Seliger,W. Herbert & Shohamy Elena (1989): Second language research methods: Oxford, Oxford
University Press.
9. Stoller L.Fredricka (1997).Project work: a means to promote language content.Forum35, 4, pp2-9.
10. Oswald Alison, (2004). Project Work: Seminar for Middle School Inspectors Ghardaia, Algeria,
December 3-11, 2004.
11. Papandreou P. Andreas,(1994): An Application of the project approach to EFL. Forum32, 3, p.4
12. Vygotsky, L. S. (1978). Mind in society: the development of higher psychological processes. Boston:
Harvard University Press.
----
SCHOLARS WORLD-INTERNATIONAL REFEREED MULTIDISCIPLINARY JOURNAL OF CONTEMPORARY RESEARCH EISSN 2320-3145, ISSN 2319-5789
www.scholarsworld.net [email protected] Volume.1, Issue.2, July 2013 [11]
A SOCIOLINGUISTIC STUDY OF INTERRUPTIONS AS A CAUSE
OF CONFLICTS IN MIXED-SEX CONVERSATIONS
MALIHA KHADIDJA MEZIANE,
Abou Bakr Belkaid University of Tlemcen,
Algeria (Africa)
ABSTRACT
This research study uses a sociolinguistic methodology where 12 recorded excerpts from daily
life interaction have been presented to 200 participants (100 men and 200 women). The audio
excerpts represent cases of interruptions in mixed-sex conversations.
For the purpose of a quantitative analysis, the interruptions have been designed according to
Beattie's classification (1983) combined with individual interviews about the reasons given by
each participant when marking an interruption; following De Francisco's analysis (1991).
The findings relate to a gender difference and the results seek to prove that interruptions are a
cause of conflicts in men-women conversations. This is explained by the theory of Maltz and
Borker (1982) that men and women are raised in different subcultures.
Keywords: Language and gender- interruptions- sociolinguistics- conflict-communication
SCHOLARS WORLD-INTERNATIONAL REFEREED MULTIDISCIPLINARY JOURNAL OF CONTEMPORARY RESEARCH EISSN 2320-3145, ISSN 2319-5789
www.scholarsworld.net [email protected] Volume.1, Issue.2, July 2013 [12]
INTRODUCTION:
While sex clearly refers to the biological trait of each person, many definitions have been advanced to describe
gender, all of which are more or less analogous. A prevailing explanation relates gender to the social
relationships, roles and responsibilities of men and women, combined with the expectations held about the
characteristics, attitudes and behaviours of both men and women (femininity and masculinity) .These learned
features change over time and vary within and between cultures.
Although it is not universally accepted that men and women speak differently, key linguists versed on gender
studies have been able to prove the degree of this difference; as to the characteristics, speech features and styles
that each of men or women use while speaking. One may cite the work of Jane Pilkington (1992) asserting that
women are polite and men bad-mannered while communicating, or Jennifer Coates (1998) that women use a
cooperative style of negotiation towards other women but are competitive in mixed-sex conversations. Whereas
for Deborah Tannen (1990); men and women are “poles apart‟ when it comes to cross-cultural communication.
Consequently, men view questions as issues to be resolved and are externally focused, while women talk to
connect with the others and establish intimacy. In this view, women’s social world is a network of cooperation
but men’s social world is a hierarchy of power and face-saving (Koenraad Kuiper, 2007).
Away from the assumed position of male-standard language, inter-gender and intra-gender studies have dealt
with other areas like the control subject (Jennifer Coates and Deborah Cameron, 1988) and interruptions
(Zimmerman and West, 1975).
In this context, a special attention to speech interruptions between males and speech interruptions between
females led to a personal curiosity that misinterpretation might be a consequence of interruptions in men-
women conversations. The primary consideration behind this work was to state whether men or women
interrupt more in an inter-gender conversation; but after reading the literature about language and gender in
relation to interruptions, the idea of mechanical counting and analysing like in the work of Zimmerman and
West (1975) soon fade away. Therefore, this work is to be viewed from a sociolinguistic perspective, analysing
interruptions as a gender factor in inter-gender conversations, with an attempt to link the results to
miscommunication between males and females in Tlemcen city (Algeria). Therefore, the main research
questions seek to verify:
• Do men and women have different perceptions about interruptions? If so, is gender a sociolinguistic factor
in Tlemcen speech community?
• Can interruptions be a source of miscommunication between men and women? If so, how?
• If interruptions are a source of misunderstandings between men and women, does this comfort the
explanation given by D.Tannen (1986) that men and women are raised in different subcultures?
1. A SOCIOLINGUISTIC VIEW ABOUT SPEECH STYLE BEHAVIOURS:
The primary theoretical foundation for conversational behaviour used in the present research comes from the
discipline of sociolinguistics. According to Fasold “When people use language, they do more than just try to get
another person to understand (their) thoughts and feelings. At the same time, both people are using language in subtle
ways to define their relationship to each other, to identify themselves as part of a social group” Fasold (1990:1)
Thus, a sociolinguistic view focuses on two main features: (1) the patterns of language used within identifiable
social groups or social relationships; and, (2) what those specific communication behaviours mean to those
who use them (how communication signals an aspect of one’s self or identity as a member of a particular social
group). In other words, investigating interpersonal communication based on the basic elements or patterns of a
conversation (i.e., the structure of conversation) allows sociolinguists to discover conversational behaviours that
communicate meaning within social relationships. According to Gumperz and Tannen (1979) individual
speakers tend to use specific patterns of structural elements, and these characteristic patterns make up a person’s
conversational “strategy” or “style”. That is, individuals use particular ways of talking (style) during their
conversations, and these conversational styles consist of habitual patterns for speech rhythm, pausing, tone, and
turn taking.
Although a person’s style may vary to some extent depending on the demands of the particular context, Gumperz
and Tannen (1979) claim that we should be able to identify the characteristic conversational style that a speaker
uses in casual or friendly conversation. For example, based on ethnographic research on the natural conversation
among a small group of friends and acquaintances, Tannen (1983, 1984) has identified two specific types of
SCHOLARS WORLD-INTERNATIONAL REFEREED MULTIDISCIPLINARY JOURNAL OF CONTEMPORARY RESEARCH EISSN 2320-3145, ISSN 2319-5789
www.scholarsworld.net [email protected] Volume.1, Issue.2, July 2013 [13]
conversational styles that can occur in casual conversation. The high involvement style characterized by a fast rate
of speech, faster turn-taking, an avoidance of inter-turn pauses, and frequent initiations of simultaneous speech.
High involvement speakers use simultaneous speech to signal interest and involvement in the conversation.
Conversely, slow speech, slower turn-taking, longer pauses between turns, and an avoidance of simultaneous
speech characterizes the high considerateness style According to Tannen (1983, 1984) High considerateness
speakers operate from the rule of “do not impose‟, thus, they avoid simultaneous speech. Therefore, the intention
to be considerate or involved gives rise to each individual’s style. Tannen (1983, 1984, 1989) states that the most
successful conversations occur when two speakers use similar conversational styles because both speakers share
similar habits with regard to turn-taking pace and simultaneous speech. Moreover, social psychologists show that
individuals report that they feel more enjoyment when conversing with people who use similar temporal styles as
compared to those with people who use different styles (Welkowitz and Feldstein, 1969). Tannen (1989) explains
what happens when people use different styles. She suggests that the speaker who uses a faster turn-taking pace
and more simultaneous speech will interrupt his or her partner more frequently; thus, high involvement speakers
are more likely to interrupt high considerateness speakers. Interruptions occur when high considerateness speakers
pause within their turn, and high involvement speakers perceive this silence as a lack of rapport, and thus begin
speaking. However, the high considerateness speaker perceives the high involvement speaker as imposing his
speaking turn; thus; stops talking.
2. CONVERSATIONAL INTERRUPTIONS:
Conversational interruptions or as first defined by Sacks et.al (1974) as “overlap” between speakers are
found in a dialogue when there is a violation in the “turn” of a speaker. Social conventions hold that during a
speaker's turn-at-talk, each participant in a conversation should speak only when others are not speaking, or, if
overlap is to take place, that overlap should occur quite near the anticipated end of the current speaker's turn,
when overlap is more expected and common (Sacks et al, 1974). Being a member of Tlemcen speech
community, this social convention is true and applies to our hometown.
Later work by researchers interested in the relations between men and women in society (West & Zimmerman,
1983) used Conversational Interruptions as measures of attempted dominance in cross-gender interactions. They
viewed interruptions as a symbol of domination in human interaction, and used interruption tendencies as a
dependent measure in cross-gender studies to further their socio-political view that men express their power
over women through subtle, implicit means. In their research they attempted to define “interruption” in
observable empirical terms:
In contrast to overlaps, interruptions do not appear to have a systemic basis in the provisions of the turn-taking
model. An interruption involves a “deeper intrusion into the internal structure of a speaker's utterance” Than an
overlap, and penetrates well within the syntactic boundaries of a current speaker's utterance.
(West & Zimmerman,1977:523).
Interruptions, therefore, potentially take the floor away from a current speaker (the speaker can usually raise his
own speech amplitude and disallow disruption) and signify a place where the current speaker could surrender
the floor. Confirmatory “uh-huh”-type overlaps, therefore, and other such non-disruptive overlaps, are not
interruptions. West and Zimmerman conceive of a disruption as the successful ability of an interruption to force
the speaker to address the interruption in a cooperative manner.
Kohonen (2004) performed an analysis that synthesised operational definitions from Drummond (1989), Lerner
(1989), and West and Zimmerman (1983). After excluding many “interruptions” that she found to fit into a set
of predefined exclusionary principles, she found that actual interruptions (defined solely in terms of what they
were not) constituted less than 1% of cases of speech overlap. However, Kohonen's definition is somewhat
restrictive and fails to provide an actual description of an interruption, according to the critics.
Dissatisfied with the tendency of researchers like West and Zimmerman (1977) to define interruptions purely in
negative, dysfunctional terms, Kennedy and Camden (1983) investigated the various functions of interruptions
in group-work settings. Analyses of videotaped interruptions showed that up to half of all interruptions served a
positive purpose: to strengthen the message of the speaker who is interrupted, whether through supporting,
clarifying, or repeating the message. This finding motivates a categorical division between cooperative and
competitive interruptions, a distinction that Yang (2001) recently upheld.
SCHOLARS WORLD-INTERNATIONAL REFEREED MULTIDISCIPLINARY JOURNAL OF CONTEMPORARY RESEARCH EISSN 2320-3145, ISSN 2319-5789
www.scholarsworld.net [email protected] Volume.1, Issue.2, July 2013 [14]
Although Yang (2001) partially defines the two types of interruptions according to subjective concepts related
to the mindset of the interrupter, including emotions and underlying intentions (a task which is not very easy to
measure), a great contribution of his work is his finding that cooperative interruptions generally are associated
with low-pitch and low-amplitude prosodic contours, but competitive interruptions are associated with high-
pitch and high-amplitude prosodic contours. This information will be very useful since, throughout this
research, a definition to interruptions will be attempted, and thus the recorded conversations showed to the
speakers will be in normal pitch and amplitude, in order to avoid any confusion between cooperative and
competitive interruptions.
To sum up, conversational Interruptions have been defined and categorised on several levels. In order to be an
interruption, an utterance must at least be overlap with another speaker's utterance. From there, the
categorisation becomes difficult. As Kahonen demonstrated, it is possible to consider a number of points about
defining interruptions as for cooperative vs. competitive ones. But as shown in the titles, interruption is also
defined according to the culture the speakers belong to.
3. THEORETICAL EXPLANATIONS OF GENDER MISCOMMUNICATION:
Interviewing research on miscommunication problems between men and women, Maltz and Borker (1982), and
subsequently Henley and Kramarae (1988), identified four theoretical explanations which will also underlie this
research. For gender and communication research was primarily advanced by Robin Lakoff (1975), linking
gender-roles to psychological development. The theory suggests that because women's traditional gender-roles
encourage them to be submissive, they show unassertiveness and insecurity in their talk.
Following Lakoff's approach, one argument was that women use more tag questions than men and that tag
questions indicate uncertainty (e.g. “it's an interesting article, don't you think,”). Instead, in actual observations
Fishman (1978a, 1983) interpreted women’s use of tag-questions as a way to get more attention and generate
discussion when men were less cooperative in talking. Fishman's reinterpretation of Lakoff's assumption
regarding the function of tag questions indicates another problem with this approach to explaining gender
communication problems. Spender (1984, p. 200) states in this sense that not only men's communication
tendencies are defined as “the norm and women's communication as inadequate” but women, as a group, are
described as “psychologically weak”, a notion that seems rude towards women in general. Because of these
limitations with Lakoff's theory, alternative explanations for communication problems in gender have been
explored more recently.
A second theoretical approach primarily advanced by Maltz and Borker (1982), and Tannen (1982, 1986, 1989),
suggests women and men's inabilities to communicate are due to their cultural differences, as a result of being
raised in separate gender-role groups. While gender-role groups refer to consistent relationship patterns which
are derived from being raised either as a woman to be submissive, expressive and responsible for socio-
emotional concerns, or being raised as a man to be dominant, strong, and responsible for instrumental concerns
(Maltz & Borker, 1982; Peplau & Gordon, 1985; Tannen, 1986).
Based on Gumperz approach to studying cross-ethnic communication (1982), this approach assumes that
women and men are raised in different subcultures. Thus “inabilities to understand each other are not any one's
person fault, but rather the result of wrongly interpreting communication according to one's own subcultural
rules “(Maltz & Borker, 1982, p.205). A further assumption of the cross-cultural perspective is that by the time
women and men come together to communicate as adults, their separate communication rules are already well
established from earlier single-gendered peer group influences.
A third explanation for women and men's communication problems is that such miscommunications are due to
social power (West, 1979; West & Zimmerman, 1983; Zimmerman &West 1975).The suggestion here is that
men's control of conversation parallels their predominant control in the larger society. That means, in one way
social control is maintained through women and men's day-to-day interactions. Under this framework, a delayed
response in turn-taking, or an interruption may be interpreted as turn-taking violations, and patterns of these
behaviours may indicate attempts toward relational control.
The fourth theoretical perspective currently being developed by Henley and Kramarae (1988), is a comprehensive
contextual explanation of miscommunication problems between women and men. Instead of choosing between,
for example, social, psychological or cultural explanations, they suggest all of these be recognised as “political”
force. As Chodorow (1978) explained, women and men are likely to internalise traditional gender-role concerns
which influence women to be more other connected and men to be more protective of their independence, but
these can still be highly political manifestations depending on each country.
SCHOLARS WORLD-INTERNATIONAL REFEREED M
www.scholarsworld.net
Throughout this work, and in the light of the different theories proposed above, it seems ade
research question on Maltz and Borker (1982) as assumed by Crawford (1995), as an attempt to see if one of
the reasons of miscommunication between gender groups in Tlemcen, is because men and women are raised in
different sub-cultures.
4. MATERIAL AND METHODS:
This section shows the results of the investigation that have attempted to answer the research questions and the
intentions and objectives of the present study.
Each participant was tested alone by listening to the twelve recorded dialogues and had to state if ‘yes’ or ‘no’
the samples constitute an interruption. After, they gave their reasons for their decision; the responses and their
reasons were written and collected by the researcher. The total of 200 responses was arranged into four testing
groups, in order to facilitate the comparison between the gender groups.
This section shows the results of the investigation that have attempted to answer the research
intentions and objectives of the present study.
Each participant was tested alone by listening to the twelve recorded dialogues and had to state if ‘yes’ or ‘no’
the samples constitute an interruption. After, they gave their reasons for t
reasons were written and collected by the researcher. The total of 200 responses was arranged into four testing
groups, in order to facilitate the compari
4.1 Quantitative Results:
In this section, the quantitative analysis will help to give a clear statement about the interpretation of
interruptions by males and females.
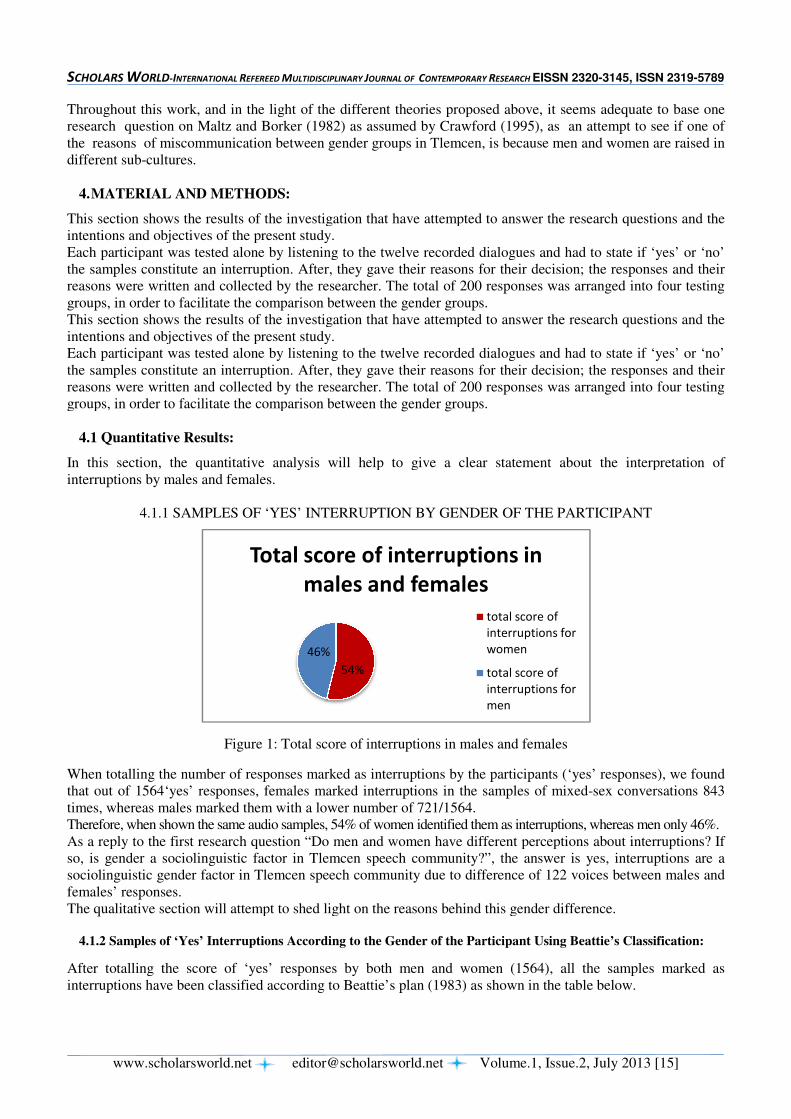
4.1.1 SAMPLES OF ‘YES’ INTERRUPTION BY GENDER OF THE PARTICIPANT
Figure 1: Total score of interruptions in males
When totalling the number of responses marked as interruptions by the participants (‘yes’ responses), we found
that out of 1564‘yes’ responses, females marked interruptions in the samples of mixed
times, whereas males marked them with a lower number of 721/1564.
Therefore, when shown the same audio samples, 54% of women identified them as interruptions, whereas men only 46%.
As a reply to the first research question “Do men and women have different perceptions about interru
so, is gender a sociolinguistic factor in Tlemcen speech community?”, the answer is yes, interruptions are a
sociolinguistic gender factor in Tlemcen speech community due to difference of 122 voices between males and
females’ responses.
The qualitative section will attempt to shed light on the reasons behind this gender difference.
4.1.2 Samples of ‘Yes’ Interruptions According to the Gender of the Participant Using Beattie’s Classification
After totalling the score of ‘yes’ responses by both
interruptions have been classified according to Beattie’s plan (1983) as shown in the table below.
Total score of interruptions in
MULTIDISCIPLINARY JOURNAL OF CONTEMPORARY RESEARCH EISSN 2320
[email protected] Volume.1, Issue.2,
Throughout this work, and in the light of the different theories proposed above, it seems ade
research question on Maltz and Borker (1982) as assumed by Crawford (1995), as an attempt to see if one of
the reasons of miscommunication between gender groups in Tlemcen, is because men and women are raised in
MATERIAL AND METHODS:
This section shows the results of the investigation that have attempted to answer the research questions and the
intentions and objectives of the present study.
Each participant was tested alone by listening to the twelve recorded dialogues and had to state if ‘yes’ or ‘no’
the samples constitute an interruption. After, they gave their reasons for their decision; the responses and their
llected by the researcher. The total of 200 responses was arranged into four testing
groups, in order to facilitate the comparison between the gender groups.
This section shows the results of the investigation that have attempted to answer the research
intentions and objectives of the present study.
Each participant was tested alone by listening to the twelve recorded dialogues and had to state if ‘yes’ or ‘no’
the samples constitute an interruption. After, they gave their reasons for their decision; the responses and their
reasons were written and collected by the researcher. The total of 200 responses was arranged into four testing
groups, in order to facilitate the comparison between the gender groups.
is section, the quantitative analysis will help to give a clear statement about the interpretation of
4.1.1 SAMPLES OF ‘YES’ INTERRUPTION BY GENDER OF THE PARTICIPANT
Figure 1: Total score of interruptions in males and females
When totalling the number of responses marked as interruptions by the participants (‘yes’ responses), we found
that out of 1564‘yes’ responses, females marked interruptions in the samples of mixed
ed them with a lower number of 721/1564.
Therefore, when shown the same audio samples, 54% of women identified them as interruptions, whereas men only 46%.
As a reply to the first research question “Do men and women have different perceptions about interru
so, is gender a sociolinguistic factor in Tlemcen speech community?”, the answer is yes, interruptions are a
sociolinguistic gender factor in Tlemcen speech community due to difference of 122 voices between males and
litative section will attempt to shed light on the reasons behind this gender difference.
4.1.2 Samples of ‘Yes’ Interruptions According to the Gender of the Participant Using Beattie’s Classification
After totalling the score of ‘yes’ responses by both men and women (1564), all the samples marked as
interruptions have been classified according to Beattie’s plan (1983) as shown in the table below.
54%
46%
Total score of interruptions in
males and females
total score of
interruptions for
women
total score of
interruptions for
men
EISSN 2320-3145, ISSN 2319-5789
Volume.1, Issue.2, July 2013 [15]
Throughout this work, and in the light of the different theories proposed above, it seems adequate to base one
research question on Maltz and Borker (1982) as assumed by Crawford (1995), as an attempt to see if one of
the reasons of miscommunication between gender groups in Tlemcen, is because men and women are raised in
This section shows the results of the investigation that have attempted to answer the research questions and the
Each participant was tested alone by listening to the twelve recorded dialogues and had to state if ‘yes’ or ‘no’
the samples constitute an interruption. After, they gave their reasons for their decision; the responses and their
llected by the researcher. The total of 200 responses was arranged into four testing
This section shows the results of the investigation that have attempted to answer the research questions and the
Each participant was tested alone by listening to the twelve recorded dialogues and had to state if ‘yes’ or ‘no’
heir decision; the responses and their
reasons were written and collected by the researcher. The total of 200 responses was arranged into four testing
is section, the quantitative analysis will help to give a clear statement about the interpretation of
4.1.1 SAMPLES OF ‘YES’ INTERRUPTION BY GENDER OF THE PARTICIPANT
When totalling the number of responses marked as interruptions by the participants (‘yes’ responses), we found
that out of 1564‘yes’ responses, females marked interruptions in the samples of mixed-sex conversations 843
Therefore, when shown the same audio samples, 54% of women identified them as interruptions, whereas men only 46%.
As a reply to the first research question “Do men and women have different perceptions about interruptions? If
so, is gender a sociolinguistic factor in Tlemcen speech community?”, the answer is yes, interruptions are a
sociolinguistic gender factor in Tlemcen speech community due to difference of 122 voices between males and
litative section will attempt to shed light on the reasons behind this gender difference.
4.1.2 Samples of ‘Yes’ Interruptions According to the Gender of the Participant Using Beattie’s Classification:
men and women (1564), all the samples marked as
interruptions have been classified according to Beattie’s plan (1983) as shown in the table below.
interruptions for
interruptions for
SCHOLARS WORLD-INTERNATIONAL REFEREED MULTIDISCIPLINARY JOURNAL OF CONTEMPORARY RESEARCH EISSN 2320-3145, ISSN 2319-5789
www.scholarsworld.net [email protected] Volume.1, Issue.2, July 2013 [16]
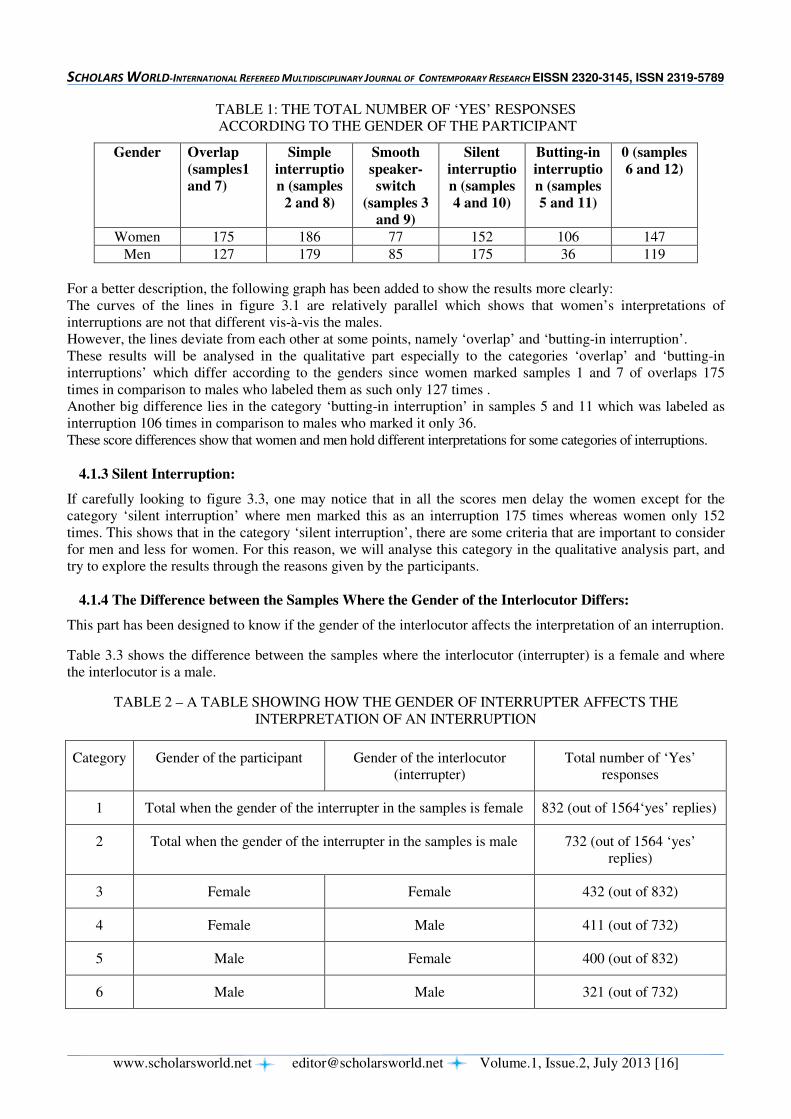
TABLE 1: THE TOTAL NUMBER OF ‘YES’ RESPONSES
ACCORDING TO THE GENDER OF THE PARTICIPANT
Gender Overlap
(samples1
and 7)
Simple
interruptio
n (samples
2 and 8)
Smooth
speaker-
switch
(samples 3
and 9)
Silent
interruptio
n (samples
4 and 10)
Butting-in
interruptio
n (samples
5 and 11)
0 (samples
6 and 12)
Women 175 186 77 152 106 147
Men 127 179 85 175 36 119
For a better description, the following graph has been added to show the results more clearly:
The curves of the lines in figure 3.1 are relatively parallel which shows that women’s interpretations of
interruptions are not that different vis-à-vis the males.
However, the lines deviate from each other at some points, namely ‘overlap’ and ‘butting-in interruption’.
These results will be analysed in the qualitative part especially to the categories ‘overlap’ and ‘butting-in
interruptions’ which differ according to the genders since women marked samples 1 and 7 of overlaps 175
times in comparison to males who labeled them as such only 127 times .
Another big difference lies in the category ‘butting-in interruption’ in samples 5 and 11 which was labeled as
interruption 106 times in comparison to males who marked it only 36.
These score differences show that women and men hold different interpretations for some categories of interruptions.
4.1.3 Silent Interruption:
If carefully looking to figure 3.3, one may notice that in all the scores men delay the women except for the
category ‘silent interruption’ where men marked this as an interruption 175 times whereas women only 152
times. This shows that in the category ‘silent interruption’, there are some criteria that are important to consider
for men and less for women. For this reason, we will analyse this category in the qualitative analysis part, and
try to explore the results through the reasons given by the participants.
4.1.4 The Difference between the Samples Where the Gender of the Interlocutor Differs:
This part has been designed to know if the gender of the interlocutor affects the interpretation of an interruption.
Table 3.3 shows the difference between the samples where the interlocutor (interrupter) is a female and where
the interlocutor is a male.
TABLE 2 – A TABLE SHOWING HOW THE GENDER OF INTERRUPTER AFFECTS THE
INTERPRETATION OF AN INTERRUPTION
Category Gender of the participant Gender of the interlocutor
(interrupter)
Total number of ‘Yes’
responses
1 Total when the gender of the interrupter in the samples is female 832 (out of 1564‘yes’ replies)
2 Total when the gender of the interrupter in the samples is male 732 (out of 1564 ‘yes’
replies)
3 Female Female 432 (out of 832)
4 Female Male 411 (out of 732)
5 Male Female 400 (out of 832)
6 Male Male 321 (out of 732)

SCHOLARS WORLD-INTERNATIONAL REFEREED M
www.scholarsworld.net
The category 1 represents all the participants’ replies (both males and females) where the gender of the
interrupter in the samples is female.
The category 2 represents all the participants’ replies (both males and females) where the gender of the
interrupter in the samples is male.
Each of these categories has been classified upon the gender of the participant and the gender of the interlocutor
in the samples (category 3, 4, 5 and 6).
In table 3.3 the total number of ‘yes’ responses by the female group is higher than that of the male group and
therefore the table must only be viewed relative to these totals.
One idea that can be deduced from this table is that women are
than men do (832 and 732 respectively).
Figure 2: Total of interruptions when the
interlocutor is female
Figures 2 and 3 are designed according to the gender of the interlocutor. If comparing between the two figures,
one may notice that nearly all the participants (of both genders) agree to label a sample as interruption when the
interlocutor is a woman (numbers nearly alike 400 and 432)
The gender of the second speaker does appear to influence the interpretation of an interruption.
The second significant finding that the figures show is that males seem to label a sample as interruption more
easily when the interlocutor is female than when he is a man. (male female 400 vs. male male 321)
Males are more likely to mark a sample of conversation as an interruption if the interrupter is female and at the
same time females are more likely to mark a sam
perceived interrupter is a male.
4.1.5 Summary of the Quantitative Findings
• Women are more likely to label a sample of conversation as interruption than men do.
• Women and men hold different interpretations for some categories of interruptions.
• In the category ‘silent interruption’, there are some criteria that are important to consider for men and less for women
• The gender of the second speaker does appear to in
• While males are more likely to mark identify interruptions if the interlocutor is female, females are more
likely to do so if the interlocutor is male.
In order to clarify the research questions set in the beg
analysed and explained in the following section which makes up the qualitative analysis.
4.2 Qualitatative Results:
4.2.1 Introduction:
After completing the quantitative analysis, two main outcomes resulted as the major results to be analysed;
‘overlap’ (sample 1 and 7) and ‘butting
total of 'yes'
out of 832
replies
male female
female female
MULTIDISCIPLINARY JOURNAL OF CONTEMPORARY RESEARCH EISSN 2320
[email protected] Volume.1, Issue.2,
The category 1 represents all the participants’ replies (both males and females) where the gender of the
all the participants’ replies (both males and females) where the gender of the
Each of these categories has been classified upon the gender of the participant and the gender of the interlocutor
, 4, 5 and 6).
In table 3.3 the total number of ‘yes’ responses by the female group is higher than that of the male group and
therefore the table must only be viewed relative to these totals.
One idea that can be deduced from this table is that women are more likely to label a sample as interruption
than men do (832 and 732 respectively).
Figure 2: Total of interruptions when the Figure 3: Total of interruptions when the
interlocutor is male
according to the gender of the interlocutor. If comparing between the two figures,
one may notice that nearly all the participants (of both genders) agree to label a sample as interruption when the
interlocutor is a woman (numbers nearly alike 400 and 432) rather than when he is a man (321 and 411).
The gender of the second speaker does appear to influence the interpretation of an interruption.
The second significant finding that the figures show is that males seem to label a sample as interruption more
ily when the interlocutor is female than when he is a man. (male female 400 vs. male male 321)
Males are more likely to mark a sample of conversation as an interruption if the interrupter is female and at the
same time females are more likely to mark a sample of conversation as an interruption if the interlocutor or
Summary of the Quantitative Findings:
Women are more likely to label a sample of conversation as interruption than men do.
Women and men hold different interpretations for some categories of interruptions.
In the category ‘silent interruption’, there are some criteria that are important to consider for men and less for women
The gender of the second speaker does appear to influence the interpretation of an interruption.
While males are more likely to mark identify interruptions if the interlocutor is female, females are more
likely to do so if the interlocutor is male.
In order to clarify the research questions set in the beginning of this study, these quantitative results will be
analysed and explained in the following section which makes up the qualitative analysis.
After completing the quantitative analysis, two main outcomes resulted as the major results to be analysed;
‘overlap’ (sample 1 and 7) and ‘butting-in interruption’ (sample 5 and 11). These classifications will help to
51.92
%
48,8
%
female female
56.15
%
43.85
%total of 'yes'
out of 732
replies
male male female male
EISSN 2320-3145, ISSN 2319-5789
Volume.1, Issue.2, July 2013 [17]
The category 1 represents all the participants’ replies (both males and females) where the gender of the
all the participants’ replies (both males and females) where the gender of the
Each of these categories has been classified upon the gender of the participant and the gender of the interlocutor
In table 3.3 the total number of ‘yes’ responses by the female group is higher than that of the male group and
more likely to label a sample as interruption
Figure 3: Total of interruptions when the
according to the gender of the interlocutor. If comparing between the two figures,
one may notice that nearly all the participants (of both genders) agree to label a sample as interruption when the
rather than when he is a man (321 and 411).
The gender of the second speaker does appear to influence the interpretation of an interruption.
The second significant finding that the figures show is that males seem to label a sample as interruption more
ily when the interlocutor is female than when he is a man. (male female 400 vs. male male 321)
Males are more likely to mark a sample of conversation as an interruption if the interrupter is female and at the
ple of conversation as an interruption if the interlocutor or
Women are more likely to label a sample of conversation as interruption than men do.
Women and men hold different interpretations for some categories of interruptions.
In the category ‘silent interruption’, there are some criteria that are important to consider for men and less for women.
fluence the interpretation of an interruption.
While males are more likely to mark identify interruptions if the interlocutor is female, females are more
inning of this study, these quantitative results will be
analysed and explained in the following section which makes up the qualitative analysis.
After completing the quantitative analysis, two main outcomes resulted as the major results to be analysed;
in interruption’ (sample 5 and 11). These classifications will help to
56.15
%
43.85
%
female male
SCHOLARS WORLD-INTERNATIONAL REFEREED MULTIDISCIPLINARY JOURNAL OF CONTEMPORARY RESEARCH EISSN 2320-3145, ISSN 2319-5789
www.scholarsworld.net [email protected] Volume.1, Issue.2, July 2013 [18]
know if the three criteria are essential for men and women to consider an interruption (success of the speaker-
switch, simultaneous speech and the completion of the first speaker’s utterance), since the reasons given by the
participants were either among these criteria or about the intentions of the speakers. To do so, this research will
also follow De Fransico’s (1991) study which relied on asking the speakers about their intentions and beliefs
regarding interruptions, by adding individual interviews for the participants.
This research was done using Beattie’s classification (1983), but once completed it appeared that Talbot’s
(1992) critical theories were stronger, since she claimed that the reasons people use in considering an
interruption don’t apply all to Beattie’s classification. This was also true for the findings of this work since not
all the reasons given by the participants match Beattie’s classification (1983).Therefore; this analysis supports
Talbot’s theory at this point (1992).
4.2.2 Overlaps:
We notice that the reasons advanced by women who marked ‘overlap’ as constituting an interruption in the
female group gave reasons associated with the ‘presence of simultaneous speech’ (Beattie’s classification),
while men who marked ‘overlap’ as a not constituting an interruption gave reasons linked with the intentions of
the speakers. (Talbot theory 1992).
This difference in replies and reasons between men and women for the classification ‘overlap’ leads to the
conclusion that men and women focus on differing characteristics of conversation and therefore use different
features to label an interruption.
4.2.3 Butting-in interruption:
The reasons that participants gave for their responses to sample 5 and 11 have been grouped together. These
reasons followed either Beattie’s classification or the intentions of the interactants.
In table 3.6 the reasons advanced by women who marked ‘butting in interruption’ as constituting an interruption
gave reasons associated with the ‘presence of simultaneous speech’ (a mechanical way from Beattie’s
classification), while males in table 3.7 who indicated ‘butting in interruption’ as a not constituting an
interruption gave other reasons where none was related to the presence of simultaneous speech. Rather, many
advanced the reason that the first speaker could finish what the second was saying and so was he/she was not
interrupted (‘successful speaker-switch’ which is also a mechanical way from Beattie’s classification).
This difference in replies and reasons between men and women for the classification ‘butting in interruption’
leads to the conclusion that men and women focus on differing characteristics of conversation and therefore use
different features to label an interruption.
4.2.4 Silent Interruptions:
Men participants provided 175 reasons to sample 4 and 10 as representing an interruption as shown in the table below.
Women participants provided 48 reasons to sample 4 and 10 as not representing an interruption as shown in the table below.
Except for ‘silent interruption’, the quantitative analysis showed that the score of males’ responses to qualify
this category as an interruption was higher than the one of the females. This is a worth mentioning and striking
result in comparison to the other results. We infer from the analysis than the chief reason advanced by men who
labelled the sample 4 and 10 as interruptions is that the first speaker did not finish his/her utterance. Whereas
for women who didn’t designate this category as an interruption insisted on the absence of simultaneous speech
and that the first speaker sounded like he/she had finished his/her speech.
These findings appear from the qualitative analysis:
4.2.5 Summary of the Qualitative Findings:
• Men and women focus on differing characteristics of conversation and therefore use different features to
label an interruption.
• Women are more concerned with the presence of ‘simultaneous speech’ than men in order to identify an interruption.
• Men are more attentive to the speech content and intentions of the speakers while women follow the formal
mechanical rules of turn-taking.
SCHOLARS WORLD-INTERNATIONAL REFEREED MULTIDISCIPLINARY JOURNAL OF CONTEMPORARY RESEARCH EISSN 2320-3145, ISSN 2319-5789
www.scholarsworld.net [email protected] Volume.1, Issue.2, July 2013 [19]
The results of the analysis show that males and females have differing interpretations of interruptions mainly
because the two genders are attentive to different characteristics of speech .When asked to state if a sample
represents an interruption or not, each gender group had specific rules to identify an interruption.
The findings of this analysis also indicate that on several occasions females expect the presence of
‘simultaneous speech’ to label an interruption, unlike the findings of other researchers who stated that
‘simultaneous speech’ is not a condition in American culture to identify an interruption. Thus, this study has
been realized in Tlemcen speech community and the results contradict the ones of the American society, as far
as interruptions are concerned as a gender sociolinguistic phenomenon.
DISCUSSION:
The overall findings of this research reveal three main results which refer to the research questions set at the
beginning of this work in order to link the findings and give an overview of the analysis.
As Hayachi (1997) points out, looking at a language critically makes the invisible world visible, since it
constitutes a means of questioning, observing and analysing the existing phenomena that the majority of people
take for granted. It is a way of making people sensitive to language and be aware of the sociolinguistic world
they belong to. The case of this work particularly sought to test the notion that there might be a difference in the
way women and men use various mechanisms in talk and conversations, with a view to understand the
importance of interruptions. Yet, the most prominent finding that the data revealed was that women and men
interpret interruptions differently.
The analyses displayed the different mechanisms both gender groups used and therefore the different
interpretations each gender group had. Also, many researchers came across the same analyses and explained
this gendered language difference by some notable theories. One may cite the dominance approach of men over
women proposed by Thorne and Henley (1975) and West and Zimmerman (1975), or the difference approach
proposed by Coates (1989) and Tannen (1984) where women and men come from different sub-cultures and
consequently do different things ‘in’ and ‘with’ conversation. Maltz and Borker’s (1982) study compared
women and men’s use of language in cross-cultural conversations and concluded that if men and women
interpret interruptions differently, it is because they hold different uses for conversation.
The next striking finding in this work disagreed with the many researchers’ theories presented in the literature
review, since we found that women expect the presence of simultaneous speech in order to identify an
interruption. Both Beattie (1983) and Murray (1985) claimed that simultaneous speech is not necessary to mark
an interruption in the American culture, while it seems that in Tlemcen society, it is. The analyses showed that
the female participants repeatedly justified their “yes/no” answers by relating to the presence or absence of
simultaneous speech. Maybe simultaneous speech is not always necessary for some groups of people but since
it is an essential requirement for women in this study, the theory of ‘simultaneous speech as not a necessity to
label an interruption’ is not a universal theory that apply to all the societies in the world as the researchers
claimed; especially if we consider the large amount of data collected and analysed through this study.
CONCLUSION:
The last conclusion goes with the finding that both gender groups have tendency to designate the samples of
conversations as containing interruptions if the interlocutor is from the opposite sex. This claim is similar to
those of other researchers in language and gender like Maltz and Borker (1982) who explained this by the fact
that “males and females experience cultural differences in their rules for engaging in and interpreting friendly
conversation”. According to them, these rules unavoidably lead to miscommunication and participants’ blaming
and conflicting on the opposite sex. This supports De Fransico’s (1991) research in this topic.
This study argues that miscommunication occurs in mixed-sex conversation because women and men have
different rules and reasons for engaging in conversation. This is exemplified in the present study by the fact
that women and men interpret interruptions differently.
This study intended to verify that men and women interpret interruptions differently and therefore the category
‘interruption’ is not stable but its definition may change from one culture to another. Hence, this study also
supported the methodology of discourse activity as suggested by Talbot(1992) than counting interruptions in
mixed-sex conversations as West and Zimmerman (1978) did.
This investigation was conducted after researching the field of ‘interruption analysis’ and discovering that
researchers’ definitions of interruptions differed and consequently their results too, as they were ‘in theory’
SCHOLARS WORLD-INTERNATIONAL REFEREED MULTIDISCIPLINARY JOURNAL OF CONTEMPORARY RESEARCH EISSN 2320-3145, ISSN 2319-5789
www.scholarsworld.net [email protected] Volume.1, Issue.2, July 2013 [20]
looking for different things in their analyses. The study’s main objective was to prove that the category
‘interruption’ is, as Talbot (1992) puts it, ‘in the eye of the beholder or the ear of the interruptee’ .
The study presents findings that prove this to be true. In other words, each society interprets interruptions
differently because it is a matter of culture.
REFERENCES:
1. AGERON, Ch-R. (1968) : Les Algériens musulmans et la France. 1871-1919 T. 1, Vol 2, Paris, PUF.
2. Amrane, D. (1991), Les Femmes algériennes dans la Guerre, Paris: Plon.
3. Amrane-Minne, D. (1999), „Women and Politics in Algeria from the War of Independence to our Day‟, in Research in African Literature, 30: 3, pp. 62 -77.
4. Balia, P. & Rulleau, C. (1978), La Stratégie de Boumedienne, Paris: Sinbad.
5. Beattie, G. W (1983). Talk. An Analysis of Speech and Non-Verbal Behaviour in Conversation. Milton
Keynes: Open University Press
6. Beaumont, S.L. (1995). “Adolescent girls‟ conversations with mothers and friends: A matter of style”. In
Discourse Processes, 20, 109-132.
7. Beaumont, S.L. (2000). “Conversational styles of mothers and their preadolescent and missle adolescent
daughters”. In Merill Palmer Quarterly, 46 (1), 119-139.
8. Bennett, A (1981). “Interruption and the Interpretation of Conversation.” Discourse Processes 4: 171-188
9. Bennoune, M. (1999), Les Algériennes, victimes de la société néopatriarcale, Algiers:Marinoor
10. BENRABAH, M. (1993) : « L‟arabe algérien véhicule de la modernité » in, Foued Laroussi, (éd.), Cahiers
de linguistique française, n° 22, Minoration linguistique au Maghreb. Rouen, SUDLA, pp. 33 -43.
11. Bloomfield, L. (1933): Language. New York, H.Holt.
12. Bolinger, D. (1975) Aspects of Language, 2nd
Ed. New York. Harcourt Brace Jovanovich, Inc
13. Bouamama, S. (2000), Algérie: Les Racines de l’Intégrisme, Brussels: EPO.
14. Bouatta, C. (1997), “Evolution of the Women‟s Movement in Contemporary Algeria: Organization, Objectives
and Prospectives”, in Economics Research Working Papers No. 124, Helsinki: World Institute for Development.
15. BOUCHERIT, A. (2004) : “Algérie : de l‟arabe à l‟arabisation” in, Language Contact and Language
Conflict in Arabic. Variations on a Sociolinguistic Theme. Aleya RouchdyY (éd.), Routledge Curzon.
16. Campbell, A., and Rushton, J.R? (1978). “Bodily communication and personality”. British Journal of
Social and Clinical Psychology, 17, 31-36.
17. Carpenter, J.C. (1983). “Activity structure and play: Implications for socialization”. In M. Liss (Eds.),
Social and Cognitive skills: Sex roles and children‟s play. New York: Academic Press, Inc., 117 -145.
18. Chodorow, N. (1978). The reproduction of mothering. Berkeley, CA: University of California Press.
19. Coates, J. (ed.) (1998) Language and Gender: A Reader. Blackwell: Oxford, Malden Masc.
20. Coates, J. and Cameron D. (eds.) (1998) Women and Their Speech Communities. Longman: London and New York.
21. Coupland N. (1988) Dialect in Use. Cardiff : University of Wales Press.
22. Dendane, Z. (2007).Aspects of Sociolinguistic Variation in Tlemcen. Unpublished Doctorate Thesis.
University of Oran: Algeria.
23. DESPOIS, J. (1949): « L‟Afrique Blanche 1 ». in L‟Afrique du Nord, Paris, PUF.
24. Drummond, K. (1989). “A backward glance at interruptions”. In Western journal of Speech
Communication, 53- 150-166.
25. Edelsky, C (1981). “Who‟s Got the Floor?” Language in Society 10: 383-421.
26. Fasold, R. (1990). The sociolinguistics of language. Cambridge, MA: Brasil Blackwell.
27. Ferguson, C.A (1959). „Diglossia‟ in Word, Vol.15, 1959, 325- 40.
28. Ferguson, N (1976). Interruptions: speaker-switch nonfluency in spontaneous conversation, Edinburgh
University, Department of Linguistics, Work in Progress 9, 1-19.
29. Fishman, P. (1983). “Interaction: the work women do”. In B. Thorne, C. Kramarae, and N. Henley
(Eds.), Language, gender and society. Rowley, MA: Newbury House, Inc., 89-102.
SCHOLARS WORLD-INTERNATIONAL REFEREED MULTIDISCIPLINARY JOURNAL OF CONTEMPORARY RESEARCH EISSN 2320-3145, ISSN 2319-5789
www.scholarsworld.net [email protected] Volume.1, Issue.2, July 2013 [21]
30. Freeman , A(1996) “ Perspectives on Arabic Diglossia”. On: Kateb, K. (2001), La Fin du mariage
traditionnel en Algérie? 1876-1998, Saint-Denis: Bouchène
31. Giles, G., and Coupland, N. (1991). Language: Contexts and consequences. Pacific Grove, FL: Brooks/Cole.
32. Giles, H. (1979). “Ethnicity markers in speech”. In K.R. Scherer and H.Giles (Eds.), Social markers in
speech (pp.251-290). Cambridge, England: Cambridge University Press.
33. Goodwin, M.H. (1980). Directive-response speech sequences in girls‟ and boys task activities. In S.
McConnel-Ginet, R. Borker and N. Furman (Eds.), Women and language in literature and society. New
York: Praeger, 157-173.
34. GRANDGUILLAUME, G. (1983) : Arabisation et politique linguistique au Maghreb, Paris,
Maisonneuve & Larose.
35. GRANDGUILLAUME, G. (2002) : « Les enjeux de la question des langues en Algérie » in, Les cahiers
de confluences. Les langues de la Méditerranée. S/direction de Robert BISTOLFI, et Henri GIORDAN,
Paris, L‟Harmattan, p. 141-264.
36. Grice, H. P (1975). Logic and conversation. In P. Cole and J. Morgan (eds) Syntax and Semantics, III:
Speech Acts. New York: Academic Press, 330-65
37. Gumperz, J (1982). Discourse Strategies. Cambridge: Cambridge University Press
38. Gumperz, J.J. and Tannen, D. (1979).Individual and social differences in language use.In C.J. Fillmore,
D.KEmpler, and W.S.Y. Wang 5eds.), Individual differences in language ability and language behavior.
New York: Academic press.
39. Guy, G. (1980) Variation in the Group and the Individual: the Case of Final Stop Deletion. In W. Labov,
ed. Locating Language in Time and Space. London: Academic Press.
40. Hayachi, R. (1997). Cognition, Empathy and interaction: floor management of English and Japanese
conversation. Norwood, NJ: Ablex.
41. Henley, N., and Kramarae, C. (1988, June). Miscommunication issues of gender and power. Paper
presented at the annual meeting of the National women’s Studies, Association, Minneapolis, MN.
42. Hite, S. (1987). Women and love: A cultural revolution in progress. New York: Alfred A. Knopf, Inc.
43. Hudson R. A.(1996) Sociolinguistics, Cambridge, University Press.
44. Hymes, D. (1972a), Models of the Interaction of Language and social life, in Gumperz and Hymes
Cambridge, UK: Cambridge University Press
45. Kennedy, C.W. , and Camden, C.L. (1983). A new look at interruptions. The Western Journal of Speech
Communication, 47, 45-58.
46. Kohonen, S. (2004). Turn-taking in conversation: Overlaps and interruptions in intercultural talk. Cahiers
AFLS, 10, 15-32.
47. Labov William (1972) Language in the Inner City, Pennsylvania Press, Philadelphia.
48. Lacoste-Dujardin, C. (1986), Des Mères contre les femmes. Maternité et patriarcat au Maghreb, Paris: La Decouverte.
49. Lakoff, R. (1975). Language and Women‟s Place. New York: Harper and Row Fishman, P. (1978a).
Interaction: the work women do. Social Problems, 25, 397-406.
50. Le Page, R. and Tabouret-Keller, A. (1985) Acts of Identity: Creole- Based Approaches to Language
Ethnicity. Cambridge: Cambridge University Press.
51. Lerner, G.H., (1989). Notes on overlap management in conversation: The case of delayed completion.
Western journal of Speech Communication, 53, 167-177.
52. Lyons, J. (1970) New Horizons In Linguistics. Harmondsworth: Penguin.
53. Macaulay, R. (1973) „Double Standards‟. American anthropologist 75 : 1324-37
54. Maltz, D. N. and Borker, R. A. 1982. "A Cultural Approach to Male-Female Miscommunication." Pp. 197-216
in Language and Social Identity, edited by John J. Gumperz. Cambridge, UK: Cambridge University Press.
55. Margaret.A and Saad. M (2005), Transition And Development In Algeria: Economic, Social And Cultural
Challenges, USA: Intellect Books.
56. McLachlan, A. (1991). The effects of agreement, disagreement, gender and familiarity on patterns of
dyadic interaction . Journal of Language and Social Psychology, 10, 205-212.
57. Mesthrie, R., Swann, J., Deumert, A and Leap, W. (2000). Introducing Sociolinguistics. Edinburgh
University Press.
SCHOLARS WORLD-INTERNATIONAL REFEREED MULTIDISCIPLINARY JOURNAL OF CONTEMPORARY RESEARCH EISSN 2320-3145, ISSN 2319-5789
www.scholarsworld.net [email protected] Volume.1, Issue.2, July 2013 [22]
58. MILIANI, M. (2003) : « La dualité français-arabe dans le système éducatif algérien » in, Education et
société plurilingue, n° 15, pp. 17-31.
59. MILIANI, M. (2004) : « Les politiques linguistiques en Algérie : entre divergence et diversité » in,
Henri BOYER (éd.), Langues et contact des langues dans l’aire méditerranéenne. Pratiques,
représentations, gestion, Paris, L‟Harmattan, pp. 211-218.
60. Milroy, J. (1987) Lexical Alternation and Diffusion in Vernacular Speech: Belfast Working Papers in
Language and Linguistics 3 : 101-14
61. Milroy, J. and L., (1985) Authority in Language, Routledge and Kegan Paul, London.
62. Milroy, L (1980) Language and social Networks. Oxford : Blackwell.(1987)
63. Murray, S.O (1985).“Towards a Model of Members‟ Methods for Recognising Interruptions.” Language
in Society 13:31-41.
64. Murray, S.O (1987). “Power and Solidarity in “Interruption”: A Critique of the Santa Barbara School
conception and its application by Orcutt and Harvey (1985) Symbolic Interaction 10 p101-110
65. Murray, S.O (1988). The Sound of Simultaneous Speech, The Meaning of Interruption: A rejoinder.
Journal of Pragmatics 12: 115-116
66. Murray, S.O and Covelli, L.H (1982). Women and Men Speaking at the Same Time. Paper presented at
the Kroeber Anthropological Society annual meetings, Berkley.
67. Murray, Stephen 0. and Lucille H. Covelli. 1988. "Women and Men Speaking at the Same Time." Journal
of Pragmatics 12:103-11.
68. Murray, Stephen 0. 1985. "Toward a Model of Members' Methods for Recognizing Interruptions."
Language in Society 143140.
69. Murray, Stephen 0. 1987. "Power and Solidarity in 'Interruption': A Critique of the Santa Barbara School
Conception and Its Application by Orcutt and Harvey (1985).
70. Orcutt, J.D and Harvey, L.K (1985). “Deviance, Rule-breaking and Male Dominance in Conversation.”
Symbolic Interaction 8: 15-32
71. Oufreha, F.-Z. (1998), „Femmes algériennes: la révolution silencieuse?‟, Monde Arabe. Maghreb
Machrek, 162, pp. 57-68.
72. Peplau, L.A., and Gordon, S.L. (1985). Women and men in love: Sex differences in close heterosexual
relationships. In V.E. O’Leary, R.K. Unger and B.S. Wallston (Eds.), Women, gender and social
psychology. Hillsdale, N J; Erlbaum, 257-291.
73. Rim, Y. (1977). Personality variables and interruptions in small discussions. European Journal of Social
Psychology, 7, 2, 247-251.
74. Sacks et al (1974). “A Simplest Systematics for the Organisation of Turn-taking.” Language 50:696-730
75. Sacks, H., Schegloff, E.A. , Jefferson, G. (1974). A Simplest systematic for the organization of turn-
taking for conversation. Language, 50, 696-735.
76. Scherer, K.R. (1979). Personality markers in speech. In K.R. Sherer and H Giles (Eds.), Social markers
in speech (pp.147-209). Cambridge: Cambridge University Press.
77. Smolensky, M.W., Carmody, M.A., and Halcomb, .C. (1990). The influence of task type, group structure
and extraversion on uninhibited speech in computer -mediated communication. In Computers in Human
Behaviour, 6, 261-272.
78. Spender, D. (1984). Man-made language. London : Routledge and Kegan Paul.
79. Street, R. L. and Giles, H. (1982). Speech accommodation theory : A social cognitive approach to
language and speech behavior. In M.E. Rooff and C.R. Berger (Eds.), Social Cognition and
Communication. Beverly Hills, CA: Sage.
80. Talbot, M (1992). „I Wish You‟d stop interrupting me: Interruptions and Asymmetries in Speaker Rights
in „Unequal Encounters‟ Centre for Language in Social Life- Working Paper 21, Lancaster University
81. TALEB-IBRAHIMI, Kh. (2004) : « Un cas exemplaire de métissage linguistique : les pratiques des
jeunes Algériens » in, Jocelyne DAKHLIA, (dir.) Trames de langues. Usages et métissages
linguistiques dans l‟histoire du Maghreb, Paris, Maisonneuve et Larose, pp. 439-454.
82. Tannen, D. 1986. That's Not What I Meant! How Conversational Style Makes or Breaks Your Relations
With Others. New York: Morrow.
SCHOLARS WORLD-INTERNATIONAL REFEREED MULTIDISCIPLINARY JOURNAL OF CONTEMPORARY RESEARCH EISSN 2320-3145, ISSN 2319-5789
www.scholarsworld.net [email protected] Volume.1, Issue.2, July 2013 [23]
83. Tannen, D. (1983). When is an overlap not an interruption? One component of conversational style. In R.
DiPietro, W. Frawley, and A. Wedel (Eds.), The 1st Delware symposium on language studies. Newark:
University of Delaware Press.
84. Tannen, D. (1984). Conversatioanl style: Analyzing talk among friends. Norwood, NJ: Ablex.
85. Tannen, D. (1989). Interpreting interruption in conversation. In B. Music, R. Graczyk and Wiltshire
5eds.).Papers from the 25th annual regional meeting of the Chicago Linguistic Society. Chicago: Chicago
Linguistic Society.
86. Tannen, D. (1990). You just don‟t understand: Women and men in conversation. New York: Ballintine.
87. Thomas, B. (1989) Differences of sex and sects: linguistic variation and social networks in a Welsh mining village. in
J. Coates and D. Cameron (eds.) Women and Their Speech Communities. Longman: London and New York
88. Trudgill P., (1974) The social Differentiantion of English in Norwich, Cambridge: Cambridge University Press.
89. Trudgill P., (1975) Accent, Dialect and the school, Edward Arnold.
90. Trudgill P., (1975) Accent, Dialect and the School. G. B.
91. Trudgill P., (1983) On Dialect. Basil Blackwell, U.K.
92. Trudgill P., (2000). Sociolinguistics: an Introduction to the Language and Society, Penguin Books Ldt., England.
93. Trudgill P.,(1990) The Dialects of England. Oxford, Blackwell.
94. UNDP (1998), Human Development Report, New York: United Nations
95. Welkowitz, J., and Feldstein, S., (1969). Dyadic interaction and induced differences in perceived similarity.
Proceedings of the 77th Annual Convention of the American Psychological Association, 4, 343-344.
96. West, C. And Zimmerman, D.H. (1977). Women‟s place in everyday talk: Reflections on parent-child
interaction. Social Problems, 24, 521-529.
97. West, Candace and Don Zimmerman. 1983. "Small Insults: A Study of Interruptions in Cross-sex
Conversations Between Unacquainted Persons." in Language, Gender, and Society, edited by Barrie
Thorne, Cheris Kramarae, and Nancy Henley. Rowley, MA: Newbury House.
98. West, Candace. 1979. "Against Our Will: Male Interruptions of Females in Cross-Sex Conversation." Pp.
81-97 in Language, Sex, and Gender (Annals of the New York Academy of Sciences, 327), edited by
Judith Orsanu, Mariam K. Slater, and Leonore Loeb Adler. New York: New York Academy of Sciences.
99. Yang, L.-c. (2001) Visualizing spoken discourse: Prosodic form and discourse functions of
interruptions, in: Proceedings of 2nd
SIGdial Workshop on Discourse and Dialogue.
100. Zimmerman, D. and West C. (1975) „Sex roles, interruptions and silences in conversation‟, in Thorne
et. al (eds.) Language and sex: Difference and Dominance. Rowley, Masc.: Newbury House.
101. Zimmerman, Don and Candace West. 1975. Sex Roles, Interruptions and Silences in Conversations.
Pp. 105-29 in Language and Sex: Difference and Dominance, edited by Barrie Thorne and Nancy Henley.
Rowley, MA: Newbury House.
WEBLIOGRAPHY:
1. http://www.ons.dz/-Emploi-et-chomage-.html
2. http://www.letempsdz.com//content/view/33562/170/
3. http://www.tsa-algerie.com/divers/universite-40-des-chercheurs-algeriens-sont-des-femmes_9769.html
4. Tlemcen. (2010). In Encyclopedia Britannica. Retrieved March 29, 2010, from Encyclopædia
5. Britannica Online: http://www.britannica.com/EBchecked/topic/597513/Tlemcen
6. http://www.britannica.com/EBchecked/topic/597513/Tlemcen
7. http://mondediplo.com/2010/02/14tlemcen
8. http://www.questia.com/library/encyclopedia/tlemcen.jsp
9. http://www.afls.net/Cahiers/Spring%202004%20kohonen.pdf.
10. http://www.asiatour.com/algeria/e-06tlem/ea-tle11.htm
11. http://www.mbendi.com/a_sndmsg/place_view.asp?pid=5370
12. http://www.economicexpert.com/a/Tlemcen.html
13. http://newspublish.algerieautrefois.com/06/07/2010/bac-algerie-les-resultats-revelent-une-veritable-
predominance-des-filles-par-rapport-aux-garcons-une-tendance-confirmee-une-nouvelle-fois-cette-annee/
----
SCHOLARS WORLD-INTERNATIONAL REFEREED MULTIDISCIPLINARY JOURNAL OF CONTEMPORARY RESEARCH EISSN 2320-3145, ISSN 2319-5789
www.scholarsworld.net [email protected] Volume.1, Issue.2 July 2013 [24]
MAPPING THELANDSCAPE: CORPORATE SOCIAL
RESPONSIBILITY FOR UNIVERSAL MARKET ACCESS
Dr. RAKHI GUPTA,
Associate Professor,
(Dept of Business Management) ICCMRT-
U.P.T.U Lucknow. (UP)- India
Dr. DIVYA GUPTA CHOUDHRY,
Assistant Prof, Rukhmani Devi Institute of
Advanced Studies,Rohini,
New Delhi- India
Dr. S.N.PGUPTA,
(Associate Professor, D.A.V College)
C.S.J.M University , Kanpur UP- India
ABSTRACT
This paper examines how small and medium enterprises (SME) of a developing country are
addressing corporate social responsibility (CSR) issues. The authors see corporate social
responsibility or CSR as an important tool or channel which can ensure greater market access
and enable a better engagement in the global market. The paper aims to examine the view of
executives of Small and Medium enterprises (SMEs) of corporations regarding CSR and they
rank the benefits CSR in this Global Market. Result shows that CSR is an important tool to pick
up the brand image and reputation of corporation.
The research is based on survey data, which have collected through personal visit, e-mail and
post mail. SPSS Software 11.5 version has been employed to bring-out the result.
Keywords: Corporate Social Responsibility, Small and Medium Enterprises (SMEs),
Market access, Business strategy, Brand name
SCHOLARS WORLD-INTERNATIONAL REFEREED MULTIDISCIPLINARY JOURNAL OF CONTEMPORARY RESEARCH EISSN 2320-3145, ISSN 2319-5789
www.scholarsworld.net [email protected] Volume.1, Issue.2 July 2013 [25]
INTRODUCTION:
Today in most challenging business world corporate social responsibility may emerge as one of the
business’ preferred strategy. Because the figures of conscious customers are dramatically escalate. They
are concern about the environment, community and workplace management of the corporation before
acquiring their products or service. Specially, when the issue come for corporate customer regarding their
raw material or outsourcing than may be the figure of conscious customers is much higher. Corporate
improve their reputation or brand image through focusing their committeemen towards the sustainable
development activates. Though Indian companies are no stranger to corporate social responsibility (CSR),
the discipline itself has metamorphosed in the last 100 years or so Today, businesses have realized that, in
order to continue thriving, they have to adopt a more holistic and inclusive business model, which has a
direct correlation with the business performance. This includes a system of triple bottom-line reporting-
economic, social and environmental - and a focus on transparency and accountability.
CSR is more than philanthropy and does not necessarily refer to 'giving and receiving'. To quote Mr Hari
S Bhartia, Co-Chairman the Confederation of Indian Industry (CII) National Summit on CSR 2009, and
managing director, TVS Motors and Sundaram Clayton, 'an effective CSR initiative must engage the less
privileged on a partnership basis.
Over 80 per cent companies in India are engaged in CSR-oriented activities, marking a 17 per cent jump since
2004. Significantly, a recent study by the Nottingham University Business School has ranked India number one,
in terms of CSR penetration among the seven Asian countries surveyed. And, while the government has been
evolving a large number of welfare schemes for the people, these benefits rarely reach the most deserving.
Industries, on the other hand, have expertise in man management, financial management and business planning -
and can easily provide the missing ingredients of leadership and organization, and establish the 'last mile
connectivity' to reach the benefits to the deserving people. Therefore the focus of CSR could be
'unlocking' the last mile connectivity, especially in fast-developing countries like India.
In this research we intended to stumble on reason behind the social activities by the corporations. A
questionnaire has been distributed among the executives of 123 SMEs in India; we have received 70
questionnaires, whereas only 63 questionnaires are useable. The questionnaires have been distributed through
mail and personal appointment. We concluded our research that increasing brand name and reputation is
core benefit of CSR activities. SPSS software 11.5 version has been exercised to make the rank through mean
and standard division.
CONCEPT AND DYNAMISM OF CORPORATE SOCIAL RESPONSIBILITY:
CSR can be well understood under the "3 waves of CSR". a. Community engagement b. socially responsible
production process c. Socially responsible employee relations It could be clearly analyzed under the "3 waves of
CSR" that the corporate world need to shell out a part of their profit initially to tap the long run economies of scale (
LREoS), be it internal or external. Beyond good intentions some of the benefits that the corporate world reaps are:
• Powerfully aligning the firms operations and social environmental "Foot print" with managements values,
• Understanding and transforming public perception of the company and industry,
• Attracting investment in the firm, sector and overall economy,
• Increased market share and new market penetration,
• Mobilizing and energizing the company's own human capital,
• Reducing risk
In developing countries like INDIA, business can succeed only if industries maintain good relationships
with all their stakeholders. These relationships can be strengthened, if organizations fulfill their obligations
towards the stakeholder.
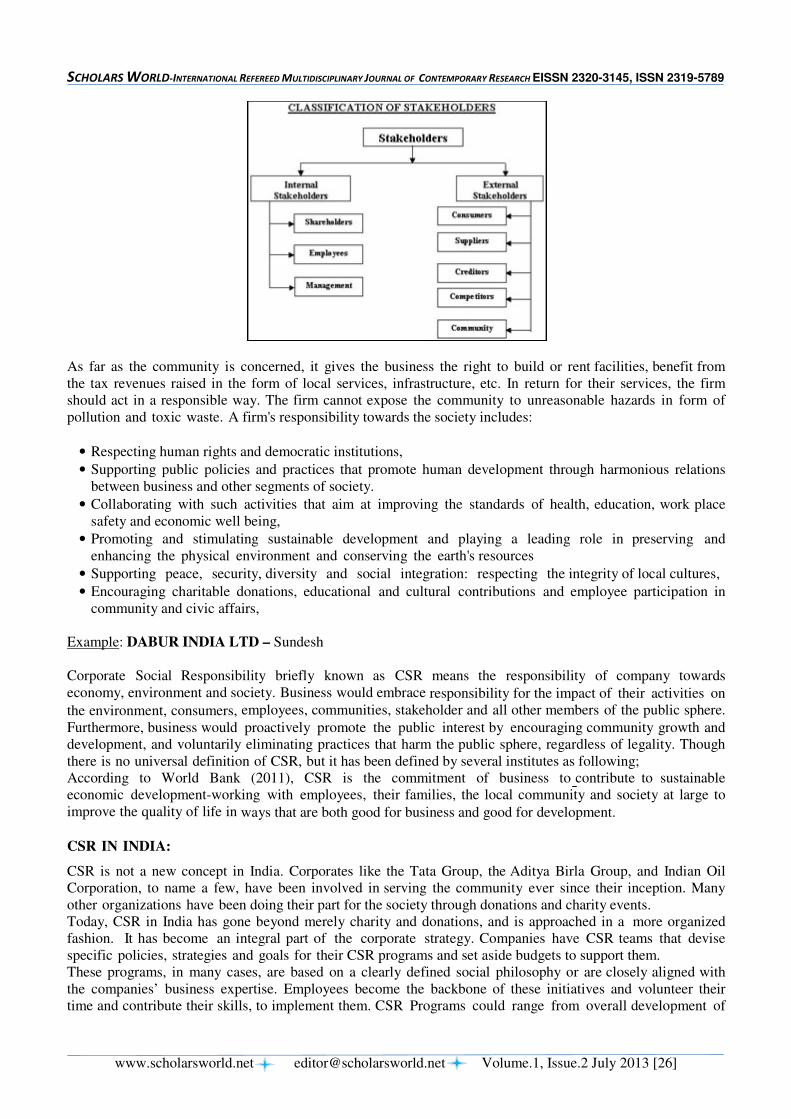
SCHOLARS WORLD-INTERNATIONAL REFEREED MULTIDISCIPLINARY JOURNAL OF CONTEMPORARY RESEARCH EISSN 2320-3145, ISSN 2319-5789
www.scholarsworld.net [email protected] Volume.1, Issue.2 July 2013 [26]
As far as the community is concerned, it gives the business the right to build or rent facilities, benefit from
the tax revenues raised in the form of local services, infrastructure, etc. In return for their services, the firm
should act in a responsible way. The firm cannot expose the community to unreasonable hazards in form of
pollution and toxic waste. A firm's responsibility towards the society includes:
• Respecting human rights and democratic institutions,
• Supporting public policies and practices that promote human development through harmonious relations
between business and other segments of society.
• Collaborating with such activities that aim at improving the standards of health, education, work place
safety and economic well being,
• Promoting and stimulating sustainable development and playing a leading role in preserving and
enhancing the physical environment and conserving the earth's resources
• Supporting peace, security, diversity and social integration: respecting the integrity of local cultures,
• Encouraging charitable donations, educational and cultural contributions and employee participation in
community and civic affairs,
Example: DABUR INDIA LTD – Sundesh
Corporate Social Responsibility briefly known as CSR means the responsibility of company towards
economy, environment and society. Business would embrace responsibility for the impact of their activities on
the environment, consumers, employees, communities, stakeholder and all other members of the public sphere.
Furthermore, business would proactively promote the public interest by encouraging community growth and
development, and voluntarily eliminating practices that harm the public sphere, regardless of legality. Though
there is no universal definition of CSR, but it has been defined by several institutes as following;
According to World Bank (2011), CSR is the commitment of business to contribute to sustainable
economic development-working with employees, their families, the local community and society at large to
improve the quality of life in ways that are both good for business and good for development.
CSR IN INDIA:
CSR is not a new concept in India. Corporates like the Tata Group, the Aditya Birla Group, and Indian Oil
Corporation, to name a few, have been involved in serving the community ever since their inception. Many
other organizations have been doing their part for the society through donations and charity events.
Today, CSR in India has gone beyond merely charity and donations, and is approached in a more organized
fashion. It has become an integral part of the corporate strategy. Companies have CSR teams that devise
specific policies, strategies and goals for their CSR programs and set aside budgets to support them.
These programs, in many cases, are based on a clearly defined social philosophy or are closely aligned with
the companies’ business expertise. Employees become the backbone of these initiatives and volunteer their
time and contribute their skills, to implement them. CSR Programs could range from overall development of
SCHOLARS WORLD-INTERNATIONAL REFEREED MULTIDISCIPLINARY JOURNAL OF CONTEMPORARY RESEARCH EISSN 2320-3145, ISSN 2319-5789
www.scholarsworld.net [email protected] Volume.1, Issue.2 July 2013 [27]
a community to supporting specific causes like education, environment, healthcare etc.
For example, organizations like Bharath Petroleum Corporation Limited, Maruti Suzuki India Limited, and
Hindustan Unilever Limited, adopt villages where they focus on holistic development. They provide better
medical and sanitation facilities, build schools and houses, and help the villagers become self-reliant by
teaching them vocational and business skills.
On the other hand GlaxoSmithKline Pharmaceuticals’ CSR programs primarily focus on health and healthy
living. They work in tribal villages where they provide medical check- up and treatment, health camps and
health awareness programs. They also provide money, medicine and equipment to non-profit organizations that
work towards improving health and education in under-served communities.
CSR has come a long way in India. From responsive activities to sustainable initiatives, corporates have
clearly exhibited their ability to make a significant difference in the society and improve the overall quality
of life. In the current social situation in India, it is difficult for one single entity to bring about change, as the
scale is enormous. Corporates have the expertise, strategic thinking, manpower and money to facilitate
extensive social change. Effective partnerships between corporates, NGOs and the government will place
India’s social development on a faster track.
GOLDEN PEACOCK AWARD FOR CORPORATE SOCIAL RESPONSIBILITY:
In India, Corporate Social Responsibility is the continuing commitment by business to behave ethically and
contribute to economic development while improving the quality of life of the work force, their families as
well as of the local community and society at large. Business needs a stable social environment that
provides a predictable climate for investment and trade. Understanding stake-holders expectation is quite
simply enlightened self - interest for business in today's interdependent world. It provides opportunity to
demonstrate the human face of business. The Golden Peacock Award For Corporate Social Responsibility
will help to build organizations brand equity on Corporate Social Responsibility. These are the awards
which are given at the national and global level.
� Some of the past winners are Ordnance Factory, Indian Ordnance Factories, Medak,
� Mahindra and Mahindra Ltd, Farm Equipment Sector, Mumbai
� Reliance Energy Ltd, Dhanu Thermal Power Station
� All India Management Association , Centre for Management Services, New Delhi � Bhilai Steel Plant, Steel Authority of India Ltd, Bhilai
� Aditya Birla Insulators, A unit of Aditya Birla Nuvo Ltd, Rishra, West Bengal
BENEFITS OF CSR:
Corporate social responsibility (CSR) is not just about doing the right thing. It means behaving responsibly, and
also dealing with stakeholder who do the same. It also ensures benefits for the business. By publishing corporate
social responsibility (CSR) activities corporations may ensure that customers, suppliers and the local community
about what they are doing. CSR lends itself to good news stories. Publicity like this can be a key part of using CSR
to win contracts. People want to buy from businesses they respect. CSR can be particularly effective for targeting
ethical companies, the public sector and non-profit organizations (Business Link, 2011).
At the same time, CSR can be seen as part of a continuing process of building long-term value. Everything
done by the corporation should help improve its reputation and encourage customers and other
stakeholders to stay involved with this corporation. A business that buys recycled paper - but exploits its
customers and ignores the community has missed the point.
CSR is a good 'business case'. Companies invest in CSR activities because it makes business sense. It is neither a
pure philanthropic activity which aims to 'do good to the community' nor an activity that aims to 'pay back to the
society'. Some experts observe that the role of nation-state is diminishing and large multinational corporations,
which have command on huge financial, human and technical resources play the dominant role in influencing
government policy (through lobbing and other means) and also in bringing social changes.
Therefore, often the nation-state fails to protect the interest of local those groups of the society who have no
linkage with companies. In this situation, the society expects the corporate sector to take voluntary action to
protect the interest of the local community and the society in general. The local community also expects
companies to play an important role in social development. Social expectations are expressed through mass
agitations, campaign by voluntary organizations and media campaign. The CSR initiative is the response of the
SCHOLARS WORLD-INTERNATIONAL REFEREED MULTIDISCIPLINARY JOURNAL OF CONTEMPORARY RESEARCH EISSN 2320-3145, ISSN 2319-5789
www.scholarsworld.net [email protected] Volume.1, Issue.2 July 2013 [28]
corporate sector to societal expectations.
Companies invest in CSR activities because they derive significant benefits from those activities. CSR activities help
companies to build reputation, make environment less vindictive, reduce litigation, and attract talent. In addition to
those benefits, companies that invest in CSR activities develop good understanding of social culture and dynamics
and identify social changes much in advance of those companies which are not involved in CSR activities. Visionary
companies identify social undercurrents and latent social needs and often convert them in business opportunities.
CSR is a very potent tool for managing reputation al risks.
It is unfortunate that many companies try to present CSR activities as purely philanthropic. This might be a public
posture, but this set a wrong tone in the organization and employees fail to see the ‘business case’ and act with the
perception that CSR activities are discretionary in nature. This is detrimental to the long term interest of the company.
Effective CSR like this helps a corporation to continue in a differentially. Even with dozens of
competitors, a real commitment to CSR lets corporations stand out. As well as affecting the way a corporate
behaves, CSR can lead to new products and services that reflect corporate values and those of its
stakeholders. Over time, it can all add up to a powerful brand - and a winning business. We summarize core
benefits of CSR from our literature review, these are as following;
IMPROVED IMAGE AND REPUTATION:
The definition of the word “image” as it relates to management is the process of managing the desired
visual image communicated to others. “Visual” is the mental impression or record made in the short term and
perhaps long-term memory of others (Wikipedia, 2009a). The company’s management should checks up on
that image, makes corrections (not after an event occurs but sees the event coming), and begins to know to
make adjustments as the events begin to impact the company’s image. The best manage image may create
though responsible attitude towards the customer, environment, society and workplace. Reputation is the
current sum total of the specific attributed to a company by people. A company’s reputation is produced by the
memory impressions of its perceived actions over time. Practice of corporate social responsibility push-up the
image and reputation of the corporation which assist SMEs to get global market access.
IMPROVED TRUST AND UNDERSTANDING:
CSR improve business trust and understanding within its customers because responsible businesses are
always careful about sales service which is the best tool to achieve customer satisfaction. According to
Scott (2002), Customer service is a series of activities designed to enhance the level of customer satisfaction
that is, the feeling that a product or service has met the customer expectation.
Customer service may be provided by a person (e.g., sales and service representative), or by automated means
called self-service. Examples of self service are Internet sites. The experience a customer has of a product
also affected the total service experience, but this is more of a product direct feature than what is included in
the definition of customer service (Wikipedia, 2009b). Better customer service lead corporations to access
Global market through improving trust and understanding within stakeholder (e.g. customer, supplier)
BETTER MARKET POSITION:
Corporate Social responsibility may play a role to get better market position through potential customer.A
responsbile corporation ensure better customer satisfation by minimizing cost of production, which allow
customer to get better porduct with a less price. One study in 1993 at Wright State University in Dayton,
Ohio, found that managers believe corporate social actions have an effect on perceived market share
(Makower, 1994). Corporate social responsible ensure better market position through global market access.
IMPROVE FINANCIAL PERFORMANCE:
Corporate Social responsibility improves the financial performance through cost reduction, efficient
employee and more sales. There are several research supports that CSR ensure better financial performance
for corporations. Research shows that responsible corporation has better reputation which led to the better
financial performance than the irresponsible corporation. In 1994 study at Florida International University
that tried to link social performance with financial performance found a significant positive relation
between CSR and growth in sales, return on assets and so on (Makower, 1994).

SCHOLARS WORLD-INTERNATIONAL REFEREED MULTIDISCIPLINARY JOURNAL OF CONTEMPORARY RESEARCH EISSN 2320-3145, ISSN 2319-5789
www.scholarsworld.net [email protected] Volume.1, Issue.2 July 2013 [29]
INCREASE ATTRACTIVENESS TO POTENTIAL RECRUITS:
When a corporation improves its workplace management, show respects towards all level of employees,
responsible attitude towards the society and straight towards the conversation of heritage than the next thing
comes automatically e.g., better company culture. Better company culture led the organizations toward
increasing attractiveness to potential recruits. When a corporation able to recruits potential candidate than the
corporation may able earn more revenue by efficient workforce.
COST SAVING AND INCREASED EFFICIENCY:
Environmental friendly business process may cost more in the short run business but it is really meaningful for
long-run business. Environmental friendly process also encourages employees to work efficiently and reduce the
total cost in a long financial time series. There are lot of example are surrounding the world one of Indian
experience is that Tex Cycle Sdn Bhd reduce their total cost through environmental friendly business process.
They are currently using solar system for their electricity and reduce their water bill through recycling.
INCREASE EMPLOYEES MOTIVTION:
One of the most dificult job for any corporation to make happy its employess. But corporations may
reach in the optimal position through better cresponsible business attitude. Recent surveys indicate that
corporate social responsibility is increasingly an important factor in attracting and retaining a talented and
diverse workforce (Globescan Inc 2005). Companies that account for the interests of their employees by
offering good working conditions will achieve better performance in terms of quality and delivery, and,
Therefore, experience higher levels of productivity (Brine and et al, 2009).
EFFICIENT RISK MANAGEMENT SYSTEM:
The investment community is increasingly viewing corporate social responsibility as akin to long-term risk
management and good governance practices. Recent surveys indicate that analysts place as much importance
on corporate reputation as they do on financial performance (Hill & Knowltown 2006). At the same time
corporate social responsibility brings new business network which assist corporation to understand financial
as well as non-financial risk.
MORE BUSINESS:
Corporate social responsibility not only vital for big corporation but also bring prospect for small and
medium corporation. Now-a-days big corporations are also careful about the supplier. They are asking their
supplier to introduce responsible business. At the same time corporations are rejected by the responsible
consumer group, if they are irresponsible. In this way, CSR bring more business for the corporations.
RESEARCH METHODOLOGY AND DATA ANALYSIS:
Once we set the core benefits of CSR, we made questionnaire with this core benefits and we ask Indian
managers to rank the most important benefits of CSR. Sentence was like as this; please rank them in terms
of importance from your point of view. The most important factor will receive rank 1; second most
important factor will receive rank 2, etc. No rank should be repeated. We send 123 questionnaire and we
get back 70 filled questionnaire e.g., percentage of receive questionnaire is 59.34%. In the below table 1.1,
we summarize respond of questionnaire.
TABLE 1.1: PERCENTAGE OF RESPONDENTS
No Media of sending Number No of received Percentage Reject Useable
1 Personally appointment 43 42 97.67% 1 41
2 Post mail 35 18 51.43% 4 14
3 E-mail 45 10 22.22% 2 8
Total 123 70 59.34% 7 63
We use the SPSS software 11.5 to get mean and standard division of the rank made by 63 respondents. As we
mention earlier, that we ask the respondent to rank as 1 for most important benefit of CSR and 2 for
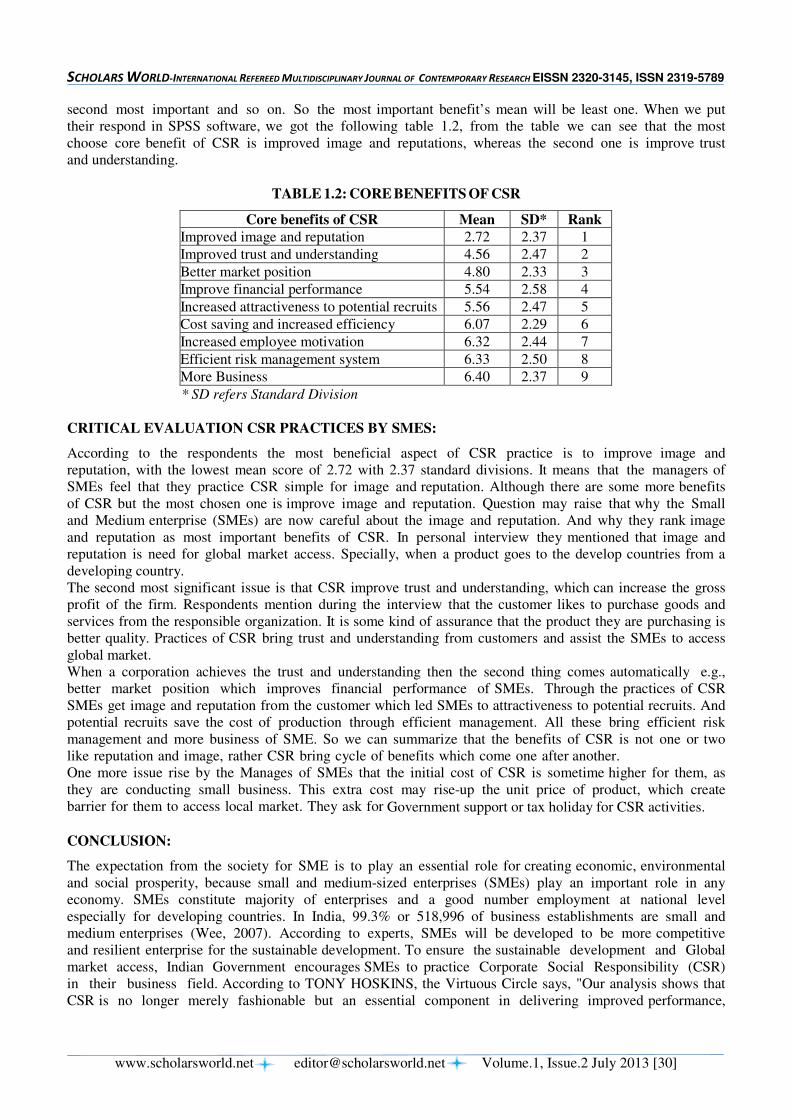
SCHOLARS WORLD-INTERNATIONAL REFEREED MULTIDISCIPLINARY JOURNAL OF CONTEMPORARY RESEARCH EISSN 2320-3145, ISSN 2319-5789
www.scholarsworld.net [email protected] Volume.1, Issue.2 July 2013 [30]
second most important and so on. So the most important benefit’s mean will be least one. When we put
their respond in SPSS software, we got the following table 1.2, from the table we can see that the most
choose core benefit of CSR is improved image and reputations, whereas the second one is improve trust
and understanding.
TABLE 1.2: CORE BENEFITS OF CSR
Core benefits of CSR Mean SD* Rank
Improved image and reputation 2.72 2.37 1
Improved trust and understanding 4.56 2.47 2
Better market position 4.80 2.33 3
Improve financial performance 5.54 2.58 4
Increased attractiveness to potential recruits 5.56 2.47 5
Cost saving and increased efficiency 6.07 2.29 6
Increased employee motivation 6.32 2.44 7
Efficient risk management system 6.33 2.50 8
More Business 6.40 2.37 9
* SD refers Standard Division
CRITICAL EVALUATION CSR PRACTICES BY SMES:
According to the respondents the most beneficial aspect of CSR practice is to improve image and
reputation, with the lowest mean score of 2.72 with 2.37 standard divisions. It means that the managers of
SMEs feel that they practice CSR simple for image and reputation. Although there are some more benefits
of CSR but the most chosen one is improve image and reputation. Question may raise that why the Small
and Medium enterprise (SMEs) are now careful about the image and reputation. And why they rank image
and reputation as most important benefits of CSR. In personal interview they mentioned that image and
reputation is need for global market access. Specially, when a product goes to the develop countries from a
developing country.
The second most significant issue is that CSR improve trust and understanding, which can increase the gross
profit of the firm. Respondents mention during the interview that the customer likes to purchase goods and
services from the responsible organization. It is some kind of assurance that the product they are purchasing is
better quality. Practices of CSR bring trust and understanding from customers and assist the SMEs to access
global market.
When a corporation achieves the trust and understanding then the second thing comes automatically e.g.,
better market position which improves financial performance of SMEs. Through the practices of CSR
SMEs get image and reputation from the customer which led SMEs to attractiveness to potential recruits. And
potential recruits save the cost of production through efficient management. All these bring efficient risk
management and more business of SME. So we can summarize that the benefits of CSR is not one or two
like reputation and image, rather CSR bring cycle of benefits which come one after another.
One more issue rise by the Manages of SMEs that the initial cost of CSR is sometime higher for them, as
they are conducting small business. This extra cost may rise-up the unit price of product, which create
barrier for them to access local market. They ask for Government support or tax holiday for CSR activities.
CONCLUSION:
The expectation from the society for SME is to play an essential role for creating economic, environmental
and social prosperity, because small and medium-sized enterprises (SMEs) play an important role in any
economy. SMEs constitute majority of enterprises and a good number employment at national level
especially for developing countries. In India, 99.3% or 518,996 of business establishments are small and
medium enterprises (Wee, 2007). According to experts, SMEs will be developed to be more competitive
and resilient enterprise for the sustainable development. To ensure the sustainable development and Global
market access, Indian Government encourages SMEs to practice Corporate Social Responsibility (CSR)
in their business field. According to TONY HOSKINS, the Virtuous Circle says, "Our analysis shows that
CSR is no longer merely fashionable but an essential component in delivering improved performance,
SCHOLARS WORLD-INTERNATIONAL REFEREED MULTIDISCIPLINARY JOURNAL OF CONTEMPORARY RESEARCH EISSN 2320-3145, ISSN 2319-5789
www.scholarsworld.net [email protected] Volume.1, Issue.2 July 2013 [31]
requiring committed leaders to put it at the heart of business".
Hence, the policy makers need to further action, most notably strengthening the existing provisions so that
CSR becomes a boon for developing Nations.
REFERENCE:
1. Asongu, J. J. (2007). The History of Corporate Social Responsibility. Journal of Business and Public
Policy. 1: 2, 30-37.
2. Brine, M., Brown, R. and Hackett, G.(2009) Corporate Social Responsibility and FinancialPerformance
in Australian context, retrieved rom http://www.treasury.gov.au/documents/1268/PDF/04_CSR.pdf
at 2.45pm on23/11/2009.
3. Bursa India (2009). Corporate social responsibility (CSR) framework for Indianpublic listed
companies [Online]. [Referred to 30.06.09] Availale: http://www.klse.com.my/website/bm/ about
us/the_organisation/csr/downloads/csr_writeup.pdf
4. Business Link (2009) retrieve at 3.08am, 6th
Nov,2009 http://www.businesslnk.gov.uk/bdotg
/action/detail?type=RESOURCES&itemId=1075408600&r.s=e&r.l1=1074404796&r.lc=en&r.l3=107540
8468&r.l2=1074446322&r.i=1075408491&r.t=RESOURCES
5. CSR (2006). Realizing corporate social responsibility in India: a view from the accounting
profession. The Journal of Corporate Citizenship. [Online]. [Referred to30.06.09] Available
http://goliath.ecnext.com/coms2/gi_0199-6339648/Realising- corporate-social-responsibility-in.html
6. Globescan Inc 2005, Definition of corporate social responsibility survey, viewed 3February 2007,
http://www.globescan.com/rf_csr_first_01.html
7. Hill, P and Knowlton, J (2006), Return on Reputation: Corporate Reputation Watch 2006, March,
New York.
8. Makower, Joel (1994), Beyond the Bottom Line Putting Social Responsibility to work for your business
and the world, Simon & Schuster, New York
9. PM award (2009), retrieve at 3pm, 22nd
January, 2009 http://www.anugerahcsrIndia.org/
10. Scott, Jamier L.(2002) in Turban, Efraim (2002), Electronic Commerce: A Managerial Perspective,
Prentice Hall,
----
SCHOLARS WORLD-INTERNATIONAL REFEREED MULTIDISCIPLINARY JOURNAL OF CONTEMPORARY RESEARCH EISSN 2320-3145, ISSN 2319-5789
www.scholarsworld.net [email protected] Volume.1, Issue.2 July 2013 [32]
A GENRE ANALYSIS OF BUSINESS ENGLISH E-MAILS
THE CASE OF A MULTINATIONAL’S ALGERIAN EMPLOYEES
AMINA KERKEB,
University of El Jillali Liabes,
Sidi Bel A bbés. Algeria
ABSTRACT
The role of English in international communication, namely business communication, has rapidly
blown up by the advent of the 21st
century and globalization. Hence, business professionals in
Algeria have undeniably to improve their employees’ English proficiency in order to be
competent in international trade.
To analyse some business writings through a genre analysis based on the "moves" and "steps"
schematic structure model, sixty e-mails exchanged between Algerian employees and their native
speaker interlocutors were sampled to identify the rhetorical structure and the communicative
purposes of the messages. A textual analysis was also conducted, for examining politeness
strategies writers used to achieve their communicative purposes.
The results indicate that the investigated e-mails comprise three types of e-mail genre, and show
clear discrepancies between the native and the non-native speaker employees in the use of ‘move-
steps’ structures, politeness strategies and formal features.
Since the ‘social and interpersonal aspects of language’ mismatch can cause misunderstanding
and annoyance between native and non native speakers of English, tasks in business
communication courses in particular should ask students to use language in real business
situations, to familiarize them with the social features and interactional aspects of the language.
Keywords: International Business Communication, E-mail, Genre Analysis, Moves-steps
Structure.
SCHOLARS WORLD-INTERNATIONAL REFEREED MULTIDISCIPLINARY JOURNAL OF CONTEMPORARY RESEARCH EISSN 2320-3145, ISSN 2319-5789
www.scholarsworld.net [email protected] Volume.1, Issue.2 July 2013 [33]
1. INTRODUCTION:
Due to globalization, commercial and economic relations between nations have rapidly increased, which has
expanded the role of English in international communications. Strevens (1987), states that ‘English is used by
more people than any other language on the earth, although its mother-tongue speakers make up a quarter or a
fifth of the total’. Thus, to be involved in world business, there will always be a need for using this international
language. Globalization and the fast world of business have also made of the electronic mail a real rival to the
ordinary letter. Nowadays, communication is mainly done through e-mails, and thanks to the use of intranet
systems in almost all developed companies, this means of communication has become a major tool at the
service of business correspondence.
Despite the fact that e-mails are characterized by simple and short sentences full of abbreviations that neglect
grammatical structures, business e-mails for instance are as communicative as the ordinary business letters.
Jensen's (2009) analysis of 46 e-mails collected from the managing director of a Danish company revealed that
e-mails can be used to reach interaction goals and build long-term business relationships using English as a
lingua franca. Moreover, unlike personal e-mails, business e-mails tend toward formal style rather than the
informal one, thus, they are likely to contain as many complex and long sentences as the business letter.
International Business communication -the language of which is principally English- is increasingly relying on
electronic technology, mainly on e-mails, and since business e-mails are following the same linguistic and
stylistic conventions of the business letter to a certain extent, business communication proficiency is narrowly
related to business English e-mail writing mastery.
To support this idea, the present research has adopted generic analysis principles to emphasize on the one hand,
the pedagogical importance of genre analysis approach in raising students’ awareness of the most appropriate
schematic organization of those texts for different discourse communities and purposes. On the other hand, the
present investigation emphasizes the role of English for Business Purposes (EBP) teachers in familiarizing the
students in business English courses with the aspects of the language used in real business situations.
To achieve this purpose, sixty e-mails of NS and NNS (Algerians) employees were gathered for the genre
analysis. The objectives of this analysis are, first, to identify the e-mail genres that characterize the collected
messages, then, to make out the dominant moves and steps that organize texts in the majority of the corpus (e-
mails). Finally, it aims at analyzing the politeness strategies (negative and positive strategies) by which both
groups (NS and NNS) have expressed themselves to address different interlocutors in different business
situations.
2. METHOD:
The researcher collected a corpus of sixty e-mails for a genre analysis, written in English by thirty Algerian
employees, and thirty native speakers at different organizational levels. The analysis is drawn on Bhatia’s
(1993) framework for the study of ‘unfamiliar’ genres.
The genre analysis of the corpus in this study focuses on the discourse of e-mails from two perspectives. First, it
analyses the moves structure through which the e-mails were organized. Second, it studies the politeness
strategies used in those moves to achieve the targeted communicative purposes.
3. DATA COLLECTION PROCEDURE:
The length of the e-mails was taken into account. They are neither too short nor too long. Thus, the average
length of the selected data is around 80 words. Moreover, E-mails are taken as they are, spelling and
grammatical mistakes are not corrected or omitted in order to transmit the exact way in which Algerian workers
are writing their business texts.
4. DATA ANALYSIS:
4.1 The Schematic Structure Analysis:
As a reminder to the schematic notion, which has been used in this genre analysis, one can refer to the
comprehensive definition of Swales (1990), who argues that ‘from a language teaching perspective, it is useful
to think of genre as consisting of a series of “moves”. A move can be thought of as part of a text, which
achieves a particular purpose within the text. Each move is taken to embody a number of constituent elements
called “steps” (Swales, 1990).

SCHOLARS WORLD-INTERNATIONAL REFEREED MULTIDISCIPLINARY JOURNAL OF CONTEMPORARY RESEARCH EISSN 2320-3145, ISSN 2319-5789
www.scholarsworld.net [email protected] Volume.1, Issue.2 July 2013 [34]
In a similar model, Bhatia (1993) proposed a schematic structure of moves and steps for sales letters in
Business Communication, which was convenient to be adopted in the present study. Accordingly, the genre
analysis in the present study has followed the steps below:
� Categorization of the Messages:
Basing on Bhatia’ model of genre analysis (of business letters) only texts around the average of 80 words were
kept, with a selection of an equal number between NS’ messages and NNS’ messages (30 messages in each
group). The total number of the categorized e-mails was then, sixty messages.
� The Identification of the E-Mails Genres:
In attempt of identifying the genres that characterize the collected e-mails, ‘the communicative purpose
dominating the messages was used as the main criterion’ according to Louhaila’s and Kankaanranta’s (2008)
framework. Therefore, three distinct groups of communicative purposes were identified in the corpus (e-mails):
1. Exchange information about the corporation’s activities
2. Deliver other documents for information or for comments
3. Inform employees of the corporation’s activities or issues
In addition to the three communicative purposes above, no other purposes were found in any of the sixty messages.
Those three communicative purposes distinguish according to Louhaila and Kankaanranta (2008) three genres.
The first group of messages was called the ‘Dialogue Genre’, the second group ‘Postman Genre’ and the third
‘Noticeboard Genre’.
Dialogue genre messages’ rate in this study corresponded to the biggest share of the corpus (60%). Frequently
linked to preceding or subsequent messages, dialogue e-mails exchanged questions, responses, requests and
other routine information. This is why they got the largest rate. Example 1 below shows a Dialogue message
complaining overdue invoices.
Example 1: Dialogue E-mail:
Subject: over due invoices
Hi Toni,
I remind you that Citibank is asking that the bill be signed with the wet stamp of your company. I’m
sending you an example thank you to arrange as quickly as possible can you send this bill by DHL and we
will transfer. Thank you very much and best regards
Djamel
Postman genre accounted for 26.66% of the corpus, it is comparable to a delivery service, and delivers
attachments, meetings’ planning, summaries of actions, message exchanges or vacations’ planning. It was mainly
recognized through the recurrence of expressions like “please find enclosed” and “find in the attached file” which
indicated attached documents, generally sent to multiple recipients. The following example represents a Postman
message from a customer to an ABB Algeria superior, delivering an order and a proforma invoice.
Example 2: Postman E-mail:
Subject: Re: order spares for (omitted)
Dear Mounir,
Many thanks for your order.
Our financial dept. informed us that you are a new customer for us.
And you are not in the ABB CIT (cash in time)
Therefore we can only accept advanced payment!
Please find enclosed our confirmation of order (X)
And our Proforma Invoice (X)
Kind regards
Wolgan Lustin
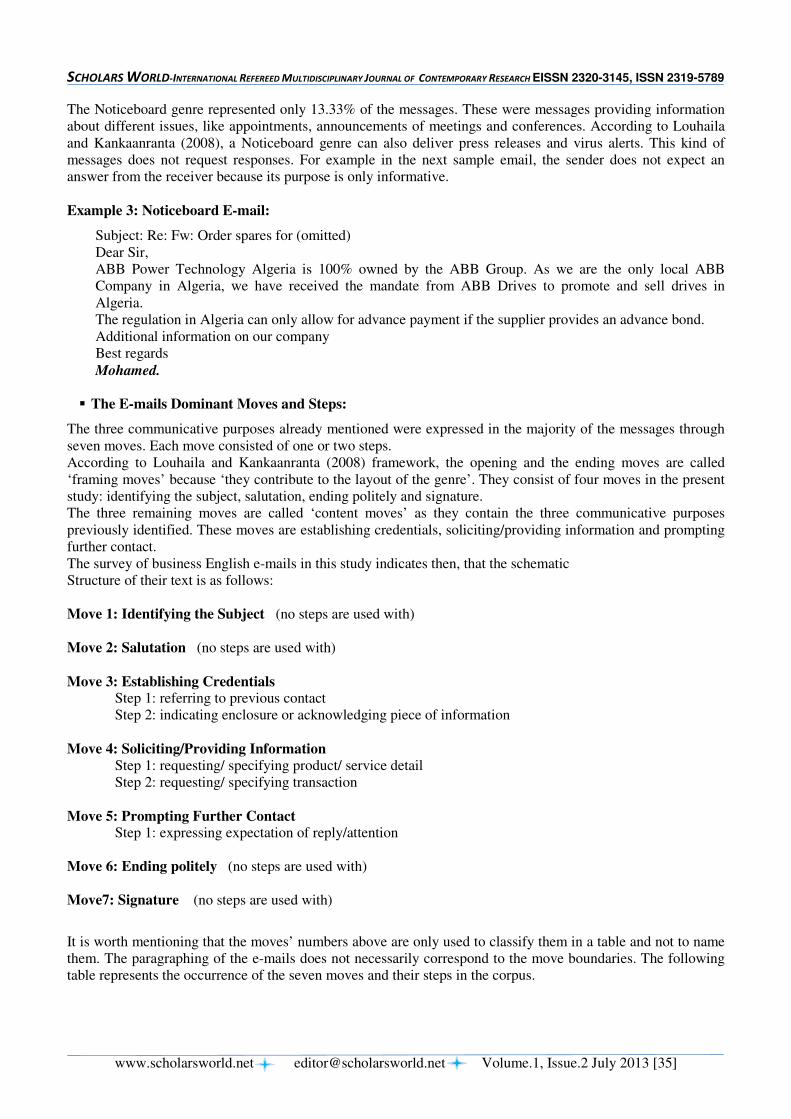
SCHOLARS WORLD-INTERNATIONAL REFEREED MULTIDISCIPLINARY JOURNAL OF CONTEMPORARY RESEARCH EISSN 2320-3145, ISSN 2319-5789
www.scholarsworld.net [email protected] Volume.1, Issue.2 July 2013 [35]
The Noticeboard genre represented only 13.33% of the messages. These were messages providing information
about different issues, like appointments, announcements of meetings and conferences. According to Louhaila
and Kankaanranta (2008), a Noticeboard genre can also deliver press releases and virus alerts. This kind of
messages does not request responses. For example in the next sample email, the sender does not expect an
answer from the receiver because its purpose is only informative.
Example 3: Noticeboard E-mail:
Subject: Re: Fw: Order spares for (omitted)
Dear Sir,
ABB Power Technology Algeria is 100% owned by the ABB Group. As we are the only local ABB
Company in Algeria, we have received the mandate from ABB Drives to promote and sell drives in
Algeria.
The regulation in Algeria can only allow for advance payment if the supplier provides an advance bond.
Additional information on our company
Best regards
Mohamed.
� The E-mails Dominant Moves and Steps:
The three communicative purposes already mentioned were expressed in the majority of the messages through
seven moves. Each move consisted of one or two steps.
According to Louhaila and Kankaanranta (2008) framework, the opening and the ending moves are called
‘framing moves’ because ‘they contribute to the layout of the genre’. They consist of four moves in the present
study: identifying the subject, salutation, ending politely and signature.
The three remaining moves are called ‘content moves’ as they contain the three communicative purposes
previously identified. These moves are establishing credentials, soliciting/providing information and prompting
further contact.
The survey of business English e-mails in this study indicates then, that the schematic
Structure of their text is as follows:
Move 1: Identifying the Subject (no steps are used with)
Move 2: Salutation (no steps are used with)
Move 3: Establishing Credentials Step 1: referring to previous contact
Step 2: indicating enclosure or acknowledging piece of information
Move 4: Soliciting/Providing Information
Step 1: requesting/ specifying product/ service detail
Step 2: requesting/ specifying transaction
Move 5: Prompting Further Contact Step 1: expressing expectation of reply/attention
Move 6: Ending politely (no steps are used with)
Move7: Signature (no steps are used with)
It is worth mentioning that the moves’ numbers above are only used to classify them in a table and not to name
them. The paragraphing of the e-mails does not necessarily correspond to the move boundaries. The following
table represents the occurrence of the seven moves and their steps in the corpus.
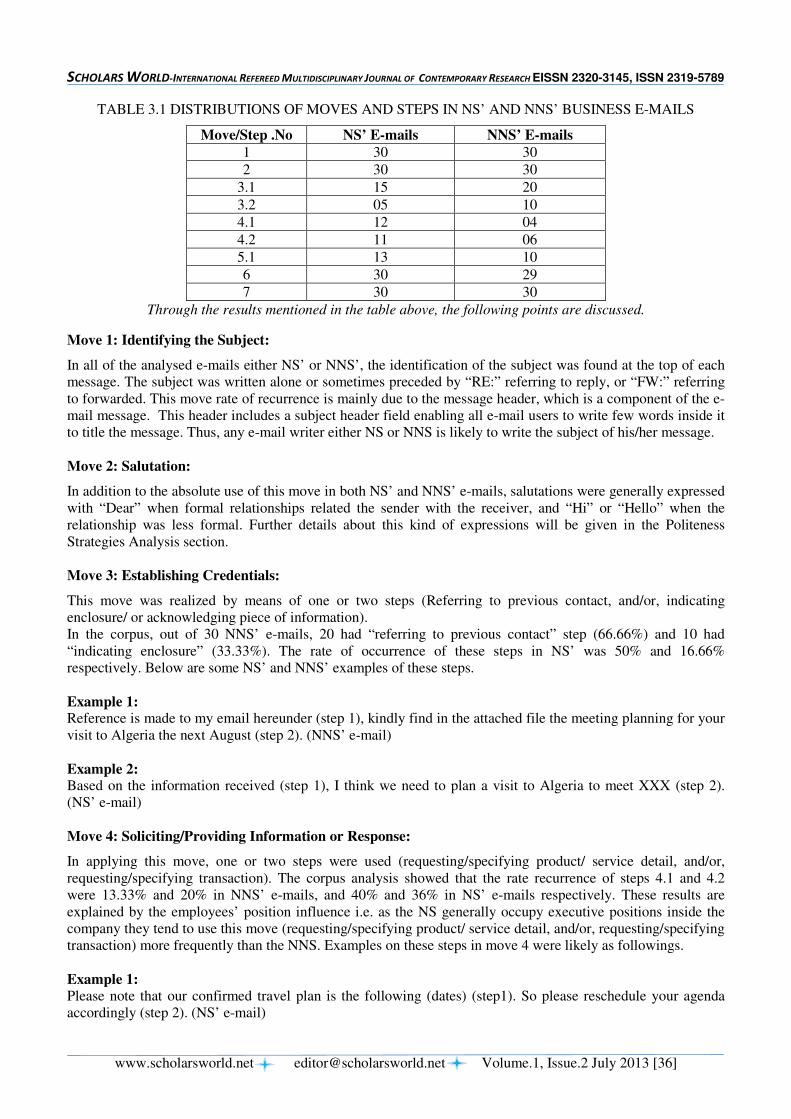
SCHOLARS WORLD-INTERNATIONAL REFEREED MULTIDISCIPLINARY JOURNAL OF CONTEMPORARY RESEARCH EISSN 2320-3145, ISSN 2319-5789
www.scholarsworld.net [email protected] Volume.1, Issue.2 July 2013 [36]
TABLE 3.1 DISTRIBUTIONS OF MOVES AND STEPS IN NS’ AND NNS’ BUSINESS E-MAILS
Move/Step .No NS’ E-mails NNS’ E-mails
1 30 30
2 30 30
3.1 15 20
3.2 05 10
4.1 12 04
4.2 11 06
5.1 13 10
6 30 29
7 30 30
Through the results mentioned in the table above, the following points are discussed.
Move 1: Identifying the Subject:
In all of the analysed e-mails either NS’ or NNS’, the identification of the subject was found at the top of each
message. The subject was written alone or sometimes preceded by “RE:” referring to reply, or “FW:” referring
to forwarded. This move rate of recurrence is mainly due to the message header, which is a component of the e-
mail message. This header includes a subject header field enabling all e-mail users to write few words inside it
to title the message. Thus, any e-mail writer either NS or NNS is likely to write the subject of his/her message.
Move 2: Salutation:
In addition to the absolute use of this move in both NS’ and NNS’ e-mails, salutations were generally expressed
with “Dear” when formal relationships related the sender with the receiver, and “Hi” or “Hello” when the
relationship was less formal. Further details about this kind of expressions will be given in the Politeness
Strategies Analysis section.
Move 3: Establishing Credentials:
This move was realized by means of one or two steps (Referring to previous contact, and/or, indicating
enclosure/ or acknowledging piece of information).
In the corpus, out of 30 NNS’ e-mails, 20 had “referring to previous contact” step (66.66%) and 10 had
“indicating enclosure” (33.33%). The rate of occurrence of these steps in NS’ was 50% and 16.66%
respectively. Below are some NS’ and NNS’ examples of these steps.
Example 1: Reference is made to my email hereunder (step 1), kindly find in the attached file the meeting planning for your
visit to Algeria the next August (step 2). (NNS’ e-mail)
Example 2: Based on the information received (step 1), I think we need to plan a visit to Algeria to meet XXX (step 2).
(NS’ e-mail)
Move 4: Soliciting/Providing Information or Response:
In applying this move, one or two steps were used (requesting/specifying product/ service detail, and/or,
requesting/specifying transaction). The corpus analysis showed that the rate recurrence of steps 4.1 and 4.2
were 13.33% and 20% in NNS’ e-mails, and 40% and 36% in NS’ e-mails respectively. These results are
explained by the employees’ position influence i.e. as the NS generally occupy executive positions inside the
company they tend to use this move (requesting/specifying product/ service detail, and/or, requesting/specifying
transaction) more frequently than the NNS. Examples on these steps in move 4 were likely as followings.
Example 1: Please note that our confirmed travel plan is the following (dates) (step1). So please reschedule your agenda
accordingly (step 2). (NS’ e-mail)

SCHOLARS WORLD-INTERNATIONAL REFEREED MULTIDISCIPLINARY JOURNAL OF CONTEMPORARY RESEARCH EISSN 2320-3145, ISSN 2319-5789
www.scholarsworld.net [email protected] Volume.1, Issue.2 July 2013 [37]
Example 2: Please confirm us if it’s a mistake (step 1). We can’t lodge customs declaration with two different weights
regarding same shipment (step 2). (NNS’ e-mail)
Move 5: Prompting further Contact:
This move was realized by means of one step (Expressing expectation of reply or attention). The survey in the
corpus revealed that 33.33% of NNS and 43.33% of NS included this step in their messages.
Example 1:
Please reply by return as a matter of urgency (move 5-step 1). (NNS’ e-mail)
Example 2: Please during your correspondence kindly keep me always in copy as well as share with me all the attachments
(move 5-step 1). (NS’e-mail).
Move 6: Ending Politely:
Though this move was found at the end of the majority of both groups’ e-mails (NNS with 96.66% and NS with
100%), various expressions were used in achieving it. For example, “Best Regards”, “Kind Regards”, “Best and
Kind Regards” and “Regards” had 31.25%, 0%, 25%, 12.5% in NNS’ e-mails, and 21.42%, 21.42%, 0%,
21.42% in NS’ e-mails respectively. Other minor expressions such as “thank you and best regards”, “see you
soon”, “talk you soon, ciao”, and “thank you has a nice day”, were also used.
Move 7: Signature:
As shown in the table of moves’ occurrence, this move characterized all the e-mails (100%), either of NS or of
NNS. The signature move provides then, the writer’s name, a means by which the messages were closed.
� The Schematic Structure of The E-Mails:
To illustrate the schematic structure of the messages where the seven moves occurred, the following sample e-
mail is provided. See table 2 below
TABLE 2 SAMPLE E-MAIL OF POSTMAN GENRE
MOVE 1 Subject: Re: Action plan for Secondary AIS 36kV
MOVE 2 Hello Rachid,
I think that by mistake I never sent out the MOM of our meeting in X related
to secondary distribution business in Algeria.
Apologies. STEP 1
MOVE 3 Please find here below a summary of the actions agreed today related to the
introduction of Secondary AIS 36kV in Algeria.(action points omitted)
For your reference, here attached a short presentation of the product which could be
useful for you to cross check the local requirements with the available product.
STEP 2
MOVE 4 I hope you initiated the market analysis activities, despite the fact you didn't receive
This message. STEP 1
MOVE 5 Kindly let me know when it is possible for you to complete all the information.
STEP 1
MOVE 6 Thank you and best Regards
MOVE 7 Antonio

SCHOLARS WORLD-INTERNATIONAL REFEREED MULTIDISCIPLINARY JOURNAL OF CONTEMPORARY RESEARCH EISSN 2320-3145, ISSN 2319-5789
www.scholarsworld.net [email protected] Volume.1, Issue.2 July 2013 [38]
MOVE 1: Identifying the Subject
MOVE 2: Salutation
MOVE 3: Establishing Credential
Step 1: referring to previous contact
Step 2: indicating enclosure
MOVE 4: Soliciting Information
Step 1: requesting
MOVE 5: Prompting Further Contact
Step 1: expressing expectation of reply
MOVE 6: Ending Politely
MOVE 7: Signature
The writer (NS) of the e-mail above presents his apologies for a mistake at the beginning of the message. By doing
so, he is emphasizing the importance of this move (Establishing Credential) in anticipating the communicative
business purposes of the next moves. This also reflects an awareness of (business) text organization.
In addition to the seven moves mostly found in the corpus, particular moves specified some other e-mails, such
as “wish move”, “objectives move” “using pressure tactics move” and others. The following tables show
examples of two messages containing such moves.
TABLE 3.5 SAMPLE E-MAIL OF DIALOGUE GENRE
MOVE 1 Subject: Overdue invoices
MOVE 2 Dear Mr. Ahmed
MOVE 3 At first, thank you for a very nice business growth so far this year.
You have reached after 9 months almost the volume of last year.
MOVE 4 Then, I have a problem that should be solved as soon as possible
I have got an information from our business controller that there
are some overdue in payment from your side STEP 1
when asking the reason from our sales I got the explanation that
you for some time not have been able to invoice the customer
and for that reason the shipment are in custom and costumer can’t get it.
MOVE 5 I have also heard that some of orders are cancelled by the customer
due to late deliver (products in custom).
Roamers are also telling that other BU’s have same problems and that
Service are not delivering any spare parts because of overdue payment
(Motors in same situation?).
STEP 2
MOVE 6 Could you please clarify the situation and inform when Drives in
Finland can get the payment for below invoices.
MOVE 7 Looking forward to meet you in Tunisia in the growth meeting
MOVE 8 Best regards
MOVE 9 Leif
MOVE 1: Identifying the Subject
MOVE 2: Salutation
MOVE 3: Expressing Congratulation
MOVE 4: Objective
MOVE 5: identifying the Problem
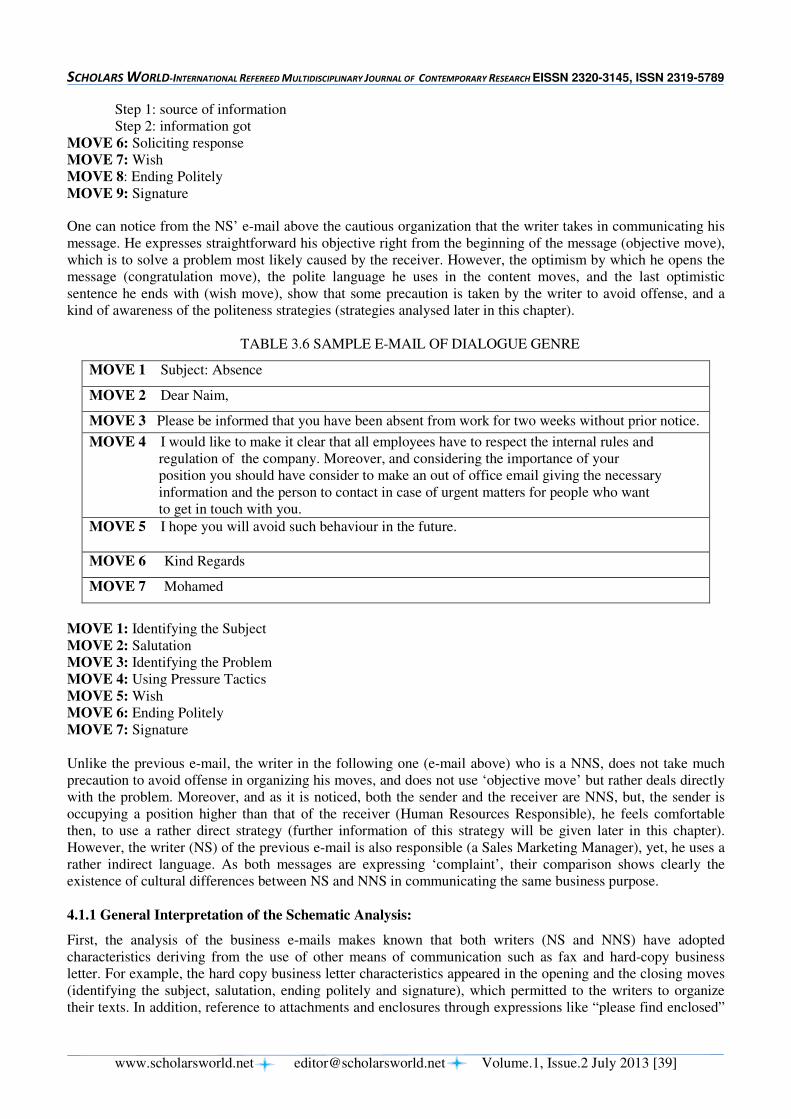
SCHOLARS WORLD-INTERNATIONAL REFEREED MULTIDISCIPLINARY JOURNAL OF CONTEMPORARY RESEARCH EISSN 2320-3145, ISSN 2319-5789
www.scholarsworld.net [email protected] Volume.1, Issue.2 July 2013 [39]
Step 1: source of information
Step 2: information got
MOVE 6: Soliciting response
MOVE 7: Wish
MOVE 8: Ending Politely
MOVE 9: Signature
One can notice from the NS’ e-mail above the cautious organization that the writer takes in communicating his
message. He expresses straightforward his objective right from the beginning of the message (objective move),
which is to solve a problem most likely caused by the receiver. However, the optimism by which he opens the
message (congratulation move), the polite language he uses in the content moves, and the last optimistic
sentence he ends with (wish move), show that some precaution is taken by the writer to avoid offense, and a
kind of awareness of the politeness strategies (strategies analysed later in this chapter).
TABLE 3.6 SAMPLE E-MAIL OF DIALOGUE GENRE
MOVE 1 Subject: Absence
MOVE 2 Dear Naim,
MOVE 3 Please be informed that you have been absent from work for two weeks without prior notice.
MOVE 4 I would like to make it clear that all employees have to respect the internal rules and
regulation of the company. Moreover, and considering the importance of your
position you should have consider to make an out of office email giving the necessary
information and the person to contact in case of urgent matters for people who want
to get in touch with you.
MOVE 5 I hope you will avoid such behaviour in the future.
MOVE 6 Kind Regards
MOVE 7 Mohamed
MOVE 1: Identifying the Subject
MOVE 2: Salutation
MOVE 3: Identifying the Problem
MOVE 4: Using Pressure Tactics
MOVE 5: Wish
MOVE 6: Ending Politely
MOVE 7: Signature
Unlike the previous e-mail, the writer in the following one (e-mail above) who is a NNS, does not take much
precaution to avoid offense in organizing his moves, and does not use ‘objective move’ but rather deals directly
with the problem. Moreover, and as it is noticed, both the sender and the receiver are NNS, but, the sender is
occupying a position higher than that of the receiver (Human Resources Responsible), he feels comfortable
then, to use a rather direct strategy (further information of this strategy will be given later in this chapter).
However, the writer (NS) of the previous e-mail is also responsible (a Sales Marketing Manager), yet, he uses a
rather indirect language. As both messages are expressing ‘complaint’, their comparison shows clearly the
existence of cultural differences between NS and NNS in communicating the same business purpose.
4.1.1 General Interpretation of the Schematic Analysis:
First, the analysis of the business e-mails makes known that both writers (NS and NNS) have adopted
characteristics deriving from the use of other means of communication such as fax and hard-copy business
letter. For example, the hard copy business letter characteristics appeared in the opening and the closing moves
(identifying the subject, salutation, ending politely and signature), which permitted to the writers to organize
their texts. In addition, reference to attachments and enclosures through expressions like “please find enclosed”
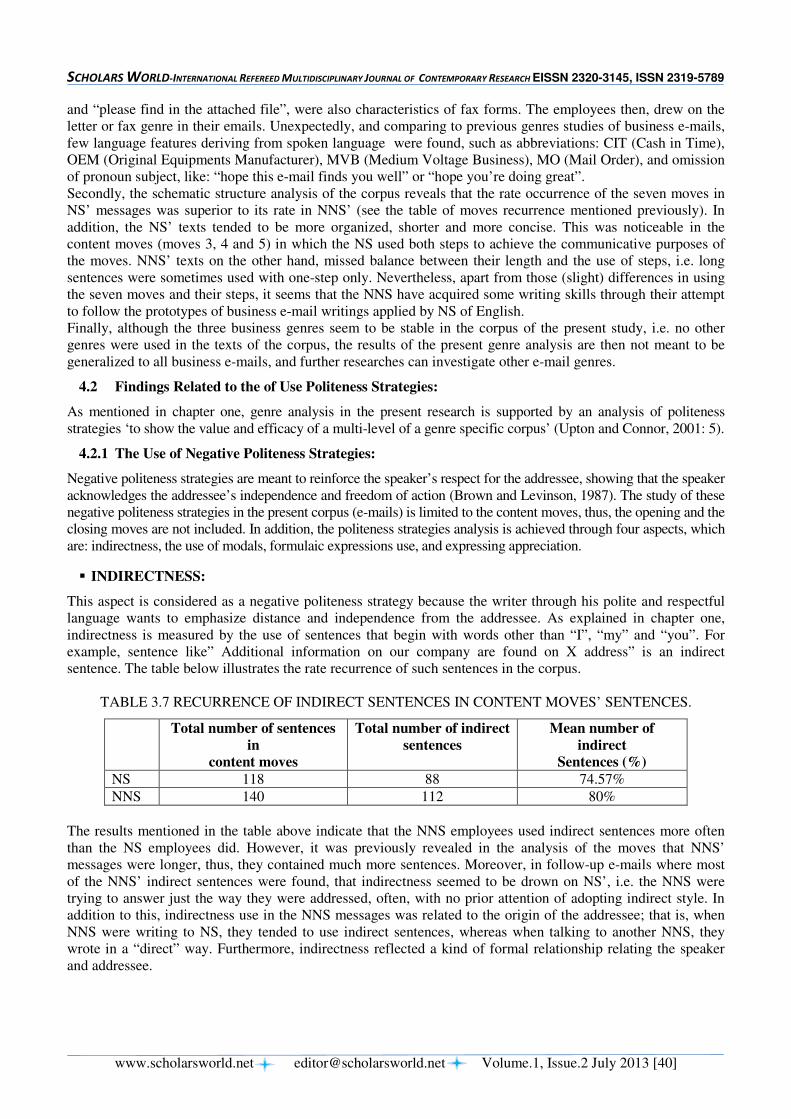
SCHOLARS WORLD-INTERNATIONAL REFEREED MULTIDISCIPLINARY JOURNAL OF CONTEMPORARY RESEARCH EISSN 2320-3145, ISSN 2319-5789
www.scholarsworld.net [email protected] Volume.1, Issue.2 July 2013 [40]
and “please find in the attached file”, were also characteristics of fax forms. The employees then, drew on the
letter or fax genre in their emails. Unexpectedly, and comparing to previous genres studies of business e-mails,
few language features deriving from spoken language were found, such as abbreviations: CIT (Cash in Time),
OEM (Original Equipments Manufacturer), MVB (Medium Voltage Business), MO (Mail Order), and omission
of pronoun subject, like: “hope this e-mail finds you well” or “hope you’re doing great”.
Secondly, the schematic structure analysis of the corpus reveals that the rate occurrence of the seven moves in
NS’ messages was superior to its rate in NNS’ (see the table of moves recurrence mentioned previously). In
addition, the NS’ texts tended to be more organized, shorter and more concise. This was noticeable in the
content moves (moves 3, 4 and 5) in which the NS used both steps to achieve the communicative purposes of
the moves. NNS’ texts on the other hand, missed balance between their length and the use of steps, i.e. long
sentences were sometimes used with one-step only. Nevertheless, apart from those (slight) differences in using
the seven moves and their steps, it seems that the NNS have acquired some writing skills through their attempt
to follow the prototypes of business e-mail writings applied by NS of English.
Finally, although the three business genres seem to be stable in the corpus of the present study, i.e. no other
genres were used in the texts of the corpus, the results of the present genre analysis are then not meant to be
generalized to all business e-mails, and further researches can investigate other e-mail genres.
4.2 Findings Related to the of Use Politeness Strategies:
As mentioned in chapter one, genre analysis in the present research is supported by an analysis of politeness
strategies ‘to show the value and efficacy of a multi-level of a genre specific corpus’ (Upton and Connor, 2001: 5).
4.2.1 The Use of Negative Politeness Strategies:
Negative politeness strategies are meant to reinforce the speaker’s respect for the addressee, showing that the speaker
acknowledges the addressee’s independence and freedom of action (Brown and Levinson, 1987). The study of these
negative politeness strategies in the present corpus (e-mails) is limited to the content moves, thus, the opening and the
closing moves are not included. In addition, the politeness strategies analysis is achieved through four aspects, which
are: indirectness, the use of modals, formulaic expressions use, and expressing appreciation.
� INDIRECTNESS:
This aspect is considered as a negative politeness strategy because the writer through his polite and respectful
language wants to emphasize distance and independence from the addressee. As explained in chapter one,
indirectness is measured by the use of sentences that begin with words other than “I”, “my” and “you”. For
example, sentence like” Additional information on our company are found on X address” is an indirect
sentence. The table below illustrates the rate recurrence of such sentences in the corpus.
TABLE 3.7 RECURRENCE OF INDIRECT SENTENCES IN CONTENT MOVES’ SENTENCES.
Total number of sentences
in
content moves
Total number of indirect
sentences
Mean number of
indirect
Sentences (%)
NS 118 88 74.57%
NNS 140 112 80%
The results mentioned in the table above indicate that the NNS employees used indirect sentences more often
than the NS employees did. However, it was previously revealed in the analysis of the moves that NNS’
messages were longer, thus, they contained much more sentences. Moreover, in follow-up e-mails where most
of the NNS’ indirect sentences were found, that indirectness seemed to be drown on NS’, i.e. the NNS were
trying to answer just the way they were addressed, often, with no prior attention of adopting indirect style. In
addition to this, indirectness use in the NNS messages was related to the origin of the addressee; that is, when
NNS were writing to NS, they tended to use indirect sentences, whereas when talking to another NNS, they
wrote in a “direct” way. Furthermore, indirectness reflected a kind of formal relationship relating the speaker
and addressee.
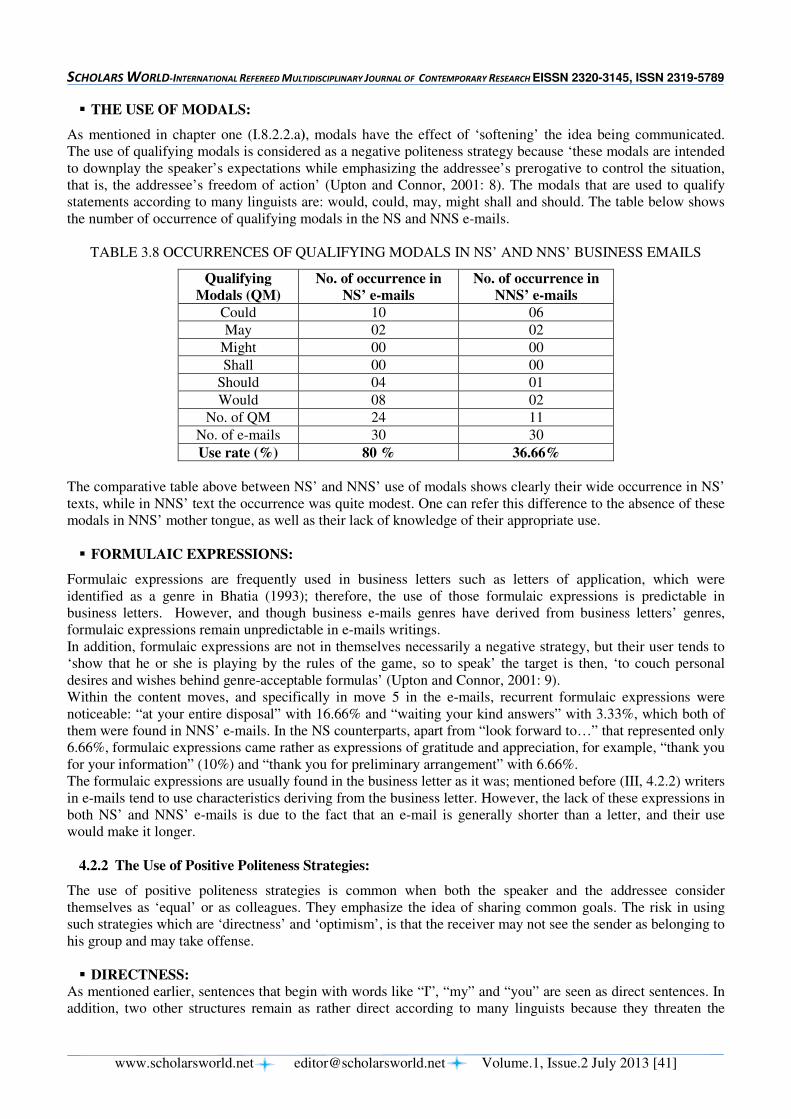
SCHOLARS WORLD-INTERNATIONAL REFEREED MULTIDISCIPLINARY JOURNAL OF CONTEMPORARY RESEARCH EISSN 2320-3145, ISSN 2319-5789
www.scholarsworld.net [email protected] Volume.1, Issue.2 July 2013 [41]
� THE USE OF MODALS:
As mentioned in chapter one (I.8.2.2.a), modals have the effect of ‘softening’ the idea being communicated.
The use of qualifying modals is considered as a negative politeness strategy because ‘these modals are intended
to downplay the speaker’s expectations while emphasizing the addressee’s prerogative to control the situation,
that is, the addressee’s freedom of action’ (Upton and Connor, 2001: 8). The modals that are used to qualify
statements according to many linguists are: would, could, may, might shall and should. The table below shows
the number of occurrence of qualifying modals in the NS and NNS e-mails.
TABLE 3.8 OCCURRENCES OF QUALIFYING MODALS IN NS’ AND NNS’ BUSINESS EMAILS
Qualifying
Modals (QM)
No. of occurrence in
NS’ e-mails
No. of occurrence in
NNS’ e-mails
Could 10 06
May 02 02
Might 00 00
Shall 00 00
Should 04 01
Would 08 02
No. of QM 24 11
No. of e-mails 30 30
Use rate (%) 80 % 36.66%
The comparative table above between NS’ and NNS’ use of modals shows clearly their wide occurrence in NS’
texts, while in NNS’ text the occurrence was quite modest. One can refer this difference to the absence of these
modals in NNS’ mother tongue, as well as their lack of knowledge of their appropriate use.
� FORMULAIC EXPRESSIONS:
Formulaic expressions are frequently used in business letters such as letters of application, which were
identified as a genre in Bhatia (1993); therefore, the use of those formulaic expressions is predictable in
business letters. However, and though business e-mails genres have derived from business letters’ genres,
formulaic expressions remain unpredictable in e-mails writings.
In addition, formulaic expressions are not in themselves necessarily a negative strategy, but their user tends to
‘show that he or she is playing by the rules of the game, so to speak’ the target is then, ‘to couch personal
desires and wishes behind genre-acceptable formulas’ (Upton and Connor, 2001: 9).
Within the content moves, and specifically in move 5 in the e-mails, recurrent formulaic expressions were
noticeable: “at your entire disposal” with 16.66% and “waiting your kind answers” with 3.33%, which both of
them were found in NNS’ e-mails. In the NS counterparts, apart from “look forward to…” that represented only
6.66%, formulaic expressions came rather as expressions of gratitude and appreciation, for example, “thank you
for your information” (10%) and “thank you for preliminary arrangement” with 6.66%.
The formulaic expressions are usually found in the business letter as it was; mentioned before (III, 4.2.2) writers
in e-mails tend to use characteristics deriving from the business letter. However, the lack of these expressions in
both NS’ and NNS’ e-mails is due to the fact that an e-mail is generally shorter than a letter, and their use
would make it longer.
4.2.2 The Use of Positive Politeness Strategies:
The use of positive politeness strategies is common when both the speaker and the addressee consider
themselves as ‘equal’ or as colleagues. They emphasize the idea of sharing common goals. The risk in using
such strategies which are ‘directness’ and ‘optimism’, is that the receiver may not see the sender as belonging to
his group and may take offense.
� DIRECTNESS:
As mentioned earlier, sentences that begin with words like “I”, “my” and “you” are seen as direct sentences. In
addition, two other structures remain as rather direct according to many linguists because they threaten the
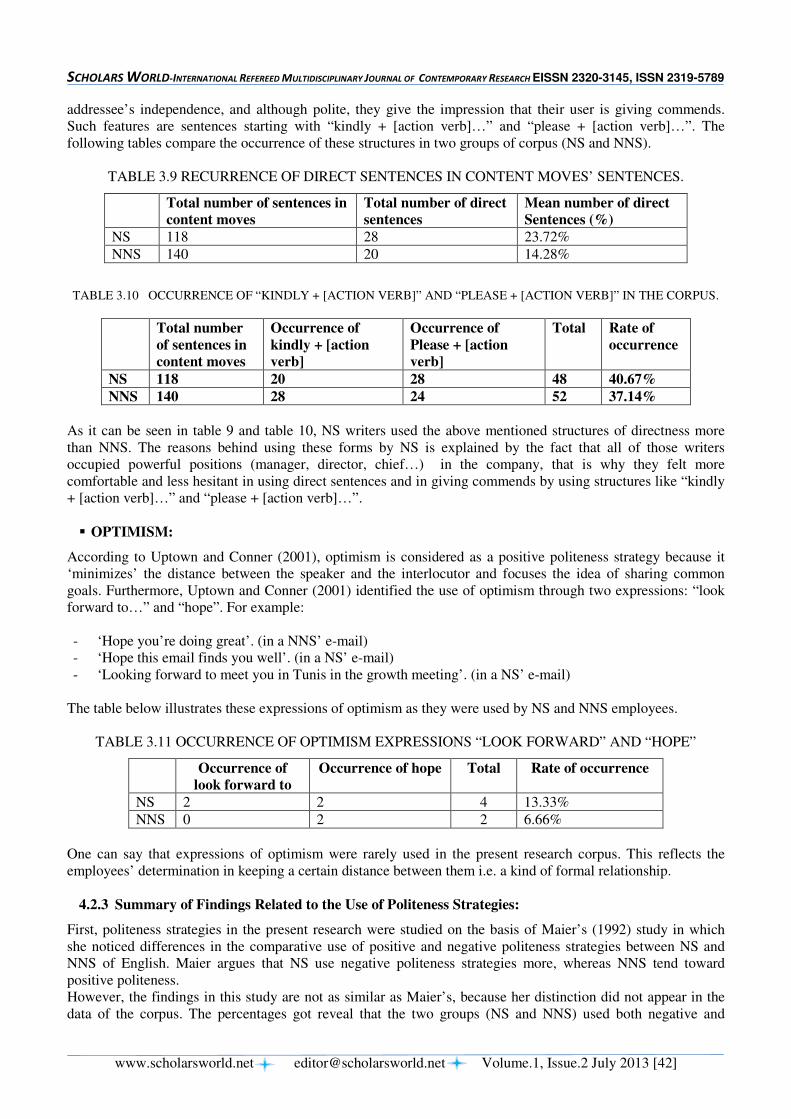
SCHOLARS WORLD-INTERNATIONAL REFEREED MULTIDISCIPLINARY JOURNAL OF CONTEMPORARY RESEARCH EISSN 2320-3145, ISSN 2319-5789
www.scholarsworld.net [email protected] Volume.1, Issue.2 July 2013 [42]
addressee’s independence, and although polite, they give the impression that their user is giving commends.
Such features are sentences starting with “kindly + [action verb]…” and “please + [action verb]…”. The
following tables compare the occurrence of these structures in two groups of corpus (NS and NNS).
TABLE 3.9 RECURRENCE OF DIRECT SENTENCES IN CONTENT MOVES’ SENTENCES.
Total number of sentences in
content moves
Total number of direct
sentences
Mean number of direct
Sentences (%)
NS 118 28 23.72%
NNS 140 20 14.28%
TABLE 3.10 OCCURRENCE OF “KINDLY + [ACTION VERB]” AND “PLEASE + [ACTION VERB]” IN THE CORPUS.
Total number
of sentences in
content moves
Occurrence of
kindly + [action
verb]
Occurrence of
Please + [action
verb]
Total Rate of
occurrence
NS 118 20 28 48 40.67%
NNS 140 28 24 52 37.14%
As it can be seen in table 9 and table 10, NS writers used the above mentioned structures of directness more
than NNS. The reasons behind using these forms by NS is explained by the fact that all of those writers
occupied powerful positions (manager, director, chief…) in the company, that is why they felt more
comfortable and less hesitant in using direct sentences and in giving commends by using structures like “kindly
+ [action verb]…” and “please + [action verb]…”.
� OPTIMISM:
According to Uptown and Conner (2001), optimism is considered as a positive politeness strategy because it
‘minimizes’ the distance between the speaker and the interlocutor and focuses the idea of sharing common
goals. Furthermore, Uptown and Conner (2001) identified the use of optimism through two expressions: “look
forward to…” and “hope”. For example:
- ‘Hope you’re doing great’. (in a NNS’ e-mail)
- ‘Hope this email finds you well’. (in a NS’ e-mail)
- ‘Looking forward to meet you in Tunis in the growth meeting’. (in a NS’ e-mail)
The table below illustrates these expressions of optimism as they were used by NS and NNS employees.
TABLE 3.11 OCCURRENCE OF OPTIMISM EXPRESSIONS “LOOK FORWARD” AND “HOPE”
Occurrence of
look forward to
Occurrence of hope Total Rate of occurrence
NS 2 2 4 13.33%
NNS 0 2 2 6.66%
One can say that expressions of optimism were rarely used in the present research corpus. This reflects the
employees’ determination in keeping a certain distance between them i.e. a kind of formal relationship.
4.2.3 Summary of Findings Related to the Use of Politeness Strategies:
First, politeness strategies in the present research were studied on the basis of Maier’s (1992) study in which
she noticed differences in the comparative use of positive and negative politeness strategies between NS and
NNS of English. Maier argues that NS use negative politeness strategies more, whereas NNS tend toward
positive politeness.
However, the findings in this study are not as similar as Maier’s, because her distinction did not appear in the
data of the corpus. The percentages got reveal that the two groups (NS and NNS) used both negative and
SCHOLARS WORLD-INTERNATIONAL REFEREED MULTIDISCIPLINARY JOURNAL OF CONTEMPORARY RESEARCH EISSN 2320-3145, ISSN 2319-5789
www.scholarsworld.net [email protected] Volume.1, Issue.2 July 2013 [43]
positive strategies but, with some differences, that is, while NNS had 80% (less than NS) in using sentences that
begin with words other than “I”, “my” and “you” to express indirectness, NS preferred expressing indirectness
using “modals” as they had 80% (more than NNS).
Then, results related to the use of positive politeness strategies (which use is ‘risky’ according to Upton and
Connor, 2001: 7) show that NS tended to use positive strategies twice more than their counterparts of NNS did.
Yet, 100% of the NS who have chosen that ‘risky’ positive strategies were occupying decisive positions inside the
company, and the messages they sent were all addressed to employees occupying positions inferior than theirs.
Furthermore, the formality or the informality of the relationship relating the speaker with the addressee
influenced the kind of politeness strategy to be used. For example, in salutation move (though this move was
not included in politeness strategies study, yet it anticipated the kind of strategies that were to be used in the
next content moves) when an expression like “Dear sir” started the message, the language used in the content
moves was often formal. Whereas messages that began with salutations like “Hi” or “Hello”, a less formal
language was found in the following moves.
Thus, one can say that in addition to politeness strategies rules, another aspects are to be taken into account,
which are that of preferences in using those strategies as Upton and Connor (2001) argue: ‘What stands out
more is the type of negative and positive strategies used’, but also, their relationship with corporate positions,
and the formal vs. informal relationships.
Lastly, it is important to underline that NNS writers were often drawing on NS’ texts, and though this method is
useful to learn business English writing (e-mails), it represents a real problem in identifying NNS’ used
strategies. In addition, cross-cultural differences and level of English proficiency are influential in the use of
politeness strategies. It is then, difficult to standardize politeness strategies rules. Nevertheless, it has been
noticed that in informal business relationships, interlocutors in attention or in inattention, they tend to be
‘careless’ in using politeness strategies.
5 THE RESEARCH IMPLICATIONS:
The significance of the present study implications will be in the pedagogical application of its analysis results. This
seems to be a logical conclusion as the present study’s motivating goal (expressed in the general introduction) was to
bridge the gap between university Business English courses and the challenging world of workplace. Thus, the genre
analysis model adopted in this research served as a tool to analyse the use of English at workplace (the case
company) and its results could be used in solving linguistic and pedagogical problems in English teaching at the
Faculties of Economics and Management in Algeria. Therefore, the pedagogical application of the genre analysis
results is to be realized theoretically (Business English courses) and practically (exercises).
Although these results should be seen as preliminary because of the data limitations, this study provides future
researchers with some experimental facts supporting a promising new perspective that aims to study significant
language features of discourse in organizational institutions.
5.1 Application of the Analysis’ Results in Theory:
As emphasized all over the previous chapters, many studies have demonstrated the successful application of the
results of genre analysis in ESP teaching. The benefits of having genre knowledge and its introduction in
Business English studies could be summarized as follows:
� Genre analysis enables ESP teachers designing language programmes (for example, Business English
Courses) as it is an effective and convenient tool for identifying the learner’s needs.
� Instead of using ‘models for linguistic reproduction of conventional forms to respond to recurring social
contents’, genre analysis enables ESP teachers to ‘understand and manipulate complex inter-generic and
multicultural realizations of professional discourse’, because genres are flexible and dynamic.
� A moves-based analysis is useful in teaching novice writers of a particular genre such as business letter
genres, e-mail genres, negotiation genre…etc, because writing for particular purposes requires additional
specific strategies beyond general writing skills.
� Generic knowledge allows ESP learners to understand the functioning of the English language in complex
world of ‘institutionalised’ communication (for example, Business Communication).
� Genre knowledge prepares ESP learners to that complex world by offering them keys to ‘use, interpret,
exploit and innovate novel generic forms’ (Bhatia, 2002: 67).
SCHOLARS WORLD-INTERNATIONAL REFEREED MULTIDISCIPLINARY JOURNAL OF CONTEMPORARY RESEARCH EISSN 2320-3145, ISSN 2319-5789
www.scholarsworld.net [email protected] Volume.1, Issue.2 July 2013 [44]
� Genre knowledge teaches ESP students to consider the context, the situation, the purpose and cultural
differences while writing or interpreting a particular text (example, a business text).
� As genre analysis includes rhetorical aspects of texts, ESP students learn how to use and interpret politeness
strategies employed in achieving communicative purposes of a genre.
Therefore, and as the investigation in this study is concerned with the use of English in Business
Communication (mainly in writing), the researcher proposes that the genre analysis which benefits were
mentioned above, be introduced in the designing of EBP syllabus and curriculums.
For this, it is proposed to implement specific introductory programme for each discipline (for example, Marketing,
Management, International Trade, Economics, Finance and Accounting) by providing authentic texts which would
be analysed (through a genre analysis) for schematic structure, language and writing strategies knowledge. This
knowledge benefits ‘discipline-specific training’ in skills (mainly in writing and reading).
When identifying the specificity of each discipline, teachers will know clearly, what students’ skills they have
to develop. Next, the teachers need to decide on which materials (or type of courses and exercises) can facilitate
learning of the ‘target’ skills. Once the target skills and materials of implementation are defined, the teachers
can then think about the adequate topic to be used to guarantee students’ participation, because this later is not
always insured in EFL teaching. So, by combining ‘pragmatically’ these objectives (target skills and adequate
means), teachers can expect enthusiasm, motivation and effective learning.
Furthermore, as any syllabus design requires to be preceded by a needs analysis, EBP teachers need to consider
some factors while choosing their courses and exercises: What level are the students? Why are the students
learning English? Are there any specific future intentions for the English writing or speaking (for example, for
the would be members of the business profession…etc)? What should the students be able to produce at the end
of this exercise (a well-written business letter or e-mail, communicate successfully, negotiate effectively…
etc.)? What is the focus of the exercise (schematic structure, tense usage, creative writing… etc.)?
At a starting level (for example, the First and second years, LMD English degree), exercises such as Text
Organization could be proposed for instance, to reinforce the students’ basic English knowledge. Those texts are like
guides referring to how a text is organized to help learners follow and understand how information can be presented.
Though Business English Communication is not standard, teachers at this stage (starting level) can use a number of
available ‘standard’ forms found in textbooks (Cambridge, Oxford, Mac Donald, or on internet… etc) that help text
organization when writing. Nevertheless, this kind of exercises (guided) which are seen as ‘spoon-feeding’, may
represent an obstacle to students’ creativity. Thus, they may not be suggested in the advanced levels (last year of
License and in two years of Master), but rather introductory tasks to Business English Communication could be
suggested, which would encourage the cooperative and learner-centred style, because ‘Language is an immensely
democratized institution, to have learned a language is to have rights in it’ (Crystal, 2000: 56).
However, it is important to mention that the design of these programmes would need the cooperation of both
‘subject’ specialist and language specialists. That is, cooperation of linguistics specialists and specialists of
different disciplines (for example, teachers of Economics and Management sciences).
5.2 Application of the Analysis’ Results in Practice:
The genre analysis of e-mails in this study brings practical advices to the EBP learner for producing effective
business e-mails:
� The move-steps analysis of e-mails helps the students organizing their business writings as it represents a
good model that guides beginners in structuring their texts.
� Knowledge of business genres in general (example, negotiation) and e-mails genres in particular (example,
Dialogue Genre, Postman Genre and Noticeboard Genre) enables the students to use the right moves and
steps to achieve successfully their communicative purposes.
� The results of politeness strategies analysis demonstrated its usefulness in revealing the pragmatic discourse
features and cross-cultural similarities and differences of both NS and NNS in using Business English.
Thus, learners’ awareness of these strategies enables them to master Business English Writing.
� Politeness strategies’ awareness shows to the would be members of the business profession how to deal
with formal business relationships as being distant and avoiding directness, thus, avoiding risks of offense.
� It also draws their attention to the right and adequate use of modals (which do not exist in their mother
tongue), as well as mastering the use of formulaic and gratitude expressions.
SCHOLARS WORLD-INTERNATIONAL REFEREED MULTIDISCIPLINARY JOURNAL OF CONTEMPORARY RESEARCH EISSN 2320-3145, ISSN 2319-5789
www.scholarsworld.net [email protected] Volume.1, Issue.2 July 2013 [45]
� Furthermore, Business Communication and more specifically Business Correspondence is depending more
than ever on electronic technology. The most significant example that demonstrates this phenomenon, is the
high shift from the use of letters in Business Communication, to the use of e-mail, and the ability of this
later to communicate as many business purposes as the business letters do (requests, orders, shipments,
complaints…etc). In addition to these characteristics, e-mails are proving their efficacy in the business
world, namely in saving time, money, efforts and in establishing closer business relationships.
Therefore, the present study suggests that this increasing use of e-mails in contemporary business world be
reflected in the content of Business English Courses in Algeria. Moreover, and as far as genre analysis is
concerned, the use of e-mails in teaching Business English is seen as an authentic material that ‘takes more
account of sociological frame- of audience status old/new relationships, cultural expectations’ (Dudley Evans &
St John, 1998: 185). The usefulness of this material underlies in its ability to ‘build knowledge and awareness
which is then applied in more specific material, preferably the learner’s own’ (Dudley Evans & St John, 1998:
185), that is, the business text that the learner produces at the end.
In addition, using e-mails as a pedagogical tool does not only facilitate learning, but solves a crucial problem in
teaching English, that of students’ lack of motivation and of interest. That is, instead of sticking on ‘frozen’
texts and related vocabulary exercises, using e-mails in learning would catch the students’ attention and boost
their motivation. As they are familiar with e-mail and internet usage, they would find it as a self-monitoring
task rather than an instruction. This style of teaching (learner-centred) will conform thus, the students to the role
of interaction partners and ‘ideas generators’.
The business genres awareness is then, a theoretical knowledge, and the use of this knowledge through e-mails
is a practical exercise. Both lead to the preparation of university students of Economics and Management
Studies to be efficient and effective in communicating with people speaking different languages in international
business interactions.
6 PRACTICAL RECOMMENDATIONS: Apart from the recommendations suggested in the present study’s implications, the researcher proposes
additional practical pieces of advice to the possible ways e-mail genres in particular and business writing in
general could be introduced in business studies curriculum.
6.1 The E-mail Project as a Pedagogical Tool: The ‘Sino-Finnish’ international e-mail project (held by two researches form Finland and from China, which
aimed at reforming Business Communication teaching in their universities. This project was inspired by the
increasing use of e-mail projects in communication and language teaching, and by ‘studies of e-mail exchange
for intercultural perceptions’ (Wang & Aaltonen, 2005: 4)) is an inspiring idea to be adopted as a practical
pedagogical tool, and has significant contribution in improving and updating the teaching of Business English.
Thus, it is worth thinking to introduce it in teaching English to tertiary Economics and Management Studies
students in Algeria.
Obviously, additional reflections and suggestions will be needed and beneficial to realize the project. For
example, the ‘Sino-Finnish’ project proposed a NNS vs. NNS e-mail exchange, the Algerian experience could
rather, expose NNS students to NS students (though there is no common core in Business English yet, and
Business Communication is rather seen as a lingua franca). Or, instead of placing the Algerian students in a
business situation with international interlocutors, the students would rather exchange (under agreement with
universities) their business e-mails with employees of multinational companies settled in Algeria, i.e.
employees already familiar with the use of English in e-mails.
In all cases, one can say that the realization of such a project is not a matter of innovative ideas only, but it
relies on the availability of many conditions, which themselves need a field investigation. Yet, some essential
conditions for the realization of the e-mail project are suggested:
� The teachers’ commitment and determination are important for achieving this project.
� As argued by the ‘Sino-Finnish’ project researchers, administrators’ role is major, as they are responsible
for providing authorisations, materials (laboratories, computers, CD ROMs, printers…etc) and for signing
international or national conventions. Thus, the success of the project depends highly on their cooperation.
SCHOLARS WORLD-INTERNATIONAL REFEREED MULTIDISCIPLINARY JOURNAL OF CONTEMPORARY RESEARCH EISSN 2320-3145, ISSN 2319-5789
www.scholarsworld.net [email protected] Volume.1, Issue.2 July 2013 [46]
� Since this project is based on genre analysis (schematic structure and rhetoric features of discourse), the
teachers are meant to be aware of the analysis’ principles, mainly of business genres and of e-mail
genres. This knowledge serves in preparing the checklists that will guide the students in their writings (e-
mail compositions).
� Students’ motivation and willingness for participating in this kind of projects is crucial too, because they
are seen as the active part in the experience, and the teachers are only monitors. Therefore, the e-mail
project is to be taken with seriousness and with a sense of responsibility by the students.
� Providing a WebCT¹, which is a platform when installed in universities’ computers, teachers, students and
other members can have access to it for various pedagogical reasons, such as looking for documents,
discussing a lesson subject with a teacher, or for publishing some pedagogical works. Although, this system
is recognized as a very useful pedagogical tool², it is not free. For the realization of the e-mail project, a
WebCT course setting would facilitate the exchange of the e-mails. However, Universities are free to buy it
or to adopt the same principle on their websites, by creating an internet space, where all the exchanged e-
mails could be found. Thus analysed and corrected with the students.
� In case where the e-portfolio³ concept was concretized and generalized to all university students, each
student could put then in his e-portfolio his final realizations related to the e-mail project in particular, or
realizations accomplished through his learning process of business writing (e-mails, letters, and other
business genres). The student having put his realizations in a personal e-portfolio, he could later prove his
writing competences and skills when applying for a job.
To conclude, the e-mail project emphasizes then, the idea of learning English through interaction in real
business situations, either with NS or with NNS(4) because Business English Communication is not standard.
‘learning directly from people with whom we need to interact’ is an idea which was demonstrated in the present
study as it was mentioned in (chapter III,4.2.2) that in the beginning when the Algerian employees were novice,
they managed their writings by following the language they were addressed with, that is the NS’ texts model.
It is worth mentioning that the e-mail project is meant to be introduced in the curriculum of last year LMD
students of business studies, and in the next two years of their Master. The purpose is of course to prepare the
students for workplace, especially in business written communications.
As far as pedagogical tools are concerned, and in addition to the introduction of business genres knowledge,
some other practical means are proposed in the teaching of business writing to Algerian students in general:
� Introducing (in the first two LMD years’ curriculum) intensive business writing tasks, such as business
letter writing activities, which are described as ‘social activities’, or as text organization tasks.
� Providing recent textbooks related to teaching Business English e-mail writing, as an instrument that
reinforces the students’ understanding. Examples of such textbooks are Oxford Business English, Mac Donald
et al, Macmillan Business English, and others. These books are often accompanied with CD Roms including
interactive exercises to practice useful phrases, vocabulary and communication through computers.
� Providing recent business dictionaries, which are helpful for a business studies learner who wants to enrich
and enhance his Business English vocabulary. Moreover, teachers can refer to those dictionaries in teaching
business writing as they contain in their ‘study pages’ a number of illustrative examples, of how to write
business letters, e-mails, memos, faxes, with showing differences between the formal and the informal style
of these genres (see appendix D). The ‘study pages’ also give advices on how to write job adverts and
applications, curriculum vitae (British and American styles), and present some basic knowledge of
idiomatic language in Business English.
� Encouraging ‘learner-centred teaching’ and ‘situation-centred learning’ by providing authentic materials
and real situation contexts in teaching Business English.
All in all, the present study’s implications and recommendations objective is to shift the teaching of English in
the Algerian Economics and Management Universities from teaching linguistic structures and simple formulaic
language, to the teaching of real Business English Communication Courses that bridge between the linguistic
skills of learners and their professional knowledge goals.
7 CONCLUSION:
The genre analysis in this investigation has brought some evidence about the way Algerian employees
organized their business writings, and the strategies they use in conveying their messages, comparing to the NS’
business writing ‘way’. However, including some native speakers in this comparison does not mean that their
SCHOLARS WORLD-INTERNATIONAL REFEREED MULTIDISCIPLINARY JOURNAL OF CONTEMPORARY RESEARCH EISSN 2320-3145, ISSN 2319-5789
www.scholarsworld.net [email protected] Volume.1, Issue.2 July 2013 [47]
writing is considered as ‘common core’ or as a model to be followed. The comparison served only to the
identification of the linguistic choices and text organization skills of both groups. In addition, the researcher has
also taken in account texts of other European employees who were not native speakers but their English was
fluent, thus the kind of English used in the case company (multinational) was rather seen as a lingua franca.
Investigating business texts through a genre analysis also aimed at emphasizing the usefulness of this analysis
and encouraging its use in further researches, but moreover, encouraging its use in pedagogy as an effective tool
to teach ‘Business English’ and ‘Business Communication’. The current research has shown that tasks in
Business Communication courses in general should ask students to use language in real business situations.
This way, they will be able to acquire the rhetorical skills and genres used in the discipline. Genre theory is,
therefore, highly significant for business English teachers, because by using genre-based pedagogy in their
classes, they can empower their students to succeed as members of a community of practice.
REFERENCES:
1. Bhatia, V. K. (1996), “Methodological Issues in Genre Analysis”, In Herms, Journal of Linguistics no.
16, pp 39-59.
2. Bhatia, V. K. (2001), “The Power and the Politics of Genre”, In A. Burns, and C. Coffin (Eds). Analysing
3. English in a global context. London: Routledge. pp. 65-77.
4. Louhiala-Salminen, L., Charls, M. & Kankaarnanta, A. (2005), “English as a Lingua Franca in Nordic
Corporate Mergers: Two case Companies”, English for Specific Purposes, 24, pp 401-421.
5. Upton, T.A & Connor, U. (2001), “Using Computerized Corpus Analysis to Investigate the Textlinguistic
Discourse Moves of a Genre”, English for Specific Purposes. 20, pp 313-319.
6. Wang, J. 2007. Genre Analysis on Business Correspondence. Available at http://www.linguist.org.cn on
1st August 2011.
----
SCHOLARS WORLD-INTERNATIONAL REFEREED MULTIDISCIPLINARY JOURNAL OF CONTEMPORARY RESEARCH EISSN 2320-3145, ISSN 2319-5789
www.scholarsworld.net [email protected] Volume.1, Issue.2 July 2013 [48]
FACTORS INFLUENCING THE PURCHASE OF
PRIVATE LABELS: A CASE STUDY ON CROMA
DR.PRASHANT RASTOGI,
Professor, KCC Institute of Management,
Greater Noida (India)
ABSTRACT
Purpose – The purpose is to identify the factors which are considered by Customers while deciding between opting for a national brand and a private label and how can a company increase the sales of its private labels by working upon these factors. Design/ Methodology/ Approach – The study is descriptive in nature. A case study is conducted on Croma’s private labels for this purpose. The data is collected using a structured questionnaire. Findings – The research came out with three parameters of judgment from a customer point of view. These are Merchandise Mix, Brand Equity and Brand Knowledge. The research shows how a customer makes a purchase decision when private labels come into picture. The parameters change to some extent due to a completely different value proposition provided by the private labels as compared to national brands. Research limitations/ Implications – A key limitation of this study is the sampling frame. The sampling frame is limited to a certain age group in a restricted geographical area. The responses are collected in a limited time frame for a particular industry – Consumer durables and electronics. Future research is required in order to test the generalization of the proposed parameters. Practical Implications - To boost the sales of private labels and enhance their image in minds of the customers, it is important for the company to focus on few key areas identified in the findings. The merchandising mix of the store should reflect a proper mix of store brands and national brands. The brand equity of the retailer helps in increasing the private labels sale as the retailer becomes a brand in itself emphasizing the private labels also to be treated as a brand in the mind of the customer. Knowledge about brand can increase the reliability factor for customers by reducing their perceived risks about a product. .If worked out properly these parameters can bring out substantial improvements in the sales of private labels. Keywords: Private labels, consumer durables and electronics, merchandising mix, brand
equity

SCHOLARS WORLD-INTERNATIONAL REFEREED MULTIDISCIPLINARY JOURNAL OF CONTEMPORARY RESEARCH EISSN 2320-3145, ISSN 2319-5789
www.scholarsworld.net [email protected] Volume.1, Issue.2 July 2013 [49]
INTRODUCTION:
We grew in the world dominated by manufacturer brands, well known as national brands. However, with time we saw change in the retail landscape. More and more retail stores were carrying products with their own label. These products which were manufactured or provided by the retailers themselves came to be known as private labels or in – house brands or store brands. Private Labels are often positioned as the low cost alternatives to the regional, national or international brands, although some brands have also been positioned as “premium brands” due to the strong image of the retailer. Private labels help retailers to enhance category profitability, increase negotiation power of the retailer and create consumer loyalty. Private labels are growing faster than manufacturer brands. They are ubiquitous across categories and they now compete on quality — in fact, they are now brands! (Nirmalya Kumar and Jan-Benedict E. M. Steenkamp, 2007). In developed markets they are eating into a large chunk of the organized retail sales. They account for 40 per cent of Wal-Mart sales ($126 billion or Rs 5, 16,600 crore), 50 per cent for Tesco ($36 billion or Rs 1, 47,600). Now a category of private label – only retailers has also been created - IKEA, Toys ‘R’ Us, Zara — who sell only private label brands. In India, however the contribution of private labels is just 10 – 12% of the total organized retail (Images Retail Report 2009). Positively the growth of private labels in recent years is phenomenal, giving retailers a lot of scope to increase their profitability. Many retailers are making efforts to increase the share of private labels in their offerings, Croma being one of them. For example Spencer’s in India has private labels in 60% of its 650 product categories, and the sales of private labels are increasing at the rate of 40% annually. In Lifestyle International private labels contribute to 25% of its sale etc. INTRODUCTION TO THE COMPANY:
Croma is India’s first national large format specialist retail chain for consumer electronics and durables. Croma as a brand is promoted by Infiniti Retail Limited. Infinity Retail Limited is a 100% subsidiary of Tata Sons, the holding company of the Tata Group. Infiniti Retail Ltd. owns and runs Croma's retail operations in India, while Woolworths, Australian retail giant, provides technical support and strategic sourcing facilities from its global network. Croma launched private labels in December 2008 with a target of 20% sales contribution from them. However, till August 2010 Croma is able to gain only 5% contribution from its private labels. Therefore at present it becomes important for Croma to identify the factors which are acting as obstacles in Croma’s target’s achievement. The study thus tries to identify some parameters used by customers to judge a brand and take its final purchase decision. The study with the help of those parameters tries to identify factors which when worked upon can increase the sales of private labels. LITERATURE REVIEW:
For conducting this research it was important to get an insight about the concepts of the development of private labels, their importance, and consumer perception for brands and store image etc. There are various factors which can influence a customer’s purchase decision. Some of them are discussed below: A brand-image is defined as the total sum of brand associations held in consumer memory that lead to perceptions about the brand (Keller, 1993). These associations of brand image are multidimensional and consist of the affective dimension or the attitudes towards the brand and the perceived quality dimension (Keller, 1993). Consumer uses different cues, benefits, symbolic meanings etc. to relate to a brand. The cues used by the customers can be intrinsic or extrinsic cues. Extrinsic cues refer to cues which are extrinsic to a product and do not have to be experienced in order to make judgments, like the packaging, brand name, price and advertising. Intrinsic cues refers to the factors like taste, quality etc. which can be judged only by experiencing. These two types of cues are

SCHOLARS WORLD-INTERNATIONAL REFEREED MULTIDISCIPLINARY JOURNAL OF CONTEMPORARY RESEARCH EISSN 2320-3145, ISSN 2319-5789
www.scholarsworld.net [email protected] Volume.1, Issue.2 July 2013 [50]
also considered responsible for building brand image. For national brands it is comparatively easier to develop the brand image, as they spend more on marketing, packaging etc. and are always positioned as high quality offerings. In case of Private labels it’s more complex. Here customers do not have a strong brand association. However, authors observed that the store image acts as an important indicator of store brand quality (Semeijn and al., 2004). Researchers have studied a multitude of retailer attributes that influence overall store image, e.g., the variety and quality of products, services, and brands sold; the physical store appearance; behavior and service quality of employees; the price levels, depth and frequency of promotions; and so on (Burt and Carralero-Encinas, 2000; Ailawadi and Keller, 2004; Sorrenberg and Erasmus, 2008). In case of private labels customers tends to go more on the extrinsic cues. Therefore, factors like packaging, display etc. have to be taken care of. Although this will increase the cost for the retailer but he can keep saving margins by squeezing the supply chain and then play on volumes. Also for private labels the efficiency of a salesman to convince the customer plays a major role. Although there is a causal relationship between the store image and the salesman’s reliability as considered by the customer. But then the overall strategy defined by the company will depend on other factors also. The overall strategy and positioning of retailer will also define what a consumer expects and what factors he/she consider for coming to a conclusion, while selecting a brand. Here comes the role of the brand architecture. Esbjerg et al. (2004) adapted Aaker and Joachimsthaler (2000) brand architecture concept to the retail setting by defining retailer brand architecture as a retailer’s assortment of manufacturer brands, retailer brands and generic products. The brand architecture can differ based on two dimensions: the quality of retailer brands and visibility of retailer brands (Esbjerg et al. 2004). As we saw customer while deciding among the National Brands and the Store brands consider various factors. Relying on various literatures discussed above some of these factors can be identified as are store image (the trust factor), variety and quality of products, options available in national brands i.e. The kind of brand architecture, promotional offers going on, prices, service, salesman’s explanation and features. So, this research has narrowed down on these factors. RESEARCH METHODOLOGY:
The objectives of this research is to identify factors which a customer considers for selecting a brand, the consumer perception for store brands, reasons for low contribution of private labels in a retail outlet and in the end coming up with a set of parameters which can be worked upon to enhance store brand’s image and increase their contribution in the total sales. For this purpose Croma – Specialty retailer for consumer durables and electronics is considered. Primary data is collected for which Survey method is used for obtaining information which is based on questioning the respondents. Structured questionnaire is used to ask prearranged questions from the respondents. Most of the questions are close ended with multiple choices to assist customers in answering. Most of the questions are framed on 5 point Likert Scale. The personal detail of respondents is limited to Age, Qualification and Area of Residence. SAMPLING DESIGN:
Sampling Technique: Convenience Sampling
The selection of sampling units is based on convenience of the interviewer. In this research the interviews are taken from the customers on the shop floor at the time when a sale is closed.
Sample Size: 152 Number of Respondents for National brands: 124 Number of respondents for Croma’s private label: 28
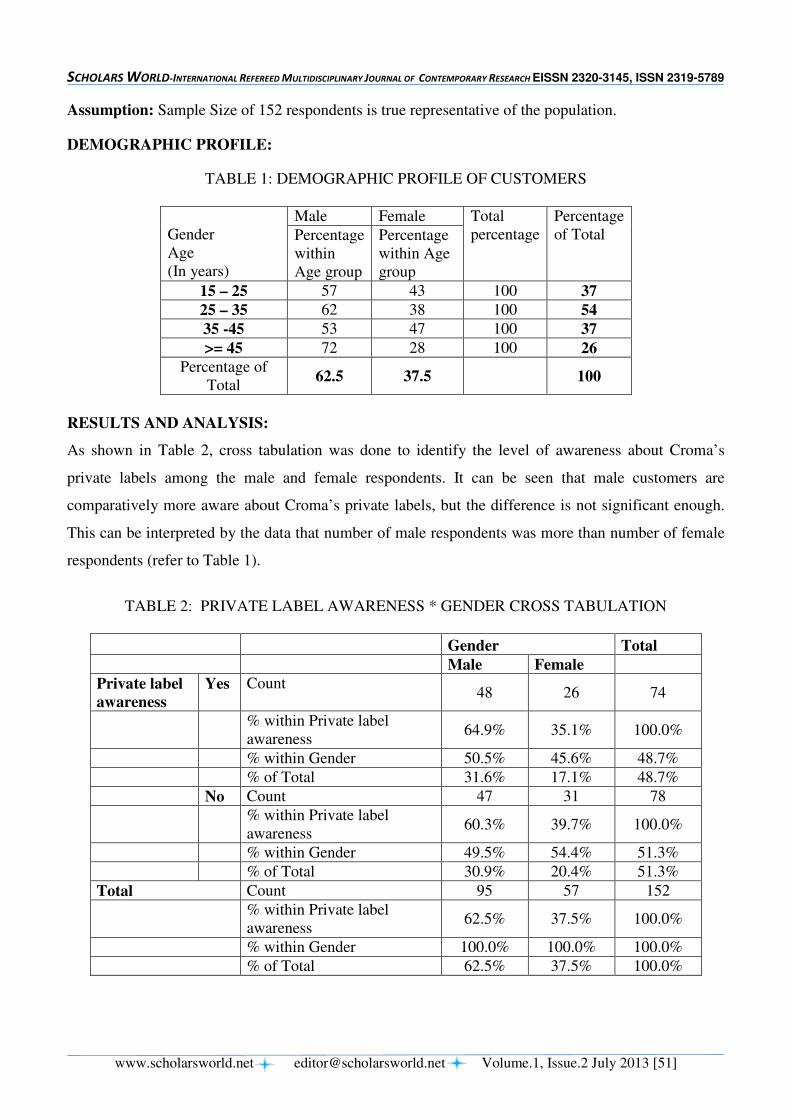
SCHOLARS WORLD-INTERNATIONAL REFEREED MULTIDISCIPLINARY JOURNAL OF CONTEMPORARY RESEARCH EISSN 2320-3145, ISSN 2319-5789
www.scholarsworld.net [email protected] Volume.1, Issue.2 July 2013 [51]
Assumption: Sample Size of 152 respondents is true representative of the population.
DEMOGRAPHIC PROFILE:
TABLE 1: DEMOGRAPHIC PROFILE OF CUSTOMERS
Gender Age (In years)
Male Female Total percentage
Percentage of Total
Percentage within Age group
Percentage within Age group
15 – 25 57 43 100 37
25 – 35 62 38 100 54
35 -45 53 47 100 37
>= 45 72 28 100 26
Percentage of Total
62.5 37.5 100
RESULTS AND ANALYSIS:
As shown in Table 2, cross tabulation was done to identify the level of awareness about Croma’s
private labels among the male and female respondents. It can be seen that male customers are
comparatively more aware about Croma’s private labels, but the difference is not significant enough.
This can be interpreted by the data that number of male respondents was more than number of female
respondents (refer to Table 1).
TABLE 2: PRIVATE LABEL AWARENESS * GENDER CROSS TABULATION
Gender Total
Male Female
Private label
awareness
Yes Count 48 26 74
% within Private label awareness
64.9% 35.1% 100.0%
% within Gender 50.5% 45.6% 48.7%
% of Total 31.6% 17.1% 48.7%
No Count 47 31 78
% within Private label awareness
60.3% 39.7% 100.0%
% within Gender 49.5% 54.4% 51.3%
% of Total 30.9% 20.4% 51.3%
Total Count 95 57 152
% within Private label awareness
62.5% 37.5% 100.0%
% within Gender 100.0% 100.0% 100.0%
% of Total 62.5% 37.5% 100.0%
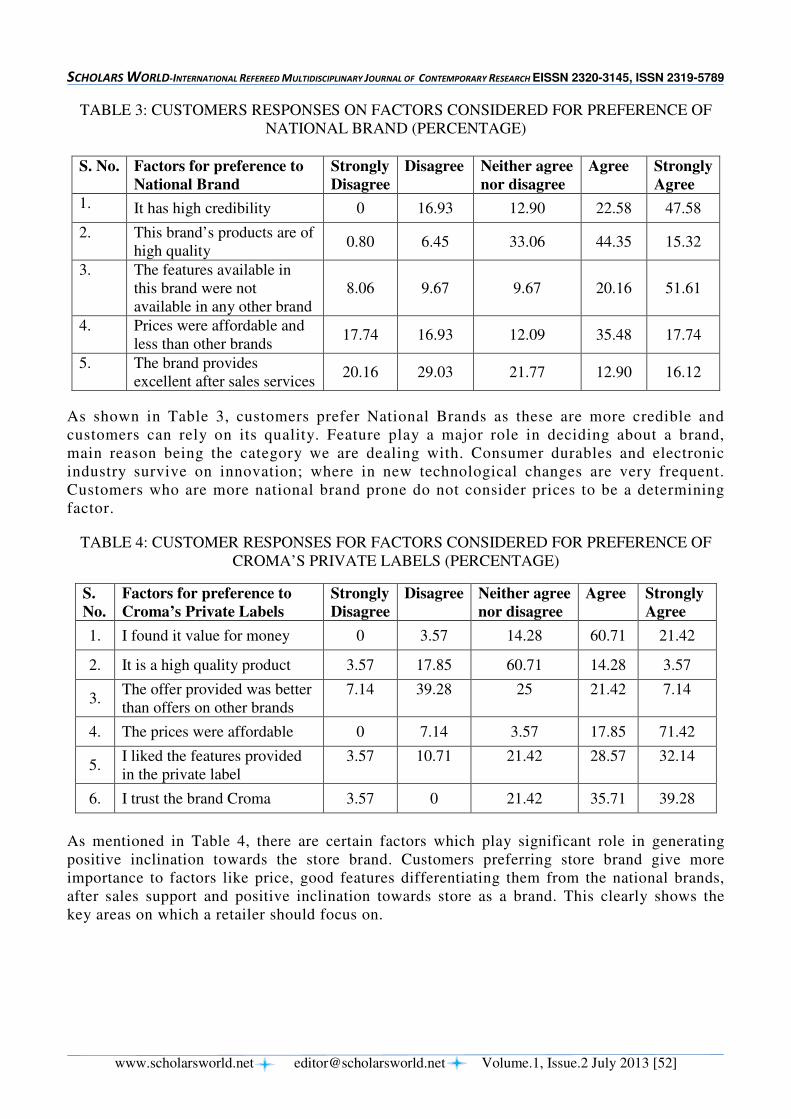
SCHOLARS WORLD-INTERNATIONAL REFEREED MULTIDISCIPLINARY JOURNAL OF CONTEMPORARY RESEARCH EISSN 2320-3145, ISSN 2319-5789
www.scholarsworld.net [email protected] Volume.1, Issue.2 July 2013 [52]
TABLE 3: CUSTOMERS RESPONSES ON FACTORS CONSIDERED FOR PREFERENCE OF NATIONAL BRAND (PERCENTAGE)
S. No. Factors for preference to
National Brand
Strongly
Disagree
Disagree Neither agree
nor disagree
Agree Strongly
Agree
1. It has high credibility 0 16.93 12.90 22.58 47.58
2. This brand’s products are of high quality
0.80 6.45 33.06 44.35 15.32
3. The features available in this brand were not available in any other brand
8.06 9.67 9.67 20.16 51.61
4. Prices were affordable and less than other brands
17.74 16.93 12.09 35.48 17.74
5. The brand provides excellent after sales services
20.16 29.03 21.77 12.90 16.12
As shown in Table 3, customers prefer National Brands as these are more credible and customers can rely on its quality. Feature play a major role in deciding about a brand, main reason being the category we are dealing with. Consumer durables and electronic industry survive on innovation; where in new technological changes are very frequent. Customers who are more national brand prone do not consider prices to be a determining factor.
TABLE 4: CUSTOMER RESPONSES FOR FACTORS CONSIDERED FOR PREFERENCE OF CROMA’S PRIVATE LABELS (PERCENTAGE)
S.
No.
Factors for preference to
Croma’s Private Labels
Strongly
Disagree
Disagree Neither agree
nor disagree
Agree Strongly
Agree
1. I found it value for money 0 3.57 14.28 60.71 21.42
2. It is a high quality product 3.57 17.85 60.71 14.28 3.57
3. The offer provided was better than offers on other brands
7.14
39.28
25
21.42
7.14
4. The prices were affordable 0 7.14 3.57 17.85 71.42
5. I liked the features provided in the private label
3.57
10.71
21.42
28.57
32.14
6. I trust the brand Croma 3.57 0 21.42 35.71 39.28
As mentioned in Table 4, there are certain factors which play significant role in generating positive inclination towards the store brand. Customers preferring store brand give more importance to factors like price, good features differentiating them from the national brands, after sales support and positive inclination towards store as a brand. This clearly shows the key areas on which a retailer should focus on.
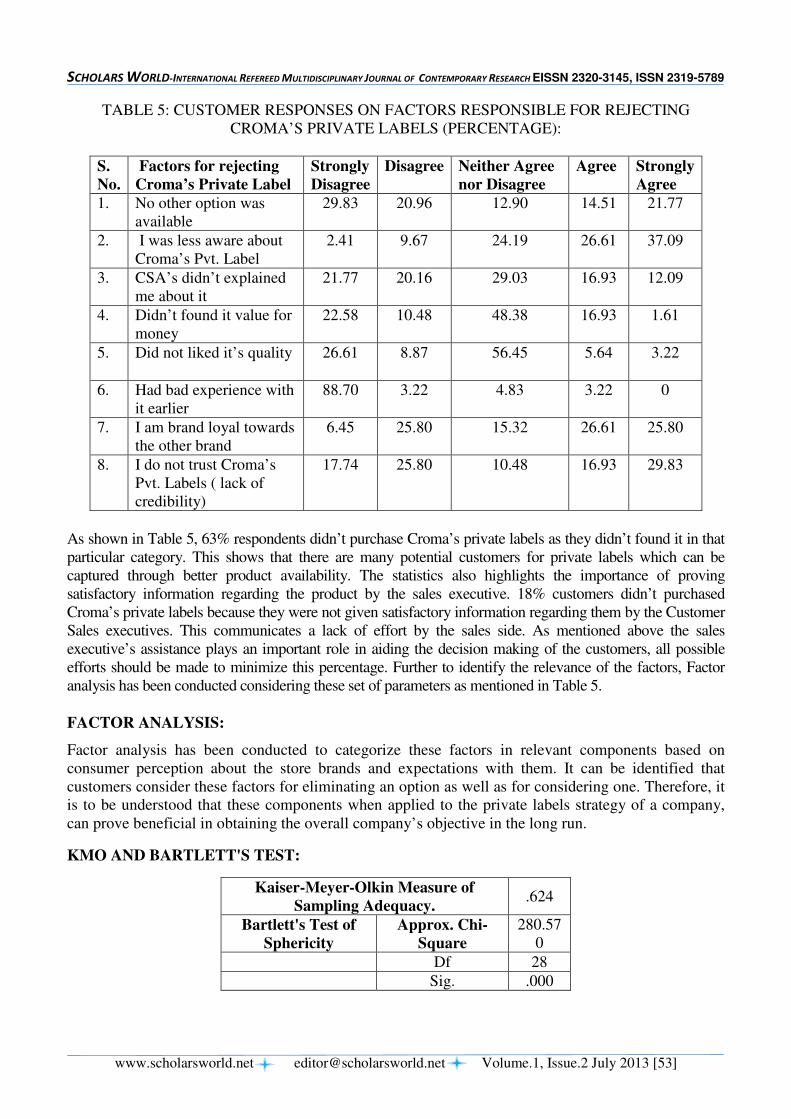
SCHOLARS WORLD-INTERNATIONAL REFEREED MULTIDISCIPLINARY JOURNAL OF CONTEMPORARY RESEARCH EISSN 2320-3145, ISSN 2319-5789
www.scholarsworld.net [email protected] Volume.1, Issue.2 July 2013 [53]
TABLE 5: CUSTOMER RESPONSES ON FACTORS RESPONSIBLE FOR REJECTING CROMA’S PRIVATE LABELS (PERCENTAGE):
S.
No.
Factors for rejecting
Croma’s Private Label
Strongly
Disagree
Disagree Neither Agree
nor Disagree
Agree Strongly
Agree
1. No other option was available
29.83
20.96 12.90 14.51 21.77
2. I was less aware about Croma’s Pvt. Label
2.41 9.67
24.19 26.61
37.09
3. CSA’s didn’t explained me about it
21.77 20.16 29.03
16.93 12.09
4. Didn’t found it value for money
22.58 10.48 48.38 16.93 1.61
5. Did not liked it’s quality 26.61
8.87
56.45
5.64
3.22
6. Had bad experience with it earlier
88.70 3.22
4.83
3.22
0
7. I am brand loyal towards the other brand
6.45 25.80
15.32 26.61
25.80
8. I do not trust Croma’s Pvt. Labels ( lack of credibility)
17.74
25.80
10.48
16.93
29.83
As shown in Table 5, 63% respondents didn’t purchase Croma’s private labels as they didn’t found it in that particular category. This shows that there are many potential customers for private labels which can be captured through better product availability. The statistics also highlights the importance of proving satisfactory information regarding the product by the sales executive. 18% customers didn’t purchased Croma’s private labels because they were not given satisfactory information regarding them by the Customer Sales executives. This communicates a lack of effort by the sales side. As mentioned above the sales executive’s assistance plays an important role in aiding the decision making of the customers, all possible efforts should be made to minimize this percentage. Further to identify the relevance of the factors, Factor analysis has been conducted considering these set of parameters as mentioned in Table 5. FACTOR ANALYSIS:
Factor analysis has been conducted to categorize these factors in relevant components based on consumer perception about the store brands and expectations with them. It can be identified that customers consider these factors for eliminating an option as well as for considering one. Therefore, it is to be understood that these components when applied to the private labels strategy of a company, can prove beneficial in obtaining the overall company’s objective in the long run.
KMO AND BARTLETT'S TEST:
Kaiser-Meyer-Olkin Measure of
Sampling Adequacy. .624
Bartlett's Test of
Sphericity
Approx. Chi-
Square
280.570
Df 28
Sig. .000
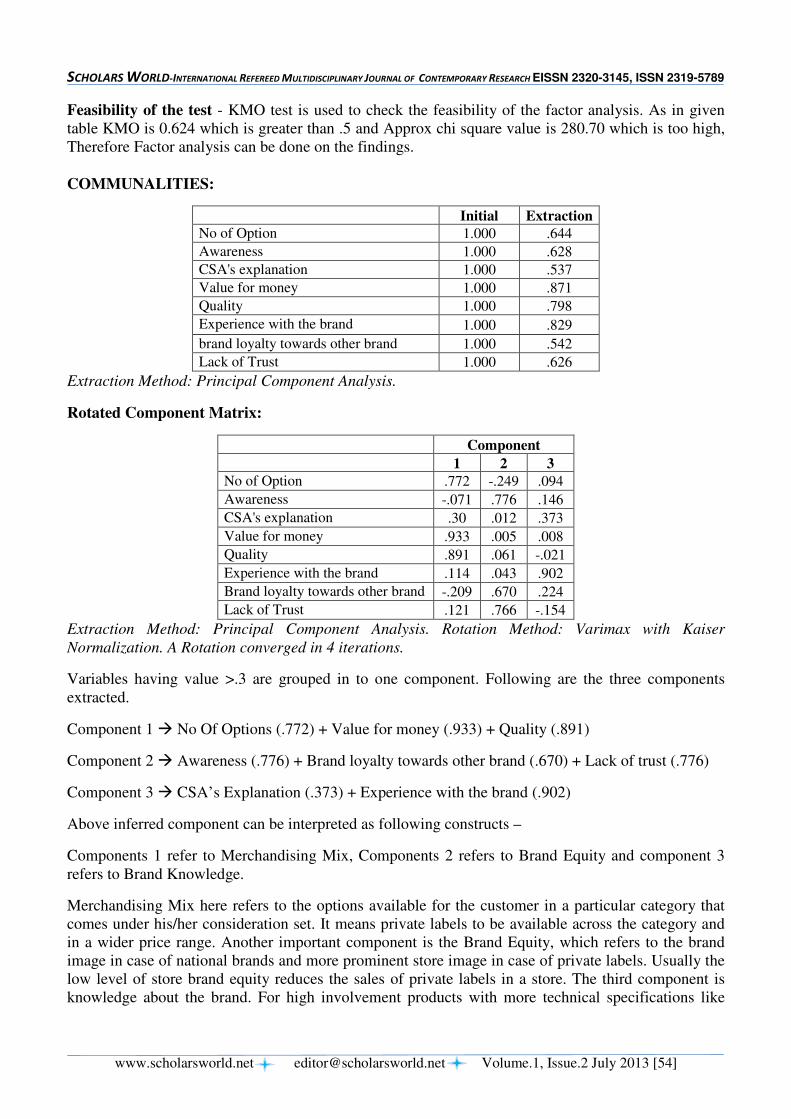
SCHOLARS WORLD-INTERNATIONAL REFEREED MULTIDISCIPLINARY JOURNAL OF CONTEMPORARY RESEARCH EISSN 2320-3145, ISSN 2319-5789
www.scholarsworld.net [email protected] Volume.1, Issue.2 July 2013 [54]
Feasibility of the test - KMO test is used to check the feasibility of the factor analysis. As in given table KMO is 0.624 which is greater than .5 and Approx chi square value is 280.70 which is too high, Therefore Factor analysis can be done on the findings. COMMUNALITIES:
Initial Extraction
No of Option 1.000 .644
Awareness 1.000 .628
CSA's explanation 1.000 .537
Value for money 1.000 .871
Quality 1.000 .798
Experience with the brand 1.000 .829
brand loyalty towards other brand 1.000 .542
Lack of Trust 1.000 .626
Extraction Method: Principal Component Analysis.
Rotated Component Matrix:
Component
1 2 3
No of Option .772 -.249 .094
Awareness -.071 .776 .146
CSA's explanation .30 .012 .373
Value for money .933 .005 .008
Quality .891 .061 -.021
Experience with the brand .114 .043 .902
Brand loyalty towards other brand -.209 .670 .224
Lack of Trust .121 .766 -.154
Extraction Method: Principal Component Analysis. Rotation Method: Varimax with Kaiser
Normalization. A Rotation converged in 4 iterations.
Variables having value >.3 are grouped in to one component. Following are the three components extracted.
Component 1 � No Of Options (.772) + Value for money (.933) + Quality (.891)
Component 2 � Awareness (.776) + Brand loyalty towards other brand (.670) + Lack of trust (.776)
Component 3 � CSA’s Explanation (.373) + Experience with the brand (.902)
Above inferred component can be interpreted as following constructs –
Components 1 refer to Merchandising Mix, Components 2 refers to Brand Equity and component 3 refers to Brand Knowledge.
Merchandising Mix here refers to the options available for the customer in a particular category that comes under his/her consideration set. It means private labels to be available across the category and in a wider price range. Another important component is the Brand Equity, which refers to the brand image in case of national brands and more prominent store image in case of private labels. Usually the low level of store brand equity reduces the sales of private labels in a store. The third component is knowledge about the brand. For high involvement products with more technical specifications like
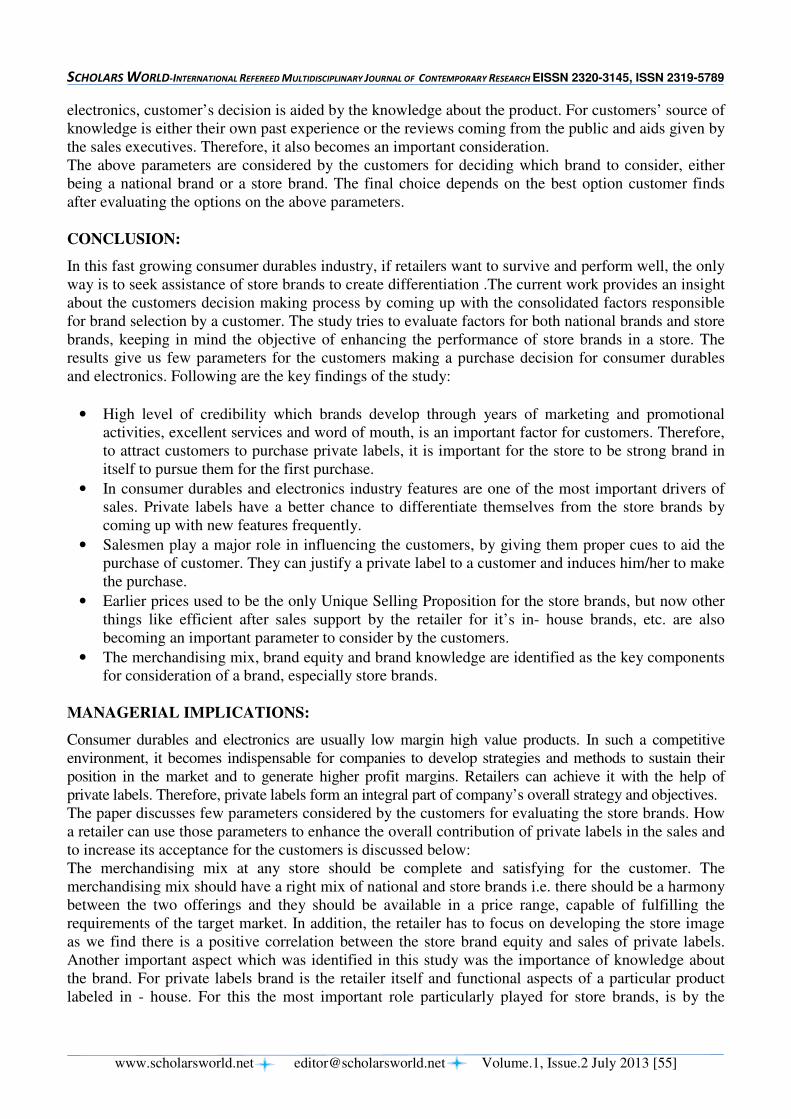
SCHOLARS WORLD-INTERNATIONAL REFEREED MULTIDISCIPLINARY JOURNAL OF CONTEMPORARY RESEARCH EISSN 2320-3145, ISSN 2319-5789
www.scholarsworld.net [email protected] Volume.1, Issue.2 July 2013 [55]
electronics, customer’s decision is aided by the knowledge about the product. For customers’ source of knowledge is either their own past experience or the reviews coming from the public and aids given by the sales executives. Therefore, it also becomes an important consideration. The above parameters are considered by the customers for deciding which brand to consider, either being a national brand or a store brand. The final choice depends on the best option customer finds after evaluating the options on the above parameters. CONCLUSION:
In this fast growing consumer durables industry, if retailers want to survive and perform well, the only way is to seek assistance of store brands to create differentiation .The current work provides an insight about the customers decision making process by coming up with the consolidated factors responsible for brand selection by a customer. The study tries to evaluate factors for both national brands and store brands, keeping in mind the objective of enhancing the performance of store brands in a store. The results give us few parameters for the customers making a purchase decision for consumer durables and electronics. Following are the key findings of the study:
• High level of credibility which brands develop through years of marketing and promotional activities, excellent services and word of mouth, is an important factor for customers. Therefore, to attract customers to purchase private labels, it is important for the store to be strong brand in itself to pursue them for the first purchase.
• In consumer durables and electronics industry features are one of the most important drivers of sales. Private labels have a better chance to differentiate themselves from the store brands by coming up with new features frequently.
• Salesmen play a major role in influencing the customers, by giving them proper cues to aid the purchase of customer. They can justify a private label to a customer and induces him/her to make the purchase.
• Earlier prices used to be the only Unique Selling Proposition for the store brands, but now other things like efficient after sales support by the retailer for it’s in- house brands, etc. are also becoming an important parameter to consider by the customers.
• The merchandising mix, brand equity and brand knowledge are identified as the key components for consideration of a brand, especially store brands.
MANAGERIAL IMPLICATIONS:
Consumer durables and electronics are usually low margin high value products. In such a competitive environment, it becomes indispensable for companies to develop strategies and methods to sustain their position in the market and to generate higher profit margins. Retailers can achieve it with the help of private labels. Therefore, private labels form an integral part of company’s overall strategy and objectives. The paper discusses few parameters considered by the customers for evaluating the store brands. How a retailer can use those parameters to enhance the overall contribution of private labels in the sales and to increase its acceptance for the customers is discussed below: The merchandising mix at any store should be complete and satisfying for the customer. The merchandising mix should have a right mix of national and store brands i.e. there should be a harmony between the two offerings and they should be available in a price range, capable of fulfilling the requirements of the target market. In addition, the retailer has to focus on developing the store image as we find there is a positive correlation between the store brand equity and sales of private labels. Another important aspect which was identified in this study was the importance of knowledge about the brand. For private labels brand is the retailer itself and functional aspects of a particular product labeled in - house. For this the most important role particularly played for store brands, is by the
SCHOLARS WORLD-INTERNATIONAL REFEREED MULTIDISCIPLINARY JOURNAL OF CONTEMPORARY RESEARCH EISSN 2320-3145, ISSN 2319-5789
www.scholarsworld.net [email protected] Volume.1, Issue.2 July 2013 [56]
Customer Sales Executives (CSA’s).Other being the past experience of the customer with the brand, which can be positive only by providing a good quality product. Thus, retailer has to understand and train salespeople to focus on effective influencers, and deliver high quality products. This is because the quality has a positive correlation with the store image, and providing a poor quality product would also prove detrimental for the store image. REFERENCES:
1. Aaker, D. A. and Joachimsthaler. E. 2000, Brand Leadership, London, Free Press. 2. Esbjerg, Lars ; Grunert, Klaus G. ; Juhl, Hans Jørn. 2004. Retailer brand architectures: 3. Consumer perceptions of five Danish food retailers, Konferencen: 8th International Conference
on Corporate Reputation, Image, Identity & Competitiveness, Fort Lauderdale, USA, , 20 - 23 May 2004.
4. Keller, K.L. 1993, "Conceptualising, measuring and managing customer-based brand equity", Journal of Marketing, Vol. 57 No.1, pp.1-22.
5. Kusum Ailawadi and Kevin Keller 2004, “Understanding Retail Branding: Conceptual Insights and Research Priorities”, Journal of Retailing, Vol. 80, Issue 4 (winter), 331-342.
6. Semeijn, J.; Ambrosini, A.B. 2004. Consumer Evaluations of Store Brands: Effects of Store Image and Product Attributes, Journal of Retailing and Consumer Services, 11 (4), 247-258.
7. Sonnenberg, N.C. and Erasmus, A.C. 2008, “Exploring the role of retailer image and store brands as extrinsic cues in young urban consumers’ choice of interior textile products”, Latin American Advances in Consumer Research, 2.
8. Steve Burt, Jose Carralero-Encinas, 2000 "The role of store image in retail internationalization", International Marketing Review, Vol. 17 Iss: 4/5, pp.433 – 453
----
SCHOLARS WORLD-INTERNATIONAL REFEREED MULTIDISCIPLINARY JOURNAL OF CONTEMPORARY RESEARCH EISSN 2320-3145, ISSN 2319-5789
www.scholarsworld.net [email protected] Volume.1, Issue.2 July 2013 [57]
EMPLOYMENT RATE AND SOCIO-ECONOMIC STATUS OF
BEGGARS IN RURAL AREAS OF ALIGARH DISTRICT
DR. JABIR HASAN KHAN,
Associate Professor,
Department of Geography, Aligarh Muslim
University, Aligarh (UP), India
DR. MENKA,
Research Fellow,
Department of Geography, Aligarh Muslim
University, Aligarh-(India)
DR. FALAK BUTOOL,
Post Doctoral Fellow,
Department of Geography, Aligarh Muslim University, Aligarh- (India)
ABSTRACT
The present research paper is an attempt to analyse the spatial patterns of rural beggars’
employment, variations in the level of their socio-economic status, and the relationship between
the rates of employment (dependent variable) with selected independent variables of socio-
economic development in Aligarh district of Uttar Pradesh. The study is based on primary source
of data, collected through the field survey in the Aligarh district carried out during 2009.
Stratified random sampling technique has been used for the selection of villages. Six per cent
villages (i.e. 70 villages) were selected out of the 1180 inhabited villages and for the selection of
households, 25 per cent households of the beggars were randomly selected from each selected
village of the district. Altogether, 496 households were selected for the present study from the 70
villages of the district. Spatial analysis reveals that the most of the blocks experienced the
medium level of employment of rural beggars in the whole eastern part, whereas, there is no
uniform pattern in terms of socio-economic development among the rural beggar population in
the district, but the medium and high level of socio-economic development is experienced in few
pockets of central and eastern parts in the study area.
Keywords: Rural Beggars, Aligarh, Employment Rate, Socio-Economic Development,
SCHOLARS WORLD-INTERNATIONAL REFEREED MULTIDISCIPLINARY JOURNAL OF CONTEMPORARY RESEARCH EISSN 2320-3145, ISSN 2319-5789
www.scholarsworld.net [email protected] Volume.1, Issue.2 July 2013 [58]
INTRODUCTION:
Rapid rate of urbanization with insufficient economic base to sustain urban life is one of the most important
reasons for encouraging beggary in developing countries like India. Beggars in India are the victim of an
imbalanced socio-economic system. They are the most vulnerable people in our society. They are the example
of human degradation to the lowest extent, and they are a menace to the healthy society. Most of them are the
product of economic deprivation, destitution and neglect (Cama, 1945). Begging is commonly defined as the act
of stopping people on the street to ask for assistance, for example in the form of food or money (Bose &
Hwang, 2002 and Collins & Blomley, 2003). According to the Census of India (2001), beggars are “vagrants,
prostitutes and person having unidentified source of income and those with unspecified source of subsistence
and not engaged in any economically productive work during reference period called beggars.”
Mukharjee (1945) pointed out that “Beggary is a symptom of social disorganisation”. Its prevalence in our
country is supposed to be the result of the breakdown of the socio-economic structure of the country. Moorthy
(1945) has done a historical survey of pauperism and mentioned that while, individual charity and State aid
played a great part in caring for the destitute, the socio-economic structure of ancient India minimised begging
and distributed equally the incidence of relief.
Beggars now depend almost wholly on indiscriminate charity which encourages thousands to join the legion of
paupers and destitute. Gillin (1929) examined that how socio-economic conditions result the beggary and
vagrancy. He highlighted the main causes which give rise to begging like economic and social disorganisation
resulting from the changes in the economic order or political instability, breakdown of agriculture, religious
ideals and practices, the crusades, migrations decay of feudalism, a plague of famine. Norberg (1985) analyses
the relationship between the rich and poor at their closest point of contact: poor relief. This study provides a
revealing account of one society’s response to poverty.
Primarily development can be perceived as reflection of personal values conditioned by societal framework in
which one lives (Stohr and Taylor, 198). In the other words, development implies progressive changes in socio-
economic structure of a country (Chand and Puri, 1990). The development is an outcome of the efforts made for
the eradication of poverty and unemployment and regional inequalities (Seer, 1989). Thus, development is the
state of change from a given situation of a region to become better one within a given period of time (Sharma,
1989). The concept of development may be taken to imply an improvement in the material and cultural well
being of the people in a region. The development of a region can be identified with an increase in the
employment opportunities, availability of infrastructural facilities, amenities and services, proper distribution of
resources, increase in production, and investment in consumption and so on. Thus, the development refers to an
improvement of all the sectors of economic, social and cultural pursuits (Verma, 1993).
AIMS AND OBJECTIVES:
The present study has been undertaken with the following specific objectives:
i. To examine the spatial variations of employment rate of the rural beggars in the district.
ii. To inspect the inter-block disparities in the levels of socio-economic development in the Aligarh
district.
iii. To find out the relationship of employment rate of rural beggars with their socio-economic
development status in the study area.
STUDY AREA:
Aligarh district, a medium sized district, is spreading over an area of 3700.4 square kilometers in the Western
part of Uttar Pradesh. It occupies the north-western part of the Uttar Pradesh which is fertile region of Ganga
and Yamuna, known as Doab. In the world map, the geographical
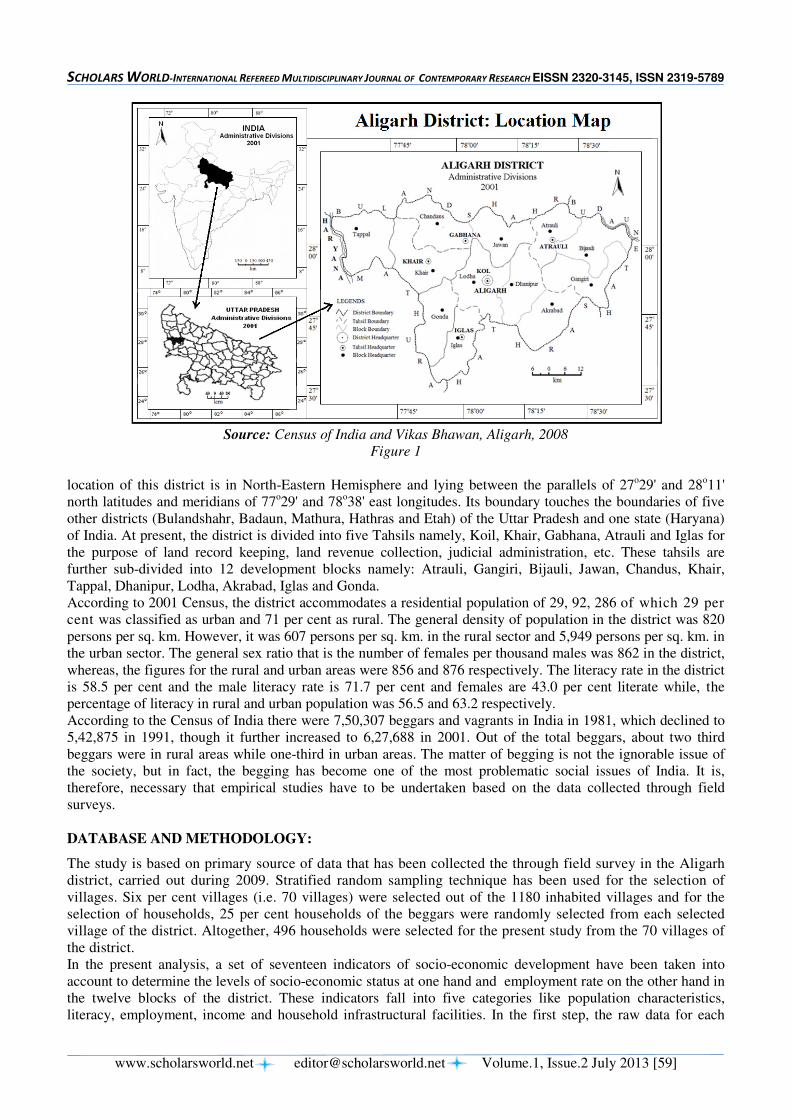
SCHOLARS WORLD-INTERNATIONAL REFEREED MULTIDISCIPLINARY JOURNAL OF CONTEMPORARY RESEARCH EISSN 2320-3145, ISSN 2319-5789
www.scholarsworld.net [email protected] Volume.1, Issue.2 July 2013 [59]
Source: Census of India and Vikas Bhawan, Aligarh, 2008
Figure 1
location of this district is in North-Eastern Hemisphere and lying between the parallels of 27o29' and 28
o11'
north latitudes and meridians of 77o29' and 78
o38' east longitudes. Its boundary touches the boundaries of five
other districts (Bulandshahr, Badaun, Mathura, Hathras and Etah) of the Uttar Pradesh and one state (Haryana)
of India. At present, the district is divided into five Tahsils namely, Koil, Khair, Gabhana, Atrauli and Iglas for
the purpose of land record keeping, land revenue collection, judicial administration, etc. These tahsils are
further sub-divided into 12 development blocks namely: Atrauli, Gangiri, Bijauli, Jawan, Chandus, Khair,
Tappal, Dhanipur, Lodha, Akrabad, Iglas and Gonda.
According to 2001 Census, the district accommodates a residential population of 29, 92, 286 of which 29 per
cent was classified as urban and 71 per cent as rural. The general density of population in the district was 820
persons per sq. km. However, it was 607 persons per sq. km. in the rural sector and 5,949 persons per sq. km. in
the urban sector. The general sex ratio that is the number of females per thousand males was 862 in the district,
whereas, the figures for the rural and urban areas were 856 and 876 respectively. The literacy rate in the district
is 58.5 per cent and the male literacy rate is 71.7 per cent and females are 43.0 per cent literate while, the
percentage of literacy in rural and urban population was 56.5 and 63.2 respectively.
According to the Census of India there were 7,50,307 beggars and vagrants in India in 1981, which declined to
5,42,875 in 1991, though it further increased to 6,27,688 in 2001. Out of the total beggars, about two third
beggars were in rural areas while one-third in urban areas. The matter of begging is not the ignorable issue of
the society, but in fact, the begging has become one of the most problematic social issues of India. It is,
therefore, necessary that empirical studies have to be undertaken based on the data collected through field
surveys.
DATABASE AND METHODOLOGY:
The study is based on primary source of data that has been collected the through field survey in the Aligarh
district, carried out during 2009. Stratified random sampling technique has been used for the selection of
villages. Six per cent villages (i.e. 70 villages) were selected out of the 1180 inhabited villages and for the
selection of households, 25 per cent households of the beggars were randomly selected from each selected
village of the district. Altogether, 496 households were selected for the present study from the 70 villages of
the district.
In the present analysis, a set of seventeen indicators of socio-economic development have been taken into
account to determine the levels of socio-economic status at one hand and employment rate on the other hand in
the twelve blocks of the district. These indicators fall into five categories like population characteristics,
literacy, employment, income and household infrastructural facilities. In the first step, the raw data for each
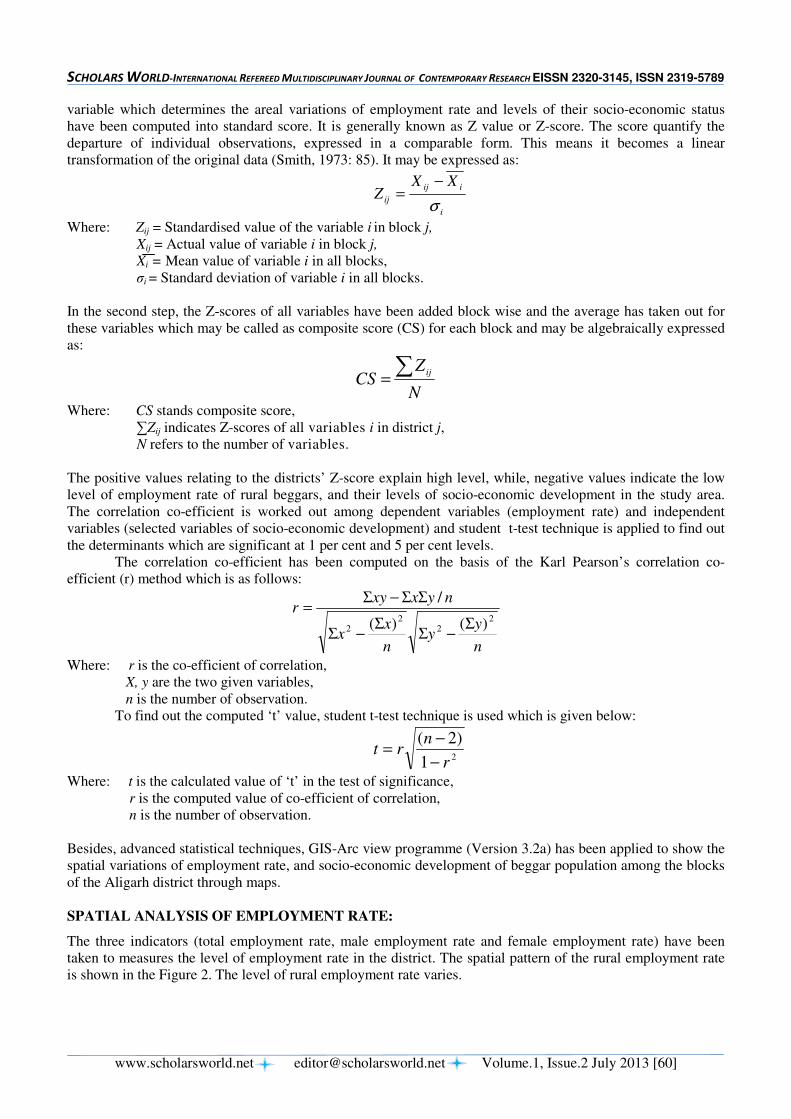
SCHOLARS WORLD-INTERNATIONAL REFEREED MULTIDISCIPLINARY JOURNAL OF CONTEMPORARY RESEARCH EISSN 2320-3145, ISSN 2319-5789
www.scholarsworld.net [email protected] Volume.1, Issue.2 July 2013 [60]
variable which determines the areal variations of employment rate and levels of their socio-economic status
have been computed into standard score. It is generally known as Z value or Z-score. The score quantify the
departure of individual observations, expressed in a comparable form. This means it becomes a linear
transformation of the original data (Smith, 1973: 85). It may be expressed as:
i
iij
ij
XXZ
σ
−=
Where: Zij = Standardised value of the variable i in block j,
Xij = Actual value of variable i in block j,
Xi = Mean value of variable i in all blocks,
σi = Standard deviation of variable i in all blocks.
In the second step, the Z-scores of all variables have been added block wise and the average has taken out for
these variables which may be called as composite score (CS) for each block and may be algebraically expressed
as:
N
ZCS
ij∑=
Where: CS stands composite score,
∑Zij indicates Z-scores of all variables i in district j,
N refers to the number of variables.
The positive values relating to the districts’ Z-score explain high level, while, negative values indicate the low
level of employment rate of rural beggars, and their levels of socio-economic development in the study area.
The correlation co-efficient is worked out among dependent variables (employment rate) and independent
variables (selected variables of socio-economic development) and student t-test technique is applied to find out
the determinants which are significant at 1 per cent and 5 per cent levels.
The correlation co-efficient has been computed on the basis of the Karl Pearson’s correlation co-
efficient (r) method which is as follows:
n
yy
n
xx
nyxxyr
22
22 )()(
/
Σ−Σ
Σ−Σ
ΣΣ−Σ=
Where: r is the co-efficient of correlation,
X, y are the two given variables,
n is the number of observation.
To find out the computed ‘t’ value, student t-test technique is used which is given below:
21
)2(
r
nrt
−
−=
Where: t is the calculated value of ‘t’ in the test of significance,
r is the computed value of co-efficient of correlation,
n is the number of observation.
Besides, advanced statistical techniques, GIS-Arc view programme (Version 3.2a) has been applied to show the
spatial variations of employment rate, and socio-economic development of beggar population among the blocks
of the Aligarh district through maps.
SPATIAL ANALYSIS OF EMPLOYMENT RATE:
The three indicators (total employment rate, male employment rate and female employment rate) have been
taken to measures the level of employment rate in the district. The spatial pattern of the rural employment rate
is shown in the Figure 2. The level of rural employment rate varies.

SCHOLARS WORLD-INTERNATIONAL REFEREED MULTIDISCIPLINARY JOURNAL OF CONTEMPORARY RESEARCH EISSN 2320-3145, ISSN 2319-5789
www.scholarsworld.net [email protected] Volume.1, Issue.2 July 2013 [61]
TABLE 1: BLOCK-WISE DISTRIBUTION OF Z-SCORE OF EMPLOYMENT RATE AND SOCIO-ECONOMIC STATUS OF RURAL BEGGAR POPULATION IN ALIGARH DISTRICT, 2009
Name of the
Block Employment Rate
Socio-Economic
Development
Employment Rate vis-à-vis
Socio-Economic Development
Lodha -0.42 0.03 ER2 SED2
Dhanipur -0.24 0.18 ER2 SED2
Akrabad 1.54 0.49 ER1 SED1
Gonda 1.56 0.62 ER1 SED1
Iglas -1.29 -0.27 ER3 SED3
Khair -0.62 -0.35 ER3 SED3
Tappal -1.46 -0.83 ER3 SED3
Chandaus -0.33 0.33 ER2 SED1
Jawan 0.20 -0.12 ER2 SED2
Atrauli 0.87 -0.24 ER1 SED3
Bijauli -0.10 -0.05 ER2 SED2
Gangiri 0.27 0.21 ER2 SED1
Source: Calculation is based on Sample Survey.
Note: ER= Employment Rate, SED= Socio-Economic Development, ER1= High Level of Employment Rate,
ER2= Medium Level of Employment Rate, ER3= Low Level of Employment Rate, SED1= High Level of Socio-
Economic Development, SED2= Medium Level of Socio-Economic Development and SED3= Low Level of
Socio-Economic Development from the lowest -1.46 score in the Tappal block to the highest 1.56 score in the
Gonda block of the district. The entire range of variation may be categorized into three grades such as high
(above 0.48 score), medium (0.48 to -0.48 score) and low (below -0.48 score) (Table 1).
TABLE 2: LEVELS OF SOCIO-ECONOMIC DEVELOPMENT OF BEGGARS IN RURAL AREAS OF ALIGARH DISTRICT, 2009
Category Z-Score No. of Block Name of the Block
Employment Rate
High Above 0.48 3 Akrabad, Gonda and Atrauli
Medium 0.48 to -0.48 6 Lodha, Dhanipur, Jawan, Chandaus, Bijauli and Gangiri
Low Below -0.48 3 Iglas, Tappal and Khair
Socio-Economic Development
High Above 0.20 4 Chandaus, Gonda, Akrabad and Gangiri
Medium 0.20 to -0.20 4 Lodha, Dhanipur, Jawan and Bijauli
Low Below -0.20 4 Tappal, Khair, Iglas and Atrauli
Source: Based on Table 1.
Figure 2
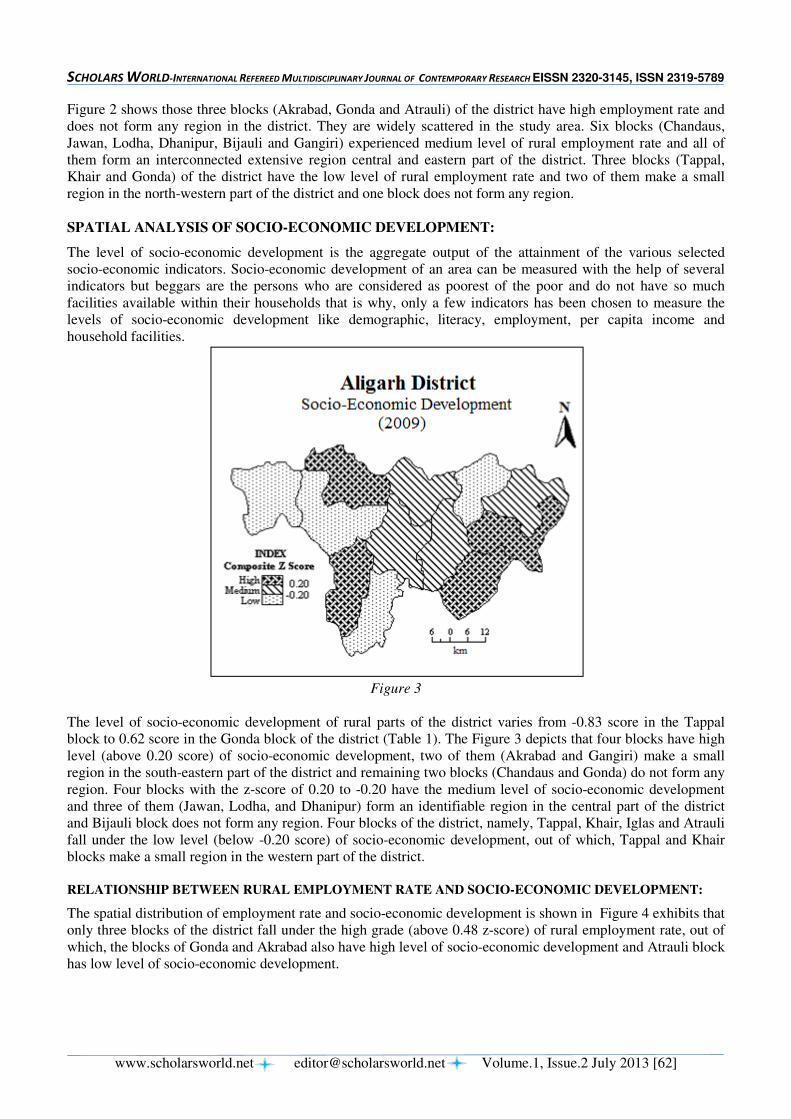
SCHOLARS WORLD-INTERNATIONAL REFEREED MULTIDISCIPLINARY JOURNAL OF CONTEMPORARY RESEARCH EISSN 2320-3145, ISSN 2319-5789
www.scholarsworld.net [email protected] Volume.1, Issue.2 July 2013 [62]
Figure 2 shows those three blocks (Akrabad, Gonda and Atrauli) of the district have high employment rate and
does not form any region in the district. They are widely scattered in the study area. Six blocks (Chandaus,
Jawan, Lodha, Dhanipur, Bijauli and Gangiri) experienced medium level of rural employment rate and all of
them form an interconnected extensive region central and eastern part of the district. Three blocks (Tappal,
Khair and Gonda) of the district have the low level of rural employment rate and two of them make a small
region in the north-western part of the district and one block does not form any region.
SPATIAL ANALYSIS OF SOCIO-ECONOMIC DEVELOPMENT:
The level of socio-economic development is the aggregate output of the attainment of the various selected
socio-economic indicators. Socio-economic development of an area can be measured with the help of several
indicators but beggars are the persons who are considered as poorest of the poor and do not have so much
facilities available within their households that is why, only a few indicators has been chosen to measure the
levels of socio-economic development like demographic, literacy, employment, per capita income and
household facilities.
Figure 3
The level of socio-economic development of rural parts of the district varies from -0.83 score in the Tappal
block to 0.62 score in the Gonda block of the district (Table 1). The Figure 3 depicts that four blocks have high
level (above 0.20 score) of socio-economic development, two of them (Akrabad and Gangiri) make a small
region in the south-eastern part of the district and remaining two blocks (Chandaus and Gonda) do not form any
region. Four blocks with the z-score of 0.20 to -0.20 have the medium level of socio-economic development
and three of them (Jawan, Lodha, and Dhanipur) form an identifiable region in the central part of the district
and Bijauli block does not form any region. Four blocks of the district, namely, Tappal, Khair, Iglas and Atrauli
fall under the low level (below -0.20 score) of socio-economic development, out of which, Tappal and Khair
blocks make a small region in the western part of the district.
RELATIONSHIP BETWEEN RURAL EMPLOYMENT RATE AND SOCIO-ECONOMIC DEVELOPMENT:
The spatial distribution of employment rate and socio-economic development is shown in Figure 4 exhibits that
only three blocks of the district fall under the high grade (above 0.48 z-score) of rural employment rate, out of
which, the blocks of Gonda and Akrabad also have high level of socio-economic development and Atrauli block
has low level of socio-economic development.
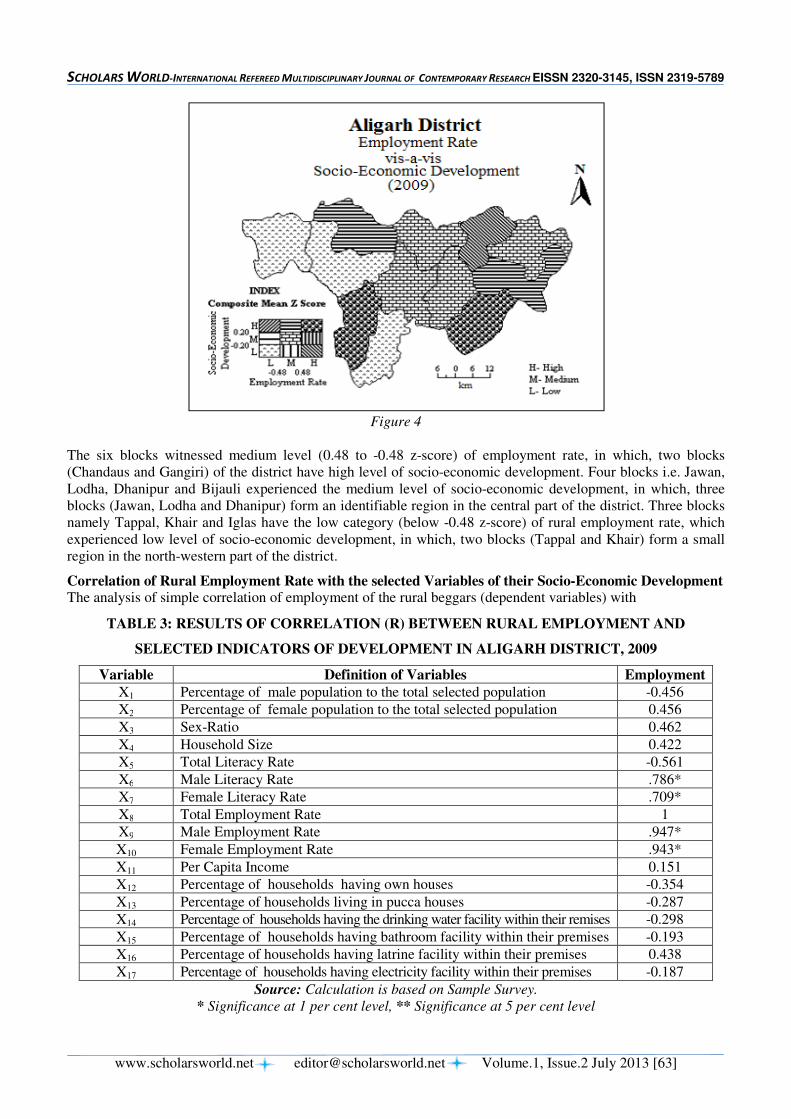
SCHOLARS WORLD-INTERNATIONAL REFEREED MULTIDISCIPLINARY JOURNAL OF CONTEMPORARY RESEARCH EISSN 2320-3145, ISSN 2319-5789
www.scholarsworld.net [email protected] Volume.1, Issue.2 July 2013 [63]
Figure 4
The six blocks witnessed medium level (0.48 to -0.48 z-score) of employment rate, in which, two blocks
(Chandaus and Gangiri) of the district have high level of socio-economic development. Four blocks i.e. Jawan,
Lodha, Dhanipur and Bijauli experienced the medium level of socio-economic development, in which, three
blocks (Jawan, Lodha and Dhanipur) form an identifiable region in the central part of the district. Three blocks
namely Tappal, Khair and Iglas have the low category (below -0.48 z-score) of rural employment rate, which
experienced low level of socio-economic development, in which, two blocks (Tappal and Khair) form a small
region in the north-western part of the district.
Correlation of Rural Employment Rate with the selected Variables of their Socio-Economic Development The analysis of simple correlation of employment of the rural beggars (dependent variables) with
TABLE 3: RESULTS OF CORRELATION (R) BETWEEN RURAL EMPLOYMENT AND
SELECTED INDICATORS OF DEVELOPMENT IN ALIGARH DISTRICT, 2009
Variable Definition of Variables Employment
X1 Percentage of male population to the total selected population -0.456
X2 Percentage of female population to the total selected population 0.456
X3 Sex-Ratio 0.462
X4 Household Size 0.422
X5 Total Literacy Rate -0.561
X6 Male Literacy Rate .786*
X7 Female Literacy Rate .709*
X8 Total Employment Rate 1
X9 Male Employment Rate .947*
X10 Female Employment Rate .943*
X11 Per Capita Income 0.151
X12 Percentage of households having own houses -0.354
X13 Percentage of households living in pucca houses -0.287
X14 Percentage of households having the drinking water facility within their remises -0.298
X15 Percentage of households having bathroom facility within their premises -0.193
X16 Percentage of households having latrine facility within their premises 0.438
X17 Percentage of households having electricity facility within their premises -0.187
Source: Calculation is based on Sample Survey.
* Significance at 1 per cent level, ** Significance at 5 per cent level
SCHOLARS WORLD-INTERNATIONAL REFEREED MULTIDISCIPLINARY JOURNAL OF CONTEMPORARY RESEARCH EISSN 2320-3145, ISSN 2319-5789
www.scholarsworld.net [email protected] Volume.1, Issue.2 July 2013 [64]
Selected indicators of socio-economic development (independent variables) have been listed in Table 3. The
correlation between employment and selected indicators of socio-economic development exhibits that among
the seventeen indepenent indicators of socio-economic development, the coefficient of correlation of four
indicators (X6= male literacy rate and X7= female literacy rate, X9= male employment rate and X10= female
employment rate) has a higher level of significant relationship with the employment and all these indicators are
positively correlated with employment rate at 99 per cent the confidence level.
CONCLUSIONS:
The geographical patterns of employment rate and levels of socio-economic development among the rural
beggar population and their relationship clearly depict that there is large variations among the inhabitant
beggars of these blocks of the study area. The analysis of the employment reveals that the medium level of
employment of rural beggars is witnessed in the whole eastern part of the district, excluding the few pockets of
the district viz., Akrabad, Gonda and Atrauli which have high level of employment among rural beggar
population whereas the western part of the district experienced the low level of employment.
The spatial of analysis of the levels of socio-economic development among the rural beggar population shows
that there is no uniform pattern in terms of socio-economic development among the rural beggar population in
the district, but the medium and high level of socio-economic development among the rural beggar population
is experienced in few pockets of central and eastern parts of the Aligarh district.
However, the geographical relationship between the employment of rural beggars and their levels of socio-
economic development shows that about seventy five percent blocks of the district are perfect positively
correlated with each other but twenty five per cent blocks of the district do not follow the same pattern with
each other in this regard.
SUGGESTIONS:
The following suggestions may be put forward to improve the socio-economic status of beggar population in
the study area:
i. Te general education system needs a meaningful change to make it job oriented. Beggars are to be kept
busy in the institutions through vocational education and some kind of productive activity. The
programmes of vocational training like tailoring, sewing, spinning, mat weaving, book binding,
gardening, mid-wifery, incense-stick making, cooking, catering, doll making, poultry and bee-keeping,
carpentry etc.
ii. Government should develop agro-based household industries and by giving emphasis on agro-allied and
ancillary activities for beggar population i.e. animal husbandry, fisheries , poultry, piggeries, apiculture,
sericulture etc., so that the these people can get employment at their places of origin and it will also help
to stop the movement of the poor people towards urban areas.
REFERENCES:
1. Bose, R. and Hwang, S. W., 2002. “Income and Spending Patterns among Panhandlers,” Canadian
Medical Association Journal, Vol. 167, No. 5, pp. 477–479.
2. Cama, K. H., 1945. “Types of Beggars,” In J. M. Kumarappa (Ed.), Our Beggar Problem: How to Tackle
it (pp. 1-17), Bombay: Padma Publications Ltd.
3. Census of India, 2001. “Primary Census Abstract, Series-1, Total Population: Table A-5,” Registrar
General and Census Commissioner, Govt. of India, New Delhi.
4. Chand, M. and Puri, V.K., 1990. “Regional Planning in India,” New Delhi: Allied Publishers Ltd, p.165.
5. Collins, D. and Blomley, N., 2003. “Private Needs and Public Space: Politics, Poverty, and Anti-
Panhandling By-Laws in Canadian Cities,” In Law Commission of Canada (Ed.), New Perspectives on
the Public–Private Divide, Vancouver: UBC Press, p.1.
6. Gillin, J. L., 1929. “Vagrancy and Begging,” American Journal of Sociology, Vol. 35, No. 3, pp. 424-432.
7. Moorthy, M. V., 1945. “An Historical Survey of Beggar Relief in India,” In J. M. Kumarappa (Ed.), Our
Beggar Problem: How to Tackle it (pp. 69-87), Bombay: Padma Publications Ltd.
8. Mukharjee, R., 1945. “Causes of Beggary,” In J. M. Kumarappa (Ed.), Our Beggar Problem: How to
Tackle it (pp. 19-26), Bombay: Padma Publications Ltd.

SCHOLARS WORLD-INTERNATIONAL REFEREED MULTIDISCIPLINARY JOURNAL OF CONTEMPORARY RESEARCH EISSN 2320-3145, ISSN 2319-5789
www.scholarsworld.net [email protected] Volume.1, Issue.2 July 2013 [65]
9. Norberg, K., 1985. “Rich and Poor in Grenoble 1600-1814”, University of California Press, pp 336.
10. Seer, D., 1969. “The Meaning of Development,” New Delhi: Eleventh World Conference of Society for
International Development, p.3.
11. Sharma, R.C., 1989. “Regional Planning for Social Development,” New Delhi: Criterian Publishing
House, p. 68.
12. Smith, D. M., 1973. “The Geography of Social Well Being in the United State: An Introduction to
Territorial Social Indicators,” New York: McGraw-Hill, p. 85.
13. Stohr, W. and Taylor, D.R. Fraster, 1981. “Development from Above and Below? The Dialectics of
Regional Planning in Developing Countries,” In A.L. Mabogunje and R.P. Misra (Eds.), Regional
development alternative: international perspectives, Singapore: Huntsmen Offset Printing Pvt. Ltd, pp.9-26.
14. Verma, S.S., 1993. “Typology of Development and Planning for Integrated Development: A Study of
Rohilkhand Plain (UP),” In R.S. Tripathi and R.P. Tiwari (Eds.), Regional disparities and development in
India, New Delhi: Ashish Publishing House, pp. 231-243.
15. Vikas Bhawan Office, Aligarh.
----
SCHOLARS WORLD-INTERNATIONAL REFEREED MULTIDISCIPLINARY JOURNAL OF CONTEMPORARY RESEARCH EISSN 2320-3145, ISSN 2319-5789
www.scholarsworld.net [email protected] Volume.1, Issue.2, July 2013 [66]
TRADITIONS OF PATRIOTISM IN URDU POETRY: A
CRITICAL STUDY WITH SPECIAL REFERENCE TO THE
POET OF THE EAST ALLAMA IQBAL AND HIS POETRY
DR. MD YAHYA,
Assistant Professor,
Department of Urdu, Kirori Mal College,
University of Delhi, Delhi-India
ABSTRACT
Urdu literature particularly poetry is very rich in traditions of patriotic and nationalistic
sentiments, which took root and flourished along India’s Struggle for freedom. The later half of
the 19th century and early 20
th century saw an impetus in nationalistic and patriotic activities in
the movement for freedom drawing people from all walks of life into its fold including men of
letters. The strands of progressive movements in Indian literature specially poetry provided fillip
to many modern ideas of patriotism, freedom, equality, equity and justice that formed the core of
this movement’s edifice. Young and budding Indian poets enthusiastically took to expressing
their nationalistic ideas in simple and lucid poems. Their writings clearly demonstrate how
nationalist ideologies can instrumentalize literature towards its lofty ends, turning patriotic
feelings and love for the motherland into a constructive force.
Even so many Indian writers such as Iqbal were swept away by the nationalist frenzy. Allama
Iqbal was a pioneering poet of Urdu and a fiery poet of patriotism. Iqbal was the founder of a new
school of Urdu poetry, which blossomed, in the first quarter of the 20th century. Iqbal's poetry
evolved from nationalism, and he remained a poet of patriotism till the end, although, switching
his loyalties to different levels from being a zealous nationalist in early period of his career to
pan-Islamism in later years.
This paper examines in detail the above cited and other patriotic themes in Urdu literature with
special reference to Allama Iqbal’s poetry, which inspired the sub-continental movement for
national awakening and struggle. Examples of such poetry including the thematic poems and
couplets of Allama Iqbal is cited and illustrated in Roman transliteration and their translation into
English for benefit of English readers.
Keywords: Patriotic traditions, Indian freedom struggle, Urdu poetry, Allama Iqbal, Poet
of the East.
SCHOLARS WORLD-INTERNATIONAL REFEREED MULTIDISCIPLINARY JOURNAL OF CONTEMPORARY RESEARCH EISSN 2320-3145, ISSN 2319-5789
www.scholarsworld.net [email protected] Volume.1, Issue.2, July 2013 [67]
INTRODUCTION:
Literature had been instrumental in all movements for political and social reforms since the 18th century and
later in movements for unification of nations around the world, from the 19th century onwards. The idea of
national unity and patriotism was closely linked with the ideals of political rights, economic development and
the abolition of all repressive systems. And literature became a potent tool to propound these ideals across
nations. The freedom struggle in the Indian sub-continent was also assisted immensely by mass media and
literature particularly poetry that wielded greater emotional impact on the masses.
Among the great Urdu poets who sung patriotic compositions Allama Iqbal holds an eminent position.
However, his contribution to the stirring of patriotic sentiments among participants in the Indian freedom
struggle was watered down due to his support for the idea of Pakistan and pan-Islamism in later years. Few
remember today the remarkable contribution of Iqbal to the development of Urdu literature. The resounding
strains of Iqbal's hymn to the nation are in abundance like the well-known Tarana-i-Hindi (Song of India):
Hubbe watan, samaaye, aankhon men noor hokar
Sar men khumaar hokar, dil men suroor hokar.
(May love for the nation pervade all, becoming light of the eyes,
Exhilarating the mind and intoxicating the heart.)
Iqbal devoted himself to write his classical poems on patriotism in light of Islamic traditions, reminding its
followers of their past glory and virtues which enabled them to bring about in a short span of 30 years since
Prophet’s migration to Medina and his four immediate successors (Caliphs), an amazing political and social
revolution in the history of mankind.
Iqbal's patriotic fervor found finest expression in his elegies on the deaths of national leaders. He wrote on the
death of Mahatma Gandhi. It is hard to imagine an Urdu poet writing with such passion about a leader from
different part of India today. But the liberation struggle had brought a burning sense of unity among Indians of
those times. Nationalism was only one theme of Iqbal's poetry. It equally drew inspiration from human
sensibilities, he worked for most of his life in India, and he recalled his ancestral land with passionate pride.
EARLY URDU POETRY AND GLIMPSES OF PATRIOTIC TENDENCIES:
The beautiful and delightful expression of human emotions and feelings particularly related to love and various
other aesthetic inclinations was considered real poetry in the early period, which was presented with economy
of words, felicity and subtlety of expression. Sentiments and feelings of attachments were then highly localized.
This is the reason that the concepts of nation and nation-state were not developed during this period in the truest
sense of the word remarkable during the 19th and 20
th centuries. Regionalism and Tribal loyalties were
considered patriotism and it also included racial and kinship allegiance. This situation prevailed throughout the
world more deeply in the Arab world. Thus we see deep patriotic or loyalist sentiments in the very early epic
poems of the Arabic poetry, which were recited by warriors in the battlefield. The same trend is noticed in the
Persian poetry also where Iran and its beautiful nature is presented and praised fabulously. Everything beautiful
belonging to Iran including its weather is mentioned and praised minutely.
Similar sentiments were reverberated in Urdu poetry also since its very beginning because the early Urdu
poets were masters of Persian language and literature as well. However, if we have to find and see the real
and first signs of patriotism in somewhat modern sense, we have to look at the declining phases of the
Mughal rule in India. The British had gradually started to open up their ulterior designs and Indian
intellectuals had begun to realize that they would have to even sacrifice their lives in order to reclaim their
territorial and political independence.
In the Indian sub-continent the tradition of patriotism, which is the subject of discussion in this paper originated
when an aggressive nation began its occupation of India. A peace loving nation and its citizens were seen
protesting this aggression and illegitimate occupation. But this hostile nation succeeded in their imperialistic
designs all over India because of their modern techniques of warfare and tyrannical aggression. When they
became successful in 1857 to bring Lucknow and Delhi under their control, the Indians slipped into shock for a
period. But poetry took the lead to cure the Indian community of this shock and began the fight against the
aggressors in an organized manner.

SCHOLARS WORLD-INTERNATIONAL REFEREED MULTIDISCIPLINARY JOURNAL OF CONTEMPORARY RESEARCH EISSN 2320-3145, ISSN 2319-5789
www.scholarsworld.net [email protected] Volume.1, Issue.2, July 2013 [68]
Shahar Ashoob'- a form of Urdu poetry to mourn the destruction of a city- was in the forefront to revive the
patriotic emotion during this period and this kind of poetry penned by pioneering poets like Bahishti,
Shakirnaji, Sauda, Mir and Nazir after the massacre and destruction in Delhi in 1857 could be placed in such
category. Urdu poetry critics have defined 'Shahar Ashoob' and said that real 'sharAshub' is one, which reflects
conflicts driven by politics and its effects and results. (Siddiqui; 1987, Page no. 113)
The imprints of patriotism, which could be traced in ‘Shaher Ashoobs’, were of incipient nature and its more
pronounced expression could be seen in later poetry. However, it should be conceded that Urdu poetry took a
while to adopt patriotism in its pronounced and complete form till the poetry of Allama Iqbal. Patriotic
sentiments first began to emerge in Urdu poetry and among Muslims because the Britishers snatched power
form Muslims and also targeted them to ensconce their hold.
The Muslims took time to come out of their shock but when they emerged out from this lull, they had with
themselves a clearly defined ideology of patriotism. They gathered strength form the Koran and Prophet's sayings to
fight the occupation and suppression of the Englishmen. Iqbal is a shinning example of this awakening.
Generally people consider Iqbal pitted against the notion of nationalism and they are right to this extent. Iqbal
considered national, communal and racial chauvinism as dangerous and believed that if these biases acquire the
intensity of patriotism they become highly destructive. The prejudice of considering oneself higher than the
entire world and treat others with contempt are one such example. Iqbal developed his version of patriotism
after hard research and advanced his thought in the light of teaching of Koran and Hadith.
In order to understand the concept of patriotism in Urdu poetry we should refer here to the views of Abul
Kalam Azad, he says:
"I am a Muslim and I do for believe what my Sharia says. Koran says that as selection between
matter and forms is natural and the law preserves the real and actual matter, likewise this law
also works with regard to beliefs and actions. The ultimate victory is of the action, which is
based on truth and reality, and it deserves to be preserved. Therefore, whenever there is fight
between Justice and Injustice, it is ultimately justice, which emerges victorious. Only beneficial
things will be preserved on earth and the harmful will be eliminated. For this reason the Koran
names the right as truth which is eternal and the evil and false are temporary which are bound
to be eliminated." (Azad, 1968 page no. 144, 145,)
In this regard only Maulana talks about rebellion and patriotism and says that:
‘I have been charged with sedition. But let me understand the meaning of rebellion. Is rebellion
the name of freedom, which has not been achieved yet? If it is so then I plead guilty but let me
remind that it is also called patriotism when it becomes victorious. Till yesterday the armed
leaders of Ireland were rebels but today what titles will the Great Britain bestow on leaders like
Devilliers and Graefth. Parnell of this Ireland had once said, "Our work is always first rebellion
and then the holy war of patriotism.’ (Azad, 1968, page no. 144, 145,)
This is the view of patriotism, which ran in the veins of Urdu poetry, and Iqbal developed his patriotic and
nationalistic poetry around this concept. The Urdu poetry has been taken granted to be exponent of love themes.
This is true to some extent but it is not entirely true. Urdu poetry has been sensitive to prevailing conditions in
every period. The realities of life and views related to it have always been dealt with in Urdu poetry. Outwardly
Urdu poetry does not seem to deal much about socio-political issues but t is not true. Urdu poetry has not only
taken up these issues and espoused them. But these issues have not been presented distinctly. They have been
treated in similes and symbols in every period, and those who appreciate Urdu poetry well, have no problem in
identifying those issues covered in allusions.
Let me quote some of these examples here:
Nazim-e-mulk so rahe hain haey
(Oh! the rulers of nation have gone to sleep)
Duniya ka nezam ho chukka ab (Mushafi)
(Who will now govern the world?)
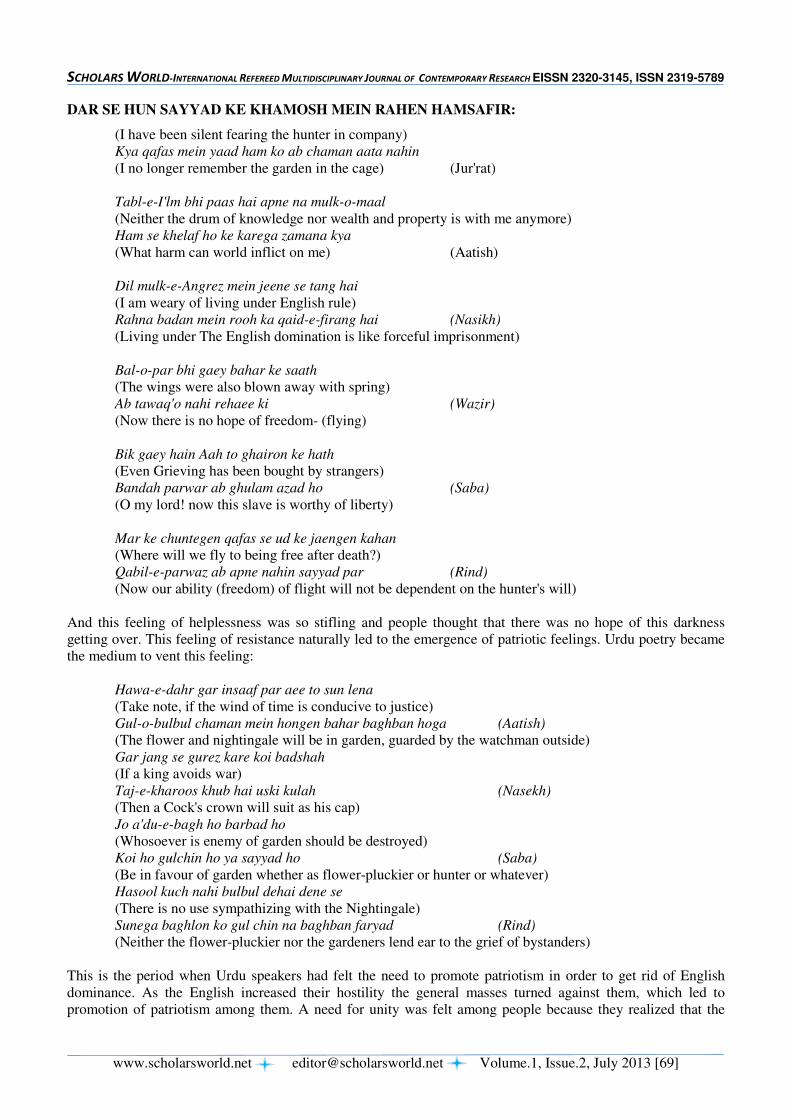
SCHOLARS WORLD-INTERNATIONAL REFEREED MULTIDISCIPLINARY JOURNAL OF CONTEMPORARY RESEARCH EISSN 2320-3145, ISSN 2319-5789
www.scholarsworld.net [email protected] Volume.1, Issue.2, July 2013 [69]
DAR SE HUN SAYYAD KE KHAMOSH MEIN RAHEN HAMSAFIR:
(I have been silent fearing the hunter in company)
Kya qafas mein yaad ham ko ab chaman aata nahin
(I no longer remember the garden in the cage) (Jur'rat)
Tabl-e-I'lm bhi paas hai apne na mulk-o-maal
(Neither the drum of knowledge nor wealth and property is with me anymore)
Ham se khelaf ho ke karega zamana kya
(What harm can world inflict on me) (Aatish)
Dil mulk-e-Angrez mein jeene se tang hai
(I am weary of living under English rule)
Rahna badan mein rooh ka qaid-e-firang hai (Nasikh)
(Living under The English domination is like forceful imprisonment)
Bal-o-par bhi gaey bahar ke saath
(The wings were also blown away with spring)
Ab tawaq'o nahi rehaee ki (Wazir)
(Now there is no hope of freedom- (flying)
Bik gaey hain Aah to ghairon ke hath
(Even Grieving has been bought by strangers)
Bandah parwar ab ghulam azad ho (Saba)
(O my lord! now this slave is worthy of liberty)
Mar ke chuntegen qafas se ud ke jaengen kahan
(Where will we fly to being free after death?)
Qabil-e-parwaz ab apne nahin sayyad par (Rind)
(Now our ability (freedom) of flight will not be dependent on the hunter's will)
And this feeling of helplessness was so stifling and people thought that there was no hope of this darkness
getting over. This feeling of resistance naturally led to the emergence of patriotic feelings. Urdu poetry became
the medium to vent this feeling:
Hawa-e-dahr gar insaaf par aee to sun lena
(Take note, if the wind of time is conducive to justice)
Gul-o-bulbul chaman mein hongen bahar baghban hoga (Aatish)
(The flower and nightingale will be in garden, guarded by the watchman outside)
Gar jang se gurez kare koi badshah
(If a king avoids war)
Taj-e-kharoos khub hai uski kulah (Nasekh)
(Then a Cock's crown will suit as his cap)
Jo a'du-e-bagh ho barbad ho
(Whosoever is enemy of garden should be destroyed)
Koi ho gulchin ho ya sayyad ho (Saba)
(Be in favour of garden whether as flower-pluckier or hunter or whatever)
Hasool kuch nahi bulbul dehai dene se
(There is no use sympathizing with the Nightingale)
Sunega baghlon ko gul chin na baghban faryad (Rind)
(Neither the flower-pluckier nor the gardeners lend ear to the grief of bystanders)
This is the period when Urdu speakers had felt the need to promote patriotism in order to get rid of English
dominance. As the English increased their hostility the general masses turned against them, which led to
promotion of patriotism among them. A need for unity was felt among people because they realized that the
SCHOLARS WORLD-INTERNATIONAL REFEREED MULTIDISCIPLINARY JOURNAL OF CONTEMPORARY RESEARCH EISSN 2320-3145, ISSN 2319-5789
www.scholarsworld.net [email protected] Volume.1, Issue.2, July 2013 [70]
English were succeeding in their designs by sowing division among Indians and destroying the amity and
brotherhood between communities. The emotion of patriotism, which was being promoted, needed the unity
among Hindus and Muslims desperately and none other than the first great Urdu poet Mir emphasized this
point. He says:
Wajh-e-begangi nahi ma'loom
(I fail to comprehend the reason for this unfamiliarity)
Tum jahan ke ho wahan ke ham bhi hain (Mir Taqi Mir)
(I too hail from the same place as you do)
And later on when Urdu poetry attempted to turn this unfamiliarity into harmonization then Saba Akbarabadi
says:
Kufr-o-Islam ke jhagre ko chuka do sahib
(Your sir, let us bury this quarrels of Islam and kufr)
Jang aapas mein Karen sheikh-o-brahman kab tak
(How long will the Sheikh and Brahman fight)
The tradition of this patriotism in Urdu poetry is quite long. I have just indicated only few examples of this in
the above lines.
TRADITIONS OF PATRIOTISM IN ALLAMA IQBAL’S POETRY:
As far as Iqbal is concerned, his poetry itself began with the emotional theme of patriotism and the
environment, which Iqbal lived in, was immersed in a specific form of patriotism. The Urdu poetry was
warming up to discard its desolate themes. The Ghazal was being disapproved of because of narrowed space.
Above all, a poet like Ghalib had taken the ghazal to such a zenith that no aspect of ghazal was hardly left to be
improved upon. In this situation Maulan Muhammad Husain Azad and Altaf Husain Hali, under the influence
of Sir Syed Ahmad's prose movement, set out to free the Urdu poetry from the clutches of ghazal and dedicated
themselves to popularize poems in Urdu poetry again. Hali rendered distinguished service in this regard, which
was vehemently carried forward by Allama Iqbal and people were taken by surprise. Iqbal was writing poetry
with a high ideal. He had a deep understanding of world politics and was well acquainted with the philosophies
of all religions. He had penetrative knowledge of the English imperialism as well. He had good appreciation of
the past, was striving to make the present action-oriented and was laying down grounds for a bright future.
Iqbal wrote poems like 'Himalaya' to awaken his countrymen to the fact that their past was so bright and tried to
instigate their patriotic tendencies. He always tried to free the Indian masses form their sense of inferiority. The
kind of patriotism Iqbal tried to awaken was so successful that it turned the Independence movement into Jehad
for Indian Muslims and they joined the freedom struggle in hoards. Iqbal's poetry proved very crucial for the
international integration of Muslims and Hindu-Muslim unity in India. When Iqbal emerged on the horizon of
Urdu poetry, the literary atmosphere was quite bright. Literary luminaries like Hali, Shibli and Nazir Ahmad
were alive but Iqbal fascinated people with his individualistic style.
Iqbal was an epoch in himself and to evaluate his views and beliefs cursorily would be an injustice to him and
his period. Prof. Jamil Ahmad Anjum says about Iqbal:
‘Nobody can deny that Iqbal brought revolution in Urdu poetry by his modern thought and style
of expression. Since very beginning his style of poetry became so popular that his contemporaries
penned poems in imitation of his style. He is the founder of a new era. The aspect of Iqbal's
poetry, which impacted the Urdu poetry most, was his revolutionary poetry. The revolutionary
thought of Iqbal was a natural outcome of the social upheavals and the humanity caught in the
tentacles of capitalism. The efforts of Iqbal led to emergence of new trend in modern Urdu
poetry. The theme of Iqbal like 'Fazilat-e-Adam' (The superiority of human beings) is also found
distinctively in the great poet of this period Josh and later on in the poetry of Ahmad Nadim
Qasemi. Iqbal did not only influence his contemporary poets but his later generations were also
compelled to adopt his thought and style.’ (Prof. Anjum, 2007, P. 18).
The revolutionary instinct found in the Iqbal's poetry was really a great change in the Urdu poetry. It
strengthened the revolutionary struggles in the country. Iqbal did not use the language of philosophy in his
SCHOLARS WORLD-INTERNATIONAL REFEREED MULTIDISCIPLINARY JOURNAL OF CONTEMPORARY RESEARCH EISSN 2320-3145, ISSN 2319-5789
www.scholarsworld.net [email protected] Volume.1, Issue.2, July 2013 [71]
poetry but, even today, his verses solve problems of philosophy, which are considered insurmountable. And this
is because of Iqbal's vast studies:
‘The intellectual and philosophical sources of Iqbal ranged from Koran to a lot of eastern and
western philosophers. One of the spiritual guides of Iqbal was Maulana Rum whose poetic
secrets are well known to the world. His Mathnavi, apart from being a collection of poetry and
wisdom, is also a source of religious secrets and knowledge of Koran. Iqbal got acquaintance
with Turks and Turkish civilization and character in the very beginning. This fact cannot be
refuted that Kamal Ataturk played key role in the political success of the Turks. By writing the
poem 'An Address to Mustafa Kamal Pasha' Iqbal expressed his emotional solidarity to the
Turks. This emotional and sentimental solidarity of Iqbal towards Ataturk and the Turks
reflects fully his Islamic camaraderie.’ (Ahsan, April 2007, P. 30-33).
The type of patriotism, which Iqbal promoted in light of the teachings of Koran led to confidence building
among Muslims and this notion was strengthened that Islam does not create any hindrance in the way of unity
among different communities. In fact, the knowledge of Koran provides strength to humanism and faith. It was
Iqbal who called the English and their imperialism a deadly poison and said:
Na samjho ge to mit jaoge aey Hindustan walo
(O! Indians awaken! Or you will perish)
Tumahri dastan tak bhi na hogi dastano mein
(And there will no account of yours left in history)
Dr. Muhammad Iqbal (1876-1938) was one of the greatest poets of modern India. He deeply influenced the
philosophical and religious thoughts of new-generation Indians. Like Swami Vivekananda, Iqbal also
emphasized the need for continuous change and constant action. He condemned being in silent inertia and
recommended a vibrant and active worldview, which could change the world. He was basically a humanist. He
declared human action as a good and positive quality. He was of the opinion that man should neither surrender
to the nature nor to any powerful authority on earth. He should try to conquer these forces constantly. He
considered any kind of compromise the biggest sin. He always condemned sticking to traditions and customs.
Perhaps because he was a votary of constant action and change, he later supported the partition movement of
Muslims despite his initial patriotism towards India.
In the beginning of his poetic career Iqbal wrote poems like 'Himalaya', 'Bacche ki dua'(the prayer of a Child),
'Sada-e-Dard'(The echo of Pain), 'Tasvir-e-Dard' (The Imagery of Pain), 'Tarana-e-Hindi' (The Indian Song),
'Hindustani Bachon ka qaumi geet' (The national song of Indian children), and 'Naya Shewala' (The New
Temple) etc. in which he taught patriotism in very effective and affable way. Prior to Iqbal Poets like Hali and
Azad wrote poems on patriotism but their concept of patriotism was not as reinforced as in Iqbal's poems. Iqbal
was the first Urdu poet to present the concept of patriotism in Urdu poetry in its pure social context. The first
poem of his first collection of poetry was 'Himalalya' in which he has put Himalaya on a higher pedestal than
the mountain of 'Sina' (where the Moses was granted just a glimpse of God and fainted) because of patriotism.
He says:
Aey Himalaya aey fasil kishwar-e-hindustan
Chumta hai teri peshani ko jhuk kar aasman
(O! Himalaya O! The wall of India, The sky pays tribute (kissing you forehead) bending towards your end)
Tujh mein kuch paida nahi derina rozi ke nishan
Tu jawan hai gardish sham-o-sahr ke darmeyan
(There is no sign of antiquity visible in you; you are still young despite the passage of time)
Ek jalwah tha kalim-e-tur-e-sina ke liye
Tu tajalli hai sarapa chashm-e-bina ke liye
(The mountain of Tur-e-Sina was just a reflection for Moses; but you the Himalaya are a manifestation
for every healthy eye)
SCHOLARS WORLD-INTERNATIONAL REFEREED MULTIDISCIPLINARY JOURNAL OF CONTEMPORARY RESEARCH EISSN 2320-3145, ISSN 2319-5789
www.scholarsworld.net [email protected] Volume.1, Issue.2, July 2013 [72]
Imtehan didah-e-zahir mein kohistan hai tu
Pasban apna hai tu diwar-e-hindustan hai tu
(Looking simply at you, you appear just a mountain; but in reality you are a protector, the wall of India)
Matla'-e-awwal falak jiska ho who diwan hai tu
Su-e-khalwatgah-e-dil damankash-e-insan hai tu
(You are the first structure under the sky to receive the sun rays; you are shelter of heart and refuge of man)
Barf ne bandhi hai dastar-e-fazilat tere sar
Khandahzan hai jo kulah-e-mehr-e-a'lam tab par
(Snow has tied the turban of honour on your head; you are the shining cap of the world-illuminating sun)
Teri umr rafta ki ek aan hai a'hd-e-kuhan
Wadion mein hai teri kali ghatain khemazan
(The old age is glory of you past life; your black clouds are roaming in the valleys)
Chotiyan teri suraiya se hain sargarm-e-sukhn
Tu zameen par aur pahnaey falak tera watan
(Your peaks are in conversation with the stars; you are on earth but the skies are your home)
Chashma-e-daman tera aina-e-sayal hai
Daman-e-mauj-e-hawa jiske liye rumal hai
(The springs of your foothills are the flowing mirrors; the waves of winds seek refuge in your valleys)
Abr ke hathon mein rahwar-e-hawa ke wastey
Tazyana de diya barq-e-sar-e-kohisar ne
(Your peaks have given the clouds fierce lightening to pave the way for winds)
Aey himala koi bazigah hai tu bhi jise
Dast-e-qudrat ne banaya hai a'nasir ke liye
(O! Himalaya you are also a playground; which has been created by nature for elements)
Aati hai nadi faraz-e-kuh se gati hui
Kausar-o-tasnim ki maujon ko sharmati hui
(The river flows down singing from atop the mountain; putting the waves of breezes to shame)
Lail-e-shab kholti hai aa ke jab zulf-e-rasa
Daman-e-dil khichtihai aabsharon ki sada
(When the night unfolds its grown-up locks of hair; the heart pulls the sounds of the waterfalls)
Woh khamoshi sham ki jis par takallum ho feda
Woh darakhton par tafakkur ka saman chhaya hua
(The chants sacrifice themselves for the silence of the evening; and all trees get immersed in thoughts)
Aey himala! Dastan us waqt ki koi suna
Maskan-e-aabay-e-insan jab bana daman tera
(O! Himalaya tell me a story of the time; when your valleys were inhabited by humans)
Kuchh bata us sidhi sadi zindagi ka majra
Dagh jis par ghaza-e-rang-e-takalluf
(Tell something about that simple and straight life; on which there was no blot of artificiality and roughness)
Ha dekha de aey tasawwur! Phir who subh-o-sham tu
Daur phichhe ki taraf aey gardish-e-ayyam tu
(O imagination! show us that morning and evening; run backwards in the past O time!)
SCHOLARS WORLD-INTERNATIONAL REFEREED MULTIDISCIPLINARY JOURNAL OF CONTEMPORARY RESEARCH EISSN 2320-3145, ISSN 2319-5789
www.scholarsworld.net [email protected] Volume.1, Issue.2, July 2013 [73]
This is accepted by all that Iqbal commenced a new era in Urdu poetry and there is no poet today who is left
untouched by his influence with regards to his style of expression. This is another matter that as very few could
achieve the style of Mir; only a handful of poets could also imitate the style of Iqbal successfully. The poet
addresses the Himalaya and says that the mountain is like citadel and city fortress for India and it is so high that
even the sky bends down to pay its tribute to it. The mountain exists from the creation of this world but it is still
young. There is no sign of weakness in it. Only Moses could see manifestation of God on the mountain of 'Tur'
but the Himalaya is a complete reflection of God for eyes of the wise. In other words the Himalaya is witness to
the absolute power of God. You are just a mountain to the naked eye but in reality you (the Himalaya), have
been appointed the guard of India by God. The peaks of Himalaya are always covered with snows, which are in
fact the turban of hounour.
Iqbal's poem 'The prayer of a child' which is still sung by kids in primary schools is a patriotic poem. In this
poem Iqbal has attempted to mould children's thinking towards nation building:
Lab pe aati hai dua ban ke tamanna meri
Zindagi shama' ki surat ho khudaya meri
(My wish comes to my lips in the prayer; that O God! my life should be like a candle)
Dur duniya ka mere dam se andhera ho jaey
Har jagah mere chamakne se ujala ho jaey
(The darkness of this world be undone by me; every place is illuminated by my sparkle)
Ho mere dam se yunhi mere watan ki zinat
Jis tarah phul se hoti hai chaman ki zinat
(May I be the reason for the shining of my nation; like the flower makes the garden beautiful?)
Zindagi ho meri parvane ki surat ya rab
I'lm ki shama' se ho mujh ko muhabbat ya rab
(May my life be like a moth O God! May I be in love with the candle of knowledge!)
Ho mera kam ghribon ki hemayat karna
Dardmandon se zaeefonse muhabbat karna
(My aim should be to support the downtrodden; and to be compassionate towards the weak and the oppressed)
Mere Allah burai se bachana mujh ko
Nek jo rah ho us rah pe chalana mujh ko
(O my God! Save me from wrong-doing; show me the right path)
The biggest pain which troubled Iqbal was that the atmosphere of unity and harmony had vitiated in India and
its citizens were becoming strangers to each other. Iqbal says in his poem "The Voice of Pain":
Jal raha hun kal nahin padti kisi pahlu mujhe
Han dubo de aey muhit aab-e-ganga mein mujhe
(I am burning and do not find respite anyhow; yes! O fellows! Immerse me in the water of the Ganga)
Sarzameen apni qayamat ki nafaq angez hai
Wasl kaisa yan to ek qaribferaq amez hai
(Our land is filled with disaffection like it will happen on the Judgment's Day; how can people get together
when there is discord among the acquaintances)
Badle yakrangi ke ye na aashnaee hai ghazab
Ek hi khirman ke danon mein judaee ghazab
(How strange is the changed colour of this unity into otherness; the separation in the seeds of the same field is
very strange)
Jis ke phulon mein ukhwat ki hawa aaee nahi
Us chaman mein koi lutf-e-naghma pairaee nahi
(The flower which is not touched by the air of fraternity; that garden is devoid of any melodious elegance)
SCHOLARS WORLD-INTERNATIONAL REFEREED MULTIDISCIPLINARY JOURNAL OF CONTEMPORARY RESEARCH EISSN 2320-3145, ISSN 2319-5789
www.scholarsworld.net [email protected] Volume.1, Issue.2, July 2013 [74]
Kab zaban kholi hamari lazzat-e-guftar ne
Phuk dala jab chaman ko aatish paikar ne
(When did my pleasing speech open it tongue; when the fire of battle destroyed the garden)
This poem of Iqbal vividly portrays the events of Indian history between 1905 and 1945. Iqbal considered
Hindu and Muslims the seeds of the same harvest. He borrowed this concept from Sir Syed Ahmad Khan who
had said in a speech that India is like a bride and Hindu-Muslims are its two eyes and the beauty of the bride
depends on the safety of its both eyes and if it loses its one eye it will look ugly.
Iqbal severely felt the pain of India's enslavement and this feeling is amply depicted in his poem ' the Imagery
of Pain' in which he has expressed his sentiments vehemently and effectively. In this poem he has expressed the
weaknesses of his countrymen, which are an impediment in the national integration of India and its freedom and
progress. Iqbal understood well that communalism and disunity among Hindus and Muslims is on the rise,
which will one day destroy the concept of nationalism and Indian national integration. He says:
Nahi minat kash tab-e-shanidan dastan meri
Khamoshi guftagu hai bezabani hai zaban meri
(My story is not worth listening; silence is my talking and my language)
Ye dastur-e-zaban bandi hai kaisa teri mahfil mein
Yahan toa baat karne ki tarasti hai zaban meri
(How is this prohibitions on talking in your party; my tongue is dying to speak out here)
Ujada hai tamiz-e-millat-o-aaeen ne qaumon ko
Mere ahle watan ke dil mein kuch fikr-e-watan bhi hai
(The consideration of the nation and laws has destroyed communities; have my countrymen some consideration
for their nation in their heart)
Sakoot amooz tul-e-dastan-e-dard hai warna
Zaban bhi hai hamare munh mein aur tab-e-sukhan bhi hai
(The narration of the story of pain counsels silence; otherwise we have tongue in our mouth and urge to speak out too)
This is the time when Iqbal was under the influence of nationalism and patriotism. In this poem Iqbal emerges
as a nationalist and exhibits the same patriotic fervor of his poems like Naya Shewala, Tarana-e-Hind and
Himalaya. He has openly lamented the divisive tendencies and behavior of his countrymen and warned them
that if they do not mend their ways and get united they will be lost in history. He laments the dark future of his
country and this poem reflects the wounded soul of a true patriotic citizen. He laments the deteriorating
condition of his country in these words:
Rulata hai tera nazarah aey Hindustan mujh ko
Ke I'brat khez hai tera afsana sab fasano me
(Your condition makes me despondent O Hindustan! That your story is the most didactic of all stories)
This stanza is the best specimen of Iqbal's patriotic sentiments. Another famous poem of Iqbal is "Tarana-e-
Hind" which presents his patriotic sentiments more emphatically:
Sare Jahan se achcha Hindustan hamara
Ham bulbulen hai is ki ye gulsitan hamara
(Our Hindustan is the best in this world; we are the nightingales of our garden-India)
Ghurbat mein hon agar ham rahta hai dil watan mein
Samjho wahin hame bhi dil ho jahan hamara
(Even if we are abroad our heart lies in our nation; consider us being there where our heart resides)
Parbat woh sab se uncha hamsaya aasman ka
Woh santari hamara woh pasban hamara
(Here is the highest mountain, the companion of the sky; it is our guard, it is our watchman)

SCHOLARS WORLD-INTERNATIONAL REFEREED MULTIDISCIPLINARY JOURNAL OF CONTEMPORARY RESEARCH EISSN 2320-3145, ISSN 2319-5789
www.scholarsworld.net [email protected] Volume.1, Issue.2, July 2013 [75]
Godi mein khelti hai e ski hazar nadiya
Gulshan hai jin ke dam se rashk-e-jina hamara
(Thousands of rivers play in its lap; our garden is blooming because of it, the envy of Jennies')
Aey aab-erood-Ganga! Who din hain yaad tujhko
Utra tere kinare jab karwan hamara
(O! the water of Ganges! Do you remember that day; when our caravan descended on your banks)
Mazhab nahi sikhata aapas mein bair rakhna
Hindi hain ham, watan hai Hindustan hamara
(Religion does not teach discord among own fellows; we are Indians and Hindustan is our homeland)
Yunnan-o-Misr-o-Ruma sab mit gaye jahan se
Ab tak magar hai baqi nam-o-nishan hamara
(The Greeks, Egyptians and Romans all vanished from this world; but our footprint and name is still there)
Kuch baat hai ke hasti mit-ti nahi hamari
Sadion raha hai dushman daur-e-zaman hamara
(There is something, which does not destroy our existence; or the time has been our enemy for centuries)
Iqbal! Koi mahram apna nahi jahan mein
Ma'loom kya kisi ko dard-e-nehan hamara
(O Iqbal! There is no confidant of our own in this world; does any one know our hidden pain)
India is a country of many religions & cultures and Iqbal believed that this religious diversity gives colorfulness
to Indian civilization rather than disturbing its unity. He has expressed this view in his poem 'the national song
of children':
Chishti ne jis zameen par paigham-e- haq sunaya
Nanak ne jis chaman mein wahdat ka geet gaya
(The Chishti (Moinuddin Ajmeri) who gave the message of truth on this land; The Nanak who sang the song of
unity in this garden)
Tatarion ne jis ko apna watan banaya
Jis ne Hajazion se dasht-e-Arab charaya
(The Tatars who made this land their home; the Hajazis who left Arab for this land)
Mera watan wahi hai mera watan wahi hai
Yunanion ko jis ne hairan kar diya tha
(This is my country, this is my country; the country which had bewildered the Greeks)
Sara jahan ko jis ne I'lm-o-hunar diya tha
Mitti ko jis ki haq ne zar ka asar diya tha
(The country, which gave science and art to the entire world; the earth, which was given the effect of gold by God)
Turkon ka jis ne daman hiron se bhar diya tha
Mera watan wahi hai mera watan wahi hai
(The country, which had filled the Turks with, diamonds; this is my country, this is my country)
Tute the jo sitare Faras ki aasman se
Phir tab de ke jis ne chamkaye kahkashan se
(The stars which had broken away from the sky of Persia; this land again gave them light to shine in the galaxies)
Wahadat ki laey suni thi duniya ne jis makan se
Mir-e-Arab ko aaee thandi hawa jahan se
(The place from where the world had heard the rhyme of unity; the place from where the Amir of Arab had
received the cool breeze)
SCHOLARS WORLD-INTERNATIONAL REFEREED MULTIDISCIPLINARY JOURNAL OF CONTEMPORARY RESEARCH EISSN 2320-3145, ISSN 2319-5789
www.scholarsworld.net [email protected] Volume.1, Issue.2, July 2013 [76]
Mera watan wahi hai, mera watan wahi hai
Bande kalim jis ke parbat jahan ke sina
(That is my country that is my country; the country whose mountains are like Sina)
Janat ki zindagi hai jis ke feza mein jina
Mera watan wahi hai mera watan wahi hai
(Living life in the environment of this land is like living life in the heaven; that is my country that is my country)
The most zealous and powerful sentiment of Iqbal's patriotic poetry is unity and harmony. He firmly believed
that without harmony and unity our country couldn’t be freed from the chains of enslavement. His best and
beautiful poem on this subject is 'Naya Shewala'. Iqbal has employed a very enthusiastic, sincere and unique
mode of expression in this poem. In view of the Hindu-Muslim unity Iqbal has used Hindi words beautifully in
this poem. He says:
Sach kah dun aye Brahman gar tu bura na mane
(I will tell you the truth O! Brahman if you do not mind)
Tere sanamkadon ke but ho gaye purane
(The idols of your temple have turned old)
Apnon se bair rakhna tu ne buton se sikha
(The idols have thought you nursing enmity towards own people)
Jang-o-jadal sikhaye waiz ko bhi khuda ne
(The gods have even thought the preacher fighting)
Pathron ki muraton mein samjha hai tu khuda hai
(You have seen God in the idols of stones)
Khak-e-watan ka mujh ko har zarah devta hai
(But every particle of our nation’s land is a God for me)
Aa ghairaton ke parde ek bar phir mita dein
(Come on! Let us once again lift the veil of unfamiliarity)
Bichhron ko phir mila dein naksh-e-doee mita dein
(Let us bring the separated together and discard the notion of otherness)
Duniya ke tirathon mein uncha ho apna tirath
(May our temple be the tallest of all holy shrines of the world?)
Daman-e-Aasman se uska kalas mila dein
(Let us take its pinnacle up to the skies)
Har subh uth ke gain mantar woh mithe mithe
(Let us wake up and sing those sweet chants (mantras) every morning)
Sare pujarion ko mai meit ki pela dein
(Let us make all priests drink the wine of love and friendship)
Shakti bhi shanti bhi bhakton ke geet mein hai
(There is peace as well as power in the songs of the devotees)
Dharti ke basiyon ki mukti preet mein hai
(The salvation of the humans lies in love)
The relevance of this poem has elapsed for long time but from the viewpoint of poetry this poem is the best
example of patriotic poetry of Iqbal because its style of expression is very effective and attractive. The poet has
exhausted all his poetic abilities to stress the greatness of nation on peoples' minds. The idea of patriotism and
nationalism Chakbast has presented is political point of view. It does not contain the universality of Iqbal's idea.
Chakbast has limited himself. He does not see patriotism beyond political role. Iqbal transcends these
boundaries. Iqbal covers fundamental problems of life along with patriotism and nationalism and discussion of
these problems becomes the central theme of his poetry.
Iqbal and Chakbast gave place to nationalistic and patriotic ideas in Urdu poetry and created an environment of
dealing with its different aspects. They made discussion of patriotism all pervasive and this resulted in
collective focus on all political, social, economic and cultural problems of life. It will not be improper to say
that discussion of problems replaced emotional discourse on patriotism. The later also continued but most poets
also started dealing with life problems extensively. This happened around the First World War. This viewpoint

SCHOLARS WORLD-INTERNATIONAL REFEREED MULTIDISCIPLINARY JOURNAL OF CONTEMPORARY RESEARCH EISSN 2320-3145, ISSN 2319-5789
www.scholarsworld.net [email protected] Volume.1, Issue.2, July 2013 [77]
was essential at this juncture. Politics had entered all walks of life at this moment. The idea of independence
and freedom had occupied the mind of every individual. Opposition of the Englishmen was important for every
individual. This was a time of struggle and conflict. This period marks the transfer of politics from the
moderates to the extremist youth which gave fillip to the idea of freedom. The need for bringing a new political
and executive order was felt. This led to a plan of revolution to overthrow despotism and repressive order. A
revolution for eradicating poverty, deprivation and inequality is planned.
In the words of the famous critic of Urdu literature, Dr. Khushhal Zaidi, it can be said that Iqbal was a painful
chapter of literature and country. He had great respect for the greatness of the nation. He wanted transformation
of the prevalent condition of India with patriotism, humanism and national pride because of which India was
once known as the golden bird. This led Iqbal to write countless poems on patriotism and national pride. Iqbal
had full command on reformist and nationalistic poems. Iqbal is known as a versatile and expert poet, scholar,
researcher and writer of many languages and genres. His poetry is a meeting point of both classical and modern
poetry. Iqbal is the best nationalistic poet in Urdu but he never considered the ideas of nationalism and
patriotism above religion.
While delivering his presidential address to the Muslim Conference in 1922 Iqbal had said about the
nationalistic idea that although patriotism is a natural factor and it is a part of ethical values of humans but the
thing which is most important is the man's religion, culture and his national traditions. These are the things for
which man should live and die for. The land on which man lives and his soul is temporarily attached to is not
worthy of being considered above God and religion.
Iqbal has first dealt with philosophy and ideas of India and then the entire world without any religious bias. He
not only attained recognition and status at international level because of his nationalistic and patriotic poetry but
he also expanded the range of Urdu poetry. He began his poetry with Ghazal like other poets. But he later
adopted poem because of the bad conditions of his community and country. He wrote poems full of patriotic
sentiments. Iqbal began his poetry in an era of transformations. The entire Indian society was engulfed by
feelings of fear and defeatism. This could only be corrected when fellow countrymen were awakened from their
slumber of ignorance. In this regard our poets and writers also played a pivotal role along with national leaders.
For instance, Azad, Hali, Saroor and Chakbast wrote poems full of patriotic sentiments and national awakening.
But Iqbal's services in this regard are most prominent as he discarded old traditions in his creative endevours
and made patriotism and nationalistic sympathy fundamental basis of his poetry.
Having being entangled in the chains of enslavement for long time Indians had forgotten patriotism and the
meaning of freedom. In this condition the Urdu poets discharged not only poetic responsibilities but also
prophetic duties. Therefore, the people who had lost their courage and were happy in their slumber reinforced
by enslavement were awakened. The songs and poems with patriotic fervor shook them from their slumber.
Iqbal reminded Indians of their glorious past. He reminded them of the great warriors, Sufis, emperors of India
in the past and their valour, courage and humanity and taught them those values along with patriotism and
brotherhood. Iqbal penned down numerous nationalistic and patriotic poems. His poetry abounds in
nationalistic and patriotic sentiments with the aim of awakening fellow countrymen. He wrote many poems on
the theme of Hindu-Muslim unity as well as the glorious past of the nation and its leaders.
Iqbal also wrote patriotic poems for children to awaken them to nationalist sentiments from the beginning. In
these poems Iqbal mentions the blossoming leaves, flowers and fruits of the garden (India). He loved his
country, therefore, sometimes he praises its weather, and at times it rainy season and then he seems to be
overwhelmed by the waves of Ganges and Yamuna. In short he loved his country in its every bit and particle:
Pathron ki muraton mein samjha hai tu khuda hai
(You have seen God in the idols of stones)
Khak-e-watan ka mujh ko har zarah devta hai
(But every particle of our nation’s land is a God for me)
Iqbal loved his country deeply. His nation and its small and big things formed the core of his poetry. He did not
look beyond his country like other poets for selecting themes of poetry. He sang praise of trees, plants, flowers,
birds, rivers and mountains. He did not leave anything.
The Ghazals of Iqbal also propagates national consciousness and national integrity. His ghazals espouse
humanism and brotherhood. Apart from flowers and nightingales he takes up issues and problems of the nation

SCHOLARS WORLD-INTERNATIONAL REFEREED MULTIDISCIPLINARY JOURNAL OF CONTEMPORARY RESEARCH EISSN 2320-3145, ISSN 2319-5789
www.scholarsworld.net [email protected] Volume.1, Issue.2, July 2013 [78]
and country in his ghazals. The study of his ghazals shows that he brought out ghazal from romantic
atmosphere and infused it with realism.
CONCLUSION:
This brief account of patriotism in Urdu poetry indicates that Urdu poetry is not only about love and beauty.
The political, social and moral problems of life have also been dealt with in Urdu poetry. Urdu poetry has kept
pace with changing times and its problems. When India needed patriotism most during its struggle against
colonialism and foreign rule, Urdu poetry embraced it fully with open arms and espoused its cause with all
devotion. The greatness and loftiness, which is inherent in the tradition of patriotism, has put the Urdu poetry
on the same pedestal led by poets like Iqbal.
REFERANCES:
1. Abul ejaz siddiqui; kashaf-e-tanqidi-e-istalehat moqtadara qaumi zaban, islamabad, 1987.
2. Maulana abul kalam azad, "qaul-e-faisal" iteqad publishing house, delhi 1968.
3. Prof. Jamil ahmad anjum, iqbal ka asr urdu sha'ri par, mahnamah qaumi zaban, karanchi, april 2007.
4. prof. Mohsin ahsan, iqbal and turk, mahnamah qaumi zaban, karanchi, april 2007.
5. Hamari azadi, abulkalam azad, mutarjim md. Mojib, orient long man limited, 1776.
6. Roshni ke darechays. E. Husain, edit by jafar askari e. Academy, allah abad 1973.
7. Kulyate akbar allah abadi, fourth volum, first edition kitabistan karanchipakistan 1948
8. Tareekh azad hind fauj, hali publishing house kitab ghar delhi, 1990.
9. Inqalab 1857, p c joshi, n.b.t.i delhi 1992.
10. Majmuwa kalam jauher edited tajuddin, masjid fatehpuri, delhi 1918.
11. Tareekh tahreeke azadi hind, first part, traslated by adil abbasi taraqqi 1980.
12. Foghane delhi, tafazzul husain kokab, acadmy punjab lahore 1952.
13. Khake dil janisar akhtar, lahoti print aids, delhi 1973.
14. Urdu mein taraqqi pasand adbi tahreekeducational book house, aligarh
15. Nai duniyan ko salam aur jamhoor, alisardar jafri,maktaba jamia limited delhi, 1972.
16. U p ke musalman aur mahaze azadi, first part,qazi publisher delhi, 2003.
17. Urdu shairi ka siyasi wo samaji pase manzar g. H. Zulfiqar, matbae punjab lahore, 1977.
18. Shaher aashob ek tazziya, amir arfi, saqi book depot, delhi
19. Shaher aashob, maktaba jamia limited delhi, 1986.
20. Hindustan ki jiddojehd azadi mein urdu shairi ka hissa, nusrat publishr, lucknow, 1991.
21. Sirate md. Ali, rais ahmad jafri nadvi, maktaba jamia millia islamia first edit, 1932.
22. Nazmon ka intekhab, rahe masoom raza, karimi press allahabad, 1960.
23. Azadi ke taranay, rajesh kumar, national archaives new delhi 1976.
24. Zabt shuda nazmein, edit k. Anjum & m. Husain, majlise ali j.zaidi, delhi, 1975.
25. Hamara hindustan, janisar akhtar, bombay 1938.
JOURNALS:
1. Aaj kal monthly, delhi, january 1957.
2. Aaj kal monthly, delhi, azadi number august 1957.
3. Urdu adab, shibli number, anjuman taraqqi urdu hind new delhi 1957.
4. Academy lucknow dou mahe, yadgar hasrat number uttar pardesh, 1960.
5. Afkar josh number, maktaba afkar karachhi, october-november, 1961.
6. Asia she mahe, meerut april, may, june 1961.
7. Kahtoon aligarh, april 1913.
8. Frogh urdu mah nama lucknow jang azadi number, 1957.
9. Kari, amrisar, may 1930.
10. Naya adab aur kalim, haqa adab lucknow, november 1940.
11. Humayon mahnama lahor, feruary 1938.
12. Yadgar hasrat number do mahe, uttar pardesh urdu academy lucknow 1918.
----
SCHOLARS WORLD-INTERNATIONAL REFEREED MULTIDISCIPLINARY JOURNAL OF CONTEMPORARY RESEARCH EISSN 2320-3145, ISSN 2319-5789
www.scholarsworld.net [email protected] Volume.1, Issue.2, July 2013 [79]
AN ANALYTICAL STUDY ON PERFORMANCE
MEASUREMENT SYSTEM OF SUPPLY CHAIN
MANAGEMENT IN HLL LIFE CARE LTD, TRIVANDRUM
Dr. S. RAJA MOHAN,
Professor,
Alagappa Institute of Management, Alagappa
University, Karaikudi, Tamilnadu-(India)
E.V.RIGIN,
Associate Professor,
Department of Management Studies, VHNSN
College, Virudhunagar, Tamilnadu, (India)
ABSTRACT
Customer satisfaction and service is perceived as more enduring than cost savings. The managers
recognize technology, information, and measurement systems as major barriers for successful
supply chain collaboration. However, the people’s issues such as culture, trust, aversion to
change, and willingness to collaborate are more intractable. People are the key bridge to
successful collaborative innovation and should therefore not be overlooked as companies invest
in supply chain enablers such as technology, information, and measurement systems. Due to the
information technology and communication the benefits of SCM have increased the turnover,
revenue, and cost reduction. In HLL Life care the executives are rightly aware of the benefits,
problems and the impact of SCM. In any organization SCM practices have number of benefits,
problems and impact factors. This paper highlights the performance measurement system of
Supply Chain Management practices in HLL Life care Ltd, Trivandrum.
Keywords: Supply chain management, Strategic management, Performance measurement
SCHOLARS WORLD-INTERNATIONAL REFEREED MULTIDISCIPLINARY JOURNAL OF CONTEMPORARY RESEARCH EISSN 2320-3145, ISSN 2319-5789
www.scholarsworld.net [email protected] Volume.1, Issue.2, July 2013 [80]
1. INTRODUCTION
Supply Chain Management (SCM) seeks to enhance competitive performance by closely integrating the internal
functions within a company with the external operations of suppliers and channel members. SCM practices can
offer tremendous value to company that relies on the smooth planning and execution of related operations to
achieve long-term profitability and maintain a solid competitive edge. Successful SCM requires cross-
functional integration within the firm and across the network of firms that comprise the supply chain. In every
organization the SCM practices the benefits, problems and impact factors influence the activities of SCM
practices. The association among the benefits, problems and impacts of SCM are important to identify the
effectiveness of SCM practices of the organisation. This chapter analyses the relationship between benefits and
impact of SCM and the relationship of cost management, customer service, quality, productivity and asset
management, factors influencing demograpic factors and impact of SCM and so on.
2. STATEMENT OF THE PROBLEM:
Health care industry is one of the worlds’ largest and fastest growing industries. It comprises various sectors such
as medical equipment, pharmaceutical, healthcare services and so on. The health care supply chain involves the
flow of many different product types and the participation of various stakeholders. The main purpose of the health
care supply chain is to deliver products at the right time in order to fulfill the needs of customers.
The concept of SCM was introduced in the year 1980. It expresses the need to integrate the key business processes,
from end user through original suppliers. SCM focuses on planning, forecasting, purchasing, storing, moving,
product assembly and keeping track of a product. SCM is an essential element of operational efficiency. It plays a
role in cultural evolution and helps to improve the quality of life. It creates jobs, decreases pollution and increases
the standard of living. In health care industry, SCM practices increases the efficiency in all the functional activates of
production and operations management, which use to produce quality product at right time.
SCM supports to maintain good relationship with vendors and suppliers. Seamless flow of material and information
is the key to supply chain. This helps in reducing the inventory , leads to low cost and increases the flexibility,
improving price value offerings and so on. Information technology plays a vital role connected with SCM of HLL
Life care Ltd. Hence the present study has been under taken to identify the need of IT in SCM of HLL.
3. REVIEW OF LITERATURE:
Methvin and Annemarie Campbell (2011) in their conference preceding entitled “Healthcare provider SCM”
highlight the significance of SCM for healthcare providers and detail present and future considerations related
to key processes, technology and metrics. As per their note more providers recognize the strategic imperative
associated with progressive SCM, their envision significant growth of information, technology, credentials and
overall development of the field in line with other industries. They concluded that gained SC efficiencies
represent sizeable savings for the US healthcare system going forward.
Rana Basu, Mousumi Modak et al. (2011) in their research work entitled “Analyzing the Risk factors of SCM in
Indian manufacturing organizations” point out that the risk factors in SC in context to Indian manufacturing
organizations, all risks cannot be avoided. Risk mitigation planning provides an organization with a more
mature decision making process in facing unexpected losses being caused by unexpected events. Existence of
the supply chain can be seen in both service industries as well as in manufacturing industries and the
complexity variation occurs from industries to industries and from firm to firm. Beside other issues
organizations must consider the overall costs including cost of space, expenses related to doing
businesses outside the country. With this the socioeconomic, political and cultural dimensions can be
considered as important issues in order to manage the SC risks.
Nimawat Dheeraj and Namdev Vishal (2012) have suggested a few ideas in their research paper entitled “An
Overview of green SCM in India” and said that, cost and complexity are perceived as the biggest barriers
to implementing green SCM, which highlights the need for cost effective and easy to implement solutions.
Brand building is one of the top incentives for green SCM, highlighting the importance of public
perception of how companies operate. Recycling of raw materials and component parts are the top green
manufacturing and production focused initiatives adoption of green practices is highest in those areas of
the supply chain where there is a direct relation to cost savings and efficiency. Most of the Indian
manufacturing small and medium enterprises like cutting and hand tools and auto parts and spare parts
and industrial equipments and machinery manufacturer and various other products manufacturers are
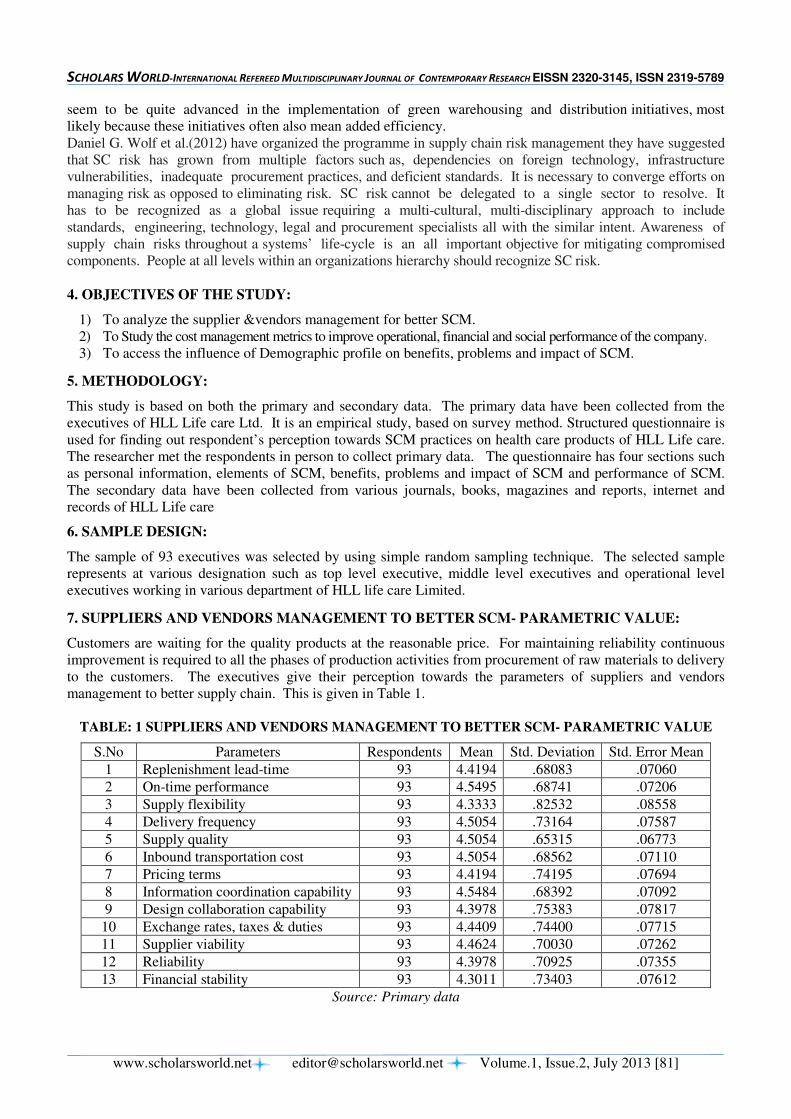
SCHOLARS WORLD-INTERNATIONAL REFEREED MULTIDISCIPLINARY JOURNAL OF CONTEMPORARY RESEARCH EISSN 2320-3145, ISSN 2319-5789
www.scholarsworld.net [email protected] Volume.1, Issue.2, July 2013 [81]
seem to be quite advanced in the implementation of green warehousing and distribution initiatives, most
likely because these initiatives often also mean added efficiency.
Daniel G. Wolf et al.(2012) have organized the programme in supply chain risk management they have suggested
that SC risk has grown from multiple factors such as, dependencies on foreign technology, infrastructure
vulnerabilities, inadequate procurement practices, and deficient standards. It is necessary to converge efforts on
managing risk as opposed to eliminating risk. SC risk cannot be delegated to a single sector to resolve. It
has to be recognized as a global issue requiring a multi-cultural, multi-disciplinary approach to include
standards, engineering, technology, legal and procurement specialists all with the similar intent. Awareness of
supply chain risks throughout a systems’ life-cycle is an all important objective for mitigating compromised
components. People at all levels within an organizations hierarchy should recognize SC risk.
4. OBJECTIVES OF THE STUDY:
1) To analyze the supplier &vendors management for better SCM.
2) To Study the cost management metrics to improve operational, financial and social performance of the company.
3) To access the influence of Demographic profile on benefits, problems and impact of SCM.
5. METHODOLOGY:
This study is based on both the primary and secondary data. The primary data have been collected from the
executives of HLL Life care Ltd. It is an empirical study, based on survey method. Structured questionnaire is
used for finding out respondent’s perception towards SCM practices on health care products of HLL Life care.
The researcher met the respondents in person to collect primary data. The questionnaire has four sections such
as personal information, elements of SCM, benefits, problems and impact of SCM and performance of SCM.
The secondary data have been collected from various journals, books, magazines and reports, internet and
records of HLL Life care
6. SAMPLE DESIGN:
The sample of 93 executives was selected by using simple random sampling technique. The selected sample
represents at various designation such as top level executive, middle level executives and operational level
executives working in various department of HLL life care Limited.
7. SUPPLIERS AND VENDORS MANAGEMENT TO BETTER SCM- PARAMETRIC VALUE:
Customers are waiting for the quality products at the reasonable price. For maintaining reliability continuous
improvement is required to all the phases of production activities from procurement of raw materials to delivery
to the customers. The executives give their perception towards the parameters of suppliers and vendors
management to better supply chain. This is given in Table 1.
TABLE: 1 SUPPLIERS AND VENDORS MANAGEMENT TO BETTER SCM- PARAMETRIC VALUE
S.No Parameters Respondents Mean Std. Deviation Std. Error Mean
1 Replenishment lead-time 93 4.4194 .68083 .07060
2 On-time performance 93 4.5495 .68741 .07206
3 Supply flexibility 93 4.3333 .82532 .08558
4 Delivery frequency 93 4.5054 .73164 .07587
5 Supply quality 93 4.5054 .65315 .06773
6 Inbound transportation cost 93 4.5054 .68562 .07110
7 Pricing terms 93 4.4194 .74195 .07694
8 Information coordination capability 93 4.5484 .68392 .07092
9 Design collaboration capability 93 4.3978 .75383 .07817
10 Exchange rates, taxes & duties 93 4.4409 .74400 .07715
11 Supplier viability 93 4.4624 .70030 .07262
12 Reliability 93 4.3978 .70925 .07355
13 Financial stability 93 4.3011 .73403 .07612
Source: Primary data
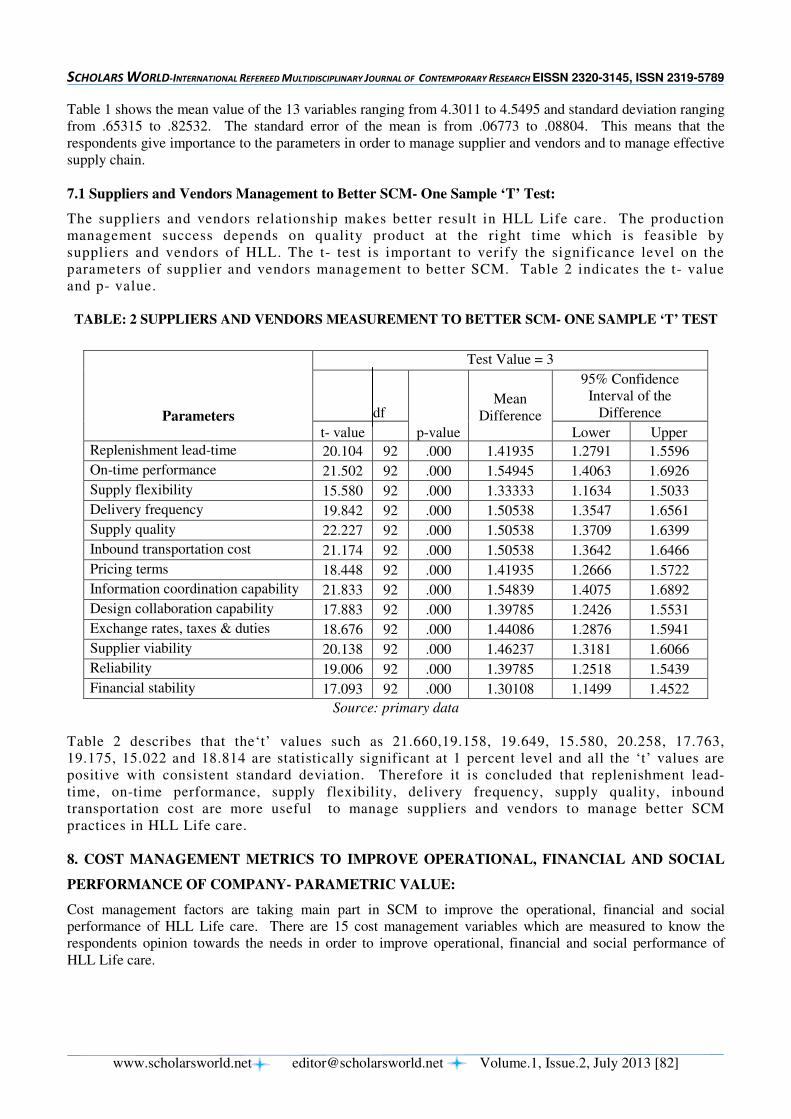
SCHOLARS WORLD-INTERNATIONAL REFEREED MULTIDISCIPLINARY JOURNAL OF CONTEMPORARY RESEARCH EISSN 2320-3145, ISSN 2319-5789
www.scholarsworld.net [email protected] Volume.1, Issue.2, July 2013 [82]
Table 1 shows the mean value of the 13 variables ranging from 4.3011 to 4.5495 and standard deviation ranging
from .65315 to .82532. The standard error of the mean is from .06773 to .08804. This means that the
respondents give importance to the parameters in order to manage supplier and vendors and to manage effective
supply chain.
7.1 Suppliers and Vendors Management to Better SCM- One Sample ‘T’ Test:
The suppliers and vendors relationship makes better result in HLL Life care. The production
management success depends on quality product at the right time which is feasible by
suppliers and vendors of HLL. The t- test is important to verify the significance level on the
parameters of supplier and vendors management to better SCM. Table 2 indicates the t- value
and p- value.
TABLE: 2 SUPPLIERS AND VENDORS MEASUREMENT TO BETTER SCM- ONE SAMPLE ‘T’ TEST
Parameters
Test Value = 3
df
p-value
Mean
Difference
95% Confidence
Interval of the
Difference
t- value Lower Upper
Replenishment lead-time 20.104 92 .000 1.41935 1.2791 1.5596
On-time performance 21.502 92 .000 1.54945 1.4063 1.6926
Supply flexibility 15.580 92 .000 1.33333 1.1634 1.5033
Delivery frequency 19.842 92 .000 1.50538 1.3547 1.6561
Supply quality 22.227 92 .000 1.50538 1.3709 1.6399
Inbound transportation cost 21.174 92 .000 1.50538 1.3642 1.6466
Pricing terms 18.448 92 .000 1.41935 1.2666 1.5722
Information coordination capability 21.833 92 .000 1.54839 1.4075 1.6892
Design collaboration capability 17.883 92 .000 1.39785 1.2426 1.5531
Exchange rates, taxes & duties 18.676 92 .000 1.44086 1.2876 1.5941
Supplier viability 20.138 92 .000 1.46237 1.3181 1.6066
Reliability 19.006 92 .000 1.39785 1.2518 1.5439
Financial stability 17.093 92 .000 1.30108 1.1499 1.4522
Source: primary data
Table 2 describes that the‘t’ values such as 21.660,19.158, 19.649, 15.580, 20.258, 17.763,
19.175, 15.022 and 18.814 are statistically significant at 1 percent level and all the ‘t’ values are
positive with consistent standard deviation. Therefore it is concluded that replenishment lead-
time, on-time performance, supply flexibility, delivery frequency, supply quality, inbound
transportation cost are more useful to manage suppliers and vendors to manage better SCM
practices in HLL Life care.
8. COST MANAGEMENT METRICS TO IMPROVE OPERATIONAL, FINANCIAL AND SOCIAL
PERFORMANCE OF COMPANY- PARAMETRIC VALUE:
Cost management factors are taking main part in SCM to improve the operational, financial and social
performance of HLL Life care. There are 15 cost management variables which are measured to know the
respondents opinion towards the needs in order to improve operational, financial and social performance of
HLL Life care.
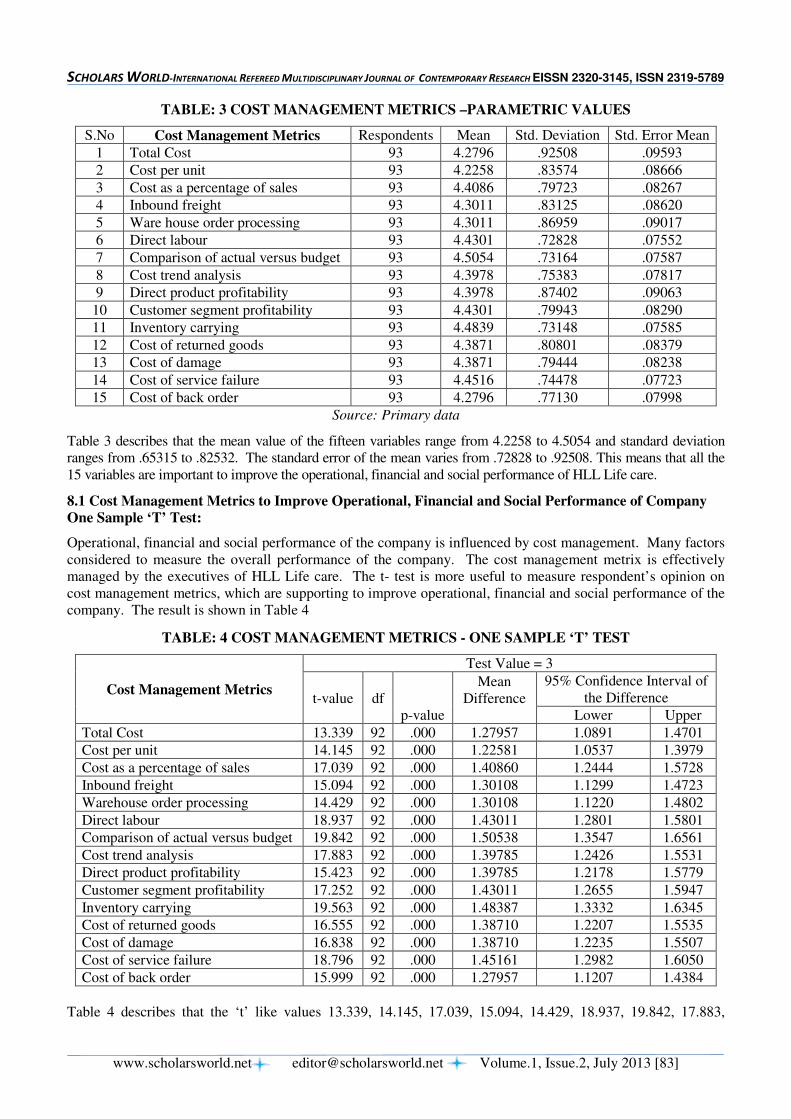
SCHOLARS WORLD-INTERNATIONAL REFEREED MULTIDISCIPLINARY JOURNAL OF CONTEMPORARY RESEARCH EISSN 2320-3145, ISSN 2319-5789
www.scholarsworld.net [email protected] Volume.1, Issue.2, July 2013 [83]
TABLE: 3 COST MANAGEMENT METRICS –PARAMETRIC VALUES
S.No Cost Management Metrics Respondents Mean Std. Deviation Std. Error Mean
1 Total Cost 93 4.2796 .92508 .09593
2 Cost per unit 93 4.2258 .83574 .08666
3 Cost as a percentage of sales 93 4.4086 .79723 .08267
4 Inbound freight 93 4.3011 .83125 .08620
5 Ware house order processing 93 4.3011 .86959 .09017
6 Direct labour 93 4.4301 .72828 .07552
7 Comparison of actual versus budget 93 4.5054 .73164 .07587
8 Cost trend analysis 93 4.3978 .75383 .07817
9 Direct product profitability 93 4.3978 .87402 .09063
10 Customer segment profitability 93 4.4301 .79943 .08290
11 Inventory carrying 93 4.4839 .73148 .07585
12 Cost of returned goods 93 4.3871 .80801 .08379
13 Cost of damage 93 4.3871 .79444 .08238
14 Cost of service failure 93 4.4516 .74478 .07723
15 Cost of back order 93 4.2796 .77130 .07998
Source: Primary data
Table 3 describes that the mean value of the fifteen variables range from 4.2258 to 4.5054 and standard deviation
ranges from .65315 to .82532. The standard error of the mean varies from .72828 to .92508. This means that all the
15 variables are important to improve the operational, financial and social performance of HLL Life care.
8.1 Cost Management Metrics to Improve Operational, Financial and Social Performance of Company
One Sample ‘T’ Test:
Operational, financial and social performance of the company is influenced by cost management. Many factors
considered to measure the overall performance of the company. The cost management metrix is effectively
managed by the executives of HLL Life care. The t- test is more useful to measure respondent’s opinion on
cost management metrics, which are supporting to improve operational, financial and social performance of the
company. The result is shown in Table 4
TABLE: 4 COST MANAGEMENT METRICS - ONE SAMPLE ‘T’ TEST
Cost Management Metrics
Test Value = 3
t-value
df
p-value
Mean
Difference
95% Confidence Interval of
the Difference
Lower Upper
Total Cost 13.339 92 .000 1.27957 1.0891 1.4701
Cost per unit 14.145 92 .000 1.22581 1.0537 1.3979
Cost as a percentage of sales 17.039 92 .000 1.40860 1.2444 1.5728
Inbound freight 15.094 92 .000 1.30108 1.1299 1.4723
Warehouse order processing 14.429 92 .000 1.30108 1.1220 1.4802
Direct labour 18.937 92 .000 1.43011 1.2801 1.5801
Comparison of actual versus budget 19.842 92 .000 1.50538 1.3547 1.6561
Cost trend analysis 17.883 92 .000 1.39785 1.2426 1.5531
Direct product profitability 15.423 92 .000 1.39785 1.2178 1.5779
Customer segment profitability 17.252 92 .000 1.43011 1.2655 1.5947
Inventory carrying 19.563 92 .000 1.48387 1.3332 1.6345
Cost of returned goods 16.555 92 .000 1.38710 1.2207 1.5535
Cost of damage 16.838 92 .000 1.38710 1.2235 1.5507
Cost of service failure 18.796 92 .000 1.45161 1.2982 1.6050
Cost of back order 15.999 92 .000 1.27957 1.1207 1.4384
Table 4 describes that the ‘t’ like values 13.339, 14.145, 17.039, 15.094, 14.429, 18.937, 19.842, 17.883,
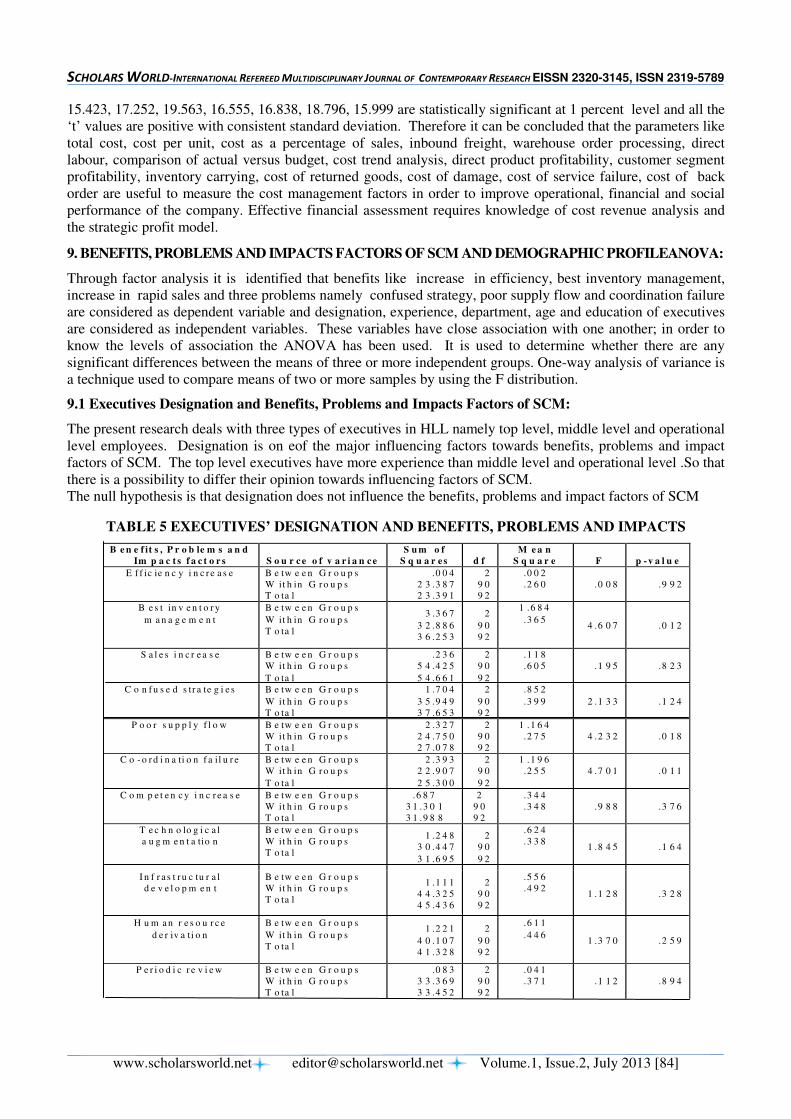
SCHOLARS WORLD-INTERNATIONAL REFEREED MULTIDISCIPLINARY JOURNAL OF CONTEMPORARY RESEARCH EISSN 2320-3145, ISSN 2319-5789
www.scholarsworld.net [email protected] Volume.1, Issue.2, July 2013 [84]
15.423, 17.252, 19.563, 16.555, 16.838, 18.796, 15.999 are statistically significant at 1 percent level and all the
‘t’ values are positive with consistent standard deviation. Therefore it can be concluded that the parameters like
total cost, cost per unit, cost as a percentage of sales, inbound freight, warehouse order processing, direct
labour, comparison of actual versus budget, cost trend analysis, direct product profitability, customer segment
profitability, inventory carrying, cost of returned goods, cost of damage, cost of service failure, cost of back
order are useful to measure the cost management factors in order to improve operational, financial and social
performance of the company. Effective financial assessment requires knowledge of cost revenue analysis and
the strategic profit model.
9. BENEFITS, PROBLEMS AND IMPACTS FACTORS OF SCM AND DEMOGRAPHIC PROFILEANOVA:
Through factor analysis it is identified that benefits like increase in efficiency, best inventory management,
increase in rapid sales and three problems namely confused strategy, poor supply flow and coordination failure
are considered as dependent variable and designation, experience, department, age and education of executives
are considered as independent variables. These variables have close association with one another; in order to
know the levels of association the ANOVA has been used. It is used to determine whether there are any
significant differences between the means of three or more independent groups. One-way analysis of variance is
a technique used to compare means of two or more samples by using the F distribution.
9.1 Executives Designation and Benefits, Problems and Impacts Factors of SCM:
The present research deals with three types of executives in HLL namely top level, middle level and operational
level employees. Designation is on eof the major influencing factors towards benefits, problems and impact
factors of SCM. The top level executives have more experience than middle level and operational level .So that
there is a possibility to differ their opinion towards influencing factors of SCM.
The null hypothesis is that designation does not influence the benefits, problems and impact factors of SCM
TABLE 5 EXECUTIVES’ DESIGNATION AND BENEFITS, PROBLEMS AND IMPACTS
B e n e f it s , P r o b le m s a n d
Im p a c t s f a c t o r s S o u r c e o f v a r i a n c e
S u m o f
S q u a r e s d f
M e a n
S q u a r e F p - v a l u e
E f f ic ie n c y i n c r e a s e
B e tw e e n G r o u p s
W it h in G r o u p s
T o ta l
.0 0 4
2 3 .3 8 7
2 3 .3 9 1
2
9 0
9 2
.0 0 2
.2 6 0 .0 0 8 .9 9 2
B e s t in v e n t o r y
m a n a g e m e n t
B e tw e e n G r o u p s
W it h in G r o u p s
T o ta l
3 .3 6 7
3 2 .8 8 6
3 6 .2 5 3
2
9 0
9 2
1 .6 8 4
.3 6 5 4 .6 0 7 .0 1 2
S a l e s i n c r e a s e
B e tw e e n G r o u p s
W it h in G r o u p s
T o ta l
.2 3 6
5 4 .4 2 5
5 4 .6 6 1
2
9 0
9 2
.1 1 8
.6 0 5 .1 9 5 .8 2 3
C o n f u s e d s tr a te g i e s
B e tw e e n G r o u p s
W it h in G r o u p s
T o ta l
1 .7 0 4
3 5 .9 4 9
3 7 .6 5 3
2
9 0
9 2
.8 5 2
.3 9 9 2 .1 3 3 .1 2 4
P o o r s u p p l y f l o w
B e tw e e n G r o u p s
W it h in G r o u p s
T o ta l
2 .3 2 7
2 4 .7 5 0
2 7 .0 7 8
2
9 0
9 2
1 .1 6 4
.2 7 5 4 .2 3 2 .0 1 8
C o - o r d i n a ti o n f a il u r e
B e tw e e n G r o u p s
W it h in G r o u p s
T o ta l
2 .3 9 3
2 2 .9 0 7
2 5 .3 0 0
2
9 0
9 2
1 .1 9 6
.2 5 5 4 .7 0 1 .0 1 1
C o m p e t e n c y i n c r e a s e
B e tw e e n G r o u p s
W it h in G r o u p s
T o ta l
.6 8 7
3 1 .3 0 1
3 1 .9 8 8
2
9 0
9 2
.3 4 4
.3 4 8 .9 8 8 .3 7 6
T e c h n o lo g i c a l
a u g m e n t a tio n
B e tw e e n G r o u p s
W it h in G r o u p s
T o ta l
1 .2 4 8
3 0 .4 4 7
3 1 .6 9 5
2
9 0
9 2
.6 2 4
.3 3 8 1 .8 4 5 .1 6 4
I n f r a s t r u c tu r a l
d e v e l o p m e n t
B e tw e e n G r o u p s
W it h in G r o u p s
T o ta l
1 .1 1 1
4 4 .3 2 5
4 5 .4 3 6
2
9 0
9 2
.5 5 6
.4 9 2 1 .1 2 8 .3 2 8
H u m a n r e s o u r c e
d e r iv a ti o n
B e tw e e n G r o u p s
W it h in G r o u p s
T o ta l
1 .2 2 1
4 0 .1 0 7
4 1 .3 2 8
2
9 0
9 2
.6 1 1
.4 4 6 1 .3 7 0 .2 5 9
P e r i o d i c r e v i e w
B e tw e e n G r o u p s
W it h in G r o u p s
T o ta l
.0 8 3
3 3 .3 6 9
3 3 .4 5 2
2
9 0
9 2
.0 4 1
.3 7 1 .1 1 2 .8 9 4
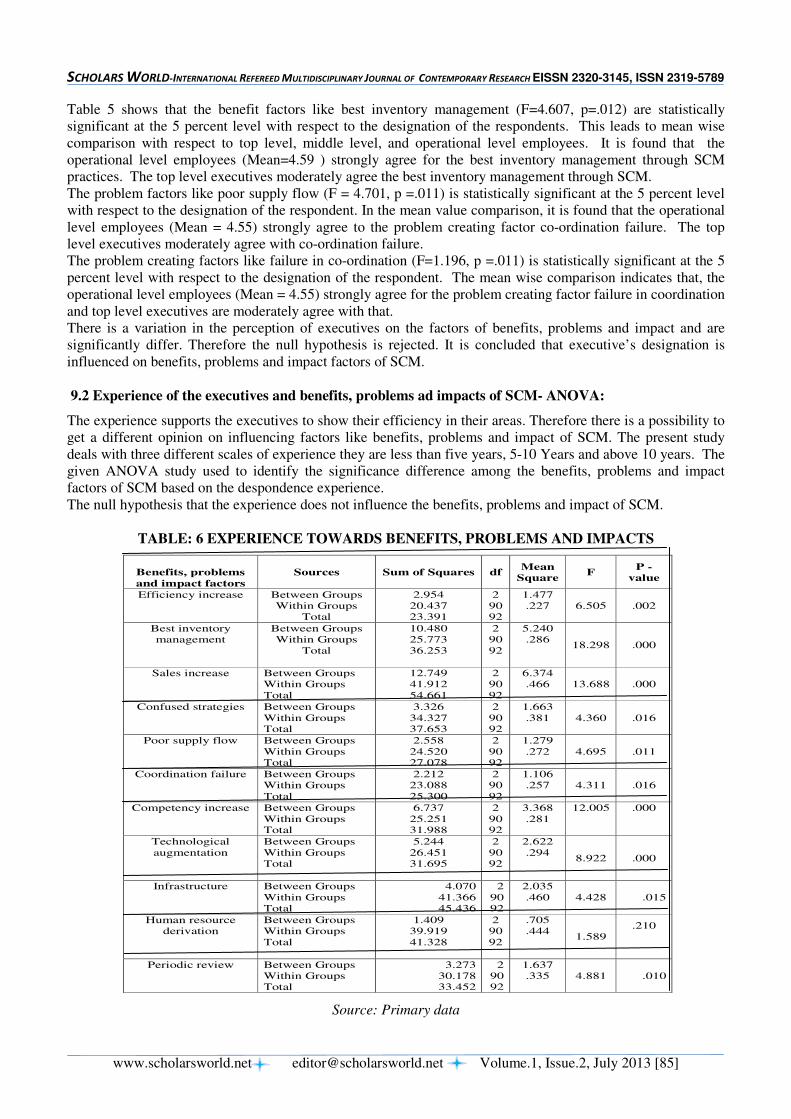
SCHOLARS WORLD-INTERNATIONAL REFEREED MULTIDISCIPLINARY JOURNAL OF CONTEMPORARY RESEARCH EISSN 2320-3145, ISSN 2319-5789
www.scholarsworld.net [email protected] Volume.1, Issue.2, July 2013 [85]
Table 5 shows that the benefit factors like best inventory management (F=4.607, p=.012) are statistically
significant at the 5 percent level with respect to the designation of the respondents. This leads to mean wise
comparison with respect to top level, middle level, and operational level employees. It is found that the
operational level employees (Mean=4.59 ) strongly agree for the best inventory management through SCM
practices. The top level executives moderately agree the best inventory management through SCM.
The problem factors like poor supply flow (F = 4.701, p =.011) is statistically significant at the 5 percent level
with respect to the designation of the respondent. In the mean value comparison, it is found that the operational
level employees (Mean = 4.55) strongly agree to the problem creating factor co-ordination failure. The top
level executives moderately agree with co-ordination failure.
The problem creating factors like failure in co-ordination (F=1.196, p =.011) is statistically significant at the 5
percent level with respect to the designation of the respondent. The mean wise comparison indicates that, the
operational level employees (Mean = 4.55) strongly agree for the problem creating factor failure in coordination
and top level executives are moderately agree with that.
There is a variation in the perception of executives on the factors of benefits, problems and impact and are
significantly differ. Therefore the null hypothesis is rejected. It is concluded that executive’s designation is
influenced on benefits, problems and impact factors of SCM.
9.2 Experience of the executives and benefits, problems ad impacts of SCM- ANOVA:
The experience supports the executives to show their efficiency in their areas. Therefore there is a possibility to
get a different opinion on influencing factors like benefits, problems and impact of SCM. The present study
deals with three different scales of experience they are less than five years, 5-10 Years and above 10 years. The
given ANOVA study used to identify the significance difference among the benefits, problems and impact
factors of SCM based on the despondence experience.
The null hypothesis that the experience does not influence the benefits, problems and impact of SCM.
TABLE: 6 EXPERIENCE TOWARDS BENEFITS, PROBLEMS AND IMPACTS
Source: Primary data
Benefits, problems
and impact factors
Sources Sum of Squares df Mean
Square F
P -
value
Efficiency increase
Between Groups
Within Groups
Total
2.954
20.437
23.391
2
90
92
1.477
.227 6.505 .002
Best inventory
management
Between Groups
Within Groups
Total
10.480
25.773
36.253
2
90
92
5.240
.286 18.298 .000
Sales increase
Between Groups
Within Groups
Total
12.749
41.912
54.661
2
90
92
6.374
.466 13.688 .000
Confused strategies
Between Groups
Within Groups
Total
3.326
34.327
37.653
2
90
92
1.663
.381 4.360 .016
Poor supply flow
Between Groups
Within Groups
Total
2.558
24.520
27.078
2
90
92
1.279
.272 4.695 .011
Coordination failure
Between Groups
Within Groups
Total
2.212
23.088
25.300
2
90
92
1.106
.257 4.311 .016
Competency increase
Between Groups
Within Groups
Total
6.737
25.251
31.988
2
90
92
3.368
.281
12.005 .000
Technological
augmentation
Between Groups
Within Groups
Total
5.244
26.451
31.695
2
90
92
2.622
.294 8.922 .000
Infrastructure
Between Groups
Within Groups
Total
4.070
41.366
45.436
2
90
92
2.035
.460 4.428 .015
Human resource
derivation
Between Groups
Within Groups
Total
1.409
39.919
41.328
2
90
92
.705
.444 1.589
.210
Periodic review
Between Groups
Within Groups
Total
3.273
30.178
33.452
2
90
92
1.637
.335 4.881 .010
SCHOLARS WORLD-INTERNATIONAL REFEREED MULTIDISCIPLINARY JOURNAL OF CONTEMPORARY RESEARCH EISSN 2320-3145, ISSN 2319-5789
www.scholarsworld.net [email protected] Volume.1, Issue.2, July 2013 [86]
Table 6 shows that the beneficial factors namely increasing efficiency (F=6.505, p=.002), best
inventory management (F=18.298, P=.000), increase of sales (F=13.688, p=.000) are
statistically significant at the 5 percent and 1 percent level with respect to the experience of
the respondents. The level wise comparison indicates that, the operational level employees
(Mean=4.5635) strongly agree for the increase efficiency through SCM practices. The top
level and middle level executives moderately agree the factors of best inventory management
through SCM.
The problem factors namely confused strategies (F=4.360, p=.016), poor supply flow (F=4.695,
p=.011) and failure in co-ordination (F=4.311, p=.016) are statistically significant at the 5 percent
level with respect to the experience of the respondents. The mean wise comparison with respect to top
level, middle level, and operational level employees indicates that, the middle level employees
(Mean=4.55 ) strongly agree with the problem factor confused strategies and top level executives are
moderately agree for confused strategies. The mean wise comparison to poor supply flow (Mean=4.58)
indicates that the operational level executives have strongly agreed with the poor supply flow and top
level executives are moderately agreeing with the poor supply flow. Finally the mean wise comparison
value for co-ordination failure (Mean=4.56) indicates that the operational level executives have
strongly agree with this factor and top level executives are moderately agree with the co-ordination
failure.
The impact factors increase in competency (F =12.005, p =.000), technological augmentation
(F=8.922, p= .000), infrastructural development (F=4.428, p=.015) and periodic review (F=4.881,
p = .010) are statistically significant at 5 percent level with respect to experience of the
respondents. This leads to mean wise comparison with respect to top level, middle level, and
operational level employees. It is found that, the operational level employees (Mean=4.65)
strongly agree to the increase in competency through SCM practices and top level executives
agree with the competency increase and middle level executives are moderately agreeing for
increase in competency factor.
The mean wise comparison for the technological augmentation among the top level, middle and
operational level executives, the middle level executives(Mean=4.59) strongly agree with technological
augmentation and top level executives are agree with this factor. The mean wise comparison of the
infrastructural facilities, the operational level executives (Mean=4.52) strongly agree with the
infrastructural facility factors and top level executives are moderately agree with the infrastructural
facilities. Finally the mean wise comparison for the periodic review among the employees of HLL, the
middle level executives (Mean=4.60) strongly agree with periodic review and top level executives
moderately agree with periodic review. Therefore the null hypothesis is rejected. It can be concluded
that the experience of the respondents influence the factors such as benefits, problems and impact factors
of SCM.
9.3 Department of the executives and benefits, problems and impacts of SCM-ANOVA:
There are six different departments in HLL such as stores, production, maintenance, customer
relations, shop flow and human resource management department. The given one-way ANOVA
used to identify the significant variation on their perception towards benefits, problems and
impact of SCM based on the department of the respondents. The protocol significantly differs,
based on the nature of the respondent’s departmental work. Therefore it is a possibility to get a
different opinion on benefits, problems and impact factors of SCM. The null hypothesis is that
he respondents department does not influence the factors of benefits, problems and impact of
SCM.
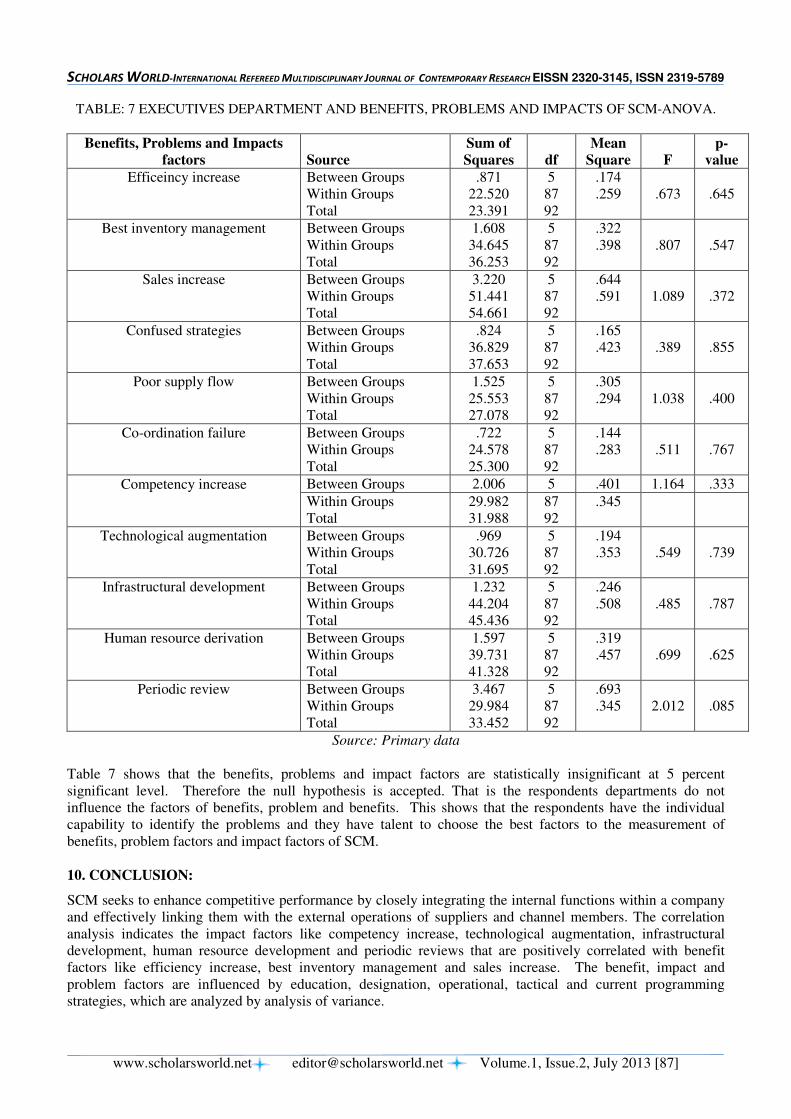
SCHOLARS WORLD-INTERNATIONAL REFEREED MULTIDISCIPLINARY JOURNAL OF CONTEMPORARY RESEARCH EISSN 2320-3145, ISSN 2319-5789
www.scholarsworld.net [email protected] Volume.1, Issue.2, July 2013 [87]
TABLE: 7 EXECUTIVES DEPARTMENT AND BENEFITS, PROBLEMS AND IMPACTS OF SCM-ANOVA.
Benefits, Problems and Impacts
factors Source
Sum of
Squares df
Mean
Square F
p-
value
Efficeincy increase
Between Groups
Within Groups
Total
.871
22.520
23.391
5
87
92
.174
.259 .673 .645
Best inventory management
Between Groups
Within Groups
Total
1.608
34.645
36.253
5
87
92
.322
.398 .807 .547
Sales increase
Between Groups
Within Groups
Total
3.220
51.441
54.661
5
87
92
.644
.591 1.089 .372
Confused strategies
Between Groups
Within Groups
Total
.824
36.829
37.653
5
87
92
.165
.423 .389 .855
Poor supply flow
Between Groups
Within Groups
Total
1.525
25.553
27.078
5
87
92
.305
.294 1.038 .400
Co-ordination failure
Between Groups
Within Groups
Total
.722
24.578
25.300
5
87
92
.144
.283 .511 .767
Competency increase
Between Groups 2.006 5 .401 1.164 .333
Within Groups
Total
29.982
31.988
87
92
.345
Technological augmentation
Between Groups
Within Groups
Total
.969
30.726
31.695
5
87
92
.194
.353 .549 .739
Infrastructural development
Between Groups
Within Groups
Total
1.232
44.204
45.436
5
87
92
.246
.508 .485 .787
Human resource derivation
Between Groups
Within Groups
Total
1.597
39.731
41.328
5
87
92
.319
.457 .699 .625
Periodic review
Between Groups
Within Groups
Total
3.467
29.984
33.452
5
87
92
.693
.345 2.012 .085
Source: Primary data
Table 7 shows that the benefits, problems and impact factors are statistically insignificant at 5 percent
significant level. Therefore the null hypothesis is accepted. That is the respondents departments do not
influence the factors of benefits, problem and benefits. This shows that the respondents have the individual
capability to identify the problems and they have talent to choose the best factors to the measurement of
benefits, problem factors and impact factors of SCM.
10. CONCLUSION:
SCM seeks to enhance competitive performance by closely integrating the internal functions within a company
and effectively linking them with the external operations of suppliers and channel members. The correlation
analysis indicates the impact factors like competency increase, technological augmentation, infrastructural
development, human resource development and periodic reviews that are positively correlated with benefit
factors like efficiency increase, best inventory management and sales increase. The benefit, impact and
problem factors are influenced by education, designation, operational, tactical and current programming
strategies, which are analyzed by analysis of variance.

SCHOLARS WORLD-INTERNATIONAL REFEREED MULTIDISCIPLINARY JOURNAL OF CONTEMPORARY RESEARCH EISSN 2320-3145, ISSN 2319-5789
www.scholarsworld.net [email protected] Volume.1, Issue.2, July 2013 [88]
REFERENCES:
1. Methvin & Annemarie Campbell, “Healthcare Provider Supply Chain Management”, Operations
management in health care organizations, Fall 2011, pp. 1-30
2. Rana Basu, Mousumi Modak and Pranab , “Analyzing the Risk factors of supply chain management in
Indian manufacturing organizations”, Journal of Social and Development Sciences ,Vol. 1, No. 3, 2011,
pp. 109-114
3. Nimawat Dheeraj and Namdev Vishal, “An Overview of green Supply Chain Management in India”,
Research Journal of Recent Sciences ,Vol. 1, No. 6, 2012, pp.77-82,
4. Daniel G. Wolf, Cyber Pack Ventures, James F. X. Payne, Telecordia Mary Anderson, Booz Allen
Hamilton , “Supply chain risk management awareness”, Armed forces communication and electronics
association cyber committee,2012.
----
SCHOLARS WORLD-INTERNATIONAL REFEREED MULTIDISCIPLINARY JOURNAL OF CONTEMPORARY RESEARCH EISSN 2320-3145, ISSN 2319-5789
www.scholarsworld.net [email protected] Volume.1, Issue.2, July 2013 [89]
LOST DREAMS AND UNBROKEN THREADS IN
TEA BY VELINA HASU HOUSTON
Mrs. ZELLAT-HENRY Imene,
Vallée des Jardins Sidi Bel Abbes Algerie
ABSTRACT
Although the issue of conflicted identities is a common one in ethnic American literature, the
field of Asian American literary studies is fairly new coming only into existence in the early
1970s and is constantly being expanded and redefined in order to incorporate new ethnic groups.
Velina Hasu HOUSTON, among other Amerasian women writers, has tried to be voiceful
through the language of dialogue, through stage and actors, through Thalia and Melpomene i.e.
through drama rather than other literary genres. In that respect, this paper tends to examine how a
history of racialization in the United States impacts the identity formation of the Asian American
characters in the play of TEA by Velina Hasu HOUSTON in addition to the ways in which the
Asian war brides coming to America from Japan in 1969 have challenged, on the one hand, the
notions of ‘foreignness’ and ‘otherness’ in relation to white Americans as race often functions
ineffectively signifying a group homogeneity. On the other hand, they suffer from a double
silence, as being foreigners and as being women facing a choice between claiming America
which might affirm white cultural hegemony and maintaining their distinct racial or ethnic
identity which could perpetuate a diasporic existence, as one's identity is reduced to ancestral
origins and marked as alien.
Keywords: Drama, Ethnicity, Culture, Immigration, Alienation, Feminism.
SCHOLARS WORLD-INTERNATIONAL REFEREED MULTIDISCIPLINARY JOURNAL OF CONTEMPORARY RESEARCH EISSN 2320-3145, ISSN 2319-5789
www.scholarsworld.net [email protected] Volume.1, Issue.2, July 2013 [90]
INTRODUCTION:
American literature has always reflected its originality through time and space in a complex terrain. Different
themes developed in various literary works show the diversity of the American literary landscape and the
struggle against fixed notions of memory, identity and origin. The history of racialisation in the USA impacts
the identity formation of ethnic groups like Asian Americans. “Race, as we all know, is a social construct, a
mass fantasy in which we all participate, yet it persists as a constant material force as well as avisceral and lived
reality.”(Shilpa Davé, LeiLani Nishime, and Tasha G. Oren 2005), taking into account that race is a
constructed and often very ambiguous method of identification, based on phenotypical characteristics such as
skin colour, eye shape, and hair colour. However, race has continually been used throughout the history of the
United States as a way of informing perceptions of identity and “foreignness” and as a method of both including
and excluding racialised minority groups from full participation in American society.
Indeed, the first federal laws enacted in the United States in order to exclude a particular group of people were
in response to Asian immigration, beginning with the Naturalization Law of 1790, which limited citizenship to
“free white persons.” Then, Asian immigration was not reopened until 1965 with the Immigration Law and
Asians quickly became the fastest growing minority group in the United States. This population increase, along
with the Asian American political and literary movement in the late 1960s, made Asian Americans more visible
to the general American public. In 1968 Asian American intellectuals formed a political movement and public
struggle for racial equality that took place largely on West Coast college campuses and spread to the United
States as a whole.
In the 1990s, a resurgence of interest in Asian American studies and politics took place in the United States, in
part due to the emergence of powerful Asian American literature, which helped establish Asian America as a
point of reference. Frank Chin and Maxine Hong Kingston, two Chinese American writers, were instrumental in
bringing attention to Asian American literature both within and outside the academy in the 1960s and 1970s,
but the publication of Amy Tan’s Joy Luck Club in 1989 brought the subject of Asian America to the attention
of the mainstream public. Literary critic David Palumbo-Liu asserts that the most lasting effect of the Asian
American movement may be the “reshaping of American consciousness of ethnicity and race” (David Palumbo-
Liu 1995:307). Although awareness of minorities within Asian America is still emerging, much progress has
been made in bringing attention to the experiences of Asian Americans as a whole, and much of this progress
has come through literature.
Although immigrants from Asia and Americans of Asian descent have been writing in the United States since the
19th century, Asian American literature as a category of writing only came into existence in the early 1970s.
Perhaps the earliest references to "Asian American literature" appeared with David Hsin-fu Wand's Asian
American Heritage: An Anthology of Prose and Poetry, published in 1974, and Aiiieeeee! An Anthology of Asian-
American Writers, edited by Frank Chin, Jeffery Paul Chan, Lawson Fusao Inada, and Shawn Wong, also
published in 1974. Elaine Kim's seminal book of criticism, Asian American Literature: An Introduction to the
Writings and Their Social Context, was published in 1982 and was the first critical book on the topic. Thus, the
mainstream public has begun to understand America as more diverse, so, too, have scholars moved to integrate
more texts by women and ethnic minorities into the standard canon of literature taught and studied. These changes
can be both exhilarating and disconcerting, as the breadth of American literature appears to be almost limitless.
Many Asian American writers found that they would be more voiceful through the language of dialogue, actors,
stage, the system of signs, theatrical discourse …i.e. through drama as the Asian American theater emerged in
the 1960s and the 1970s with the foundation of four theatre companies: East West Players in Los Angeles,
Asian American Theatre Workshop (later renamed Asian American Theater Company) in San Francisco,
Theatrical Ensemble of Asians (later renamed Northwest Asian American Theatre) in Seattle, and Pan Asian
Repertory Theatre in New York City.
Women playwrights were appropriating their fellow male writers’ concept of Cultural Nationalism for their
own needs. The result is a sort of a woman-centered ethnic “cultural nation,” a space they could claim as their
own through their writing. It is, of course, to those women writers’ credit that their works came to enjoy
unprecedented popularity among mainstream readers. However, it should also be pointed out that they owe their
SCHOLARS WORLD-INTERNATIONAL REFEREED MULTIDISCIPLINARY JOURNAL OF CONTEMPORARY RESEARCH EISSN 2320-3145, ISSN 2319-5789
www.scholarsworld.net [email protected] Volume.1, Issue.2, July 2013 [91]
success in no small measure to the particular intellectual climate of the United States society at the time when
their works were produced (Pitkin Hanna Fenichel 1967: 175).
Heterogeneity, hybridity and multiplicity characterize the Asian American culture as part of an aim of that
argument being to disrupt the current hegemonic relationship between dominant and minority positions twofold
argument about cultural politics. Ultimate several plays illustrate the limits of positioning Asian Americans
merely in terms of culture—through reinforcing narratives of East versus West in the form of parent-child
tensions—as illustrative of this popular and problematic discourse in which critics must use as a point of
departure (Lowe Lisa 2000: 509).
In stressing cultural differences, discourses within Asian American studies seek to examine an Asian American
‘identity’ which privileges commonality over differences. Centering a discourse around race, culture and/or
ethnicity continually marginalizes examination of the means through which gender and class and other
differences intersect and complicate various experiences among Asian Americans. Thus, there are dangers in
framing discussions around binaristic concepts such as ‘Old World,’ ‘New World,’ and other terms that seek to
establish notions of concrete, static cultures based upon race. In fact, focus should be shifted away from people
to the agenda: “basing the identity on politics rather than the politics on identity”
Feminism in Asian America is a collective response to racism, sexism, cultural nationalism, and call for
heterogeneity in various locations: feminist scholarship as well as organizing and activism. It aims to consider the
gender and ethnicity paradigm around nexuses of race, ethnicity, gender and class in Asian America. It emerges to
challenge Orientalism inflicted upon Asian women and the stereotypes American mainstreams hold of Asian
American women. Contemporary Asian American feminism also attempts to extend its territory to other Asian
subjects in a transnational context by including women across boundaries of race, class, and nationalities.
Velina Hasu HOUSTON among other Amerasian women playwrights had to journey against fixed notions of
origin, memory and identity. She was born on May 5, 1957. She is an award winning American playwright,
essayist, poet, author, editor, and screenwriter. She has had many works produced, presented, and published,
with some drawing from her experience of being multiracial, as well as from the immigrant experiences of her
family and those she encountered growing up in Junction City, Kansas.
Her work focuses on the shifting boundaries of identity with regard to gender, culture, and ethnicity, often
embracing a transnational view of identity based upon her own Japanese and American background. Her works'
themes also have extended beyond these issues to explore stories related to women in society. She is best
known for her play TEA which portrays the lives of Japanese war brides who move to the United States with
their American servicemen husbands.
In her play TEA she tells about the Japanese "war brides" in 1969 in Kansas, America forming a Japanese
women community in America, in which the main character, Himiko is one of them and their difficulties are to
adapt themselves among American society. Indeed, the occupation also had a great impact on relationships
between man and woman in Japan. The "modern girl" phenomenon of the 1920s and early 1930s had been
characterized by greater freedom, The Japanese public was thus astounded by the sight of some 45,000 so-
called ‘pan pan girls’ (prostitutes) fraternizing with American soldiers during the occupation.
With the coming of American soldiers which continue to increase until the early 1950s, it was not surprising
that during this period, there were a lot of marriages between American grooms and Japanese brides. American
men were interested too, to Japanese women since they were known for being good wives, obedient and
faithful. They had the moral charm, slight and dainty though their eyes and eye-lids seemed strange at first, Yet
they are often very charming…Even if she cannot be called beautiful, according to Western standards, Japanese
women must be confessed pretty, and if she is seldom graceful in the Occidental sense, she is at least graceful in
her own Oriental manner.
Comparing to American women, Japanese women are more compliant, gentle and obedient. When American
soldiers reached Japan and they found Japanese women who brought them their slippers, fixed them tea and
SCHOLARS WORLD-INTERNATIONAL REFEREED MULTIDISCIPLINARY JOURNAL OF CONTEMPORARY RESEARCH EISSN 2320-3145, ISSN 2319-5789
www.scholarsworld.net [email protected] Volume.1, Issue.2, July 2013 [92]
drew them a hot bath without being asked, they thought they have arrived in a paradise for men. However,
American soldiers kept still a bad reputation in the Japanese society, who were staying in their homeland, they
still remembered the American bombing in Hiroshima and Nagasaki. Therefore, lots of Japanese families forbid
their daughters to have any relationship with Americans. On the contrary, many Japanese girls considered
marriage with Americans a very good beginning of a new and better life.
In a town near a military base in Kansas, four Japanese women, all post-war emigrants with American
servicemen husbands, meet at the home of a fifth, Himiko, who has shot herself after having fallen in a serious
alienation. The four women have differences of background, temperament, outlook, and status, and two are
widows. During the meeting, they clean and tidy the house, drink tea together, and come to a difficult
accommodation with each other. Himiko is present as a spirit, gradually reconciling herself to her fate and
death. As they undergo their rite of passage, the women ‘transform’ to their past selves in Japan, to their
husbands, and to their own children, so that the playwright through these techniques creates a full and complex
portraiture of the women coming to terms with their cultural limbo in a largely alien society. At the climax, the
tragic circumstances behind Himiko's suicide are fully revealed in a moving epiphany.
TEA is the final play of a trilogy based on HOUSTON’s family. The first trilogy is: Morning has Broken, Asa
Ga Kimashita, which tells about her Japanese mother’s decision to marry an African American, Native
American Indian and leave her ancestral home. The second trilogy is American Dreams. TEA concludes the
series, reaching beyond immediate autobiography to encompass a community of Japanese women, one of whom
is based on HOUSTON’s widowed mother that is why she called it ‘a poem to my mother’(Uno 1993: 155). In
her playwrght’s notes for TEA, Houston writes:
“My passion for these Japanese international brides is both personal and political. An Amerasian
born of America’s first war with Asia, I am the daughter of one such Japanese woman and an
American soldier who was half Native American Indian and half African American. My creative
exploration of my family history, though born of artistic and personal passion, are nevertheless
historical because they document history- the Japanese war brides and the Japanese American
experience- that otherwise must have been lost to the mainstream history that Japan has side-
stepped and about which America never knew and never care (Houston, 1993: 155).
HOUSTON expresses the angst, fear, and rage that oppression has wrought while maintaining her relationship
with America as a good citizen. She presents disappointment, a pervading sense of a broken promise and a lost
dream as implies the end of scene three, where Himiko tells the audience, contrary to Setsuko’s optimistic
memory, that they never had “it”. TEA paints a picture of Japanese victimization and the crushing, unjust force
of Western ignorance towards people whose only crime was looking especially different, especially identifiable
as a potential enemy. HOUSTON reveals in the play that many young Japanese women wanted to leave their
war-torn, broken homeland—the dream was rotting before their youth-bright eyes, and running into the arms of
the victors seemed glamorous, savvy, and promising.
But on a personal level, instead of finding prosperity and romance, the “war brides” largely discover a new kind
of struggle—marriage is isolation, prejudice, and abuse, and even the women in supposedly content marriages
seem silly at best to their children:
Teruko: My mother doesn’t worry about anything except my dad. When she starts licking the bottom of his
shoes and gets that look in her eye,
(mimicks her mother doing this) I can say, “Mom, hi, I’m going to join the Marines, become a lesbian, screw
the football team.” She’d just say,
(Imitates mother’s accent) “Okay, Linda. That’s good. Have to fix dinner for sugar pie now.)
Although Himiko’s tragedy ‘explodes’, everyone suffers—some women fester, sensing that they will never be
fully accepted by their neighbours, while others carry the heavy load of widowhood, facing a double sense of
SCHOLARS WORLD-INTERNATIONAL REFEREED MULTIDISCIPLINARY JOURNAL OF CONTEMPORARY RESEARCH EISSN 2320-3145, ISSN 2319-5789
www.scholarsworld.net [email protected] Volume.1, Issue.2, July 2013 [93]
loneliness on the strange plains of Kansas. The play’s five women are all individuals, all facing personal
struggles and exhibiting different personalities, but they are also a microcosm of a much larger community of
war brides brought back to something much different than what they had imagined: refusal of service on the
basis of mixed marriage, being relegated to Kansas for the same reason, the million winks and nods received
every day, accompanying any minor errand.
While Asian men are certainly a minority in American culture, Asian women are a double minority and a
double silence if minorities have historically been ignored by the mainstream, women have certainly also been
until very recently, and the West often fetishizes the Asian woman as submissive, pliant, delicate, and always
quiet. Asian men may be seen as a kind of second-class version of masculinity, but Asian women are a kind of
caricature of woman’s general submissive stereotype, and for this reason, HOUSTON’s decision to give the
voice to female, Asian American women is intriguingly subversive.
Furthermore, it is important to note HOUSTON’s decision not to include separate actors for the roles of the
husbands and children, we are given these important perspectives, but they are pronounced through the women.
This seems especially important in the former case; since the traditional view of women is that of submission to
their husbands, and particularly since the West has historically been so fascinated by the idea of the silent
geisha serving her man, the idea that the men are only given voice through the bodies, imaginations, and
memories of their wives is almost shocking.
The theme of disappointment, perhaps achieving its climax in Himiko’s affirmation “No, we didn’t. We never had
it. All we had filtering through our fists was the powder left when a dream explodes in your face”, is crucial in
eclipsing the possibility of a too-neat, too-resolved ending. As submission, respect and silence are the
characteristics of a Japanese woman, she is supposed to be patient even when facing alienation and rejection by
the host society. This can be perceived even through their physical appearance as a Japanese woman is known by
her famous way of wearing a kimono clad and her bowing, which is a form of respect to all the people around her
including her husband. Sumiko Iwao in her book, The Japanese Women, said: “Americans cannot understand how
Japanese women tolerate the blatant sexual discrimination evident in their society” (Iwao, 1993: 3).
In Japanese society, women’s role is considered to be housewives, managing and arranging their homes to
obtain their self-esteem, stability and prosperity teachings of the Japanese society and its government, thus
Japanese women tend to go with the flow as said in Japanese: ( agare ni mi o makaseru). (Ibid 1993: 4).
Generally saying, the value system that guides Japanese women is reactive meaning that their behaviours come
as a response to others treatment. Japanese women are pragmatic, they do not care to achieve equality or
struggle to have a better status. They fail in their childhood to learn how to think independently. Japanese
women , however, consider their own happiness is to be closely tied to that of their families, so much that they
will restrain their personal feelings to an extent that an American woman might not be able to tolerate i.e.: they
are very happy and honoured when they succeed to have a good and harmonious family .
Houston explores a Japanese woman's interracial romance in postwar Japan and the influence of traditional
patriarchy on the lives of Japanese women. Although the term "feminism" was not invented until the 1880s,
reform movements aiming to improve women's lives emerged early in the nation's history. At the end of the
Revolutionary War, women lived under far more constraints than men. In slavery, to be sure, neither men nor
women had rights. But in the free white population, women, governed by the doctrine of coverture—laws
defining the status of women during marriage—were transferred from paternal guardianship to their husbands'
rule when they married, with no legal access to property, education, children, and occupations.
Female education was rudimentary at best. Still, marriage was women's most reasonable choice because (except
for widows) if unmarried, in Japan, women had to live in their parents' homes, work as servants in other people's
homes, or go into the sex trade. In fact the play TEA centers on the struggle of a woman for equality, and to be
accepted as a human being, before being cast into a gender stereotype and follow a direct approach towards this
goal of equality so that women believed a change was possible in the way they were perceived in society.
Furthermore, the play shows how alienation is a kind of disease which can be experienced by anyone in the
world. Human is a social being who needs to have communication with other people to survive, help and be
SCHOLARS WORLD-INTERNATIONAL REFEREED MULTIDISCIPLINARY JOURNAL OF CONTEMPORARY RESEARCH EISSN 2320-3145, ISSN 2319-5789
www.scholarsworld.net [email protected] Volume.1, Issue.2, July 2013 [94]
helped each other, that is why human cannot live without his or her society or people around him or her .i.e.
without having interact with other people, human is nothing and nearly he cannot survive. (Fromm, 1955: 35).
Himiko, the protagonist in TEA, experiences both personal alienation and social alienation.
According to Davis, an alienated person who experiences a deeper emotional problem will lose his or her
primary feelings extremely and does not know how they feel. In short, what matters to him or her is only
whether he or she has the right attitude toward something (Davis, 1970: 296-297). An alienated person focuses
on what he or she should do according to the people around him or her, and when he or she feels free from
something which has bounded him or her, he or she will experience, fantastic happiness because he or she is
temporarily freed from his or her hated self being another individual (Davis, 1970: 299). Himiko had such
attitude because of her society reactions towards her.
In TEA characters are described how they were excited by the new environment and a few frustrations do not
spoil their enthusiasm. How experiencing some difficulties with simple things like, for instance, making
telephone calls, or using public transport, tends to down -play negative emotions. How they feel isolated and
become withdrawn from life around them. They reject what is around them, feel that everyone is against them
and that nobody understands them (Nguyen Kim Phuong 1993: 4-5).
As a diasporic writer HOUSTON showed in her play TEA how the Japanese women contracting a mix marriage
were truly torn. Coming to America to realize the dream of having a better life. Attracted to America by young
love and by the self-confidence of the victorious young nation, they had no idea of how stranded and unhappy
they would feel in the Great Plains, where their husbands are assigned at Ft. Riley letting them alone to struggle
against the other. HOUSTON seems to hide her characters behind the theatre masks finding in drama an
effective medium of communicating what her characters experience, as masks are very symbolic in the Asian
culture, notably in the Japanese one. In that respect, she employs drama to place the audience at a flash point of
the cross-cultural despair. Once Himiko takes the journey that she also forces upon her Japanese peers, she
comes to understand and know herself better so that she can summon the courage needed to confront the reality.
At the climax of the play, she does so and this releases her from her natural life. With the help of the gift of the
spiritual rite from her Japanese peers, she crosses over the boundaries of guilt and shame with a sense of inner
peace and begins the new journey of reuniting with her dead child.
REFERENCES:
1. DAVE Shilpa, NISHIME Leilani and TASHA G Oren. East Mainstream: Asian American Popular
Culture. New York University Press, 2005.
2. DAVIS J.K. Man in Crisis: Perspectives on the Individual and his World. Illinois: Scott, Foresm an
and Company, 1970.
3. FOMM E. The Sane Society. USA: Holt, Rinehart and Winston Inc, 1955.
4. IWAO S. Japanese Women: Traditional Images and Changing Reality. Macmillan, 1993.
5. LOWE Lisa. Heterogenity, Hybridity, Multiplicity: Making Asian American Differences. Jean-Yu Wen
Shen Wu, Min Song, 2000.
6. NGUYEN Kim Phuong. Culture Shock, Citizenship Immigration. LINC Program/Class III-D4, 1993.
7. PITKIN Hanna Fenichel. The Concept of Representation. University of California, 1967.
8. PLUMBO-Liu David. The Ethnic Canon: Histories, Institutions and Interventions. Regentsnof the
University of Minnesota, 1995.
----

SCHOLARS WORLD-INTERNATIONAL REFEREED MULTIDISCIPLINARY JOURNAL OF CONTEMPORARY RESEARCH EISSN 2320-3145, ISSN 2319-5789
www.scholarsworld.net [email protected] Volume.1, Issue.2, July 2013 [95]
A COMPARATIVE STUDY OF TWO OPERATING SYSTEMS:
WINDOWS 7 AND WINDOWS 8
KALPANA GUPTA,
Jaipuria Institute,
(India)
BARKHA KAKKAR,
Jaipuria Institute,
(India)
VIVEK SEN SAXENA,
Integrated Academy of Management and Technology,
Ghaziabad -(India)
ABSTRACT
The paper is comprised on the comparative study of two Microsoft operating systems Windows 7
and Windows 8.
Our work in this paper is the study the features of Windows 7, the upside and downside of the
features, features of Windows 8, and a comparison of both the operating systems.
In the end of the paper we had concluded the merits and demerits of both the operating systems
on basis of our study and how Windows8 is better than Windows 7 and how different features of
Windows 8 are useful to users of different age groups and different requirements.
Keywords: Microsoft operating systems, Windows 7, Windows 8
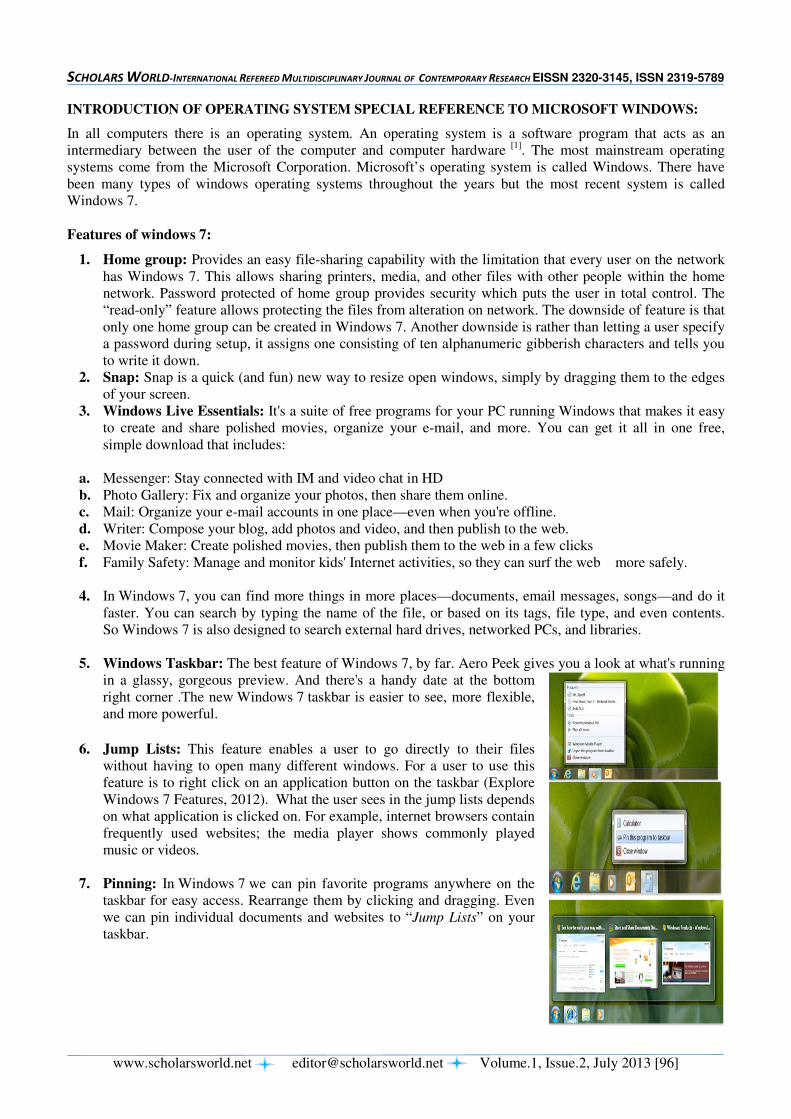
SCHOLARS WORLD-INTERNATIONAL REFEREED MULTIDISCIPLINARY JOURNAL OF CONTEMPORARY RESEARCH EISSN 2320-3145, ISSN 2319-5789
www.scholarsworld.net [email protected] Volume.1, Issue.2, July 2013 [96]
INTRODUCTION OF OPERATING SYSTEM SPECIAL REFERENCE TO MICROSOFT WINDOWS:
In all computers there is an operating system. An operating system is a software program that acts as an
intermediary between the user of the computer and computer hardware [1]
. The most mainstream operating
systems come from the Microsoft Corporation. Microsoft’s operating system is called Windows. There have
been many types of windows operating systems throughout the years but the most recent system is called
Windows 7.
Features of windows 7:
1. Home group: Provides an easy file-sharing capability with the limitation that every user on the network
has Windows 7. This allows sharing printers, media, and other files with other people within the home
network. Password protected of home group provides security which puts the user in total control. The
“read-only” feature allows protecting the files from alteration on network. The downside of feature is that
only one home group can be created in Windows 7. Another downside is rather than letting a user specify
a password during setup, it assigns one consisting of ten alphanumeric gibberish characters and tells you
to write it down.
2. Snap: Snap is a quick (and fun) new way to resize open windows, simply by dragging them to the edges
of your screen.
3. Windows Live Essentials: It's a suite of free programs for your PC running Windows that makes it easy
to create and share polished movies, organize your e-mail, and more. You can get it all in one free,
simple download that includes:
a. Messenger: Stay connected with IM and video chat in HD
b. Photo Gallery: Fix and organize your photos, then share them online.
c. Mail: Organize your e-mail accounts in one place—even when you're offline.
d. Writer: Compose your blog, add photos and video, and then publish to the web.
e. Movie Maker: Create polished movies, then publish them to the web in a few clicks
f. Family Safety: Manage and monitor kids' Internet activities, so they can surf the web more safely.
4. In Windows 7, you can find more things in more places—documents, email messages, songs—and do it
faster. You can search by typing the name of the file, or based on its tags, file type, and even contents.
So Windows 7 is also designed to search external hard drives, networked PCs, and libraries.
5. Windows Taskbar: The best feature of Windows 7, by far. Aero Peek gives you a look at what's running
in a glassy, gorgeous preview. And there's a handy date at the bottom
right corner .The new Windows 7 taskbar is easier to see, more flexible,
and more powerful.
6. Jump Lists: This feature enables a user to go directly to their files
without having to open many different windows. For a user to use this
feature is to right click on an application button on the taskbar (Explore
Windows 7 Features, 2012). What the user sees in the jump lists depends
on what application is clicked on. For example, internet browsers contain
frequently used websites; the media player shows commonly played
music or videos.
7. Pinning: In Windows 7 we can pin favorite programs anywhere on the
taskbar for easy access. Rearrange them by clicking and dragging. Even
we can pin individual documents and websites to “Jump Lists” on your
taskbar.
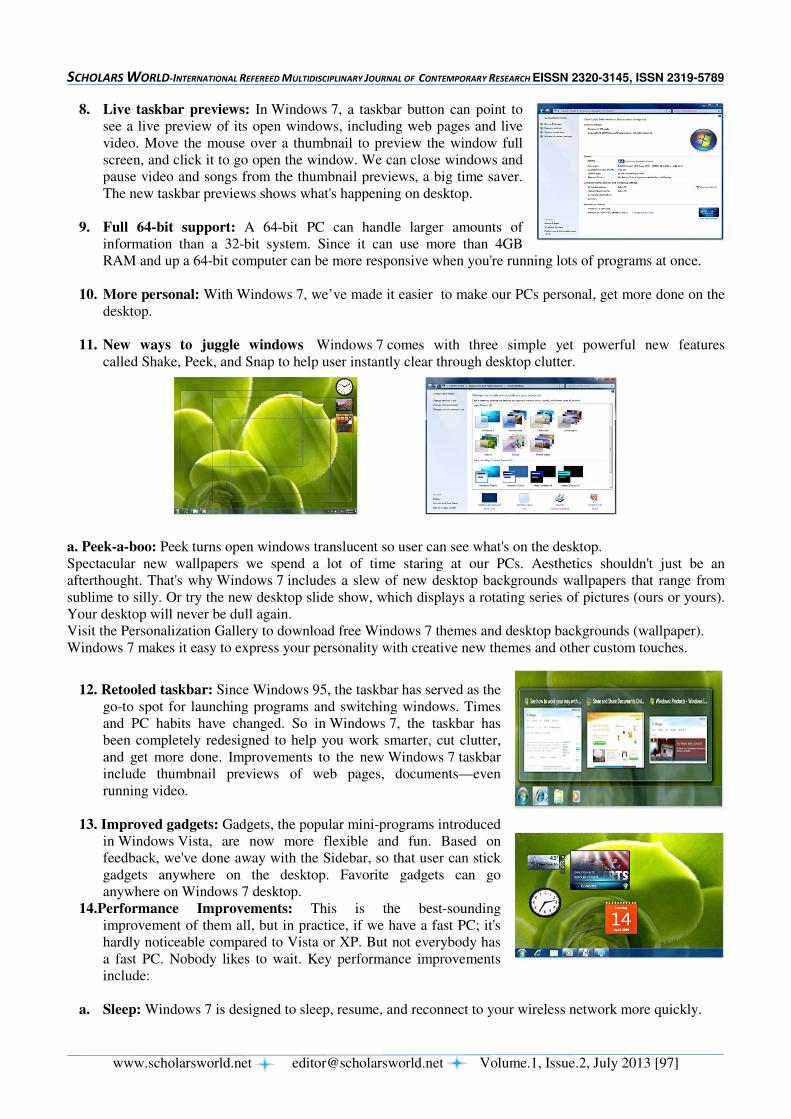
SCHOLARS WORLD-INTERNATIONAL REFEREED MULTIDISCIPLINARY JOURNAL OF CONTEMPORARY RESEARCH EISSN 2320-3145, ISSN 2319-5789
www.scholarsworld.net [email protected] Volume.1, Issue.2, July 2013 [97]
8. Live taskbar previews: In Windows 7, a taskbar button can point to
see a live preview of its open windows, including web pages and live
video. Move the mouse over a thumbnail to preview the window full
screen, and click it to go open the window. We can close windows and
pause video and songs from the thumbnail previews, a big time saver.
The new taskbar previews shows what's happening on desktop.
9. Full 64-bit support: A 64-bit PC can handle larger amounts of
information than a 32-bit system. Since it can use more than 4GB
RAM and up a 64-bit computer can be more responsive when you're running lots of programs at once.
10. More personal: With Windows 7, we’ve made it easier to make our PCs personal, get more done on the
desktop.
11. New ways to juggle windows Windows 7 comes with three simple yet powerful new features
called Shake, Peek, and Snap to help user instantly clear through desktop clutter.
a. Peek-a-boo: Peek turns open windows translucent so user can see what's on the desktop.
Spectacular new wallpapers we spend a lot of time staring at our PCs. Aesthetics shouldn't just be an
afterthought. That's why Windows 7 includes a slew of new desktop backgrounds wallpapers that range from
sublime to silly. Or try the new desktop slide show, which displays a rotating series of pictures (ours or yours).
Your desktop will never be dull again.
Visit the Personalization Gallery to download free Windows 7 themes and desktop backgrounds (wallpaper).
Windows 7 makes it easy to express your personality with creative new themes and other custom touches.
12. Retooled taskbar: Since Windows 95, the taskbar has served as the
go-to spot for launching programs and switching windows. Times
and PC habits have changed. So in Windows 7, the taskbar has
been completely redesigned to help you work smarter, cut clutter,
and get more done. Improvements to the new Windows 7 taskbar
include thumbnail previews of web pages, documents—even
running video.
13. Improved gadgets: Gadgets, the popular mini-programs introduced
in Windows Vista, are now more flexible and fun. Based on
feedback, we've done away with the Sidebar, so that user can stick
gadgets anywhere on the desktop. Favorite gadgets can go
anywhere on Windows 7 desktop.
14.Performance Improvements: This is the best-sounding
improvement of them all, but in practice, if we have a fast PC; it's
hardly noticeable compared to Vista or XP. But not everybody has
a fast PC. Nobody likes to wait. Key performance improvements
include:
a. Sleep: Windows 7 is designed to sleep, resume, and reconnect to your wireless network more quickly.
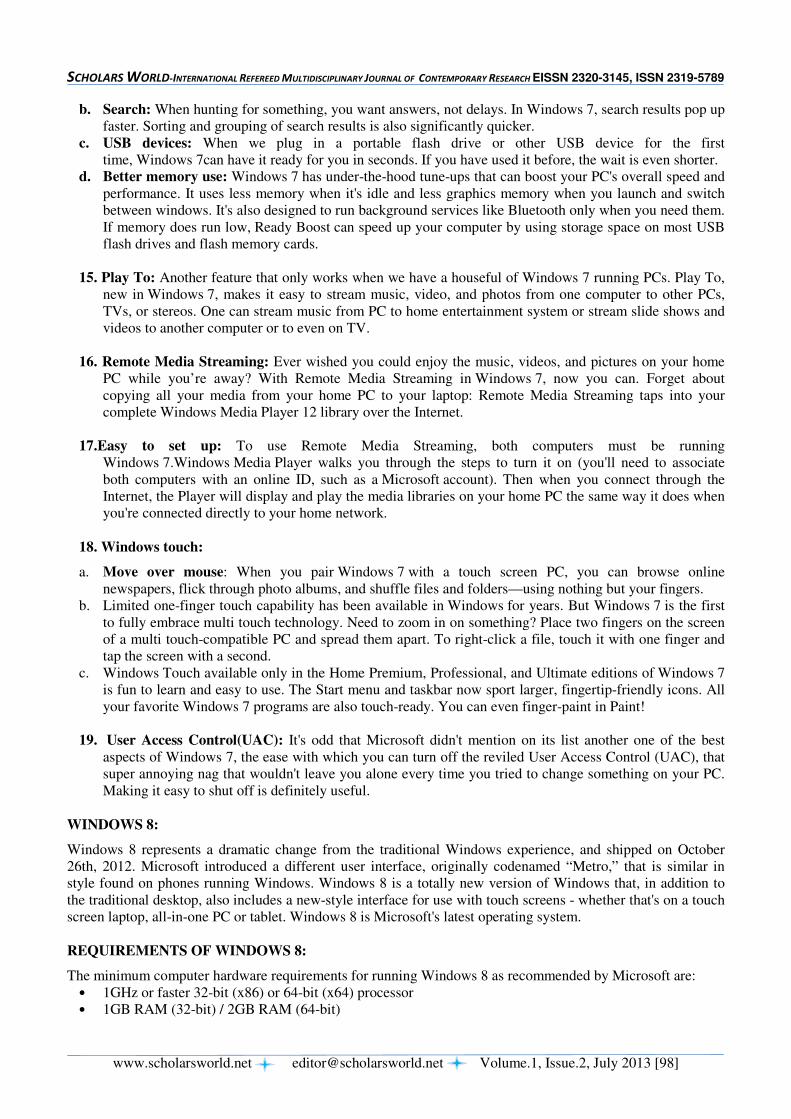
SCHOLARS WORLD-INTERNATIONAL REFEREED MULTIDISCIPLINARY JOURNAL OF CONTEMPORARY RESEARCH EISSN 2320-3145, ISSN 2319-5789
www.scholarsworld.net [email protected] Volume.1, Issue.2, July 2013 [98]
b. Search: When hunting for something, you want answers, not delays. In Windows 7, search results pop up
faster. Sorting and grouping of search results is also significantly quicker.
c. USB devices: When we plug in a portable flash drive or other USB device for the first
time, Windows 7can have it ready for you in seconds. If you have used it before, the wait is even shorter.
d. Better memory use: Windows 7 has under-the-hood tune-ups that can boost your PC's overall speed and
performance. It uses less memory when it's idle and less graphics memory when you launch and switch
between windows. It's also designed to run background services like Bluetooth only when you need them.
If memory does run low, Ready Boost can speed up your computer by using storage space on most USB
flash drives and flash memory cards.
15. Play To: Another feature that only works when we have a houseful of Windows 7 running PCs. Play To,
new in Windows 7, makes it easy to stream music, video, and photos from one computer to other PCs,
TVs, or stereos. One can stream music from PC to home entertainment system or stream slide shows and
videos to another computer or to even on TV.
16. Remote Media Streaming: Ever wished you could enjoy the music, videos, and pictures on your home
PC while you’re away? With Remote Media Streaming in Windows 7, now you can. Forget about
copying all your media from your home PC to your laptop: Remote Media Streaming taps into your
complete Windows Media Player 12 library over the Internet.
17.Easy to set up: To use Remote Media Streaming, both computers must be running
Windows 7.Windows Media Player walks you through the steps to turn it on (you'll need to associate
both computers with an online ID, such as a Microsoft account). Then when you connect through the
Internet, the Player will display and play the media libraries on your home PC the same way it does when
you're connected directly to your home network.
18. Windows touch:
a. Move over mouse: When you pair Windows 7 with a touch screen PC, you can browse online
newspapers, flick through photo albums, and shuffle files and folders—using nothing but your fingers.
b. Limited one-finger touch capability has been available in Windows for years. But Windows 7 is the first
to fully embrace multi touch technology. Need to zoom in on something? Place two fingers on the screen
of a multi touch-compatible PC and spread them apart. To right-click a file, touch it with one finger and
tap the screen with a second.
c. Windows Touch available only in the Home Premium, Professional, and Ultimate editions of Windows 7
is fun to learn and easy to use. The Start menu and taskbar now sport larger, fingertip-friendly icons. All
your favorite Windows 7 programs are also touch-ready. You can even finger-paint in Paint!
19. User Access Control(UAC): It's odd that Microsoft didn't mention on its list another one of the best
aspects of Windows 7, the ease with which you can turn off the reviled User Access Control (UAC), that
super annoying nag that wouldn't leave you alone every time you tried to change something on your PC.
Making it easy to shut off is definitely useful.
WINDOWS 8:
Windows 8 represents a dramatic change from the traditional Windows experience, and shipped on October
26th, 2012. Microsoft introduced a different user interface, originally codenamed “Metro,” that is similar in
style found on phones running Windows. Windows 8 is a totally new version of Windows that, in addition to
the traditional desktop, also includes a new-style interface for use with touch screens - whether that's on a touch
screen laptop, all-in-one PC or tablet. Windows 8 is Microsoft's latest operating system.
REQUIREMENTS OF WINDOWS 8:
The minimum computer hardware requirements for running Windows 8 as recommended by Microsoft are:
• 1GHz or faster 32-bit (x86) or 64-bit (x64) processor
• 1GB RAM (32-bit) / 2GB RAM (64-bit)
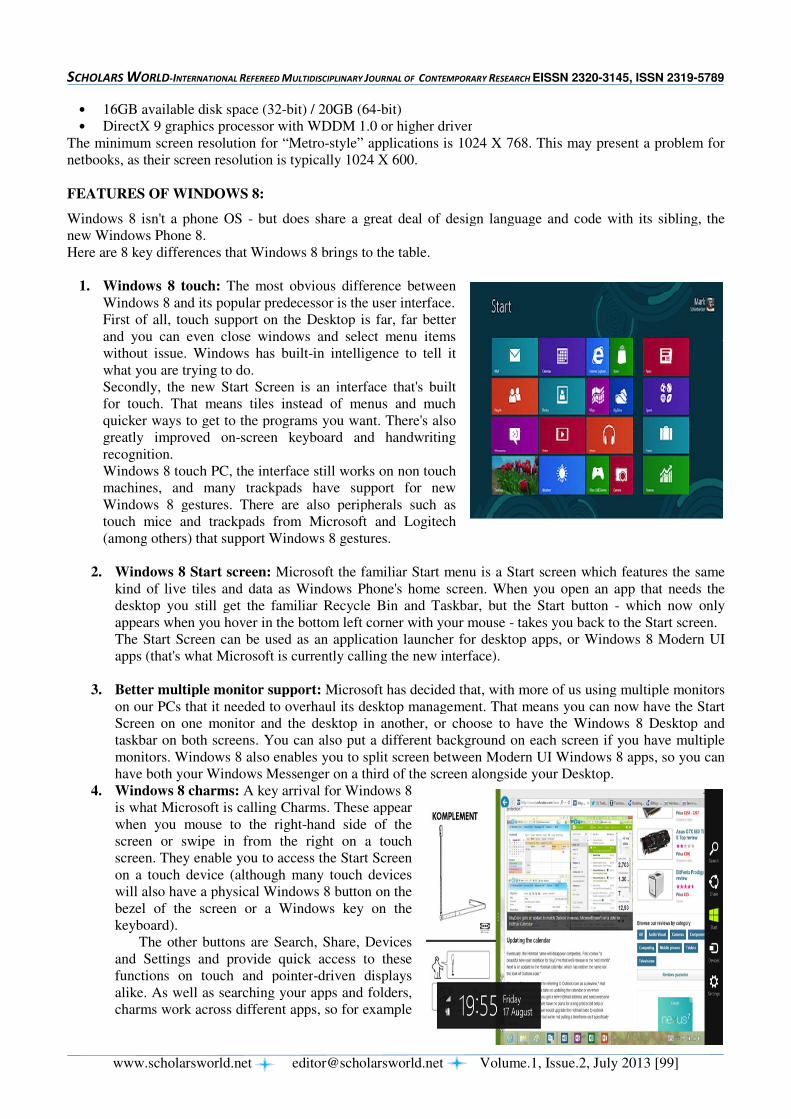
SCHOLARS WORLD-INTERNATIONAL REFEREED M
www.scholarsworld.net
• 16GB available disk space (32-
• DirectX 9 graphics processor with WDDM 1.0 or higher driver
The minimum screen resolution for “Metro
netbooks, as their screen resolution is typically 1024 X 600.
FEATURES OF WINDOWS 8:
Windows 8 isn't a phone OS - but does share a great deal of design language and code with its sibling, the
new Windows Phone 8.
Here are 8 key differences that Windows 8 brings to the table.
1. Windows 8 touch: The most obvious
Windows 8 and its popular predecessor is the user interface.
First of all, touch support on the Desktop is far, far better
and you can even close windows and select menu items
without issue. Windows has built
what you are trying to do.
Secondly, the new Start Screen is an interface that's built
for touch. That means tiles instead of menus and much
quicker ways to get to the programs you want. There's also
greatly improved on-screen keyboard and handwriting
recognition.
Windows 8 touch PC, the interface still works on non touch
machines, and many trackpads have support for new
Windows 8 gestures. There are also peripherals such as
touch mice and trackpads from Microsoft and Logitech
(among others) that support Win
2. Windows 8 Start screen: Microsoft the familiar Start menu is a Start screen which features the same
kind of live tiles and data as Windows Phone's home screen. When you open an app that needs the
desktop you still get the familiar Recycle
appears when you hover in the bottom left corner with your mouse
The Start Screen can be used as an application launcher for desktop apps, or Windows 8 Modern UI
apps (that's what Microsoft is currently calling the new interface).
3. Better multiple monitor support:
on our PCs that it needed to overhaul its desktop management. That means you can now
Screen on one monitor and the desktop in another, or choose to have the Windows 8 Desktop and
taskbar on both screens. You can also put a different background on each screen if you have multiple
monitors. Windows 8 also enables you to split
have both your Windows Messenger on a third of the screen alongside your Desktop.
4. Windows 8 charms: A key arrival for Windows 8
is what Microsoft is calling Charms. These appear
when you mouse to the right
screen or swipe in from the right on a touch
screen. They enable you to access the Start Screen
on a touch device (although many touch devices
will also have a physical Windows 8 button on the
bezel of the screen or a Windows key on
keyboard).
The other buttons are Search, Share, Devices
and Settings and provide quick access to these
functions on touch and pointer
alike. As well as searching your apps and folders,
charms work across different apps, so for example
MULTIDISCIPLINARY JOURNAL OF CONTEMPORARY RESEARCH EISSN 2320
[email protected] Volume.1, Issue.2,
-bit) / 20GB (64-bit)
DirectX 9 graphics processor with WDDM 1.0 or higher driver
The minimum screen resolution for “Metro-style” applications is 1024 X 768. This may present a problem for
netbooks, as their screen resolution is typically 1024 X 600.
but does share a great deal of design language and code with its sibling, the
Here are 8 key differences that Windows 8 brings to the table.
The most obvious difference between
Windows 8 and its popular predecessor is the user interface.
First of all, touch support on the Desktop is far, far better
and you can even close windows and select menu items
without issue. Windows has built-in intelligence to tell it
Secondly, the new Start Screen is an interface that's built
for touch. That means tiles instead of menus and much
quicker ways to get to the programs you want. There's also
screen keyboard and handwriting
Windows 8 touch PC, the interface still works on non touch
machines, and many trackpads have support for new
Windows 8 gestures. There are also peripherals such as
touch mice and trackpads from Microsoft and Logitech
(among others) that support Windows 8 gestures.
Microsoft the familiar Start menu is a Start screen which features the same
kind of live tiles and data as Windows Phone's home screen. When you open an app that needs the
desktop you still get the familiar Recycle Bin and Taskbar, but the Start button
appears when you hover in the bottom left corner with your mouse - takes you back to the Start screen.
The Start Screen can be used as an application launcher for desktop apps, or Windows 8 Modern UI
apps (that's what Microsoft is currently calling the new interface).
Better multiple monitor support: Microsoft has decided that, with more of us using multiple monitors
on our PCs that it needed to overhaul its desktop management. That means you can now
Screen on one monitor and the desktop in another, or choose to have the Windows 8 Desktop and
taskbar on both screens. You can also put a different background on each screen if you have multiple
monitors. Windows 8 also enables you to split screen between Modern UI Windows 8 apps, so you can
have both your Windows Messenger on a third of the screen alongside your Desktop.
A key arrival for Windows 8
is what Microsoft is calling Charms. These appear
right-hand side of the
screen or swipe in from the right on a touch
screen. They enable you to access the Start Screen
on a touch device (although many touch devices
will also have a physical Windows 8 button on the
bezel of the screen or a Windows key on the
The other buttons are Search, Share, Devices
and Settings and provide quick access to these
functions on touch and pointer-driven displays
alike. As well as searching your apps and folders,
charms work across different apps, so for example
EISSN 2320-3145, ISSN 2319-5789
Volume.1, Issue.2, July 2013 [99]
style” applications is 1024 X 768. This may present a problem for
but does share a great deal of design language and code with its sibling, the
Microsoft the familiar Start menu is a Start screen which features the same
kind of live tiles and data as Windows Phone's home screen. When you open an app that needs the
Bin and Taskbar, but the Start button - which now only
takes you back to the Start screen.
The Start Screen can be used as an application launcher for desktop apps, or Windows 8 Modern UI
Microsoft has decided that, with more of us using multiple monitors
on our PCs that it needed to overhaul its desktop management. That means you can now have the Start
Screen on one monitor and the desktop in another, or choose to have the Windows 8 Desktop and
taskbar on both screens. You can also put a different background on each screen if you have multiple
screen between Modern UI Windows 8 apps, so you can
have both your Windows Messenger on a third of the screen alongside your Desktop.
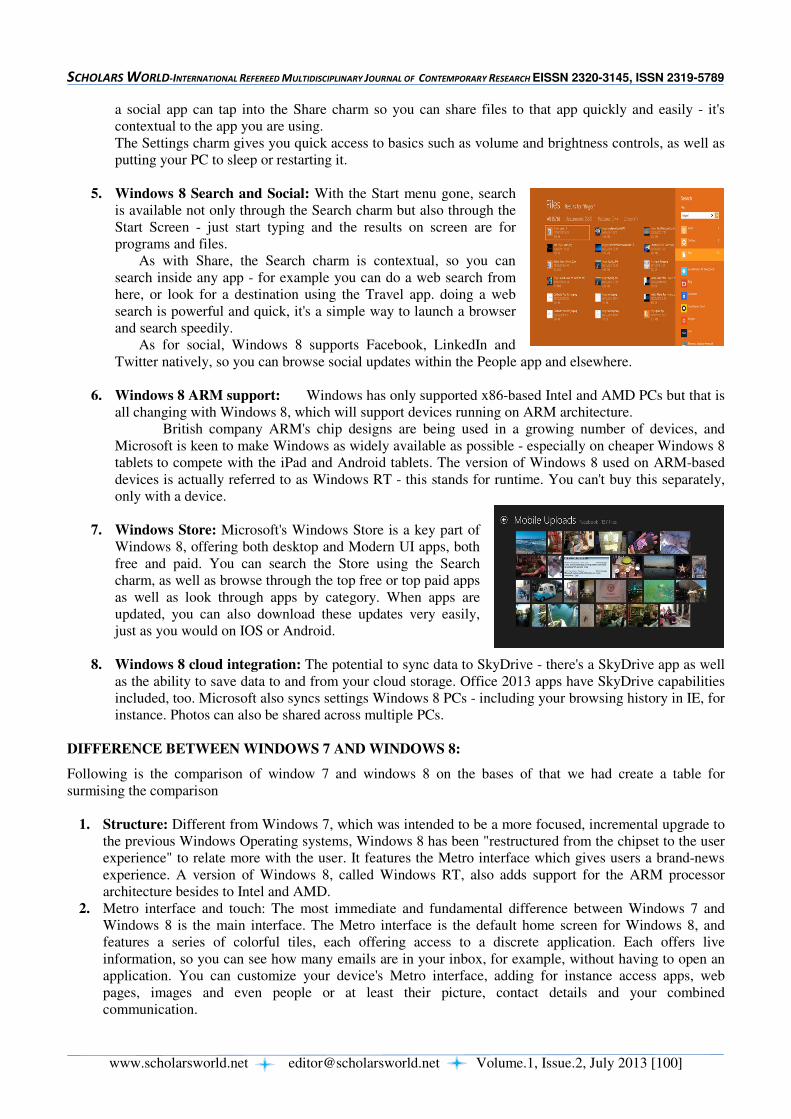
SCHOLARS WORLD-INTERNATIONAL REFEREED MULTIDISCIPLINARY JOURNAL OF CONTEMPORARY RESEARCH EISSN 2320-3145, ISSN 2319-5789
www.scholarsworld.net [email protected] Volume.1, Issue.2, July 2013 [100]
a social app can tap into the Share charm so you can share files to that app quickly and easily - it's
contextual to the app you are using.
The Settings charm gives you quick access to basics such as volume and brightness controls, as well as
putting your PC to sleep or restarting it.
5. Windows 8 Search and Social: With the Start menu gone, search
is available not only through the Search charm but also through the
Start Screen - just start typing and the results on screen are for
programs and files.
As with Share, the Search charm is contextual, so you can
search inside any app - for example you can do a web search from
here, or look for a destination using the Travel app. doing a web
search is powerful and quick, it's a simple way to launch a browser
and search speedily.
As for social, Windows 8 supports Facebook, LinkedIn and
Twitter natively, so you can browse social updates within the People app and elsewhere.
6. Windows 8 ARM support: Windows has only supported x86-based Intel and AMD PCs but that is
all changing with Windows 8, which will support devices running on ARM architecture.
British company ARM's chip designs are being used in a growing number of devices, and
Microsoft is keen to make Windows as widely available as possible - especially on cheaper Windows 8
tablets to compete with the iPad and Android tablets. The version of Windows 8 used on ARM-based
devices is actually referred to as Windows RT - this stands for runtime. You can't buy this separately,
only with a device.
7. Windows Store: Microsoft's Windows Store is a key part of
Windows 8, offering both desktop and Modern UI apps, both
free and paid. You can search the Store using the Search
charm, as well as browse through the top free or top paid apps
as well as look through apps by category. When apps are
updated, you can also download these updates very easily,
just as you would on IOS or Android.
8. Windows 8 cloud integration: The potential to sync data to SkyDrive - there's a SkyDrive app as well
as the ability to save data to and from your cloud storage. Office 2013 apps have SkyDrive capabilities
included, too. Microsoft also syncs settings Windows 8 PCs - including your browsing history in IE, for
instance. Photos can also be shared across multiple PCs.
DIFFERENCE BETWEEN WINDOWS 7 AND WINDOWS 8:
Following is the comparison of window 7 and windows 8 on the bases of that we had create a table for
surmising the comparison
1. Structure: Different from Windows 7, which was intended to be a more focused, incremental upgrade to
the previous Windows Operating systems, Windows 8 has been "restructured from the chipset to the user
experience" to relate more with the user. It features the Metro interface which gives users a brand-news
experience. A version of Windows 8, called Windows RT, also adds support for the ARM processor
architecture besides to Intel and AMD.
2. Metro interface and touch: The most immediate and fundamental difference between Windows 7 and
Windows 8 is the main interface. The Metro interface is the default home screen for Windows 8, and
features a series of colorful tiles, each offering access to a discrete application. Each offers live
information, so you can see how many emails are in your inbox, for example, without having to open an
application. You can customize your device's Metro interface, adding for instance access apps, web
pages, images and even people or at least their picture, contact details and your combined
communication.
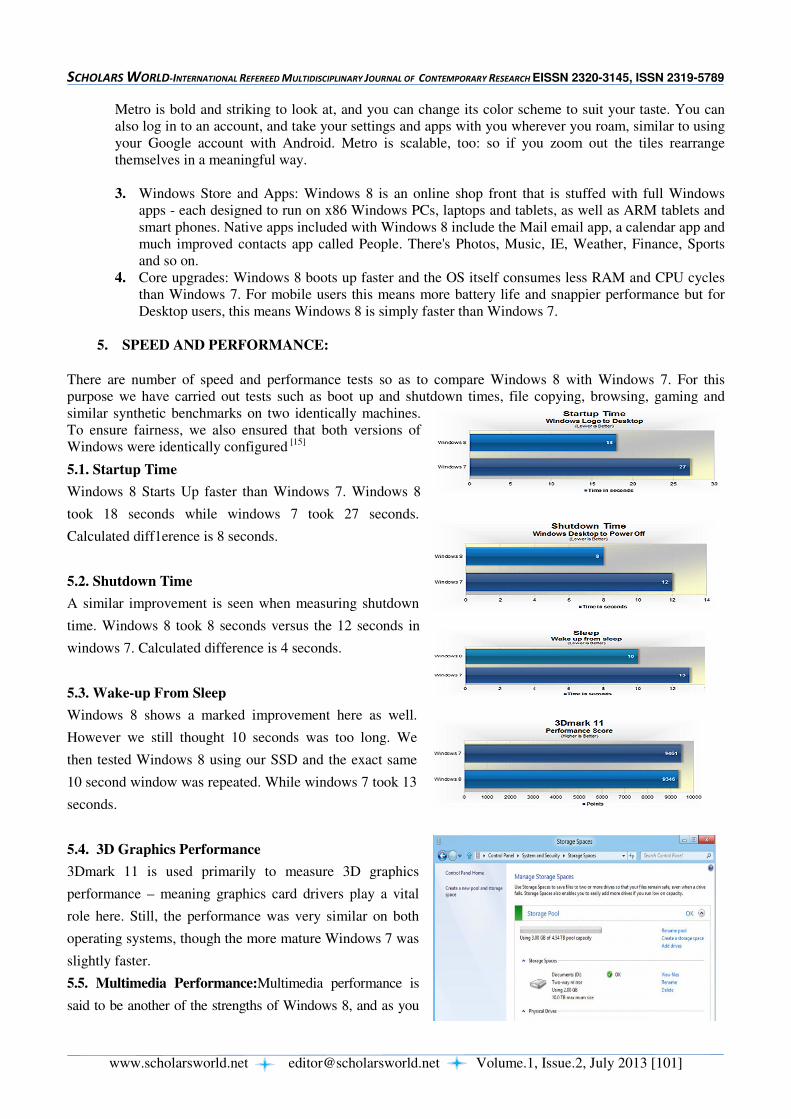
SCHOLARS WORLD-INTERNATIONAL REFEREED MULTIDISCIPLINARY JOURNAL OF CONTEMPORARY RESEARCH EISSN 2320-3145, ISSN 2319-5789
www.scholarsworld.net [email protected] Volume.1, Issue.2, July 2013 [101]
Metro is bold and striking to look at, and you can change its color scheme to suit your taste. You can
also log in to an account, and take your settings and apps with you wherever you roam, similar to using
your Google account with Android. Metro is scalable, too: so if you zoom out the tiles rearrange
themselves in a meaningful way.
3. Windows Store and Apps: Windows 8 is an online shop front that is stuffed with full Windows
apps - each designed to run on x86 Windows PCs, laptops and tablets, as well as ARM tablets and
smart phones. Native apps included with Windows 8 include the Mail email app, a calendar app and
much improved contacts app called People. There's Photos, Music, IE, Weather, Finance, Sports
and so on.
4. Core upgrades: Windows 8 boots up faster and the OS itself consumes less RAM and CPU cycles
than Windows 7. For mobile users this means more battery life and snappier performance but for
Desktop users, this means Windows 8 is simply faster than Windows 7.
5. SPEED AND PERFORMANCE:
There are number of speed and performance tests so as to compare Windows 8 with Windows 7. For this
purpose we have carried out tests such as boot up and shutdown times, file copying, browsing, gaming and
similar synthetic benchmarks on two identically machines.
To ensure fairness, we also ensured that both versions of
Windows were identically configured [15]
5.1. Startup Time
Windows 8 Starts Up faster than Windows 7. Windows 8
took 18 seconds while windows 7 took 27 seconds.
Calculated diff1erence is 8 seconds.
5.2. Shutdown Time
A similar improvement is seen when measuring shutdown
time. Windows 8 took 8 seconds versus the 12 seconds in
windows 7. Calculated difference is 4 seconds.
5.3. Wake-up From Sleep
Windows 8 shows a marked improvement here as well.
However we still thought 10 seconds was too long. We
then tested Windows 8 using our SSD and the exact same
10 second window was repeated. While windows 7 took 13
seconds.
5.4. 3D Graphics Performance
3Dmark 11 is used primarily to measure 3D graphics
performance – meaning graphics card drivers play a vital
role here. Still, the performance was very similar on both
operating systems, though the more mature Windows 7 was
slightly faster.
5.5. Multimedia Performance:Multimedia performance is
said to be another of the strengths of Windows 8, and as you

SCHOLARS WORLD-INTERNATIONAL REFEREED MULTIDISCIPLINARY JOURNAL OF CONTEMPORARY RESEARCH EISSN 2320-3145, ISSN 2319-5789
www.scholarsworld.net [email protected] Volume.1, Issue.2, July 2013 [102]
can see when testing with PCmark 7, it was 9% faster than its predecessor.
5.6. Microsoft Excel
Comparing Windows 8 armed with the new Office 2013 suite we found that it was 10% faster when running our
Excel test against Windows 7 using Office 2010. Even when
comparing apples to apples, with both operating systems running
Excel 2010, Windows 8 is more efficient using the CPU cycles to
its benefit on simulation.
5.7. Transferring Multiple Large Files Together Windows 8 features a new Explorer interface for transferring
files, which provides more accurate data on transfer speeds and
estimated time of completion. It also stacks multiple transfer
windows together. The user interface is awesome, but on the
performance side of things there is little difference when
transferring multiple large files together or individually.
Windows 8 and Windows 7 deliver similar performance in both
situations.
5.8. Transferring Multiple Smaller Files Together
When transferring thousands of smaller files we also found that
Windows 7 and Windows 8 offer the same performance.
5.9. Different Browsers with Windows 7 and Windows 8
As you can see, the desktop version of the IE10 browsers on
Windows 8 delivered virtually the same performance as IE9 on
Windows 7. Chrome works better in Windows 8 in comparison
with Firefox running on identical Windows 8 computer. Also
both Mozilla Firefox and Google Chrome perform faster in
Windows 8 than Windows 7. Internet Explorer works very slowly
in all versions of windows.
5.10. Gaming Performance:
By testing these two performance intensive games on both
systems we noticed that both operating systems provide similar
performance with a very slight edge to Windows 7′s advantage:
Battlefield 3
Looking at the gaming performance for Battlefield 3, it can be
observed that both operating systems provide similar performance
with a very slight leading edge for Windows 7.
Just Cause 2: Just Cause 2 runs just a bit faster on windows 7 than
Windows 8 for both resolutions 1680×1050 and 1920×1200. The
difference is not significant however. Similar to the previous
3DMark test, this relies on graphics drivers more than anything
else.
6. Security: Due to the inclusion of UEFI (which is basically
like a very light-weight operating system that then loads
Windows), there is also a boot-level malware scanner that
will prevent your computer from booting if a USB thumb
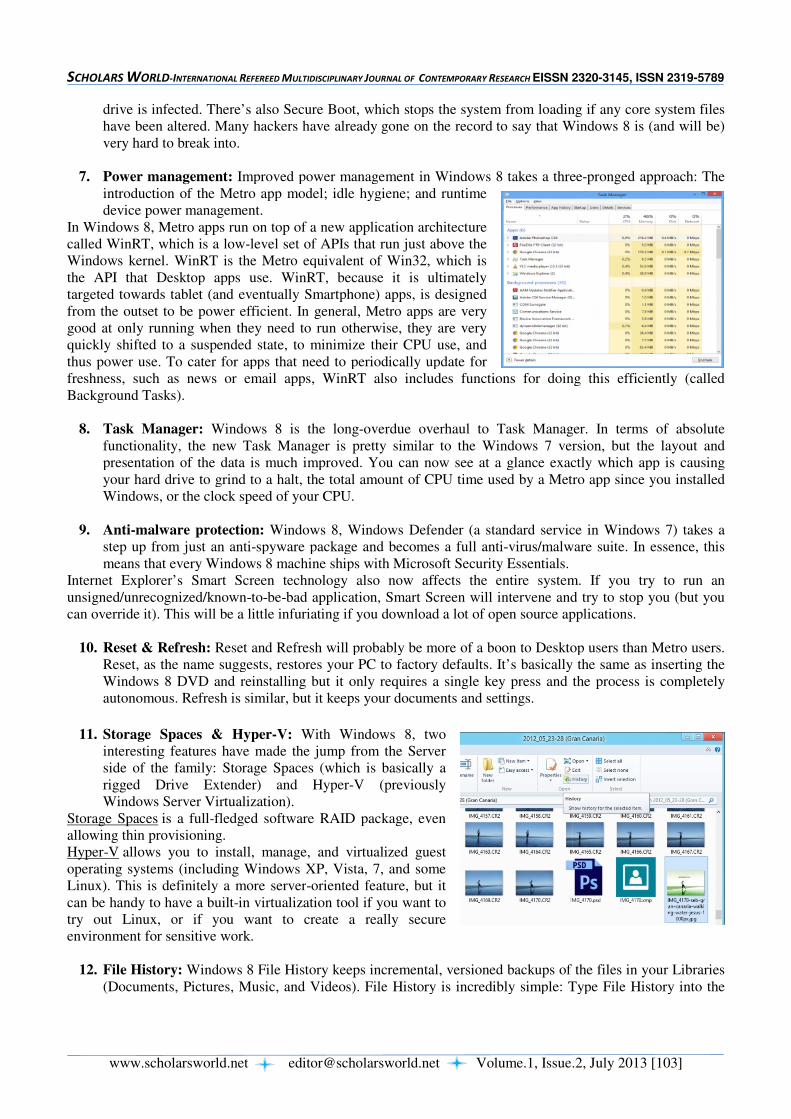
SCHOLARS WORLD-INTERNATIONAL REFEREED M
www.scholarsworld.net
drive is infected. There’s also Secu
have been altered. Many hackers have already
very hard to break into.
7. Power management: Improved power management in Windows 8 takes a three
introduction of the Metro app model; idle hygiene; and runtime
device power management.
In Windows 8, Metro apps run on top of a new application
called WinRT, which is a low-level set of APIs that run just above the
Windows kernel. WinRT is the Metro equivalent of Win32, which is
the API that Desktop apps use. WinRT, because it is ultimately
targeted towards tablet (and eventually Smar
from the outset to be power efficient. In general, Metro apps are very
good at only running when they need to run otherwise, they are very
quickly shifted to a suspended state, to minimize their CPU use, and
thus power use. To cater for apps that need to periodically update for
freshness, such as news or email apps, WinRT also includes functions for doing this efficiently (called
Background Tasks).
8. Task Manager: Windows 8 is the long
functionality, the new Task Manager is pretty similar to the Windows 7 version, but the layout and
presentation of the data is much improved. You can now see at a glance exactly which app is causing
your hard drive to grind to a halt, the total amo
Windows, or the clock speed of your CPU.
9. Anti-malware protection: Windows 8, Windows Defender (a standard service in Windows 7) takes a
step up from just an anti-spyware package and becomes a full an
means that every Windows 8 machine ships with Microsoft Security Essentials.
Internet Explorer’s Smart Screen technology also now affects the entire system. If you try to run an
unsigned/unrecognized/known-to-be-
can override it). This will be a little infuriating if you download a lot of open source applications.
10. Reset & Refresh: Reset and Refresh will probably be more of a boon to Desktop use
Reset, as the name suggests, restores your PC to factory defaults. It’s basically the same as inserting the
Windows 8 DVD and reinstalling but it only requires a single key press and the process is completely
autonomous. Refresh is similar, but it keeps your documents and settings.
11. Storage Spaces & Hyper-V:
interesting features have made the jump from the Server
side of the family: Storage Spaces (which is basically a
rigged Drive Extender) and Hyper
Windows Server Virtualization).
Storage Spaces is a full-fledged software RAID package, even
allowing thin provisioning.
Hyper-V allows you to install, manage, and virtualized guest
operating systems (including Windows XP, Vista, 7, and some
Linux). This is definitely a more server
can be handy to have a built-in virtualization tool if you want to
try out Linux, or if you want to create a really secure
environment for sensitive work.
12. File History: Windows 8 File History keeps incremental, versioned backups of the files in your Libraries
(Documents, Pictures, Music, and Videos). File History is incredibly simple: Type File History into the
MULTIDISCIPLINARY JOURNAL OF CONTEMPORARY RESEARCH EISSN 2320
[email protected] Volume.1, Issue.2,
drive is infected. There’s also Secure Boot, which stops the system from loading if any core system files
have been altered. Many hackers have already gone on the record to say that Windows 8 is (and will be)
Improved power management in Windows 8 takes a three
introduction of the Metro app model; idle hygiene; and runtime
In Windows 8, Metro apps run on top of a new application architecture
level set of APIs that run just above the
Windows kernel. WinRT is the Metro equivalent of Win32, which is
the API that Desktop apps use. WinRT, because it is ultimately
targeted towards tablet (and eventually Smartphone) apps, is designed
from the outset to be power efficient. In general, Metro apps are very
good at only running when they need to run otherwise, they are very
quickly shifted to a suspended state, to minimize their CPU use, and
er for apps that need to periodically update for
freshness, such as news or email apps, WinRT also includes functions for doing this efficiently (called
Windows 8 is the long-overdue overhaul to Task Manager. In terms of a
functionality, the new Task Manager is pretty similar to the Windows 7 version, but the layout and
presentation of the data is much improved. You can now see at a glance exactly which app is causing
your hard drive to grind to a halt, the total amount of CPU time used by a Metro app since you installed
Windows, or the clock speed of your CPU.
Windows 8, Windows Defender (a standard service in Windows 7) takes a
spyware package and becomes a full anti-virus/malware suite. In essence, this
means that every Windows 8 machine ships with Microsoft Security Essentials.
Internet Explorer’s Smart Screen technology also now affects the entire system. If you try to run an
bad application, Smart Screen will intervene and try to stop you (but you
can override it). This will be a little infuriating if you download a lot of open source applications.
Reset and Refresh will probably be more of a boon to Desktop use
Reset, as the name suggests, restores your PC to factory defaults. It’s basically the same as inserting the
Windows 8 DVD and reinstalling but it only requires a single key press and the process is completely
ilar, but it keeps your documents and settings.
V: With Windows 8, two
interesting features have made the jump from the Server
side of the family: Storage Spaces (which is basically a
rigged Drive Extender) and Hyper-V (previously
Windows Server Virtualization).
fledged software RAID package, even
allows you to install, manage, and virtualized guest
operating systems (including Windows XP, Vista, 7, and some
inux). This is definitely a more server-oriented feature, but it
in virtualization tool if you want to
try out Linux, or if you want to create a really secure
Windows 8 File History keeps incremental, versioned backups of the files in your Libraries
(Documents, Pictures, Music, and Videos). File History is incredibly simple: Type File History into the
EISSN 2320-3145, ISSN 2319-5789
Volume.1, Issue.2, July 2013 [103]
re Boot, which stops the system from loading if any core system files
to say that Windows 8 is (and will be)
Improved power management in Windows 8 takes a three-pronged approach: The
freshness, such as news or email apps, WinRT also includes functions for doing this efficiently (called
overdue overhaul to Task Manager. In terms of absolute
functionality, the new Task Manager is pretty similar to the Windows 7 version, but the layout and
presentation of the data is much improved. You can now see at a glance exactly which app is causing
unt of CPU time used by a Metro app since you installed
Windows 8, Windows Defender (a standard service in Windows 7) takes a
virus/malware suite. In essence, this
Internet Explorer’s Smart Screen technology also now affects the entire system. If you try to run an
application, Smart Screen will intervene and try to stop you (but you
can override it). This will be a little infuriating if you download a lot of open source applications.
Reset and Refresh will probably be more of a boon to Desktop users than Metro users.
Reset, as the name suggests, restores your PC to factory defaults. It’s basically the same as inserting the
Windows 8 DVD and reinstalling but it only requires a single key press and the process is completely
Windows 8 File History keeps incremental, versioned backups of the files in your Libraries
(Documents, Pictures, Music, and Videos). File History is incredibly simple: Type File History into the
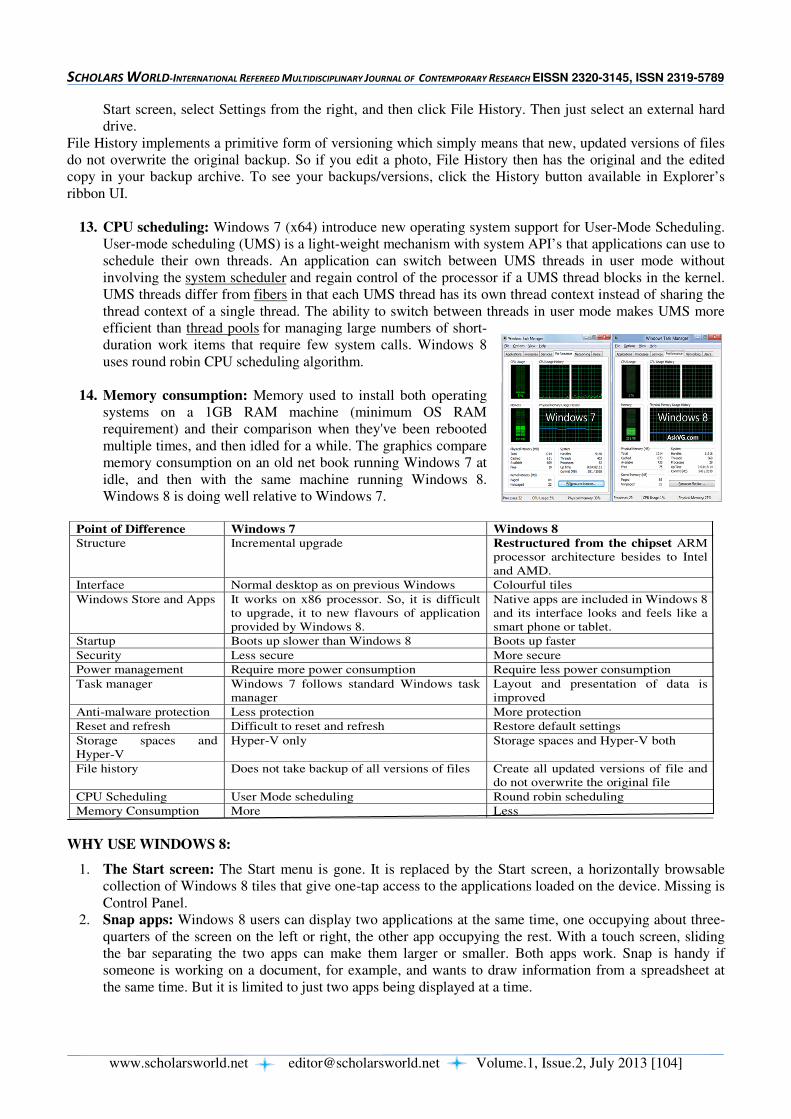
SCHOLARS WORLD-INTERNATIONAL REFEREED MULTIDISCIPLINARY JOURNAL OF CONTEMPORARY RESEARCH EISSN 2320-3145, ISSN 2319-5789
www.scholarsworld.net [email protected] Volume.1, Issue.2, July 2013 [104]
Start screen, select Settings from the right, and then click File History. Then just select an external hard
drive.
File History implements a primitive form of versioning which simply means that new, updated versions of files
do not overwrite the original backup. So if you edit a photo, File History then has the original and the edited
copy in your backup archive. To see your backups/versions, click the History button available in Explorer’s
ribbon UI.
13. CPU scheduling: Windows 7 (x64) introduce new operating system support for User-Mode Scheduling.
User-mode scheduling (UMS) is a light-weight mechanism with system API’s that applications can use to
schedule their own threads. An application can switch between UMS threads in user mode without
involving the system scheduler and regain control of the processor if a UMS thread blocks in the kernel.
UMS threads differ from fibers in that each UMS thread has its own thread context instead of sharing the
thread context of a single thread. The ability to switch between threads in user mode makes UMS more
efficient than thread pools for managing large numbers of short-
duration work items that require few system calls. Windows 8
uses round robin CPU scheduling algorithm.
14. Memory consumption: Memory used to install both operating
systems on a 1GB RAM machine (minimum OS RAM
requirement) and their comparison when they've been rebooted
multiple times, and then idled for a while. The graphics compare
memory consumption on an old net book running Windows 7 at
idle, and then with the same machine running Windows 8.
Windows 8 is doing well relative to Windows 7.
WHY USE WINDOWS 8:
1. The Start screen: The Start menu is gone. It is replaced by the Start screen, a horizontally browsable
collection of Windows 8 tiles that give one-tap access to the applications loaded on the device. Missing is
Control Panel.
2. Snap apps: Windows 8 users can display two applications at the same time, one occupying about three-
quarters of the screen on the left or right, the other app occupying the rest. With a touch screen, sliding
the bar separating the two apps can make them larger or smaller. Both apps work. Snap is handy if
someone is working on a document, for example, and wants to draw information from a spreadsheet at
the same time. But it is limited to just two apps being displayed at a time.
Point of Difference Windows 7 Windows 8
Structure Incremental upgrade Restructured from the chipset ARM
processor architecture besides to Intel
and AMD.
Interface Normal desktop as on previous Windows Colourful tiles
Windows Store and Apps It works on x86 processor. So, it is difficult
to upgrade, it to new flavours of application
provided by Windows 8.
Native apps are included in Windows 8
and its interface looks and feels like a
smart phone or tablet.
Startup Boots up slower than Windows 8 Boots up faster
Security Less secure More secure
Power management Require more power consumption Require less power consumption
Task manager Windows 7 follows standard Windows task
manager
Layout and presentation of data is
improved
Anti-malware protection Less protection More protection
Reset and refresh Difficult to reset and refresh Restore default settings
Storage spaces and
Hyper-V
Hyper-V only Storage spaces and Hyper-V both
File history Does not take backup of all versions of files Create all updated versions of file and
do not overwrite the original file
CPU Scheduling User Mode scheduling Round robin scheduling
Memory Consumption More Less
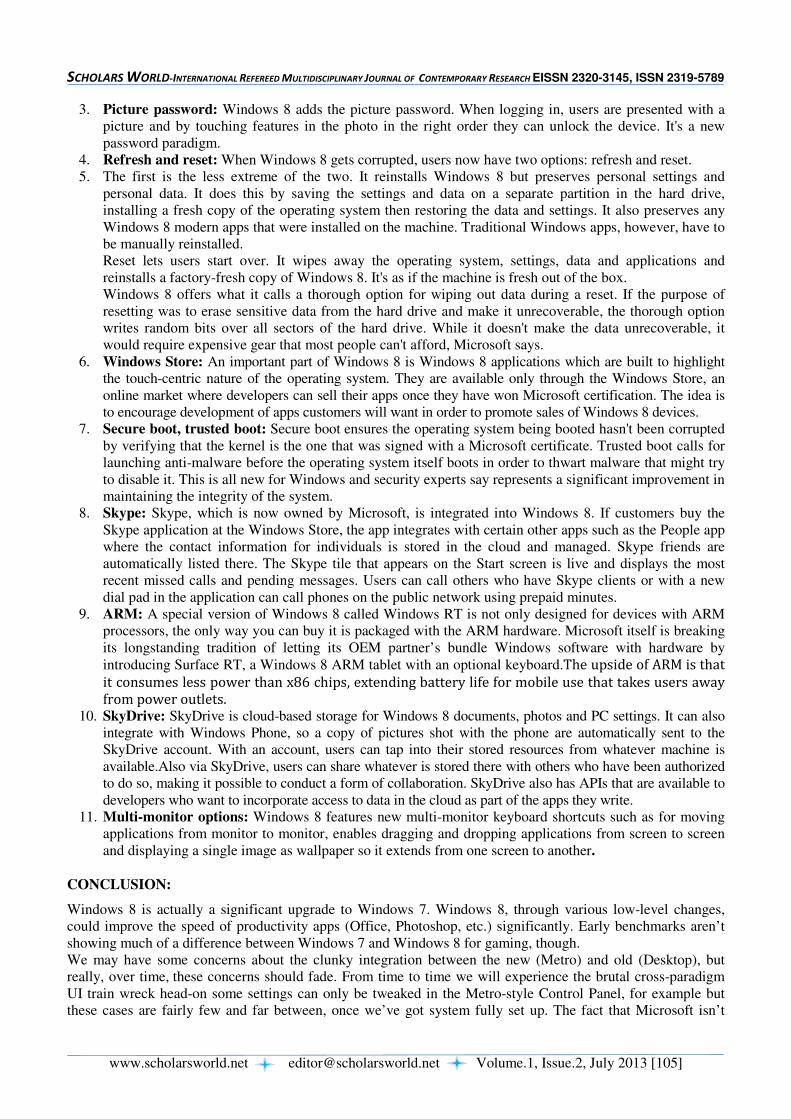
SCHOLARS WORLD-INTERNATIONAL REFEREED MULTIDISCIPLINARY JOURNAL OF CONTEMPORARY RESEARCH EISSN 2320-3145, ISSN 2319-5789
www.scholarsworld.net [email protected] Volume.1, Issue.2, July 2013 [105]
3. Picture password: Windows 8 adds the picture password. When logging in, users are presented with a
picture and by touching features in the photo in the right order they can unlock the device. It's a new
password paradigm.
4. Refresh and reset: When Windows 8 gets corrupted, users now have two options: refresh and reset.
5. The first is the less extreme of the two. It reinstalls Windows 8 but preserves personal settings and
personal data. It does this by saving the settings and data on a separate partition in the hard drive,
installing a fresh copy of the operating system then restoring the data and settings. It also preserves any
Windows 8 modern apps that were installed on the machine. Traditional Windows apps, however, have to
be manually reinstalled.
Reset lets users start over. It wipes away the operating system, settings, data and applications and
reinstalls a factory-fresh copy of Windows 8. It's as if the machine is fresh out of the box.
Windows 8 offers what it calls a thorough option for wiping out data during a reset. If the purpose of
resetting was to erase sensitive data from the hard drive and make it unrecoverable, the thorough option
writes random bits over all sectors of the hard drive. While it doesn't make the data unrecoverable, it
would require expensive gear that most people can't afford, Microsoft says.
6. Windows Store: An important part of Windows 8 is Windows 8 applications which are built to highlight
the touch-centric nature of the operating system. They are available only through the Windows Store, an
online market where developers can sell their apps once they have won Microsoft certification. The idea is
to encourage development of apps customers will want in order to promote sales of Windows 8 devices.
7. Secure boot, trusted boot: Secure boot ensures the operating system being booted hasn't been corrupted
by verifying that the kernel is the one that was signed with a Microsoft certificate. Trusted boot calls for
launching anti-malware before the operating system itself boots in order to thwart malware that might try
to disable it. This is all new for Windows and security experts say represents a significant improvement in
maintaining the integrity of the system.
8. Skype: Skype, which is now owned by Microsoft, is integrated into Windows 8. If customers buy the
Skype application at the Windows Store, the app integrates with certain other apps such as the People app
where the contact information for individuals is stored in the cloud and managed. Skype friends are
automatically listed there. The Skype tile that appears on the Start screen is live and displays the most
recent missed calls and pending messages. Users can call others who have Skype clients or with a new
dial pad in the application can call phones on the public network using prepaid minutes.
9. ARM: A special version of Windows 8 called Windows RT is not only designed for devices with ARM
processors, the only way you can buy it is packaged with the ARM hardware. Microsoft itself is breaking
its longstanding tradition of letting its OEM partner’s bundle Windows software with hardware by
introducing Surface RT, a Windows 8 ARM tablet with an optional keyboard.The upside of ARM is that
it consumes less power than x86 chips, extending battery life for mobile use that takes users away
from power outlets. 10. SkyDrive: SkyDrive is cloud-based storage for Windows 8 documents, photos and PC settings. It can also
integrate with Windows Phone, so a copy of pictures shot with the phone are automatically sent to the
SkyDrive account. With an account, users can tap into their stored resources from whatever machine is
available.Also via SkyDrive, users can share whatever is stored there with others who have been authorized
to do so, making it possible to conduct a form of collaboration. SkyDrive also has APIs that are available to
developers who want to incorporate access to data in the cloud as part of the apps they write.
11. Multi-monitor options: Windows 8 features new multi-monitor keyboard shortcuts such as for moving
applications from monitor to monitor, enables dragging and dropping applications from screen to screen
and displaying a single image as wallpaper so it extends from one screen to another.
CONCLUSION:
Windows 8 is actually a significant upgrade to Windows 7. Windows 8, through various low-level changes,
could improve the speed of productivity apps (Office, Photoshop, etc.) significantly. Early benchmarks aren’t
showing much of a difference between Windows 7 and Windows 8 for gaming, though.
We may have some concerns about the clunky integration between the new (Metro) and old (Desktop), but
really, over time, these concerns should fade. From time to time we will experience the brutal cross-paradigm
UI train wreck head-on some settings can only be tweaked in the Metro-style Control Panel, for example but
these cases are fairly few and far between, once we’ve got system fully set up. The fact that Microsoft isn’t

SCHOLARS WORLD-INTERNATIONAL REFEREED MULTIDISCIPLINARY JOURNAL OF CONTEMPORARY RESEARCH EISSN 2320-3145, ISSN 2319-5789
www.scholarsworld.net [email protected] Volume.1, Issue.2, July 2013 [106]
making a version of Windows 8 specifically for non-touch screen devices, without Metro, is a bitter pill to
swallow from an ideological standpoint, and I suspect many consumers will hold out for this reason.
For business and enterprise installations, where the upgrade cost both in terms of time and money is higher, I am
more ambivalent. That the Metro interface cannot be disabled by system administrators is troubling. By installing
Windows 8, companies will implicitly force its employees to use a new interface that could severely dent
productivity. This issue is compounded by the fact that almost all of Windows 8 Desktop’s new features are oriented
towards at-home consumers, rather than office workers. I think Windows 8 will be a very tough sell in the enterprise.
Installing Windows 8 is neither recommended nor discouraged by ResNet, and is down to personal preference.
We expect that all prebuilt (OEM) PCs will be shipped with Windows 8. Only computers running Windows 8
Pro will be eligible to downgrade their installation to Windows 7 or Windows Vista. No versions of Windows 8
will be able to downgrade to Windows XP.
REFERENCES:
1. http://www.scribd.com/doc/24517666/operating-system-notes-Galvin
2. http://www.pcadvisor.co.uk/buying-advice/windows/3368956/windows-7-vs-windows-8-whats-
difference-between-windows-8-windows-7/?pn=2
3. http://www.pcadvisor.co.uk/buying-advice/windows/336895/windows-7-vs-windows-8-whats-difference-
between-windows-8-windows-7/#ixzz2FaXxAKkU
4. http://www.askvg.com/comparison-between-windows-7-and-windows-8-memory-management-system/
5. http://www.pcadvisor.co.uk/features/internet/3284163/8-hot-features-in-windows-8/
6. http://hbswk.hbs.edu/item/7124.html
7. http://en.wikipedia.org/wiki/Windows_8
8. http://www.hongkiat.com/blog/windows-8-new-features-you-will-love/
9. http://timesofindia.indiatimes.com/tech/windows8november/8-new-features-in-Microsoft-Windows-
8/itslideshow/16951551.cms
10. http://www.notebookreview.com/default.asp?newsID=6268
11. http://windows.microsoft.com/en-in/windows7/products/features
12. http://en.wikipedia.org/wiki/Features_new_to_Windows_7
13. http://www.dvice.com/archives/2009/10/top-10-windows.php
14. http://www.networkworld.com/news/2012/102212-windows8-windows7-263591.html
15. http://usabilitygeek.com/windows-8-vs-windows-7-speed-and-performance-testing/
16. http://digitalunite.com/guides/computer-basics/windows-8/what-are-differences-between-windows-7-and-
windows-8
----
SCHOLARS WORLD-INTERNATIONAL REFEREED MULTIDISCIPLINARY JOURNAL OF CONTEMPORARY RESEARCH EISSN 2320-3145, ISSN 2319-5789
www.scholarsworld.net [email protected] Volume.1, Issue.2, July 2013 [107]
COMPARATIVE FINANCIAL PERFORMANCE
OF HDFC BANK AND ICICI BANK
DR. K. SRINIVAS,
Principal,
KGR Institute of Technology and Management,
Rampally, Keesara, Hyderabad (India)
L. SAROJA,
Sr.Leturer,
Depatmentof Commerce, S.P. College,
Secundrabad, Andhra Pradesh (India)
ABSTRACT
The nationalization phase of the early 1970s brought some of the elite banks under the
government’s control. The next decade heralded the second phase of nationalization with the
merging of old private sector banks. The 1990s saw partial liberalization of the banking industry
and the emergence of new private sector banks as well as international banks. During the next
few years, fears of liberalization were put to rest and in the past decade the banking system has
gained much from it. Liberalization brought out the best in the industry inducing competitive
spirit among various banks.
The present research paper is aimed to analyze and compare the Financial Performance of HDFC
and ICICI Bank and offer suggestions for the improvement of efficiency in select banks. For the
purpose of analysis of comparative financial performance of the select banks, world-renowned,
CAMELS model with t-test is applied. CAMELS stand for Capital Adequacy, Asset Quality,
Management, Earning Quality, Liquidity and Sensitivity.
The capital adequacy and Tier I capital ratio of ICICI and HDFC bank is more than the Basel
Accord. We conclude that both the banks are good with respect capital adequacy because it is
above the Basel norms. The efficiency of HDFC Bank management is good because its NPAs are
less than 0.5 for the study period from 2013 to 2012. The net profit, operating profit, return on
net-worth, spread, liquidity and loans to total assets of HDFC bank has more compared with
ICICI bank. Hence HDFC bank earns more profits compared with ICICI bank.
The total advances to customer deposit, debt-equity and burden of HDFC have less compared
with ICICI bank, and hence long term solvency is well in ICICI bank. The CAMELS’ analysis
and t-test concludes that there is no significance difference between the ICICI and HDFC bank’s
financial performance but the ICICI bank performance is slightly less compared with HDFC.
Keywords: Elite Banks, CAMELS Model, ICICI and HDFC bank, financial performance
SCHOLARS WORLD-INTERNATIONAL REFEREED MULTIDISCIPLINARY JOURNAL OF CONTEMPORARY RESEARCH EISSN 2320-3145, ISSN 2319-5789
www.scholarsworld.net [email protected] Volume.1, Issue.2, July 2013 [108]
INTRODUCTION:
Banks play an active role in the economic development of a country. Their ability to make a positive
contribution in igniting the process of growth depends on the effective banking system. The banking sector
reforms were aimed at making banks more efficient and viable. As one who had a role in initiating these
reforms, we can say that the period of transition was not that easy. But as a consequence of these reforms the
banking system has emerged more sound and safe. The capital adequacy of the Indian banks is now on par with
international standards. The level of net NPAs has come down to very manageable levels. An issue that is in the
forefront of banking reforms currently is that of bank consolidation. The present study is devoted to analyze the
financial performance of HDFC Bank and ICICI Bank.
MEANING AND DEFINITION:
Bank is an institution that deals in money and its substitutes and provides crucial financial services. The principal
type of baking in the modern industrial world is commercial banking and central banking.
Banking Means "Accepting Deposits for the purpose of lending or Investment of deposits of money from the public,
repayable on demand or otherwise and withdraw by cheque, draft or otherwise."
The concise oxford dictionary has defined a bank as "Establishment for custody of money which it pays out on
customers order." Infact this is the function which the bank performed when banking originated.
"Banking in the most general sense, is meant the business of receiving, conserving & utilizing the funds of
community or of any special section of it."
OBJECTIVES OF THE STUDY:
The present paper is aimed to examine the following objectives:
1. To analyze and compare the Financial Performance of HDFC and ICICI Bank.
2. To offer suggestions for the improvement of efficiency in HDFC and ICICI Bank.
METHODOLOGY:
Source of Data: The study is based on secondary data. The data were collected from the official directory and data base of Centre
for Monitoring Indian Economy (CMIE) namely PROWESS. The published annual reports of the selected banks
taken from their websites, magazines and journals on finance have also been used a sources of data.
To assess the comparative financial performance of select banks, the study adopted the world-renowned
CAMEL model (with minor modifications) with t-test.
Period of Study:
The study covers a period of ten years from 2003 – 2012.
Sampling: The new private sector banks consist of eight banks. For the present study covers two important banks one is
Housing Development Financial Corporation (HDFC) and another one Industrial Credit Investment Corporation
of India (ICICI).
Hypotheses: From the above objectives of the following hypothesis is formulated to test the financial efficiency of the select
banks:
Ho = “There is no significant difference between financial performance of HDFC and ICICI Bank.”
Scope of the Study:
The research paper covers two important new private sector banks Housing Development Financial Corporation
(HDFC) and Industrial Credit Investment Corporation of India (ICICI) Bank only.
LIMITATIONS OF THE STUDY:
The major limitation of the present study is that the analysis is restricted to one particular sector such as
banking. It is confined to only measure the financial performance of select banks. The inherent limitation is
secondary data. The published data is not uniform and not properly disclosed by the banks. Hence, this may be
taken as another limitation.

SCHOLARS WORLD-INTERNATIONAL REFEREED M
www.scholarsworld.net
COMPARATIVE FINANCIAL PERFORMANCE OF HDFC BANK AND ICICI BANK:
The nationalization phase of the early 1970s brought some of the elite banks under the go
The next decade heralded the second phase of nationalization with the merging of old private sector banks. The
1990s saw partial liberalization of the banking industry and the emergence of new private sector banks as well
as international banks. During the next few years, fears of liberalization were put to rest and in the past decade
the banking system has gained much from it. Liberalization brought out the best in the industry inducing
competitive spirit among various banks. During thi
employment, embraced technology and ventured into related new businesses. Some of them have even re
branded themselves to cater to the ever
management mechanisms and added fresh capital, which is very important to the banking industry.
With the development of the banking sector, it is interesting to know how the selected banks have performed. The
present study carried out a closer analysis of two banks based on their annual results. For the purpose of analysis
of comparative financial performance of the select banks, world
stand for Capital Adequacy, Asset Quality, Management, Earning Quality,
crucial parameters, which reflect the operating performance, soundness, liquidity of the
following is analysis of comparative financial performan
I. Capital Adequacy:
This ratio is used to protect depositors and promote the stability and efficiency of financial systems around the
world. Two types of capital are measured: tier one capital, which can absorb losses without a bank being
required to cease trading, and tier two capital, which can absorb losses in the event of a winding
provides a lesser degree of protection to depositors. CAR is similar to leverage; in the most basic formulation, it
is comparable to the inverse of debt
instead of debt-to-equity; since assets are by definition equal to debt plus equity, a transformation is required).
Unlike traditional leverage, however, CAR recognizes that assets can have different levels of risk.
1. Capital Adequacy Ratio: CRAR:
Capital adequacy ratios (CARs) are a measure of the amount of a bank's core capital expressed as a percentage
of its risk-weighted asset and it is also known as "Capital to Risk Weighted Assets Ratio (CRAR)."
Capital adequacy ratio is defined as:
TIER 1 CAPITAL = (paid up capital + statutory reserves + disclosed free reserves)
subsidiary + intangible assets + current & b/f losses)
TIER 2 CAPITAL = A) Undisclosed Reserves + B) General Loss res
and subordinated debts where Risk can either be weighted assets (
minimum total capital requirement. If using risk weighted assets,
The percent threshold varies from bank t
conforming to the Basel Accords) is set by the national banking regulator of different countries.
TABLE
Years
2003
2004
2005
2006
2007
2008
2009
2010
2011
2012
Source: Various issues of CMIE, RBI and Bank Annual Reports
MULTIDISCIPLINARY JOURNAL OF CONTEMPORARY RESEARCH EISSN 2320
[email protected] Volume.1, Issue.2,
COMPARATIVE FINANCIAL PERFORMANCE OF HDFC BANK AND ICICI BANK:
The nationalization phase of the early 1970s brought some of the elite banks under the go
The next decade heralded the second phase of nationalization with the merging of old private sector banks. The
1990s saw partial liberalization of the banking industry and the emergence of new private sector banks as well
al banks. During the next few years, fears of liberalization were put to rest and in the past decade
the banking system has gained much from it. Liberalization brought out the best in the industry inducing
competitive spirit among various banks. During this period the banks were restructured, shed the flab of over
employment, embraced technology and ventured into related new businesses. Some of them have even re
branded themselves to cater to the ever-demanding customers. Also the banks put in place effecti
management mechanisms and added fresh capital, which is very important to the banking industry.
With the development of the banking sector, it is interesting to know how the selected banks have performed. The
lysis of two banks based on their annual results. For the purpose of analysis
of comparative financial performance of the select banks, world-renowned, CAMELS model is applied. CAMELS
stand for Capital Adequacy, Asset Quality, Management, Earning Quality, Liquidity and Sensitivity. They are the
crucial parameters, which reflect the operating performance, soundness, liquidity of the
following is analysis of comparative financial performance with CAMELS model and t-test.
This ratio is used to protect depositors and promote the stability and efficiency of financial systems around the
world. Two types of capital are measured: tier one capital, which can absorb losses without a bank being
two capital, which can absorb losses in the event of a winding
provides a lesser degree of protection to depositors. CAR is similar to leverage; in the most basic formulation, it
is comparable to the inverse of debt-to-equity leverage formulations (although CAR uses equity over assets
equity; since assets are by definition equal to debt plus equity, a transformation is required).
Unlike traditional leverage, however, CAR recognizes that assets can have different levels of risk.
:
Capital adequacy ratios (CARs) are a measure of the amount of a bank's core capital expressed as a percentage
weighted asset and it is also known as "Capital to Risk Weighted Assets Ratio (CRAR)."
TIER 1 CAPITAL = (paid up capital + statutory reserves + disclosed free reserves)
subsidiary + intangible assets + current & b/f losses)
TIER 2 CAPITAL = A) Undisclosed Reserves + B) General Loss reserves + C) hybrid debt capital instruments
and subordinated debts where Risk can either be weighted assets ( ) or the respective national regulator's
minimum total capital requirement. If using risk weighted assets,
The percent threshold varies from bank to bank (10% in this case, a common requirement for regulators
conforming to the Basel Accords) is set by the national banking regulator of different countries.
TABLE- 1CAPITAL ADEQUACY RATIO: CRAR
Years HDFC ICICI
2003 11.12 11.10
2004 11.66 10.40
2005 12.16 11.80
2006 11.41 13.40
2007 13.08 11.69
2008 13.60 13.96
2009 15.69 15.53
2010 17.44 19.41
2011 16.22 19.54
2012 16.52 18.52
Source: Various issues of CMIE, RBI and Bank Annual Reports
EISSN 2320-3145, ISSN 2319-5789
Volume.1, Issue.2, July 2013 [109]
COMPARATIVE FINANCIAL PERFORMANCE OF HDFC BANK AND ICICI BANK:
The nationalization phase of the early 1970s brought some of the elite banks under the government’s control.
The next decade heralded the second phase of nationalization with the merging of old private sector banks. The
1990s saw partial liberalization of the banking industry and the emergence of new private sector banks as well
al banks. During the next few years, fears of liberalization were put to rest and in the past decade
the banking system has gained much from it. Liberalization brought out the best in the industry inducing
s period the banks were restructured, shed the flab of over-
employment, embraced technology and ventured into related new businesses. Some of them have even re-
demanding customers. Also the banks put in place effective risk
management mechanisms and added fresh capital, which is very important to the banking industry.
With the development of the banking sector, it is interesting to know how the selected banks have performed. The
lysis of two banks based on their annual results. For the purpose of analysis
renowned, CAMELS model is applied. CAMELS
Liquidity and Sensitivity. They are the
crucial parameters, which reflect the operating performance, soundness, liquidity of the select banks. The
test.
This ratio is used to protect depositors and promote the stability and efficiency of financial systems around the
world. Two types of capital are measured: tier one capital, which can absorb losses without a bank being
two capital, which can absorb losses in the event of a winding-up and so
provides a lesser degree of protection to depositors. CAR is similar to leverage; in the most basic formulation, it
s (although CAR uses equity over assets
equity; since assets are by definition equal to debt plus equity, a transformation is required).
Unlike traditional leverage, however, CAR recognizes that assets can have different levels of risk.
Capital adequacy ratios (CARs) are a measure of the amount of a bank's core capital expressed as a percentage
weighted asset and it is also known as "Capital to Risk Weighted Assets Ratio (CRAR)."
TIER 1 CAPITAL = (paid up capital + statutory reserves + disclosed free reserves) - (equity investments in
erves + C) hybrid debt capital instruments
) or the respective national regulator's
o bank (10% in this case, a common requirement for regulators
conforming to the Basel Accords) is set by the national banking regulator of different countries.
Source: Various issues of CMIE, RBI and Bank Annual Reports
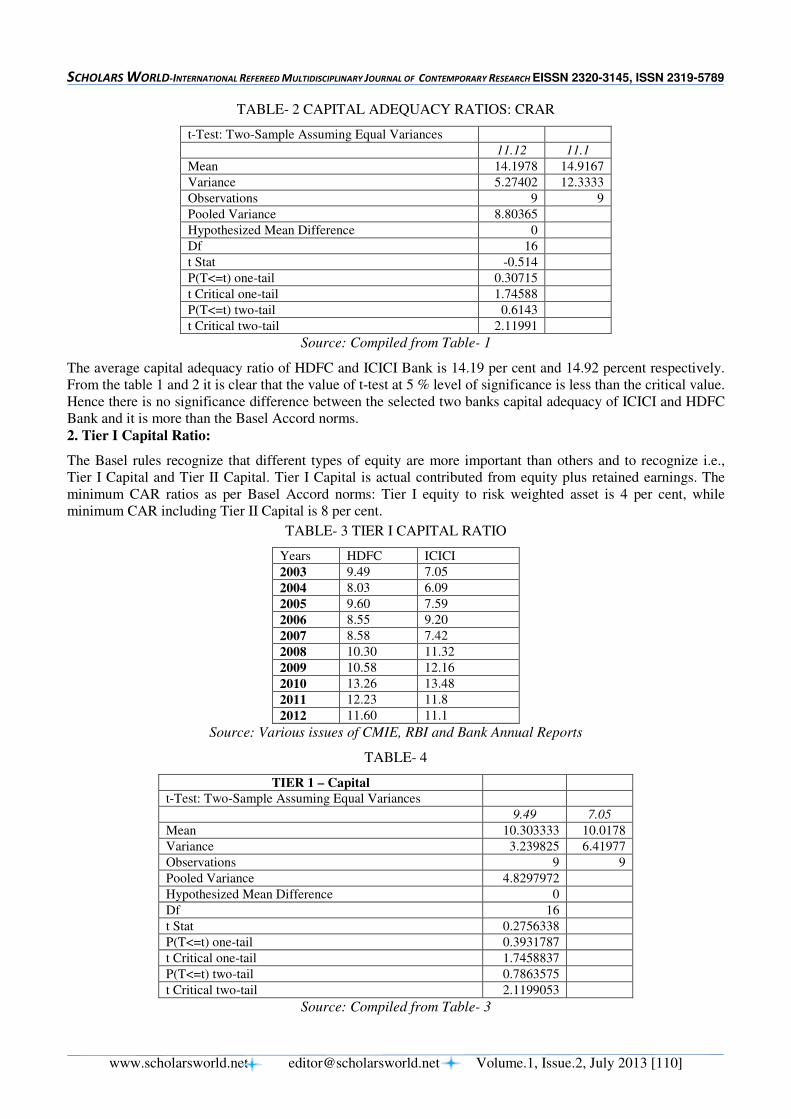
SCHOLARS WORLD-INTERNATIONAL REFEREED MULTIDISCIPLINARY JOURNAL OF CONTEMPORARY RESEARCH EISSN 2320-3145, ISSN 2319-5789
www.scholarsworld.net [email protected] Volume.1, Issue.2, July 2013 [110]
TABLE- 2 CAPITAL ADEQUACY RATIOS: CRAR
t-Test: Two-Sample Assuming Equal Variances
11.12 11.1
Mean 14.1978 14.9167
Variance 5.27402 12.3333
Observations 9 9
Pooled Variance 8.80365
Hypothesized Mean Difference 0
Df 16
t Stat -0.514
P(T<=t) one-tail 0.30715
t Critical one-tail 1.74588
P(T<=t) two-tail 0.6143
t Critical two-tail 2.11991
Source: Compiled from Table- 1
The average capital adequacy ratio of HDFC and ICICI Bank is 14.19 per cent and 14.92 percent respectively.
From the table 1 and 2 it is clear that the value of t-test at 5 % level of significance is less than the critical value.
Hence there is no significance difference between the selected two banks capital adequacy of ICICI and HDFC
Bank and it is more than the Basel Accord norms.
2. Tier I Capital Ratio:
The Basel rules recognize that different types of equity are more important than others and to recognize i.e.,
Tier I Capital and Tier II Capital. Tier I Capital is actual contributed from equity plus retained earnings. The
minimum CAR ratios as per Basel Accord norms: Tier I equity to risk weighted asset is 4 per cent, while
minimum CAR including Tier II Capital is 8 per cent.
TABLE- 3 TIER I CAPITAL RATIO
Years HDFC ICICI
2003 9.49 7.05
2004 8.03 6.09
2005 9.60 7.59
2006 8.55 9.20
2007 8.58 7.42
2008 10.30 11.32
2009 10.58 12.16
2010 13.26 13.48
2011 12.23 11.8
2012 11.60 11.1
Source: Various issues of CMIE, RBI and Bank Annual Reports
TABLE- 4
TIER 1 – Capital
t-Test: Two-Sample Assuming Equal Variances
9.49 7.05
Mean 10.303333 10.0178
Variance 3.239825 6.41977
Observations 9 9
Pooled Variance 4.8297972
Hypothesized Mean Difference 0
Df 16
t Stat 0.2756338
P(T<=t) one-tail 0.3931787
t Critical one-tail 1.7458837
P(T<=t) two-tail 0.7863575
t Critical two-tail 2.1199053
Source: Compiled from Table- 3
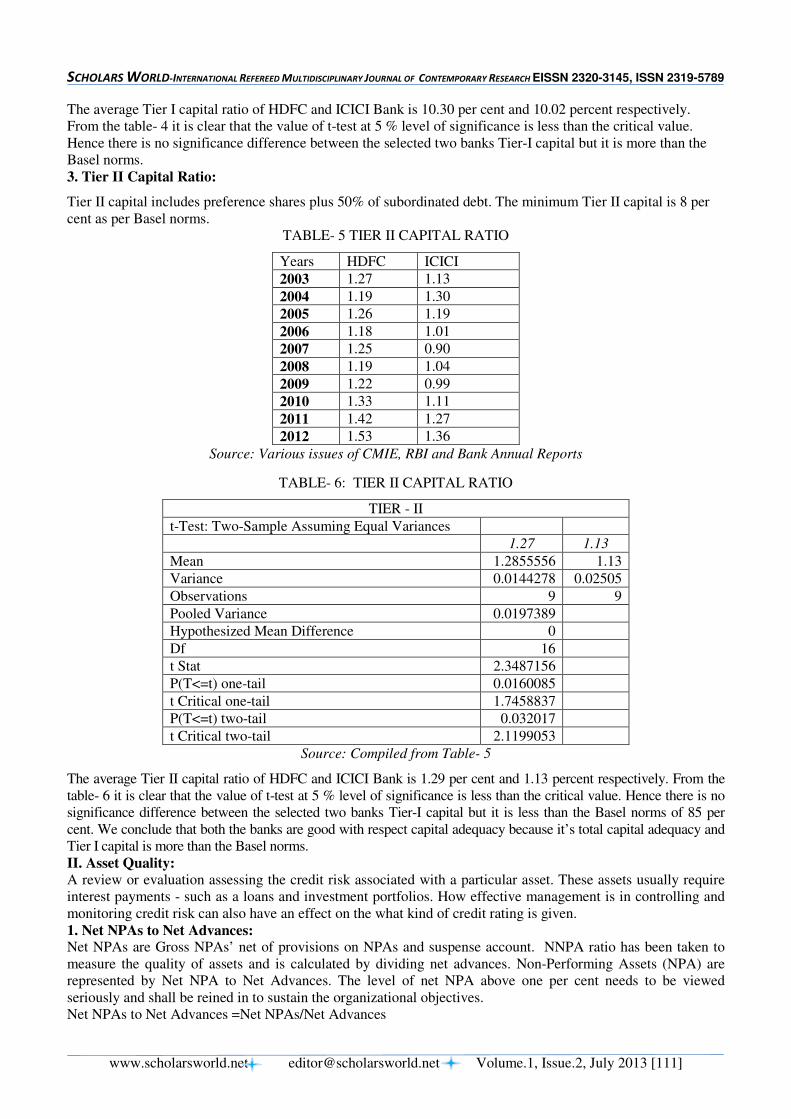
SCHOLARS WORLD-INTERNATIONAL REFEREED MULTIDISCIPLINARY JOURNAL OF CONTEMPORARY RESEARCH EISSN 2320-3145, ISSN 2319-5789
www.scholarsworld.net [email protected] Volume.1, Issue.2, July 2013 [111]
The average Tier I capital ratio of HDFC and ICICI Bank is 10.30 per cent and 10.02 percent respectively.
From the table- 4 it is clear that the value of t-test at 5 % level of significance is less than the critical value.
Hence there is no significance difference between the selected two banks Tier-I capital but it is more than the
Basel norms.
3. Tier II Capital Ratio:
Tier II capital includes preference shares plus 50% of subordinated debt. The minimum Tier II capital is 8 per
cent as per Basel norms.
TABLE- 5 TIER II CAPITAL RATIO
Years HDFC ICICI
2003 1.27 1.13
2004 1.19 1.30
2005 1.26 1.19
2006 1.18 1.01
2007 1.25 0.90
2008 1.19 1.04
2009 1.22 0.99
2010 1.33 1.11
2011 1.42 1.27
2012 1.53 1.36
Source: Various issues of CMIE, RBI and Bank Annual Reports
TABLE- 6: TIER II CAPITAL RATIO
TIER - II
t-Test: Two-Sample Assuming Equal Variances
1.27 1.13
Mean 1.2855556 1.13
Variance 0.0144278 0.02505
Observations 9 9
Pooled Variance 0.0197389
Hypothesized Mean Difference 0
Df 16
t Stat 2.3487156
P(T<=t) one-tail 0.0160085
t Critical one-tail 1.7458837
P(T<=t) two-tail 0.032017
t Critical two-tail 2.1199053
Source: Compiled from Table- 5
The average Tier II capital ratio of HDFC and ICICI Bank is 1.29 per cent and 1.13 percent respectively. From the
table- 6 it is clear that the value of t-test at 5 % level of significance is less than the critical value. Hence there is no
significance difference between the selected two banks Tier-I capital but it is less than the Basel norms of 85 per
cent. We conclude that both the banks are good with respect capital adequacy because it’s total capital adequacy and
Tier I capital is more than the Basel norms.
II. Asset Quality:
A review or evaluation assessing the credit risk associated with a particular asset. These assets usually require
interest payments - such as a loans and investment portfolios. How effective management is in controlling and
monitoring credit risk can also have an effect on the what kind of credit rating is given.
1. Net NPAs to Net Advances: Net NPAs are Gross NPAs’ net of provisions on NPAs and suspense account. NNPA ratio has been taken to
measure the quality of assets and is calculated by dividing net advances. Non-Performing Assets (NPA) are
represented by Net NPA to Net Advances. The level of net NPA above one per cent needs to be viewed
seriously and shall be reined in to sustain the organizational objectives.
Net NPAs to Net Advances =Net NPAs/Net Advances
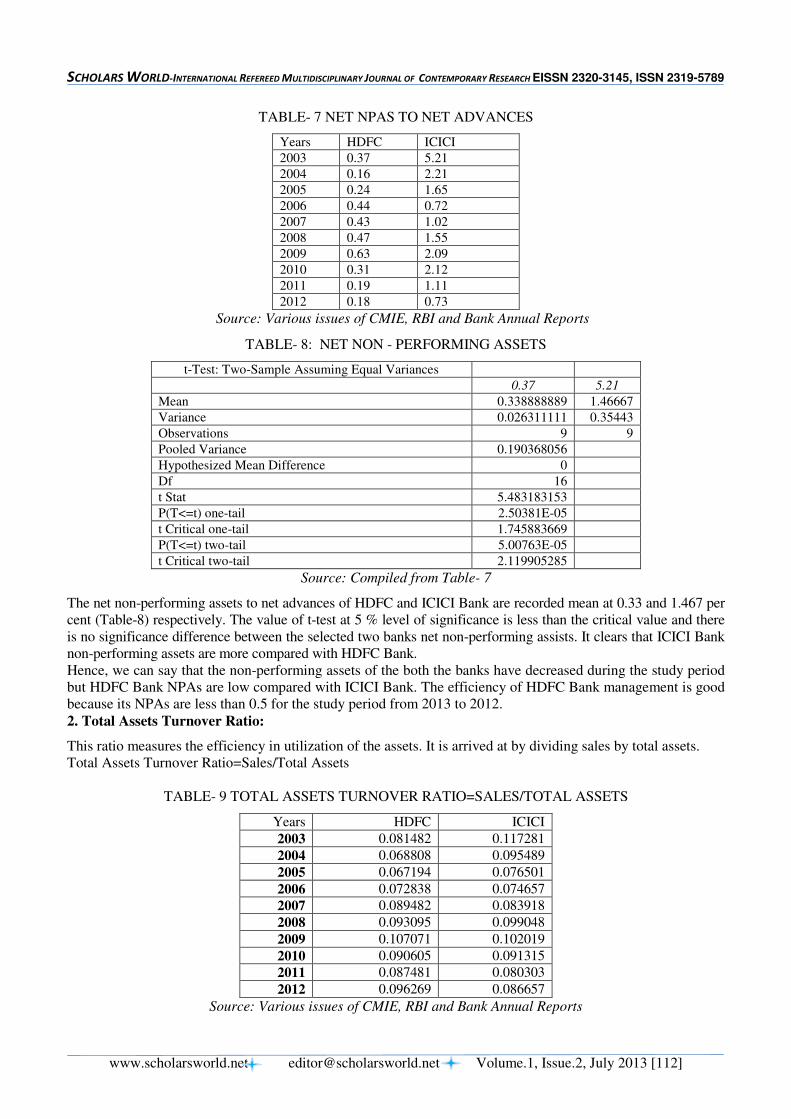
SCHOLARS WORLD-INTERNATIONAL REFEREED MULTIDISCIPLINARY JOURNAL OF CONTEMPORARY RESEARCH EISSN 2320-3145, ISSN 2319-5789
www.scholarsworld.net [email protected] Volume.1, Issue.2, July 2013 [112]
TABLE- 7 NET NPAS TO NET ADVANCES
Years HDFC ICICI
2003 0.37 5.21
2004 0.16 2.21
2005 0.24 1.65
2006 0.44 0.72
2007 0.43 1.02
2008 0.47 1.55
2009 0.63 2.09
2010 0.31 2.12
2011 0.19 1.11
2012 0.18 0.73
Source: Various issues of CMIE, RBI and Bank Annual Reports
TABLE- 8: NET NON - PERFORMING ASSETS
t-Test: Two-Sample Assuming Equal Variances
0.37 5.21
Mean 0.338888889 1.46667
Variance 0.026311111 0.35443
Observations 9 9
Pooled Variance 0.190368056
Hypothesized Mean Difference 0
Df 16
t Stat 5.483183153
P(T<=t) one-tail 2.50381E-05
t Critical one-tail 1.745883669
P(T<=t) two-tail 5.00763E-05
t Critical two-tail 2.119905285
Source: Compiled from Table- 7
The net non-performing assets to net advances of HDFC and ICICI Bank are recorded mean at 0.33 and 1.467 per
cent (Table-8) respectively. The value of t-test at 5 % level of significance is less than the critical value and there
is no significance difference between the selected two banks net non-performing assists. It clears that ICICI Bank
non-performing assets are more compared with HDFC Bank.
Hence, we can say that the non-performing assets of the both the banks have decreased during the study period
but HDFC Bank NPAs are low compared with ICICI Bank. The efficiency of HDFC Bank management is good
because its NPAs are less than 0.5 for the study period from 2013 to 2012.
2. Total Assets Turnover Ratio:
This ratio measures the efficiency in utilization of the assets. It is arrived at by dividing sales by total assets.
Total Assets Turnover Ratio=Sales/Total Assets
TABLE- 9 TOTAL ASSETS TURNOVER RATIO=SALES/TOTAL ASSETS
Years HDFC ICICI
2003 0.081482 0.117281
2004 0.068808 0.095489
2005 0.067194 0.076501
2006 0.072838 0.074657
2007 0.089482 0.083918
2008 0.093095 0.099048
2009 0.107071 0.102019
2010 0.090605 0.091315
2011 0.087481 0.080303
2012 0.096269 0.086657
Source: Various issues of CMIE, RBI and Bank Annual Reports
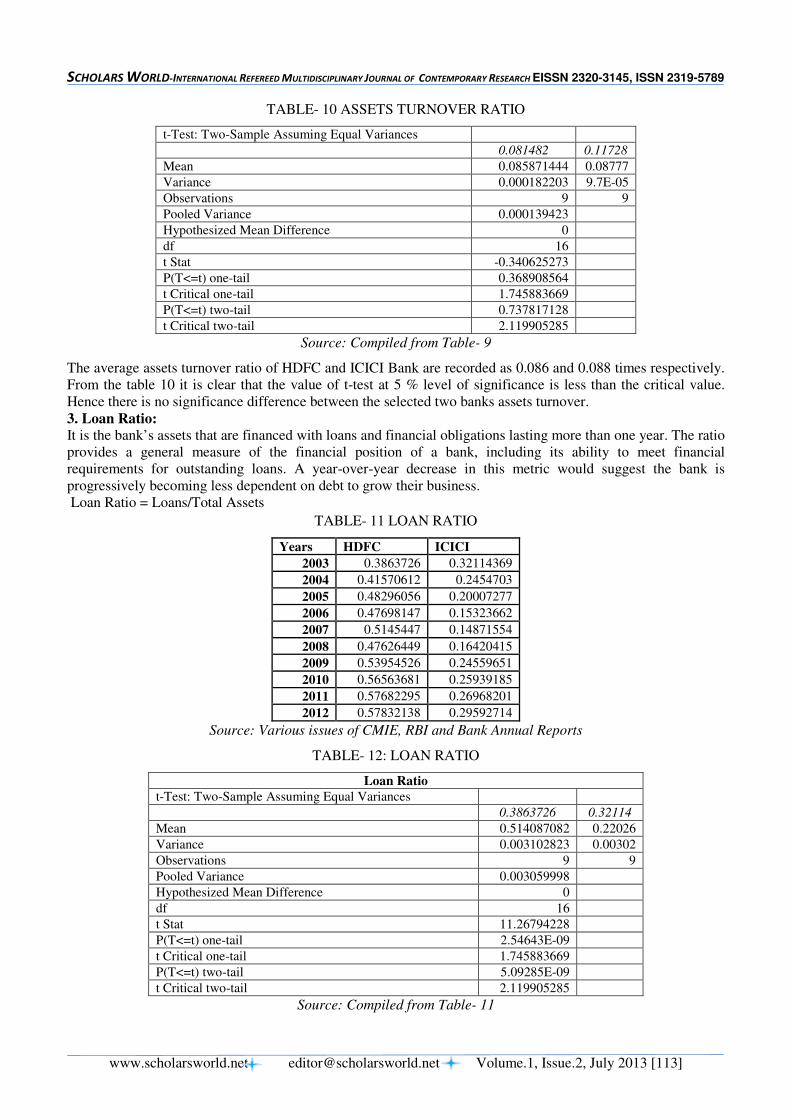
SCHOLARS WORLD-INTERNATIONAL REFEREED MULTIDISCIPLINARY JOURNAL OF CONTEMPORARY RESEARCH EISSN 2320-3145, ISSN 2319-5789
www.scholarsworld.net [email protected] Volume.1, Issue.2, July 2013 [113]
TABLE- 10 ASSETS TURNOVER RATIO
t-Test: Two-Sample Assuming Equal Variances
0.081482 0.11728
Mean 0.085871444 0.08777
Variance 0.000182203 9.7E-05
Observations 9 9
Pooled Variance 0.000139423
Hypothesized Mean Difference 0
df 16
t Stat -0.340625273
P(T<=t) one-tail 0.368908564
t Critical one-tail 1.745883669
P(T<=t) two-tail 0.737817128
t Critical two-tail 2.119905285
Source: Compiled from Table- 9
The average assets turnover ratio of HDFC and ICICI Bank are recorded as 0.086 and 0.088 times respectively.
From the table 10 it is clear that the value of t-test at 5 % level of significance is less than the critical value.
Hence there is no significance difference between the selected two banks assets turnover.
3. Loan Ratio:
It is the bank’s assets that are financed with loans and financial obligations lasting more than one year. The ratio
provides a general measure of the financial position of a bank, including its ability to meet financial
requirements for outstanding loans. A year-over-year decrease in this metric would suggest the bank is
progressively becoming less dependent on debt to grow their business.
Loan Ratio = Loans/Total Assets
TABLE- 11 LOAN RATIO
Years HDFC ICICI
2003 0.3863726 0.32114369
2004 0.41570612 0.2454703
2005 0.48296056 0.20007277
2006 0.47698147 0.15323662
2007 0.5145447 0.14871554
2008 0.47626449 0.16420415
2009 0.53954526 0.24559651
2010 0.56563681 0.25939185
2011 0.57682295 0.26968201
2012 0.57832138 0.29592714
Source: Various issues of CMIE, RBI and Bank Annual Reports
TABLE- 12: LOAN RATIO
Loan Ratio
t-Test: Two-Sample Assuming Equal Variances
0.3863726 0.32114
Mean 0.514087082 0.22026
Variance 0.003102823 0.00302
Observations 9 9
Pooled Variance 0.003059998
Hypothesized Mean Difference 0
df 16
t Stat 11.26794228
P(T<=t) one-tail 2.54643E-09
t Critical one-tail 1.745883669
P(T<=t) two-tail 5.09285E-09
t Critical two-tail 2.119905285
Source: Compiled from Table- 11

SCHOLARS WORLD-INTERNATIONAL REFEREED MULTIDISCIPLINARY JOURNAL OF CONTEMPORARY RESEARCH EISSN 2320-3145, ISSN 2319-5789
www.scholarsworld.net [email protected] Volume.1, Issue.2, July 2013 [114]
The loans to total assets of HDFC and ICICI Bank are recorded mean at 0.51 and 0.22 respectively. The value
of t-test at 5 % level of significance is more than the critical value and there is a significance difference between
the selected two banks loans to total assets. It clears that ICICI Bank loans to total assets are less compared with
HDFC Bank. Hence, we can say that the loans to total assets of ICICI bank have decreased during the study
period but HDFC Bank loans to total assets are more compared with ICICI Bank.
III. Management Competence:
The bank management competence is customer service, effective transactions and competent risk management.
1. Credit Deposit Ratio: It is the ratio of how much a bank lends out of the deposits it has mobilized. It indicates how much of a bank's
core funds are being used for lending, the main banking activity. A higher ratio indicates more reliance on
deposits for lending and vice-versa.
Credit Deposit Ratio=Total Advances/Customer Deposit
TABLE- 13 CREDIT DEPOSIT RATIO=TOTAL ADVANCES/CUSTOMER DEPOSIT
Years HDFC ICICI
2003 52.53 122.96
2004 58.35 97.38
2005 70.32 89.17
2006 62.90 87.59
2007 66.13 83.83
2008 65.35 84.99
2009 66.78 91.44
2010 72.66 90.04
2011 76.41 87.81
2012 79.08 92.23
Source: Various issues of CMIE, RBI and Bank Annual Reports
TABLE- 14 CREDIT DEPOSIT RATIO
t-Test: Two-Sample Assuming Equal Variances
52.53 122.96
Mean 68.66444444 89.3867
Variance 43.46992778 16.5736
Observations 9 9
Pooled Variance 30.02177639
Hypothesized Mean Difference 0
df 16
t Stat -8.022770902
P(T<=t) one-tail 2.67229E-07
t Critical one-tail 1.745883669
P(T<=t) two-tail 5.34458E-07
t Critical two-tail 2.119905285
Source: Compiled from Table- 13
The total advances to customer deposit of HDFC and ICICI Bank are recorded mean at 68.7 and 89.4 per cent
(Table-11) respectively. The value of t-test at 5 % level of significance is less than the critical value and there is
no significance difference between the selected two banks total advances to customer deposit. It clears that
ICICI Bank total advances to customer deposits are more compared with HDFC Bank.
IV. Earnings Ability/ Profitability Ratios:
Profitability ratio is the common ratio required to judge the profitability of commercial banks. This ratio
measures the profitability or the operational efficiency of the banks. Employing more resources and making
effective utilization of resources can increase absolute profits. There are two groups of persons who may be

SCHOLARS WORLD-INTERNATIONAL REFEREED MULTIDISCIPLINARY JOURNAL OF CONTEMPORARY RESEARCH EISSN 2320-3145, ISSN 2319-5789
www.scholarsworld.net [email protected] Volume.1, Issue.2, July 2013 [115]
specifically interested in the analysis of the profitability of the banks. These are (i) the management which is
interested in the overall profitability and operational efficiency of the banks, and (ii) the equity shareholders
who are interested in the ultimate returns available to them. The profitability ratios are calculated by relating the
returns with the (i) Income of the bank (ii) Assets of the bank and (iii) the owner’s contribution.
1. Net Profit Ratio:
Net profit is obtained when interest is expanded; operating expenses and taxes are deducted from total income.
This ratio establishes relationship between profit and total income. It indicates management efficiency.
Net Profit Ratio= (Net Profit/Total Income)*100
TABLE- 15: NET PROFIT RATIO
Years HDFC ICICI
2003 15.65147 9.643171
2004 17.36466 13.6394
2005 18.72364 15.63231
2006 16.26821 13.53367
2007 13.97599 10.75269
2008 12.82465 10.50027
2009 11.44066 9.711598
2010 14.63088 12.12934
2011 16.18102 15.78996
2012 15.8838 15.751
Source: Various issues of CMIE, RBI and Bank Annual Reports
TABLE- 16: NET PROFIT RATIO
t-Test: Two-Sample Assuming Equal Variances
15.65147 9.64317
Mean 15.17621375 13.0489
Variance 5.828251605 5.72797
Observations 8 9
Pooled Variance 5.774765698
Hypothesized Mean Difference 0
Df 15
t Stat 1.821809743
P(T<=t) one-tail 0.044241581
t Critical one-tail 1.753050325
P(T<=t) two-tail 0.088483162
t Critical two-tail 2.131449536
Source: Compiled from Table-15
The net profit ratio of HDFC and ICICI Bank are recorded mean at 15.18 and 13.05 per cent (Table-16)
respectively. The value of t-test at 5 % level of significance is less than the critical value and there is no
significance difference between the selected two banks net profit ratio. It clears that HDFC Bank net profit ratio
is more compared with ICICI Bank.
2. Operating Profit Ratio:
The profit earned from bank’s normal core business operations. This value does not include any profit earned
from the bank’s investments (such as earnings from banks in which the bank has partial interest) and the effects
of taxes and provisions.
Operating Profit Ratio = (Operating Profit/ Total Income) * 100
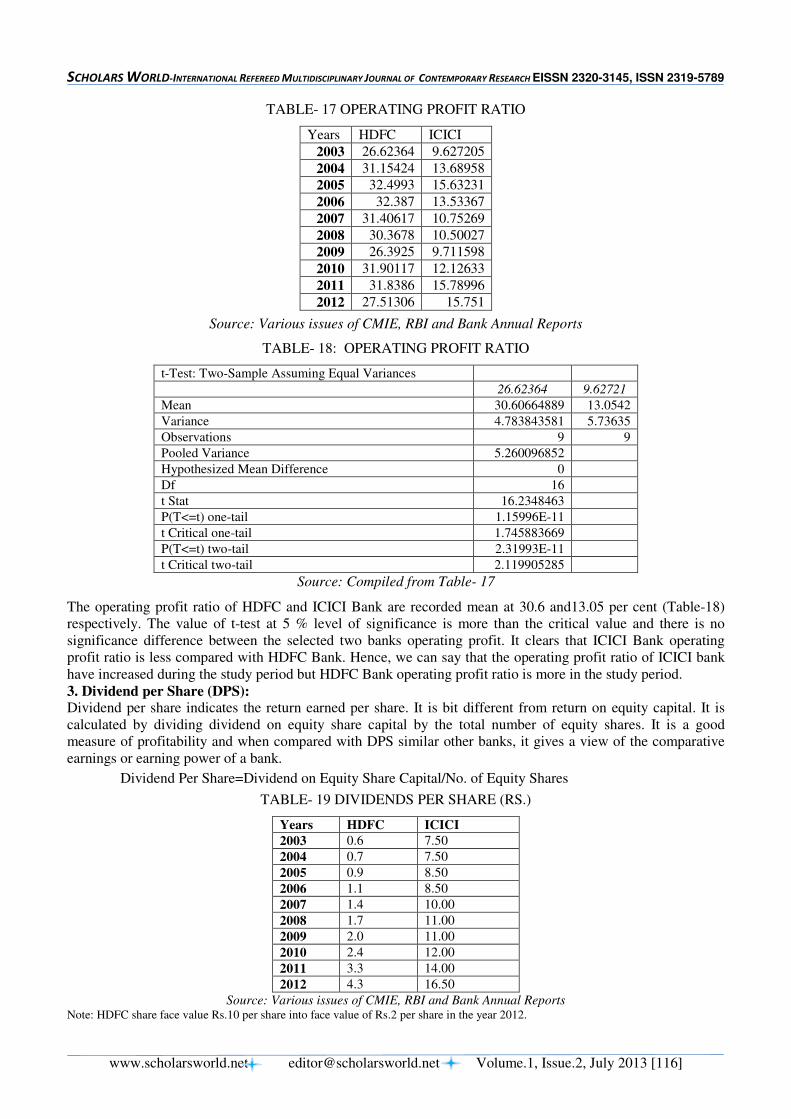
SCHOLARS WORLD-INTERNATIONAL REFEREED MULTIDISCIPLINARY JOURNAL OF CONTEMPORARY RESEARCH EISSN 2320-3145, ISSN 2319-5789
www.scholarsworld.net [email protected] Volume.1, Issue.2, July 2013 [116]
TABLE- 17 OPERATING PROFIT RATIO
Years HDFC ICICI
2003 26.62364 9.627205
2004 31.15424 13.68958
2005 32.4993 15.63231
2006 32.387 13.53367
2007 31.40617 10.75269
2008 30.3678 10.50027
2009 26.3925 9.711598
2010 31.90117 12.12633
2011 31.8386 15.78996
2012 27.51306 15.751
Source: Various issues of CMIE, RBI and Bank Annual Reports
TABLE- 18: OPERATING PROFIT RATIO
t-Test: Two-Sample Assuming Equal Variances
26.62364 9.62721
Mean 30.60664889 13.0542
Variance 4.783843581 5.73635
Observations 9 9
Pooled Variance 5.260096852
Hypothesized Mean Difference 0
Df 16
t Stat 16.2348463
P(T<=t) one-tail 1.15996E-11
t Critical one-tail 1.745883669
P(T<=t) two-tail 2.31993E-11
t Critical two-tail 2.119905285
Source: Compiled from Table- 17
The operating profit ratio of HDFC and ICICI Bank are recorded mean at 30.6 and13.05 per cent (Table-18)
respectively. The value of t-test at 5 % level of significance is more than the critical value and there is no
significance difference between the selected two banks operating profit. It clears that ICICI Bank operating
profit ratio is less compared with HDFC Bank. Hence, we can say that the operating profit ratio of ICICI bank
have increased during the study period but HDFC Bank operating profit ratio is more in the study period.
3. Dividend per Share (DPS): Dividend per share indicates the return earned per share. It is bit different from return on equity capital. It is
calculated by dividing dividend on equity share capital by the total number of equity shares. It is a good
measure of profitability and when compared with DPS similar other banks, it gives a view of the comparative
earnings or earning power of a bank.
Dividend Per Share=Dividend on Equity Share Capital/No. of Equity Shares
TABLE- 19 DIVIDENDS PER SHARE (RS.)
Years HDFC ICICI
2003 0.6 7.50
2004 0.7 7.50
2005 0.9 8.50
2006 1.1 8.50
2007 1.4 10.00
2008 1.7 11.00
2009 2.0 11.00
2010 2.4 12.00
2011 3.3 14.00
2012 4.3 16.50
Source: Various issues of CMIE, RBI and Bank Annual Reports Note: HDFC share face value Rs.10 per share into face value of Rs.2 per share in the year 2012.
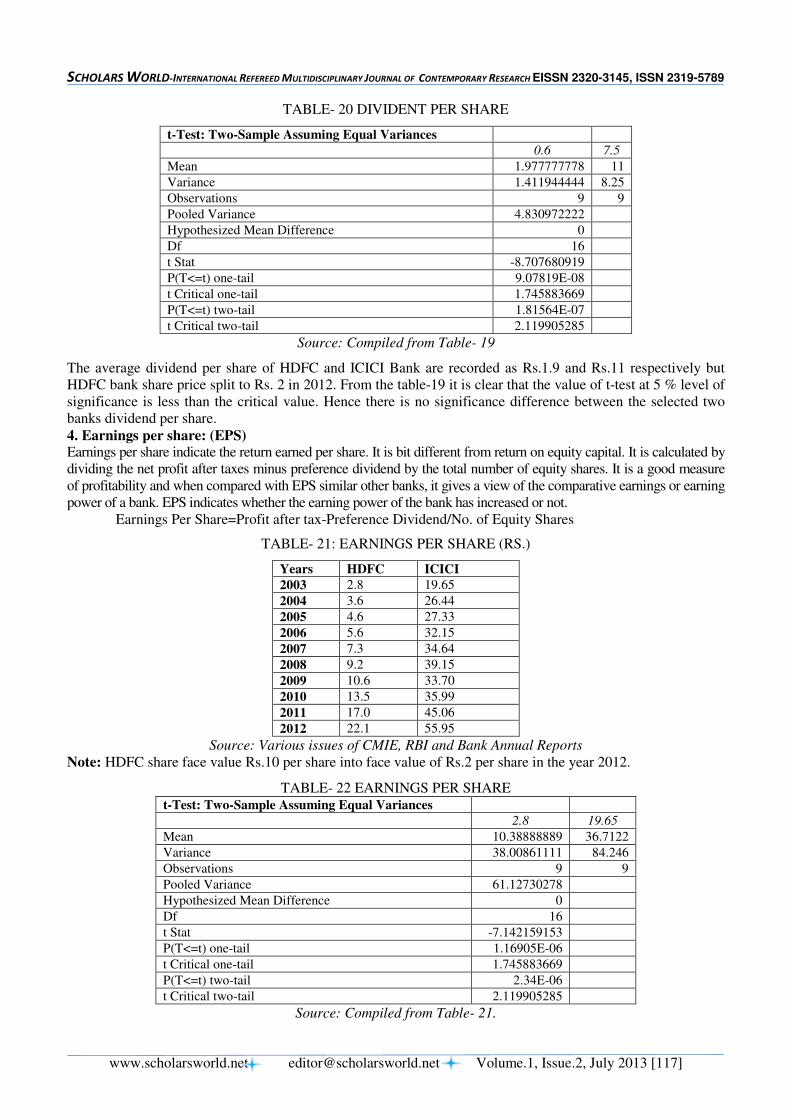
SCHOLARS WORLD-INTERNATIONAL REFEREED MULTIDISCIPLINARY JOURNAL OF CONTEMPORARY RESEARCH EISSN 2320-3145, ISSN 2319-5789
www.scholarsworld.net [email protected] Volume.1, Issue.2, July 2013 [117]
TABLE- 20 DIVIDENT PER SHARE
t-Test: Two-Sample Assuming Equal Variances
0.6 7.5
Mean 1.977777778 11
Variance 1.411944444 8.25
Observations 9 9
Pooled Variance 4.830972222
Hypothesized Mean Difference 0
Df 16
t Stat -8.707680919
P(T<=t) one-tail 9.07819E-08
t Critical one-tail 1.745883669
P(T<=t) two-tail 1.81564E-07
t Critical two-tail 2.119905285
Source: Compiled from Table- 19
The average dividend per share of HDFC and ICICI Bank are recorded as Rs.1.9 and Rs.11 respectively but
HDFC bank share price split to Rs. 2 in 2012. From the table-19 it is clear that the value of t-test at 5 % level of
significance is less than the critical value. Hence there is no significance difference between the selected two
banks dividend per share.
4. Earnings per share: (EPS) Earnings per share indicate the return earned per share. It is bit different from return on equity capital. It is calculated by
dividing the net profit after taxes minus preference dividend by the total number of equity shares. It is a good measure
of profitability and when compared with EPS similar other banks, it gives a view of the comparative earnings or earning
power of a bank. EPS indicates whether the earning power of the bank has increased or not.
Earnings Per Share=Profit after tax-Preference Dividend/No. of Equity Shares
TABLE- 21: EARNINGS PER SHARE (RS.)
Years HDFC ICICI
2003 2.8 19.65
2004 3.6 26.44
2005 4.6 27.33
2006 5.6 32.15
2007 7.3 34.64
2008 9.2 39.15
2009 10.6 33.70
2010 13.5 35.99
2011 17.0 45.06
2012 22.1 55.95
Source: Various issues of CMIE, RBI and Bank Annual Reports
Note: HDFC share face value Rs.10 per share into face value of Rs.2 per share in the year 2012.
TABLE- 22 EARNINGS PER SHARE t-Test: Two-Sample Assuming Equal Variances
2.8 19.65
Mean 10.38888889 36.7122
Variance 38.00861111 84.246
Observations 9 9
Pooled Variance 61.12730278
Hypothesized Mean Difference 0
Df 16
t Stat -7.142159153
P(T<=t) one-tail 1.16905E-06
t Critical one-tail 1.745883669
P(T<=t) two-tail 2.34E-06
t Critical two-tail 2.119905285
Source: Compiled from Table- 21.
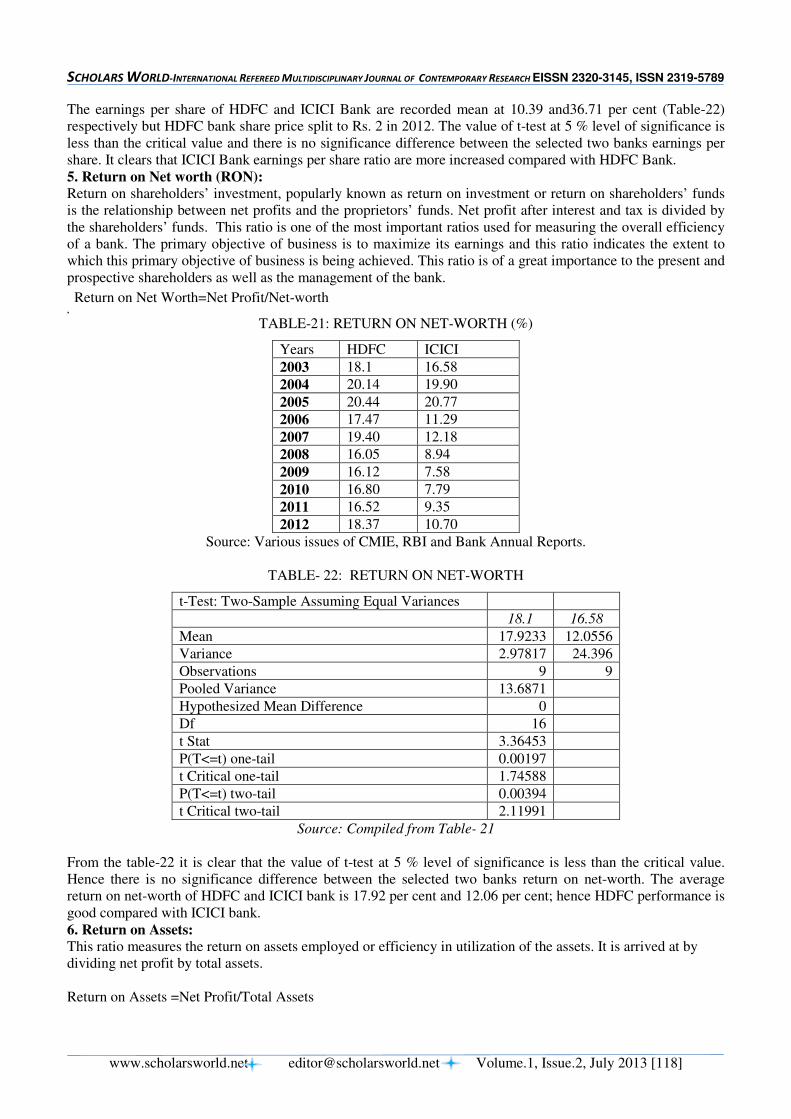
SCHOLARS WORLD-INTERNATIONAL REFEREED MULTIDISCIPLINARY JOURNAL OF CONTEMPORARY RESEARCH EISSN 2320-3145, ISSN 2319-5789
www.scholarsworld.net [email protected] Volume.1, Issue.2, July 2013 [118]
The earnings per share of HDFC and ICICI Bank are recorded mean at 10.39 and36.71 per cent (Table-22)
respectively but HDFC bank share price split to Rs. 2 in 2012. The value of t-test at 5 % level of significance is
less than the critical value and there is no significance difference between the selected two banks earnings per
share. It clears that ICICI Bank earnings per share ratio are more increased compared with HDFC Bank.
5. Return on Net worth (RON):
Return on shareholders’ investment, popularly known as return on investment or return on shareholders’ funds
is the relationship between net profits and the proprietors’ funds. Net profit after interest and tax is divided by
the shareholders’ funds. This ratio is one of the most important ratios used for measuring the overall efficiency
of a bank. The primary objective of business is to maximize its earnings and this ratio indicates the extent to
which this primary objective of business is being achieved. This ratio is of a great importance to the present and
prospective shareholders as well as the management of the bank.
Return on Net Worth=Net Profit/Net-worth ,
TABLE-21: RETURN ON NET-WORTH (%)
Years HDFC ICICI
2003 18.1 16.58
2004 20.14 19.90
2005 20.44 20.77
2006 17.47 11.29
2007 19.40 12.18
2008 16.05 8.94
2009 16.12 7.58
2010 16.80 7.79
2011 16.52 9.35
2012 18.37 10.70
Source: Various issues of CMIE, RBI and Bank Annual Reports.
TABLE- 22: RETURN ON NET-WORTH
t-Test: Two-Sample Assuming Equal Variances
18.1 16.58
Mean 17.9233 12.0556
Variance 2.97817 24.396
Observations 9 9
Pooled Variance 13.6871
Hypothesized Mean Difference 0
Df 16
t Stat 3.36453
P(T<=t) one-tail 0.00197
t Critical one-tail 1.74588
P(T<=t) two-tail 0.00394
t Critical two-tail 2.11991
Source: Compiled from Table- 21
From the table-22 it is clear that the value of t-test at 5 % level of significance is less than the critical value.
Hence there is no significance difference between the selected two banks return on net-worth. The average
return on net-worth of HDFC and ICICI bank is 17.92 per cent and 12.06 per cent; hence HDFC performance is
good compared with ICICI bank.
6. Return on Assets:
This ratio measures the return on assets employed or efficiency in utilization of the assets. It is arrived at by
dividing net profit by total assets.
Return on Assets =Net Profit/Total Assets
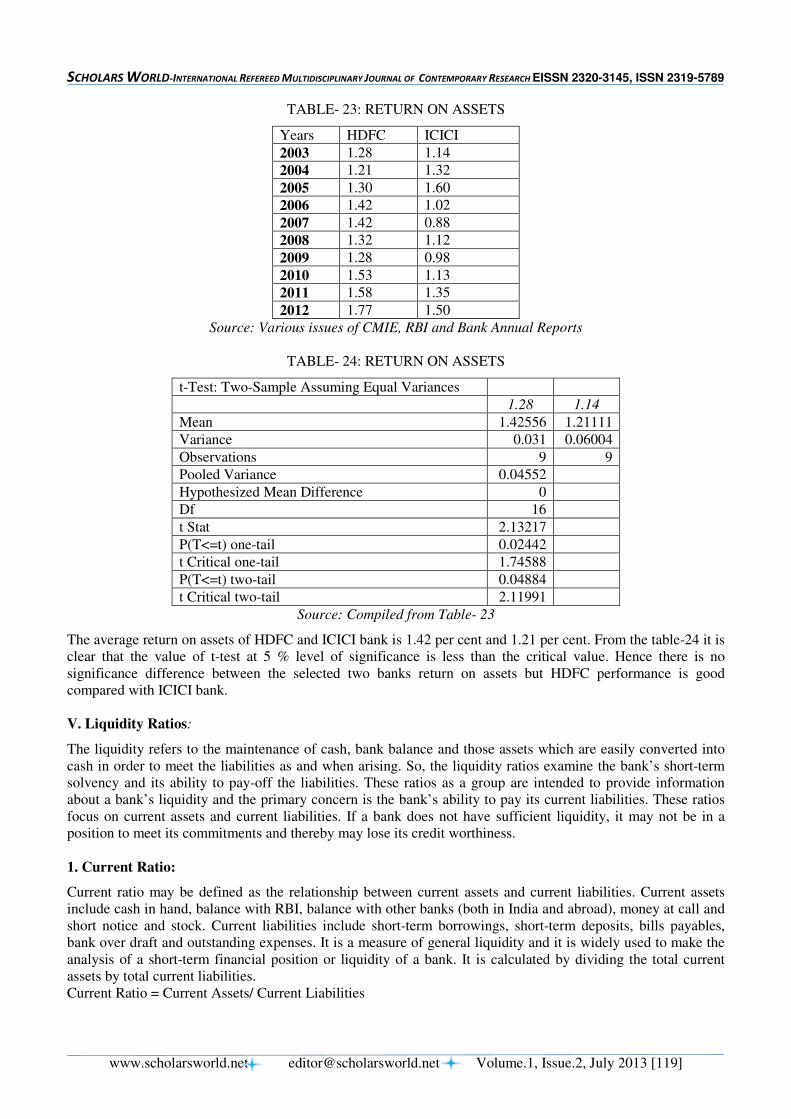
SCHOLARS WORLD-INTERNATIONAL REFEREED MULTIDISCIPLINARY JOURNAL OF CONTEMPORARY RESEARCH EISSN 2320-3145, ISSN 2319-5789
www.scholarsworld.net [email protected] Volume.1, Issue.2, July 2013 [119]
TABLE- 23: RETURN ON ASSETS
Years HDFC ICICI
2003 1.28 1.14
2004 1.21 1.32
2005 1.30 1.60
2006 1.42 1.02
2007 1.42 0.88
2008 1.32 1.12
2009 1.28 0.98
2010 1.53 1.13
2011 1.58 1.35
2012 1.77 1.50
Source: Various issues of CMIE, RBI and Bank Annual Reports
TABLE- 24: RETURN ON ASSETS
t-Test: Two-Sample Assuming Equal Variances
1.28 1.14
Mean 1.42556 1.21111
Variance 0.031 0.06004
Observations 9 9
Pooled Variance 0.04552
Hypothesized Mean Difference 0
Df 16
t Stat 2.13217
P(T<=t) one-tail 0.02442
t Critical one-tail 1.74588
P(T<=t) two-tail 0.04884
t Critical two-tail 2.11991
Source: Compiled from Table- 23
The average return on assets of HDFC and ICICI bank is 1.42 per cent and 1.21 per cent. From the table-24 it is
clear that the value of t-test at 5 % level of significance is less than the critical value. Hence there is no
significance difference between the selected two banks return on assets but HDFC performance is good
compared with ICICI bank.
V. Liquidity Ratios:
The liquidity refers to the maintenance of cash, bank balance and those assets which are easily converted into
cash in order to meet the liabilities as and when arising. So, the liquidity ratios examine the bank’s short-term
solvency and its ability to pay-off the liabilities. These ratios as a group are intended to provide information
about a bank’s liquidity and the primary concern is the bank’s ability to pay its current liabilities. These ratios
focus on current assets and current liabilities. If a bank does not have sufficient liquidity, it may not be in a
position to meet its commitments and thereby may lose its credit worthiness.
1. Current Ratio:
Current ratio may be defined as the relationship between current assets and current liabilities. Current assets
include cash in hand, balance with RBI, balance with other banks (both in India and abroad), money at call and
short notice and stock. Current liabilities include short-term borrowings, short-term deposits, bills payables,
bank over draft and outstanding expenses. It is a measure of general liquidity and it is widely used to make the
analysis of a short-term financial position or liquidity of a bank. It is calculated by dividing the total current
assets by total current liabilities.
Current Ratio = Current Assets/ Current Liabilities
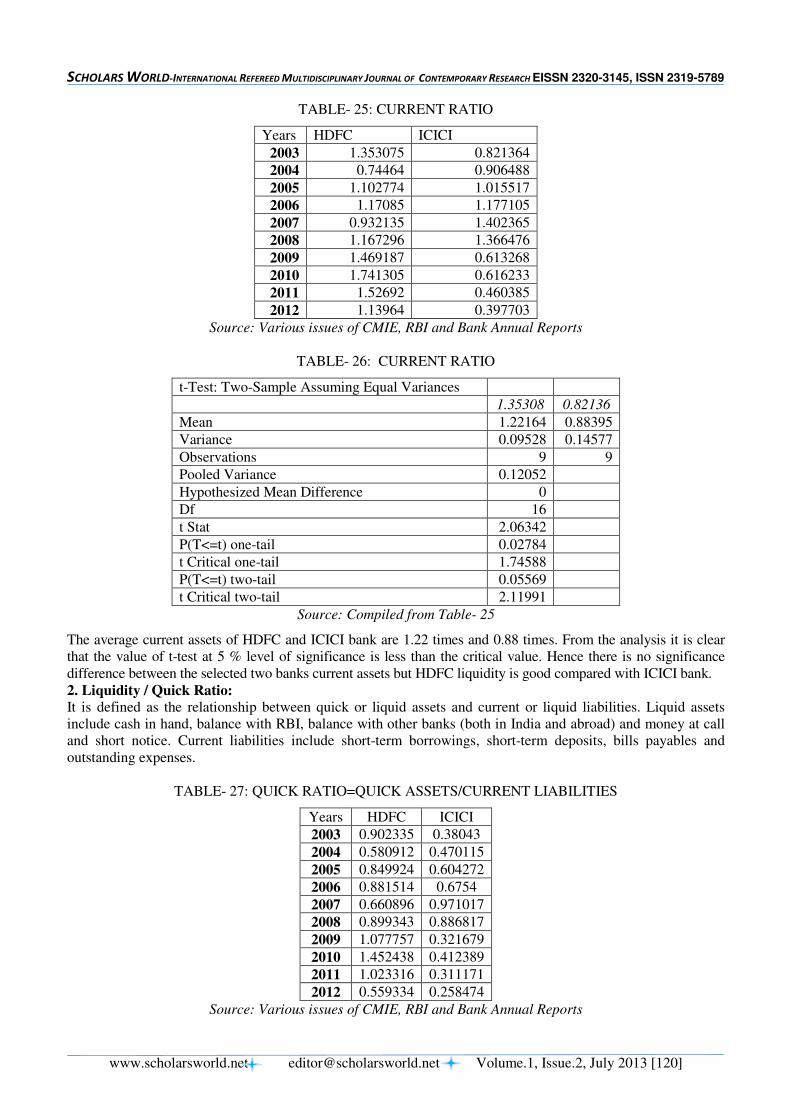
SCHOLARS WORLD-INTERNATIONAL REFEREED MULTIDISCIPLINARY JOURNAL OF CONTEMPORARY RESEARCH EISSN 2320-3145, ISSN 2319-5789
www.scholarsworld.net [email protected] Volume.1, Issue.2, July 2013 [120]
TABLE- 25: CURRENT RATIO
Years HDFC ICICI
2003 1.353075 0.821364
2004 0.74464 0.906488
2005 1.102774 1.015517
2006 1.17085 1.177105
2007 0.932135 1.402365
2008 1.167296 1.366476
2009 1.469187 0.613268
2010 1.741305 0.616233
2011 1.52692 0.460385
2012 1.13964 0.397703
Source: Various issues of CMIE, RBI and Bank Annual Reports
TABLE- 26: CURRENT RATIO
t-Test: Two-Sample Assuming Equal Variances
1.35308 0.82136
Mean 1.22164 0.88395
Variance 0.09528 0.14577
Observations 9 9
Pooled Variance 0.12052
Hypothesized Mean Difference 0
Df 16
t Stat 2.06342
P(T<=t) one-tail 0.02784
t Critical one-tail 1.74588
P(T<=t) two-tail 0.05569
t Critical two-tail 2.11991
Source: Compiled from Table- 25
The average current assets of HDFC and ICICI bank are 1.22 times and 0.88 times. From the analysis it is clear
that the value of t-test at 5 % level of significance is less than the critical value. Hence there is no significance
difference between the selected two banks current assets but HDFC liquidity is good compared with ICICI bank.
2. Liquidity / Quick Ratio:
It is defined as the relationship between quick or liquid assets and current or liquid liabilities. Liquid assets
include cash in hand, balance with RBI, balance with other banks (both in India and abroad) and money at call
and short notice. Current liabilities include short-term borrowings, short-term deposits, bills payables and
outstanding expenses.
TABLE- 27: QUICK RATIO=QUICK ASSETS/CURRENT LIABILITIES
Years HDFC ICICI
2003 0.902335 0.38043
2004 0.580912 0.470115
2005 0.849924 0.604272
2006 0.881514 0.6754
2007 0.660896 0.971017
2008 0.899343 0.886817
2009 1.077757 0.321679
2010 1.452438 0.412389
2011 1.023316 0.311171
2012 0.559334 0.258474
Source: Various issues of CMIE, RBI and Bank Annual Reports
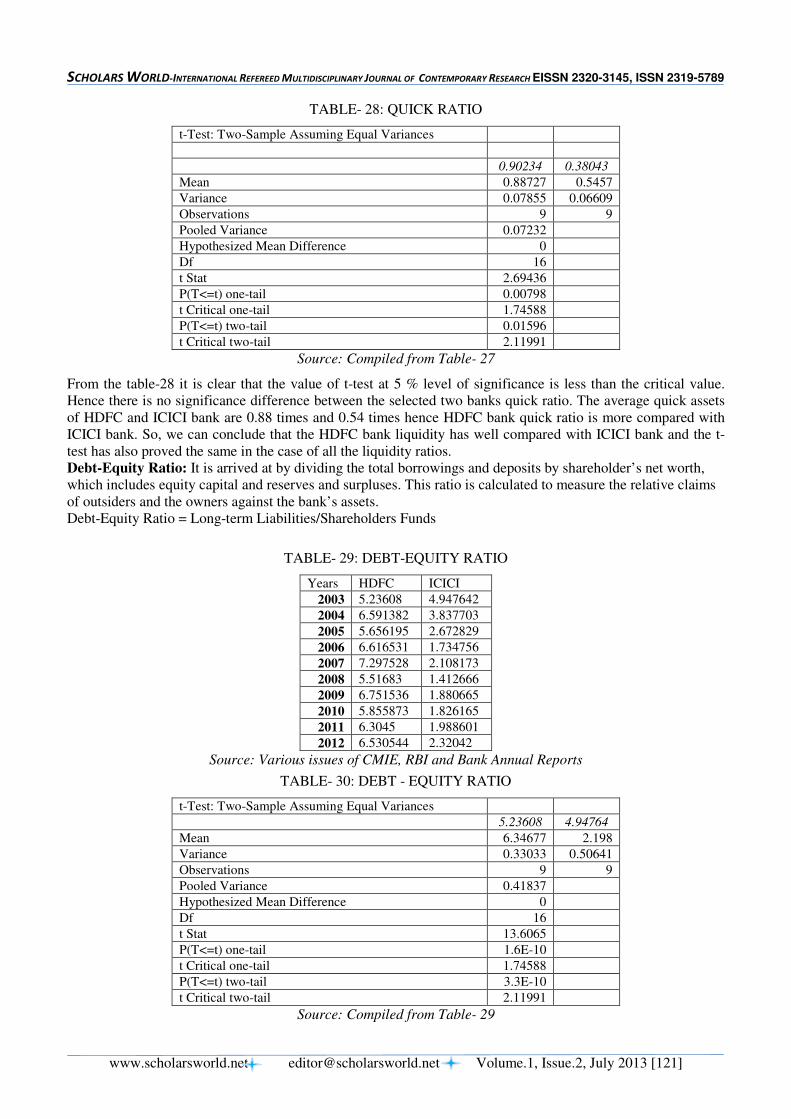
SCHOLARS WORLD-INTERNATIONAL REFEREED MULTIDISCIPLINARY JOURNAL OF CONTEMPORARY RESEARCH EISSN 2320-3145, ISSN 2319-5789
www.scholarsworld.net [email protected] Volume.1, Issue.2, July 2013 [121]
TABLE- 28: QUICK RATIO
t-Test: Two-Sample Assuming Equal Variances
0.90234 0.38043
Mean 0.88727 0.5457
Variance 0.07855 0.06609
Observations 9 9
Pooled Variance 0.07232
Hypothesized Mean Difference 0
Df 16
t Stat 2.69436
P(T<=t) one-tail 0.00798
t Critical one-tail 1.74588
P(T<=t) two-tail 0.01596
t Critical two-tail 2.11991
Source: Compiled from Table- 27
From the table-28 it is clear that the value of t-test at 5 % level of significance is less than the critical value.
Hence there is no significance difference between the selected two banks quick ratio. The average quick assets
of HDFC and ICICI bank are 0.88 times and 0.54 times hence HDFC bank quick ratio is more compared with
ICICI bank. So, we can conclude that the HDFC bank liquidity has well compared with ICICI bank and the t-
test has also proved the same in the case of all the liquidity ratios.
Debt-Equity Ratio: It is arrived at by dividing the total borrowings and deposits by shareholder’s net worth,
which includes equity capital and reserves and surpluses. This ratio is calculated to measure the relative claims
of outsiders and the owners against the bank’s assets.
Debt-Equity Ratio = Long-term Liabilities/Shareholders Funds
TABLE- 29: DEBT-EQUITY RATIO
Years HDFC ICICI
2003 5.23608 4.947642
2004 6.591382 3.837703
2005 5.656195 2.672829
2006 6.616531 1.734756
2007 7.297528 2.108173
2008 5.51683 1.412666
2009 6.751536 1.880665
2010 5.855873 1.826165
2011 6.3045 1.988601
2012 6.530544 2.32042
Source: Various issues of CMIE, RBI and Bank Annual Reports
TABLE- 30: DEBT - EQUITY RATIO
t-Test: Two-Sample Assuming Equal Variances
5.23608 4.94764
Mean 6.34677 2.198
Variance 0.33033 0.50641
Observations 9 9
Pooled Variance 0.41837
Hypothesized Mean Difference 0
Df 16
t Stat 13.6065
P(T<=t) one-tail 1.6E-10
t Critical one-tail 1.74588
P(T<=t) two-tail 3.3E-10
t Critical two-tail 2.11991
Source: Compiled from Table- 29

SCHOLARS WORLD-INTERNATIONAL REFEREED MULTIDISCIPLINARY JOURNAL OF CONTEMPORARY RESEARCH EISSN 2320-3145, ISSN 2319-5789
www.scholarsworld.net [email protected] Volume.1, Issue.2, July 2013 [122]
The debt-equity ratio of HDFC and ICICI Bank are recorded mean at 6.34 and 2.19 (Table-30) respectively.
The value of t-test at 5 % level of significance is less than the critical value and there is no significance
difference between the selected two banks debt-equity ratio. It clears that ICICI Bank debt-equity ratio is less
compared with HDFC Bank. So we can say that the debt-equity ratio of ICICI bank have decreased during the
study period hence long term solvency is well in ICICI bank.
VI. Sensitivity to Market Risk:
Foreign exchange rates, commodity prices or equity prices can adversely affect a financial institution's earnings
or capital. For most institutions, market risk primarily reflects exposures to changes in interest rates. The S
component focuses on an institution's ability to identify, monitor, manage and control its market risk, and
provides institution management with a clear and focused indication of supervisory concerns in this area.
1. Spread Ratio: Spread is the difference between interest earned and interest paid. So spread is the amount available to the
commercial banks for meeting their administrative, operating and other expenses. As a matter of practice, banks
try to increase the spread volume so that it is sufficiently available to meet the non-interest expenses and the
remainder contributes to the profit volume.
The ratio of spread as percentage of working fund is considered to be an important ratio which indicates
profitability of commercial banks. The ratio is calculated by taking the difference between the ratios of interest
earned as percentage of working fund and interest paid as percentage of working fund.
Spread Ratio (%) = (Spread / Working Fund)*100
TABLE- 31: SPREAD RATIO
Years HDFC ICICI
2003 4.065869 1.3699929
2004 2.942775 1.7661133
2005 3.091641 1.7740989
2006 3.130357 1.5814548
2007 3.801131 1.6549622
2008 3.925632 2.0458639
2009 4.049195 2.2413608
2010 3.770133 2.2733131
2011 3.994711 2.2672698
2012 3.852238 2.3030628
Source: Various issues of CMIE, RBI and Bank Annual Reports
TABLE- 32 SPREAD RATIO
t-Test: Two-Sample Assuming Equal Variances
4.06587 1.36999
Mean 3.61753 1.98972
Variance 0.1881 0.08717
Observations 9 9
Pooled Variance 0.13763
Hypothesized Mean Difference 0
Df 16
t Stat 9.30779
P(T<=t) one-tail 3.7E-08
t Critical one-tail 1.74588
P(T<=t) two-tail 7.4E-08
t Critical two-tail 2.11991
Source: Compiled from Table- 31.
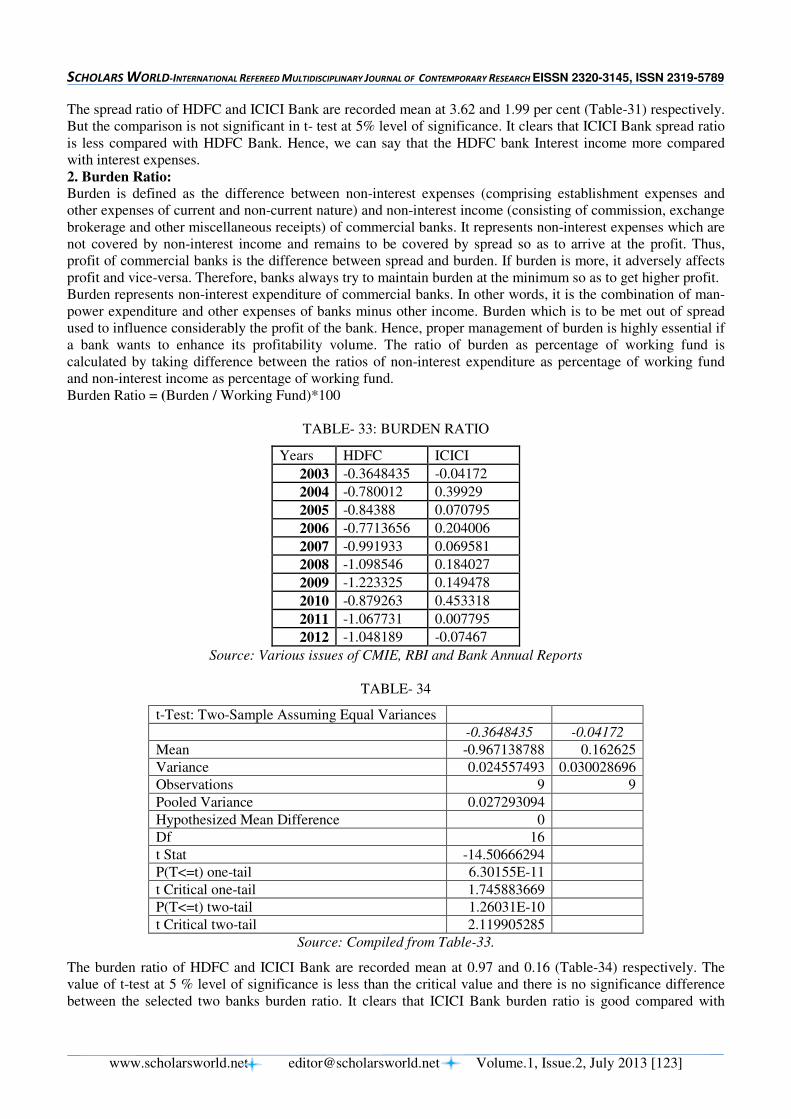
SCHOLARS WORLD-INTERNATIONAL REFEREED MULTIDISCIPLINARY JOURNAL OF CONTEMPORARY RESEARCH EISSN 2320-3145, ISSN 2319-5789
www.scholarsworld.net [email protected] Volume.1, Issue.2, July 2013 [123]
The spread ratio of HDFC and ICICI Bank are recorded mean at 3.62 and 1.99 per cent (Table-31) respectively.
But the comparison is not significant in t- test at 5% level of significance. It clears that ICICI Bank spread ratio
is less compared with HDFC Bank. Hence, we can say that the HDFC bank Interest income more compared
with interest expenses.
2. Burden Ratio:
Burden is defined as the difference between non-interest expenses (comprising establishment expenses and
other expenses of current and non-current nature) and non-interest income (consisting of commission, exchange
brokerage and other miscellaneous receipts) of commercial banks. It represents non-interest expenses which are
not covered by non-interest income and remains to be covered by spread so as to arrive at the profit. Thus,
profit of commercial banks is the difference between spread and burden. If burden is more, it adversely affects
profit and vice-versa. Therefore, banks always try to maintain burden at the minimum so as to get higher profit.
Burden represents non-interest expenditure of commercial banks. In other words, it is the combination of man-
power expenditure and other expenses of banks minus other income. Burden which is to be met out of spread
used to influence considerably the profit of the bank. Hence, proper management of burden is highly essential if
a bank wants to enhance its profitability volume. The ratio of burden as percentage of working fund is
calculated by taking difference between the ratios of non-interest expenditure as percentage of working fund
and non-interest income as percentage of working fund.
Burden Ratio = (Burden / Working Fund)*100
TABLE- 33: BURDEN RATIO
Years HDFC ICICI
2003 -0.3648435 -0.04172
2004 -0.780012 0.39929
2005 -0.84388 0.070795
2006 -0.7713656 0.204006
2007 -0.991933 0.069581
2008 -1.098546 0.184027
2009 -1.223325 0.149478
2010 -0.879263 0.453318
2011 -1.067731 0.007795
2012 -1.048189 -0.07467
Source: Various issues of CMIE, RBI and Bank Annual Reports
TABLE- 34
t-Test: Two-Sample Assuming Equal Variances
-0.3648435 -0.04172
Mean -0.967138788 0.162625
Variance 0.024557493 0.030028696
Observations 9 9
Pooled Variance 0.027293094
Hypothesized Mean Difference 0
Df 16
t Stat -14.50666294
P(T<=t) one-tail 6.30155E-11
t Critical one-tail 1.745883669
P(T<=t) two-tail 1.26031E-10
t Critical two-tail 2.119905285
Source: Compiled from Table-33.
The burden ratio of HDFC and ICICI Bank are recorded mean at 0.97 and 0.16 (Table-34) respectively. The
value of t-test at 5 % level of significance is less than the critical value and there is no significance difference
between the selected two banks burden ratio. It clears that ICICI Bank burden ratio is good compared with
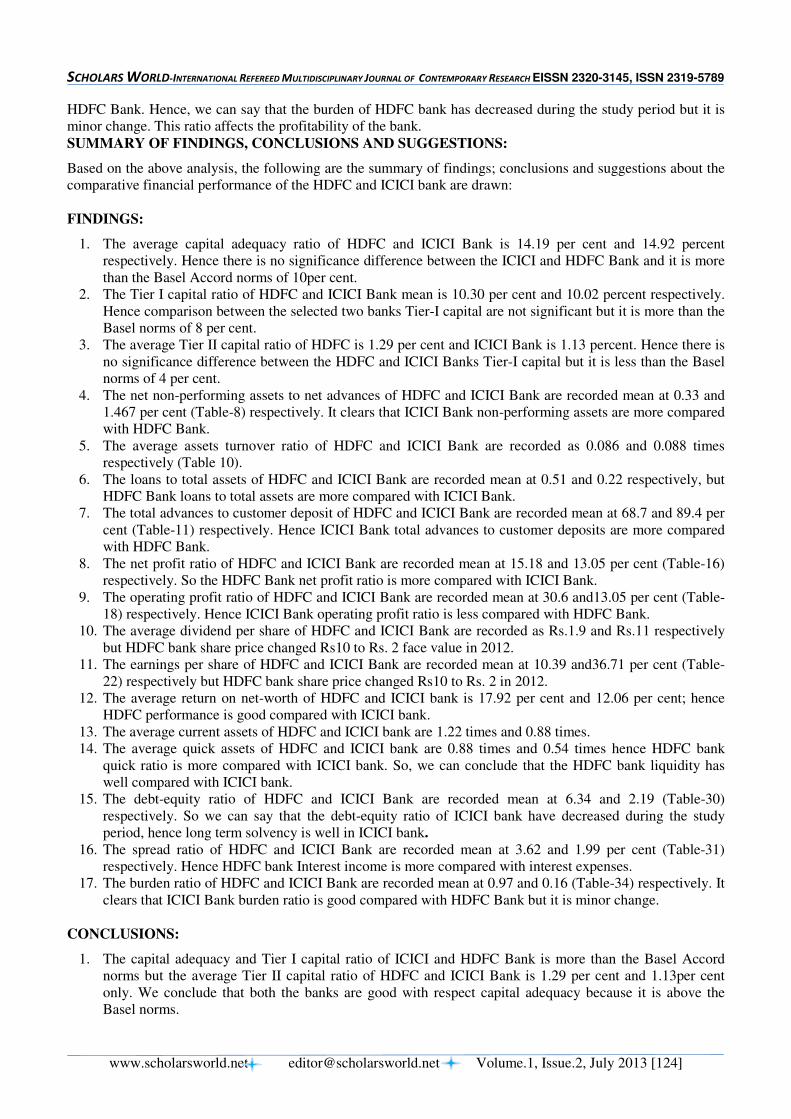
SCHOLARS WORLD-INTERNATIONAL REFEREED MULTIDISCIPLINARY JOURNAL OF CONTEMPORARY RESEARCH EISSN 2320-3145, ISSN 2319-5789
www.scholarsworld.net [email protected] Volume.1, Issue.2, July 2013 [124]
HDFC Bank. Hence, we can say that the burden of HDFC bank has decreased during the study period but it is
minor change. This ratio affects the profitability of the bank.
SUMMARY OF FINDINGS, CONCLUSIONS AND SUGGESTIONS:
Based on the above analysis, the following are the summary of findings; conclusions and suggestions about the
comparative financial performance of the HDFC and ICICI bank are drawn:
FINDINGS:
1. The average capital adequacy ratio of HDFC and ICICI Bank is 14.19 per cent and 14.92 percent
respectively. Hence there is no significance difference between the ICICI and HDFC Bank and it is more
than the Basel Accord norms of 10per cent.
2. The Tier I capital ratio of HDFC and ICICI Bank mean is 10.30 per cent and 10.02 percent respectively.
Hence comparison between the selected two banks Tier-I capital are not significant but it is more than the
Basel norms of 8 per cent.
3. The average Tier II capital ratio of HDFC is 1.29 per cent and ICICI Bank is 1.13 percent. Hence there is
no significance difference between the HDFC and ICICI Banks Tier-I capital but it is less than the Basel
norms of 4 per cent.
4. The net non-performing assets to net advances of HDFC and ICICI Bank are recorded mean at 0.33 and
1.467 per cent (Table-8) respectively. It clears that ICICI Bank non-performing assets are more compared
with HDFC Bank.
5. The average assets turnover ratio of HDFC and ICICI Bank are recorded as 0.086 and 0.088 times
respectively (Table 10).
6. The loans to total assets of HDFC and ICICI Bank are recorded mean at 0.51 and 0.22 respectively, but
HDFC Bank loans to total assets are more compared with ICICI Bank.
7. The total advances to customer deposit of HDFC and ICICI Bank are recorded mean at 68.7 and 89.4 per
cent (Table-11) respectively. Hence ICICI Bank total advances to customer deposits are more compared
with HDFC Bank.
8. The net profit ratio of HDFC and ICICI Bank are recorded mean at 15.18 and 13.05 per cent (Table-16)
respectively. So the HDFC Bank net profit ratio is more compared with ICICI Bank.
9. The operating profit ratio of HDFC and ICICI Bank are recorded mean at 30.6 and13.05 per cent (Table-
18) respectively. Hence ICICI Bank operating profit ratio is less compared with HDFC Bank.
10. The average dividend per share of HDFC and ICICI Bank are recorded as Rs.1.9 and Rs.11 respectively
but HDFC bank share price changed Rs10 to Rs. 2 face value in 2012.
11. The earnings per share of HDFC and ICICI Bank are recorded mean at 10.39 and36.71 per cent (Table-
22) respectively but HDFC bank share price changed Rs10 to Rs. 2 in 2012.
12. The average return on net-worth of HDFC and ICICI bank is 17.92 per cent and 12.06 per cent; hence
HDFC performance is good compared with ICICI bank.
13. The average current assets of HDFC and ICICI bank are 1.22 times and 0.88 times.
14. The average quick assets of HDFC and ICICI bank are 0.88 times and 0.54 times hence HDFC bank
quick ratio is more compared with ICICI bank. So, we can conclude that the HDFC bank liquidity has
well compared with ICICI bank.
15. The debt-equity ratio of HDFC and ICICI Bank are recorded mean at 6.34 and 2.19 (Table-30)
respectively. So we can say that the debt-equity ratio of ICICI bank have decreased during the study
period, hence long term solvency is well in ICICI bank.
16. The spread ratio of HDFC and ICICI Bank are recorded mean at 3.62 and 1.99 per cent (Table-31)
respectively. Hence HDFC bank Interest income is more compared with interest expenses.
17. The burden ratio of HDFC and ICICI Bank are recorded mean at 0.97 and 0.16 (Table-34) respectively. It
clears that ICICI Bank burden ratio is good compared with HDFC Bank but it is minor change.
CONCLUSIONS:
1. The capital adequacy and Tier I capital ratio of ICICI and HDFC Bank is more than the Basel Accord
norms but the average Tier II capital ratio of HDFC and ICICI Bank is 1.29 per cent and 1.13per cent
only. We conclude that both the banks are good with respect capital adequacy because it is above the
Basel norms.
SCHOLARS WORLD-INTERNATIONAL REFEREED MULTIDISCIPLINARY JOURNAL OF CONTEMPORARY RESEARCH EISSN 2320-3145, ISSN 2319-5789
www.scholarsworld.net [email protected] Volume.1, Issue.2, July 2013 [125]
2. The net non-performing assets to net advances of ICICI Bank non-performing assets are more compared
with HDFC Bank. The efficiency of HDFC Bank management is good because its NPAs are less than 0.5
for the study period from 2013 to 2012.
3. The loans to total assets of HDFC are more compared with ICICI Bank. Hence, we can say that the risk is
more in HDFC bank compared with ICICI Bank.
4. The total advances to customer deposit of HDFC are less compared with ICICI Bank. Hence, ICICI bank
is managing more efficiently for converting deposits to advances.
5. The net profit, operating profit ratio of HDFC Bank is more compared with ICICI Bank. The average
return on net-worth of HDFC and ICICI bank is 17.92 per cent and 12.06 per cent; hence HDFC
performance is good compared with ICICI bank.
6. The average current assets and quick assets of HDFC is more compared with ICICI bank. So, we can
conclude that the HDFC bank liquidity has well compared with ICICI bank and the t-test has also proved
the same in the case of all the liquidity ratios.
7. The debt-equity ratio of ICICI Bank is less compared with HDFC bank; hence long term solvency is well
in ICICI bank.
8. The spread ratio of ICICI Bank is less compared with HDFC Bank. Hence, we can say that the HDFC
bank Interest income more compared with interest expenses. Hence HDFC bank earns more profits.
9. The burden ratio of ICICI Bank is good compared with HDFC Bank. But spread is more in HDFC bank
hence it earns more profits.
From the CAMELS’ analysis it clears that there is no significance difference between the ICICI and HDFC bank’s
financial performance but we conclude that the ICICI bank performance is slightly less compared with HDFC.
SUGGESTIONS:
In the light of the above conclusions the following suggestions may be made:
1. The NPAs of the ICIC bank is more than one per cent, hence should control NPAs otherwise it affects the
asset quality in long run.
2. The burden of the HDFC bank should control within the short-period otherwise the profit of the bank is
eaten away by the increased burden in the long-run.
3. The spread of the ICIC bank should control otherwise the income of the bank is eaten away by the
interest expenses in the long-run.
REFERENCES:
1. Sathya and Bhattacharya et el (1997) : “Impact of Privatization on the Performance of the Public Sector
Banks, Journal of Management Review: pp 45-55.
2. K. SRINIVAS (2010): “Pre and Post Merger Financial Performance of Merged Banks- A Select Study”,
Indian Journal of Finance, May 2010.
3. Chowdari Prasad and K.S. Srinivasa Rao (2004) : “Private Sector Banks in India - A SWOT Analysis,
Bankers Profession, pp 28-33.
4. Sanjay J. Bhayani (2006): “Performance of the New Indian Private Banks – A Comparative Study,
Banking Review: pp 55 – 59.
5. Chidambaram R.M and Alamelu (1994): “Profitability in Banks – A matter of Survival, The Banker: pp
1-3 May.
6. Das A. (1997): “Technical, Allocative and Scale Efficiency of Public Sector Banks in India, RBI
Occasional Papers, June to September.
7. Barman R. B. and Samanta G. P “Banking Services Price Index: An Exploratory Analysis for India”
(www.financialindia.com)
8. Bhadury Prof. Subrato (2007) conducted study on “Commercial banking in India new challenges and
opportunities after liberalization” South Asian Journal of Socio-Political Studies (Vol No-2, Jan-June
2007).
9. Board John Sutcliffe, Ziemba Charles, William T.(2003) “Applying Operations ResearchTechniques to
Financial Markets” Interfaces; (Mar/Apr2003, vol. 33 issue 2), (Pg12-24).
10. Brown Craig O. and Dinc I. Serdar (2005) “The Politics of Bank Failures: Evidence from Emerging
Markets” Quarterly Journal of Economics, (November 2005) (Pg-1413-1443).
SCHOLARS WORLD-INTERNATIONAL REFEREED MULTIDISCIPLINARY JOURNAL OF CONTEMPORARY RESEARCH EISSN 2320-3145, ISSN 2319-5789
www.scholarsworld.net [email protected] Volume.1, Issue.2, July 2013 [126]
11. Batra Mr. Sumant & Dass Kesar (2003) “Maximising value of Non Performing Assets” Forum for Asian
Insolvency Reform (FAIR) (Seoul, Korea 10 - 11 November 2003).
12. Chhikara Dr. Sudesh (2007) “Causes and Impact of Non Performing Assets in Public Sector Banks: A
state level Analysis” Amity Management Analyst ( Vol 1, No 2) (2007) ( Pg. No. 48-56).
13. Chen Ping, Yang Hailiang ,Yin George (2008) “Markowitz's meanvariance asset-liability management
with regime switching: A continuous209 time model” Insurance, Mathematics & Economics.
Amsterdam: (Dec 2008.Vol. 43, Issue. 3);(Pg. 456-461).
14. Chipalkatti Niranjan , Rishi Meenakshi (2007) “Do Indian banks understate their bad loans?” The Journal
of Developing Areas. Nashville: (Spring 2007. Vol. 40, Issue. 2) ;( Pg. 75-91).
15. Chakrabarti Rajesh and Chawla Gaurav (2005) “Bank Efficiency in India since the Reforms: An
Assessment” Money & Finance ICRA Bulletin, (July-Dec’05) (Pg.-31-42).
16. Deolalkar G.H “The Indian Banking Sector On the road to progress” Article from (www.fedral.co.in) 15.
Derviz Alexis and Podpiera Jiri “Predicting Bank CAMEL ad S&P ratings: The Caste of Czech
Republic” Working Paper Series, printed and distributed by Czech National Bank (http://www.cnb.cz.).
17. Demirgüç-Kunt Asli and Detragiache Enrica (1998) “The Determinants of Banking Crises: Evidence
from Developed and Developing Countries” IMF staff papers (Vol.45, No.1) (March,1998).
18. Das, Abhima, Ghosh, Saibal (2006) “Financial Deregulation and Efficiency: An Empirical Analysis of
Indian Banks during the Post Reform Period” Review of Financial Economics; (Sep2006, Vol. 15 Issue
3), (Pg193-221).
19. Dhar V Ganga and Reddy G Nares (2007) “Mergers and acquisitions in the Banking Sector- an Empirical
Analysis”ICFAI Reader, (March 2007), (Pg: 42-50).
20. Detemple Jérôme , Rindisbache Marcel R (2008) ”Insurance, Mathematics & Economics. Amsterdam:
(Dec 2008. Vol. 43, Issue. 3); (Pg. 281).
21. Frierson, Robert DeV (2007) “Orders Issued under section 4 of the Bank holding Company Act” Federal
Reserve Bulletin; (3/1/2007), (Pg44-48).
----

SCHOLARS WORLD-INTERNATIONAL REFEREED MULTIDISCIPLINARY JOURNAL OF CONTEMPORARY RESEARCH EISSN 2320-3145, ISSN 2319-5789
www.scholarsworld.net [email protected] Volume.1, Issue.2, July 2013 [127]
CASE OF LOGISTICS AND INFORMATION
SYSTEM (LIS) VIS A VIS MC DONALD’S
DrAnubha Vashisht,
Symbiosis Centre for Management Studies Noida (Constituent of Symbiosis International
University)-India
DrAakanksha Uppal,
INMANTEC Business School, Ghaziabad-India
ABSTRACT
Logistics information system (LIS) involves the integration of information, transportation, inventory, warehousing, material handling and packaging. Logistics is a channel of the supply chain which adds value of time and place utility. During the last few decades, logistics developed from an unglamorous function to an important set of activities that add value to firms. Logistics has been identified as a great potential to become the next governing element of corporate strategy to create value for customers, generate cost savings, enforce discipline in marketing efforts and extend the flexibility of production. This paper intends to study different information technology tools used by Mc Donald’s for logistics integration and study key challenges faced in Logistic Management by McDonald’s.
Keywords: Logistics, Forward integration, McDonalds, Logistics information system, Logistics Integration
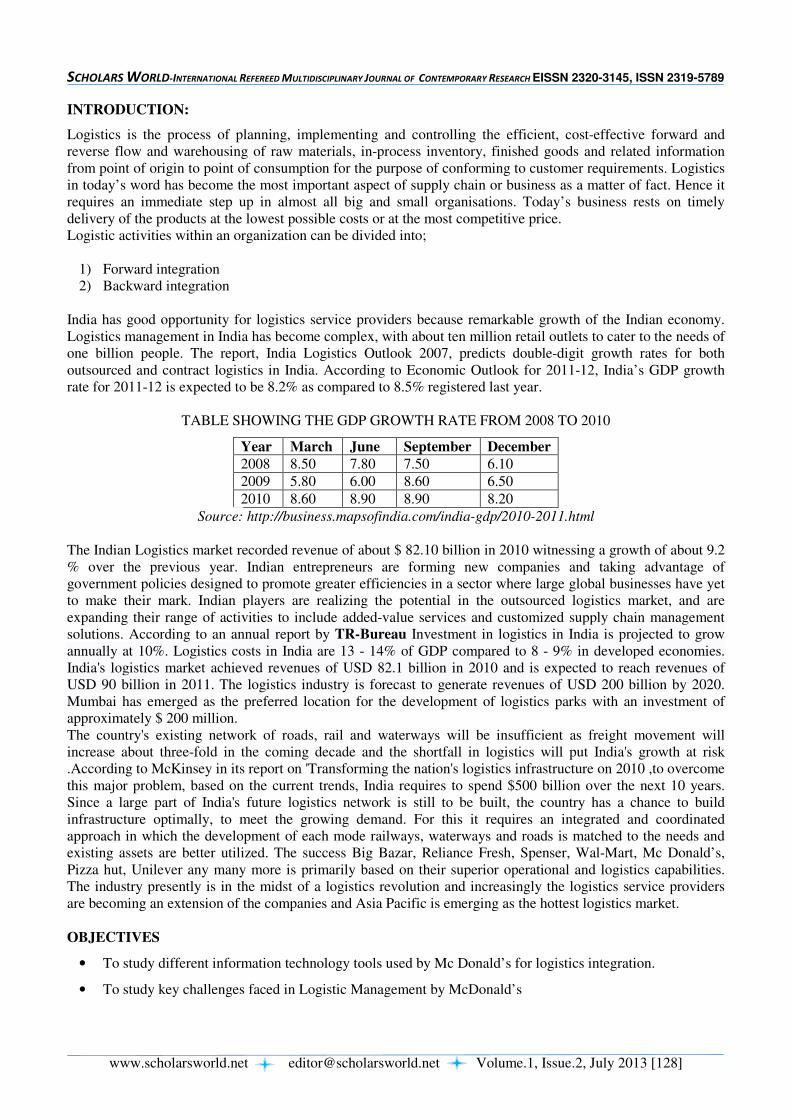
SCHOLARS WORLD-INTERNATIONAL REFEREED MULTIDISCIPLINARY JOURNAL OF CONTEMPORARY RESEARCH EISSN 2320-3145, ISSN 2319-5789
www.scholarsworld.net [email protected] Volume.1, Issue.2, July 2013 [128]
INTRODUCTION:
Logistics is the process of planning, implementing and controlling the efficient, cost-effective forward and reverse flow and warehousing of raw materials, in-process inventory, finished goods and related information from point of origin to point of consumption for the purpose of conforming to customer requirements. Logistics in today’s word has become the most important aspect of supply chain or business as a matter of fact. Hence it requires an immediate step up in almost all big and small organisations. Today’s business rests on timely delivery of the products at the lowest possible costs or at the most competitive price. Logistic activities within an organization can be divided into;
1) Forward integration 2) Backward integration
India has good opportunity for logistics service providers because remarkable growth of the Indian economy. Logistics management in India has become complex, with about ten million retail outlets to cater to the needs of one billion people. The report, India Logistics Outlook 2007, predicts double-digit growth rates for both outsourced and contract logistics in India. According to Economic Outlook for 2011-12, India’s GDP growth rate for 2011-12 is expected to be 8.2% as compared to 8.5% registered last year.
TABLE SHOWING THE GDP GROWTH RATE FROM 2008 TO 2010
Year March June September December 2008 8.50 7.80 7.50 6.10
2009 5.80 6.00 8.60 6.50
2010 8.60 8.90 8.90 8.20
Source: http://business.mapsofindia.com/india-gdp/2010-2011.html
The Indian Logistics market recorded revenue of about $ 82.10 billion in 2010 witnessing a growth of about 9.2 % over the previous year. Indian entrepreneurs are forming new companies and taking advantage of government policies designed to promote greater efficiencies in a sector where large global businesses have yet to make their mark. Indian players are realizing the potential in the outsourced logistics market, and are expanding their range of activities to include added-value services and customized supply chain management solutions. According to an annual report by TR-Bureau Investment in logistics in India is projected to grow annually at 10%. Logistics costs in India are 13 - 14% of GDP compared to 8 - 9% in developed economies. India's logistics market achieved revenues of USD 82.1 billion in 2010 and is expected to reach revenues of USD 90 billion in 2011. The logistics industry is forecast to generate revenues of USD 200 billion by 2020. Mumbai has emerged as the preferred location for the development of logistics parks with an investment of approximately $ 200 million. The country's existing network of roads, rail and waterways will be insufficient as freight movement will increase about three-fold in the coming decade and the shortfall in logistics will put India's growth at risk .According to McKinsey in its report on 'Transforming the nation's logistics infrastructure on 2010 ,to overcome this major problem, based on the current trends, India requires to spend $500 billion over the next 10 years. Since a large part of India's future logistics network is still to be built, the country has a chance to build infrastructure optimally, to meet the growing demand. For this it requires an integrated and coordinated approach in which the development of each mode railways, waterways and roads is matched to the needs and existing assets are better utilized. The success Big Bazar, Reliance Fresh, Spenser, Wal-Mart, Mc Donald’s, Pizza hut, Unilever any many more is primarily based on their superior operational and logistics capabilities. The industry presently is in the midst of a logistics revolution and increasingly the logistics service providers are becoming an extension of the companies and Asia Pacific is emerging as the hottest logistics market.
OBJECTIVES
• To study different information technology tools used by Mc Donald’s for logistics integration.
• To study key challenges faced in Logistic Management by McDonald’s
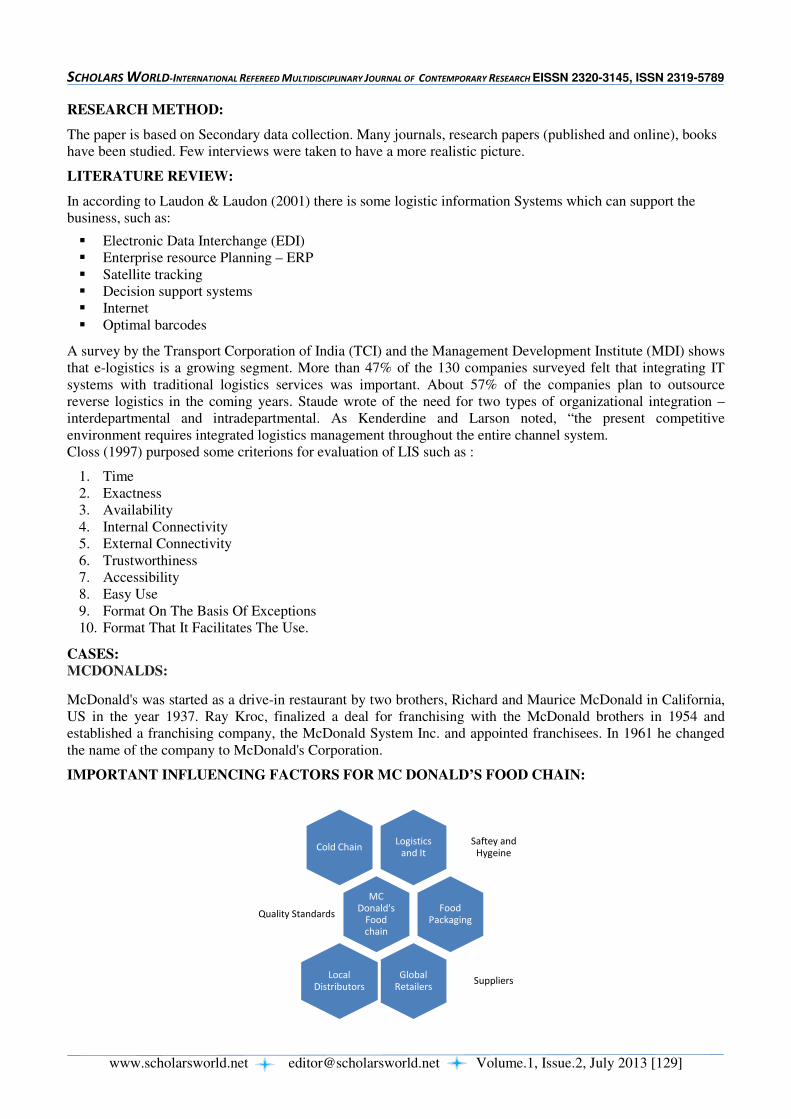
SCHOLARS WORLD-INTERNATIONAL REFEREED MULTIDISCIPLINARY JOURNAL OF CONTEMPORARY RESEARCH EISSN 2320-3145, ISSN 2319-5789
www.scholarsworld.net [email protected] Volume.1, Issue.2, July 2013 [129]
RESEARCH METHOD:
The paper is based on Secondary data collection. Many journals, research papers (published and online), books have been studied. Few interviews were taken to have a more realistic picture.
LITERATURE REVIEW:
In according to Laudon & Laudon (2001) there is some logistic information Systems which can support the business, such as:
� Electronic Data Interchange (EDI) � Enterprise resource Planning – ERP � Satellite tracking � Decision support systems � Internet � Optimal barcodes
A survey by the Transport Corporation of India (TCI) and the Management Development Institute (MDI) shows that e-logistics is a growing segment. More than 47% of the 130 companies surveyed felt that integrating IT systems with traditional logistics services was important. About 57% of the companies plan to outsource reverse logistics in the coming years. Staude wrote of the need for two types of organizational integration – interdepartmental and intradepartmental. As Kenderdine and Larson noted, “the present competitive environment requires integrated logistics management throughout the entire channel system. Closs (1997) purposed some criterions for evaluation of LIS such as :
1. Time 2. Exactness 3. Availability 4. Internal Connectivity 5. External Connectivity 6. Trustworthiness 7. Accessibility 8. Easy Use 9. Format On The Basis Of Exceptions 10. Format That It Facilitates The Use.
CASES:
MCDONALDS:
McDonald's was started as a drive-in restaurant by two brothers, Richard and Maurice McDonald in California, US in the year 1937. Ray Kroc, finalized a deal for franchising with the McDonald brothers in 1954 and established a franchising company, the McDonald System Inc. and appointed franchisees. In 1961 he changed the name of the company to McDonald's Corporation.
IMPORTANT INFLUENCING FACTORS FOR MC DONALD’S FOOD CHAIN:
Logistics
and It
Saftey and
HygeineCold Chain
MC
Donald's
Food
chain
Quality StandardsFood
Packaging
Global
RetailersSuppliers
Local
Distributors
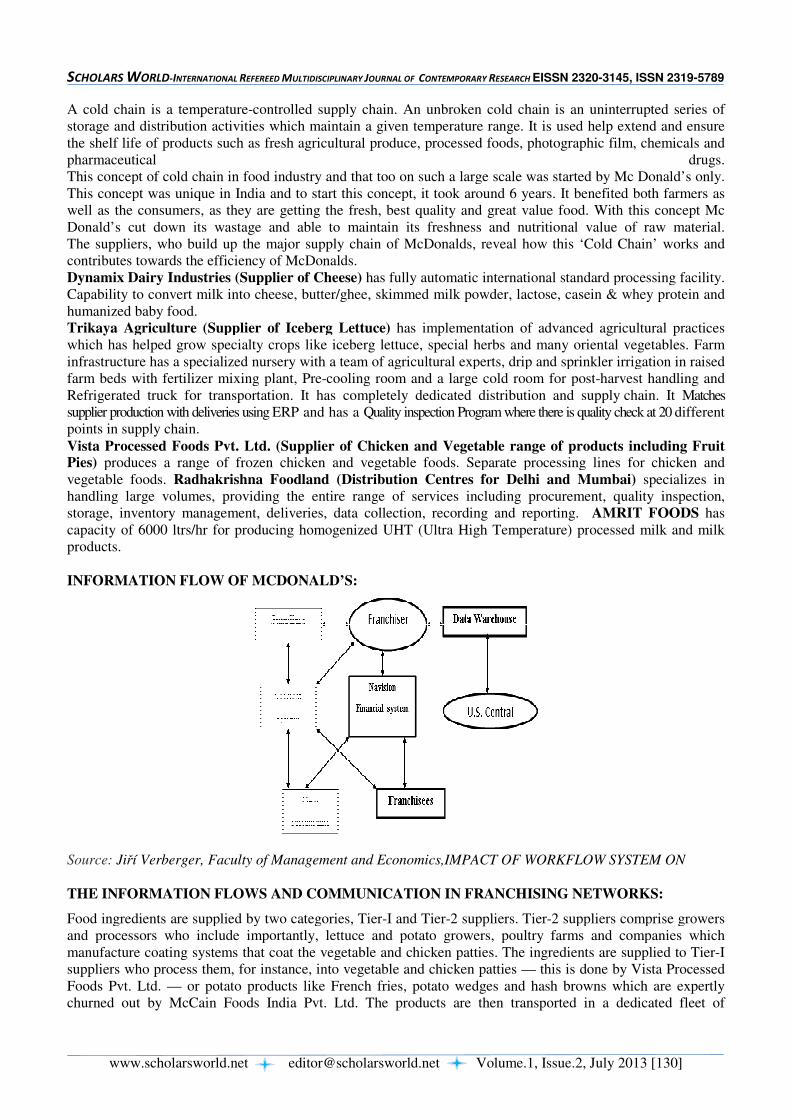
SCHOLARS WORLD-INTERNATIONAL REFEREED M
www.scholarsworld.net
A cold chain is a temperature-controlled supply chain. An unbroken cold chain is an uninterrupted series of storage and distribution activities which maintain a given temperathe shelf life of products such as fresh agricultural produce, processed foods, photographic film, chemicals and pharmaceutical drugs.This concept of cold chain in food industry and that too on such a large scThis concept was unique in India and to start this concept, it took around 6 years. It benefited both farmers as well as the consumers, as they are getting the fresh, best quality and great value food. With this conceptDonald’s cut down its wastage and able to maintain its freshness and nutrThe suppliers, who build up the major supply chain of McDonalds, reveal how this ‘Cold Chain’ works and contributes towards the efficiency of McDonDynamix Dairy Industries (Supplier of Cheese)
Capability to convert milk into cheese, butter/ghee, skimmed milk powder, lactose, casein & whey protein and humanized baby food. Trikaya Agriculture (Supplier of Iceberg Lettuce)
which has helped grow specialty crops like iceberg lettuce, special herbs and many oriental vegetables. Farm infrastructure has a specialized nursery with a teamfarm beds with fertilizer mixing plant, PreRefrigerated truck for transportation. It has csupplier production with deliveries using ERPpoints in supply chain. Vista Processed Foods Pvt. Ltd. (Supplier of Chicken and Vegetable range of products including Fruit Pies) produces a range of frozen chicken and vegetable foods. Separate processing lines for chicken and vegetable foods. Radhakrishna Foodland (Distributio
handling large volumes, providing the entire range of services including procurement, quality inspection, storage, inventory management, deliveries, data collection, recording and reporting. capacity of 6000 ltrs/hr for producing homogenized UHT (Ultra High Temperature) prproducts. INFORMATION FLOW OF MCDONALD’S
Source: Jiří Verberger, Faculty of Management and Economics,
THE INFORMATION FLOWS AND COMMUN
Food ingredients are supplied by two categories, Tierand processors who include importantly, lettuce and potato growers, poultry farms and companiesmanufacture coating systems that coat the vegetable and chicken patties. The ingredients are supplied to Tiersuppliers who process them, for instance, into vegetable and chicken patties Foods Pvt. Ltd. — or potato products like French fries, potato wedges and hash browns which are expertly churned out by McCain Foods India Pvt. Ltd. The products are then transported in a dedicated fleet of
MULTIDISCIPLINARY JOURNAL OF CONTEMPORARY RESEARCH EISSN 2320
[email protected] Volume.1, Issue.2, July
controlled supply chain. An unbroken cold chain is an uninterrupted series of storage and distribution activities which maintain a given temperature range. It is used help extend and ensure the shelf life of products such as fresh agricultural produce, processed foods, photographic film, chemicals and pharmaceutical drugs.This concept of cold chain in food industry and that too on such a large scale was started by Mc Donald’s only. This concept was unique in India and to start this concept, it took around 6 years. It benefited both farmers as well as the consumers, as they are getting the fresh, best quality and great value food. With this conceptDonald’s cut down its wastage and able to maintain its freshness and nutritional value of raw material. The suppliers, who build up the major supply chain of McDonalds, reveal how this ‘Cold Chain’ works and contributes towards the efficiency of McDonalds. Dynamix Dairy Industries (Supplier of Cheese) has fully automatic international standard processing facility. Capability to convert milk into cheese, butter/ghee, skimmed milk powder, lactose, casein & whey protein and
griculture (Supplier of Iceberg Lettuce) has implementation of advanced agricultural practices which has helped grow specialty crops like iceberg lettuce, special herbs and many oriental vegetables. Farm infrastructure has a specialized nursery with a team of agricultural experts, drip and sprinkler irrigation in raised farm beds with fertilizer mixing plant, Pre-cooling room and a large cold room for postRefrigerated truck for transportation. It has completely dedicated distribution and
ERP and has a Quality inspection Program where there is
Vista Processed Foods Pvt. Ltd. (Supplier of Chicken and Vegetable range of products including Fruit produces a range of frozen chicken and vegetable foods. Separate processing lines for chicken and
Radhakrishna Foodland (Distribution Centres for Delhi and Mumbai)
handling large volumes, providing the entire range of services including procurement, quality inspection, storage, inventory management, deliveries, data collection, recording and reporting. apacity of 6000 ltrs/hr for producing homogenized UHT (Ultra High Temperature) pr
INFORMATION FLOW OF MCDONALD’S:
í Verberger, Faculty of Management and Economics,IMPACT OF WORKFLOW S
FLOWS AND COMMUNICATION IN FRANCHISING NETWORKS:
Food ingredients are supplied by two categories, Tier-I and Tier-2 suppliers. Tier-2 suppliers comprise growers and processors who include importantly, lettuce and potato growers, poultry farms and companiesmanufacture coating systems that coat the vegetable and chicken patties. The ingredients are supplied to Tiersuppliers who process them, for instance, into vegetable and chicken patties — this is done by Vista Processed
o products like French fries, potato wedges and hash browns which are expertly churned out by McCain Foods India Pvt. Ltd. The products are then transported in a dedicated fleet of
EISSN 2320-3145, ISSN 2319-5789
Volume.1, Issue.2, July 2013 [130]
controlled supply chain. An unbroken cold chain is an uninterrupted series of ture range. It is used help extend and ensure
the shelf life of products such as fresh agricultural produce, processed foods, photographic film, chemicals and pharmaceutical drugs.
ale was started by Mc Donald’s only. This concept was unique in India and to start this concept, it took around 6 years. It benefited both farmers as well as the consumers, as they are getting the fresh, best quality and great value food. With this concept Mc
itional value of raw material. The suppliers, who build up the major supply chain of McDonalds, reveal how this ‘Cold Chain’ works and
has fully automatic international standard processing facility. Capability to convert milk into cheese, butter/ghee, skimmed milk powder, lactose, casein & whey protein and
mplementation of advanced agricultural practices which has helped grow specialty crops like iceberg lettuce, special herbs and many oriental vegetables. Farm
of agricultural experts, drip and sprinkler irrigation in raised cooling room and a large cold room for post-harvest handling and
nd supply chain. It Matches is quality check at 20 different
Vista Processed Foods Pvt. Ltd. (Supplier of Chicken and Vegetable range of products including Fruit produces a range of frozen chicken and vegetable foods. Separate processing lines for chicken and
n Centres for Delhi and Mumbai) specializes in handling large volumes, providing the entire range of services including procurement, quality inspection, storage, inventory management, deliveries, data collection, recording and reporting. AMRIT FOODS has apacity of 6000 ltrs/hr for producing homogenized UHT (Ultra High Temperature) processed milk and milk
IMPACT OF WORKFLOW SYSTEM ON
NG NETWORKS:
2 suppliers comprise growers and processors who include importantly, lettuce and potato growers, poultry farms and companies which manufacture coating systems that coat the vegetable and chicken patties. The ingredients are supplied to Tier-I
this is done by Vista Processed o products like French fries, potato wedges and hash browns which are expertly
churned out by McCain Foods India Pvt. Ltd. The products are then transported in a dedicated fleet of
SCHOLARS WORLD-INTERNATIONAL REFEREED MULTIDISCIPLINARY JOURNAL OF CONTEMPORARY RESEARCH EISSN 2320-3145, ISSN 2319-5789
www.scholarsworld.net [email protected] Volume.1, Issue.2, July 2013 [131]
refrigerated trucks to the company’s Distribution Centers. Multi-temperature and single temperature trucks then transport the fast food swiftly to the McDonald’s restaurants across the country. McDonald’s adheres to the Hazard Analysis Critical Control Point (HACCP) system which ensures food quality. But apart from HACCP, McDonald’s has also devised its own food safety systems, the Supplier Quality Management Systems (SQMS) and the Distributor Quality Maintenance Program (DQMP). The SQMS is a worldwide mandate for all McDonalds’ suppliers and includes essentials of the HACCP control system, while also contriving several principles of its own. These systems are applicable to processing and manufacturing plants. The DQMS audits and checks the warehouses of the chain. It has E-procurement system. This system is the business-to-business or business-to-consumer or Business-to-government purchase and sale of supplies, Work and services through the Internet as well as other information and networking systems, such as Electronic Data Interchange and Enterprise Resource Planning. E-procurement is a Web site that allows qualified and registered users to look for buyers or sellers of goods and services. Customers can qualify for volume discounts or special offers on the web. Emac Digital is E-Procurement website which is jointly by McDonalds and Accel-KKR Internet Co. The supply-chain network of McDonald’s, which appears to work effortlessly, is powered by various IT systems which enhance its effectiveness. According to Bhupinder Singh, CEO, Vista Processed Foods Pvt. Ltd they use SAP for theirTier-1 supplier of the chain. In RK Foodland the Distribution Centers have RAMCO Marshall ERP with Cobra software. These systems are used to directly upload store orders. At the restaurant level, the fast food chain has in-house developed technologies which track day-to-day sales, enables restaurants to schedule staff and send forecast orders to Distribution centers. THE RESEARCHERS WHILE ANALYZING THE KEY CHALLENGES FACED IN LOGISTIC
MANAGEMENT BY MCDONALD’S FOUND THAT WITH ESCALATING GROWTH OF FAST
FOOD INDUSTRY.
• More capacity should be added to the supply chain and the number of distribution centers should be increased.
• There is insufficient knowledge about the software application, under-exposure of logistics solution providers and hence proper training is required.
• There is need for software to optimize network.
• There is a need to connect all Distribution Centers through software
• there is inadequate infrastructure, to meet the requirement of logistics provider
• Ineffective usage of information technology.
• The major problem is the road transport sector, which, despite being a major link in the system, does not enjoy industry status.
• The complexity of logistics operations
• customer demands for operational excellence
• requirement of timely delivery
• control logistics costs
• Safety and environmental compliance is increasing.
CONCLUSION:
Logistics is the integration of the activities that procure materials, transform them into intermediate goods and final products through manufacturing and assembly, and deliver them to customers. Comprising all movement of materials from incoming shipments, inventory, production and the final delivery to consumers, logistics managers are responsible for the right goods being where they need to be at the right time. For a firm as large as McDonald’s logistics is an area where proper planning results in increased efficiency. Because of its size, little improvements in the way it handles materials adds up. Conversely, a few, seemingly simple lapses can cost the company millions. Purchasing is the most costly activity in most firms. For the fast food industry, the cost of purchases as a percentage of sales is often substantial. Because such a huge portion of revenue is devoted to purchasing, an effective procurement strategy is vital. Purchasing provides a major opportunity for management to reduce costs and increase contribution margins. Because the cost and quality of goods sold is directly related to the cost and quality of goods purchased, McDonald's must examine a number of strategies for effective purchasing. Because
SCHOLARS WORLD-INTERNATIONAL REFEREED MULTIDISCIPLINARY JOURNAL OF CONTEMPORARY RESEARCH EISSN 2320-3145, ISSN 2319-5789
www.scholarsworld.net [email protected] Volume.1, Issue.2, July 2013 [132]
of the perishable nature of food, a system of just-in-time ordering and delivery is most effective for the company. For such a system to work, solid ties must be forged with a lot of suppliers. Ordering huge quantities of beef, chicken, and vegetables and expecting them to arrive at the shortest possible time requires coordination with capable suppliers. The company stands to gain the most with improvements in production – the actual preparation of food. Raw agricultural materials arriving at its commissary must be turned into buns, hamburger patties, French fries and McNuggets™ with minimal waste. It must then carry over this practice of efficiency into its outlets. REFERENCES:
1. Gustin, C.M., 1993. Examination of 10-year trends in logistics information systems. Industrial Engineering December, 34–39.
2. Sum, C.C., Teo, C.B., Ng, K.K., 2001. Strategic logistics management in Singapore. International Journal of Operations & Production Management (9), 1239–1260.
3. Thong, J.Y.L., 1999. An integrated model of information systems adoption in small businesses. Journal of Management Information Systems 15 (4), 187–214.
4. Patricia J. Daugherty, Alexander E. Ellinger and Craig M. Gustin, Integrated logistics: achieving logistics performance improvements, Volume 1 · Number 3 · 1996 · 25–33
5. Pamela Cheema ,Logistics Week, The Big Idea; McDonald’s Unravels its Supply Chain
WEBSITES:
1. http://www.eyefortransport.com/index.asp?news=48586 2. http://www.indialogisticsshow.com/Industry.htm 3. www.ciol.com/SMB/SMB/.../Indian-Logistic...investment-in-2010/ 4. http://logistics.bafree.net/mcdonalds-india-supply-chain/ 5. http://www.managementparadise.com/forums/elements-logistics/211392-supply-chain-management-
mcdonalds.html 6. http://www.laowee.com/index.php/2010/09/kfc-logistics-model-and-supply-chain-analysis/ 7. http://youngentrepreneurfoundation.wordpress.com/2009/10/01/the-world-is-flat-3-how-kfc-went-global/ 8. http://automotivehorizon.sulekha.com/indian-logistics-industry-poised-for-humungous-
growth_02_2011_postedby_jayashankar-menon
----
SCHOLARS WORLD-INTERNATIONAL REFEREED MULTIDISCIPLINARY JOURNAL OF CONTEMPORARY RESEARCH EISSN 2320-3145, ISSN 2319-5789
www.scholarsworld.net [email protected] Volume.1, Issue.2, July 2013 [133]
RISK ADJUSTED PERFORMANCE EVALUATION OF
SELECTED BALANCED MUTUAL FUND SCHEMES IN INDIA
DR.K. MALLIKARJUNA RAO,
Assistant professor,
Dept. of Commerce, Govt. Degree College
Zaheerabad, Dist-Medak, (AP)-India
H. RANJEETA RANI,
Senior student of Master of Business
Administration, ICBM-School of Business
Excellence, Hyderabad(AP)-India
ABSTRACT
Mutual funds entered the Indian capital market in 1964 with a view to provide the retail investors
the benefit of diversification of risk, assured returns, professional management. Since then they
have grown phenomenally in terms of number, size of operations, investors’ base and scope. The
Liberalization, Privatization and Globalization measures undertaken by the Government of India
opened the way for the entry of private sector and foreign players into this industry.
Consequently, this has emerged as a highly competitive financial service industry today. In this
paper, an attempt has been made to study the performance of selected balanced schemes of
mutual funds based on risk-return relationship models and various measures. Balanced schemes
of mutual funds are the ones which are mostly preferred by Indian investors because of their
balanced portfolio in equity and debt. A total of 10 schemes offered by various mutual funds have
been studied over the time period April, 2010 to March, 2013(3 years). The analysis has been
made on the basis of mean return, beta risk, total risk, Sharpe ratio, Treynor ratio, Jensen Alpha
and Fama’s decomposition measure. The overall analysis JM Balanced-G (-0.0282) and Kotak
Balanced fund (-0.6974) schemes managers poor stock selection skills.
Keywords: Mutual funds, NAV, Balanced Funds, Beta and S&P CNX Nifty
SCHOLARS WORLD-INTERNATIONAL REFEREED MULTIDISCIPLINARY JOURNAL OF CONTEMPORARY RESEARCH EISSN 2320-3145, ISSN 2319-5789
www.scholarsworld.net [email protected] Volume.1, Issue.2, July 2013 [134]
INTRODUCTION:
A mutual fund is the most suitable investment for the common man as it offers an opportunity to invest in a
diversified, professionally managed portfolio relatively at a low cost. Anybody with an investible surplus of a
few hundred rupees can invest in mutual funds. Changes in the economic scenario, falling interest rates of bank
deposits, volatile nature of capital market and recent bitter experience of investors in making direct investment
in capital market instruments led to the increasing importance of mutual funds. They have been playing a
significant role in financial inter-mediation, development of capital markets and growth of the financial sector
as a whole. The active involvement of mutual funds in economic development can be seen by their dominant
presence in the money and capital market. These institutions have come to assume to such of significant that
they now completely dominate the entire financial market.
Mutual fund industry started in India with the establishment of Unit Trust of India (1964), which was the only
player in the mutual fund industry up to 1987. In 1987, the government permitted public sector banks and
financial institutions to join the fray. From 1993 onwards the industry was opened up for private sector and
foreign players have started setting up mutual funds in India.
Mutual fund industry started in India with the establishment of Unit Trust of India (1964), which was the only
player in the mutual fund industry up to 1987. In 1987, the government permitted public sector banks and
financial institutions to join the fray. From 1993 onwards the industry was opened up for private sector and
foreign players have started setting up mutual funds in India. Mutual funds have all come forward with varying
schemes suitable to the need of saving populace. By December, 2012 there were 43 mutual funds and over 747
schemes in India with Assets under Management of Rs.786,544 crores.
CLASSIFICATION OF MUTUAL FUNDS:
In India, UTI, Public sector mutual funds, Private sector mutual funds, and foreign mutual funds are offering a
variety of schemes to the investors. These schemes can be classified on the basis of;
1) Structure/Execution and operation
2) Investment objectives/portfolio composition
3) Geographical classification
4) Other schemes
On the basis of Structure / Execution and operation mutual funds are classified;
(a) Open-ended schemes
(b) Close-ended schemes.
The yield or return of a fund depends upon the portfolio composition or investment objective of the scheme. On
the basis of investment objective, the classification would be unlimited. A few of them are presented here.
GROWTH FUND:
The aim of growth fund is to provide capital appreciation over the medium to long term. These schemes
normally invest a major portion of their funds in equities. These schemes provide different options to the
investors like dividend option, capital appreciation etc., and the investors may choose an option depending on
their preference. The investors must indicate the option in the application form. The mutual funds also allow the
investors to change the options at a later date. Growth schemes are good for investors having a long-term
outlook seeking capital appreciation over a period of time.
INCOME FUND:
The aim of income funds is to provide regular and steady income to investor. These schemes generally invest in
fixed income securities such as bonds, corporate debentures, Government securities and money market
instruments. Such funds are less risky compared to equity schemes. These funds are not affected by the
fluctuations in equity markets. However, opportunities of capital appreciation are also limited in such funds.
The NAVs of such funds are affected by the change in interest rate in the country. If the interest rates fall,
NAV’s of such funds are likely to increase in the short run and vice versa.
SCHOLARS WORLD-INTERNATIONAL REFEREED MULTIDISCIPLINARY JOURNAL OF CONTEMPORARY RESEARCH EISSN 2320-3145, ISSN 2319-5789
www.scholarsworld.net [email protected] Volume.1, Issue.2, July 2013 [135]
BALANCED FUND:
The aim of the balanced funds is to provide both growth and regular income. As such schemes invest both in
equities and fixed income securities in the proportion indicated in their offer documents. These are appropriate
for investors looking for moderate growth. They generally invest 40-60 per cent in equity and debt instruments.
These funds are also affected by the of fluctuations in share prices in the stock markets. However, NAV of such
funds are likely to be less volatile compared to pure equity funds Canara Robeco Balanced –G, HDFC Balanced
Fund –G, ICICI Prud Balanced Fund-G, JM Balanced-G, Kotak Balanced Fund-G, LIC NOMURA Balanced
Plan-C, Principal Balanced Fund –G, Reliance RSF Balanced-G, SBI Magnum Balanced Fund-G, UTI
Balanced fund -G are some of the balanced funds selected for detailed analysis in the present study.
MONEY MARKET SCHEMES:
The objective of these schemes is to provide easy liquidity, preservation of capital and moderate income. These
schemes invest exclusively in safer short-term instruments such as treasury bills, certificate of deposit,
commercial paper and inter-bank call money, government securities etc. Returns on these schemes fluctuate
depending on the interest rates prevailing in the market.
On the basis of geographical limits, mutual fund schemes can be classified as domestic mutual funds and
offshore mutual funds.
Other types of schemes are Tax Saving Schemes, Index Schemes, Sector specific Schemes (e.g.
Pharmaceuticals, Software, Fast Moving Consumer Goods (FMCG), Petroleum stocks etc), Gilt Schemes and
Children’s Fund.
REVIEW OF LITERATURE:
Performance evaluation of mutual funds has been extensively by Sharpe (1966) Treynor (1965), Jenson’s (
1968), Fama (1972), Barua et.al (1991), Jaideep and Sudip Majumdar (1994), Gupta and Sanjay Sehgal (1997),
Gupta and Sanjay Sehgal Nalini Prava Tripathy’ (2002) (1997), Amitabh Gupta (2000), Ramesh Chander’s
(2000), Nalini Prava Tripathy’ (2002), Sindu (2004),Sinadhi and Jain (2005),
Navdeep Aggarwal and Mohit Gupta (2007), “performance of Mutual funds in india an empirical study” The study
was conducted using CAPM and FAMA French model and concluded that the value addition of the fund depends on
certain factors such as excess market returns, size factor, value factor and suggest that returns earned by Mutual
funds were actually due to the exposure of these factors only and fund managers did not add any value.
Soumya Guha(2008) “performance of Indian equity Mutual funds Vis-a-Vis their style benchmarks” has
suggested that in her evaluation of fund managers performance found that Indian equity fund managers have not
been able to beat their style benchmarks (William Sharpe ratio) on the average and pointed out the weaknesses of
fund managers. Several researchers have tried to study the various factors and their impact on fund’s performance.
OBJECTIVES OF THE PRESENT STUDY:
1. To examine comparative performance of selected open ended schemes and S&P CNX Nifty in terms of
risk and return.
2. To evaluate the performance of selected Mutual fund schemes in terms of their return and risk and
thereby fund manager’s stock selection
II. METHODOLOGY:
2.1 Sampling:
The present study made an attempt to analyze the performance of 10 balanced mutual fund schemes for the
period of 2011-2013. The selected schemes are Canara Robeco Balanced –G, HDFC Balanced Fund –G, ICICI
Prud Balanced Fund-G, JM Balanced-G, Kotak Balanced Fund-G LIC NOMURA Balanced Plan-C, Principal
Balanced Fund –G, Reliance RSF Balanced-G, SBI Magnum Balanced Fund-G and UTI Balanced fund –G.

SCHOLARS WORLD-INTERNATIONAL REFEREED MULTIDISCIPLINARY JOURNAL OF CONTEMPORARY RESEARCH EISSN 2320-3145, ISSN 2319-5789
www.scholarsworld.net [email protected] Volume.1, Issue.2, July 2013 [136]
2.2 Data Sources:
The study is based on the secondary data. For evaluating the performance of the sample schemes the adjusted
monthly NAV data during April, 2010 – March, 2013 have been collected from various Websites like
www.Mutualfundsindia.com, www.valueresearhonline.com, www.amfiindia.com and www.nseindia.com have
provided valuable data and information for the study. The data are also drawn from the respective websites of the
selected mutual funds. The 91-day Treasury bill rate has been collected from ICRA Money and Finance Bulletin.
PERFORMANCE EVALUATION MEASURES:
The idea behind the performance evaluation is to compare the returns obtained by the portfolio (or a mutual
fund schemes) through active management by the investment manager. Such portfolio chosen for comparison
are often referred as ‘benchmark portfolio’. Such random portfolios can be many. Hence, a stock market index
can be selected as a benchmark portfolio. To carry on this exercise, two types of techniques are applied-
measures that consider total risk and measures that consider systematic risk.
The performance of selected mutual fund schemes has been evaluated by using six performance measures: (a)
Rate of Return (b) Sharpe measure (c) Treynor measure (d) Jensen differential return measure, (e) Fama’s
Components of Investment Performance.
RETURN:
For each mutual fund schemes in the sample, the returns have been calculated taking monthly Net Asset Values from
April 2010 to March, 2013. The NAVs are adjusted assuming dividends are reinvested at the ex-dividend NAV.
The return is calculated by using the following formula.
1 - t NAV
1 -NAVt -NAVt R pt = … (1.1)
Where, Rpt is the difference between Net Asset Values (NAVs) for two consecutive days divided by the NAV
of the preceding day. ‘t’ and ‘t-1’ indicate month end month beginning respectively, t-1,2,3,…n. In is the
natural logarithm to the base ‘e’.
The average return on the market portfolio is determined as follows:
∑=
=n
1 t
Rptp n / R …. (1.2)
Where,
Rp is the average return on the mutual fund schemes. It is also called an average return on the portfolio.
The returns on market portfolio are computed as follows:
[ ]1 -Index t
1 -Index t -Index t R mt = …… (1.3)
Where,
Rmt is the returns on the basis of S&P CNX Nifty index.
The average return on market index is as follows:
∑=
=n
1 t
Rmtm n / R ……. (1.4)
Where,
Rm is the average return on the market.
RISK:
Standard Deviation:
Standard deviation is a measure of total risk. In the present study, the standard deviation of monthly returns has
been taken as the measure of risk.

SCHOLARS WORLD-INTERNATIONAL REFEREED MULTIDISCIPLINARY JOURNAL OF CONTEMPORARY RESEARCH EISSN 2320-3145, ISSN 2319-5789
www.scholarsworld.net [email protected] Volume.1, Issue.2, July 2013 [137]
n
σp = { 1/n∑ (Rpt-Rp)2 }
1/2 ……(1.5)
t=1
where,
σp is the total risk of the portfolio.
The total risk on the market line portfolio is computed as follows:
n
σm = { 1/n∑ (Rmt - Rp)2 }
1/2 ……(1.6)
t=1
where,
σm is the total risk of the market portfolio.
BETA:
Beta measures the systematic risk and shows how sensitive the return of a security is in relation to the market
return. It is calculated by relating the return on a security with return for the market.
The beta estimated form the following formula is,
Rpt = α + β Rmt + ep ……(1.7)
Where,
Rpt is the return on the mutual fund scheme
Rmt is the return on market index i.e. SENSEX
ep is the error term
α is the constant term
b) Sharpe’s Measure:
According to Sharpe, it is the total risk of the fund that the investors are concerned about. So, this measure
evaluates mutual funds on the basis of reward per unit of total risk. Symbolically, it can be written as:
Sharpe Measure = (Rp - Rf) /σp …… (1.8)
Where,
Rp represents return on fund,
Rf is risk free rate of return and
σp is standard deviation of the fund.
While a high and positive Sharpe Ratio shows a superior risk-adjusted performance of a fund, a low and
negative Sharpe Ratio is an indication of unfavorable performance.
c) Treynor’s Measure:
This performance measure evaluates funds on the basis of ratio of return generated by the fund over and above
risk free rate of return during a given period and systematic risk associated with it (beta). Symbolically, it can
be represented as:
Treynor's Measure = (Rp - Rf ) /β ….(1.9)
Where,
Rp represents return on fund,
Rf is risk free rate of return and
β is beta of the fund.
All risk-averse investors would like to maximize this value. While a high and positive Treynor's Meausre shows a
superior risk-adjusted performance of a fund, a low and negative ratio is an indication of unfavorable performance.
d) Jensen Differential Measure:
This measure involves evaluation of the returns that the fund has generated in relation to the returns actually
expected out of the fund given the level of its systematic risk. The surplus between the two returns is called
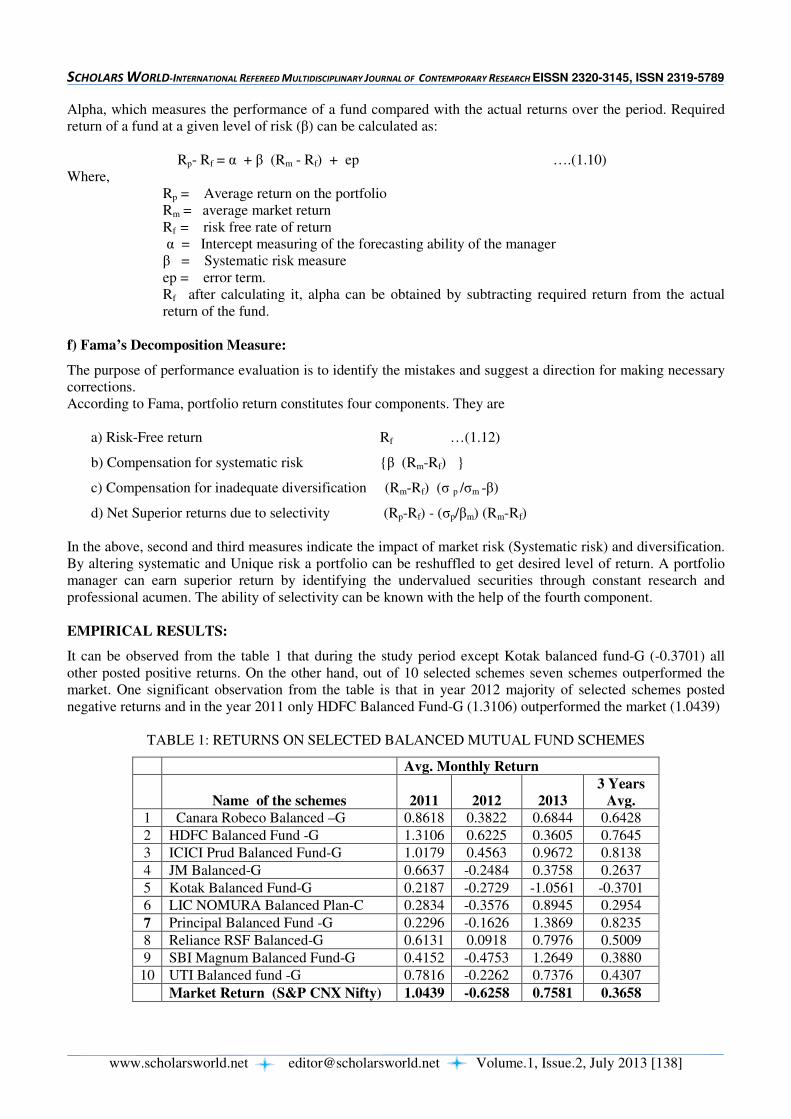
SCHOLARS WORLD-INTERNATIONAL REFEREED MULTIDISCIPLINARY JOURNAL OF CONTEMPORARY RESEARCH EISSN 2320-3145, ISSN 2319-5789
www.scholarsworld.net [email protected] Volume.1, Issue.2, July 2013 [138]
Alpha, which measures the performance of a fund compared with the actual returns over the period. Required
return of a fund at a given level of risk (β) can be calculated as:
Rp- Rf = α + β (Rm - Rf) + ep ….(1.10)
Where,
Rp = Average return on the portfolio
Rm = average market return
Rf = risk free rate of return
α = Intercept measuring of the forecasting ability of the manager
β = Systematic risk measure
ep = error term.
Rf after calculating it, alpha can be obtained by subtracting required return from the actual
return of the fund.
f) Fama’s Decomposition Measure:
The purpose of performance evaluation is to identify the mistakes and suggest a direction for making necessary
corrections.
According to Fama, portfolio return constitutes four components. They are
a) Risk-Free return Rf …(1.12)
b) Compensation for systematic risk {β (Rm-Rf) }
c) Compensation for inadequate diversification (Rm-Rf) (σ p /σm -β)
d) Net Superior returns due to selectivity (Rp-Rf) - (σp/βm) (Rm-Rf)
In the above, second and third measures indicate the impact of market risk (Systematic risk) and diversification.
By altering systematic and Unique risk a portfolio can be reshuffled to get desired level of return. A portfolio
manager can earn superior return by identifying the undervalued securities through constant research and
professional acumen. The ability of selectivity can be known with the help of the fourth component.
EMPIRICAL RESULTS:
It can be observed from the table 1 that during the study period except Kotak balanced fund-G (-0.3701) all
other posted positive returns. On the other hand, out of 10 selected schemes seven schemes outperformed the
market. One significant observation from the table is that in year 2012 majority of selected schemes posted
negative returns and in the year 2011 only HDFC Balanced Fund-G (1.3106) outperformed the market (1.0439)
TABLE 1: RETURNS ON SELECTED BALANCED MUTUAL FUND SCHEMES
Avg. Monthly Return
Name of the schemes 2011 2012 2013
3 Years
Avg.
1 Canara Robeco Balanced –G
0.8618 0.3822 0.6844 0.6428
2 HDFC Balanced Fund -G 1.3106 0.6225 0.3605 0.7645
3 ICICI Prud Balanced Fund-G 1.0179 0.4563 0.9672 0.8138
4 JM Balanced-G 0.6637 -0.2484 0.3758 0.2637
5 Kotak Balanced Fund-G 0.2187 -0.2729 -1.0561 -0.3701
6 LIC NOMURA Balanced Plan-C 0.2834 -0.3576 0.8945 0.2954
7 Principal Balanced Fund -G 0.2296 -0.1626 1.3869 0.8235
8 Reliance RSF Balanced-G 0.6131 0.0918 0.7976 0.5009
9 SBI Magnum Balanced Fund-G 0.4152 -0.4753 1.2649 0.3880
10 UTI Balanced fund -G 0.7816 -0.2262 0.7376 0.4307
Market Return (S&P CNX Nifty) 1.0439 -0.6258 0.7581 0.3658
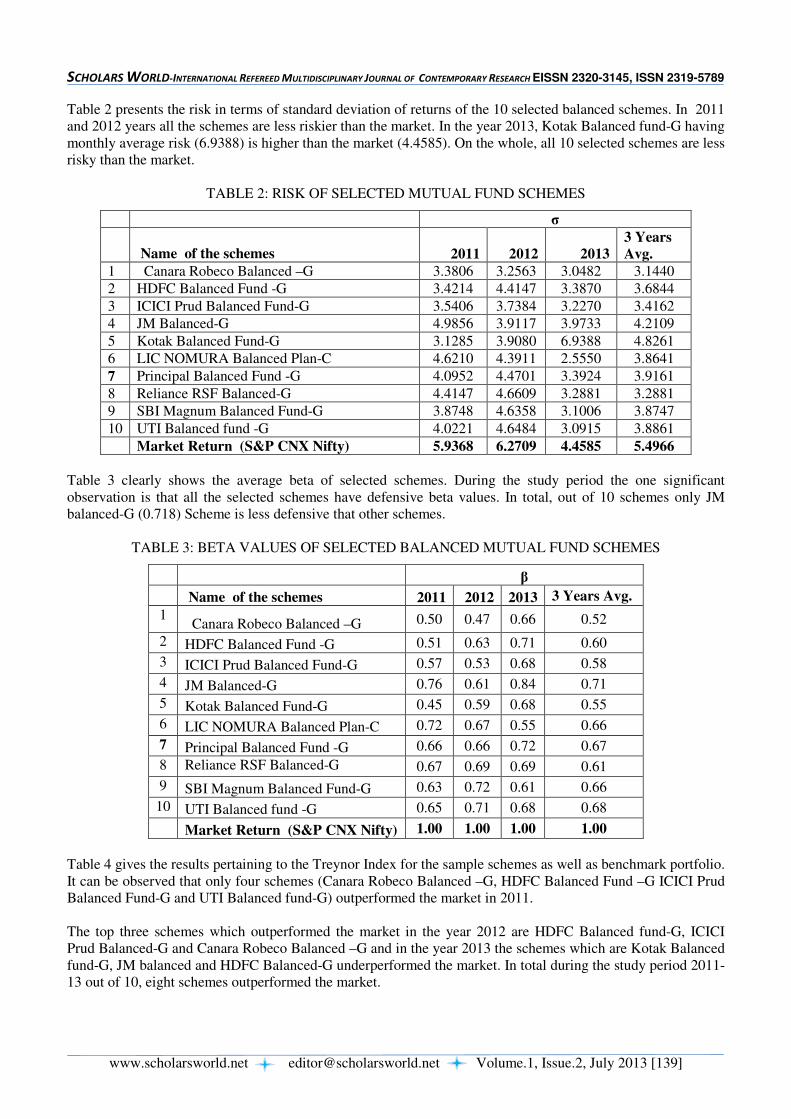
SCHOLARS WORLD-INTERNATIONAL REFEREED MULTIDISCIPLINARY JOURNAL OF CONTEMPORARY RESEARCH EISSN 2320-3145, ISSN 2319-5789
www.scholarsworld.net [email protected] Volume.1, Issue.2, July 2013 [139]
Table 2 presents the risk in terms of standard deviation of returns of the 10 selected balanced schemes. In 2011
and 2012 years all the schemes are less riskier than the market. In the year 2013, Kotak Balanced fund-G having
monthly average risk (6.9388) is higher than the market (4.4585). On the whole, all 10 selected schemes are less
risky than the market.
TABLE 2: RISK OF SELECTED MUTUAL FUND SCHEMES
σ
Name of the schemes 2011 2012 2013
3 Years
Avg.
1 Canara Robeco Balanced –G
3.3806 3.2563 3.0482 3.1440
2 HDFC Balanced Fund -G 3.4214 4.4147 3.3870 3.6844
3 ICICI Prud Balanced Fund-G 3.5406 3.7384 3.2270 3.4162
4 JM Balanced-G 4.9856 3.9117 3.9733 4.2109
5 Kotak Balanced Fund-G 3.1285 3.9080 6.9388 4.8261
6 LIC NOMURA Balanced Plan-C 4.6210 4.3911 2.5550 3.8641
7 Principal Balanced Fund -G 4.0952 4.4701 3.3924 3.9161
8 Reliance RSF Balanced-G 4.4147 4.6609 3.2881 3.2881
9 SBI Magnum Balanced Fund-G 3.8748 4.6358 3.1006 3.8747
10 UTI Balanced fund -G 4.0221 4.6484 3.0915 3.8861
Market Return (S&P CNX Nifty) 5.9368 6.2709 4.4585 5.4966
Table 3 clearly shows the average beta of selected schemes. During the study period the one significant
observation is that all the selected schemes have defensive beta values. In total, out of 10 schemes only JM
balanced-G (0.718) Scheme is less defensive that other schemes.
TABLE 3: BETA VALUES OF SELECTED BALANCED MUTUAL FUND SCHEMES
β
Name of the schemes 2011 2012 2013 3 Years Avg.
1 Canara Robeco Balanced –G
0.50 0.47 0.66 0.52
2 HDFC Balanced Fund -G 0.51 0.63 0.71 0.60
3 ICICI Prud Balanced Fund-G 0.57 0.53 0.68 0.58
4 JM Balanced-G 0.76 0.61 0.84 0.71
5 Kotak Balanced Fund-G 0.45 0.59 0.68 0.55
6 LIC NOMURA Balanced Plan-C 0.72 0.67 0.55 0.66
7 Principal Balanced Fund -G 0.66 0.66 0.72 0.67
8 Reliance RSF Balanced-G 0.67 0.69 0.69 0.61
9 SBI Magnum Balanced Fund-G 0.63 0.72 0.61 0.66
10 UTI Balanced fund -G 0.65 0.71 0.68 0.68
Market Return (S&P CNX Nifty) 1.00 1.00 1.00 1.00
Table 4 gives the results pertaining to the Treynor Index for the sample schemes as well as benchmark portfolio.
It can be observed that only four schemes (Canara Robeco Balanced –G, HDFC Balanced Fund –G ICICI Prud
Balanced Fund-G and UTI Balanced fund-G) outperformed the market in 2011.
The top three schemes which outperformed the market in the year 2012 are HDFC Balanced fund-G, ICICI
Prud Balanced-G and Canara Robeco Balanced –G and in the year 2013 the schemes which are Kotak Balanced
fund-G, JM balanced and HDFC Balanced-G underperformed the market. In total during the study period 2011-
13 out of 10, eight schemes outperformed the market.
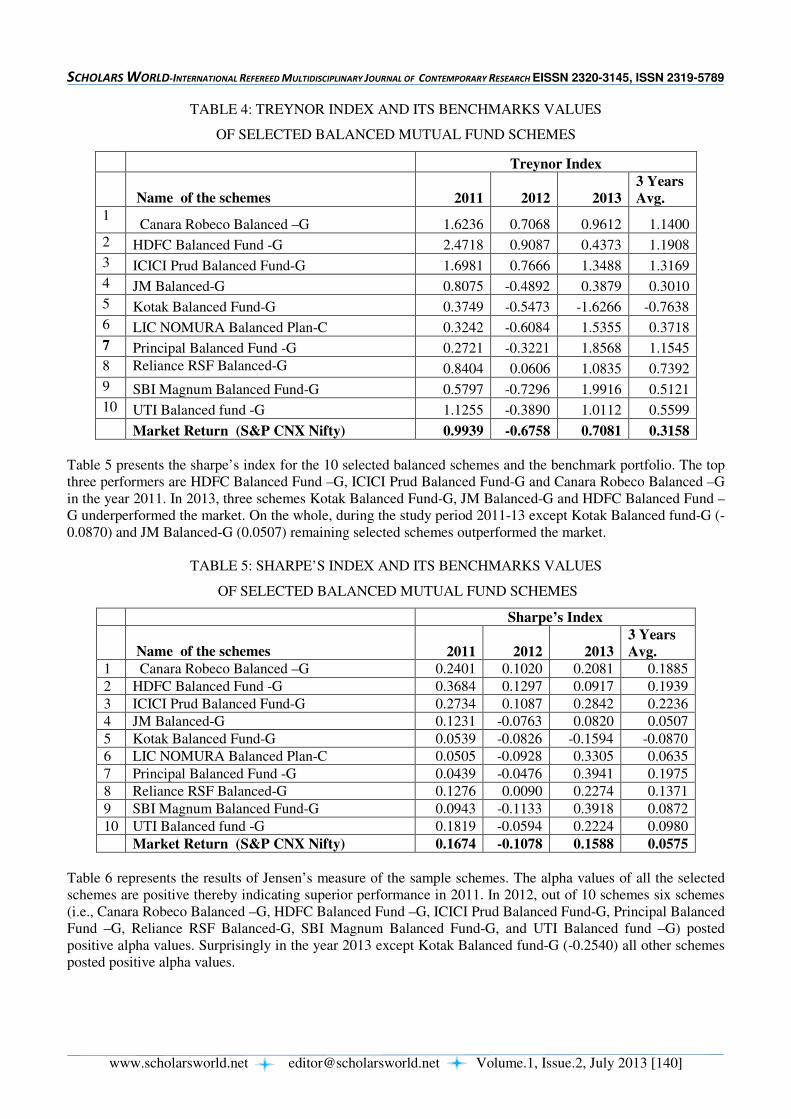
SCHOLARS WORLD-INTERNATIONAL REFEREED MULTIDISCIPLINARY JOURNAL OF CONTEMPORARY RESEARCH EISSN 2320-3145, ISSN 2319-5789
www.scholarsworld.net [email protected] Volume.1, Issue.2, July 2013 [140]
TABLE 4: TREYNOR INDEX AND ITS BENCHMARKS VALUES
OF SELECTED BALANCED MUTUAL FUND SCHEMES
Treynor Index
Name of the schemes 2011 2012 2013
3 Years
Avg.
1 Canara Robeco Balanced –G
1.6236 0.7068 0.9612 1.1400
2 HDFC Balanced Fund -G 2.4718 0.9087 0.4373 1.1908
3 ICICI Prud Balanced Fund-G 1.6981 0.7666 1.3488 1.3169
4 JM Balanced-G 0.8075 -0.4892 0.3879 0.3010
5 Kotak Balanced Fund-G 0.3749 -0.5473 -1.6266 -0.7638
6 LIC NOMURA Balanced Plan-C 0.3242 -0.6084 1.5355 0.3718
7 Principal Balanced Fund -G 0.2721 -0.3221 1.8568 1.1545
8 Reliance RSF Balanced-G 0.8404 0.0606 1.0835 0.7392
9 SBI Magnum Balanced Fund-G 0.5797 -0.7296 1.9916 0.5121
10 UTI Balanced fund -G 1.1255 -0.3890 1.0112 0.5599
Market Return (S&P CNX Nifty) 0.9939 -0.6758 0.7081 0.3158
Table 5 presents the sharpe’s index for the 10 selected balanced schemes and the benchmark portfolio. The top
three performers are HDFC Balanced Fund –G, ICICI Prud Balanced Fund-G and Canara Robeco Balanced –G
in the year 2011. In 2013, three schemes Kotak Balanced Fund-G, JM Balanced-G and HDFC Balanced Fund –
G underperformed the market. On the whole, during the study period 2011-13 except Kotak Balanced fund-G (-
0.0870) and JM Balanced-G (0.0507) remaining selected schemes outperformed the market.
TABLE 5: SHARPE’S INDEX AND ITS BENCHMARKS VALUES
OF SELECTED BALANCED MUTUAL FUND SCHEMES
Sharpe’s Index
Name of the schemes 2011 2012 2013
3 Years
Avg.
1 Canara Robeco Balanced –G
0.2401 0.1020 0.2081 0.1885
2 HDFC Balanced Fund -G 0.3684 0.1297 0.0917 0.1939
3 ICICI Prud Balanced Fund-G 0.2734 0.1087 0.2842 0.2236
4 JM Balanced-G 0.1231 -0.0763 0.0820 0.0507
5 Kotak Balanced Fund-G 0.0539 -0.0826 -0.1594 -0.0870
6 LIC NOMURA Balanced Plan-C 0.0505 -0.0928 0.3305 0.0635
7 Principal Balanced Fund -G 0.0439 -0.0476 0.3941 0.1975
8 Reliance RSF Balanced-G 0.1276 0.0090 0.2274 0.1371
9 SBI Magnum Balanced Fund-G 0.0943 -0.1133 0.3918 0.0872
10 UTI Balanced fund -G 0.1819 -0.0594 0.2224 0.0980
Market Return (S&P CNX Nifty) 0.1674 -0.1078 0.1588 0.0575
Table 6 represents the results of Jensen’s measure of the sample schemes. The alpha values of all the selected
schemes are positive thereby indicating superior performance in 2011. In 2012, out of 10 schemes six schemes
(i.e., Canara Robeco Balanced –G, HDFC Balanced Fund –G, ICICI Prud Balanced Fund-G, Principal Balanced
Fund –G, Reliance RSF Balanced-G, SBI Magnum Balanced Fund-G, and UTI Balanced fund –G) posted
positive alpha values. Surprisingly in the year 2013 except Kotak Balanced fund-G (-0.2540) all other schemes
posted positive alpha values.
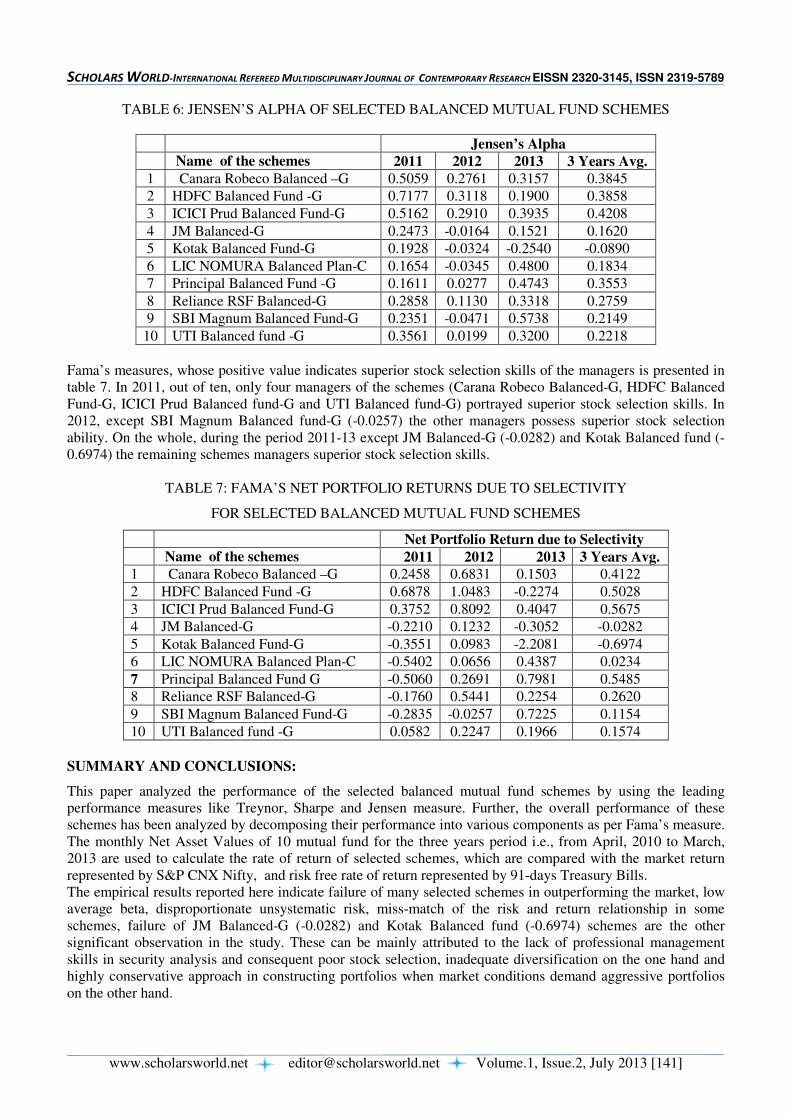
SCHOLARS WORLD-INTERNATIONAL REFEREED MULTIDISCIPLINARY JOURNAL OF CONTEMPORARY RESEARCH EISSN 2320-3145, ISSN 2319-5789
www.scholarsworld.net [email protected] Volume.1, Issue.2, July 2013 [141]
TABLE 6: JENSEN’S ALPHA OF SELECTED BALANCED MUTUAL FUND SCHEMES
Jensen’s Alpha
Name of the schemes 2011 2012 2013 3 Years Avg.
1 Canara Robeco Balanced –G
0.5059 0.2761 0.3157 0.3845
2 HDFC Balanced Fund -G 0.7177 0.3118 0.1900 0.3858
3 ICICI Prud Balanced Fund-G 0.5162 0.2910 0.3935 0.4208
4 JM Balanced-G 0.2473 -0.0164 0.1521 0.1620
5 Kotak Balanced Fund-G 0.1928 -0.0324 -0.2540 -0.0890
6 LIC NOMURA Balanced Plan-C 0.1654 -0.0345 0.4800 0.1834
7 Principal Balanced Fund -G 0.1611 0.0277 0.4743 0.3553
8 Reliance RSF Balanced-G 0.2858 0.1130 0.3318 0.2759
9 SBI Magnum Balanced Fund-G 0.2351 -0.0471 0.5738 0.2149
10 UTI Balanced fund -G 0.3561 0.0199 0.3200 0.2218
Fama’s measures, whose positive value indicates superior stock selection skills of the managers is presented in
table 7. In 2011, out of ten, only four managers of the schemes (Carana Robeco Balanced-G, HDFC Balanced
Fund-G, ICICI Prud Balanced fund-G and UTI Balanced fund-G) portrayed superior stock selection skills. In
2012, except SBI Magnum Balanced fund-G (-0.0257) the other managers possess superior stock selection
ability. On the whole, during the period 2011-13 except JM Balanced-G (-0.0282) and Kotak Balanced fund (-
0.6974) the remaining schemes managers superior stock selection skills.
TABLE 7: FAMA’S NET PORTFOLIO RETURNS DUE TO SELECTIVITY
FOR SELECTED BALANCED MUTUAL FUND SCHEMES
Net Portfolio Return due to Selectivity
Name of the schemes 2011 2012 2013 3 Years Avg.
1 Canara Robeco Balanced –G
0.2458 0.6831 0.1503 0.4122
2 HDFC Balanced Fund -G 0.6878 1.0483 -0.2274 0.5028
3 ICICI Prud Balanced Fund-G 0.3752 0.8092 0.4047 0.5675
4 JM Balanced-G -0.2210 0.1232 -0.3052 -0.0282
5 Kotak Balanced Fund-G -0.3551 0.0983 -2.2081 -0.6974
6 LIC NOMURA Balanced Plan-C -0.5402 0.0656 0.4387 0.0234
7 Principal Balanced Fund G -0.5060 0.2691 0.7981 0.5485
8 Reliance RSF Balanced-G -0.1760 0.5441 0.2254 0.2620
9 SBI Magnum Balanced Fund-G -0.2835 -0.0257 0.7225 0.1154
10 UTI Balanced fund -G 0.0582 0.2247 0.1966 0.1574
SUMMARY AND CONCLUSIONS:
This paper analyzed the performance of the selected balanced mutual fund schemes by using the leading
performance measures like Treynor, Sharpe and Jensen measure. Further, the overall performance of these
schemes has been analyzed by decomposing their performance into various components as per Fama’s measure.
The monthly Net Asset Values of 10 mutual fund for the three years period i.e., from April, 2010 to March,
2013 are used to calculate the rate of return of selected schemes, which are compared with the market return
represented by S&P CNX Nifty, and risk free rate of return represented by 91-days Treasury Bills.
The empirical results reported here indicate failure of many selected schemes in outperforming the market, low
average beta, disproportionate unsystematic risk, miss-match of the risk and return relationship in some
schemes, failure of JM Balanced-G (-0.0282) and Kotak Balanced fund (-0.6974) schemes are the other
significant observation in the study. These can be mainly attributed to the lack of professional management
skills in security analysis and consequent poor stock selection, inadequate diversification on the one hand and
highly conservative approach in constructing portfolios when market conditions demand aggressive portfolios
on the other hand.
SCHOLARS WORLD-INTERNATIONAL REFEREED MULTIDISCIPLINARY JOURNAL OF CONTEMPORARY RESEARCH EISSN 2320-3145, ISSN 2319-5789
www.scholarsworld.net [email protected] Volume.1, Issue.2, July 2013 [142]
REFERENCES:
1. William F. Sharpe “Mutual Fund Performance”. Journal of Business, Vol. XXXIX .Part-2, Jan 1996,
pp.119-38.
2. Jack L. Treynor, “How to rate management of Investment Funds”, Harvard Business Review, Vol.XLIII,
Jan-Feb 1965, pp63-75.
3. Michael C. Jensen, “Performance of Mutual fund in the period 1945-65” The Journal of finance,
Vol.XXIII, No.2, May 1968.pp 318-416.
4. William F. Sharpe, “Adjusting for risk in portfolio Performance Measurement “, Lorie James and Brealy
Richard (Ed) Modern Developments in Investment Management, (Illinois: Dryden press), 1978. pp 442-7.
5. Fama Eugene F. “Components of Investment Performance”, The journal of Finance, Vol. XVII, No. 3
,June 1972, pp 551-67.
6. Samir K. Barua et.al “Master Shares: A Bonanza for large Investors”, Vikalpa, Vol. 16, No.1 ,April-June
1991.
7. Jaideep Sarkar, Sudipta Majumdar “Performance Evaluation of Mutual Funds in India” NMIS
Management Review, vol. VI, No.2 ,July-December 1994, pp.64-78.
8. Gupta, O.P. and Sehgal S, “Investment Performance of Mutual fund: The Indian Experience”, in Indian
Capital Markets: Trends and Dimensions edited by Uma Shashikant and S Arumugan, Tata McGraw Hill,
New Delhi.
9. Gupta, Amitabh, “Investment Performance of Indian Mutual Funds: An Empirical study”, Finance India,
Vol. XIV, No.3, September 2000 pp.833-866.
10. Ramesh Chander, “Performance Appraisal of Mutual Funds in India”, Finance India, Vol. XIV, No.4,
December 2000, pp.1256-1261.
11. Naliniprave Tripathy “An Empirical Analysis on Performance Evaluation of Mutual Funds in India: A
study on Equity-linked savings schemes”, Proceeding of the International Conference on Business and
Finance, Vol. III, 2002.
12. Sindu, “Performance Evaluation of Indian Private Sector Mutual Funds”,Osmania University,
Hyderabad, A.P. 2004
13. Navdeep Aggarwal and Mohit Gupta (2007) “performance of Mutual funds in India an empirical study
ICFAI Journal of finance 2007, No.9, Vol.13.
14. Soumya Guha(2008)“performance of Indian equity Mutual funds Vis-a-Vis their style benchmarks” Icfai
University Press 2008 Vol.14. no.8.
----
SCHOLARS WORLD-INTERNATIONAL REFEREED MULTIDISCIPLINARY JOURNAL OF CONTEMPORARY RESEARCH EISSN 2320-3145, ISSN 2319-5789
www.scholarsworld.net [email protected] Volume.1, Issue.2, July 2013 [143]
‘PARTITION AND THE SIKH DIASPORIC CONSCIOUSNESS’ IN
ANITA RAU BADAMI’S CAN YOU HEAR THE NIGHTBIRD CALL?
MEERA BHARWANI, PhD,
Xavier Institute of Engineering, Mahim, Mumbai
Narsee Monjee Institute of Management Studies, Mumbai- India
ABSTRACT
In the year 1947, India was partitioned on the basis of the two-nation theory, which was accepted
by both the Muslim League as well as the Congress, the inference being that the Muslims and the
Hindus could not happily co-exist within a single political entity. Thus, the Indian Subcontinent
was split into Hindu India and Muslim Pakistan. In the objective basis and logic of Partition, viz.,
the two-nation theory, the Sikhs were prevailed over by the logic of history, and the dialectics of
Hindu and Muslim communalism unfolded by the consequences of the imperialist policies. The
Sikhs got concerned, like others, with the identity, security and well-being of their own
community. This paper looks at the effect of the Partition on the Sikh community abroad,
specifically the Sikh Diaspora in Canada. The paper attempts to explore the way in which the
conditions prevailing in the motherland shaped the members of the community living outside the
geographical confines of the home country. The paper takes up a novel by Anita Rau Badami
called Can You Hear the Nightbird Call? (2006), for scrutiny. This novel deals with characters
like Pa –ji and Bibi- ji who have left undivided India before the Partition. The effort is to observe
whether the life of these people remains impervious to the upheaval in the homeland or if they too
are touched and forced to take sides.
Keywords: Partition, Diaspora, Sikh, Historical Events
SCHOLARS WORLD-INTERNATIONAL REFEREED MULTIDISCIPLINARY JOURNAL OF CONTEMPORARY RESEARCH EISSN 2320-3145, ISSN 2319-5789
www.scholarsworld.net [email protected] Volume.1, Issue.2, July 2013 [144]
1. INTRODUCTION:
The partition which ranks as one of the most tragic events in the history of the world resulted not only in the
loss of human lives and property but also impinged on cultural issues. The enormous unnatural migration in
history is linked inextricably with horrific tales of massacres, looting; arson, rape, abduction of women and
children and other acts of savagery. These were essentially facets of a Punjabi tragedy. People were uprooted,
leaving an impoverished culture behind them. Of all the provinces, Punjab suffered the most. The massacre that
preceded and followed the Partition, of India, was unprecedented. Sikh religion, culture and history were
inextricably linked to the Punjab. Sikhs were the smallest minority in Punjab, most of the holy shrines of the
Sikhs and the vast majority of their community were based in the Punjab. Unlike the Muslims who were in
majority in the northwestern and northeastern zones of the subcontinent, the Sikh were not in a majority
anywhere in the Punjab, not even in the central districts where they were mainly located or in their holy city of
Amritsar and this naturally had consequences on their situation.
The Sikh argument was that India should not be partitioned, but if it became inevitable then the Punjab should
be divided and the borders between a predominantly Muslim Punjab in the West and a Hindu-Sikh majority
East Punjab should be drawn on the Chenab, so that East Punjab would include their holy places as well as the
majority of the community. The Sikh leadership feared persecution in a predominantly Muslim Pakistan, just as
the Muslim leadership argued that permanent Hindu Raj based on caste prejudices will be established if India
remained united. But then the Sikh confusion and disorientation, partly the result of the politics of power and
partition, was worse confounded by the rising tide of Hindu communalism in independent India. As a matter of
fact, it is impossible to understand the Sikh problem except in relation to the Hindu communal response to even
the legitimate Sikh aspirations. The Sikhs were included or excluded from the Hindu fold, depending upon the
shifting definitions of the Hindus and of Hinduism without any thought to the opinions or inclinations of the
Sikhs themselves and that is the focus of this paper.
Anita Rau Badami's Can You Hear the Nightbird Call? (2006) is the story of three women linked in love and
tragedy over a long span of time. Beginning at the time before the partition of India and Pakistan, it ends with
the explosion of Air India flight 182 off the coast of Ireland in 1985. The novel is rich with the daily sights,
sounds and scents of both India and Canada. Rau’s warmth and her understanding of human relationships are
amply demonstrated in this novel, where the fictional world gets intermingled with real events that took place in
history. This mixture also becomes the connection and fusion of the personal and the political with the religious
identity of the characters, mostly with chaotic results.
2. BACKGROUND: HISTORICAL EVENTS IN THE NOVEL:
The action of the novel takes place in the backdrop of actual happenings in the history of India. Anita Rau
Badami positions the episodes of the novel as if the tangible events in the political reality of India and Canada
are taking place as the characters lives get played out. Speaking about the various political incidents depicted in
the novel, Ami Sands Brodoff in “Humanizing History” (2001) explicates, “we experience these events through
the lives, thoughts and experiences of her characters; we live through the devastation with them”. The diverse
political incidents represented in the novel serve to remind the readers about the politics of the region and
exercises their reminiscences of the recent past. “My memory keeps getting in the way of your history," reads
the first epigraph to the novel. There are three epigraphs in all; the second refers to the Anti-Sikh riots in Delhi
and the third to the Kanishka bombing. These reveal the role that political events play in the scheme of the
narrative. Her biggest challenge in writing Nightbird, Badami says in the same interview with Brodoff was
“keeping the history in backdrop, not letting it eat up the story”. This again explains the importance attached to
the actual historical and political incidents in the work of fiction. Badami says in the same interview: “I wanted
to humanize the facts, to give life and shape to the dry bones of history”. The fictional characters live and
breathe in the background of the partition of India, the emergency, etc and their lives are affected by this
history. Some major historical events embodied in the novel are:
• The Komagata Maru incident (1914),
• The Partition of India (1947),
• The two Indo-Pak Wars (1965, 1971),
SCHOLARS WORLD-INTERNATIONAL REFEREED MULTIDISCIPLINARY JOURNAL OF CONTEMPORARY RESEARCH EISSN 2320-3145, ISSN 2319-5789
www.scholarsworld.net [email protected] Volume.1, Issue.2, July 2013 [145]
• The Khalistan Movement (1970s and 1980s),
• Imposition of a State of Emergency in India (1975),
• Operation Bluestar (1984),
• The Assassination of Prime Minister, Indira Gandhi (1984),
• The Anti-Sikh Riots (1984),
• The Kanishka Aircrash (1985).
3. PRE-PARTITION PERIOD: KINSHIP, FRATERNITY, AFFINITY AND A SHARED
COMMUNITY LIFE:
At the outset, Badami brings in the role of politics-based religion in the society that the characters are a part of.
She mentions that the house of the central character Bibi-ji was: “One of a small cluster of Sikh and Hindu
houses, it was separated from the Muslim homes by fields of swaying cane sugar” (3). This clearly indicates
that even in pre-partition India, Muslims and Hindus live close to each other yet separated by fields or some
other barrier. Here it can also be seen that the Sikhs and Hindus live together as one, there is no marked
differentiation between the two religions. This is articulated by Rajkumari Shanker in “Women in Sikhism”
(1997), “until recently Sikhs had displayed little collective concern in distinguishing themselves from the
predominant Hindu culture and religion” (184). Speaking about the similarity of customs between the two, she
continues: “Day-to-day life was influenced by a network of kinship and caste relations. Consequently, the
religious groupings of "Hindu" and "Sikh" remained fluid and frail…These commonalities tied them together
into a common symbolic universe” (201, 1997). At this stage there is an essential feeling of relatedness between
the Hindus and Sikhs, not merely a passive acceptance of different customs and beliefs. Rajkumari Shanker
relates more similarities: “The result of all this was that the two were integrated into a common cultural
universe. They shared the same grammar of social relations based on vertical ties of kinship and caste rather
than the horizontal solidarity of religion and community” (201, 1997). However, Badami makes it clear soon
enough that the feeling of kinship is not an absence of awareness of the religious duties of one’s faith. These are
alluded to when the author says about Bibi-ji or Sharan: “As a Sikh she already knew she was not supposed to
worship idols and stones and pictures, but her mother had said that gods from all religions were holy and it
would not hurt to pray to them now and again” (8). This serves to show that although the characters are
conscious of their religion they live in harmony with other religions.
Badami also gives out other pieces of information indicating that at this juncture religious dissimilarities are not
powerful and dominant obligations, a form that they later assume. She tells readers that Sharan's husband wants
her to learn both English and Gurbaani (33). Also, Sharan secretly breaks the rules of her religion by cutting her
hair to even them out (35). And more importantly, Pa-ji celebrates all festivals: “He insisted on being multi-
denominational as far as festivals went, and celebrated them all-Baisakhi, Diwali, Eid, Hanukkah, Christmas”
(38). In addition to this, Lalloo too rejects Sikh tradition despite Pa-ji’s objections; he cut his long hair and
traded his turban for a hat. (59). These examples from the pre-partition period stress that although religious
consciousness is present in the psyche of the characters, it remains latent in their lifestyle. Characters are not so
acutely aware of either the religious or cultural divide. There is a sense of sharing and community life in the
initial phase. When Sharan and Lalloo disregard the customs of their community, they experience a feeling of
emancipation rather than the pressure on the mind of any guilt and consequent remorse. This displays the initial
tolerant and open-minded approach to religious convictions. Pa-ji’s actions appear in his connection with all
festivals and languages and thus become an access to accommodate people of their own and other faiths.
Up to here, realization of religion is not extreme, yet the affinity and sense of pride is very much present. Pa-ji
(Khushwant Singh) treats younger immigrants to Canada as younger brothers. (40). Also, Pa-ji and Bibi-ji run
an open house for newcomers “Anyone was welcome: relatives, friends, refugees, children of friends on their
way to somewhere else, they were all ushered in” (42). Pa-ji explains the reason for this: “People helped me
when I came here, and this is my way of paying back. We are strangers in this land and have nobody but our
own community to turn to” (47). The sense of fraternity that Pa-ji feels for his fellow Sikhs is demonstrated in
his generosity for recent immigrants. His love also acquires a feeling of pride. Badami reports: “It pleased him
to be reminded that Sikhs were scattered all over the world, like seeds that had exploded from a seed pod” (60).
It is a matter of happiness for Pa-ji that Sikhs have settled in many parts of the planet and their common religion
SCHOLARS WORLD-INTERNATIONAL REFEREED MULTIDISCIPLINARY JOURNAL OF CONTEMPORARY RESEARCH EISSN 2320-3145, ISSN 2319-5789
www.scholarsworld.net [email protected] Volume.1, Issue.2, July 2013 [146]
is flourishing there. Speaking about the Indian diasporic community, Aparna Rayaprol states in Negotiating
Identities: Women in the Indian Diaspora: (1997) “Religion is another identity marker that helps Indians to
preserve their individual self-awareness and group cohesion” (16). In the diasporic location of Canada, Pa-ji
maintains ties with his Sikh associates in an effort to uphold the religious identity he shares with them.
Rayaprol’s assertions are corroborated by Ajay Kumar Sahoo in Sociology of Diaspora, A Reader (2007):
“Religion serves as a major symbolic resource in building community around Gurdwaras, temples and
Mosques” (115, 116). Pa-ji’s love and pride for his creed is not just a passive emotion of satisfaction. “Pa-ji is
active on the religious front. He sends out petitions to fellow Sikhs for funds for this or that charitable cause and
worked on his book, The Popular and True History of the Sikh Diaspora” (200). In spite of all this he is a
citizen of the world who wants his wife to know English and he also wishes to share the happiness of others.
4. THE PARTITION OF INDIA: A DEFINING MOMENT IN THE POLITICAL HISTORY OF
THE INDIAN SUBCONTINENT:
The Partition of India is mentioned time and again in the novel. Kanwar writes to Bibi-ji in Canada: “Ever since
it was announced that there will be a division of land between the Hindus and the Mussalmans, there has been
unrest” (44). The first mention of the rise of religious consciousness and the distrust between the Muslims on
one side and Hindus and Sikhs on the other starts with the mention of the partition. Again the distinction is
between the Hindus and Muslims, Kanwar does not mention Sikhs separately. So, it can be assumed that the
Sikhs are counted together with the Hindus. In this initial mention of separation, the unease is due to the
allotment of land and the consequent insecurity of where one would find oneself after the division. There is no
actual distrust or dislike of the other side. Veena Das in “Time, Self and Community: Features of the Sikh
Militant Discourse” (1996) comments about the bulding up of a Sikh narrative of identity. She states, “the self
is given shape and form by opposing it to its 'others'. There are two communities that are posited as the
counterpoints of the Sikh community, the relevant others, in the building up of this narrative. The first are
Muslims” (178). Her postulation is that up to the partition times the distinction between the Sikh and Muslims
was important but after partition this got neutralised. Das goes on, “the second opposing community is that of
the Hindus” (178). The veracity of Das’s assertions is visible in the action of the novel at this stage. It can be
seen clearly here that the Muslims are the ‘other’ at this point, the Hindus and Sikhs are on the same side. But
events later in the novel do reveal that the oppositional other changes and the Hindus take on this position in the
perception of the Sikhs.
This holds true for those living in Canada too. In accordance with this, the author continues with the details of
the everyday life of the characters in Canada that goes on as usual. However, soon the account goes on to
another letter by Kanwar. The unrest mentioned earlier is now a heightened animosity: “Last week there was a
big fight between the Mussalmans and the Sikhs in Hazara district in the north-west...Across our land, hearts
are filling with anger and hate” (49), Kanwar writes. Yet, at this stage Kanwar’s husband is still hopeful and
believes that the Muslims in the village, his long-time neighbours are like kith and kin and will protect his
family (50). This stage is the changeover period when acrimony between the two factions has taken root but is
not a wholly wrought enmity. However religion does become an important aspect of life as the partition draws
near and a month before the actual event, in Canada there are “rumours of fighting between Hindus and Sikhs
on one side and Muslims on the other, of the beatings and rapes and killings accruing daily in the villages near
the lines that had been so arbitrarily drawn across the country” (50). Violence erupts due to the political
redrawing of borders. These geographical boundaries also represent the divisions in the hearts of the people and
serve to strengthen the religious divide; the earlier neighbourhood affinity is lost. Individuals find it impossible
to escape that phase of religious affinity and repulsion for those belonging to another faith, they fall prey to
collective violence. The scene of carnage during the partition period has been documented in literature and
history giving rise to a whole sub division of fictional accounts dealing with this massacre called Partition
Literature. M. G. Vassanji in A Place Within: Rediscovering India (2008) states: “In 1947 arrived the last
viceroy of India, Lord Mountbatten to oversee the division and independence of India…The boundary was
drawn, and the transfer of populations, which took place in the north-west and north-east, was accompanied by
scenes of gruesome violence in which half a million lives were lost” (170). In the fictional world of the novel
too, political events continue to have an effect on socio-religious affairs: “Bibi-ji found it hard to believe that
SCHOLARS WORLD-INTERNATIONAL REFEREED MULTIDISCIPLINARY JOURNAL OF CONTEMPORARY RESEARCH EISSN 2320-3145, ISSN 2319-5789
www.scholarsworld.net [email protected] Volume.1, Issue.2, July 2013 [147]
people who had lived as neighbours and friends for so many years could suddenly become enemies just because
of a line drawn on a paper map in a government office” (51). Bibi-ji’s objective insight into the situation in the
neutral territory of a distant country uninvolved in the politics of the sub continent is shared by the readers who
are studying the novel in a comparatively distant point in time. In this way readers too discern the insanity of
the violence that the political events have unleashed.
In addition to this, during partition violence, Nimmo’s mother is raped. It needs to be noted here that the agent
of this extreme violence remains undisclosed. The reader is not told about the identity or religious inclination of
the rapist, this is because it is an act of violence due to the communal perception that the politics of the time
gave a free rein to. Therefore, it seems that there is no purpose in identifying the instrument of collective
consciousness except that it is a faceless, non-Sikh man. Preeti Gill in The peripheral Centre, Voices from
India’s Northeast (2010) makes a point about the position of women when violent activities are unleashed. She
says, “often women's bodies become the site of battle with innumerable instances of atrocities and brutality”
(10). At this point, in the tale, Nimmo’s mother, a woman, loses her reputation and her life as well for being an
agent belonging to the other side. She commits suicide by hanging herself because of her shame and humiliation
at her rape. Gill continues: “Women who lose their 'honour' find it extremely difficult to lead normal lives and
live down the stigma” (10, 2010). Nimmo’s mother knows this reality only too well and therefore takes the
extreme step of killing herself rather than face the shame. Gill elaborates: “The effects of violent acts like rape,
sexual abuse and physical assault and abuse has led to deep psychological and emotional trauma and a very
high incidence of what is known as Post Traumatic Stress Disorder” (8, 2010). In the novel, the veracity of
Gill’s words is revealed in the actions of the victim who tries to wash away the disgrace. This demonstrates the
cruel outcome of the assault, of offending her feminity that finally pushes her to suicidal death after the tragic
pathos of trying to wash away her shameful experience which her daughter remembers over and over again in
parts. Badami only indirectly reveals this to her readers, “Nimmo could not rid herself of the memory of a pair
of feet dangling above a dusty floor, their clean pink soles smelling delicately of lavender soap” (159). The
violent past haunting Nimmo’s mind through memories seems to be a continuation of the traumatic tension that
her daughter too feels at the memory of the mother’s rape. This technique of revealing Nimmo's memories
slowly but repeatedly reinforces the trauma of the violence during partition and serves to demonstrate the issue
of the rise of religious feeling that has its source in the political events of the time.
Like Nimmo, there are others who lose everything including their relations and identity during the partition. But
this is not damage enough; other scenes are related by the writer. The author continues to the time when Nimmo
is trying to cross over to India: “She joined a kafeela…and walked for days in that enormous ragged line of
people, begging people for food and water” (157). In the riots that followed the partition, entire families were
wiped out and there were those considered lucky because they managed to escape, leaving behind all they had.
Kafeelas were made up of such people walking in a long column, trying to protect all they had-their lives.
“They passed burning villages… She saw men weeping for their losses. Bloated corpses floated in the canals
that ran along the edges of the fields, and lost-eyed children like herself begged pitifully for food and water”
(157). This also confirms the passion and fanaticism that religion can generate in the lives of ordinary people.
Alok Bhalla points out in Memory, History and Fictional Representations of the Partition, (1999) “The
violence that accompanied India's partition in 1947 was of such fiendishness that it has defied understanding.
Fictional writings about this period express this bewilderment. They also portray pre-partition times of
tolerance. The writers deal with the violence itself in different ways – redemptively, pessimistically or
cynically” (3119). A limb cut or horrendous death without food or water and rape were common occurrences
during the time and were inflicted for the sole purpose of separating those on the same side from those on the
other side. As Bhalla testifies, Badami’s readers too are left confused about the extent of the rapid deterioration
in the ties between former neighbours and friends.
The violence that is perpetrated in the name of religion happens in India. It reaches Bibi-ji in Canada as a distant
reality. She learns of it only through letters, rumours and news on television: “In the months that followed, stories
of the savagery sweeping Punjab in the north-west and Bengal in the northeast trickled steadily into Vancouver”
(51). But, in Canada, Muslims like Hafeez Ali and his friend, Alibhai are regulars at the Indian restaurant called
‘The Delhi Junction Café’ run by Pa-ji and Bibi-ji (65). In spite of the partition and consequent violence back
home, in the early years of the restaurant’s life, the Indians and the Pakistanis had sat hunched around the same
SCHOLARS WORLD-INTERNATIONAL REFEREED MULTIDISCIPLINARY JOURNAL OF CONTEMPORARY RESEARCH EISSN 2320-3145, ISSN 2319-5789
www.scholarsworld.net [email protected] Volume.1, Issue.2, July 2013 [148]
table (65). Ajay Kumar Sahoo states “Food and cuisine form a significant feature of Indian identity in the
diaspora. One can easily locate an Indian restaurant in any major metropolitan city of Canada” (117, 2007). This
seems to be the situation in the fictional world of Badami’s creation, common food habits play a major part in
joining members of the sub continent in a fraternal bond. They meet regularly in the Indian restaurant and
exchange pleasantries. This shows that at this point in the novel, the politics of the homeland is not so strong a
force at least in Canada and this consciousness is not so vigorously felt there. The characters depicted are away
from their homeland, the prime condition of their mind is dislocation, the pain of not being on native soil is
powerful enough to supersede any feeling of ill-will and they consider themselves associates if they belong to the
same ethnic location. In fact, at this point Bibi.-ji is not even sure which country is 'home' for her, “A taut rope tied
them all to "home", whether India or Pakistan” (65). Political events in the home country do not exert so powerful
an influence. But she acquires the necessary conviction later when she decides that her loyalties lay with India, not
Pakistan (66). Nevertheless, later the violence becomes real as the political events in the characters’ native lands
force them to take up a definite identity as the next section demonstrates.
5. EVENTS IN CANADA REFLECT THE SENTIMENT IN INDIA:
Presently, incidents that take place due to the politics of the time do have an effect. The first war between the two
newly formed nations is referred to: “In 1965, when war broke out between India and Pakistan, the battle came to
The Delhi Junction as well. The seating maps altered, and Hafeez and Alibhai moved defensively over to a
separate table across the room from the Indian group” (66, 67). When the two countries are at war with each other,
the split consciousness that was fired with the partition travels all the way to far-off Canada to reach and divide of
the space they occupy physically. Mental consciousness of partition in the form of religion and creed too splits the
beings into opposite numbers. The damage is identical: “Anger, hurt and loss simmered on both sides” (67). The
escalation of the resentment is analogous to the intensification of the political hostilities back home. So much so
that at one point the two sides are not even on speaking terms and soon the two regulars cease to be patrons. But,
Badami is quick to reveal the outcome at the end of the war. “But when the war ended a few months later, they
reappeared as if nothing had occurred” (67). The war between the two countries, India and Pakistan has ended and
there is no cause for continued animosity. Therefore, after the war, the antagonism is forgotten and both sides
share the same camaraderie that existed earlier. An unchanged consciousness prevails once again as if a wave that
had split from and the sea merges with the deep waters again. However, these agreeable circumstances are a
transitory phase and the author, feeling the need to stress this, gives her readers a clue to the future. As predicted
by Veena Das earlier, the amity between the Sikhs and the Hindus turns to antagonism.
When Bibi-ji decides to rent out her flat to her Hindu friends and is feeling happy about it. Badami addresses
her audience: “But that was before events in distant India poisoned her life, before bitter anger wiped out the
gratitude and her friends became her enemies” (70). This advance information about her character in an act of
foreshadowing has a dual purpose: First, it stresses Bibi-ji’s gratitude for her long friendship with Leela and
how this friendship becomes sour as a consequence of political events. It lets the addressees observe the way in
which Bibi-ji changes her stance from a regular member of the community to a strong reactionary. Veena Das
explicates further: “The emergence of a militant movement among Sikhs, both in India and among emigrant
Sikhs, is an important phenomenon” (176, 1996). This important trend is depicted by Badami in her characters
especially Bibi-ji. The same Bibi-ji who once thanked her stars for her Hindu friend, revises her opinion due to
the effect of politics. Second, this also tells readers that politics does not cause a rift between different nations
but internally within citizens of the same nation also. This time the Sikhs and Hindus are in opposition. Badami,
continuing to utilize the unique narrative style employing prolepsis or an interjected scene that takes the
narrative forward and after appraising readers about the future goes back to past political affairs.
6. THE KHALISTAN MOVEMENT: THE BEGINNING OF SIKH REVIVALISM AND THE
APPEARANCE OF DR. RAGHUBIR RANDHAWA:
The introduction of the character of Dr. Raghubir Randhawa (250) is important from the point of view of the
permutation of a divisive ideology into politics. This also portends the commencement of the rift between Sikhs
and Hindus. Dr. Randhawa is a supporter of Khalistan, a separate country for the Sikhs. George Bryjak in
“Collective Violence in India” (1986) elaborates: “Sikhism, a religion founded by Guru Nanak in the fifteenth
century, has a long and proud military tradition. Sikhs view themselves as a unique people, and some of them
SCHOLARS WORLD-INTERNATIONAL REFEREED MULTIDISCIPLINARY JOURNAL OF CONTEMPORARY RESEARCH EISSN 2320-3145, ISSN 2319-5789
www.scholarsworld.net [email protected] Volume.1, Issue.2, July 2013 [149]
have attempted to establish an independent political state since 1947” (38). The demand for a separate country
for the Sikhs is linked to feelings of pride in one's religion, ethnicity, language, and way of life for Dr
Randhawa. His politics of identity is conducted through a paranoiac hatred of others. George Bryjak clarifies
further: “The desire for an autonomous homeland to be called Khalistan (derived from the concept of Khalsa- a
chosen race of soldier-saints), along with a number of other economic, social, and cultural grievances, has pitted
Sikhs against their Hindu neighbors, the local police, and the federal government” (38, 1986). Bryjak’s
statements are proved true in Badami’s story in the character of Dr. Raghubir Randhawa. He is a Sikh scholar
who has come to Canada from Southall, England. He is Pa-ji’s guest and has been invited to lecture at the Sikh
temple. “On the drive home, Pa-ji also discovered that his guest had arrived on wings of anger and discontent,
for it was promises-broken ones-that had brought him to Vancouver” (251). Badami takes care to point out that
Dr Randhawa is not only different in sartorial taste and appearance, but that the difference is ideological also.
His communication is part of the political idiom being developed by the militant movement to create a
politically active group and to forge an effective unity among his community against the Hindus.
Badami goes to a great extent to stress the fact that at this point Dr. Randhawa’s intense views are not common
amongst others especially his hosts. For, although Pa-ji contributes to the Sikh cause, he does not believe in Dr.
Randhawa’s extreme opinions. He attends the lecture out of a sense of duty towards the visitor and because he
considered Dr. Randhawa, a fellow historian and a history lesson was not to be missed. Bibi-ji went out of
politeness, although she thought the man a pompous fellow who talked too much. Lalloo is present as well,
because Pa-ji had forced him to do so. He had brought his six-year old son, who spent the hour buzzing about
the hall pretending to be a fighter plane. Jasbeer was there for the same reason as Lallo, Pa-ji had insisted.
Further, Badami writes:
But his lecture the following evening was poorly attended; there were only five people in an echoing hall that
could accommodate three hundred… An old Sikh man, spread out over the last five chairs in the hall, was
taking a nap, his snores occasionally rising above Dr Randhawa's impassioned speech. (251, 252)
Badami uses humour to good effect here. Dr Randhawa’s role as a speaker and revolutionary for his
community is ridiculed with descriptions of a scanty audience and dozing listeners.
The main force of Dr. Randhawa's speech is about a separate state for Sikhs - Khalistan. Archana Goyal in
Terrorism: Causes and Consequences (1990) says “The voice of 'Khalistan', purely, political issue, has been dyed
with religious touch and a number of groups are formed to disturb the peace of the people and the government,
with their undesired actions” (74, 75). Here, religion and politics get intertwined; the desire for political power is
cloaked in a religious garb. In the novel, Dr. Randhawa talks in terms of religious convictions. He starts:
"The Sikhs have been betrayed!"...We have been betrayed for two hundred years-first by the British, who stole
Punjab that our great Maharaja Ranjit Singh won for us from the Mughals… and then by the Congress Brahmans,
who gave the Musalmans their Pakistan and the Hindus their India but left the Sikhs to die in between; then by
Nehru…and his winning words…And we have been cheated again by the rose-wearing Brahman's daughter,
Indira Gandhi who takes the wheat that we grow on our lands and distributes it to all of Hindustan, who diverts the
water from our rivers to neighbouring states and leaves us with empty buckets. (252).
The remarks made by Veena Das are pertinent here: “It is important to appreciate the juxtaposition of the stories
of how Sikhs had been insulted and oppressed, the allusions to mythology and folklore about the past heroic
deeds of the Sikhs, and the exhortations to violence” (189). Dr. Randhawa comments about the Hindu Brahmins
and his stance clearly shows his antagonism towards them. Again his appeal is to past wrongs that have to be
set right. His open criticism of the political regime of the time and his identification of the government with
Hindustan-the land of Hindus in his speech can be considered the first stirrings of a Sikh revival in Badami’s
story. The words he uses are significant as they are meant to incite passion and mark the reality of being Sikh as
distinct from not just Muslims but Hindus as well. Here, Dr. Randhawa’s exhortations to incite the audience
follow the expected contours of the buildup of a common Sikh account of having been victimised for their
service to their country. V. S. Naipaul considering the concerns of Sikhs in his travelogue India A Million
Mutinies Now (1990) alludes to “Sikh alienation” (427). He discusses the case of one Sikh, Gurtej Singh who
resigned from the Indian Administrative Service because of his commitment to the Sikh cause, Naipaul writes
about Gurtej Singh: “He wanted, the very first time he came, to talk about the importance of water. Punjab
depended on the water of its rivers; it didn’t like sharing its water with other states. Since 1947, he said more
SCHOLARS WORLD-INTERNATIONAL REFEREED MULTIDISCIPLINARY JOURNAL OF CONTEMPORARY RESEARCH EISSN 2320-3145, ISSN 2319-5789
www.scholarsworld.net [email protected] Volume.1, Issue.2, July 2013 [150]
people had died quarrelling over water than had died over the upheavels of partition. 'The water problem is the
crux of the matter' ” (427, 428) . Naipaul’s observations about the response of ordinary Sikhs to the policies of
the Indian authorities are reflected in the concerns of the fictional character of Dr. Randhawa, who also talks
about the ‘water problem’. Veena Das, speaking about the rise of militancy in the Sikh religious tradition says:
“In this narrative, the Sikh community is defined in the contemporary period with reference to certain key
events of the past, which emphasise the building up of the community on the basis of its heroic deeds” (178).
Dr. Randhawa’s subsequent words in the novel relate exactly to Das’s observations. Dr. Randhawa continues:
We fight their wars for them; give up our young men for the safety of their Hindu lives. Think how many
soldiers in the Indian army are Sikhs! Think how many of us are dying fighting the Pakistanis while the Hindus
shiver behind their doors! And then think what we Sikhs have got in return for all this endless generosity! A
kick-that's all. We have been betrayed, I say and we are fools to sit quietly and take it. (252, 253)
These words seek to inform Sikhs about their foolishness and innocence in the acceptance of their position as
brave warriors who fight the enemy selflessly to preserve the lives of their weak co – citizens. Naipaul
continues: “The establishing of a Sikh identity was a recurring Sikh need. Religion was the basis of this
identity; religion provided the emotional charge” (448, 1990). Dr. Randhawa’s exhortations to his Sikh brothers
and sisters point toward his larger arrangement of creating a distinctive Sikh character. Once again Naipaul’s
assertions are relevant: “Religion became the identification with the sufferings and persecution of the later
Gurus: the call to battle” (450). The use of religion to commandeer the Sikhs who are as yet moderates and do
not subscribe to Dr Randhawa’s exteme views is in evidence at this point in the narrative. Veena Das continues:
“The self of the Sikh as it emerges from this particular organisation of images is that of the martyr whose
sacrifices have fed the community with its energy in the past, while the Hindu is weak and effeminate or
cunning and shy” (179, 1996). The fiery content and rhetoric of instigation used by Dr. Randhawa are italicized
by the author only to stress his political intents and his agenda of creating an alternative army through the
immigrant Sikhs. Naipaul also reports that Gurtej had written a paper for a university seminar in 1982 entitled
'Genesis of the Sikh problem in India'. “Its primary theme was the separateness of the Sikh faith and ideology
from the Hindu; its further theme was that the Punjab was geographically and culturally more a part of the
Middle East than of India. The great enemy of Sikhism and the Sikh empire of Ranjit Singh had been-again-
brahminism” (444). This is indicative of the widespread sentiment of Sikhs in the fictional world of the novel as
well; the focal point of Dr Randhawa’s refrain is the centrality of territory as a means of preserving identity. He,
therefore wants the Sikhs to assume a singular identity that seperates them from the others. This seperation is
sought to be enforced in terms of opposition. Dr Randhawa’s behaviour, his missionary spirit of leadership
wanting to direct his co-religionists and his comments on the power figures of recent national history are all
designed to underline to his addressees a separatist way of thinking, the need for a religion based split, in other
words a separate state and identity for Sikhs.
However, Dr. Randhawa's opinions and views are not yet common among the Sikh community in Canada.
Badami uses an elaborate narrative arrangement to show up the tolerance and moderation of Dr. Randhawa's
audience. Again, there are some light, even humorous moments as the antics of Lalloo's son are described: “
"Nothing doing!" said Lalloo, who had missed most of the speech because his son had been whispering an
elaborate story of planes and ghosts into his left ear” (253). Dr. Randhawa ends his speech with a battle cry:
“we lie bleeding, but we are not dead yet. Arise warriors, and shout with me, Our country or Death!” (254). But
this fails to wake up the sleeping gentleman: “From the back row, a gentle snore emerged from the open mouth
of the old Sikh” (255). Furthermore, as part of her plan, however in the middle of the lecture, full of Dr
Randhawa's rhetoric, Badami makes sure that the readers know about Pa-ji's and Bibi-ji's views. “Bibi-ji gazed
at the maps one on top of another, her thoughts wandering in a different direction from Pa-ji's. Like me, she
thought. A series of tracings, a palimpsest of images, the product of so many histories, some true, some
imaginary, all valid, but surely not all necessary?” (255). Bibi-ji’s thought process reveals her feelings of
compassion and a sense of harmony.
The humanitarian concerns of the central characters are not so easily shaken by the flaming words in the
speeches of Dr Randhawa as far as they able to see his projection as ‘not all necessary.’ The politics of the time
do have an effect but this is not yet so great that the characters modify their core values. Thus, amidst all this
Pa-ji remains resolute in his outlook. Rajkumari Shanker states: “Identity formation is inevitably a dual process.
It is not sufficient for a group of people to think that they constitute a separate entity; those among whom they
SCHOLARS WORLD-INTERNATIONAL REFEREED MULTIDISCIPLINARY JOURNAL OF CONTEMPORARY RESEARCH EISSN 2320-3145, ISSN 2319-5789
www.scholarsworld.net [email protected] Volume.1, Issue.2, July 2013 [151]
interact must also recognize this claim” (202, 1994). This explains the reason for the moderation of Dr
Randhawa’s audience. They are reacting to the attitude of the supposed others who do not consider them as
different and thus Pa-ji, Bibi-ji and their friends do not think it necessary to take on a single identity, they are
happy to be contained by a multiplicity that encompasses within it the identity of an Indian. However Dr
Randhawa’s standpoint of a detached personality and his insistence on a separate state for Sikhs, Khalistan – the
land for the Sikhs, the pure and the brave remains unwavering. People like Dr Randhawa feel that during and
after partition under the secular nation of India, Hinduism is assimilating Sikhism and his project is for the
promotion of his religion as a separate entity which a further division from India will ensure. But his views are
not supported by anybody at that juncture as Badami takes pains to expose.
Badami continues to use her special narrative technique by interspersing thoughts with the narrative voice. Bibi-
ji’s voice: “But then she had a deep-rooted suspicion of anyone who wanted to divide up countries, a theme that
seemed to run through everything Dr Raghubir Randhawa said” (251). Pa-ji's thoughts too are revealed at this
juncture and later the narrator takes over telling readers that Pa-ji enjoys Dr. Randhawa's company due to his
“vast knowledge of Punjabi history” (256). Again the narrator’s voice changes to the character’s utterance.
Then the omniscient narrator continues: “Out of politeness, because Dr Randhawa was, after all, his guest and
guests were akin to God above, Pa-ji refrained from disagreeing with him on any point. But his sympathies for
the visitor waned rapidly” (256). Pa-ji's and Bibi-ji’s opinion of their guest is further made known. When Bibi-ji
calls him “Idiot” (257) and Pa-ji says “I don't think much of his notion of a separate country” (257) and still
later: “Pa-ji was relieved when his guest left. All the talk of secession made him deeply uneasy. He hoped this
was the last he would see of Dr Randhawa and hear about a free county for the Sikhs. He wished it would all go
away” (257). Yet again, the narrative technique assumes importance here. Badami changes the track in a subtle
way between the character’s voice and the omniscient narrator’s.
After the elaborate revelation of the character's thoughts and opinions, the narrator in the very next sentence
says “But he was wrong. Nine years later Dr. Randhawa would return to Vancouver, and this time he would be
greeted by an audience that not only filled the auditorium but flowed out of it as well” (258). This technique of
taking the readers fast forward to a time nine years later when Dr. Randhawa's views have become popular and
Pa-ji has been proved wrong is Badami’s way of showing the readers that seperatist tendencies are on the rise in
the diasporic location of Canada also. As a result of the political events of the home country, the outlook of the
Sikh community towards their Hindu counterparts changes. Badami also discloses Bi-biji's personal loss and the
death of Pa-ji signalling the death of tolerance and human sympathies Dipak Gupta makes a significant
assertion: “Every movement starts with an idea: an idea of a group of people being wrongfully treated by
another” (104, 2008). In the story bound realm of the novel, Dr Randhawa’s speech certainly conforms to this,
he does talk about the mistreatment that his group has suffered. Dipak Gupta continues: “Sometimes the
offending group consists of "those" who have deviated from the ''true path" of a common religious faith;
sometimes they are accused of being interlopers with no claim to the land; and sometimes the "others" are seen
as the source of economic exploitation” (104, 2008). In Badami’s account, this is seen in the accomplishments
of Dr. Randhawa. His foremost attempt to germinate a reactionary and revolutionary spirit among his
community fellows that seems to be a failure and ridiculed by the author transforms at a later date as the idea of
his community’s manipulation has been planted. His second appearance seems to be powered by much political
upheavals to the extent of gaining him wide popularity effortlessly and this time it is his opposers who are in the
minority, they are seen as differing from the right path. His subsequent emergence, after operation Blue Star, is
the final stage in this viscid loop.
Later, Bibi-ji’s persistent silence, her refusal to warn her friend reveals the malevolence in her consciousness
towards one who still considers her a friend. Jayaram and Saberwal observe, “group conflicts may sour
interpersonal relations between two persons” (23, 1996). This observation is accurate in the fictional world of
Badami’s creation. There is no source of personal animosity between Bibi-ji and Leela, Bibi-ji’s bitterness is
entirely due to her membership of her clan. Badami continues: “But Lalloo had said that it was not safe to fly
Air India-economic boycott, his friend, the travel agent, had said. Perhaps sabotage” (383). This implicates all
of them in the silence that is the cause of Leela’s death. As the omniscient author has already indicated, Lalloo,
his friend, the travel agent, Jasbeer and even Bibi-ji are all aware of the plans to avenge the lives of their co-
religionists back home but say nothing to warn Leela, their former friend. This clearly illustrates the sentiment
SCHOLARS WORLD-INTERNATIONAL REFEREED MULTIDISCIPLINARY JOURNAL OF CONTEMPORARY RESEARCH EISSN 2320-3145, ISSN 2319-5789
www.scholarsworld.net [email protected] Volume.1, Issue.2, July 2013 [152]
of brotherhood and communal filialship that overrules all other sentiments of morality and friendship. The
politically motivated happenings in the motherland are powerful enough now, to silence them. And the silence
referred to is not just the physical lack of speech but also the silencing of their ethics and morality, of their love
and duty towards one who still considers herself their friend. Some remarks made by Veena Das are relevant
here. She states, “where active agency is vested in the Sikh as killer, it is framed there by the context of the fight
for justice” (188, 2000). The fight for retribution for the wrongs against their community justify the use of
violence for the members of the group.
The events in both countries that the action of the novel is located in helps to elucidate the effect of the home
country upon the diaspora. When the break up involving Sikhs and Hindus in India takes place, in the disporic
location of Canada too the divide between the Sikhs and Hindus intensifies. About Bibi-ji, the author says:
“Over the next few days, she was increasingly conscious that the tension between the Sikhs and the rest of the
Indian community already high after the invasion of the Golden Temple, was now closer to exploding. When
Bibi-ji hears of the fate of Nimmo's family: "She felt as if the world that she had known for so long, the stable,
safe world, had been blown apart, leaving only smoky puffs of whispering poisonous rumours" ” (375).
Revenge for actions in the native country is sought by the characters who are now residents of another country.
This proves that ties of communalism and religious concord are stronger than those of personal friendship and
amity. Ami Sands Brodoff observes: “Badami proves that a novel can bring home the impact of political events
with an immediacy and power that newscasts and historical texts cannot” (2001). The novel reaches a
devastating climax when the conflicts of the past erupt into the lives of all three women.
7. CONCLUSION:
The circumstances in the home country are complex. In a situation vitally altered by Partition, the Sikhs have
been questing for their identity and role in independent India, where in the Constitution, they were clubbed with
the Hindus and declared against their theology as a Hindu sect. While the Sikh aspiration to defend their
revelation and maintain their identity is wholly legitimate and understandable, it has not remained untainted by
the distortions introduced into the historical situation by Partition. Thus, the Sikh definition of identity has been
conceived on the lines of the two-nation theory, with the negative emphasis on separation, cultural or territorial,
from Hindu India. The elementary distinction between Khalsa raj, the perfect equivalent of Gandhi's swaraj,
and Khalistan was never clearly apprehended or spelt out. The Sikh ideal of cultural and religious pluralism or
the other radical idea of people’s power and sovereignty as a counterweight to any arbitrariness and tyranny of
the State did not receive due attention and emphasis as the core of Sikh identity and fundamentalism. This gets
reflected in the novel, the way in which Bibi-ji equation with her Hindu friend, Leela change and transforms
from friendship into animosity provides evidence of this.
It can be said, therefore that not being bound by the physical restrictions of their homeland did not exempt the
characters of the novel from the happenings in the homeland. The characters have left behind their land and
possessions to seek a better life in an alien land. In spite of this, their identity is embedded in their religion and the
area where their ancestors were from. The communities of different faiths they had been living and working
alongside with have no true power over their inclination and fondness which lies with their brethren from a land
which may be far off in physical distance but is mentally and emotionally nearer than the land which provides
them with sustenance and a comfortable life. Thus it is that characters who left India before the partition cannot
remain neutral to the two countries India and Pakistan but decide on the place they will call home based on the
events in the place of their birth. The total unison of the community can be gauged from the fact that one-time
moderate elements like Bibi-ji become part of extremist groups. Lalloo too starts wearing an Indian salwar suit in
place of his earlier pants and he wears a turban instead of a hat. Also, his beard and moustache grow (338). The
cultural significance of dressing to identify one’s religion is conceived by Lalloo to the extent of changing himself
accordingly. “Political conflict necessitates mobilization of people around some symbols, slogans, ideology, or
programme” (25, 1996) assert Jayaram and Saberwal. Lalloo’s adjustment in attire signals his enlistment to the
religious cause. With the change in dress, he assumes a more evident identity in keeping with the renewed power
of the religious convictions in his life. His earlier indifference in matters of religion is no longer in evidence,
signifying his wllingness to take up disagreement with those perceived as others.
SCHOLARS WORLD-INTERNATIONAL REFEREED MULTIDISCIPLINARY JOURNAL OF CONTEMPORARY RESEARCH EISSN 2320-3145, ISSN 2319-5789
www.scholarsworld.net [email protected] Volume.1, Issue.2, July 2013 [153]
8. REFERENCES:
BOOKS:
1. Anita Rau Badami. (2006) “Can You Hear the Nightbird Call?”, New Delhi: Penguin Viking.
2. Rajkumari Shanker. (1997) “Women in Sikhism”, In Sharma, Arvind (ed), Religion and Women, Delhi:
Sri Satguru Publications, pp183-210.
3. Aparna Rayaprol. (1997) “Negotiating Identities: Women in the Indian Diaspora”, New Delhi: Oxford
University Press.
4. Ajaya Kumar Sahoo. (ed) (1996) “Sociology of Diaspora, A Reader”, Jaipur: Rawat Publications.
5. Veena Das. (1996) “Time, Self and Community: Features of the Sikh Militant Discourse” in Jayaram, N.,
Saberwal, Satish (eds). Social Conflict, Delhi: Oxford University Press.
6. M.G. Vassanji. (2008) “A Place Within: Rediscovering India”, New Delhi: Penguin Books India.
7. Preeti Gill. (ed) (2010) “The Peripheral Centre, Voices from India’s Northeast”, New Delhi: Zuban, an
imprint of Kali for Women.
8. Archana Goyal. (1990) “Terrorism Causes and Cosequences”, Bikaner: Institute of Environment.
9. V.S. Naipaul. (1990) “India A Million Mutinies Now”, London: Vintage.
10. Dipak K. Gupta. (2008) “Understanding Terrorism and Political Violence, The Life Cycle of Birth,
Growth, Transformation and Demise”, London and New York, Routledge: Taylor and Francis Group.
JOURNALS:
1. Alok Bhalla. (1999). “Memory, History and Fictional Representations of the Partition”, Economic and
Political Weekly, Vol. 34, No. 44: 3119-3128.Stable URL: http://www.jstor.org/stable/4408572.
Accessed 19 May, 2011.
2. George Bryjak. (1986) “Collective Violence in India”, Asian Affairs, Vol. 13, No. 2: 35-55. Stable URL:
http://www.jstor.org/stable/30171906. Accessed 19 May, 2011.
ONLINE RESOURCES:
1. Anita Rau Badami. (2011) In interview with Brodoff, Ami Sands.
<http://www.aelaq.org/mrb/feature.php?issue=19&article=544&cat=1>Accessed on 20 April, 2011.
----
SCHOLARS WORLD-INTERNATIONAL REFEREED MULTIDISCIPLINARY JOURNAL OF CONTEMPORARY RESEARCH EISSN 2320-3145, ISSN 2319-5789
www.scholarsworld.net [email protected] Volume.1, Issue.2, July 2013 [154]
CONVERSATION WITH THAKSIN – FROM EXILE TO
DELIVERANCE:
THAILAND’S POPULIST TYCOON TELLS HIS STORY
Tom Plate Singapore, Marshall Cavendish, 2011 249 pages $28.50 ISBN 9789814328685
WILLIAM J. JONES,
Lecturer Social Science Division, Mahidol University International College
Nakorn Pathom, Thailand
Nearly 7 years after the coup which ousted Thailand’s Prime Minister ThaksinShinawatra a new incarnation of the his Thai Rak Thai party the Puea Thai party is in power once again after an astounding landslide victory in Thailand’s 2011 general election which ushered in a Thailand’s first female Prime Minister, ironically or not his younger sister YingluckShinawatra. With campaign poster slogans saturating the landscape during the 2011 elections espousing slogans such as “Thaksin thinks, Puea Thai acts” as well as periodic reports of Skype cabinet meetings with Thaksin orchestrating party politics as mediation in policy, it is hardly in question that the ex-Prime Minister is very much involved in the politics of Thailand, albeit from afar. Exile it seems has hardly curtailed passions and necessity with which the ex-Prime Minister feels is intimate to his survival, return and possible rehabilitation. Plate’s book is based on interviews garnered over a week’s time which allowed the academic and ex-journalist unprecedented access to the man in Dubai. In this book a recurring dichotomy becomes evident; is Thaksin the unrepentant democrat or chastened autocrat? The ex-Prime Minister often reveals himself to be a unfairly judged and accosted supporter of the poor and “the people” while simultaneously surrendering to the acknowledged mishandling of domestic challenges such as the Southern Muslim insurgency and most importantly his gross misjudgment of antagonisms which he helped fuel and foster with the palace and royalist which may have led to his current exile and uncertain future. Nonetheless, this book is interesting in how the author approaches in functional order the rise of Thaksin, his exile and indirect comeback via his younger sister. The author attempts to draw Thaksin into the critical realm of his deposing and who was really behind this by referring to the royal institution and his confrontations with privy councilor PremThinsulanont, whom is considered to be one of the most influential and instrumental figures in the palace political complex (p. 145). This is perhaps the most crucial of aspects which the author addresses and indeed succeeds albeit in a conservative manner. The reasons for this are of course Thailand’s current political climate and political redress to the article 112 of the criminal code better known as the lese-majesty law. This highlights the still simmering undertones of Thai political economy where the extremely popular ex-
SCHOLARS WORLD-INTERNATIONAL REFEREED MULTIDISCIPLINARY JOURNAL OF CONTEMPORARY RESEARCH EISSN 2320-3145, ISSN 2319-5789
www.scholarsworld.net [email protected] Volume.1, Issue.2, July 2013 [155]
Prime Minister due to his electoral success stands in direct confrontation with Thailand’s most revered figure and its institutional machinery. The authorapproaches his subject with apparent objectivity and adds an intellectual flavor to the text as he begins chapters with quotes from Fukiyama’s Origins of Political Order and pepper the text with references to the aforementioned which add context in juxtaposition to the content of direct quotes within the text itself. The author is able to provide the layman reader with a broad context of the Thaksin the man and politician while zooming in an historian/journalist approach to give depth to content. Interesting to the larger question of what to make of Thai politics since Thaksin’s exile is the author’s elaboration on personal notes of what it is like being in exile, traveling as a luxurious vagabond and the very personal politics of the region itself as demonstrated in Thaksin’s close relationship with Hun Sen of Cambodia and the very real friction and conflict this caused between nations not to mention the domestic criminal proceedings which provide consistent impetus for his continued absence. The nature of Thai politics in its personal form of personality and persona is brought to the fore as the sheer force of Thaksin’s personality and his charismatic refinement which at times is politically chameleon like but nonetheless steadfast and apparently principle centered with a central focus on his democratic principles and support for Thailand’s forgotten millions which he gave voice to via policy. The volume does lack depth on issues of critical substance such as the role of the monarchy which is self-vindicating by way of Wikileaks and Thaksin’s alleged abuse of power and nepotism it provides readers with a glimpse into the political mind of what Time magazine called the future leader of Asia in 2001. However, what is brought forth very assertively is the vindictive nature of contemporary Thai politics and lack of legitimacy which has accompanied court decisions and diplomatic initiatives against Thaksin. In effect it becomes apparent in hindsight that ultimate vindication may very well await Thaksin in the future if events continue to unfold as they have prior. This book is easily accessible to readers using a clear journalistic style which avails itself to people with interest in Southeast Asian politics and political leaders. What remains to be seen and is the final chapter of the book is whether or not Thaksin’s sister Yingluck can capitalize and continue her brother’s legacy, eventually bringing him home and extending the new boundaries of nascent democracy in Thailand without antagonizing conservative forces too much.
----
SCHOLARS WORLD-INTERNATIONAL REFEREED MULTIDISCIPLINARY JOURNAL OF CONTEMPORARY RESEARCH EISSN 2320-3145, ISSN 2319-5789
www.scholarsworld.net [email protected] Volume.1, Issue.2, July 2013 [156]
ICT- A CATALYST OF TEACHING – LEARNING PROCESS
PROF. SHASHI GUPTA,
Program Head-MBA-FM
BSE Institute Limited-(India)
DR. SNEHA AMRE,
Sr. Assistant Professor
Revera school of Management (India)
ABSTRACT
With an ever-increasing young population, there is a huge requirement of higher education in India.
However, even today, the education is being imparted mostly through the conventional ways. The
conventional system of education is tedious, manpower intensive and slow. The information content
is mostly localized and access to global knowledge resources is meager. It is not conducive to deal
with the extremely fast pace of development in information systems and is unable to handle large
volumes of education seekers. Consequently, the youth educated from Indian educational institutes
are lacking the holistic development of mind. On global level, their knowledge, interaction and
personal skills are found lacking and thus, they are not able to compete with their overseas
counterparts. Thus, it is highly imperative to enhance the standard of education, particularly in the
rural areas. To enhance the quality of education, especially at the tertiary level, it shall be
beneficiary to tap the rapid advances in Information and Communication Technology.
To obviate the limitations of the conventional mode of teaching, it is proposed to use the latest
ICT tools viz. Cloud Computing in conjunction with the Wireless Local Area Network (WLAN),
Video Conferencing etc. The knowledge content of the libraries is stored in dedicated servers in
the form of e-books / e- journals. The entire university campus, including classrooms, hostels,
libraries, gardens etc. is covered with WiFi Hotspots and shall be a part of the WLAN. The
various servers shall allow access to their contents and also monitor the knowledge flow. This
shall enable the students to be connected to the educational resources at all of the times and at all
of the places. Lectures of eminent personalities / experts in various subjects shall be arranged
over interactive video conferencing, thus allowing a large audience to benefit from their expertise
and simultaneously saving time, money and efforts. Application of ICT shall certainly enrich the
educational content.
Keywords: ICT, WLAN, EDUCATION, CLOUD COMPUTING, CATALYST
SCHOLARS WORLD-INTERNATIONAL REFEREED MULTIDISCIPLINARY JOURNAL OF CONTEMPORARY RESEARCH EISSN 2320-3145, ISSN 2319-5789
www.scholarsworld.net [email protected] Volume.1, Issue.2, July 2013 [157]
INTRODUCTION:
Higher education is an extremely fast growing industry and it is exposed to the globalization everyday more and
more. Service quality, emphasizing student’s satisfaction is newly emerging field of concern. In order to attract
students, serve their needs and retain them, higher education providers are actively involved in the process of
understanding student’s expectations and their perceptions of service quality. Institutions in higher education try
to provide best quality services because they need to compete for their students. And in order to gain
competitive advantage they are trying to incorporate advanced technological teaching tool in their service.
The overall scenario of higher education in India does not match with the global quality standards. Today, there
is strong feeling that the education imparted at college and university level does not match the needs and
expectations of the employment sector. Hence there is enough justification for an increased assessment of the
quality of the country’s educational institutions. Traditionally these situation assumed that quality could be
determined by their internal resources i.e. faculty with an impressive set of degrees and experience detailed at
the end of the institute’s admission brochure, number of books and journals in the library, an extra modern
campus and the size of endowment etc. (Tiwari, 2008) students are direct receivers and participators for the
higher education service, and their study activities would influence their perception and satisfactions to the
educational quality. The perception to the quality of higher education is students’ judgment to educational
services offered by the college. Hill et al (2003) believed that the two factors that influenced student’s
perceptions towards the quality of higher education were the quality of teacher’s and quality of student’s
support system including schoolmate, family, college service and most importantly teaching environment.
In the present study, the researchers have attempted to know various tools/methods of teaching with the help of
technology. Using technology to enhance classroom teaching may allow facilitator to conduct novel activities
that would be impossible without it. Effective use of technology can motivate students, make classes more
dynamic and interesting and renew facilitator’s enthusiasm as they learn new skills and techniques. Computer,
video, audio and other technique can all bring outside world into our classroom making them more realistic and
helping students to understand any abstract concept clearly. Audio is probably the easiest technology to
introduce music, listening exercises, includes accent training voice modulation and bring other native speakers
into the classroom. The researchers through this study have tried to present the clear picture of higher education
through which certain reformative action can be taken for its quality improvement.
ICT- A CATALYST OF TEACHING – LEARNING PROCESS:
The right to education is recognized as a fundamental for each citizen, yet access to it is not guaranteed. The
pivotal role of education as an instrument of social change, by altering the human perspective and transforming
the traditional mindset of society, is well recognized. Since independence, India has seen substantial increase in
the number of education institutes at primary, secondary and higher levels as well as the student’s enrolment.
But this rate of increase does not match the rate at which new technologies are being incorporated in education
system. As Indian education system is known for its special type of education practice since Gurukulam period
where activities based learning were given top priority in teaching and learning process. When formal education
system came into force where the text books laid a platform for traditional classroom process in which
instructions more mostly encyclopedic, memory oriented, recitative methods are concerned with accumulation
and reproduction of vast store of unrelated and isolated facts where memory was focal point. Today it is been
proved that concrete experiences should form the basis of meaningful learning.
Many new technologies are available not just for teachers but also for students to learn, adapt, and employ in
their classrooms as well as in distance learning. Technique such as resource based learning and project based
learning all encourage individual as well as group learning, critical thinking, the application and investigation of
issues relevant to student’s lives and the opportunity for students to develop independent learning skills.
Achieving these objectives, as well as the acquisition of basic body of knowledge, enable these students to
become skilled lifelong learners. The chances that student will remember, learn and use material are increased if
they work with it and integrate it with information from other sources and their own prior learning. Therefore it
is vital that teachers learn these innovative techniques and incorporate them in to their teaching in the
classroom. The main goal of resource based learning is to provide opportunity for all students to develop
independent learning skills which will enable them to become lifelong learner.
SCHOLARS WORLD-INTERNATIONAL REFEREED MULTIDISCIPLINARY JOURNAL OF CONTEMPORARY RESEARCH EISSN 2320-3145, ISSN 2319-5789
www.scholarsworld.net [email protected] Volume.1, Issue.2, July 2013 [158]
There are different ways by which one can achieve Resource based learning. It can be achieved if students
actively participate in their own learning, if wide varieties of resources are used, if teachers employ many
instructional techniques and starts being facilitator of learning-continuously guiding, monitoring and evaluating
students’ progress. By incorporating the above listed items, the resource based learning develops the skills that
require application and synthesis of information by encouraging the students to engage in questioning and
critically thinking about the topic. On the other hand, Project based learning is based on self directed learning
that is usually conducted by small group of students. Projects play important role in learning because in addition
to achieving objectives mentioned earlier, they also promote the engagement of complex processes of inquiry
and design. A project can have many benefits over other forms of classroom activities because they typically
involve more complex cognitive processing. The engagement by the student in critical thinking and inquiry
typically will enable the student to develop his / her skills in this area, eventually enabling the student to
become a better learner in all areas of education and life.
Another way of teaching is Web Based Instructions (WBI). It is defined broadly as any form of innovative
approach for delivering instruction to remote audience in which the web is included as tool (Relan & Gillani,
1997). Presently several websites have been developed to provide learner with access to instructional resources
from distance. However, Hill (1996) noted that, most course-based learning or learning site simply post course
materials. In such instances use of web falls far short of the potential this medium afford.
The opportunities associated with the development of computer based technology in contributing to effective
science education have grown exponentially within past decade. The multi-media software available on CD-
ROM plays powerful role with applications in labs, lectures, tutorial and project work. Virtual Laboratories is
another innovative technique in which it details the preparation, essential equipments, and method relevant to
the practical and students then actively perform experiments themselves with simulated responses. Virtual
laboratory presents a range of equipments on screen and may offer very high degree of interactivity. Training
through audio visuals aids can play important role in medical education. With tremendous change in technology
one more tool which is incorporated in teaching is teleconferencing. It is new mixed model approach for
Distance Education combining satellite teleconferencing with hands in activity session. It was developed to
adjust for many of the disadvantages associated with distance education. The mixed model used live
teleconferences speakers, video clips, and interactive call in sessions and local sessions.
Simulation technique has recently got hype in teaching. It is an imitation of some real thing, state of affairs, or
process. Simulation is used in many contexts, including the modeling of natural system or human systems in
order to gain insight into their functioning. Key issues in simulation include acquisition of valid source
information about the relevant selection of key characteristics and behaviors. Simulation technique in the field
of education focuses on specific task. It enables the students to be well prepared for better professional
environment. The simulation is more than a “living” textbook and it becomes an integral part of the learning
environment. Hence simulation is rightly termed as web based classroom of the future.
In this way, Information and Communication Technology have been impacting every aspect of higher education
what is learned (competency and performance based curriculum, information literacy etc.) when and where
learning will take place and how the learning will occur (student centric learning, supporting knowledge
construction). ICT has become integral part of today’s teaching – learning process. Countries across the world
are using ICT in facilitating information dissemination and communication in all areas of education and
training. There are now educational and training institutions imparting skills in the basic and advanced concepts
of ICT. Besides, ICT is being used in facilitating distance learning. It is enabling online designing of courses,
online delivery of courses, computer aided teaching, online assessment, besides this management and
networking of large number of educational institutions. ICT based systems, CD based courses, online courses
and digital libraries, discussion forums, teleconference, etc. has made e-learning g a reality today.
In the past, the conventional process of teaching has revolved around teachers planning and leading students
through a series of instructional sequences to achieve a desired learning outcome. Typically these forms of
teaching have revolved around the planned transmission of a body of knowledge followed by some forms of
interaction with the content as a means to consolidate the knowledge acquisition. Contemporary learning
theory is based on the notion that the concept of flexibility in the delivery place of educational programs is not
SCHOLARS WORLD-INTERNATIONAL REFEREED MULTIDISCIPLINARY JOURNAL OF CONTEMPORARY RESEARCH EISSN 2320-3145, ISSN 2319-5789
www.scholarsworld.net [email protected] Volume.1, Issue.2, July 2013 [159]
new (eg. Moore & Kearsley, 1996). Educational institutions have been offering programs at a distance for
many years and there has been a vast amount of research and development associated with establishing
effective practices and procedures in off-campus teaching and learning. Use of the technology, however, has
extended the scope of this activity and whereas previously off-campus delivery was an option for students who
were unable to attend campuses, today, and many more students are able to make this choice through
technology-facilitated learning settings. Learning is an active process of constructing knowledge rather than
acquiring knowledge and that instruction is the process by which this knowledge construction is supported
rather than a process of knowledge transmission (Duffy & Cunningham, 1996). A number of other issues have
emerged from the uptake of technology whose impacts have yet to be fully explored. These include changes to
the makeup of the teacher pool, changes to the profile of who are the learners in our courses and paramount in
all of this, changes in the costing and economics of course delivery expanding the pool of teachers.
In the past, the role of teacher in an educational institution was a role given to only highly qualified people.
With technology-facilitated learning, there are now opportunities to extend the teaching pool beyond this
specialist set to include many more people. The changing role of the teacher has seen increased opportunities
for others to participate in the process including workplace trainers, mentors, specialists from the workplace and
others. Through the affordances and capabilities of technology, today we have a much expanded pool of
teachers with varying roles able to provide support for learners in a variety of flexible settings. This trend
seems set to continue and to grow with new ICT developments and applications. And within this changed pool
of teachers will come changed responsibilities and skill sets for future teaching involving high levels of ICT and
the need for more facilitative than didactic teaching roles (eg. Littlejohn et al., 2002).
Expanding the pool of students in the past, education has been a privilege and an opportunity that often was
unavailable to many students whose situation did not fit the mainstream. Through the flexibilities provided by
technology, many students who previously were unable to participate in educational activities are now finding
opportunities to do so. The pool of students is changing and will continue to change as more and more people
who have a need for education and training are able to take advantage of the increased opportunities.
Interesting opportunities are now being observed among, for example, school students studying university
courses to overcome limitations in their school programs and workers undertaking courses from their desktops.
THE COST OF EDUCATION:
Traditional thinking has always been that technology-facilitated learning would provide Economies and efficiencies
that would see significant reductions in the costs associated with the delivery of educational programs. The costs
would come from the ability to create courses with fixed establishment costs, for example technology-based courses,
and for which there would be savings in delivery through large scale uptake. We have already seen a number of
virtual universities built around technology delivery alone (eg. Jones International University, www.jiu.edu). The
reality is that few institutions have been able to realize these aims for economy. There appear to have been many
underestimated costs in such areas as course development and course delivery.
The costs associated with the development of high quality technology-facilitated learning materials are quite high.
RECOMMENDATIONS:
It is recommended that blended learning will perhaps be a more significant growth area than fully online learning.
Follow-up studies might focus on aspects of blended learning that institutions need to address, such as types of blended
learning, activities that lead to blended-learning success, and instructor training for blended-learning situations.
Currently the requirements are experiments/practices/plans in which ICTs are understood, engaged in, and developed
in local contexts. It needs to be a development approach based on anticipatory action learning, where the users frame
their needs, and where future needs are explored. Thus it will be a framework of communication between different
parties, users, the private sector, business, government, and large telecommunication corporations.
It is Recommended that ICT be linked to local problems, specifically to poverty alleviation, showcasing the
benefits of using ICTs for economic growth.
SCHOLARS WORLD-INTERNATIONAL REFEREED MULTIDISCIPLINARY JOURNAL OF CONTEMPORARY RESEARCH EISSN 2320-3145, ISSN 2319-5789
www.scholarsworld.net [email protected] Volume.1, Issue.2, July 2013 [160]
Applied with intelligence, diligence, research and commitment, ICTs provide powerful means of improving the
quality of education along with significantly improved data for diagnosis and formative evaluation. This
potential will be realized if educators in all sectors take up the challenge and hard work of adaptation and
change required if we are to develop both ICTs in education and the profession in its use of them. If the ICT
strategy is integrated into the overall’s strategy ICT has the greatest potential to act as a catalyst for change.
Furthermore schools should capitalize on positive attitudes and support teachers to underpin ICT use with a
pedagogical approach. This can be achieved by hand on practical training, providing easy to use ICT based
materials, peer learning, securing a reliable infrastructure and easy access to research findings.
ICTs can transform education, making it far more interactive and empowering for students and
professors/teachers.
SUMMARY AND CONCLUSIONS:
This paper has sought to explore the role of ICT in higher education as we progress into the 21st century. ICTs
have impacted on educational practice in education to date in quite small ways but that the impact will grow
considerably in years to come and that ICT will become a strong agent for change among many educational
practices. Extrapolating current activities and practices, the continued use and development of ICTs within
education will have a strong impact on:
• What is learned?
• How it is learned?
• When and where learning takes place?
• Who is learning and who is teaching?
Learning should become more relevant to stakeholders’ needs; learning outcomes should become more
deliberate and targeted. To ensure that the opportunities and advantages are realized, it will be important in
every other walk of life to ensure that the educational research and development is sustained so that education at
large can learn from within and that experiences and activities in different institutions and sectors can inform
and guide others without the continual need for re-invention of the wheel. Lastly ICTs serve to provide the
means to realize the potential it holds.
REFERENCES:
1. Avison, D. (1997). The Discipline Of Information System: Teaching, Research And Practice,
(eds.)6.McGraw- Hill Publication, pp. 113
2. Barron, A. (1998). Designing Web-based training. British Journal of Educational Technology,
29(4), 355-
3. Berge, Z. (1998). Guiding principles in Web-based instructional design. Education Media
International, 35(2), 72-
4. Collis, B. (2002). Information technologies for education and training. In Adelsberger, H.,
Collis, B, & Pawlowski,
5. J. (Eds.) Handbook on Technologies for Information and Training. Berlin: Springer Verlag.
6. Duffy, T., & Cunningham, D. (1996). Constructivism: Implications for the design and delivery
of instruction, Handbook of research for educational telecommunications and technology (pp.
170-198). New York: MacMillan.
7. Freeman, M. (1997). Flexibility in access, interactions and assessment: The case for web-based
teaching programs. Australian Journal of Educational Technology, 13(1), 23-39.
8. Jonassen, D. & Reeves, T. (1996). Learning with technology: Using computers as cognitive
tools. In D. Jonassen (Ed.), Handbook of Research Educational on Educational Communications
and Technology (pp 693-719). New York: Macmillan.
9. Kennedy, D. & McNaught, C.(1997). Design elements for interactive multimedia. Australian
Journal of Educational Technology, 13(1), 1-22.

SCHOLARS WORLD-INTERNATIONAL REFEREED MULTIDISCIPLINARY JOURNAL OF CONTEMPORARY RESEARCH EISSN 2320-3145, ISSN 2319-5789
www.scholarsworld.net [email protected] Volume.1, Issue.2, July 2013 [161]
10. Laffey J., Tupper, T. & Musser, D. (1998) A computer-mediated support system for project-
based learning. Educational Technology Research and Development, 46(1), 73-86.
11. Lebow, D. (1993). Constructivist values for instructional systems design: Five principles toward
a new mindset. Educational Technology, Research and Development, 41(3), 4-16.
12. Littlejohn, A., Suckling, C., Campbell, L. & McNicol, D. (2002). The amazingly patient tutor:
students’ interactions with an online carbohydrate chemistry course. British Journal of
Educational Technology, 33(3), 313-321.
13. McCausland, H.,Wache, D. & Berk, M. (1999). Computer literacy; its implications and
outcomes. A case study from the Flexible Learning Centre. University of South Australia.
Moore, M. & Kearsley, G. (1996). Distance Education: A Systems View. Belmont, CA:
Wadsworth.
14. Oliver, R. & Short, G. (1996). The Western Australian Telecentres Network: A model for
enhancing access to education and training in rural areas. International Journal of Educational
Telecommunications, 2(4), 311-328.
15. Oliver, R. (2000). Creating Meaningful Contexts for Learning in Web-based Settings.
Proceedings of Open Learning 2000. (pp 53-62). Brisbane: Learning Network, Queensland.
----
Top Related
Copyright © 2022 FDOKUMEN

