


Bahasa
Halaman
Hukum

Alanya Akademik Bakış Alanya Academic Review
Yıl:2018, C:2, S:3, s. 213-224 Year:2018, Vol:2, No:3, s.213-224
Economic Assessment of Dual Purpose Type of Cattle
Farming in Minahasa Regency – Indonesia (Research Article)
Doi: 10.29023/alanyaakademik.424012
Erwin WANTASEN
PhD, Sam Ratulangi University, Faculty of Animal Science, Department of Socio Econiomic,
Manado, 95115- Indonesia
([email protected]) Phone:+62-085256199586
Orcid ID: https://orcid.org/0000-0001-6225-1284
Umar PAPUTUNGAN
Professor, Sam Ratulangi University, Faculty of Animal Science, Department of Aninmal
Production, Manado, 95115- Indonesia
Orcid ID: https://orcid.org/0000-0003-4903-6357
How to cite this article: Wantasen, E., & Paputungan, U. (2018). Economic Assessment of Dual
Purpose Type of Cattle Farming in Minahasa Regency – Indonesia. Alanya Academic Review, 2(3),
213-224.
ABSTRACT
The aim of this study was to analyze dual purpose type of cattle farm
households’ economy in Langowan District Minahasa Regency, Indonesia.
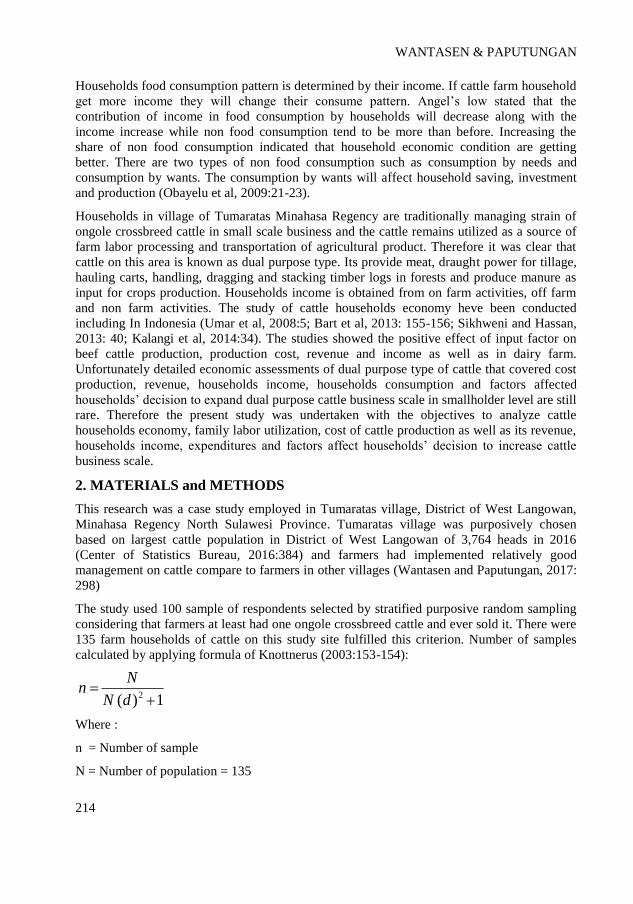
Data relies on sample survey of 100 farm households in Tumarats Village
during 2017. Descriptive and quantitative analysis using a probit model was
employed. Result of this study showed that Family labor absorbed by cattle
farms on the first, second and third scales were 44.34, 27.46 and 16.82 man
days/AU/year respectively. The contribution of cattle income on the first,
second and third scales were 52.84%, 66.31% and 70.19% respectively.
Value added of cattle, selling price, family labor, cattle labor and cultivated
land area had significantly positive effect on households’ decision to
increase cattle scale of business.
1. INTRODUCTION
Three elements that always interact in household activity are production, income and
consumption. Process of production, consumption, income and labor utilization on beef cattle
farmers is influenced by government regulation. Cattle farmers have to work hard in order to
increase their income and production.
Input price and labor wage will affect household’s income and then influence household’s
consumption (Udoet al, 2011:25; Hartono, 2006:226; Wantasen et al. 2012:142; Dalie et al,
2015:93) Hence, process of production will affect households decision in consumption
through household’s income and expenditures. The increasing of farmers income will
improve farmers welfare in the villages area. Farmers begin consume much more food
especially high quality food such as grain, eggs, milk, fruits. Surplus of beef cattle production
will increase farmer’s standard of living (Anis et al, 2015:39)
Keywords:
Food expenditure
Household decision
Income
Scale of business
Nonfood expenditure
Received: 16.05.2018
Revision: 15.06.2018
Accepted: 22.06.2018
WANTASEN & PAPUTUNGAN
214
1)( 2
dN
Nn
Households food consumption pattern is determined by their income. If cattle farm household
get more income they will change their consume pattern. Angel’s low stated that the
contribution of income in food consumption by households will decrease along with the
income increase while non food consumption tend to be more than before. Increasing the
share of non food consumption indicated that household economic condition are getting
better. There are two types of non food consumption such as consumption by needs and
consumption by wants. The consumption by wants will affect household saving, investment
and production (Obayelu et al, 2009:21-23).
Households in village of Tumaratas Minahasa Regency are traditionally managing strain of
ongole crossbreed cattle in small scale business and the cattle remains utilized as a source of
farm labor processing and transportation of agricultural product. Therefore it was clear that
cattle on this area is known as dual purpose type. Its provide meat, draught power for tillage,
hauling carts, handling, dragging and stacking timber logs in forests and produce manure as
input for crops production. Households income is obtained from on farm activities, off farm
and non farm activities. The study of cattle households economy heve been conducted
including In Indonesia (Umar et al, 2008:5; Bart et al, 2013: 155-156; Sikhweni and Hassan,
2013: 40; Kalangi et al, 2014:34). The studies showed the positive effect of input factor on
beef cattle production, production cost, revenue and income as well as in dairy farm.
Unfortunately detailed economic assessments of dual purpose type of cattle that covered cost
production, revenue, households income, households consumption and factors affected
households’ decision to expand dual purpose cattle business scale in smallholder level are still
rare. Therefore the present study was undertaken with the objectives to analyze cattle
households economy, family labor utilization, cost of cattle production as well as its revenue,
households income, expenditures and factors affect households’ decision to increase cattle
business scale.
2. MATERIALS and METHODS
This research was a case study employed in Tumaratas village, District of West Langowan,
Minahasa Regency North Sulawesi Province. Tumaratas village was purposively chosen
based on largest cattle population in District of West Langowan of 3,764 heads in 2016
(Center of Statistics Bureau, 2016:384) and farmers had implemented relatively good
management on cattle compare to farmers in other villages (Wantasen and Paputungan, 2017:
298)
The study used 100 sample of respondents selected by stratified purposive random sampling
considering that farmers at least had one ongole crossbreed cattle and ever sold it. There were
135 farm households of cattle on this study site fulfilled this criterion. Number of samples
calculated by applying formula of Knottnerus (2003:153-154):
Where :
n = Number of sample
N = Number of population = 135
ALANYA AKADEMİK BAKIŞ/ALANYA ACADEMIC REVIEW 2/3 (2018)
215
d = Sample error (critical value 5% = 0.05)
where: N (d)2 + 1 = 135(0.05)2 + 1 = 1.34
n = 135/1.34 = 100.74
Data were analyzed by using descriptive and quantitative methods. Descriptive analysis
described the source of households income, income from cattle business, number of cattle
ownership, households expenditure or households consumption. In order to fit with the real
condition in study site, selected sample are grouped into three scales of cattle ownership
consist of ≤ 5 Animal Unit (AU) , 50 respondents, 5-10 AU, 30 respondents and >10 AU, 20
respondents. Survey method is used for data collection through interviews to farmers using
questionnaires in 2017. Data collection consisted of cattle size, cultivated land area, family
labor, farmers’ education, age, value added of cattle, cattle price, cost of forage, production
cost, households income and households expenditure. Quantitative analysis was used to
determine the economic incentive or income and to determine factors influencing farmers’
decision to improve cattle business scale. Income was computed by subtracting revenue
obtained to cost of production spent by farmers. The formula is given as follow (Amir and
Natnipscheer, 1989: 79) :
П = TR – TC
Where:
П = Income/ economic incentive (IDR/year/farmer)
TR = Total revenue (IDR/year/farmer)
TC = Total Cost (IDR/year/farmer)
Pyndick and Rubenfeld (1991: 229) stated, probit model is a type of regression where the
dependent variable can take only two values. The purpose of the model is to estimate the
probability that an observation with particular characteristics will fall into a specific one of
the categories; moreover, classifying observations based on their predicted probabilities is a
type of binary classification model. Suppose a response variable Y is binary, that is it can
have only two possible outcomes which we will denote as 1 and 0. For example, Y may
represent presence/absence of a certain condition, success/failure of some device, answer
yes/no on a survey, etc. We also have a vector of regressors X, which are assumed to
influence the outcome Y, and ϵi is random variables that assumes is normal. Specifically, we
assume that the model takes the form
Pr (Yi=1) = Pr (ϵi ≥ - βXi ) = 1- Φ (- βXi ) = Φ (βXi) ……………………………(1)
Since Pr (Yi = 0) = 1 - Pr (Yi =1)……………………………………………………... (2)
can also say
Pr (Yi = 0) = Φ (-βXi)…………………………………………………………… (3)
where Pr denotes probability, and Φ is the Cumulative Distribution Function (CDF) of the
standard normal distribution. The parameters β are typically estimated by maximum
likelihood.

WANTASEN & PAPUTUNGAN
216
A probit model was used to determine factor affecting the farmers’ decision to increase cattle
scale of business. A procedure to measure breeders’ decision was to apply both binary and
non binary variables for quantify factors mostly affecting positive or negative of farmers’
decision to rise cattle production. A probit procedure that specifies the binary dependent as a
function of the number of quantitative explanatory variables was used for the ability of
generating bounded probability estimates. For individual farmer (Borooah, 2002: 57). The
formula used to estimate factors influencing farmers’ decision to increase cattle business
scale in the model of Gujarati (2001:387) showed as follows:
Yi = α + β Xi + ei ……………………………………………………………………….(4)
Where X i represent vectors of explanatory variables of the ith farmer, Yi is a binary variables
such as Yi =1 if the i th farmer wants to increase production of cattle and Yi = 0 if otherwise.
Xi is assumed to be stochastic and independent of the zero mean random variable ei. Yi can
be assumed to two different values, i 0 and 1. So the expected probability could be obtained:
E (Yi) = 1 X f i (1) + 0 X fi (0) = fi (1)…………………………………………………. (5)
Where, f i (1) is probability of expanding operation for a farmer with a set of resources and
economic characteristic (Xi). From (4) and (5)
E (Yi) = α +β X i ………………………………………………………………………...(6)
meaning that the probability of f i (1) would be different for farmers with different levels of
resources and economic characteristics. Hence, the expected probability E (Yi) which could
be interpreted as the proportion of all farmers with resources and economic characteristics
(Xi) mostly increasing production scale would be:
0 ≤ α + β Xi ≤ 1 ………………………………………………………………………….(7)
General probit model for ith farmer is shown as follows (Borooah, 2002:254)
FD = F ( VAC, PRICE, HS, FLAB, CLAB, EDU, LAND, AGE, CFOR)
The dependent variable was hypothetical index of farmers’ decision to increase cattle
production. The maximum likelihood technique was used to estimate the coefficient of cattle
business scale (Gujarati, 2001:177)
The independent variables in the model with expected signs are presented in Table 1:

ALANYA AKADEMİK BAKIŞ/ALANYA ACADEMIC REVIEW 2/3 (2018)
217
Table 1. Explanatory Variables
Explanatory Variables Explanation Expected Sign
VAC Value added of cattle +
PRICE Selling Price of cattle +
HERD SIZE Actual number of cattle -
FLAB Family Labors working on cattle
business
+
CLAB Cattle labor +
EDU Dummy variable whether or not
farmers has a high school
education or above (1= yes, 0=
otherwise)
-
LAND Cultivated land area +
AGE Actual age of farmer -
CFOR Cost of forage is measured by
money value of time that spent
by household to fed cattle
-
Stastitical likelihood ratio (LR) was used as F test on the OLS method to test null hypothesis
that all the explanatory variables simultaneously affect the dependent variable. In order to
know the goodness of regression line we use coefficient of determination developed by
McFadden (R2McF) where the value is ranging 0 and 1. Completion analysis was conducted
by using computer with Eviews software version 8.
3. RESULTS and DISCUSSIONS
3.1. Cattles Ownership
Most of people in Tumaratas Village worked in agricultural sector include of rearing cattle.
This site is known as center of cattles’ production and development in Minahasa Regency.
Average rain fall is 2,500-3,000 mm per year, temperature ranging is 24oC – 28oC while
moisture is 91%. Such climatic condition makes West Langowan district potensial for crops
and livestock development. Farmers cultivated their land with various crops such as cabbage,
tomato, chili, onion, carrot, maize, ground nut, red bean and patato. Farmers raised ongole
breed of cattle since this type of cattle was very useful particularly to provide meat and
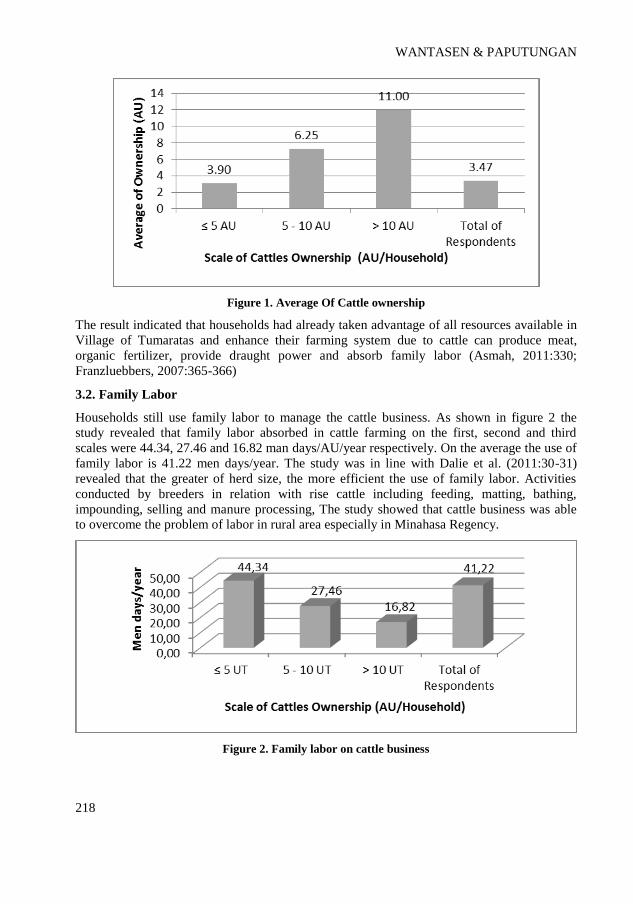
cultivate their land. The average of herd size per household was 3.47 heads. Based on the
result of this study that is presented in Figure 1 showed that number of cattle owned by
households on the first, second and third scales were 3.90, 6.25 and 11.00 Animal unit (AU)
respectively. The result was different with Jaleta and Gebremedhin (2012:204) stated that in
Ethiopian highland on average households own about 6.5 AU but in parallel with Umar et al.,
(2008:7) that inform average household owned around 2 to 4 heads of cattles.
WANTASEN & PAPUTUNGAN
218
Figure 1. Average Of Cattle ownership
The result indicated that households had already taken advantage of all resources available in
Village of Tumaratas and enhance their farming system due to cattle can produce meat,
organic fertilizer, provide draught power and absorb family labor (Asmah, 2011:330;
Franzluebbers, 2007:365-366)
3.2. Family Labor
Households still use family labor to manage the cattle business. As shown in figure 2 the
study revealed that family labor absorbed in cattle farming on the first, second and third
scales were 44.34, 27.46 and 16.82 man days/AU/year respectively. On the average the use of
family labor is 41.22 men days/year. The study was in line with Dalie et al. (2011:30-31)
revealed that the greater of herd size, the more efficient the use of family labor. Activities
conducted by breeders in relation with rise cattle including feeding, matting, bathing,
impounding, selling and manure processing, The study showed that cattle business was able
to overcome the problem of labor in rural area especially in Minahasa Regency.
Figure 2. Family labor on cattle business

ALANYA AKADEMİK BAKIŞ/ALANYA ACADEMIC REVIEW 2/3 (2018)
219
3.3. Households’ Income
Household’s income was obtained from on farm activities including raise cattle, plant
cabbage, tomato, chili, onion, carrot, maize, ground nut, red bean and patato, off farm activies
such as sell processed of agricultural products, and non farm activities such as non agriculture
worker, remitant and national civil servant. Income share for on farm, off farm and non farm
activities are presented in Table 2.
Table 2. Income Share for Each Activity of Household (IDR/Year/Household)
Income
sources ≤ 5 AU 5-10AU >10 AU Total Samples
Rearing
cattles
34,053,721
(52.84%)
102,745,856
(66.31%)
180,151,400
(70.19%)
39,636,226
(50.17%)
Crops 16,358,645
(25.38%)
24,628,681
(15.89%)
39,028,650
(15.21%)
17,081,548
(28.80%)
Off Farm 4,978,753
(7.72%)
3,883,333
(2.51%)
25,500,000
(9.93%)
5,118,240
(6.07%)
Non Farm 9,059,505
(14.06%)
23,691,667
(15.29%)
12,000.000
(4.68%)
9,966,840
(14.96%)
The contribution of income from cattle business was the largest one compared with other
sources of income in the household. It was indicated that catlle was still the main bisiness of
household especially on scale 2 (5-10 AU) and scale 3 (>10AU) for its contribution had
exceed 60%. The studi was consistent with Pohler et al (2011:383) who stated that cows are
viewed as primary income source of households’ farmers in USA. The share of income from
crops was relatively less for 15.21% to 25.38% . It can be seen in Table 2 that the increase of
herd size, the income share of crops tend to decrease because households give more attention
on their cattle business. Income from non farm activity seem to be lower by increasing of
herd size. It considered make sense since household look for other income sources to meet
their needs particularly when income from cattle business tend to decrease. Breeders earn
income from cattle farming through selling cattles, organic fertilizer, value added of cattles,
cattle labor, rent out of stud cattle. Cost of production included of cost of forage, cost of
health, cost of labor and cost of stable. Households’ income from cattle business is presented
in Table 3.
Table 3. Households’ Income on Cattle Business
Herds Size (AU) Average of cattle
ownership (AU)
Annual Revenue
(IDR/AU)
Annual cost of
Production
(IDR/AU)
Annual Income
(IDR/AU)
<5 AU 3.90 12,804,300 2,413,646 10,390,654
5-10 AU 6.25 14,726,325 1,654,847 13,071,478
>10 AU 11.00 15,195,833 1,103,117 14,092,716
Total of
Respondents 3,47 13.363.280 2.276.538 11.086.742
Table 3 explained that the more the cattle raised, the more the income obtained by household
from cattle business due to the higher scale of bisiness, household can sell more cattle and
manure as well as rent out of cattle labor to obtained more income. Some researcher showed
WANTASEN & PAPUTUNGAN
220
that extensive, semi intensive and intensive farming included livestock was one of the
approach to increase the production, productivity and income of smallholder farming
(Stainfield and Mack, 2001:20; McLeod et al, 2007:112-113; Anis et al, 2015:39)
3.4. Households’ Expenditures
Households’ expenditures is a total amount of money spent by households to meet their needs
at the certain period of time. The greater the portion of income used on non food consumption
indicated the increase of household welfare. The pattern of household consumption
expenditures was devided into two parts namely expenditures on food consumption and
expenditures on non food consumption. Expenditures on food consumption included rice,
eggs, meat, fish, cooking oil etc. Non food consumption expenditures included education,
health, clothing, electricity, housing, water, soap, fuel, social and spiritual, recreation, feast,
savings etc.
The study indicated that in absolute terms the more animal are kept, the greater the
expenditure consumption but the percentage was getting smaller. (Table 4). This indicated
that the dual purpose type of cattle business had improved quality of life of household in
Minahasa Regency.
Table 4. Households’ Consumption Expenditures
Type of Consumption
Total Consumption Total Of
Respondent < 5 AU 5-10 AU > 10 UT
Food Consumption (IDR/Year) 13,121,314
(55.83%)
15,993,333
(54.26%)
19,068,000
(45.62%)
13,409,672
(55.77%)
Non Food Consumption
(IDR/Year)
10,380,629
(44.17%)
13,480,167
(45.74%)
22,725,000
(54.37%)
10,633,475
(44.23%)
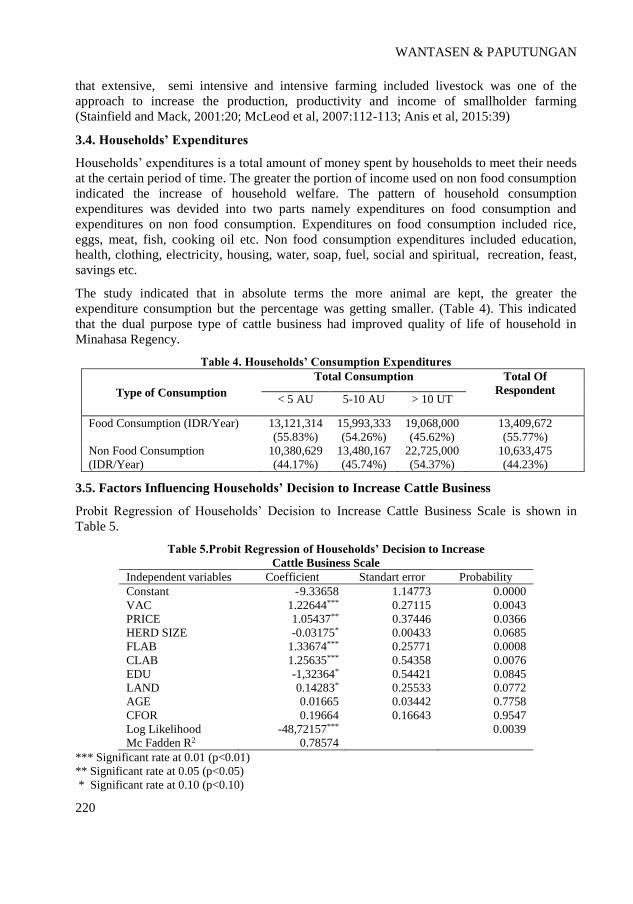
3.5. Factors Influencing Households’ Decision to Increase Cattle Business
Probit Regression of Households’ Decision to Increase Cattle Business Scale is shown in
Table 5.
Table 5.Probit Regression of Households’ Decision to Increase
Cattle Business Scale
Independent variables Coefficient Standart error Probability
Constant - 9.33658 1.14773 0.0000
VAC 1.22644*** 0.27115 0.0043
PRICE 1.05437** 0.37446 0.0366
HERD SIZE -0.03175* 0.00433 0.0685
FLAB 1.33674*** 0.25771 0.0008
CLAB 1.25635*** 0.54358 0.0076
EDU -1,32364* 0.54421 0.0845
LAND 0.14283* 0.25533 0.0772
AGE 0.01665 0.03442 0.7758
CFOR 0.19664 0.16643 0.9547
Log Likelihood -48,72157*** 0.0039
Mc Fadden R2 0.78574
*** Significant rate at 0.01 (p<0.01)
** Significant rate at 0.05 (p<0.05)
* Significant rate at 0.10 (p<0.10)
ALANYA AKADEMİK BAKIŞ/ALANYA ACADEMIC REVIEW 2/3 (2018)
221
Table 5 showed that Value added of cattle, selling price, family labor, cattle labor and
cultivated land area had a significant and positive effect on households’ decision to increase
cattle business scale. Level of education and herd size had a significant and negative impact
on breeders’ decision to increase cattle business scale while age and cost of forage were not
affect farmers’ decision. It implies that the factors of family labor, cattle labor and value
added of cattle were mostly improve possibility of increasing productivity and provide better
opportunity for increase income in the future. Altogether the dependent variables have effect
to households’ decision as much as 78.57% ( R2McF = 0.7857). The value of log likelihood
was 48.72 (p<0.01) meaning that all independent variables in the model effected the
dependent variables simultaneously. Value added of cattle was closely related to household
decision to increase cattle production (p< 0.01) because cattle can produce feces that could be
made as organic fertilizer. Farm households had been able to process cow dung into organic
fertilizer. They had several times received guidance from agricultural extension at the study
site. Organic fertilizer was used by farmers on their crops. Moreover farmers could rent out
cattle labor as well as cattle as stud. The organic fertilizer was very useful for crops and
forage planted by farmers besides minimizes the use of agrochemicals, reduces environmental
impact, improve soil structure and fertility. If farmers have larger value added from cattle
they will increase the number of cattle due to the income they will have. The result was
different with previews study since they didn’t measure value added of cattle impact on
income and households’ decision to increase cattle business scale (Raharjo and Suroyo,
2013:143 Wantasen et al, 2013: 152). Family labor had a significant influence (p< 0.01) on
households’ decision to increase cattle business scale. Variety of tasks in rearing cattle such
as feeding cattle, looking for forage, bathing and breeding need family labor to perform it.
Therefore family with large members was useful for rearing cattle particularly to looking for
forage as the main input. Availability of family labor was very important to guarantee the
sufficient number of forage. Hence, household could increase business scale if the forage
available in large number.
Cattle labor had a significant effect on households’ decision (p<0.01) because there were
many of cultivated lands needed cattle labor. Cattle can serve both as a source of power for
ploughing farm land and as a means of transportation. Tractor usage was still considered
more expensive than labor of cattle. Many farmers in village of Tumaratas rent out their cattle
to get money income. Therefore the more cattle they rent out, the more income they earned.
The implication was that household would improve the cattle scale if they earned more
money.
Price of cattle had a significant influence on households’ decision (p< 0.05) to increase the
scale of cattle business. The selling price of cattle in the study area depends on the physical
condition of livestock, sex and age. Farmers prefered to maintain cattle from ongole
crossbreed type and had good characteristics included productive working on farm land, has
clean- white colour, healthy body, have a high hump. All characteristics mentioned was
considered as factors that had contributed on economic incentive of cattle price. Therefore
household was interested in increasing their scale of cattle business.
Herd size had negative response (p<0.10) on households’ decision to increase cattle scale.
Farmers with smaller herd size will tend to increase the scale of cattle business due to their
capacity and feed availability. If farmers have larger business scale of cattle they were not

WANTASEN & PAPUTUNGAN
222
interested in improving the scale of business because they need more forages to meet
livestocks requirement.
Education had negative influenced (p<0.10) on households’ decision to increase scale of
cattle business. It showed that farmers with higher level of education tend to work outside of
agricultural sector with more income and relatively high of social status. The result was in
line with Asmah (2011:332) claimed the lower level of educated farmers had use less
technology innovation on their business of cattle.
Although effort to increase scale of cattle need substantially large of cash input to purchase
more cattle, forage and adequate infrastructures however the annually income of farmers from
cattle business was average IDR 11,086,742 whereas the annually cost production was
average IDR 2,276,538 indicating that household had economic incentive to increase their
cattle scale of business. The result was consistent with Kalangi et al. (2007:32) and Bart et
al.(2013:159) who claimed that income had significant influence on farmers’ decision to
increase the cattle business scale.
4. CONCLUSION
The study indicated that the cattle business on Tumaratas Village, Minahasa Regency was the
main business of household due to absorbed family labor, increase both family income and
non food consumption. Value added of cattle, family labor, cattle labor, selling price of cattle
had positive impact on farmers’ decision to increase cattle business scale. In contrary, level of
education and herd size had negative effect on households’decision, while age of farmer and
cost of forage had not indicated significant effect.
The study showed that cattle farming could improve farmers’ income in Minahasa Regency.
Nevertheless farmers still face problems to develop herd size such as forages availability and
technology of cattle reproduction. Therefore the local government District of Minahasa
should introduce the kind of quality forages and intensify the implementation of insemination
technology and natural mating system by using superior bull cattle. Local government need to
train cattle farmers to inseminate and facilitate them with equipment due to limited number of
inseminator in the region. So that farmers will not rely on the inseminator officer to increase
their owned cattle number.
REFERENCES
AMIR, P. and NATNIPSCHEER. H.C.K (1989). Conducting on Farm Animal Research,
Procedure and Economic Analysis. Singapore national printer Ltd. Singapore.
ANIS. S.D., WANTASEN, E., .DALIE, S.,KALIGIS, D. A. and PAPUTUNGAN, U.(2015).
Beef Cattle Feasibility Study of Household Farm in Bolmong Regency, North
Sulawesi Province of Indonesia”,International Journal of Agricultural Sciences and
Natural Resources., 2(2): 36-39
ASMAH, E.E. (2011). Rural Livelihood Diversification and Agricultural Household Welfare
in Ghana. Journal of Development and Agricultural Economics, 3(7): 325-334.
BART, K., MAYER, A.C., GOMEZ, C.A., MUNOZ, E., HESS, H.D. and HOLMANN, F.
(2013). Economic Evaluation of The Current and Alternative Dual-Purpose Cattle
ALANYA AKADEMİK BAKIŞ/ALANYA ACADEMIC REVIEW 2/3 (2018)
223
Systems for Smallholder Farms in The Central Peruvian Highlands”. Agricultural
Systems, 101(3): 152-161.
BOROOAH, V.K. (2002). Logit and Probit Ordered and Multinominal Models. Quantitative
Vol 138, Application in The Social Sciences. Sage Publishing International.
CENTER Of STATISTICS BUREAU. (2016). Minahasa In Figure. Center of Statistics
Bureau, North Sulawesi Province, Manado.
DALIE, S., WANTASEN, E., ANIS, S.D. and PANGEMANAN, S.P. (2015). Profit
Analysis Of Traditional Beef Cattle Farm in Minahasa Regency, Indonesia. 2015.
Online Journal of Animal and Feed Research, 5 (3): 90-94.
.EMILY, A. O., GIDEON, A. O. and STEVEN J. S. (2003).Cattle as Assets: Assessment of
Non-Market Benefit From Cattle in Smallholder Kenyan Crop-Livestock Systems”,
Proceedings of the 25th International Conference of Agricultural Economists (IAAE)
16 . 22 August 2003, ISBN Number: 0-958-46098-1 Durban, South Africa p. 328-334.
FRANZLUEBBERS, A.J. (2007). Integrated Crop–Livestock Systems in The South eastern
USA. Agronomy Journal, 99: 361–372.
GUJARATI, D. N. (2001). Basic Econometric, Fourth edition. McGraw Hill, New York.
HARTONO, B. 2006. Household Economic of Dairy Farmer: A Case Study in Village of
Pandesari, Dictrict of Pujon, Malang Regency. Animal Production, 8(3): 226-232.
JALETA, M. and GEBREMEDHIN, B. (2012). Interdependence of Smallholders’ Net
Market Positions in Mixed Crop-Livestock Systems of Ethiopian highlands.Journal of
Development and Agricultural Economics, 4(7): 199-209.
KNOTTNERUS, P. (2003). Sample Survey Theory: Some Pythagorean Perspectives.
Springer Science Business Media. New York.
KALANGI, L.S., SYAUKAT, Y., KUNTJORO, S.U. and PRIYANTI, A. (2014).The
Characteristics of Cattle Farmer Households and the Income of Cattle Farming
Businesses in East Java. Journal Of Agriulture and Veterinary Science, 7(12): 29-34.
MACLEOD, N.D., MCDONALD, C.K., LISSON, S.N. and RAHMAN, R.(2007). Modelling
for Scenario Analysis for Improved Smallholder Farming Systems in Indonesia. Paper
Presented in MODSIM International Congress on Modelling and Simulation
Modelling and Simulation Society of Australia and New Zealand, 109-114.
OBAYELU, A. E., OKORUWA, V. O. and ONI, O. A. (2009). Analysis of Rural and Urban
Households’ Food Consumption Differential in The North-Central, Nigeria: A micro-
Econometric Approach. Journal of Development and Agricultural Economics, 1(2):
18-26.
PINDYCK, R.S. and RUBINFELD, D.L. (1991). Econometric Model and Economic
Forecast. Mc Graw Hill Inc, New York.
POHLER, K.G., MALLORY, D.A., PATTERSON, D.J., SMITH, M.F., LAUDERDALE,
J.W., MARTINS, T., PERES, R.F.G., VILELA, E.R. and VASCONCELOS, J.L.M.
WANTASEN & PAPUTUNGAN
224
(2011). Reproductive Technology & Global Production Of Beef: Why Beef Producers
In The U.S. Need To Pay Attention Proceedings, Applied Reproductive Strategies in
Cattle August 31 – September 1, 2011; Joplin, MO:379-396.
RAHARJO, M. and SUROYO. (2013). Beef Cattle Integration on Dry-Land Farming in
Sragen Central- Java Indonesia: Improving of Economic and Environmental Carrying
Capacity Aspects. Animal Production, 15(2):135-143.
SIKHWENI, N.P. and HASSAN, R. (2013). Opportunities and Challenges Facing Small-
Scale Cattle Farmers Living Adjacent to Kruger National Park, Limpopo Province.
Journal of Emerging Trends in Economic and. Management Science, 5(1):38-43
STAINFELD, H.and MACK, S. (2001). Livestock Development Strategies.World Animal
Review., 88: 18-24.
UDO, H.M.J., AKLILU, H.A., PHONG, L.T., BOSMA, R.H., BUDISATRIA, I.G.S., PATIL,
B.R.,SAMDUP, T. and Bebe, B.O. (2011).Impact of Intensification of Different Types
of Livestock Production in Smallholder Crop-Livestock Systems. Livestock Science.,
139: 22-29.
UMAR, A.S.S., ALAMU, J.F. and ADENIJI, O.B.(2008). Economic Analysis of Small Scale
Fattening Enterprise in Bama Local Government Area OfBorno State Nigeria. Patnsuk
Journal, 4(1): 1-10.
WANTASEN, E., HARTONO, B., HANANI, N. and PANELEWEN. V.V.J. (2012).
Household Economic Behavior of Traditional Cattle Farmers in Utilizing Artificial
Insemination Technology: A Case Study in Village of Kanonang III, Minahasa
Regency of Indonesa. Journal of Agriculture and Food Technology, 2(8) :141-152.
WANTASEN, E., HARTONO, B. and HANANI, N. (2013). Income Upgrading Model Of
Cattleman In The Utilization Of Artificial Insemination: Case Studi In Village of
Kanonang III, Regency Of Minahasa. Animal Production, 15(2):144-152.
WANTASEN, E., PAPUTUNGAN, U. (2017). Faktor Faktor Yang Mempengaruhi Nilai
Tambah Usaha Ternak Sapi Di Desa Tumaratas Kecamatan Langowan Barat. Jurnal
Zootek, 37 (2) : 294-302.
Top Related
Copyright © 2022 FDOKUMEN

