


Bahasa
Halaman
Hukum

52
© 2018 AESS Publications. All Rights Reserved.
BANKRUPTCY VIA EARNING VOLATILITY: DOES IT INTEGRATE IN FINANCIAL INSTITUTIONS?
Protap Kumar Ghosh1+
Mahfuja Khatun2
Prosenjit Tarafdar3
1Associate Professor, Business Administration Discipline, Khulna University, Khulna, Bangladesh
2,3Lecturer, Human Resource Management Discipline, Khulna University, Khulna, Bangladesh
(+ Corresponding author)
ABSTRACT Article History Received: 13 September 2017 Revised: 8 November 2017 Accepted: 23 November 2017 Published: 5 December 2017
Keywords Bankruptcy Earning volatility Altman‟s Z-score Financial institutions.
JEL Classification: G33, G20
This study has been designed to reveal whether declining trend of profitability can severely affect bankruptcy of the financial institutions. Altman Z-score, fixed effect, random effect and then Hausman test are used to achieve our research goal. After critical analysis, we find that although bankruptcy and earning volatility are positively correlated in the long-term, earning volatility has very little influence on bankruptcy indicator of banking sector in Bangladesh. That is, profitability indicators Return on Investment (ROI) and Return on Assets (ROA) can explain very little portion of total changes in Altman Z-score.
Contribution/ Originality: There are some financial (i.e. liquidity, solvency and profitability) and non-financial
factors are responsible for bankruptcy of an organization but in this study, we have tried to show how much the
earning volatility is exclusively responsible for financial distress of financial institutions.
1. INTRODUCTION
Bangladesh is one of the fast growing developing economies having more than 6% growth in GDP during last
couple of years. In addition to this amazing GDP growth rate, Bangladesh has the economy having third highest
foreign currency reserves in south Asia. Financial institutions play an important role in this development process,
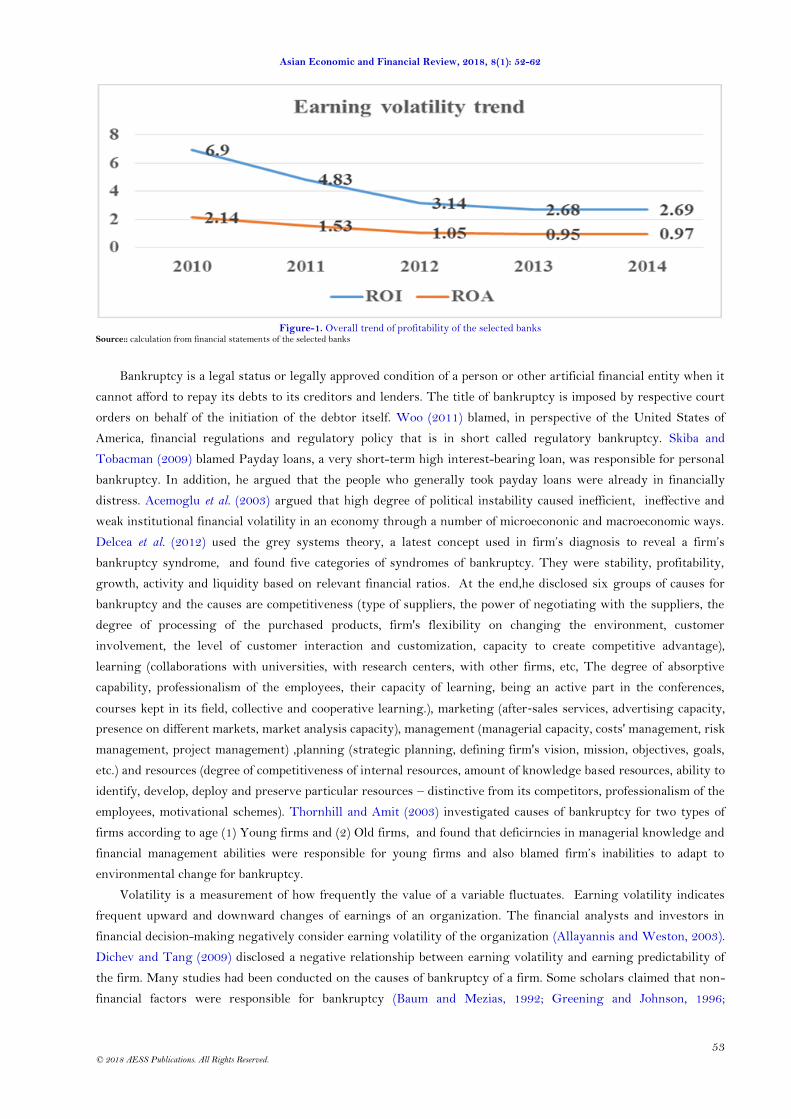
but during last couple of years overall profitability of banking sectors in Bangladesh had shown downward trend
(shown in figure-1) and few banks are severely fighting for survival. This continuous downward trend profitability
urges to investigate its impact on the bankruptcy condition of commercial bank; the most important player of our
money market.
Asian Economic and Financial Review ISSN(e): 2222-6737 ISSN(p): 2305-2147 DOI: 10.18488/journal.aefr.2018.81.52.62 Vol. 8, No. 1, 52-62 © 2018 AESS Publications. All Rights Reserved. URL: www.aessweb.com
Asian Economic and Financial Review, 2018, 8(1): 52-62
53
© 2018 AESS Publications. All Rights Reserved.
Figure-1. Overall trend of profitability of the selected banks
Source:: calculation from financial statements of the selected banks
Bankruptcy is a legal status or legally approved condition of a person or other artificial financial entity when it
cannot afford to repay its debts to its creditors and lenders. The title of bankruptcy is imposed by respective court
orders on behalf of the initiation of the debtor itself. Woo (2011) blamed, in perspective of the United States of
America, financial regulations and regulatory policy that is in short called regulatory bankruptcy. Skiba and
Tobacman (2009) blamed Payday loans, a very short-term high interest-bearing loan, was responsible for personal
bankruptcy. In addition, he argued that the people who generally took payday loans were already in financially
distress. Acemoglu et al. (2003) argued that high degree of political instability caused inefficient, ineffective and
weak institutional financial volatility in an economy through a number of microecononic and macroeconomic ways.
Delcea et al. (2012) used the grey systems theory, a latest concept used in firm‟s diagnosis to reveal a firm‟s
bankruptcy syndrome, and found five categories of syndromes of bankruptcy. They were stability, profitability,
growth, activity and liquidity based on relevant financial ratios. At the end,he disclosed six groups of causes for
bankruptcy and the causes are competitiveness (type of suppliers, the power of negotiating with the suppliers, the
degree of processing of the purchased products, firm's flexibility on changing the environment, customer
involvement, the level of customer interaction and customization, capacity to create competitive advantage),
learning (collaborations with universities, with research centers, with other firms, etc, The degree of absorptive
capability, professionalism of the employees, their capacity of learning, being an active part in the conferences,
courses kept in its field, collective and cooperative learning.), marketing (after‐sales services, advertising capacity,
presence on different markets, market analysis capacity), management (managerial capacity, costs' management, risk
management, project management) ,planning (strategic planning, defining firm's vision, mission, objectives, goals,
etc.) and resources (degree of competitiveness of internal resources, amount of knowledge based resources, ability to
identify, develop, deploy and preserve particular resources – distinctive from its competitors, professionalism of the
employees, motivational schemes). Thornhill and Amit (2003) investigated causes of bankruptcy for two types of
firms according to age (1) Young firms and (2) Old firms, and found that deficirncies in managerial knowledge and
financial management abilities were responsible for young firms and also blamed firm‟s inabilities to adapt to
environmental change for bankruptcy.
Volatility is a measurement of how frequently the value of a variable fluctuates. Earning volatility indicates
frequent upward and downward changes of earnings of an organization. The financial analysts and investors in
financial decision-making negatively consider earning volatility of the organization (Allayannis and Weston, 2003).
Dichev and Tang (2009) disclosed a negative relationship between earning volatility and earning predictability of
the firm. Many studies had been conducted on the causes of bankruptcy of a firm. Some scholars claimed that non-
financial factors were responsible for bankruptcy (Baum and Mezias, 1992; Greening and Johnson, 1996;
Asian Economic and Financial Review, 2018, 8(1): 52-62
54
© 2018 AESS Publications. All Rights Reserved.
Swaminathan, 1996) whereas some other scholars claimed that financial factors are core reasons behind bankruptcy
(Santomero and Vinso, 1977; Myers and Majluf, 1984). An analysis was carried by Transylvania Insolvency House
in 2013 and it concluded that about 31% of continuous loses were responsible for bankruptcy as well as continuous
profit fall led an organization towards short and long-term financial burden. Kraus and Litzenberger (1973)
supported that usages of any kind of long-term debt enriched the possibility of bankruptcy. Fitzpatrick (1932)
pointed out five stages that lead to failure. Those five points are (1) incubation (financials are just developing) (2)
financial embarrassment (management becomes aware of the firm‟s distressed condition) (3) financial insolvency
(unable to meet its obligations), (4) total insolvency (liabilities exceed the physical assets), and (5) confirmed
insolvency (legal steps are taken to protect the firm‟s creditors or liquidation occurs). Ooghe and DE Prijcker
(2006) disclosed four main types of failure processes that were related to the fundamental causes of bankruptcy to
the financial and nonfinancial consequences. They are unsuccessful newly established companies having significant
lack of managerial and industry related experience; ambitious growth companies having insufficient financial
resources to adjust their way of doing business to the changes in the environment; dazzled growth companies led by
an over confident management without a realistic view on the company‟s financial situation and gradual
deterioration of established companies where management had lost touch with the changing environment. Kenney
et al. (2016) reported that some cyclical company specific factors like low profitability, low liquidity and high
leverage are responsible for a company‟s failure. They also reported that „structural‟ company-level characteristics
(it means private and public limited) were also responsible for bank failure because public company managers took
more risk in decision-making.
Ahmed and Alam (2015) investigated, analyzed and applied Z score on 15 commercial banks of Bangladesh.
They applied Altman‟s Z score on these banks based on 5 years financial performance (2009-2013). They
surprisingly noticed that about 7% of banks were in healthy position in 2009 and started declining gradually. After
2011 there was none, most of the banks belong to distress zone. Mostofa et al. (2016) investigated the insolvency
level and probability of 25 conventional and non-conventional banks in Bangladesh. Their research explained that
about 24% of sample banks were in safe zone and 20% in risky zone. Hamid et al. (2016) conducted a survey for
predicting the financial distress of non-bank financial institutions in bangladesh and she found that about all of the
non-bank financial institutions were in distress zone. As, these recent studies represented financial distress of
banking sector in Bangladesh and figure-one also represents downtrend profitability of the selected banks.
From the above the discussion, it is clearly evidence that Bangladesh banking industry is seriously in critical
situation. Moreover, it is also found that both financial and non-financial factors are responsible for bankruptcy of
an organization. During last couple of years, except last three years, the political situation was not usual and
different blunders are also found in this financial sector. Although profitability trend during our research period is
found downward, the others non-financial factors are also unfavorable. Therefore, this study has been designed to
investigate how much the downtrend profitability of the financial institutions is responsible for financial distress in
this sector during our study period.
2. LITERATURE REVIEW
Pradhan (2014) conducted a research upon public sector banks in India and used Z-score to predict the
bankruptcy of the same using „Back Propagation Neural Network‟ to detect Z-score parameters and presented that
many of non-bank financial institutions have been in the „Distress‟ zone although some of them were well
recognized for their performance and contribution. Jan and Marimuthu (2015) used Altman‟s Z score model and
claimed that bankruptcy caused in different Islamic countries was just because of different performance indicators
except productivity. A study was conducted by Bernanke (1981) and found that a drop in national income of banks
suffered form a deterioration in portfolio quality which led to insolvency over a period of time. Chakravarthy (1986)
concluded usually Altman‟s Z score was not only a measure of predicting bankruptcy but also a multidimensional
Asian Economic and Financial Review, 2018, 8(1): 52-62
55
© 2018 AESS Publications. All Rights Reserved.
measure of strategic performance. Altman (1968) said it is a “composite measure of profitability, cash flow, slack,
and stock market factors. Ferrier et al. (2002) disclosed that high scores of Altman‟s Z score represented strong
financial health. On the other hand, low scores directed financial distress. To measure the financial distress of the
firm, Z-score was also used by Jan and Marimuthu (2015); Siskos (2014); Nandi and Choudhary (2011); Chowdhury
and Barua (2009); Pustylnick (2009); Kim (2007); Grice and Ingram (2001); Hayes et al. (2010); Poston et al. (1994)
and so on. Grice and Ingram (2001) concluded in his study that Altman‟s Z-score model had about 70%-80%
reliability in predicting bankruptcy. Kim (2007) found, “the Z-score is a predictor of bankruptcy and it provides in
advance that the firm is going to be insolvent”. Hayes et al. (2010) claimed in their research that the Z score
accurately predicted bankruptcy filing 94% of the time and accurately predicted financial distress over 90% of the
time. Carton and Hofer (2006) conducted an investigatin using performance metrics and concluded that optimal
metric for delivering information about financial terms was Altman‟s Z-score model and it was not only a financial
distress predictor but also an effective performance measurement tool. Altman and Hotchkiss (2006) disclosed that
Z-score was mostly the best measure for predicting the likelihood of bankruptcy for non-manufacturing firm
developed by Altman (1968). Pradhan (2014) concluded that Altman‟s Z score model could predict bankruptcy 2 or
3 years in advance.
Brédart (2014) conducted a research and aimed to develop econometric forecasting model by STATA software,
named logistic model, to predict bankruptcy constructed from three easily available and simple financial ratios, “net
income / total assets”, current ratio and “equity / total assets”. He concluded that the accuracy of the model to
predict bankruptcy is 83.82 %. On the other hand, Altman (1993) claimed that modified Z-score model could
forecast bankruptcy with 90.9% accuracy one year prior than financial failure. Despite critical views and practices of
other alternatives, ratio-based models have been played tremendous roles in the prediction of bankruptcy. Refait-
Alexandre (2004) performed a research and concluded that financial accounting data relating to profitability,
liquidity and solvency have the highest perceptive and dominating power in bankruptcy analysis. Hung and Chen
(2009) initiated an investigation to detect effective methods for predicting bankruptcy and visualized statistical
approach and artificial intelligence technique. Where statistical approach included correlation matrix, regression
analysis, logit modeling, discriminant analysis, ratio analysis and probit modeling. Artificial intelligence technique
denoted artificial neural network (ANN) and they proposed a selective ensemble of three classifiers, i.e. the decision
tree, the back propagation neural network and the support vector machine. They thought all the methods were
performing better than others were. However, among various available and accessible bankruptcy prediction
models, i.e. either logistic model based on STATA software, statistical approach or artificial intelligence technique,
ratio model is the best single model that could predict bankruptcy immediately (Mossman et al., 1998). Anjum
(2012) proclaimed that Altman Z-score model was the best model of predicting bankruptcy and financial distress
one, two or three year in advance and most importantly it could be applied to modern economy. To predict financial
distress and manage credit worthiness in future , current ratio and quick ratio are more effective and vital element
of Z-score model to anticipate bankruptcy scientifically and can be a great tool to save business than any other
liquidity ratio (Chuvakhin and Gertmenian, 2003). Form our discussion, it is eventually proved that Altman-Z score
is now greater reliable to bankruptcy of an organization.
3. RESEARCH METHODOLOGY
This is an empirical study based on secondary data. Data have been collected from published annual reports of
the selected public limited commercial banks from 2011 to 2015. There are 40 private commercial banks in
Bangladesh. Out of those banks, nine banks had been established during last few years. Only 30 banks have more
than five-year operational experience and out of these 30 commercial banks, 15 banks have been selected for
analysis judgmentally where our required data are readily available. To analyze the data, both quantitative and
qualitative approaches have been used. In this paper, return on invested capital and return of assets are used as
Asian Economic and Financial Review, 2018, 8(1): 52-62
56
© 2018 AESS Publications. All Rights Reserved.
independent variables to measure the earning volatility of the banking institutions while Altman-Z score is used to
measure the level of bankruptcy. To determine the return on invested capital (ROI) and return of assets (ROA), the
following two formulas are used.
Return on Investment = Net Income / Total Invested Capital---------------- (i)
Return of Assets (ROA) = Net Income / Total Asset ----------------------------- (ii)
To analyze the bankruptcy condition of the banks, the following Altman-Z score formula for private non-
manufacturing companies has been used. Where financial conditions are termed as „Safe Zone‟ where the value of
Z-score is > 2.6, as „Gray Zone‟ where the value Z is > 1.1 but < 2.6 and value Z < 1.1 is „Bankruptcy Zone‟.
The used equation, Altman-Z score = 6.56T1 + 3.26T2 + 6.72T3 + 1.05T4 ------- (iii)
Where,
T1 = T2 =
T3= T4=
After finding yearly Z-score of each bank, we have tried to show how changes in ROI and ROA have affected
yearly Z-scores of various banks. Before that, the value of all dependent and independent variables are converted
into natural log to present degree of chance in dependent variable because of degree of changes in independent
variables. As we have used a series of panel data of selected fifteen bank from 2010 to 2014, fixed effect and
random effect models are used for regression analysis and then Hausman test is used to select the appropriate
models for explanation. To test the degree of correlation among the dependent variable and independent variables,
multiple correlations analysis is done. Then to test the degree of multicollinearity between ROI and ROA, Variance
Inflation Factor (VIF) test is used. Our proposed regression models and hypotheses are:
The fixed effects model,
Z-score_ln it = βo + β1 * ROI_lnit + β2 * ROA_lnit +αi +µit --------------- (iv)
Where, βo denotes constant value of the model
β1 = coefficient of return on invested capital
β2 =coefficient of return on assets
i = entity and t = time
αi is the unknown intercept for each entity, (i=1….n)
µit is the error term
The random effects model,
Z-score_ln it = βo + β1 * ROI_lnit + β2 * ROA_lnit+ αi +Ɛii + µit ---------(v)
Where, Ɛii denotes within entity error
µit denotes between entity errors
To test the linkage between profitability and bankruptcy of financial institution, we have developed the
following two hypotheses.
H1 = Changes in the Values of ROI has a positive impact on the changes in Z-scores
H2 = Changes in the Values of ROA has a positive impact on the changes in Z-scores
4. ANALYSIS AND FINDINGS
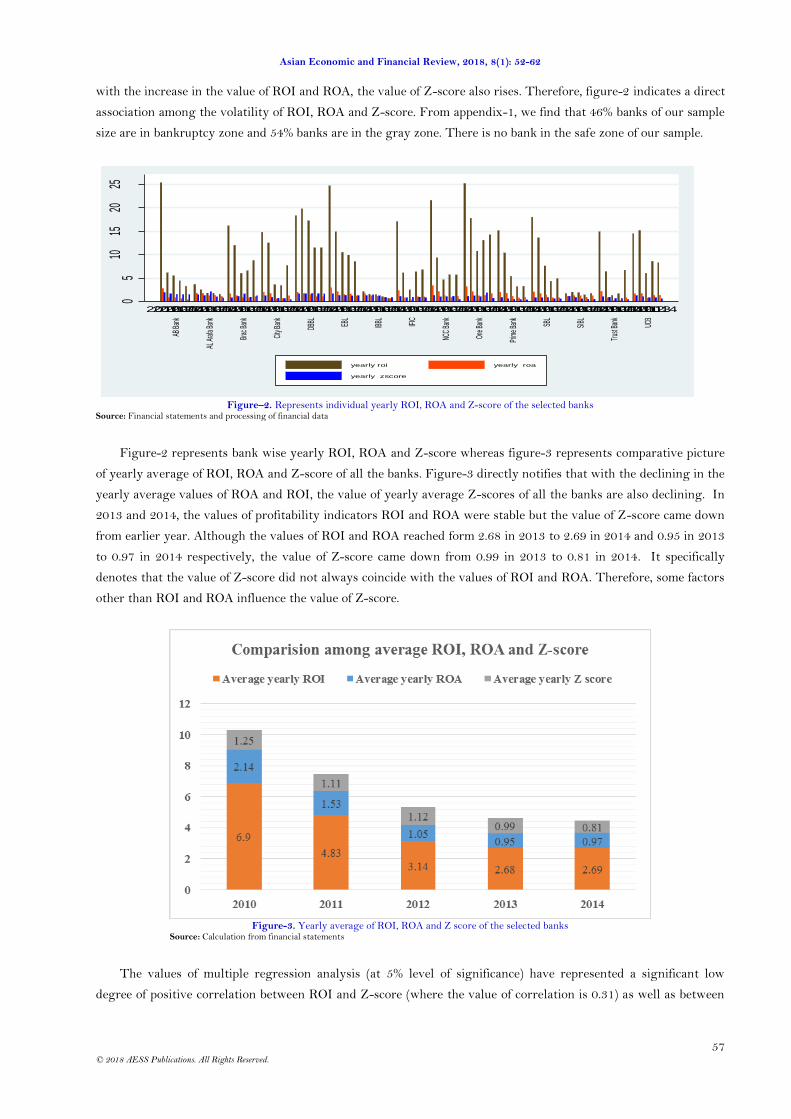
Figure-2 represents yearly ROA, ROI and Z-scores of the selected banks from 2010 to 2014. Where the graph
reasonably disclosed that in most of the cases yearly trends of the variables represented downward trends. Where
ROA and ROI trend show downward trends, accordingly Z-score also represents downward trend. In few banks
Asian Economic and Financial Review, 2018, 8(1): 52-62
57
© 2018 AESS Publications. All Rights Reserved.
with the increase in the value of ROI and ROA, the value of Z-score also rises. Therefore, figure-2 indicates a direct
association among the volatility of ROI, ROA and Z-score. From appendix-1, we find that 46% banks of our sample
size are in bankruptcy zone and 54% banks are in the gray zone. There is no bank in the safe zone of our sample.
05
1015
2025
AB B
ank
AL A
rafa
Bank
Brac
Ban
k
City
Bank
DBBL EB
L
IBBL IFIC
NCC
Bank
One B
ank
Prim
e Ban
k
SBL
SIBL
Trus
t Ban
k
UCB
201020112012201320142010201120122013201420102011201220132014201020112012201320142010201120122013201420102011201220132014201020112012201320142010201120122013201420102011201220132014201020112012201320142010201120122013201420102011201220132014201020112012201320142010201120122013201420102011201220132014
yearly roi yearly roa
yearly zscore
Figure–2. Represents individual yearly ROI, ROA and Z-score of the selected banks
Source: Financial statements and processing of financial data
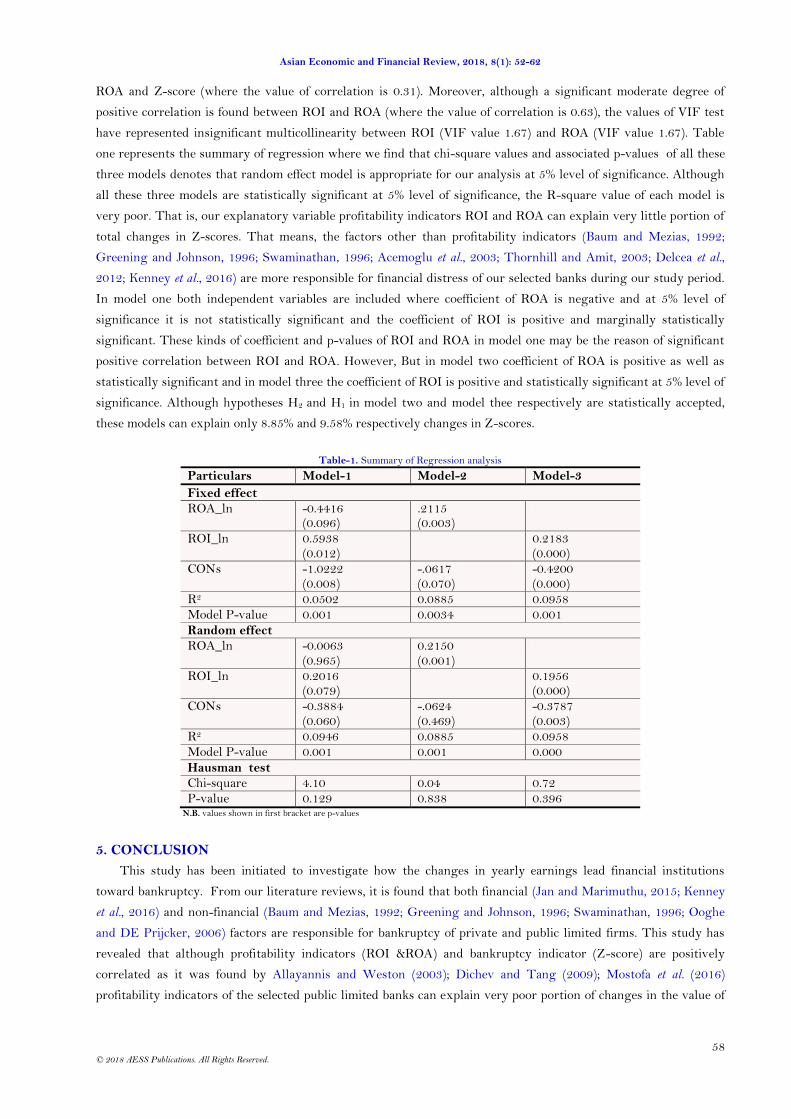
Figure-2 represents bank wise yearly ROI, ROA and Z-score whereas figure-3 represents comparative picture
of yearly average of ROI, ROA and Z-score of all the banks. Figure-3 directly notifies that with the declining in the
yearly average values of ROA and ROI, the value of yearly average Z-scores of all the banks are also declining. In
2013 and 2014, the values of profitability indicators ROI and ROA were stable but the value of Z-score came down
from earlier year. Although the values of ROI and ROA reached form 2.68 in 2013 to 2.69 in 2014 and 0.95 in 2013
to 0.97 in 2014 respectively, the value of Z-score came down from 0.99 in 2013 to 0.81 in 2014. It specifically
denotes that the value of Z-score did not always coincide with the values of ROI and ROA. Therefore, some factors
other than ROI and ROA influence the value of Z-score.
Figure-3. Yearly average of ROI, ROA and Z score of the selected banks
Source: Calculation from financial statements
The values of multiple regression analysis (at 5% level of significance) have represented a significant low
degree of positive correlation between ROI and Z-score (where the value of correlation is 0.31) as well as between
Asian Economic and Financial Review, 2018, 8(1): 52-62
58
© 2018 AESS Publications. All Rights Reserved.
ROA and Z-score (where the value of correlation is 0.31). Moreover, although a significant moderate degree of
positive correlation is found between ROI and ROA (where the value of correlation is 0.63), the values of VIF test
have represented insignificant multicollinearity between ROI (VIF value 1.67) and ROA (VIF value 1.67). Table
one represents the summary of regression where we find that chi-square values and associated p-values of all these
three models denotes that random effect model is appropriate for our analysis at 5% level of significance. Although
all these three models are statistically significant at 5% level of significance, the R-square value of each model is
very poor. That is, our explanatory variable profitability indicators ROI and ROA can explain very little portion of
total changes in Z-scores. That means, the factors other than profitability indicators (Baum and Mezias, 1992;
Greening and Johnson, 1996; Swaminathan, 1996; Acemoglu et al., 2003; Thornhill and Amit, 2003; Delcea et al.,
2012; Kenney et al., 2016) are more responsible for financial distress of our selected banks during our study period.
In model one both independent variables are included where coefficient of ROA is negative and at 5% level of
significance it is not statistically significant and the coefficient of ROI is positive and marginally statistically
significant. These kinds of coefficient and p-values of ROI and ROA in model one may be the reason of significant
positive correlation between ROI and ROA. However, But in model two coefficient of ROA is positive as well as
statistically significant and in model three the coefficient of ROI is positive and statistically significant at 5% level of
significance. Although hypotheses H2 and H1 in model two and model thee respectively are statistically accepted,
these models can explain only 8.85% and 9.58% respectively changes in Z-scores.
Table-1. Summary of Regression analysis
Particulars Model-1 Model-2 Model-3
Fixed effect ROA_ln -0.4416
(0.096) .2115 (0.003)
ROI_ln 0.5938 (0.012)
0.2183 (0.000)
CONs -1.0222 (0.008)
-.0617 (0.070)
-0.4200 (0.000)
R2 0.0502 0.0885 0.0958 Model P-value 0.001 0.0034 0.001
Random effect ROA_ln -0.0063
(0.965) 0.2150 (0.001)
ROI_ln 0.2016 (0.079)
0.1956 (0.000)
CONs -0.3884 (0.060)
-.0624 (0.469)
-0.3787 (0.003)
R2 0.0946 0.0885 0.0958 Model P-value 0.001 0.001 0.000
Hausman test Chi-square 4.10 0.04 0.72 P-value 0.129 0.838 0.396
N.B. values shown in first bracket are p-values
5. CONCLUSION
This study has been initiated to investigate how the changes in yearly earnings lead financial institutions
toward bankruptcy. From our literature reviews, it is found that both financial (Jan and Marimuthu, 2015; Kenney
et al., 2016) and non-financial (Baum and Mezias, 1992; Greening and Johnson, 1996; Swaminathan, 1996; Ooghe
and DE Prijcker, 2006) factors are responsible for bankruptcy of private and public limited firms. This study has
revealed that although profitability indicators (ROI &ROA) and bankruptcy indicator (Z-score) are positively
correlated as it was found by Allayannis and Weston (2003); Dichev and Tang (2009); Mostofa et al. (2016)
profitability indicators of the selected public limited banks can explain very poor portion of changes in the value of
Asian Economic and Financial Review, 2018, 8(1): 52-62
59
© 2018 AESS Publications. All Rights Reserved.
financial distress indicator. As profitability indicators have little influence on financial distress of the selected
banks, we can reasonably claim that other financial and non-financial factors are the major player of financial
distress of public limited domestic commercial banks in Bangladesh that may be a field of future research.
Funding: This study received no specific financial support. Competing Interests: The authors declare that they have no competing interests. Contributors/Acknowledgement: All authors contributed equally to the conception and design of the study.
REFERENCES
Acemoglu, D., S. Johnson, J. Robinson and Y. Thaicharoen, 2003. Institutional causes, macroeconomic symptoms: Volatility,
crises and growth. Journal of Monetary Economics, 50(1): 49-123. View at Google Scholar | View at Publisher
Ahmed, T. and S. Alam, 2015. Prediction of financial distress in banking companies of Bangladesh and a need for regulation by
FRC. Cost and Management, 43(6): 13-19.
Allayannis, G. and J.P. Weston, 2003. Earnings volatility, cashflow volatility, and rm value. Retrieved from
https://pdfs.semanticscholar.org/dacf/8f0e3f1b661b819f251b7687d699bfc5fcff.pdf.
Altman, E.I., 1968. Financial ratios, discriminant analysis and the prediction of corporate bankruptcy. Journal of Finance, 23(4):
589-609. View at Google Scholar | View at Publisher
Altman, E.I., 1993. Corporate financial distress and bankruptcy. 2nd Edn., New York: John Wiley & Sons.
Altman, E.I. and E. Hotchkiss, 2006. Corporate financial distress and bankruptcy: Predict and avoid bankruptcy, analyze and
invest in distressed debt. Hoboken. NJ: Wiley.
Anjum, S., 2012. Business bankruptcy prediction models: A significant study of the Altman‟s Z-score model. Asian Journal of
Management Research, 3(1): 212-219. View at Google Scholar
Baum, J.A. and S.J. Mezias, 1992. Localized competition and organizational failure in the Manhattan hotel industry, 1898-1990.
Administrative Science Quarterly, 37(4): 580-604. View at Google Scholar | View at Publisher
Bernanke, B.S., 1981. Bankruptcy, liquidity, and recession. American Economic Review, 71(2): 155-159. View at Google Scholar
Brédart, X., 2014. Bankruptcy prediction model: The case of the United States. International Journal of Economics and Finance,
6(3): 1-7. View at Google Scholar | View at Publisher
Carton, R.B. and C.W. Hofer, 2006. Measuring organizational performance: Metrics for entrepreneurship and strategic
management research. Northanpton, USA: Edward Elgar Publishing Inc.
Chakravarthy, B.S., 1986. Measuring strategic performance. Strategic Management Journal, 7(5): 437-458. View at Google Scholar |
View at Publisher
Chowdhury, A. and S. Barua, 2009. Rationalities of z-category shares in Dhaka stock exchange: Are they in financial distress
risk? BRAC University Journal, 6(1): 45-58.
Chuvakhin, N. and L.W. Gertmenian, 2003. Predicting bankruptcy in the World Com age. Journal of Contemporary Business
Practice, 6(1): 3-8. View at Google Scholar
Delcea, C., E. Scarlat and V. Mărăcine, 2012. Grey relational analysis between firm's current situation and its possible causes: A
bankruptcy syndrome approach. Grey Systems: Theory and Application, 2(2): 229-239. View at Google Scholar | View at
Publisher
Dichev, I.D. and V.W. Tang, 2009. Earnings volatility and earnings predictability. Journal of Accounting and Economics, 47(1-
2): 160-181. View at Google Scholar | View at Publisher
Ferrier, W.J., C.M. Fhionnlaoich, K.G. Smith and C.M. Grimm, 2002. The impact of performance distress on aggressive
competitive behavior: A reconciliation of conflicting views. Managerial and Decision Economics, 23(4-5): 301-316. View
at Google Scholar | View at Publisher
Fitzpatrick, P.J., 1932. A comparison of the ratios of successful industrial enterprises with those of failed companies. Certified
Public Accountant, 6: 727-731.
Asian Economic and Financial Review, 2018, 8(1): 52-62
60
© 2018 AESS Publications. All Rights Reserved.
Greening, D.W. and R.A. Johnson, 1996. Do managers and strategies matter? A study in crisis. Journal of Management Studies,
33(1): 25-51. View at Google Scholar | View at Publisher
Grice, J.S. and R.W. Ingram, 2001. Tests of the generalizability of Altman's bankruptcy prediction model. Journal of Business
Research, 54(1): 53-61. View at Google Scholar | View at Publisher
Hamid, T., F. Akter and N.B. Rab, 2016. Prediction of financial distress of non-bank financial institutions of Bangladesh using
Altman‟s Z score model. International Journal of Business and Management, 11(12): 261-270. View at Google Scholar | View at
Publisher
Hayes, S.K., K.A. Hodge and L.W. Hughes, 2010. A study of the efficacy of Altman‟s Z to predict bankruptcy of specialty retail
firms doing business in contemporary times. Economics & Business Journal: Inquiries & Perspectives, 3(1): 130-134.
View at Google Scholar
Hung, C. and J.H. Chen, 2009. A selective ensemble based on expected probabilities for bankruptcy prediction. Expert Systems
with Applications, 36(3): 5297-5303. View at Google Scholar | View at Publisher
Jan, A. and M. Marimuthu, 2015. Altman model and bankruptcy profile of islamic banking industry: A comparative analysis on
financial performance. International Journal of Business and Management, 10(7): 110-119. View at Google Scholar | View at
Publisher
Kenney, R.L., G. Cava and D. Rodgers, 2016. Why do companies fail?(No. rdp 2016-09). Reserve Bank of Australia.
Kim, B., 2007. Bankruptcy prediction: Book value or market value?
Kraus, A. and R.H. Litzenberger, 1973. A state-preference model of optimal financial leverage. Journal of Finance, 28(4): 911-
922. View at Google Scholar | View at Publisher
Mossman, C.E., G.G. Bell, L.M. Swartz and H. Turtle, 1998. An empirical comparison of bankruptcy models. Financial Review,
33(2): 35-54. View at Google Scholar | View at Publisher
Mostofa, M., S. Rezina and M. Hasan, 2016. Predicting the financial distress in the banking industry of Bangladesh: A case study
on private commercial banks. Australian Academy of Accounting and Finance Review, 2(1): 45-58.
Myers, S.C. and N.S. Majluf, 1984. Corporate financing and investment decisions when firms have information that investors do
not have. Journal of Financial Economics, 13(2): 187-221. View at Google Scholar | View at Publisher
Nandi, J.K. and N.K. Choudhary, 2011. Credit risk management of loan portfolios by Indian banks: Some empirical evidence. IUP
Journal of Bank Management, 10(2): 32-42. View at Google Scholar
Ooghe, H. and S. DE Prijcker, 2006. Failure processes and causes of company bankruptcy: A typology. Department of
Accountancy & Corporate Finance, Ghent University, Working Paper No. 388.
Poston, K.M., W.K. Harmon and J.D. Gramlich, 1994. A test of financial ratios as predictors of turnaround versus failure among
financially distressed firms. Journal of Applied Business Research, 10(1): 41-57. View at Google Scholar | View at Publisher
Pradhan, R., 2014. Z score estimation for Indian banking sector. International Journal of Trade, Economics and Finance, 5(6):
516-520. View at Google Scholar | View at Publisher
Pustylnick, I., 2009. Combined algorithm for detection of manipulation in financial statements. SMC University, Swiss
Mangement Centre, (June 19). Retrieved from https://ssrn.com/abstract=1422693.
Refait-Alexandre, C., 2004. La prévision de la faillite fondée sur l'analyse financière de l'entreprise: Un état des lieux. Economie
& Prévision, 162(1): 129-147. View at Google Scholar | View at Publisher
Santomero, A.M. and J.D. Vinso, 1977. Estimating the probability of failure for commercial banks and the banking system.
Journal of Banking & Finance, 1(2): 185-205. View at Google Scholar | View at Publisher
Siskos, D., 2014. Detecting financial reporting fraud-Lesson learned by Enron Corp. SMC University Working Paper No. 4-16.
Skiba, P.M. and J. Tobacman, 2009. Do payday loans cause bankruptcy?. Vanderbilt Law and Economics Research Paper No. 11-
13.
Swaminathan, A., 1996. Environmental conditions at founding and organizational mortality: A trial-by-fire model. Academy of
Management Journal, 39(5): 1350-1377. View at Google Scholar | View at Publisher
Asian Economic and Financial Review, 2018, 8(1): 52-62
61
© 2018 AESS Publications. All Rights Reserved.
Thornhill, S. and R. Amit, 2003. Learning about failure: Bankruptcy, firm age, and the resource-based view. Organization
Science, 14(5): 497-509. View at Google Scholar | View at Publisher
Woo, S.P., 2011. Regulatory bankruptcy: How bank regulation causes fire sales. Georgetown Law Journal, 99: 1615.
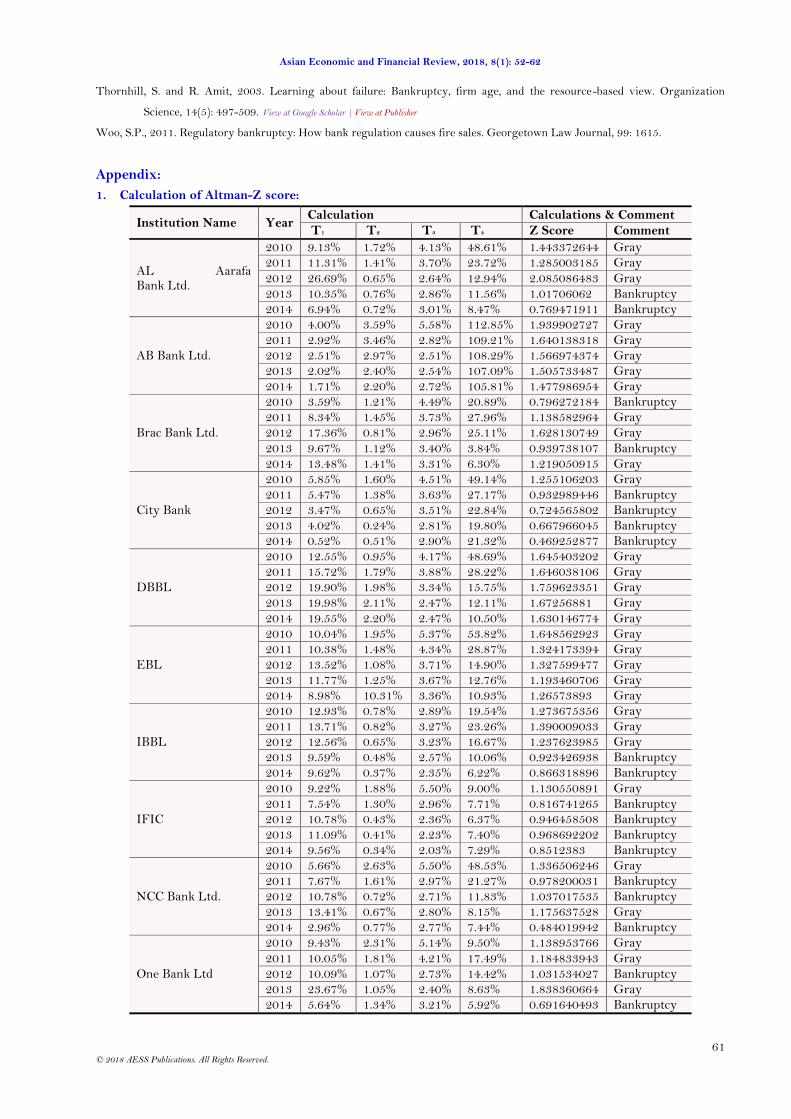
Appendix:
1. Calculation of Altman-Z score:
Institution Name Year Calculation Calculations & Comment
T1 T2 T3 T4 Z Score Comment
AL Aarafa Bank Ltd.
2010 9.13% 1.72% 4.13% 48.61% 1.443372644 Gray 2011 11.31% 1.41% 3.70% 23.72% 1.285003185 Gray
2012 26.69% 0.65% 2.64% 12.94% 2.085086483 Gray 2013 10.35% 0.76% 2.86% 11.56% 1.01706062 Bankruptcy 2014 6.94% 0.72% 3.01% 8.47% 0.769471911 Bankruptcy
AB Bank Ltd.
2010 4.00% 3.59% 5.58% 112.85% 1.939902727 Gray 2011 2.92% 3.46% 2.82% 109.21% 1.640138318 Gray 2012 2.51% 2.97% 2.51% 108.29% 1.566974374 Gray 2013 2.02% 2.40% 2.54% 107.09% 1.505733487 Gray 2014 1.71% 2.20% 2.72% 105.81% 1.477986954 Gray
Brac Bank Ltd.
2010 3.59% 1.21% 4.49% 20.89% 0.796272184 Bankruptcy 2011 8.34% 1.45% 3.73% 27.96% 1.138582964 Gray 2012 17.36% 0.81% 2.96% 25.11% 1.628130749 Gray
2013 9.67% 1.12% 3.40% 3.84% 0.939738107 Bankruptcy 2014 13.48% 1.41% 3.31% 6.30% 1.219050915 Gray
City Bank
2010 5.85% 1.60% 4.51% 49.14% 1.255106203 Gray 2011 5.47% 1.38% 3.63% 27.17% 0.932989446 Bankruptcy 2012 3.47% 0.65% 3.51% 22.84% 0.724565802 Bankruptcy 2013 4.02% 0.24% 2.81% 19.80% 0.667966045 Bankruptcy 2014 0.52% 0.51% 2.90% 21.32% 0.469252877 Bankruptcy
DBBL
2010 12.55% 0.95% 4.17% 48.69% 1.645403202 Gray 2011 15.72% 1.79% 3.88% 28.22% 1.646038106 Gray 2012 19.90% 1.98% 3.34% 15.75% 1.759623351 Gray 2013 19.98% 2.11% 2.47% 12.11% 1.67256881 Gray
2014 19.55% 2.20% 2.47% 10.50% 1.630146774 Gray
EBL
2010 10.04% 1.95% 5.37% 53.82% 1.648562923 Gray 2011 10.38% 1.48% 4.34% 28.87% 1.324173394 Gray 2012 13.52% 1.08% 3.71% 14.90% 1.327599477 Gray 2013 11.77% 1.25% 3.67% 12.76% 1.193460706 Gray 2014 8.98% 10.31% 3.36% 10.93% 1.26573893 Gray
IBBL
2010 12.93% 0.78% 2.89% 19.54% 1.273675356 Gray 2011 13.71% 0.82% 3.27% 23.26% 1.390009033 Gray 2012 12.56% 0.65% 3.23% 16.67% 1.237623985 Gray 2013 9.59% 0.48% 2.57% 10.06% 0.923426938 Bankruptcy 2014 9.62% 0.37% 2.35% 6.22% 0.866318896 Bankruptcy
IFIC
2010 9.22% 1.88% 5.50% 9.00% 1.130550891 Gray 2011 7.54% 1.30% 2.96% 7.71% 0.816741265 Bankruptcy 2012 10.78% 0.43% 2.36% 6.37% 0.946458508 Bankruptcy 2013 11.09% 0.41% 2.23% 7.40% 0.968692202 Bankruptcy 2014 9.56% 0.34% 2.03% 7.29% 0.8512383 Bankruptcy
NCC Bank Ltd.
2010 5.66% 2.63% 5.50% 48.53% 1.336506246 Gray 2011 7.67% 1.61% 2.97% 21.27% 0.978200031 Bankruptcy 2012 10.78% 0.72% 2.71% 11.83% 1.037017535 Bankruptcy 2013 13.41% 0.67% 2.80% 8.15% 1.175637528 Gray 2014 2.96% 0.77% 2.77% 7.44% 0.484019942 Bankruptcy
One Bank Ltd
2010 9.43% 2.31% 5.14% 9.50% 1.138953766 Gray
2011 10.05% 1.81% 4.21% 17.49% 1.184833943 Gray 2012 10.09% 1.07% 2.73% 14.42% 1.031534027 Bankruptcy 2013 23.67% 1.05% 2.40% 8.63% 1.838360664 Gray 2014 5.64% 1.34% 3.21% 5.92% 0.691640493 Bankruptcy
Asian Economic and Financial Review, 2018, 8(1): 52-62
62
© 2018 AESS Publications. All Rights Reserved.
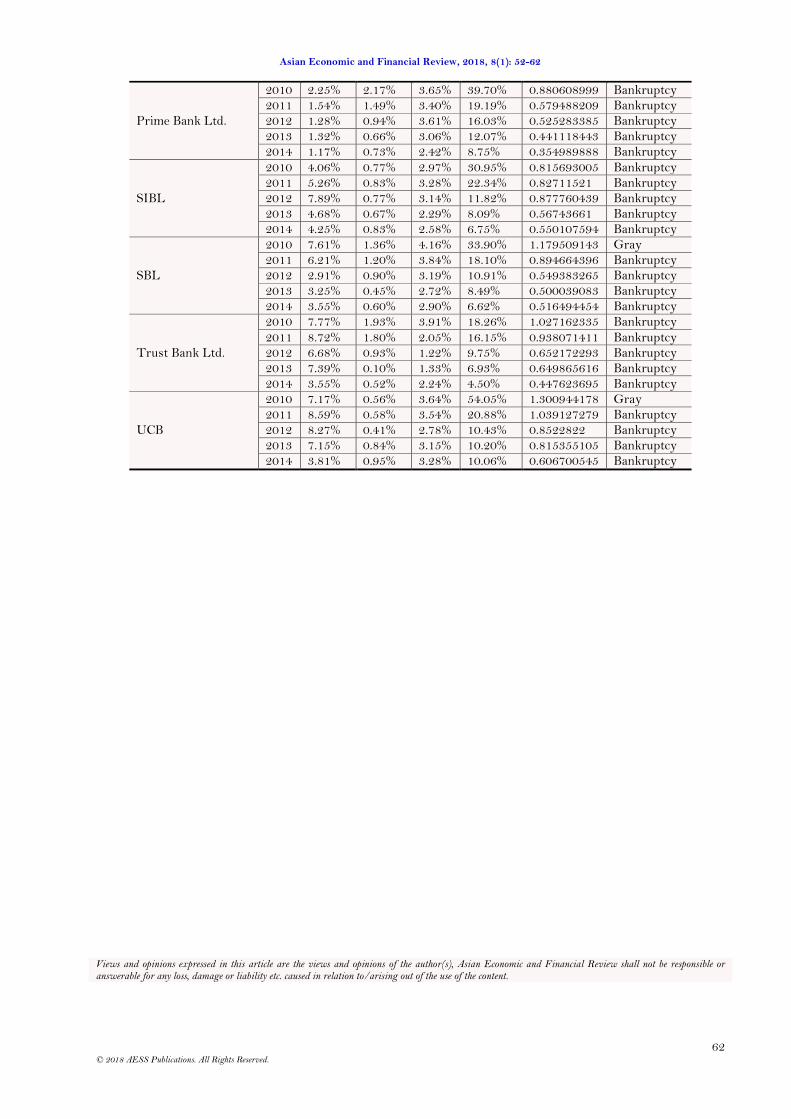
Prime Bank Ltd.
2010 2.25% 2.17% 3.65% 39.70% 0.880608999 Bankruptcy 2011 1.54% 1.49% 3.40% 19.19% 0.579488209 Bankruptcy 2012 1.28% 0.94% 3.61% 16.03% 0.525283385 Bankruptcy 2013 1.32% 0.66% 3.06% 12.07% 0.441118443 Bankruptcy 2014 1.17% 0.73% 2.42% 8.75% 0.354989888 Bankruptcy
SIBL
2010 4.06% 0.77% 2.97% 30.95% 0.815693005 Bankruptcy 2011 5.26% 0.83% 3.28% 22.34% 0.82711521 Bankruptcy 2012 7.89% 0.77% 3.14% 11.82% 0.877760439 Bankruptcy 2013 4.68% 0.67% 2.29% 8.09% 0.56743661 Bankruptcy 2014 4.25% 0.83% 2.58% 6.75% 0.550107594 Bankruptcy
SBL
2010 7.61% 1.36% 4.16% 33.90% 1.179509143 Gray 2011 6.21% 1.20% 3.84% 18.10% 0.894664396 Bankruptcy 2012 2.91% 0.90% 3.19% 10.91% 0.549383265 Bankruptcy 2013 3.25% 0.45% 2.72% 8.49% 0.500039083 Bankruptcy 2014 3.55% 0.60% 2.90% 6.62% 0.516494454 Bankruptcy
Trust Bank Ltd.
2010 7.77% 1.93% 3.91% 18.26% 1.027162335 Bankruptcy
2011 8.72% 1.80% 2.05% 16.15% 0.938071411 Bankruptcy 2012 6.68% 0.93% 1.22% 9.75% 0.652172293 Bankruptcy 2013 7.39% 0.10% 1.33% 6.93% 0.649865616 Bankruptcy 2014 3.55% 0.52% 2.24% 4.50% 0.447623695 Bankruptcy
UCB
2010 7.17% 0.56% 3.64% 54.05% 1.300944178 Gray 2011 8.59% 0.58% 3.54% 20.88% 1.039127279 Bankruptcy 2012 8.27% 0.41% 2.78% 10.43% 0.8522822 Bankruptcy 2013 7.15% 0.84% 3.15% 10.20% 0.815355105 Bankruptcy 2014 3.81% 0.95% 3.28% 10.06% 0.606700545 Bankruptcy
Views and opinions expressed in this article are the views and opinions of the author(s), Asian Economic and Financial Review shall not be responsible or answerable for any loss, damage or liability etc. caused in relation to/arising out of the use of the content.
Copyright © 2022 FDOKUMEN

