


Bahasa
Halaman
Hukum


A Thesis Submitted for the Degree of PhD at the University of Warwick
Permanent WRAP URL: http://wrap.warwick.ac.uk/136112
Copyright and reuse:This thesis is made available online and is protected by original copyright.Please scroll down to view the document itself.Please refer to the repository record for this item for information to help you to cite it. Our policy information is available from the repository home page.
For more information, please contact the WRAP Team at: [email protected]
warwick.ac.uk/lib-publications


- CONTENTS-
Page
C onten ts.............................................................................................................................. i
List of tables and illustrations...........................................................................x
Acknowledgem ents.................................................................................................... xiii
D eclara tion ....................................................................................................................xiv
A bstract...........................................................................................................................xv
C h a p te r 1: O lfa c to ry p sy c h o lo g y -a n in t r o d u c t io n a n d
o v e r v i e w ................................................................................................................. 1
1 .1 . Psychology and the sense of smell ......................................................... 1
1 .2 . The human psychophysiology of the sense of smell.................................. 6
1 .3 . The aims of the present thesis ................................................................. 9
C h a p te r 2 : C a n o d o u r a l t e r b e h a v io u r? A re v ie w a n d c r it iq u e
o f o lf a c to ry p s y c h o lo g y .................................................................................. 1 1
2 .1 . Olfactory psychology: a definition ......................................................... 11
2 .2 . What is the use of smell? Some social consequences.............................. 12
2 .3 . Olfaction: Its common roles ................................................................. 14
2.4. Olfactory influences on affect and cognition .......................................... 15
2.4.i. Learning, memory and cognition .................................... 16
2.4.ii. Alteration of affective and expressive response to odour....... 18
2.4. a) Field studies ............................................................... 19
2.4. b) Laboratory-based experiments ...................................... 20
2 .5 . A caveat ................................................................................................... 23

2 .6 . Summary of behavioural effects of odour and a mention of the
limbic system ............................................................................................ 24
Chapter 3: Foods and their odours-their effects on
consumption and behaviour........................................................................ 29
3 .1 . The psychological usefulness of food: behavioural effects...................... 29
3 .2 . Food consumption and cognition in adults ............................................ 30
3 .3 . Nutrient-specific impairment? ................................................................ 32
3 .4 . Pre-and post-prandial response to food and food odour.......................... 34
3 .5 . Alliesthesia and the concept of sensory-specific satiety ........................... 36
3 .6 . Alliesthesia & sensory-specific satiety I: the laboratory studies................ 38
3 .7 . Pre- and post-prandial pleasantness ratings of food ................................ 40
3 .8 . Alliesthesia and sensory-specific satiety II: a critique............................. 41
3 .9 . Summary of the behavioural effects of food and food odour................... 43
Chapter 4: EEG, ERP and olfactory perception. The use of
psychophysiology to examine human response to odour and
food consumption ............................................................................................. 45
4 .1 . Psychological concomitants of EEG activity ........................................... 45
4 .2 . Alpha desynchrony: artifact or task-related? ........................................... 48
4 .3 . Electroencephalography: The technique, the activity and its problems........50
4 .4 . Brain mapping and EEG ........................................................................ 52
4 .5 . EEG: statistical considerations ............................................................... 53
4 .6 . Event-Related-Potentials and their potential relation to information-
processing ................................................................................................. 57
4 .7 . The P300 .................................................................................................... 58

4 .8 . Changes in evoked potentials: food consumption or diurnal variation?...... 61
4 .9 . ERPs and food analogues ...................................................................... 62
4 .1 0 . EEG & odour: methodological considerations ....................................... 65
4 .1 1 . Event-related potentials and olfaction ..................................................... 68
4 .1 2 . Food odour, the EEG and the ERP ....................................................... 70
4 .1 3 . EEG and food odour: cognitive mediation? .......................................... 73
4 .1 4 . EEG, odour and affect ........................................................................... 74
4 .1 5 . Approach-withdrawal behaviour ........................................................... 80
4 .1 6 . Approach-withdrawal behaviour and odour ........................................... 82
4.1 7 . Conclusion ............................................................................................... 84
iii
Chapter 5: Experiment 1- Meal ingestion and exposure to
food odour: their effects on the auditory oddball ERP task.
Method & results ....................................................................... 88
5 .1 . Introduction .......................................................................................... 88
5 .2 . Subjects ................................................................................................. 91
5 .3 . Procedure .............................................................................................. 93
5 .4 . Task ....................................................................................................... 95
5 .5 . ERP recording apparatus .................................................................... 96
5 .6 . Data reduction ..................................................................................... 96
5 .7 . Psychometric data ............................................................................... 97
5.7.i. Odour identification ........................................................... 97
5.7.ii. Psychometric ratings: pleasantness, strength and
familiarity ..................................................................................... 98

5 .8 . ERP results ......................................................................................... 101
5.8.1. Tone counting ................................................................ 101
5.8.11. Amplitude data ............................................................... 102
(a) Effects on N100 amplitude ............................................... 102
(b) Effects on P200 amplitude ............................................... 102
(b) i. Was there an effect of group or odour? .............................. 102
(b) ii. Was there an effect of time-of-day?................................. 103
(b) iii. Did exposure to odour interact with group or time-of-day? .. 103
(c) Effects on P300 amplitude ................................................. 104
5.8.111. Latency data ............................................................... 104
(a) Effects on N100 latency ................................................... 104
(b) Effects on P200 latency ...................................................... 104
(b) i. Was there a main effect of group, odour or time-of-day ? .... 104
(c) Effects on P300 latency ...................................................... 105
(c) i. Was there a main effect of odour, lunch or time-of-day?...... 105
5 .9 . Discussion .......................................................................................... 105
5.9.1. Alliesthesia ..................................................................... 105
5.9.11. Did lunch affect the P3(X) or any other ERP component? ... 106
5.9.111. Did odour affect any ERP component? ......................... 110
5.9.iv. Was any diurnal variation apparent for any component? .... 113
Chapter 6: Experiment 2- Meal consumption, exposure to
food odour and EEG activity; an investigation using Brain
Electrical Activity Mapping. Method & results ........................ 116
6 .1 . Introduction ......................................................................................... 116

V6 .2 . Subjects ............................................................................................. 119
6 .3 . Procedure .......................................................................................... 120
6 .4 . The odours ...................................................................................... 121
6 .5 . The lunch ............................................................................................ 123
6 .6 . EEG apparatus and recording protocol ............................................ 123
6 .7 . EEG data reduction ......................................................................... 124
6 .8 . Psychometric results ......................................................................... 126
6.8.1. Odour identification ...................................................... 126
6.8.11. Hunger ratings ............................................................. 127
6.8.111. Psychometric ratings: pleasantness, strength, familiarity,
trigeminal and alertness ............................................................ 129
(a) Did the ingestion of lunch affect any of the psychometric
ratings? ....................................................................................... 129
(b) Did the odours differ significantly on any of the dimensions? ... 129
(b) i. Pleasantness .................................................................... 129
(b) ii. Strength ........................................................................... 131
(b) iii. Familiarity ..................................................................... 131
(b) iv. Stinging-soothing ........................................................... 132
(b) v. Alerting-relaxing .............................................................. 134
6 .9 . EEG results ......................................................................................... 134
6.9.1. Effects of odour ............................................................. 134
6.9.11. Effects of group ............................................................ 135
6.9.111. Effects of time-of-day ................................................. 136
6.9.iv. Did odour interact with group or time-of-day?................ 136
6.9. v. Were any odour x group x time-of-day interactions
obtained? ....................................................................................... 137
6.9. vi. Was EEG asymmetry apparent for pleasant, unpleasant and

neutral odours ............................................................................. 138
(a) EEG asymmetry and pleasantness ....................................... 139
(b) EEG asymmetry and electrode position ............................... 143
6.9. vii. Was EEG asymmetry evident for alerting vs calming vs neutral
odours? .......................................................................................... 147
(a) Differences in asymmetry between odours........................... 147
(b) Differences in asymmetry by position .................................. 147
6 .1 0 . Discussion ........................................................................................ 148
6. lO.i. Did ingestion of lunch affect the hedonic ratings of food
odour?............................................................................................ 148
6.10.ii. The effects of odour on the EEG................................. 149
6. lO.iii. The effects of time-of-day............................................ 151
6.10.iv. Effects of lunch............................................................. 152
6.10. v. EEG asymmetry for pleasant and relaxing odours....... 153
Chapter 7: The effects of food ingestion and exposure to the
odour of hot, cooked food on the EEG.
Method & results ............................................................................... 156
7 .1 . Introduction .......................................................................................... 156
7 .2 . Subjects .............................................................................................. 159
7 .3 . The odours .......................................................................................... 159
7 .4 . Procedure .............................................................................................. 161
7 .5 . The lunch ........................................................................................... 163
7 .6 . EEG recording ................................................................................... 163
7 .7 . Psychometric results ............................................................................ 164

7.7.1. Hunger and fullness ratings ........................................... 164
7.7.11. Does the odour induce hunger? ................................... 166
7.7.111. Odour identification ..................................................... 170
7.7.iv. Psychometric ratings: pleasantness, familiarity, strength,
alertness, happiness and hungriness ............................................. 171
(a) Did the ingestion of lunch affect any psychometric rating?...... 172
(b) Did the odours differ along any of the dimensions?............... 172
(b) i. Pleasantness .................................................................... 172
(b) ii. Strength .......................................................................... 173
(b) iii. Familiarity .................................................................... 174
(b) iv. Alertness ....................................................................... 176
(b) v. Does the odour induce happiness? .................................. 177
7.7. v. Would subjects eat food emitting the odours used?....... 178
7 .8 EEG results .......................................................................................... 179
7.8.1. Effects of odour ............................................................. 179
(a) Theta ....................................................................................... 179
(b) Alpha ...................................................................................... 181
(b) Beta 1 ................................................................................... 182
7.8.11. Effects of time-of-day ................................................... 183
(a) Theta ....................................................................................... 183
(b) Alpha ...................................................................................... 183
(c) Beta 1 and 2 ....................................................................... 183
7.8.111. Did odour and time-of-day interact? ............................. 184
7.8.iv. Did odour, group and time-of-day interact?.................... 185
7.8. v. EEG asymmetry and pleasantness ra tings.................. 186
(a) Asymmetry between odours ................................................ 186
(b) Were there any differences in asymmetry location for each
vii

odour? 187
7.8. vi. EEG asymmetry and alertness ratings ....................... 188
(a) Differences between odours ................................................ 189
(b) Differences in asymmetry by position ................................. 189
7 .9 . Discussion ................................................................................................ 190
7.9.1. Pre- and post- prandial hedonic response to odour......... 190
7.9.11. EEG results: Effects of odour ........................................ 192
7.9.iii. Time-of-day effects ......................................................... 193
7.9.iv. EEG asymmetry and odour pleasantness ........................ 194
7.9. v. EEG asymmetry and alertness .................................... 197
7.9. vi. Conclusion to experiments 1, 2, & 3 .......................... 200
Chapter 8: On EEG, odour & emotion: A re-assessment and
general discussion ...................................................................... 201
8 .1 . Aims of the current thesis-revisited ...................................................... 201
8 .2 . EEG & odour II: The predominance of theta ...................................... 204
8.2.1. Objection 1: Other wavebands as well as theta appear to be
affected by exposure to odour ................................................... 205
8.2.11. Objection 2: Changes in theta have been found in tasks which
are not olfactory in nature ........................................................... 209
8 .3 . Theta and olfactory perception: The case for ........................................ 209
8 .4 . Odour, problem-solving, task difficulty and theta ................................. 210
8 .5 . Odour and EEG asymmetry: replication or re-modification?................... 214
8 .6 . Disparities and reasons for disparity ..................................................... 216
8 .7 . Food ingestion, olfactory perception and the EEG ................................ 220
8.7.1. Olfactory alliesthesia: a viable construct ? ....................... 221

I X
8.7.Ü. The elctrophysiological response to food consumption..... 222
8 .8 . Conclusions and future directions ........................................................ 226
References ........................................................................................................ 235
Appendix A :
Appendix B :
Appendix C :
Appendix D :
Appendix E :
Appendix F :
Maps illustrating changes in the EEG
Testing materials
B 1: Handedness questionnaire
B2: Psychometric odour rating sheets for experiment 1
B3: Psychometric odour rating sheets for experiment 2
B4: Psychometric odour rating sheets for experiment 3
B5: Odour discrimination test
EEG recording equipment
Cl: The Brain Imager Series III model
C2: Waveform decomposition
C3: Testing conditions
C4: Materials
BatchCommander Programme
Semiochemistry and human behaviour
Olfactory remediation: a critical review

- LIST OF TABLES & ILLUSTRATIONS-
p. 37. Fig. A. Figure illustrating determinants o f food flavour.
p. 66a. Table 4.1. Summary o f EEC studies o f human response to odours.
p. 76. Table 4.2. Summary o f EEG studies o f human response to affective
stimuli.
p. 96a. Fig. 5. Electrodes used in ERP recording.
p. 98. Table 5a. Odours rated for familiarity and identifiability.
p. 98. Table 5b. Odours rated for strength and pleasantness.
p. 100. Table 5c. Correlations between the dimensions o f pleasantness, strength
and familiarity.
p. 101. Fig. 5.i. Graph illustrating differences in odour pleasantness.
p. 108. Table 5d. Methodological differences between the present experiment and
those of Geisler and Polich (1992a, b).
p. 124a. Fig. 6. Electrodes used in experiment 2.
p. 126. Table 6a. Odours rated for familiarity and identifiability.
p. 128. Fig. 6.i. Graph illustrating a.m. and p.m. differences in hunger ratings.
p. 129a. Table 6b. Odours rated for pleasantness, strength, familiarity, trigeminal
properties and relaxation.
p. 130. Fig 6.ii. Graph illustrating differences in pleasantness ratings o f odours.
p. 132. Fig 6.iii. Graph illustrating differences between odours for familiarity.
p. 133. Fig 6.iv. Graph illustrating differences between odours for the trigeminal
dimension.
p. 135. Fig. 6.v. Graph illustrating differences between odours in the theta
frequency for electrode, F8.
p. 136. Fig. 6.vi. Graph illustrating time-of-day differences in the alpha frequency
for electrode, PZ.

p. 138. Fig. 6.vii. Graph illustrating group and time-of-day differences in the
alpha requency for electrode, T4.
p. 140. Table 6c. F values for pleasantness differences in EEG alpha and theta
asymmetry (a.m. data).
p. 141. Table 6d. F values for pleasantness differences in alpha EEG asymmetry
(p.m. data).
p. 142. Table 6e. F values for pleasantness differences in theta EEG asymmetry
(p.m. data).
p. 144. Table 6f. F values for position asymmetry in alpha and theta (a.m. data).
p. 145. Table fig. F values for position asymmetry in alpha (p.m. data).
p. 146. Table 6h. F values for position asymmetry in theta (p.m. data).
p. 163a. Fig. 7. Electrodes used in experiment 3.
p. 165. Fig 7.i.a. Graph illustrating group a.m. hunger and fullness ratings.
p. 166. Fig. 7.i.b. Graph illustrating group p.m. hunger and fullness ratings.
p. 167. Table 7a. Odours rated for their ability to induce hunger.
p. 168. Fig. 7.ii.a. Graph illustrating the control and lunch groups' a.m. and
p.m. response to the question " does this odour make you hungry?"
p. 160. Fig. 7.ii.b. Graph illustrating the lunch group's a.m. and p.m. response t
to the question, "does this odour make you hungry?"
p. 170. Fig. 7.ii.c. Graph illustrating p.m. responses o f the groups to the
question, "does this odour make you hungry?"
p. 171. Table 7b. Odours ranked according to identifiability.
p. 171a. Table 7c. Odours rated for pleasantness, familiarity, strength, alertness
and happiness-inducement.
p. 173. Fig. 7.iii. Graph illustrating pleasantness ratings o f odours.
p. 174. Fig. 7.iv. Graph illustrating differences between odours along the strength
dimension.

p. 175. Fig. 7.v. Graph illustrating differences between odours along the
familiarity dimension.
p. 177. Fig. 7.vi. Graph illustrating differences between odours along the
alertness-relaxation dimension.
p. 178. Fig. 7.vii. Graph illustrating differences between odours for the
"happiness " dimension.
p. 180. Fig. 7.viii. Graph illustrating odours differences in theta activity for
electrode, FZ.
p. 181. Fig. 7.ix. Graph illustrating odour differences in the theta activity for
electrode, T5.
p. 182. Fig. 7. x. Graph illustrating odour differences in alpha activity for
electrodes, 01 and 02.
p. 184. Fig. 7.xi. Graph illustrating time-of-day differnces in the beta I and 2
frequencies for electrode, T3.
p. 185. Fig. 7.xii. Graph illustrating group x time-of-day differences in the alpha
frequency for electrode, F8.
p. 188. Fig. 7. xiii. Graph illustrating differences in the distribution o f alpha
asymmetry for the baked bean odour.

ACKNOWLEDGEMENTS
xiii
The author would like to acknowledge the assistance and advice of the following people
whose guidance and instruction has been sought, found, exploited and welcomed: Dr
Gina Rippon, for her technical expertise and good-humoured comments on an earlier
draft of this thesis; Mr Greg Milligan, for devising the Autoedit and BatchCommander
computer programmes used in the experiments below and for remedying equipment
failure and the author's ignorance of programming beyond the call of duty. His tireless
passion for the area and his technical tenacity ensured the completion of experiments
and analysis which would otherwise have been delayed considerably; Dr Glyn Collis,
for designing the original macro computer programmes used for re-arranging the
downloaded EEG data, and for comments on statistical strategy; Miss Nicky
Brunswick for her indefatigable assistance with the preparation of subjects' lunches;
Dr Nerys Griffiths, of Campden Food and Drink Research, for her advice on
preparation and storage of rotting meat; Mrs Barbera Argument and the Coventry
Evening Telegraph for their assistance with subject recruitment; Nicolet instruments for
the use of their promotional material; Quest International for supplying some of the
odours used in the experiments below; the Agricultural and Food Research Council for
co-funding (with Quest International) the research reported here; and, finally, Daisy,
for her patience, coffee, support and amphibia.

X I V
DECLARATION
The research reported in this thesis is the author's own. Versions of chapters 4, 5 and
6 have been presented as papers or posters at the European Chemoreception Research
Organization UK Meeting, University of Reading, November 1990; the Psychology
Postgraduate Affairs Group's Annual Conference, University of Staffordshire, April
1991; the Kith Biennial Congress of the European Chemoreception Research
Organization, Munich, Germany, August 1992; the British Psychophysiology Society
and Health Psychology Section of the British Psychological Society Joint-Meeting,
University of St Andrews, Scotland, November 1992. Abstracts have appeared in The
Psychologist. Chemical Senses and the Journal of Psychophysiology. This thesis
follows the style and content guidelines issued by the University of Warwick Graduate
School (Guide to examinations for higher degrees bv research. 1992).

X V
ABSTRACT
Recent psychophysiological evidence indicates that Central Nervous System activity may be directly affected by olfactory stimulation. The present thesis sought to examine the relationship between the CNS and olfactory perception in a series of three EEG experiments employing food odours as stimuli. Further aims were to explore the effect of food ingestion on psychophysiological behaviour and on the hedonic rating of odours, and to investigate the relationship between odour's affective valence and EEG asymmetry. The areas relating to olfactory psychology are reviewed in detail. Experiment 1 investigated the effects of the ingestion of a lunchtime meal and ambient food odour on the auditory oddball evoked potential. Marked P2(K) amplitude changes were associated with exposure to odour. In most cases, decreases in amplitude were obtained depending on the nature of the stimulus. Effects of meal ingestion were also found for P2(X) with the lunch group showing greater amplitude during the second (post-prandial) session than the unfed control group. A three-way interaction was obtained with the controls showing a significant decrease in P2(X) amplitude during the presentation of the odour of vegetable in the second session in comparison to the lunch group. No effect of odour on P300 amplitude was found. Experiments 2 and 3 examined EEG response to a variety of different actual and synthetic food odorants. Both experiments showed alterations in the theta frequency (in experiment 2, exclusively so). The effect of meal ingestion was variable with controls showing greater alpha activity than the lunch group during the second session in one experiment, but the opposite effect in the other. No alpha-related EEG asymmetry for pleasant or unpleasant odours was found in experiment 2 although asymmetries were obtained for the theta frequency. In experiment 3, however, intra-hemispheric alpha asymmetry was obtained for the most pleasant odour. No effect of lunch was found for the postprandial psychometric rating of food odour suggesting that negative olfactory alliesthesia may not be as robust a phenomenon as gustatory alliesthesia. The hypothesis is pul forward that the dominant EEG frequency for the processing of olfactory information is the theta frequency. It is suggested, however, that the effects found in this waveband may be related to the psychometric properties of the odour such as distractability and not due to the odour per se.
1
-CHAPTER 1~
OLFACTORY PSYCHOLOGY-AN INTRODUCTION AND OVERVIEW
"Taste, smell, as well as hunger, thirst, nausea and other so-called
'common ' sensations need not be touched on...as almost nothing
of psychological interest is known concerning them. "
William Jam es (1892), Briefer Course Psychology, p.69.
1.1. Psychology and the sense o f smell.
It has beeome a commonplace to suggest that the olfactory sense is the most neglected
of the human senses: James's conclusion to his chapters on the psychology of the
senses is not unique. As Engen (1983) noted a century on, " the sense of smell plays a
decisive social and sexual role for animals; its importance to humans is uncertain". The
ambiguity of the role of olfaction in altering human behaviour, and the ambivalence
accorded to it in the social, cultural and scientific domains has been documented in a
number of recent publications (Corbin 1986; Stoddart, 1990; Harrington and Rossario
1992). Although the amount of neural tissue devoted to the olfactory system is
considerable (Brodai, 1981; Price, 1985), the significance of this modality in normal

human communication and information processing has not commanded commensurate
importance.
The reasons for this neglect were indirectly summarised in Woodworth and
Schlosberg's (1954) Experimental Psychology. This generous account of the sense of
smell noted a number of psychological problems associated with the study of the
olfactory system including the measurement of the sense of smell, the nature of the
olfactory stimulus and the classification of odour.
One of the immediate problems lay in initial perception. Olfactory perception is a
highly subjective behaviour, especially when individuals are required to label odours
(Engen, 1987). Descriptors are commonly generalised adjectives based on some aspect
of the odour's quality. Odours, as Zwaaardemaker (1925) remarked, have no proper
names but are named after the substances that emit them. Descriptions are often
referential in that odours are described as fishy, minty, woody and so on. Scientific
classifications systems have attempted to crystallise such descriptors, describing odour
types which range from three (von Haller, 1763) to five (Amoore, 1952; 1962 a, b),
six (Henning, 1916) and seven (Linne, 1756) to eighteen (Rimmel, 1868). Although
none has been found to be completely acceptable, Amoore's (1962a, b) theory of
stereochemical bonding whereby five stereochemical bonding sites corresponding to a
particular odour class exist on olfactory cells, is the most widely, although not
entirely, accepted and practical of existing classification theories. A considerable
difficulty in studying a variable which is so lexically ambiguous is this relative inability
to classify and describe odours efficiently, if at all.
The relative inaccessibility of the olfactory system is also problematic. Most of what is
known regarding the process of olfactory information processing and transduction at
the neural level has been derived primarily from the study of non-primates (Getchell,
Bartoshuk, Doty & Snow, 1991). Sensory stimulation by odour normally results from
stimulation of the first cranial nerve by volatile odour molecules. The dendrites of the
projection neuron of the olfactory bulb -the mitral cell- synapse with the primary nerve,
sending axons in the lateral olfactory tract (the third and most extensive branch
extending from the olfactory bulb) to secondary brain structures in the "olfactory
cortex" (the anterior olfactory nucleus, the frontal and temporal prepiriform cortex and
the olfactory tubercle) where they form synapses with pyramidal cells. These cells, in
turn, project axons to other brain structures such as the thalamus, hypothalamus,
hippocampus and amygdala which provide feedback to the bulb and cortex. Eslinger,
Damasio & van Hoesen (1982) have noted that it it via these extensive connections with
cortical and subcortical structures that olfaction interacts with other sensory and motor
systems to influence behaviour. In a later section, this role of the limbic system in
olfactory perception and information-processing is considered in relation to the
involvement of the amygdala. This structure has been assumed to govern many aspects
of olfactory functioning from hedonic response to odour identification (Andy, Jurko &
Hughes, 1975; Hughes & Andy, 1979a, b)
Odours may also stimulate the fifth and largest cranial nerve, the trigeminus, which
reacts to stimulation by primarily tactile, nonolfactory stimuli such as heat, cold, pain
and chemical stimulation of facial membranes. The trigeminus, however, does not
appear be involved in the perception of the "aroma" of an olfactory stimulus but is
responsive to its chemico-tactile properties which explains the finding that detection of
certain odours may be possible in anosmic individuals (Doty, 1975b; Doty, Brugger,
Jurs, Orndoff, Synder & Lowry, 1978). Pinching (1977), for example, has suggested
that musks and floral odorants, what he regarded as "pure" olfactory stimuli, were the

most efficient at detecting anosmia and hyposmia in patients with head injury and hrain
tumours.
The neural mechanism for the processing of olfactory information in the olfactory nerve
and olfactory bulb has been thought to be transduction. Transduction takes place at the
receptor level, as one might expect, but information processing (such as odour
identification) may take place in the bulb and cortex (Freeman, 19X3). This information
processing is explained by reference to a spatial coding hypothesis which suggests that
individual receptors and neurons respond differentially to specific odours. Thus for
"each discriminable odour there is a subset of receptors that can respond to odour and
that these receptors have a pattern of spatial location in the nasal cavity that is unlike the
pattern for any other subset for another odour." (Freeman, 1983). Haherly (1985) has
similarly suggested an olfactory information processing role for the piriform cortex in
the form of a highly distributed ensemble code in which the olfactory cortex becomes a
content-addressable memory for the association of odour stimuli with memory traces of
previous odour stimuli (cf. Anderson, 1970; 1972). There is no conclusive evidence
to support such a theory, however, although it would appear to explain at least the
rudimentary aspects of olfactory information processing well.
Despite these recent observations, the conundrum of olfactory information coding still
exists. For example, it is still not fully understood how an odour is processed,,
recognised, differentiated and appreciated at the neural level. Some studies have
reported an idiosyncratic spatial bulbar EEG pattern to novel odours in the rabbit hut
have observed reliable changes in the pattern of the EEG when the odour has been
previously experienced (Freeman and Schneider, 1982). This finding suggests that a
spatial pattern arises in the bulb as a result of experience with a novel odour and is then
stored as a template and applied to the bulb when an odour search is initiated (Freeman,

1983). The "anticipated" odour will then produce a consistent EEG spatial
arrangement. A systematic investigation of this hypothesis has not yet been
undertaken.
A further puzzle lies in the localisation of the specific receptors responsible for the
reception of odours of different qualities, if, in fact, such selective olfactory
information processing exists at the receptor level. A number of theories have
purported to explain this process (Davies, 1971) but no one theory has fully accounted
for the precise nature of the olfactory mechanism. As Davies himself notes, "olfactory
theories are as numerous as pebbles on the beach." (Davies, 1971, p. 32.3). It is
probable that more than one type of protein molecule (which serves as receptor site)
exists on the membrane of each receptor cell (Buck & Axel, 1991 ) but there has been
little research to confirm this.
If little is known of the olfactory system at the "bottom-up" level, what is the state of
knowledge from the "top-down" approach, the avenue traditionally occupied by
psychology, psychophysiology and psychophysics? Here, considerable information
has come to light regarding the ability of odour to affect human psychological and
electrophysiological processes (Serby & Chobor, 1992). Psychological interest in the
sense of smell has largely focused on psychophysical aspects of odour and olfactory
perception. However, the most striking findings relating to odour and human behaviour
have emerged from an area which will be described here as olfactory psychology.
A relatively new branch of investigation, the primary focus of olfactory psychology is
the effect of exposure to odour on psychological processes-cognitive, emotional,
psychophysiological, appetitive, social and those relating to survival. It is a
multidisciplinary research endeavour and encompasses information from several

disciplines including neurology, social psychology, psychophysiology, cognitive
science and clinical psychology.
Historical and fictional illustrations of the ways in which odour is able to manipulate
emotion, mood and thought are legion (McCartney, 1968; Tisserand, 1977; Sheckley,
1978; Valnet, 1982; Lake, 1987; Suskind, 1985; Howes, 1987, 1988). Kipling, for
example, wrote of smell's ability to "make the heartstrings crack". Perfume companies
advertise fragrances with the aim of suggesting that their fragrance will effect a similar
result. The addition of odours to domestic and other commercial products attests to the
faith which manufacturers have in the ability of odour to affect the preference behaviour
of their customers. What is normally absent in these examples, however, is the
provision of any scientific verification. The illustrations have tremendous romantic
appeal and few would deny the potential of odour odour to affect mood, yet the
strongest evidence in support of the behaviour-altering effects of smell have been
anecdotal. However, a growing body of research now exists which documents the
specific effects of exposure to odour on a range of cognitive tasks, mood ratings and
social behaviours. A review of this literature will be presented in Chapter 2.
1.2. The human psychophysiology o f the sense o f smell.
In addition to the information from social and cognitive psychology, the relationship
between odour perception and brain response has provided a limited degree of new
information regarding the effects of olfactory stimulation on human perception (Lorig,
1989; Kobal & Hummel, 1991). The psychophysiology of olfactory perception has
witnessed something of a resurgence of interest in the past decade with a small body of
evidence highly suggestive of the role of smell in altering CNS behaviour, i.e., the
perception and sensation of smell and the information-processing involved in
recognising and responding to a smell may be reflected in the pattern of EEG activity.

This approach obviates the necessity of examining the olfactory system and its
connections with other brain areas directly but provides evidence of the ability of a
stimulus to bring about changes in the brain's electrical activity which differ
significantly from its basal state. Freeman (1991), for example, as noted above, has
suggested that changes in the olfactory bulb EEG reflects a template model o f olfactory
recognition and information processing. Other studies suggest a role for the human
EEG in reflecting olfactory perception and information processing (Moncrieff, 1962;
Lorig & Schwartz, 1988; Lorig, Huffman, DeMarlino & Do Marco, 1991; Martin,
1992; 1993b).
The majority of EEG studies has explored either the degree of activity in various EEG
wavebands during some form of cognitive, perceptual or affective task (Gale &
Edwards, 198.3; Ray & Cole, 1985; Davidson, Chapman, Chapman & Henriques,
1990) or the pattern of the EEG in specific psychological populations, often clinical
(Duffy, Burchfiel & Lombroso, 1979). Recently, it has become possible to use such a
technique to study the human psychophysiological response to odour. Studies of
human olfactory EEG have shown that, in particular circumstances, exposure to odour
can affect the activity of the central nervous system significantly, although variably
(Lorig, 1989). As noted in C hapter 4, the results from human EEG studies of
olfactory perception are often inconsistent, a finding which is largely due to
methodological differences between studies. Surprisingly, hardly any systematic study
has examined the role of food odour in modifying the pattern of the EEG. This
omission is unexpected given the importance of this odour in feeding and the
appreciation of food flavour (LeMagnen, 1971). Odour is the primary determinant of
food flavour in humans and appears to be significantly more important than taste
(Mozell, Smith, Smith Sullivan & Swender, 1969; Murphy, Cain & Bartoshuk, 1977;
Murphy & Cain, 1980). As the review in C hapter 3 notes, the role of odour in the

hedonic response to food may he critical to the acceptance of that food. This role,
together with the importance of odour in food appreciation in general, will he discussed
further in C hap ter 3.
Few studies, however, have examined the role of odour valence in affecting the EEG.
Recent evidence suggests that marked hemispheric EEG asymmetries may be obtained
to pictorial stimuli of different affective valence (Davidson, 1992). Greater frontal left
hemisphere activation is witnessed during exposure to stimuli rated as pleasant and
greater frontal right hemisphere activation is found during exposure to unpleasant,
disgusting stimuli. Such findings have been interpreted as representing the biological
substrates of affective processing by reflecting approach-withdrawal behaviour
(Wheeler, Davidson & Tomarken, 1993). In view of the robust affective qualities of
odour (Schiffman. 1992), one might expect to obtain similar EEG asymmetries to those
found with pictorial stimuli by employing olfactory stimuli if affective information is
perceived by the two senses are processed in a similar fashion. Processing of odour
has frequently been associated with the involvement with some of the subcortical
structures found in the limbic system (Takagi, 1989). If processing of an odour's
affective property is mediated by parts of the limbic system, it is arguable that the EEG
response will be different from that to visual stimuli whose processing relies less
heavily on these structures. This hypothesis assumes, however, that the limbic
system's involvement in processing odour is real and considerable and that the
subsequent neural connection between this system and the neocortex is also
considerable. In section 2.6.of C hapter 2, this hypothesis will be considered in
more detail. Whether odours perceived as pleasant and unpleasant are processed
asymmetrically has not been systematically investigated. This possibilty that the
pleasantness and unpleasantness or any other psychometric property of the odour may
generate significant EEG asymmetries will be considered in Chapter 4.

1.3. The aims o f the present thesis.
The experiments reported below are an attempt to answer some of the questions
considered above. The first question concerns the extent to which odour, specifically
food odour, may directly affect the human CNS (as measured by spontaneous EEG and
an oddball ERP paradigm). Previous studies have sought to answer this by employing
various odours and various methodologies thus often giving rise to contradictory and
inconsistent findings. In the present experiments, stimuli will be restricted to a
selection of food odours rated as pleasant or unpleasant. The importance of this
affective distinction is related to the a second aim of this thesis.
This role of "hedonics" in the appreciation of smell is the focus of the second question
addressed below. The odour of food is an affectively potent stimulus (LeMagnen,
1971; Pager, 1977). It has been found to sharpen appetite and increase salivation
(Logoff & Spieglman, 1987; Lee & Linden, 1990; 1992). Its appreciation may also be
affected by the nutritional state of the subject so that a hungry individual will rate it as
more pleasant than a sated one (Cabanac, 1971; 1979). More marked hedonic
responses can be seen to universally repellent odours (Dravnieks, Masurat & Lamm,
1984). The odour of spoiled food, for example, is a useful and potent stimulus acting
as an effective warning signal (Ro/.in & Vollmecke, 1986). Recent neuro- and psycho-
physiological evidence suggests that particular emotional experiences may he mediated
by different brain regions and may be associated with increases or decreases in EEG
activation in given brain areas (Davidson, 1984; 1992). Left frontal lobe lesions, for
example, have been found to flatten euphoria and result in depression (Gianotti, 1972);
frontal/anterior EEG alpha asymmetries are evidenced as a result of experiencing
emotion of opposing valence (positive versus negative) (Davidson, 1984; 1992). This
evidence suggests the possibility of measuring how the brain processes the hedonic

component of odour. The discussion included in Chapter 4 argues strongly that such
an approach is not only an obvious one but also highly logical.
The final question concerns the relationship between meal ingestion, EEG response and
hedonic rating of food odour. Would an odour rated pleasant before lunch, for
example, be rated as equally pleasant after lunch? Furthermore, if this is so, would the
asymmetries suggested above, occur as a result of this change in the hedonic rating?
Evidence suggests that the ingestion of food may alter brain metabolism and may affect
the appearance of certain components of the Event-Related Potential (Geisler & Polich,
1992a, b), described in Chapter 4. Related evidence suggest that the combination of
satiety and exposure to food odour may produce significantly different effects on the
EEG than the combination of hunger and exposure to food odour (Stacher, Bauer &
Steinringer, 1979). Thus, the present thesis seeks to investigate the
psychophysiological and psychometric responses to food odour before and after the
consumption of a meal. The experiments exploring this relationship will be presented
in C hapters 5, 6 & 7.
First, however, a critical review of the areas of olfactory psychology, and the effects of
food and odour on behaviour and the EEG is presented (C hapters 3-5). These
chapters critically evaluate current evidence in support of the effects of odour and the
consumption of food on cognitive, social and affective behaviour and review
psychophysiological techniques which may be able to measure and quantify these
responses more effectively. They will suggest ways in which it is possible not only to
study the effects of odour and food ingestion on Central Nervous System activity but
also suggest how different patterns of brain activity might be evidenced as a result of
experiencing different odours and as a result of experiencing different states of
nutritional satiety.

"That is horse piss anti rotted straw, he thought.
It is a good odour to breathe. It will calm my heart.
My heart is quite calm now."
Stephen Daedelus in Portrait of the Artist (1916)
by Jam es Joyce
2.1. Olfactory psychology: a definition.
A number of recent psychological studies have reported changes in human behaviour
as a result of exposure to odour. This new endeavour has attracted various
nomenclatures such as osmotherapy and, more germanely, aroma-chology (Green,
1988). Osmotherapy adequately describes an area examining the possible therapeutic
effects of odour but does not describe the effects of odour on non-health-related
behaviours. Aromachology is an unfortunate solescistic compound which makes little
morphological or semantic sense. The term 'olfactory psychology', introduced in

C hapter 1, will he employed here to describe those areas which examine the
psychological effects of exposure to odour. As noted helow, the effects of odour are
varied and often inconsistent hut suggest some role for odour in mediating aspects of
behaviour.
2.2. What is the use o f smell? Some social consequences.
Baron (1988) in a series of experiments designed to investigate factors affecting
interpersonal behaviour reported a number of changes in person perception and social
behaviour resulting from exposure to odour. Female confederates wearing perfume
and dressed informally for a (pseudo-) interview were rated as more romantic, friendly
and warm by male interviewers than were fragrant, formally-dressed women (Baron,
1981). Fragrant individuals were given lower intelligence and friendliness ratings by
male pseudo-interviewers than were non-fragrant individuals but not by female
interviewers (Baron, 1983). (Male interviewers also rated themselves as significantly
poorer interviewers when applicants wore perfume). Similarly, those fragrant female
applicants also emitting high levels of non-verbal behaviour were given less positive
ratings than their non-perfumed, low-level behaviour counterparts by male interviewers
(Baron, 1986). Contrary to the male subjects in Baron (1983), males rated the
perfumed applicants as more attractive than they did non-perfume-users. These male
subjects also recalled significantly less information about the perfume users than did
female interviewers.
These findings are particularly striking since they appear to suggest a potent role for
odour in modifying cognition. It is difficult to determine, however, what element of the
context, the fragrance or the user was instrumental in effecting these changes. For
example, post-experimental ratings of the odours on psychometric dimensions such as
pleasantness and strength might have helped eliminate hedonic and intensity factors. It
is arguable, for example, thal a strong and over-bearing perfume or a highly unpleasant
one may have radieally altered the assessment of the candidate. Thus it may not have
been the impression of "impression management" which resulted in the attribution of
negative characteristics but the perception of specific psychophysical properties of the
fragrance which are transferred to the fragrant subject.
Several other aspects of these studies raise important methodological and conceptual
questions. For example, Fiore (1992) noted that the floral fragrances used in Baron's
(1981) study and psychometrically rated in her own were those not associated with
"traditional male" traits compatible with job success (e.g., assertiveness) and may thus
have affected subjects' evaluations accordingly. It is not known whether the
confederates were blind to the aims of the experiments or how realistic were the
conditions in which the experiment took place. Furthermore, the employment of
different sexes as confederates and/or subjects makes it difficult to extrapolate the
results, all other factors remaining constant, to both males and females: Baron (1981)
used only female confederates and male participants (interviewers) whereas Baron
(1986) employed only female applicants. The studies have also focused on specific,
isolated elements of the 'interview situation' and manipulated those elements
exclusively. Other factors such as the "hard-to-get" phenomenon appear to play a more
critical role in the acquisition of employment opportunity and in the perception of
candidates as desirable (Williams, Radefeld, Binning & Sudak, 1993). These
reservations considered, however, the marked sex effects are not without some note.
They do, at least in some specific, well-controlled contexts, illustrate the hypothesis
that odour is capable of influencing impression formation, whether positively or
negatively. The question which then arises is: To what extent is it influential?

2.3. Olfaction: its common roles .
Olfaction plays a common, if limited, role in much of the repertoire of human
behaviour. Its traditional role as a natural caveat indicating the dangers of spoiled food,
fumes, gases and smoke and contributing to the appreciation of food flavour) attest to
the practical uses to which odour is put. As Milne and Milne (1962) remark :
"Without the mysterious nasal sense our meals would be dull ituleed-as though
we had a perpetual head cold. So long as we continue to get our nourishment
in the conventional way, rather than as pills to be swallowed untasted, the
human nose-of whatever size or shape-is here to stay" (p 145).
This "perpetual head cold" phenomenon is attributable to the nasal chemoreceptors and
nasopharyngeal receptors whose inability to function effectively results in temporary
anosmia. Individuals normally remark that the eaten food has lost its taste although if
asked to identify the taste of the food (as sweet, sour, salty and bitter) they are able to
do so. Identification of the actual food by mouth sensation alone, however, is
extremely difficult. When chemoreceptors are free to operate normally, food can be
smelled and identified (Patrick, 1899; Mozell, Smith, Smith, Sullivan and Swender,
1969; Jellinek, 1985; Lawless, 1991a). This function of odour will be returned to later
in C hapter 3.
A less well-documented use for odour is as an attractnnt. The use of odour in this way
is common in the animal kingdom where odour signals affect behaviour more
significantly than they do in the human kingdom (Stoddart, 1980; Alhone, 1984).
Attractants in the human kingdom, however, are not normally those secreted by sweat
glands but are artificial fragrances. A decade of research on the relationship between

human semiochemistry and attraction has yielded sparse and inconclusive evidence for
the existence of a human pheromone (Schaal & Porter, 1991; see Appendix E).
Casual observation would suggest that odours are thought to affect behaviour in an
instrumental way. Their use in commercial products to add "freshness" or to give the
attractive scent of X, Y, and Z flowers is widespread (Gibbons, 1986). For example,
leather odour is sprayed on seats of old motors, popcorn smell is dispersed in cinemas,
a faint scent is added to linen by some launderettes to create an "out-of-door freshness",
the odour of baking bread is pumped to the entrance of a supermarket to entice
customers (Selling by Smell, 1957; Elliott, 1962; Swallwell, 1990). This is the
contingent, "nonfunctional" use of odour: the specific use of an odour to enhance the
appeal or pleasantness of item. Whether such manipulations actually influence
behaviour, however, is questionable. A recent study has reported an increase in time
spent shopping at a large textile department store when certain odours permeated the air
with the odour exerting its optimum effect in the afternoon (Nixdorf, Teerling and
Koster, 1992). Carefully-controlled and designed studies, however, are few.
2.4. Olfactory influences on affect and cognition.
The majority of studies examining the effects of exposure to odour on mood and
cognition tend to use ambient odours in an environment where a subject completes a
particular perceptual or cognitive task, mood questionnaire or a rating scale. The
general effects appear to be variable, although performance on certain tasks is
particularly susceptible to the influence of smell. There also appears to be a difference
in the way that pleasant and unpleasant odours exert their effects on task performance
and mood, with unpleasant odours tending to produce negative effects and pleasant
odours, positive effects.

2.4.i. Learning, memory a nd cognition.
Memory for odour is markedly resistant to time, easily accessed and tends to he
characterized by a high degree of emotion, clarity and vividness (Laird 1935; Engen &
Ross, 1973; Hertz and Cupchik 1992). Odours used as retrieval cues, however, are
only moderately successful and appear to be no better or worse in enhancing
autobiographical retrieval than stimuli in other sensory modalities (Rubin, Groth &
Goldsmith, 1984; Martin, 1993b). It is possible that the presence of an olfactory
effect, but not olfactory superiority, in "Proustian" experiments may be due not to the
direct result of stimulation by an olfactory stimulus per se but to some form of
cognitive mediation such as the application of a verbal label. For example, equating
stimuli in designs requiring cross-modality manipulations is difficult. As Rubin et al
(1984) suggest, if two stimuli from two different sensory modalities are matched by
having the same referent, the links to memory may not be direct but may be mediated
through each other. Eich (1978) reported a facilitating effect of odour on word recall
only when the odour was mediated by a verbal association. Despite recent reviews of
the Proust phenomenon (Richardson & Zucco, 1989; Schab, 1991; Schab & Cain,
1991; Goldman & Seamon, 1992), there continues to be an absence of information
regarding the precise nature of this mechanism.
Other forms of cognitive improvement following odour exposure have been found on
photograph recognition (Huebner, Lyman & Hertel, 1992), slide recognition (Cann &
Ross, 1989) and word recall (Schab, 1990; Smith, Standing & deMan, 1992). This
latter finding has been attributed to a mechanism similar to encoding specificity
(Tulving & Thompson, 1973). Odour-related improvements have also been reported
on a Remote Associates Test (almond, muguet vs butyric acid: Ehrlichman & Bastone,
1991), and a 40-minute vigilance task (peppermint, muguet vs clean air: Warm,
Dember & Parasuraman, 1991). Impaired task performance during exposure to odour

has been found in menial arithmetic tasks (lavender: Ludvigson & Roltman 1989; traffic
air; Lewis, Baddeley, Bonham & Lovett, 1970), a vigilance/deteetion task (traffic air:
Lewis et al, 1970), and a visual detection/reaction time task (galaxolide: Lorig,
Huffman, Demartino & Demarco 1991).
Although this evidence would indicate an influential role for odour in positively and
negatively manipulating test performance, not all types of performance appear to be
influenced by olfactory stimuli. Tests of memory recall, vocabulary and mood using
lavender and cloves (Ludvigson & Roltman. 1989); a risk-taking test, an optimism-
pessimism test and an altruism test using muguet, almond, thiophene and butyric acid
(Ehrlichman & Bastone 1991) and the Torrance Test of Creative Thinking using
lavender, lemon or dimethyl sulphide (Knasko, 1992) have reported non-significant
results. The selective nature of the deficits in task performance observed in these
experiments suggests that exposure to odour will only be beneficial, or detrimental,
during the performance of specific tasks. Test of vigilance, for example, appear to be
highly susceptible to the beneficial effect of odour. Others such as mental arithmetic are
associated with relatively poorer performance. However, it is likely, given the
evidence regarding the hedonic properties of odour and from studies in the attention
literature, that task performance may be more affected by some odours than by others.
The discrepancy found between good and bad task performance may be attributed to
exposure to pleasant and unpleasant odours respectively.
For example, aversive sensory stimuli are known to selectively impair performance on
certain tasks. Unwanted or uncontrollable noise induces negative affect (eg, Konecni,
1975), negatively affects the hedonic ratings of odour (Winneke, Hedler & Koeppe,
1989) and impairs the accuracy of task performance as well as short-term memory (see
Dejoy, 1986; Jones & Broadbent, 1991 for reviews). Other aversive factors such as

anxiety, heat, fatigue and sleep loss have also been found to affect speed and accuracy
of performance (Broadbent, 1971; Davies & Parasuraman, 1982). Arguably, the
behavioural measure of this impaired performance is distraction (Broadbent, 1971).
The loudness or offensiveness of the stimulus is powerful enough to distract the subject
from the the task being completed which consequently results in poor performance.
The distraction in those tasks undertaken in the presence of odour may be due to the
psychometric properties of the odour. The literature suggests that two likely
psychometric candidates might be (i) odour intensity and (ii) the odour's hedonic
properties. The relationship between these two dimensions is strong. For example,
Doty (1975b) found that ten intense chemical odours were commonly rated as less
pleasant than their weaker counterparts. Similar effects have been reported by Henion
(1971) and Moskowitz, Dravnieks & Gerbers, 1974). A comparison of various
suprathreshold odorants, however, has found that some odours are rated as
distinctively different in pleasantness from others (Dravnieks el al, 1984; Pangborn,
Guinard & Davis, 1988).
2.4. ii. Alteration o f affective and expressive response to odours.
Brewin (1988) has noted that the term "affect" refers to a broad number of descriptive
categories including mood, feeling, attitude, preference, evaluation and emotion. The
consensus among emotion theorists is that emotional responses are characterised as
brief, organized, difficult to control and involve complex patterning across a number of
different cognitive systems (Ekman 1982; Izard, 1977; Davidson, 1984). Mood,
conversely, is characterized by a much longer latency of response (which may last from
an hour to many days).
The salience of affect in olfactory perception has been explicitly described in early
studies by Beebe-Center (1930; 19.32). Judgements of olfactory stimulation are

normally made along a pleasantness-unpleasantness axis with the factors of intensity,
identifiahility, familiarity and experience additionally modulating the subject's affective
response to an odour (Doty, 1975b; Moskovitz, Dravnieks & Klarman, 1976;
Moskowitz, 1978; Engen, 1982). A recent review has suggested that the affective
component is the most common factor in Factor- and Multi- Dimensional Scaling
analyses, concluding that these scaling and judgement procedures demonstrate the
"saturation of odor experience with hedonic tone" (Ehrlichman & Bastone, 1992).
Although evidence would suggest that this is a plausible interpretation, the assumption
that the hedonic component is the dominant dimension has been criticised for the limited
range of odorants that these MDS studies employ (see, e.g., Carrasco & Ridout,
1993).
Throughout the odour pleasantness literature there is reference to the hedonic quality of
smell. The term "hedonic" is frequently used in psychological studies, describing
responses in areas as diverse as experimental aesthetics and appetitive behaviour. A
concrete definition of the term, however, is less apparent: Its validity has not been
questioned, largely because of its usefulness as a descriptive dimension. Primarily,
however, any hedonic scale evaluates a stimulus along a pleasant-unpleasant
dimension. Although the subjective nature of odour pleasantness has been evident in
the literature on psychophysics, there do appear to be some odours which elicit
stereotypical responses (Dravnieks et al, 1984).
2.4. a) Field experiments.
Explicit effects of unpleasant odour on behaviour have been reported in a number of
studies of environmental pollution as well as in laboratory, task-based experiments.
Dravnieks et al (1984) list the hedonic descriptors of over a hundred common odorants
with most of the expected unpleasant odours given low hedonic tone ratings.

Unpleasant smells emanating from rotting food, meat and vegetable plants, rubbish
dumps, landfill gas, pulp and paper mills, polluted watercourses, chemical and oil
plants, cigarette smoke and diesel vehicles are common olfactory irritants (Goldsmith,
1969; Lindvall & Radford, 1973; Cederlof, 1964; Flesh, Burns & Turk, 1974; Ury,
Perkins & Goldsmith, 1972; Cain, Leaderer, Isseroff, Berglund, Huey, Lipsitt &
Perlman, 1983; Cram & Parkinson, 1992; Ziem & Davidoff, 1992; Shuslerman, 1992;
Tucker, Leaderer, Molhave & Cain, 1992). Bell, Schwartz, Petersen & Amend (1992)
report that two-thirds of the 620 students tested in their survey reported feeling ill
whenever they smelled one or more of five environmental chemicals. Knasko (1992)
found that a group exposed to the odour of lemon reported significantly fewer
symptoms of ill-health than a group exposed to unpleasant dimethyl sulphide.
Notable changes in behaviour have been associated with non-laboratory environmental
"olfactory" factors: Decreased attendance to a zoo and an indoor museum has been
reported during high levels of oxidant and carbon monoxide (Chapko & Solomon,
1976), whereas lower exam scores and increased anxiety levels have been found in
non-smokers exposed to tobacco smoke (Kidd, 1973; Jones, 1978). The detrimental
effects of tobacco smoke on the mood and behaviour of non-smokers has been widely
documented (Weber-Tschopp, Jermini & Grandjean 1976; Jones & Bogat, 1978;
Zillmann, Baron & Tamhorini, 1981; Moschandreas & Relwani, 1992).
2.4. b) Laboratory-based experiments.
The undesirable effects of malodour in laboratory-based studies have been found by a
number of authors (Rotton, Frey and Soler, 1978; Rollon, Frey, Barry, Milligan and
Fitzpatrick, 1979; Rollon, 1983; Ehrlichman and Halpern, 1988). Increases in the
individual's negative behaviour and mood are normally associated with the subject's
exposure to a foul-smelling odour. Subjects exposed to an unpleasant smell are also

more inclined to rate similar strangers more highly than they would dissimilar strangers
(Rotton et al, 1978; 1979). Rotton (1983) reported that women rating paintings and
black and white photographs in a room polluted with ethyl mercaptan gave significantly
lower scores of "well-being" to the photographs and judged the pictures to be less
professional and less worthy (but no less tasteful) than did subjects in an unpolluted
room. These subjects also reported lower feelings of pleasure and levels of arousal
than subjects in the air-conditioned room. In Rotton's (1983) study, the longer the
exposure to the malodour the less pleasure was taken in completing the task. This again
would indicate the generation of negative affect by an aversive stimulus. Subjects
detected fewer proof reading errors in the polluted room but detected more when moved
to an unpolluted room. Following this experiment, subjects were taken to another
unpolluted room and asked to solve a series of puzzles, the first and second of which
were insoluble (a measure of frustration). Those exposed to the malodour attempted
fewer puzzles after a thirty minute exposure to the odour.
The opposite effect, whereby a pleasant odour enhances affect and performance has
been reported (Baron, 1990). Subjects undertaking a negotiation task in a room
sprayed with a pleasant-smelling air freshener reported setting significantly higher
negotiation goals and rated their estimated self-efficacy much higher than subjects in an
unscented room. These subjects also indicated that they would attempt to attain a higher
share of available funds. In practice, subjects in the scented environment gave away
slightly more monetary concessions and reported weaker tendencies to resolve future
conflict through avoidance and competition than did those in the non-scented room.
They did, however, rate themselves as more positive, pleasant and good, a finding
which may be related to evidence suggesting that elevated positive affect increases
confidence in one's ability or judgement (Williams & Keating, 1987). These subjects
also had high expectations of themselves and of their performance. Similar effects on

mood have also been obtained with the odour of chamomile. This odour was reported
to reduce self-reported negative mood significantly in comparison with an inert placebo
in female subjects asked to visualize negative scenes (Roberts and Williams, 1092).
Subjects also tended to think that there had been more positive than negative images
presented during the chamomile condition.
Experiments requiring subjects to generate memories to neutral words during exposure
to pleasant and unpleasant odours have found that memories were significantly happier
if retrieval took place in the presence of a pleasant odour (almond) than an unpleasant
one (pyridine) (Ehrlichman & Halpern, 1988). However, the linguistic associations
with almond may have been stronger than those to pyridine so that the memories may
thus have been cognitively rather than affectively mediated. An unpleasant, identifiable
odour may thus generate a significant number of neutral or unhappy memories since
both odours used-pleasant and unpleasant- would be of "equal" cognitive status.
Aggression has also been found to be affected by exposure to odour. Angered males
exposed to the perfume of "Jungle Gardenia" have been found to express a significantly
higher level of anger towards a female provocateur that did those exposed to no-odour
or a pine-scented aerosol (Baron, 1980). The odour which the subject's perceived,
however, was presented not via the confederate but on an instruction form in front of
the subject. Whether the subject extended this odour to the confederate, therefore, or
simply disliked the odour before him is unclear. Baron concludes that these results
demonstrate that the "unquestioning faith in the benefits of perfume, cologne and
similar products does not seem justified." It is notable, however, that the amount of
aggression in the condition where subjects were exposed to an aerosol freshener-a
similar product?-did not differ significantly from that of controls. This would suggest

that the findings are perfume-specific rather than general, a point which needs to he
addressed in future investigations.
In conclusion, it would appear that odour is capable of influencing mood and cognition,
negatively and positively. Its influence, however, is task- and odour- specific. Some
studies have reported no effect of odour on particular tasks such as creativity and
optimism-pessimism or have reported methodologically-based inconsistent findings.
2.5. A caveat.
Despite the evidence that odour may change mood and ways of thinking, not all studies
which report odour-related psychological changes have used genuinely olfactory
materials. Slosson (1899), for example, reported that an audience believed that a bottle
of odourless water opened in front of it had a strong and peculiar odour when told that
the water emitted these characteristics. Similarly, O'Mahoney (1978) persuaded a
number of television viewers that they had smelled an odour in response to tones
produced by a machine which the television programme duplicilously claimed would
induce sensations of an odour. A large number of false alarms in subjects who claimed
to be able to detect an odour when none was presented has also been reported (Engen,
1965). More recently, Knasko and Gilbert (1991) found that subjects who were told
that odourless water sprayed before them was pleasantly-scented reported a more
pleasant mood than subjects who were told that the same spray was unpleasant.
Subjects in the unpleasant condition also reported significantly more symptoms of ill-
health than subjects in the pleasant condition. Thus, it would appear from these studies
that the individual's hedonic perception of an "odour" is highly malleable even when
there is in fact no odour to process. The "placebo effect" is strong (Critelli &
Neumann, 1984). (This influence of the placebo in so-called aromatherapy studies,
and the effect of odour on health is considered in Appendix F)

2.6. Summary o f the behavioural effects o f odour and a mention o f the
lim bic system.
The evidence reviewed in the proceeding section supports the hypothesis that exposure
to odour is able to selectively impair or enhance task performance, alter social
behaviour and bring about changes in mood. One possible mechanism for the alteration
as noted in section 2.4.i. may be related to an attentional executive which is affected
by extraneous variables or by the individual's interpretation of the odour's hedonic
quality, the importance of which was reviewed in section 2.4.H.
In relation to this hedonic interpretation, an alternative and common explanation for the
affective response to olfactory stimuli has implicated the limbic system and its -and
especially the amygdala's- neural associations with the olfactory system (see. e.g.,
Benignus and Prah 1982; Lorig and Schwartz, 1987; King, 1988; Long, 1989; Bell.
Miller & Schwartz, 1992). A number of authors cite this collection of sub-cortical
structures as representing the brain's putative "emotional centres" (lssacson, 1974).
The neurophysiological argument for its role in olfactory perception is a persuasive
one. Since an odour may elicit strong emotional responses, since olfactory afferents
from the lateral olfactory tract project to the cortical and medial amygdaloid nuclei, since
the amygdala is "directly" linked to the olfactory bulb, olfactory association cortex,
thalamus, hypothalamus and hippocampus (Motokizawa, 1985) and since this structure
has been postulated to mediate responses to emotional stimuli (Aggleton and Mishkin,
1986), then the limbic system plays some role in the interpretation and processing of
olfactory stimuli.

This model is by necessity, however, crude since the extent of the impairment in
olfactory perception, identification, or affective response which occurs with damage to
these areas in humans is largely unknown. The limhic system's involvement in the
management and mediation of emotion is commonly cited as one of the system's
principal functions (see Aggleton, 1992 for reviews). Kelley & Slinus (1984) have,
however, observed that there is often a tendency to oversimplify the involvement o f the
limhic system in the mediation of emotional processes. Most studies examining the
amygdala's involvement in olfactory stimulation are based on animal responses.
Tanabe, lino & Takagi (1975), for example, report successfully recording single-cell
responses to odours in the medial portion of the amygdala in the old world monkey.
Anatomical investigations have shown that only the nucleus of the olfactory tract, the
cortical nucleus and amygdaloid transition areas receive secondary olfactory fibres
(Girgis, 1969) although Price (1985) using the antero- and retro-grade axonal tracing
technique reports extensive inputs from the primary olfactory cortex to the superficial
nuclei of the amygdala (the anterior cortical amygdaloid nucleus and periamygdaloid
cortex), the thalamus (only if the tracer injections involve the neutral endopiriform
nucleus deep in the piriform nucleus or similar deep layers in the anterior cortical
amygdaloid nucleus), the hypothalamus (throughout the rostrocaudal extent o f the
lateral hypothalamus and at the premammilliary nuclei level) and the hippocampus in
rats. Furthermore, Swann (1934) and Allen (1941) report that rats and dogs continue
to retain the ability to olfactorily discriminate after bilateral destruction of the amygdala.
Human studies are not particularly indicative of a more specific role for the amygdaloid
complex in olfactory perception although some olfactory effects have been reported.
Hughlings-Jackson and Stewart (1899), for example, associated disease of the right
temporo-sphenoidal lobe with warnings of smell sensations in epileptic attacks.
Penfield (1958) noted that electrical stimulation of the uncus and amygdala produced
odour sensations in conscious patients although these studies have been criticised for
the relatively small number of subjects who responded to stimulation (Loftus & Loflus,
1980). Hughes, Hendrix, Andy, Wang, Peeler & Wetzel (1972) reported transient
increments in indifferent hedonic judgements of odours following bilateral amygdaloid
lesions. Patients presenting olfactory seizures, hallucinations or auras have been
found to experience no recurrence of olfactory disturbance after amygdalectomy
(Chitanondh, 1966; Andy, Jurko & Hughes, 1975). Halgren, Babb, Rausch &
Crandall (1977), recording from neurons in the basolateral nuclei of the amygdala,
entorhinal cortex and hippocampus failed to find responses to a variety of odorants
whereas Hughes and Andy (1979b) reported a decrement in the judgements of odour
intensity and a greater number of errors in identifying classes of odours following
amygdalectomy. In patients with right temproalobeetomy where the amygdala is
removed, the performance of a retrieval task requiring the memorisation of odours was
significantly poorer than that of left temporalohectomy patients. These patients,
however, also performed badly on standard intelligence tests of nonverbal memory
(Rausch, Serafitides & Crandall, 1977) which suggests that the memory impairment
was not modality-specific. The evidence from the Hughes and Andy (1979b) study is
difficult to interpret since it is unclear how much the removal of other brain tissue
contributed to the deficits reported. Unilateral and bilateral removal of the anterior and
posterior temporal cortex, with or without the amygdala, has been known to be
associated with deficits in olfactory identification and discrimination (Potter & Butters,
1980; Eskenazi, Cain, Novelly & Friend, 1983; Jones-Gotman & Zatorre, 1988 a, b).
Whether Hughes and Andy's findings therefore reflect the functioning of the amygdala
or the temporal cortex is unclear.
It is clear, however, that the relationship between amygdaloid deficits and their
olfactory consequences is, at present, ambiguous. However, there is a possibility that

other limbic structures including dorsal and ventral parts of the medial thalamus and the
so-called Pape/, circuit of the hypothalamus (Pape/, 1937; Nashold & Wilson, 1970),
are involved in the processing of an odour (Pfaffmann, 1960; Davis & Eichenbaum,
1992), an obvious assumption when one considers the apparently extensive neural
pathways leading from the olfactory bulb to these areas.
This is not to argue against some role for the amygdala in mediating the hedonic
component of olfactory perception nor to deny its role in the regulation of emotional
behaviours. It is possible that there is specific involvement of the amygdala in olfactory
perception but at present there appears to be little direct evidence to support such an
association from the human literature. It is important to consider this shortcoming since
many studies cite this structure as responsible for the association between olfactory
perception and affective response. As Lawless (1991b) remarked,
"students o f Proustian nostalgia need to transcend gratuitous statements
about smell and the limbic system and to search for mechanisms,
either on a psychological or physiological level, which will help
predict the circumstances under which nostalgic recollections occur." (p .383).
One possible method of transcending general associations between variables is by
exploring replicable metabolic or psychophysiological aspects of olfactory perception in
normal, healthy subjects. Volumetric measurement of MRI scans of the amygdala and
hippocampus separately during odour-related tasks, for example, is now possible
(Watson, Andermann, Gloor, Jones-Gotman, Peters, Evans, Olivier, Melanson &
LeRoux, 1992; Jones-Gotman & Zatorre, 1993). The EEG and ERP techniques can
provide access to examining the quality of general brain-behaviour relationship at the
cortical level. The use and development of the Olfactory Evoked Potential has provided

some interesting data regarding the speed and integrity of the electrophysiological
processing of odour. Studies have focused on odour strength as well as its hedonic
properties (Kobal & Hummel, 1991). This relationship between the activity of the
brain and olfactory perception and the usefulness of EEG techniques to examine the
sense of smell is discussed in Chapter 4.
In the following chapters, attention will focus on the effects of a specific type of odour
-food odour- on behaviour, principally appetitive behaviour. The effect of food
consumption on mood, cognition and on the hedonic ratings of food-related stimuli will
also be considered. The effect of food consumption on the pleasantness rating of
subsequent meals has been widely demonstrated (Rolls, 1986). Little is known,
however, regarding a meal's effect on the perception of food odour. C hapter 3
considers this possible modification of a food odour's hedonic rating al ter the ingestion
of a meal.

2 9
-CHAPTER 3-
FOODS AND THEIR ODOURS- THEIR EFFECTS ON CONSUMPTION AND
BEHAVIOUR
"...the pleasure o f smell proper, and o f taste proper, has a
tendency to satisfy the mind, yielding contentment rather than
craving. This is to he a pure emotion...A savoury smell may
partly give a commencing pleasure o f digestion, and partly bring
out into keenness and relief the sense o f hunger; in either case it
would fire the energy o f pursuit towards the full fruition."
Alexander Bain (1855), The Senses and the Intellect. p i67/170.
3.1. The psychological usefulness o f food: behavioural effects.
Historically, the ingestion of food has been associated with changes in a variety of
behaviour-from those foods containing psychoactive amines to apparently innocuous
substances such as chocolate, cheese and caffeine (Fredricks, 1976; Robinson, Lawler,
Chenoweth & Garwick, 1986). The recent emphasis on the role of food in behaviour
has focused on the respective roles of carbohydrates, proteins and caffeine in altering
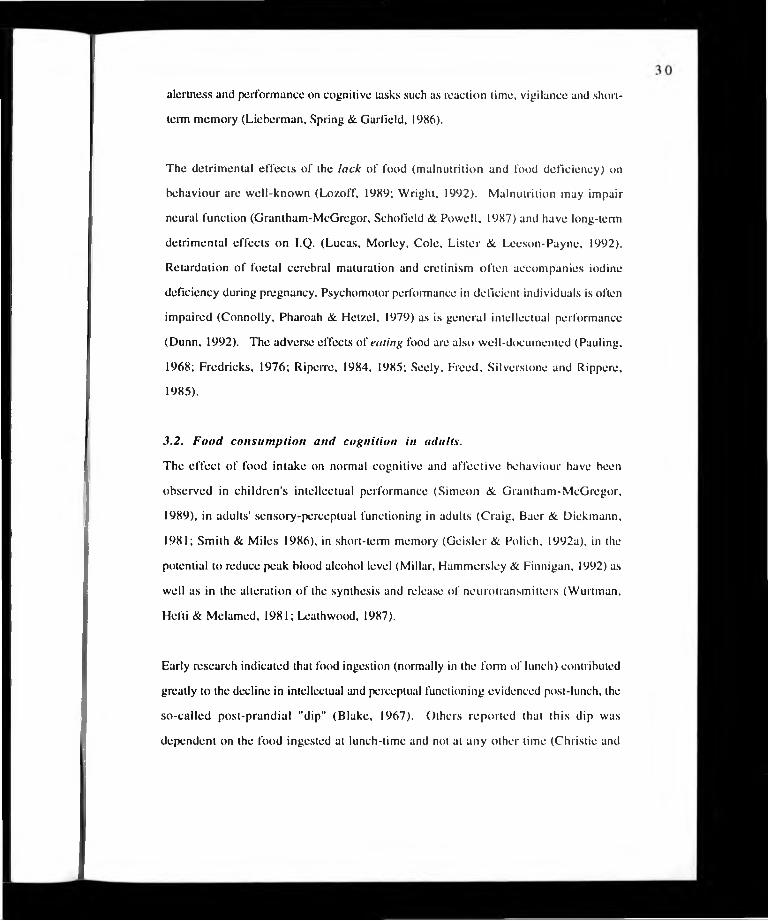
alertness and performance on cognitive tasks such as reaction lime, vigilance and short
term memory (Lieberman, Spring & Garfield, 1986).
The detrimental effects of the lack of food (malnutrition and food deficiency) on
behaviour are well-known (Lozoff, 1989; Wright. 1992). Malnutrition may impair
neural function (Grantham-McGregor, Schofield & Powell, 1987) and have long-term
detrimental effects on I.Q. (Lucas, Morley, Cole, Lister & Leeson-Payne, 1992).
Retardation of foetal cerebral maturation and cretinism often accompanies iodine
deficiency during pregnancy. Psychomotor performance in deficient individuals is often
impaired (Connolly, Pharoah & Hetzel, 1979) as is general intellectual performance
(Dunn, 1992). The adverse effects of eating food are also well-documented (Pauling,
1968; Fredricks, 1976; Riperre, 1984, 1985; Seely, Freed, Silverstone and Rippere,
1985).
3.2. Food consumption and cognition in adults.
The effect of food intake on normal cognitive and affective behaviour have been
observed in children's intellectual performance (Simeon & Grantham-McGregor,
1989), in adults' sensory-perceptual functioning in adults (Craig, Baer & Diekmann,
1981; Smith & Miles 1986), in short-term memory (Geisler & Polich, 1992a), in the
potential to reduce peak blood alcohol level (Millar, Hammersley & Finnigan, 1992) as
well as in the alteration of the synthesis and release of neurotransmitters (Wurtman,
Hefti & Melamed, 1981; Leathwood, 1987).
Early research indicated that food ingestion (normally in the form of lunch) contributed
greatly to the decline in intellectual and perceptual functioning evidenced post-lunch, the
so-called post-prandial "dip" (Blake, 1967). Others reported that this dip was
dependent on the food ingested at lunch-time and not at any other time (Christie and

McBearty, 1979; Hammer, 1951). The argument followed that ingestion during this
period served to satisfy the hunger that peaks at this time of day. Hildebrandt, Rohmert
& Rutenfranz (1975) and Colquhoun (1971), however, suggested that this decline is
not in any way food-related hut is largely due to diurnal variation, and more
specifically, body temperature. Furthermore, Christie and McBearty (1979) also report
that that the extent of the dip may be governed by personality factors-the extent of the
dip was greatest in the more stable and extraverted individual; the more neurotic and
unstable individuals were not inclined to exhibit the dip to any great extent. Craig et a!
(1981) examined the hypothesis that personality may affect psychological response to
food ingestion and found that, indeed, the less neurotic and more extrovert individuals
performed significantly worse on a discrimination efficiency task than their more
unstable and introvert counterparts after ingestion of lunch. Needless to say, those
individuals who ingested the lunch also showed a significant decrement compared with
those simply taken for a walk and not given lunch. The authors suggest that the post
prandial dip witnessed in this study is comparable to the effect of a complete night
without sleep. The duration of this dip was not measured.
A few other studies are generally supportive of the view that ingestion of a lunchtime
meal selectively impairs cognitive performance. Decrements in reaction time, mental
arithmetic and vigilance tasks have been reported following the ingestion of lunch
(Blake, 1971) as have impairments in sensory detection performance (Craig, 1986;
Smith and Miles, 1986), although the latter of these studies, however, allowed
smoking, the free-ingestion of caffeine and the free selection of food type and size.
Geisler and Polich (1992a) have reported increases in recall for words recently
presented (thought to be a measure of short-term memory) in those subjects who had
performed the task immediately after eating lunch. These scores differed significantly
from pre-lunch and 30 minutes post-lunch conditions. Smith (1992), reviewing the

available evidence concerning the effects of food on behaviour and psychological
performance, concluded that post-lunch impairments are likely to be found in tasks
requiring sustained attention but not in shorter tasks. Breakfast consumption has little
effect on sustained attention but may improve other aspects of memory. The results,
however, am suggestive rather than conclusive. The post-prandial impairments may be
dependent not only on ingestion but also on personality factors, the availability o f
stimulants and the size and nature of the meal.
3.3 N utrient-specific impairment?
The Haw in the Smith and Miles (1986) study (that meals were freely selected and not
under strict experimental control) has been highlighted by various studies in the 1980s
purporting to demonstrate specific-food-related alterations in mood and performance.
These generally concluded that carbohydrates and proteins evinced different effects on
mood and intellectual functioning (Wurtman, 1986; Lieberman, Spring & Garfield,
1986). Spring, Mailer, Wurtman, Digman and Co/.olino (1982/3), for example,
reported that a high-carbohydrate lunch was significantly associated with impairment in
a sustained attention task (dichotic shadowing) compared with those receiving a high-
protein turkey lunch but for older subjects only. Animal studies showed that different
nutrients evoked different behaviours depending on the specific nutrient consumed
(Fernstrom & Wurtman, 1971; Fernstrom & Wurtman, 1972; Wurtman. Hefli &
Melamed, 1981). When serotoninergic neurotransmission at brain receptor sites
increased, changes in food intake and selection occurred. The principal mechanism
governing these nutrient-related behavioural differences appeared to be precursor
availability (tryptophan, a large neutral amino acid) and its influence on the synthesis
and release of neurotransmilters.

Tryptophan administered in pure form increases levels of serotonin, is reported to be
significantly correlated with increased drowsiness and lethargy and increases the onset
of sleep (Hartman & Elion, 1977; Hartman & Spinweber, 1979; Lieberman, Corkin,
Spring, Growdon & Wurtman, 1982; Lieberman, Corkin, Spring, Growdon &
Wurtman, 1983; Spinweber, Ursin, Hilbert & Hilderbrand. 1983) although one study
has reported female-only effects (Spring, Mailer, Wurtman, Digman & Cozolino,
1982/3) and others have failed to find any tryptophan-dependent induction of sleep and
drowsiness (Nicholson & Slone, 1979; Hartmann, Lindsley & Spinweber, 1983).
Carbohydrate foods, although containing no tryptophan, can increase brain levels of
this precursor levels (Leathwood, 1987; Lieberman, 1987).
Although tryptophan may induce drowsiness and mental sluggishness (Yuwiler,
Brammer, Morley, Raleigh, Flannery and Geller, 1981), increase fatigue and reduce
vigour and alertness (Lieberman et al, 1982), there is little evidence to suggest that its
consumption impairs psychomotor tasks (Lieberman et al, 1982). There are some
tasks, however, that appear to be susceptible to the influence of carbohydrates.
Lieberman (1987) has argued that "since more tryptophan is available for transport into
the brain, carbohydrate meals can increase brain serotonin. The effects of a
carbohydrate meal thus can resemble those following the administration of pure
tryptophan" (p271), presumably those of inducing drowsiness and blunting alertness.
The effects of protein/tyrosine on behaviour (mood and task performance) arc less
clear. Studies using alertness, sleepiness, RT scores and inertia measures have found
no effects of protein/tyrosine (Lieberman et al, 1982/3; Leathwood & Pollet, 1982/3;
Spring et al, 1982/3) although older subjects reported greater tension and less calm after
a protein than carbohydrate meal (Spring et al, 1982/3). The implication of this finding
is unclear.

Significantly lower reaction times has been reported one and three quarter hours al ter a
carbohydrate lunch than after a protein lunch whereas no effect of carbohydrate on a
dichotic listening test was reported (Lieberman, Spring and Garfield, 1986; cf. Spring
et al, 1983). Spring, Chiodo and Bowen (1987) suggest that the RT effect may have
been attributable to the employment in the Lieberman et al study of four limes as many
trials and intervals which were half as long as those in the Spring et al study and further
suggest that, as a consequence, the Lieberman study may have yielded more reliable
scores. A Digit-Substitution test revealed significantly worse performance three and a
half hours after a carbohydrate meal compared with a protein meal (Lieberman et al,
1986). No differences, however, were found for the Wilkinson Vigilance Test, a four-
choice reaction lime lest, a card sort task or a tapping test. The criticism has been made
that not all tests of vigilance are equivalent (Lieberman et al, 1986). The discrepancies
found in several of these studies may, therefore, not be considered unusual or
unexpected. No psychonutrition research has yet explained in any detail why some of
these vigilance tests should exhibit food-dependent effects while others do not.
The conclusion of cognition-consumption studies, therefore, is that food ingestion may
affect the performance of specific tasks, usually those requiring attention and normally
results in performance deficits. In the following section, the effect of food ingestion on
a different form of behaviour, affective response, is considered. Together with the
evidence from the cognitive literature, this aspect of behaviour indicates a significant
role for food and food odour in affective response and cognitive functioning.
3.4. Pre- and post-prandial response to fo o d odour.
A great emphasis has been placed on the role of food aroma in the mediation and
precipitation of behaviour. Vonderahe (1943), for example, suggested that "the first
emotional state, that of being attentively alert and ready for action, in the pursuit of food

or for flight or for mating, appears to grow out of olfactory perception". Physiological
changes such as alterations in human hlood glucose level (Bassi & Pascucci, 1942;
Caniggia & Brogi, 1947), gastric contractions (Ginsberg, Feldman & Necheles, 1948)
and salivation (Legoff & Spieglman, 1987; Lee & Linden, 1990; Lee & Linden, 1992)
have been reported to occur with exposure to food odour. Secretion of saliva and
gastric and intestinal juices depend greatly on olfactory and gustatory reflexes
(Bergman & Bergman, 1986).
A small number of studies have shown that the affective response to the taste, smell and
consumption of a food may change markedly after the ingestion of a meal, usually
lunch (Duclaux, Feisthauer and Cabanac, 1973; Cabanac and Fantino, 1977; Rolls,
Hetherington, Burley & van Duijvenvoorde, 1986). Duclaux et til (1973), for example,
asked 10 subjects to rate the pleasantness of food odours (beef-bouillon, cheese, fish,
honey), meal-related odours (tobacco, wine, coffee) and non-food odours (lavender,
Encre de Chine) before and after the ingestion of a meal (bread, butter, ham. chips,
sugared milk and orange). A control group of ten subjects did not receive a meal.
Those in the meal consumption group rated the odours of cheese, beef and fish as
significantly less pleasant than controls (negative allieslhesia, see section 3.4.) hut
there was no alliesthesia reported for the non-food odours or for the meal-related
odours in cither group.
Olfactory thresholds also appear to he affected by the ingestion of a meal, with acuity
showing a decrease after lunch. Some authors suggested that appetite varied directly
with acuity of the olfactory sense and could thus be measured in terms of olfactory
thresholds, demonstrating in a number of studies that diurnal variations in olfactory
acuity were "intimately connected" with ingestion of food (Goet/.l and Stone, 1947;
Goetzl and Stone, 1948) over a number of days (Goet/.l, Abel and Ahokas, 1950),

decreased by ingestion (but not taste) of sugar but not by intravenous administration of
glucose (Goetzl, Goldschmidt, Wheeler and Stone, 1949). Similar findings were
reported elsewhere using coffee as an olfactory stimulus (Guild, 1956; Hammer, 1951)
although Janowitz and Grossman (1949) found no food-related changes in acuity for
coffee or any relationship between appetite suppression (by D-amphetamine) and
performance of the gusto-olfactory senses. Goetzl et al (1950) suggest that this
"occasional failure to demonstrate a significant decrease in olfactory acuity following
ingestion of the noon meals may have to be explained in part by a failure of the meal to
produce a sensation of satiety." (p 561). Others, however, note that the lowering of
the olfactory threshold during hunger is present in some individuals but is absent in
others (Furchtgott & Friedman, I960; Berg, Pangbom, Roessler & Webb, 1963).
3.5. Alliesthesia and the concept o f sensory-specific satiety.
Several factors contribute to food flavour, including odour, taste, texture, temperature,
manageability, appearance, context and mood (Lawless, 1991a), as illustrated in Fig
A. These factors are all important determinants of food flavour although some appear
to be more important than others (Rozin & Vollmeeke, 1986). As noted in Chapter
2, when the nasal chemoreceptors including nasopharyngeal receptors are impaired or
blocked, identification of food is difficult (Mozell et til 1969; Murphy, Cain &
Bartoshuk, 1977; Hyman, Mentzer & Calderone, 1979; Murphy & Cain, 1980).

37
Fig. A. represents the primary determinants o f food flavour.
A series of studies in the 1950s and 60s employing anosmies and hyposmic subjects
tended to contradict this view although these studies did not monitor the extent or
"completeness" of the anosmia, control for the use of extra-chemorecepiory clues and
may not have undertaken accurate sensory evaluations (Clark, 1968; Clark & Dodge,
1955a,b). As Mozell et al (1969) argue, "these patients cannot a priori he treated as
simply normal people minus the vapor-sensing input." Later, mechanically effected
impairments of the nasopharyngeal receptors demonstrated that without these working
receptors, the ability to identify the flavour disappears. The ability to describe the food
in terms of its taste categories, however, remains intact. Thus the importance of the
olfactory component in food appreciation cannot be underestimated.

In recent years, it has been argued that the internal, nutritional stale of the subject is
important not only to the individual's decision to acquire and ingest food but also to the
hedonic rating of food-related stimuli such as smell and taste (Cabanac, 1979; Rolls,
Rolls & Rowe, 1983; Johnson & Vickers, 1992). This idea is not a novel one:
Aristotle noted that the smell of food odours are " pleasant when we are hungry, but
when we are sated and not requiring to eat, they are not pleasant. " (Ross, 1906). If
subjects swallowed sugar solutions and were asked to rate sweet items, the
pleasantness of sweet tastes declined; rinsing the mouth with sweet solutions did not
affect the hedonic response (Cabanac, 1971). The odour of orange syrup was found to
be pleasant to fasting subjects and remained pleasant when repeatedly presented.
Following glucose ingestion, however, its pleasantness rating declined significantly.
Thus it was argued that a "stimulus can be perceived as either unpleasant or pleasant
depending on signals coming from inside the body" (Cabanac. 1971) and the term
"alliesthesia" was used to describe the phenomenon. Although few experiments have
examined this concept in any detail, the studies which exist broadly support the notion
(Drenowski, Grinker & Hirsch, 1982; Rolls et al. 1986; Warwick, Hall, Pappas &
Schiffman, 1993). However, they suggest much more specific effects than Cabanac
describes.
3.6. Alliesthesia & sensory-specific satiety I: the laboratory studies.
The alteration of the hedonic post-prandial rating of particular foods has been argued to
be dependent on more than simple ingestion. On the basis of experiments in which a
variety of different foods are presented and consumed, the idea has been suggested that
satiety is the result of the perception of sensory properties of the foods, as opposed to
their general satiating impact. This has been described as "sensory specific satiety"
(Rolls, Rolls & Rowe, 1983; Rolls, 1986). There is a significant difference between

negative alliesihesiu and sensory-specific satiety. The former refers to a "change from a
pleasant sensation toward an indifferent or unpleasant sensation on the affective axis"
(Cabanac, 1979)- tasting food or ingesting foods with no calorie content will have have
no effect on alliesthcsia. Sensory-specific satiety (SSS), however, does not depend on
the condition of repletion or on the physiological need for nutrients. Instead, "the rapid
changes in palatability that occur during and immediately after eating depend on the
sensory properties of foods, or on some cognitive process which assesses that enough
of a particular type of food has been consumed" (Rolls, 1986).
A common finding in SSS studies is that if a food is eaten to satiety, then a second
course of the same food will result in a reduction of intake to approximately 50 % of the
first intake (Rolls et ah 1981). This finding appears to reinforce the casual observation
that one food eaten to fullness will not be eaten particularly eagerly or in great quantities
if presented for consumption again. In this study, all foods except roast-beef produced
sensory-specific satiety although not all subjects ate the same amount of the lest meals
(Rolls et ah 1981).
As one would expect, subsequent intake is affected by previous intake. Less evidently,
the food's pleasantness rating may also change. The pleasantness rating for food
consumed as a one-course meal (either one of two savoury meals, a dessert or fruit)
has been found to be significantly decreased when compared with foods consumed in a
four-course meal (Rolls, van Duijvenvoorde & Rolls, 1984) as have the pleasantness
ratings for food consumed as test materials compared with those given as meals and test
materials (Johnson & Vickers, 1992). This effect of food on intake appear to be
unrelated to the nutritional content of the food (Booth, Mather & Fuller, 1982; Rolls et
ah 1986), although Booth et al reported that when subjects ale foods of different
nutritional content (high or low calorie soup or jelly) and then freely ingested
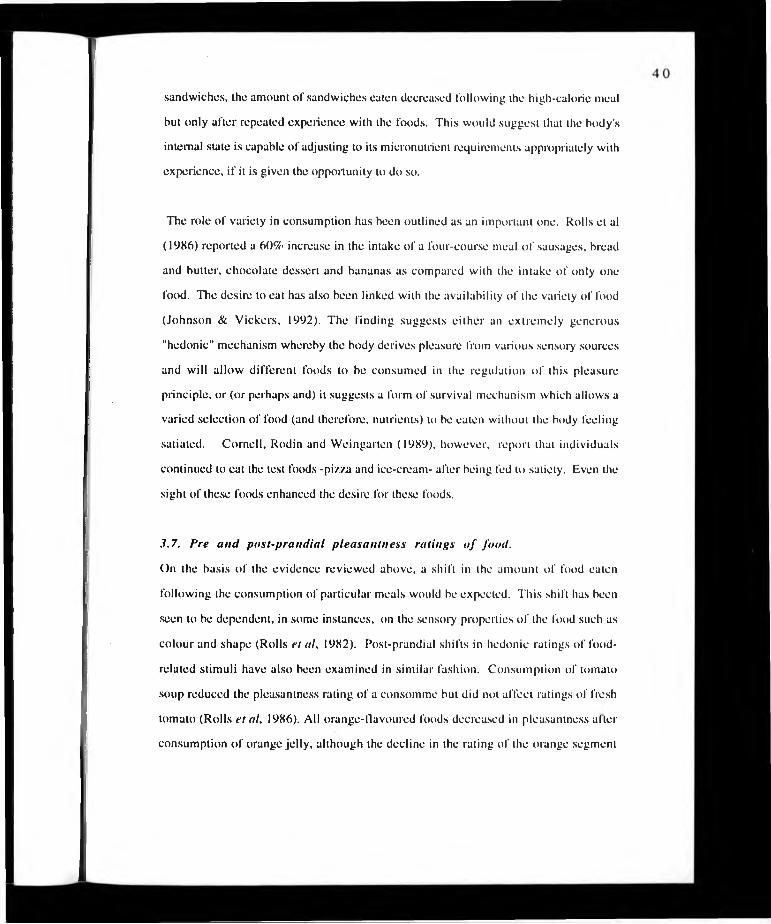
sandwiches, ihe amount of sandwiches eaten decreased following the high-calorie meal
hut only after repeated experience with the foods. This would suggest that the body's
internal stale is capable of adjusting to its micronutrient requirements appropriately with
experience, if it is given the opportunity to do so.
The role of variety in consumption has been outlined as an important one. Rolls et al
(1986) reported a 60% increase in the intake of a four-course meal of sausages, bread
and butter, chocolate dessert and bananas as compared with the intake of only one
food. The desire to eat has also been linked with the availability of the variety of food
(Johnson & Vickers, 1992). The finding suggests either an extremely generous
"hedonic" mechanism whereby the body derives pleasure from various sensory sources
and will allow different foods to be consumed in the regulation of this pleasure
principle, or (or perhaps and) it suggests a form of survival mechanism which allows a
varied selection of food (and therefore, nutrients) to be eaten without the body feeling
satiated. Cornell, Rodin and Weingarten (1989), however, report that individuals
continued to eat the lest foods -pizza and ice-cream- after being fed to satiety. Even the
sight of these foods enhanced the desire for these foods.
3.7. Pre and post-prandial pleasantness ratings o f food.
On the basis of the evidence reviewed above, a shift in the amount of food eaten
following the consumption of particular meals would be expected. This shift has been
seen to be dependent, in some instances, on the sensory properties of the food such as
colour and shape (Rolls et al, 1982). Post-prandial shifts in hedonic ratings of food-
related stimuli have also been examined in similar fashion. Consumption of tomato
soup reduced the pleasantness rating of a consomme but did not affect ratings of fresh
tomato (Rolls et al, 1986). All orange-flavoured foods decreased in pleasantness al ter
consumption of orange jelly, although the decline in the rating of the orange segment

did not persist. Interestingly, raspberry jelly showed a strong decrease in pleasantness
following ingestion of orange jelly.
Payability also radically affects liking (Spitzer & Rodin, 1981). Johnson & Vickers
(1992), for example, found that foods consumed as test meals dropped significantly
more in liking than eaten foods, except for a well-liked granola mix and plain yoghurt.
This drop was evidenced in all foods except for buttered roll, a finding the authors
attribute to the complicated nature of the food (two foods not one) which diminished
sensory-specific satiety. These authors also report that high protein meals (turkey and
cheese) dropped more in liking than lower protein meals. A second experiment, to
determine whether the complexity of an individual food (types of yoghurt with added
components) diminished sensory specific satiety, suggested that subjects' desire to eat
decreased significantly more after eating the high variety lest meals when compared to
the low and intermediate variety lest meals. Increasing the liking of the food also did
not diminish the drop in liking of food when it is eaten. There was no significant
difference in the decrease in eating between the less and more well-liked foods. Time-
of-day differences in food preference may also exist with both adults and children
preferring "breakfast items" (scrambled eggs, orange juice, cereal) mote when ingested
in the morning than in the afternoon and preferring the "dinner items" (pi/./.a, green
beans, macaroni cheese) better in the afternoon that the morning (Birch, Billman &
Richards. 1984).
3.8. Alliesthesia and sensory-specific satiety II: a critique.
The characterisation of the phenomenon described in the above studies as "sensory-
specific satiety" has been challenged. Blundell and Rogers (1991), for example, argue
that the term is limited on logical grounds. A "demonstration of sensory stimulation of
eating (by different food)" they argue, "does not justify the invocation of a mechanism

of 'sensory-specific satiely' They further argue that the methodology used to
determine the satiety and hedonie ratings obtained in these studies is inappropriate and
misleading. Are subjects, for example, rating how good the food tastes, or how good
the food is to ea t? Replications by others groups have been inconsistent or
contradictory. Cornell et a! (1989), for example, reported no effects of food intake on
subsequent ingestion of the test food. Warwick et al (1993) reported no expected
shifts in hedonic perception of food odour after the ingestion of breakfast. The only
significant odour-related finding was the increased pleasantness of geraniol after eating.
Hedonic taste responses were characteristically flatened after consumption.
Whether the term is strictly dubious on logical grounds is questionable. If the satiety
experienced were not the result of some sensory-specific factor of the food, then
presumably the nutritional content of the food would be the most likely satiating
candidate. The Rolls et al (1986) and Booth et at (1982) studies, however, demonstrate
no satiating effects of foods with different nutritional value. This is not to state that the
nutritional content of food is irrelevant to intake. Booth’s subsequent finding that
experience with foods of different nutritional hue led to a decrease in some second-
course foods provides an example that it may. However, the results obtained in the
Rolls studies are sensory, or perhaps mote prudently, factor-specific since the variables
manipulated were quite sharply delineated.
The argument that subjects may not be rating the food's taste but how good it is to eat
is, perhaps, misleading since this distinction is made by Rolls and her colleagues (e.g..
Rolls, Laster & Summerfelt, 1991). Whether subjects in these experiments fail to make
this distinction, or are unable to comprehend an experimenter's instructions without any
assistance, is debatable. In either regard, the distinction is one which could
conceivably affect only the semantic nature of the phenomenon. As suggested earlier.

factor-specific is a less presumptuous and more liberal description of the findings.
What is questionable is the highly stylised and supremely-controlled nature of the
experimental design. One might argue, on the grounds that the method endangers
external validity, that since little interaction with others is allowed, since the food is
tasted first and since a meal is foisted on the subject and is eaten to satiety, that this
mirrors very poorly the common experience of eating. This criticism and that of the
self-conscious nature of food ingestion in such an experimental setting has also made
by others (Lambert, Neal, Noyes, Parker & Worrel, 1991-2). The grouping of
responses into general response categories also suggests the possibility that individual
differences may be masked (a point also made by Blundell and Rogers), an important
factor in food preference and food choice. These observations, however, probably
constitute more of a suggestion for further development rather than a fundamental
criticism.
3.9. Summary o f the behavioural effects o f fo o d and food odour.
Food ingestion appears to affect psychological performance erratically. Some studies
suggest post-prandial decrements in cognitive performance (normally reaction time)
others report no change or highlight the cognitive benefits of lunch ingestion (such as
its effects on short-term memory). The nature of these cognitive benefits and deficits of
consumption are presently unclear. Some foods, however, would appear to have
highly generalised effects on human affect. Carbohydrates, for example, have been
reported to induce sleepiness to a greater extent than protein foods (as noted in section
3.3.). Additional mood-effects have been difficult to establish in human subjects. The
effect of food on satiety and hedonic response, however, appears to be more clearly
understood. Cabanac has suggested that a post-prandial hedonic change in the
perception of food-related sensory stimuli operates alliesthetically so that the liking of a
food is dependent on whether it has been eaten or, more generally, whether the subject

is satiated. As noted in section 3.5., foods eaten to satiety tend to be liked less than a
palatable, uneaten food. Furthermore, this "sensory-specific" satiety may extent to
food odour, although the findings for this sensory channel are less clear-cut (Ducleaux
et al, 1973; Warwick et al, 1993). In C h ap te rs 5-7, the nature of olfactory
alliesthesia will be examined more practically in a series of three experiments. The
alliesthesia component of these experiments will focus solely on the olfactory
contribution to the hedonic response to food in order to determine the relative
contribution of olfaction to post-prandial likes and dislikes.
In the following chapter, however, the effect of food ingestion on another variable, the
evoked potential is considered as well as its interaction with the perception of food
odour. Also examined is the more complex concept of the psychological significance
of the EEG and its relevance to the measurement of human olfactory perception. A
discussion is presented regarding the possibility of obtaining asymmetries in EEG as a
result of exposure to odour of opposing valence. The literature relating to affect and
EEG is reviewed and its relevance to aims of the thesis are outlined.

CHAPTER 4
EEG, ERP AND OLFACTORY PERCEPTION- THE USE OF PSYCHOPHYSIOLOGY TO
EXAMINE HUMAN RESPONSE TO ODOUR AND FOOD CONSUMPTION
"As for their [EEG rhythms[ 'functions',
one hesitates to use the word, they may he
not more than the waste-end product o f
some cerebral processes, perhaps the smoke
from smouldering biochemical fires."
R.VV. M oncrieff (1962)
"The prudent application of EEG holds
great promise for increasing our
understanding o f human CNS activity
and especially the influence o f odour
on that activity."
T.S. L ong (19X9)
4.1. Psychological concomitants o f EEG activity.
The majority of electroencephalogram (or EEG) studies suggests that this measure is
useful tool in the investigation of psychological variables. Spatial and motor tasks
(Beaumont, Mayes and Rugg, 1978; Rappelsberger and Petsche, 1988), verbal tasks
(McKee, Humphrey and McAdam, 1973; Davidson, Chapman, Chapman and
Henriques, 1990), mental imagery (Furst, 1976; Ornstein, Johnstone, Herron and
Swencionis, 1980; Berfield, Ray and Newcomhe, 1986), stress (Linke, Reuter and

Kurthen, 1989) and experience of emotion (Davidson, Schwartz, Saron, Bennett &
Goleman, 1979) produce a significant alteration in the pattern of the EEG.
Berger's (1929) discovery of the EEG and the prediction by Walter (1953) that these
'brainwaves' might represent a window on the brain has fueled a number of studies of
the effects of cognitive, affective, motor or perceptual task on brain behaviour. The
most commonly reported task-related changes are found in the alpha frequency (8Hz-
13Hz) where decreases are thought to reflect "desynchronisation" or "alpha-blocking"
(Berger, 1929). Collections of cells respond in a similar fashion until some external or
internal stimulus occasions a shift in frequency of response. According to the
International Federation of Societies for Electroencephalography and Clinical
Neurophysiology (IFSECN, 1974) alpha is "best seen with eyes closed and under
conditions of physical relaxation and relative mental inactivity. Blocked or attenuated
by attention, especially visual and mental effort." Concomitant increases in beta (14H/-
30Hz) may also be witnessed with alpha blocking. The alpha frequency is
characterised as the normal adult waking EEG and is thought to reflect "relaxed
wakefulness" (Lindsley, 1952; Niedermyer, 1987). Some authors have sought to
relate changes in this frequency to arousal. Wilson, Orne & Pakcwitz (1976), for
example, report reduced alpha feedback in subjects exposed to the threat of shock.
They also report, however, that several subjects reported the opposite, showing
increases in alpha density. The arousal relationship is, therefore, highly ambiguous.
Indeed, similar to the use of the term 'hedonic' in psychology and the use of the terms
'stimulant' and 'depressant' in caffeine/alcohol studies, it is uncertain exactly what the
terms used actually signify in their respective contexts. As a descriptive concept it is
useful but as valid construct it may be questionable.
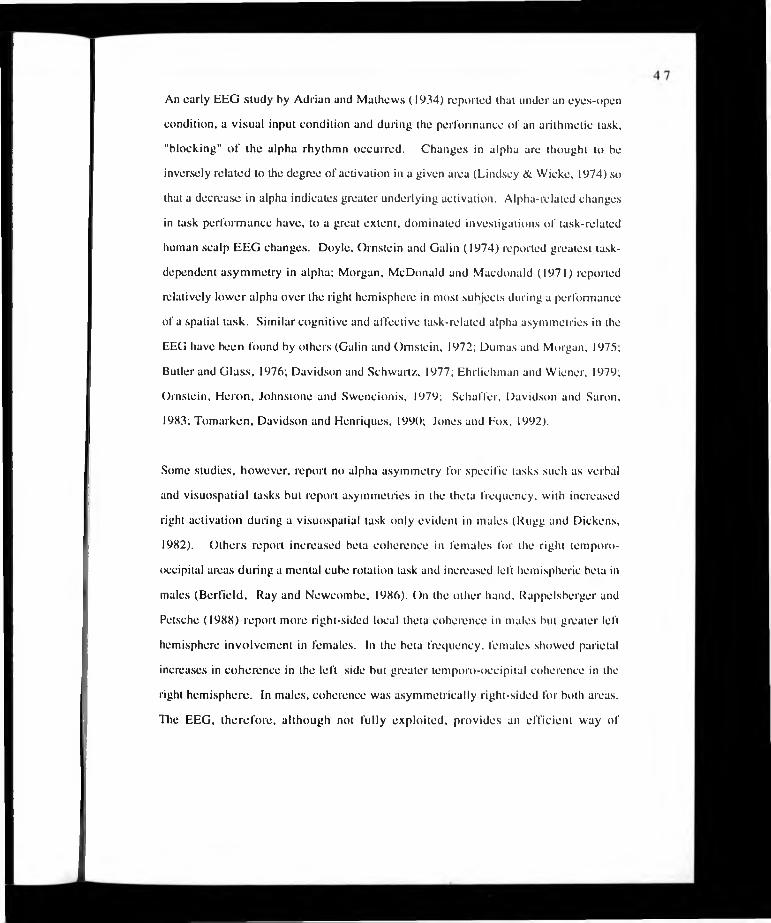
An early EEG study by Adrian and Mathews (1934) reported that under an eyes-open
condition, a visual input condition and during the performance of an arithmetic task,
"blocking" of the alpha rhythmn occurred. Changes in alpha are thought to be
inversely related to the degree of activation in a given area (Lindsey & Wicke, 1974) so
that a decrease in alpha indicates greater underlying activation. Alpha-related changes
in task performance have, to a great extent, dominated investigations of task-related
human scalp EEG changes. Doyle, Ornstein and Galin (1974) reported greatest task-
dependent asymmetry in alpha; Morgan, McDonald and Macdonald (1971) reported
relatively lower alpha over the right hemisphere in most subjects during a performance
of a spatial task. Similar cognitive and affective task-related alpha asymmetries in the
EEG have been found by others (Galin and Ornstein, 1972; Dumas and Morgan, 1975;
Butler and Glass, 1976; Davidson and Schwartz. 1977; Ehrlichman and Wiener, 1979;
Ornstein, Heron, Johnstone and Swencionis, 1979; Schaffer, Davidson and Saron,
1983; Tomarken, Davidson and Henriques, 1990; Jones and Fox, 1992).
Some studies, however, report no alpha asymmetry for specific tasks such as verbal
and visuospatial tasks but report asymmetries in the theta frequency, with increased
right activation during a visuospatial task only evident in males (Rugg and Dickens,
1982). Others report increased beta coherence in females for the right temporo-
occipital areas during a mental cube rotation task and increased left hemispheric beta in
males (Berfield, Ray and Newcombe, 1986). On the other hand, Rappelsberger and
Petsche (1988) report more right-sided local theta coherence in males but greater left
hemisphere involvement in females. In the beta frequency, females showed parietal
increases in coherence in the left side but greater temporo-occipital coherence in the
right hemisphere. In males, coherence was asymmetrically right-sided for both areas.
The EEG, therefore, although not fully exploited, provides an efficient way of

observing psychophysiological concomitants of mental performance and of the
variables capable of affecting mental performance .
4.2. Alpha desynchrony: artifact or task-related?
The notion of desynchrony and, in fact, any EEG task-related change is not as clear-cut
as it appears. Gevins, Zeitlin, Doyle, Yingling, Schaffer, Callaway and Yaeger (1979),
for example, found no lateralised EEG differences in response to different tasks but did
report bilateral involvement during performance of complex cognitive tasks. EEG
patterns distinguished between complex, uncontrolled tasks (mental paper folding,
writing from memory, scribbling, Koh's block design, reading) but not controlled ones
(visual fixation, block rotation, letter substitution and serial arithmetic). These authors
suggest, on the basis of their own findings, that there is no support for the hypothesis
that asymmetrical EEG task-related differences reflect cognitive processes (despite a
strong rebuttal from Davidson and Ehrlichman, 1980). The conclusion was further
supported by a number of criticisms Gevins, Doyle, Schaffer, Calloway & Yeager
(1980) made of studies purporting to demonstrate "left-right" hemispheric EEG
differences. Studies purporting to show differences should, for example, minimise
differences between tasks, minimise performance-related differences between tasks (so
that effort and difficulty are equal), eliminate differences in efferent activities, ensure
that useable data reflect recordings that contained tasks which were correctly performed
and reject all extracerebral artifacts.
All of the studies cited by Davidson and Ehrlichman (1980), contained at least two
methodological shortcomings which made any conclusions from the data suspect.
Yingling (1980) has argued that "the lack of active motor involvement eliminates the
necessity for much of the cortex to be involved, and thus the scalp EEG does not show
a clear pattern of lateralised activity" suggesting that movement-related EEG produced

by writing cannot be attributed to artifact when it is an essential pan of "the coordinated
perceplual-cognitive-motor activity which is the primary function of the brain". This
would be true were one able, for example, to distinguish between scribbling and
writing from memory on the basis of EEG. In the Gevins et al study, these two tasks
were the only two to fail to reach significance in terms of percentage accuracy in
distinguishing between tasks. The most striking difference in tasks was found
between visual fixation and Koh's block design. Thus, it would appear that Gevins
and his colleagues have a point when requesting that tasks be relatively free of limb
movements, stimulus characteristic differences and performance-related differences.
Davidson, Chapman, Chapman and Henriques (1990), for example, successfully
demonstrated greater power suppression in the hemisphere most engaged in processing
(in the alpha, beta, delta and theta bands) or greater power in the opposite hemisphere
during the performance of two psychometrically-matched tasks (word-finding and dot
localisation). The verbal task occasioned significant greater alpha and theta suppression
in the left hemisphere than did the spatial task. Davidson and his colleagues have also
reported fairly robust alpha asymmetries to pictorial stimuli of opposing valence
(Tomarken, Davidson and Henriques, 1990; see sections 4.14-16.). Thus, it
would seem that under lightly controlled conditions, significant shifts in the pattern of
the EEG can be obtained using cognitive, perceptual or affective stimuli. The precise
nature of the EEG, however, and its function in relation to information processing has
been widely debated (see Niedermyer & Lopes da Silva, 1987). The debate is also
fuelled by the difficulties inherent in EEG recording itself, some of which are
surmountable and some of which are less easy to overcome.

4. 3. Electroencephalography: The technique, the activity and its
p rob lem s.
Electroencephalography (or EEG) is a complex branch of electrophysiology. The
complexity begins with the generating source of the EEG and its respective wavebands
(Nunez, 1981). Recent attempts at determining this source for each frequency using
Fast Fourier Transformation dipole approximation have confirmed some early
observations (Adrian & Yamagiwa, 1935) such as a posterior bilaterally symmetrical
generator for alpha, hippocampal generator for theta and so on (Michel, Lehmann,
Henggeler & Brandeis, 1992). Other attempts have been reported (eg, Wong &
Weinberg, 1988) with clinical groups and different techniques (eg, topographic spike
mapping, the Dipole Localization Method, etc.). There is still some ambiguity,
however, surrounding the precise location of the neural generators, an ambiguity which
can obfuscate an attempt to delineate brain function from EEG measures (Nunez,
1981). The generators of the EEG may be situated at some distance from the recording
site. Thus, if a particular task elicits greater beta at posterior electrodes, for example, it
does not follow that the underlying electrode area is responsible for this shift in activity
(see Walter, Etevenon, Pidoux, Tortrat and Guillou, 1984). The greater the spatial
resolution provided by the EEG system, however, the greater the accuracy in
constructing architectonic maps of cognitive and affective function. The signal,
however, may be attenuated by material which intervenes between the recording site
and the cortex. The skull, cerebrospinal fluid, inter-cranial tissue, dura mater, skin and
hair all contribute to the "smearing" of the signal so that activity recorded from a given
site may not be as clear as at the point of generation (Cooper, W inter, Crow & Walter,
1965).
The EEG is also in a constant state of flux. EEG machines normally record fluctuations
in brain potentials generated by the post-synaptic neurons of dendrites and measured

from the scalp. The signal, therefore, is not stable or constant but spontaneously alters
over time (Lopes da Silva, 1982). Some have characterised this feature of the EEG as
chaotic (Freeman, 1991). If EEG is recorded as a subject performs a series of tasks,
therefore, it is unwise to record less than 30 seconds of activity for each of eyes open
baseline, eyes closed baseline and task performance since there would not be enough
information in the record (remembering that this record has not yet been inspected for
artefact) to accord it reliability (Etevenon, Samson-Dollfus, Kemali & Perris, 1982).
Burgess and Gruzelier (1993), for example, suggest a minimum of 62 seconds which
itself may be a conservative estimate if a thoroughly reliable, robust and representative
amount of data is required. Others recommend slightly shorter sampling periods
(Davidson, 1992), demonstrating good test-retest reliability and internal consistency
(Tomarken, Davidson, Wheeler & Kinney, 1993). This minimum would ideally be free
of artifact contamination from ocular and muscle sources (see below), factors which
tend to reduce the amount of available, useable data to one-half/ two-thirds.
A further factor which may contribute to the complexity of the interpretation of the EEG
is the influence of artifact. Under normal, and even under optimal, recording
conditions, the EEG is prone to contamination from a number of sources- eye
movement, muscle movement, respiration, phoiomyoclonic response ( to visual
stimulation), tremor and aliaising (a signal containing high frequencies is sampled at too
low a rate; this sampling rate ideally should be at least two to three times the high
frequency end of the bandpass; signals generated by other equipment are prone to
induce aliaising. Aliaising may also result from ambient electrical fields producing a
60Hz alternating current; see Coburn & Moreno, 1988; Kahn, Weiner, Brenner &
Coppola, 1988). The most virulent of these contaminants is ocular. The moving eye is
a common, notorious generator of low frequency EEG artifact which is visible in the
delta and (less so) theta ranges although algorithms may delete contaminated EEG
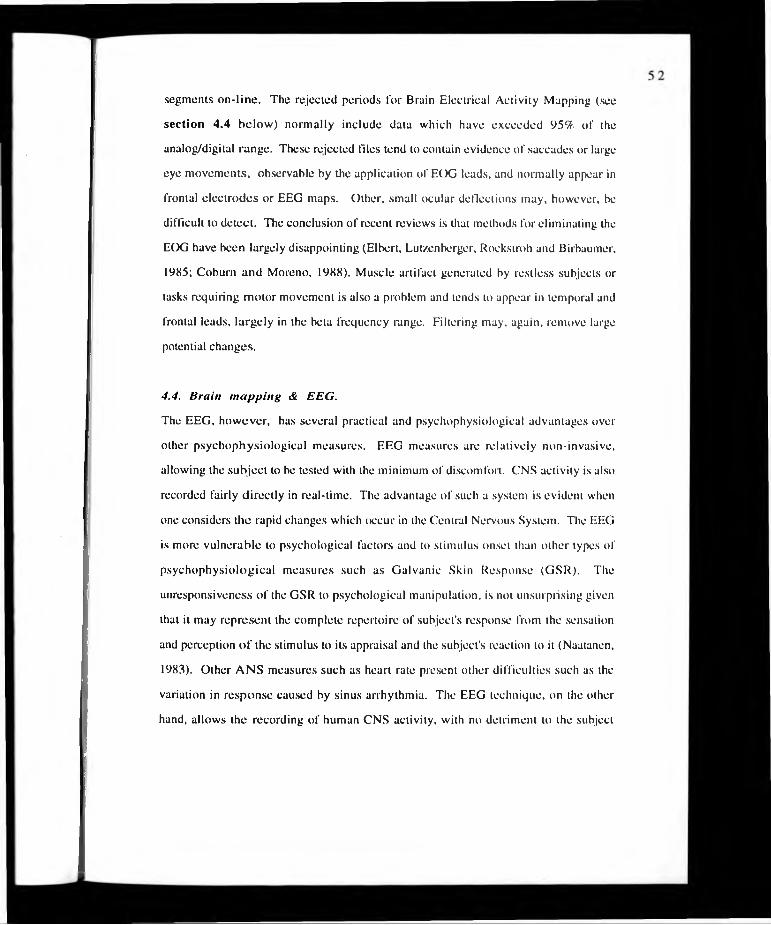
segments on-line. The rejected periods for Brain Electrical Activity Mapping (see
section 4.4 below) normally include data which have exceeded 95% of the
analog/digital range. These rejected files tend to contain evidence of saccades or large
eye movements, observable by the application of EOG leads, and normally appear in
frontal electrodes or EEG maps. Other, small ocular deflections may, however, be
difficult to detect. The conclusion of recent reviews is that methods for eliminating the
EOG have been largely disappointing (Elbert, Lutzenberger, Rockstroh and Birbaumer,
1985; Coburn and Moreno, 1988). Muscle artifact generated by restless subjects or
tasks requiring motor movement is also a problem and tends to appear in temporal and
frontal leads, largely in the beta frequency range. Filtering may, again, remove large
potential changes.
4.4. Brain mapping & EEG.
The EEG, however, has several practical and psychophysiological advantages over
other psychophysiological measures. EEG measures are relatively non-invasive,
allowing the subject to be tested with the minimum of discomfort. CNS activity is also
recorded fairly directly in real-time. The advantage of such a system is evident when
one considers the rapid changes which occur in the Central Nervous System. The EEG
is more vulnerable to psychological factors and to stimulus onset than other types of
psychophysiological measures such as Galvanic Skin Response (GSR). The
unresponsiveness of the GSR to psychological manipulation, is not unsurprising given
that it may represent the complete repertoire of subject's response from the sensation
and perception o f the stimulus to its appraisal and the subject's reaction to it (Naatanen,
1983). Other ANS measures such as heart rate present other difficulties such as the
variation in response caused by sinus arrhythmia. The EEG technique, on the other
hand, allows the recording of human CNS activity, with no detriment to the subject
while being sensitive to changes in the physical and psychological environment and
allowing the observation of possible brain latéralisation of function.
There are also practical, analytic advantages. Artifact may be rejected either on-line or
during post-hoc inspection. Modem recording systems employing Fast Fourier
Transform algorithms to simplify complex data facilitate interpretation EEG by
converting it into bandwidths (with stored numerical representation); gross changes in
the amount of EEG band activity generated by a stimulus is thus easily measured by
downloading data to a site where statistical analysis can take place. Brain Electrical
Activity Mapping also allows the construction of coloured topographical maps from
averaged waveband-EEG (the average frame of epoch is usually 2.56 seconds, but may
be less depending on the recording system used). In effect, these are a short-hand,
visual method of conveying information about activity measured from the scalp (Duffy,
McAnully & Schachter. 1984; Duffy, 1986; Wong, 1991). While indicating possible
sites of high and low activity, however, such a system may also be heuristically
misleading with stark colour contrasts eventually representing non-significant
differences in the final analysis (see Duffy, McAnulty & Schachter, 1984). The general
usefulness of these maps in quantifying relationships between psychological variables
and electrophysiological activity has been praised and criticised (see Duffy, 1986;
Tyler, 1985). It is probably wise to regard them as ornate indicators of possible EEG
changes rather than as definitive representations of the electrical activity of the scalp.
4.5. EEG: statistical considerations.
In addition to its recording, the design and analysis of EEG data is problematic. Most
EEG studies employ spectral analysis to manipulate data although this technique has
been challenged (Lorig, 1986). Lorig and his colleagues employ analysis of zero-
crossings (period analysis) which determines the duration of the major period of each

EEG waveband and quantifies the number of EEG waves that occur in various
frequency bands. Few brain mapping systems will allow such manipulation, however,
due to the FFT algorithm. The fact that EEG studies using spectral analysis continue to
demonstrate significant EEG changes to psychological, task-based variables, suggests
that the mode of analysis is one of preference rather than superiority.
The amount of data accrued in even the simplest EEG study may be considerable. The
number of electrodes may exceed 150, there are at least five conventional, analysable
wavebands, the number of conditions is often many and, in repealed measures designs,
the number of trials can be large. EEG experiments tend to be of a within-subjects
repeated measures design which presents its own problems, not only in terms of data
accretion but with regards to the violation of the sphericity assumption when
performing an analysis of variance (Vasey & Thayer, 1987). The application of an
ANOVA rests on several assumptions: normal distribution and homogeneity of variance
amongst groups, for example. Although fairly robust in deflecting violations of these
assumptions, ANOVA using a repeated measures design also encounters high
intercorrelations among the means on which comparisons are based. Assumptions
regarding the nature of these correlations are necessary before a p value is declared
significant. The problem is elaborated by Vasey & Thayer (1987): "In general, the p
values of the F tests are accurate only when the variance-covariance matrix Z can be
said to be spherical or circular. This is true if and only if the variance of all the
contrasts between repeated measurements which compose the overall comparison of
interest (e.g. the within subject main effect) is constant." (p.480). Repeated measures
contrasts, however, as already noted, are highly intercorrelated. Furthermore, the
closer to each other the two measurements are in time, the higher the correlation. The
resulting, uncorrected p value from such an analysis would therefore run the risk of
producing Type 1 errors.

There are methods of circumventing the sphericity problem The multivariate nature of
highly correlated repealed measures suggests the use of MANOVA since this does not
need to meet the assumption of sphericity. This approach is also quite robust to
violations of normality. The remaining difficulty would he to use a subject sample
compatible with a MANOVA approach, i.e. n= k + 20, where k is the number of
conditions; fewer subjects than this might deflate the power of the test. The second,
most commonly used approach, especially in psychophysiological investigations where
the number of subjects required to fulfil the MANOVA criteria would be considerable,
is to protect against sphericity by adjusting the degrees of freedom of the univariate
tests (usually by multiplication with "epsilon correction") to compensate for the positive
bias (Box, 1954; Geisser & Greenhouse, 1958; Huynh & Feldl, 1970). Since most
statistical packages feature either Huynh-Fledt or G-G corrections for repeated
measures design, most analyses with this design may circumvent the Type 1 error.
A second, major problem, as mentioned above, is p-inflalion. The EEC is a notorious
producer of large amounts of information. The number of ANOVAs and post-hoc tests
which one could conceivably perform on the data is considerable. The likelihood that p
will be inflated- leading to the rejection of the null hypothesis even though it is valid-is
possible. Thus one in twenty comparisons may lead to the declaration of a significant
result when it is not. For this reason some authors have suggested that the use of
inferential statistics in EEG analysis may be more allusive than prescriptive: The p
values provide "hints" as to what factors are responsible for the observed changes and
as such are descriptive (Rappelsberger & Petsche, 1988). There are also methods of
overcoming this problem: Bonferroni probabilities are probably one of the more
conservative methods of post-hoc testing of effects and take into account p inflation.
This approach divides the conventionally accepted level of significance (0.05) by the

total number of comparisons required. This new significance level is quite strict. If
there are three comparisons, the tables suggest a p value of 0.01 (rounded). Thus any
significant effect which exceeds this level might be legitimately said to exceed 0.05. A
less restricted and more flexible approach is provided by Tukey’s HSD. This allows
for multiple comparisons by comparing values of Q obtained from the data with critical
values of Q. Either approach may be used, but for large numbers of unplanned,
pairwise tests, with a 2-way ANOVA, Tukey's appears to be the more desirable. For a
three-way ANOVA, however, it may be necessary to calculate t-tests between pairs of
means and then invoke the Bonferroni approach. In this way, any spuriously
significant results will be declared non-significant. There is a danger, however, that
such a conservative p value will encourage Type 2 errors. In this instance, the
expectation of a meaningful statistic must be weighed against need to exercise caution.
When encountering p-inflation and Type 1 errors, it may be meaningful to consider
patterns of results. Therefore, if a number of pairwise comparisons arc declared
significant, and arc significantly meaningful to the hypothesis tested, then the pattern
may be reflective of true effects. Some authors would argue that the use of these
inferential statistics is not particularly helpful to the analysis and interpretation of EEG
data. This, however, is the extreme end of the spectrum, the other end of which would
declare any result within the significance level of 0.05 meaningful. Inferential statistics
can be informative in the analysis of EEG as long as interpretations are made cautiously
and the necessary corrections made to accommodate the problems encountered.
Although this problem in EEG is virtually intractable, the conservative measures taken
here ensure that the data must obey strict criterion before they are declared significant
and, ergo, meaningful. Practical consideration of EEG data analysis is provided in
C hapters 5-7.

4.6. Event-Related Potentials and their potential relation to information
processing .
More pronounced effects on brain electrophysiology are obtained with repealed
psychological stimulation. Repeatedly presented visual or auditory stimuli, such as
Hashes and tones, generate an averaged response which stands in isolation from
background EEG (Donchin, Ritter & McCallum, 1978). Exogenous potentials, such as
those generated by simple external sensory stimuli, can be clearly obtained under
optimal recording conditions. Endogenous potentials generated by subjective
responses to stimuli, may also be clearly obtained but their precise function and
definition is, unlike the simple stimulus-response nature of the sensory potential,
unclear (Ritter. Vaughan & Simson, 1984). Event-related potentials (or ERPs),
however, may reflect not only complex cognitive processes but also a complex
interaction with other internal and external variables, odour and food ingestion among
them (Lorig et a l , 1991 ; Geisler & Polich, 1992 a, b).
The course of the "spontaneous" EEG is erratic. Although shifts in potential can be
measured in each respective waveband and to a given psychological variable, the task is
not helped by an enormity of background "noise", the chaotic baggage carried by the
brain. Averaging EEG responses over a series of trials assists in reducing this
background noise and highlighting the foreground effect. The assumption is that brain
activity is time-locked to some impinging stimulus (hence, event-related). Andreassi
(1989) exemplifies this thus: If a single ERP is 5uV and background EEG is 2<)uV, the
EP will increase as a function of N samples (in this example, 100) whereas background
EEG will increase as a function of N square root.
________EP amp (N)______EEG amp (square root of N)
luV (liK»lOuV (10)
500200
2.50 (the EP)

In this example, the EP is two and a half times as large as the background EEG.
Sensory stimulation can be measured by this technique relatively easily. Exposure to
visual stimuli produce reliable ERPs at the occipital pole (the striate cortex),
somatosensory stimuli at the motor strip and so on. The generators for the various
sensory-related potentials may vary in site. Signal generators for EPs produced by
auditory stimuli have been found at the auditory cortex in the temporal lobe (Vaughan &
Arezzo, 1988), those for somatosensory and visual EPs at the post-central gyrus and
the primary visual cortex, respectively (Vaughan & Arezzo, 1988).
4.7. The P300.
Where event-related potentials become of increasing psychological interest is that point
at which they may be assumed to reflect information-processing. The "endogenous"
P300 component of the evoked potential is a late positive-going wave occurring at
around 3(H) milliseconds after stimulus onset. It is commonly referred to as an
information-processing or decision-making wave since it commonly appears as a result
of a subject's engagement in a task requiring discrimination of some kind (Sutton,
Braren, Zubin & John, 1965; Donehin, Ritter & MeCallum, 1978; Donchin & Coles,
1988). One of the most indueive task appears to be the auditory oddball task in which
individuals count the number of low tones in a series of high and low tones as subjects'
brain electrical activity is measured (Sutton et al, 1965). Electrical potentials to each of
the stimuli are recorded and the total for each pitch is averaged. There are always fewer
low than high tones (usually in the ratio 1:4). Ordinarily, the resulting EPs appear at
100 and 200 milliseconds after stimulus onset to each type of tone. The N100 is
assumed to reflect sensory-information processing. Its positive-going return wave, the
P200, is poorly studied but may be reflective of the distribution of altentional
resources. It has been suggested that these two components co-vary and sometimes
overlap although there is evidence for their separation (Naatanen & Pieton, 1987).

The precise meaning and function of the P300 is still uncertain (see commentaries,
Donchin & Coles, 1988). It is modality non-specific since a visual or verbal oddball
task may elicit a P300. It is commonly associated with cognitive activity and more than
likely reflects some form of information-processing. Other variables affecting its
appearance and amplitude include signal probability, attention, uncertainly reduction
and stimulus relevance. Stimuli which "resolve the subject's uncertainty" have been
found to elicit the P3(X) (Sutton etui, 1965). Others report that since the P300 is elicited
when signals were detected but not when undetected, this EP is implicated in the
evaluation of stimulus significance (Ritter & Vaughan, 1969). The function of
"context updating" has also been ascribed to the P3(H) (Pribram & McGuiness, 1975)
as has the indexing of the "operation of adaptive brain systems" (Hillyard & Pieton,
1979). Others recognise the wave as a reflection of the subject's information
processing. For example, subject's asked to guess whether a stimulus would consist
of 1 or two clicks generate a large P.3(X) to the second clicks only (Donchin et al. 198.3).
(Johnson (1986) has, in fact, suggested a model of P300 function representing three-
dimensions: subjective probability, stimulus meaning and information transmission,
any one of which may be sufficient but not necessary to elicit a P3(X)).
One important factor in the generation of the P.300 is attention. When attention is
divided between a primary task (manual tracking) and a secondary task (counting target
tones), the P300 amplitude decreases (Israel, Chesney, Wicken & Donchin, 1980).
This has been interpreted in terms of a multiple resource theory which suggests that
separate resource pools correspond to different modalities (Wickens, 1984). As a
greater decline in the P3(X) was not observed as a result of increasing task difficulty, the
theory suggests that the difficulty factor depletes resources which are not used by the
P3(X). When task difficulty is increased (monitoring of shapes was coupled with a

counting task) the P300 to tone-counting decreases, which suggests that the number of
added shapes depletes "perceptual-level" resources used for counting. If this is the
case, then practising a primary task to the point of automaticity should result in a
relatively unchanged P3(X).
The P3(K) to the infrequent stimuli is negligible when subjects are not instructed to
discriminate between tones (Polich, 1986). P.300 amplitude is smaller during linger
tapping than in silent counting paradigms (Polich, 1987). Latency remains relatively
unaffected by attention and probability although longer latencies have been reported to
silent counting than to finger tapping or button pressing. Longer latencies are also
found with ageing (Brown, Marsh & LaRue, 198.3; Polich. Howard & Starr, 1985;
O'Donnell, Friedman, Swearer & Drachman, 1992). Habituation to signals (by
increasing stimulus probability) reduces the amplitude of the P3(X) but if the pitch of the
tenth stimulus, for example, is changed, then a marked increase in P300 is generated
(dishabilualion) (Polich, 1989). Dishabituation may also be evidenced when deviant,
task-irrelevant events are embedded in a series of attended stimuli (Courehesne,
Courehesne & Hillyard, 1978) when irrelevant events are highly intrusive (Squires,
Donchin, Herning & McCarthy, 1977) or when the distinction between relevant and
irrelevant channels is blurred (Hansen & Hillyard, 198.3). It should be noted,
however, that Pritchard, Brandt, Shappell, O'Dell & Barralt (1986) reported no
habituation of the P300 over time.
The effect of extraneous variables on the ERP has recently been considered in a number
of investigations. Dual-task paradigms where an external task is performed in tandem
with the primary counting task generally results, as noted earlier, in divided attention
and a reduced P300. Other factors such as personality, diurnal cycle, food
consumption and olfactory perception have recently been considered influential in

modulating this component. Food consumption and olfactory perception, in particular,
are of especial interest since, as noted in Chapter 3, improvements and decrements in
cognitive performance has been found to be associated with both meal ingestion and
content and exposure to odour.
4.8. Changes in evoked potentia ls: fo o d consum ption or diurnal
variation?
Subjects tested early in the early afternoon have been found to generate larger EP
amplitudes than when tested at mid-morning (Broughton, Aguirre and Dunham, 1988).
The finding suggested that the subjects' diurnal cycle was influential in producing an
alteration in the amplitude of the EP. This specific time-of-day effect, however, has not
only been difficult to replicate but is often contradicted. For example, higher
amplitudes have been found in the morning (Wesenstein, Badia & Harsh, 1990), or
found in the evening than morning (Browman, 1979) or have been unaltered by the
time-of-day (Dalbokova & Kolev, 1989; Geisler & Polich, 1990). Studies examining
the interaction between time-of-day, P300 amplitude and diurnal type (morning-
perference vs. evening-preference) have reported significant and consistent AM/PM
differences for auditory N100 and P200 responses (Kerkhof, 1980; Kerkhof, Korving,
Willemse-Geesi & Rietveld, 1980) while showing no diurnal variation in the P300
(P450). The picture is, therefore, highly ambiguous.
One possible explanation for the inconsistency in studies of diurnal ERP may lie in the
possibility that there are factors, excluding diurnal cycles, which arc responsible for the
inter-session alteration in the ERP. Subjects who had eaten three hours of being tested
in an auditory oddball experiment, for example, have been found to show significantly
larger P300 amplitude than subjects who had not eaten for six hours (Geisler & Polich,
1992a). The target NICK) or P200 were relatively unaffected by recency of food

consumption. In a second experiment, subjects were tested fourteen hours after
fasting, five minutes after eating a lunch of peanut butter, jelly sandwich, apple and a
fruit drink, and thirty minutes post-prandially. Target P300 increased significantly after
consumption but decreased at the third measurement (Latency was relatively unaffected
in both studies). Subjects receiving a recent intake of food also showed better memory
recall for words after ingestion and a strong short-term memory recency effect, a
finding which the authors argue reflects the appearance of the P300- a general increase
followed by gradual decrease. This is an interesting finding in view of P.IOO's general-
purpose manifestation as a memory-updating component. In a subsequent investigation
of diurnal preference and recency of intake, larger but non-significant P300 amplitude
was observed in the food group, but a significant time-of-day by diurnal type
interaction was reported with morning-preference subjects who had not been recently
fed producing greater P3(X) amplitude in the morning than in the afternoon (Geisler &
Polich, 1992b). Evening-preference subjects demonstrated a similar effect but with
larger P300 in the evening. Much weaker preference-activity effects were evidenced
when subjects had eaten recently. There was no effect of lunch on N100 or P200
amplitude although significant interactions were observed with the latency data: the
morning-preference/no-food group produced shorter NIOO latencies than the evening-
preference/no-food group but the opposite effect was found with the food groups.
P200 latency was also shorter in evening-preference subjects.
4.9. ERPs and fo o d analogues.
On the basis of the foregoing evidence, it is arguable that recency of food consumption
has the ability to modulate ERP behaviour. Similar findings have been reported in
studies using food analogues. Bolus injections of the neuroactive peptide hormone
cholecystokinin (CCK) have been found to affect EP components, specifically the Nl-
P2 complex. CCK is known to exert metabolic effects, induces satiation in animals and

humans (Silver & Morley, 1991) and is present in lower levels in sufferers of bulimia
nervosa than in healthy controls (Lydiard, Brewerton, Fossey, Laraia, Stuart, Beinfield
& Ballenger, 1993). A 0.5 ug bolus injection of ceruletide, a cholecystokinin analog,
has been found to diminish the amplitude of the auditory P200 in attentive, unstarved
subjects (Pietrowsky, Fern, Er, Bathelt & Born, 1990). Other authors report a reduced
auditory N1-P2 amplitude following low doses of CCK but an increased amplitude
following administration of high doses during distraction by the aroma of cooking food
and the noise of food preparation (Stacher, Bauer & Steinringer, 1979). A diminution
of the auditory P200, but not N100, following 0.5 ug ceruletide infusion, but not after
bolus injection using a within-subject comparisons design has also been reported
(Pietrowsky, Schiemann, Fehm & Born, 1993). The Stacher study is of particular
interest since it is the first study of its kind to examine the effects of olfactory
stimulation on ERPs and is one of the earliest investigations of pre-and post-prandial
olfactory EEG.
In this study, 16 subjects were placed of four treatment conditions: 180 ml/30 min. of
either saline, 0.6, 3.0 or 6.0 U CCK/kg body weight by intravenous infusion, and
their ERPs were recorded. During the penultimate fifteen minutes of the testing period,
subjects with eyes-closed were exposed to the smells and the sounds of the preparation
of a meal: bread and butter, cut fresh chives, butter melting in a pan, and eggs and
bacon frying. The aim of this final procedure was to "stimulate the subject's appetite"
as ERPs and EEG were recorded. Subjects in the saline group reported increases in
feelings of hunger and voraciousness when exposed to the foods but the increases in
the CCK groups were significantly smaller with increasing dosage. A linear dose-
relationship response was observed in the AEP data with N1-P2 showing marked
diminution with increasing dosage during exposure to the food. During the baseline
saline vs. CCK period, there was no significant difference between groups, however.

What is more, EEG alpha increased in saline subjects but decreased with increasing
doses of CCK. Theta decreased during infusion of saline and exposure to food
preparation but increased with increases in CCK. Beta activity also increased with
increasing dose of CCK with the greatest increase during CCK administration
(compared with the food preparation period). The authors conclude that,
" When attention is attracted by the food-related stimuli and
shifts away from the auditory stimuli presented, the number of
neuronal units recruited by such stimuli diminishes and a decrease
in AEP amplitude results. When, with increasing dose o f CCK,
the food-related stimuli become less powerful in attracting the
subject's attention, more attention is attracted towards the auditory
stimuli and consequently AEP amplitude increases despite the
concomitant general deactivation." (p.331).
Pietrowsky etal (1989) interpret a similar lack of N2(K) attenuation following CCK and
exposure to food cues in their study as an indication of the diminished ability of the
food cues to cause distraction in their subjects.
The diminution of the AEP following distraction or lack of attention is well-
documented. The reduction in P300 amplitude appears, as mentioned above, to be
especially sensitive to external variables unassociated with the task being performed.
An exploration of ERP response during stimulation by olfactory food cues, before and
after the ingestion of a "natural" meal i.e. cooked food which is naturally ingested has
not been undertaken. The results from Slacher et at (1979) and Pietrowsky et al (1989)
encourage the view that relevant olfactory cues coupled with the ingestion of satiating
agents produce marked and significant effects tin human brain electrophysiology.

Further evidence to suggest the ability of odour to alter the course of CNS activity is
assessed below.
4.10. EEG & odour: methodological considerations.
Experimental interest in observing the EEG effects of olfactory stimulation had. until
recently, focused on studies using animals. Considerable evidence has accumulated
since Adrian first placed electrodes in the olfactory bulbs of hedgehogs (Adrian, 1942),
suggesting ways in which invasive and non-invasive exposure to odour may affect sub
cortical structures (especially the olfactory bulb) and cerebral cortex (see, e.g..
Freeman, 1991; Davis & Eichenbaum, 1992).
Moncrieffs (1962) early human study of EEG response to odour using rudimentary
EEG recording techniques found that almost all the presented odours (including
essential oils, synthetic oils and unpleasant-smelling chemicals) produced a general
reduction in alpha activity (as measured by eight, bilaterally-placed electrodes) in five
subjects (ylang ylang had no observable effect on the EEG). Similar desynchronisation
had been noted four years earlier (Bushteva, Polczlaev & Semenenko, 1958), although
electrode sites were not specified. The findings suggested that odour was capable of
precipitating CNS activation ( as reflected in low levels of alpha).
Since Moncrieffs (1962) experiment, subsequent investigations of human EEG activity
during olfactory perception have been sparse. This scenario is unlike that of the study
of olfactory evoked potentials (OEP) and chemosensory evoked potentials, which since
Allison and Goff (1967)'s early investigations has burgeoned (Plattig, 1989; Kobal &
Hummel, 1991). The momentum behind OEP studies lies in the ability to investigate
the effects of odour on brain electrophysiology directly under optimum conditions.
Modern olfactometry delivers the odour, or chemical or gas, at precise llow rales and

at controlled intensities as EEG is monitored. By averaging trials, an EP is created.
The "spontaneous" EEG, on the other hand, teases out any effects an odour may have
on a fairly naturally behaving human being. Table 4.1. summarises the main
findings from all the principal papers published on human EEG response to odour. It is
evident from this inventory that the number of studies investigating these responses
continues to he remarkably small. The impetus behind the recent increase in the number
of studies published appears to stem largely from the recent drive to examine the claims
of aromatherapy (Lorig & Schwartz, 1988) and the evidence provided by olfactory
psychology (hence the predominant use of "synthetic" odours and essential oils in these
studies). The claim that odour may affect mood, cognition and other psychological
factors has precipitated much of the psychophysiological investigations of odour
perception in the past decade (Lorig & Schwartz, 1988; Lorig & Roberts, 1991;
Klemm, Lutes, Hendrix & Warren berg, 1992; Van Toller, Behan, Howells, Kendal*
Reed & Richardson, 1993; Martin. 1992; 1993).
Recent, methodologically improved (in comparison to the crude designs of Moncrieff)
and expanded investigations have produced largely inconsistent results, a finding
which is probably attributable to the number and kind of odours used, the recording
and analysis techniques employed, the period of EEG selected for analysis, and subject
selection. One study, for example, has reported differences in the amount of alpha
activity over right and left hemispheres (although the specific direction of the
differences are not reported) and greater theta activity using fine fragrances as stimuli
and four electrodes as recording measures (Lorig & Schwartz, 1988). In a separate
experiment using three different odours and four electrodes, decreases in activity were
found in the theta frequency. Others, using eight different odours and nineteen
electrodes, report no alteration in alpha but selective increases in theta (Klemm vt at,
1992). In the former studies (Lorig & Schwartz, 1988), greater theta to fragrance was

•l.l.Table sum
marising published studies of hum
an reponse to olfactory stimulation using E
EG
/ER
P m
easures.

tension than lavender.
diminished in
saline & sm
all dose ('('K Ss.

cones. and m
ed. More left
posterior for both lav. cones;
h) 6 (male)
KEG
5 fine fragrances
as a) as a)
as a) (i) differences in the
4 (female)
(floral) to a 5$ am
ount of alphasolution in distilled
activity over 1.&R
1120 hem
s.


(10090. lavender 16. P3.1’4
lavender and lemon:
(1009?). lemon
01.02. FZ (iii) Som
e unpl.(1009?). pepperm
int ('/. IV.
odours, eg. tar &(109?). room
-air. salhanum
had

evident in the left hemisphere whereas theta was reduced to the other odours especially
in right frontal and left posterior areas. Specific inter-odour differences were also
found with spiced apple producing less theta than lavender. In the latter study (Klemm
et al, 1992), birch tar, jasmine, lavender and lemon were associated with increases in
theta. Thus, although recent studies have employed much more sophisticated EEG
technologies and presentation techniques, there continues to be a persistent variability
amongst these findings.
Most of these studies use adult subjects in conditions of optimum relaxation (eyes
closed, seated) and employ exposure periods lasting from 6/7 seconds per odour
(Moncrieff, 1962) to 2 minutes (Klemm et til, 1992). The lime consideration in
recording responses to odour is important. If habituation to an odour occurs too
quickly (the odour is not suprathreshold), then it is possible that the brain does not
register such "subliminal" stimulation. Two studies, however, have demonstrated
differences in the amount of alpha (Lorig, Huffman, DeMartino & DeMarco, 1991) and
theta (Lorig, Herman Schwartz & Cain, 1990) as a result of exposure to undetected
galaxolide, and low vs. medium concentrations of spiced apple and lavender oil,
respectively. In another study, greater EEG speeding was reported to peppermint
odour in sleeping subjects (Badia, Wesenstein, Cammers, Culpepper & Harsh, 1990)
although the procedure employed by the experimenters whereby the subjects are woken
up if they did not stir, are told that the odour was present and then requested to resume
their sleep raises some doubt as to the validity of the procedure.
The difficulty then arises as to whether the brain, after sensing the odour for the first
time, then recovers from its initial arousal following stimulation and continues behaving
as chaotically as before. A form of cerebral habituation may be in evidence if an odour
is presented for too long a time. Associated with this difficulty, however, is the
amount of EEG that is necessary for any statistical analysis to show reliable effects. As

noted in section 4.3, authors are fairly flexible concerning the minimum amount of
artifact-free data that is required in order to make the EEG sample "representative" hut a
minimum of sixty seconds would appear to be advisable (Burgess and Gru/.elier,
1993). With systems employing algorithms which may correct for eye movement, the
necessity of recording a given set of frames is only governed by the need to collect a
reasonable sample of data. When no such algorithms are available, however, the
amount of data has to be collected carefully, bearing in mind that contaminated records
will be disgarded and will therefore reduce the amount of useable and analysable data.
Thus Van Toller et al (199.3) use samples of a maximum of ten seconds with no
apparent eye-corrections. It is imaginable that a considerable amount of this data is
corrupted which leaves their total number of used frames unknown and the
interpretation of their results questionable.
The method of inhalation has also been reported to affect the pattern of the EEG. Nasal
inhalation has been found to produce greater anterior/posterior diversity in beta than
mouth inhalation. This form of inhalation also appears to reduce left hemisphere alpha
(Lorig, Schwartz, Herman & Lane, 1988). Lehmann and Knauss (1976) also report
increased desynchrony as a result of inhalation of room-air while others have
demonstrated a correlation between increased EEG amplitude in one hemisphere and the
contralateral nostril during inhalation of room-air (Werntz, Bickford. Bloom and
ShannaholT-Khalsa, 1983). The respiratory mode of the subjects in EEG experiments
is, therefore, important.
4.11. Event-related potentials & olfaction.
The influence of odour on components of ERP is more poorly studied than its influence
on EEG. Results in this domain, however, suggest that exposure to odour also exerts
electrophysiological effects. An increase in the Contingent Negative Variation at four

electrodes to the odour of jasmine has been reported (Toni, Fukada, Kanemoto,
Miyanchi, Hamauzu & Kawasaki, 1988). This study has been partly replicated using
slightly different subject samples: Torii et al employed both Japanese professional
perfumers and male students as subjects although this study has been erroneously
criticised for using perfumers only (Lorig, 1989). One other study has employed
American male and female students (Lorig & Roberts, 1990). In this latter study
differences in the lateral distribution of the CNV were observed to the low
concentration odours.
One other study has reported explicit odour effects on ERPs. Increases in the P300
have been found with increasing concentration of galaxolide in an auditory oddball task
but reported no effects on target or standard N 1(H) (Lorig et al, 1991). P200 increased
to the lowest concentration odour. Latencies for this study were not reported. Whether
this was due to non-significant findings or a failure to consider latency data is unclear.
Evidence elsewhere (Lorig, Mayer, Moore & Warrenhurg, 1993) would suggest the
former. The most curious finding from this study is the increase in P300 following
increases in odour strength and the authors' explanation for the finding. The authors
argue al one point that increased P300 amplitude is "generally associated with increased
accuracy of performance and mom complete cognitive processing of stimuli" citing
Donchin, Rutter & Coles (1978) as a reference. The "complete cognitive processing"
explanation would be more plausible if the statement was modified to: "increased
attention to the stimulus is associated with increases in P.300 amplitude", for which
there is some evidence (see Section 4.7.). However, a contrary explanation is
stated in the discussion with distraction cited as a variable resulting in the increased
P2(X) and P.3(X). In a later review, it is reported that the "data strongly suggest that the
presence of Galaxolide, even in undetected concentrations, distracted subjects and
resulted in the underestimation of the likelihood of the infrequent tones" (Lorig, 1992).

As a result, P300 amplitude was lound to increase significantly. This, as studies of
P300 amplitude determinants demonstrate, is highly unlikely. Distraction from target
tasks used in ERP investigations normally results in decreases in target P300
amplitude, not increases. This distraction-related increase in P.300, however, is
attributed to the overlapping of P200 and P300 components. Whatever influenced the
amplitudes of both P200 and P300 in this experiment, however, it is unlikely to be
distraction. If one were to suggest an alternative hypothesis one might argue that
attention to the odour even at the lowest concentration may have enhanced attention to
the task at hand. Furthermore, it is arguable, although there is no evidence provided by
Lorig et al (1991), that psychometric properties may have played some part in the
subjects' reaction to the odour during task performance (this is discussed al length in
section 4.14).
4.12. Food odour, the EEG & the ERP.
The majority of EEG studies using odour as a stimulus has employed the odours of
essential or synthetic oils. A small number of studies, however, has investigated the
effects of food odour on EEG and ERP, a stimulus which one would assume would
have considerably more "relevance" to the perceiving organism. One of the first
implicit studies of this kind was undertaken by Staeher, Bauer & Stcinringer (1979)
who found decreases in theta activity in subjects fed with saline and exposed to the
sounds and smells of food being prepared and cooked but increases in those subjects
receiving CCK (cholecystokinin -see section 4.9. for details). Decreasing alpha and
increasing beta were also observed with increasing doses of CCK but it is unclear
whether these changes accompanied exposure to the food stimuli or were simply the
isolated effects of the different ingeslive agents. The N 1-P2 complex of the ERP was
also reported to be diminished in subjects receiving saline and exposed to the food
stimuli as well as in subjects receiving small doses of CCK. These results contrasted

with those from subjects receiving large amounts of CCK who showed an increase in
amplitude. The aim of this experiment was not concerned with odour effects per se but
with the effects of combining various ingestive factors (saline, CCK) with other related
variables (sound/smell of food). Yet they provide the first indication that food odour
affects CNS activity, even if that activity may also be affected by the type of material
ingested and the medley of food-related sensory information it responded to.
Pictrowsky et aI (1989) found similar decreases in EP amplitude in subjects completing
an auditory oddball task after receiving saline and during stimulation by the smell and
sound of food being prepared and cooked. One obvious feature which does not allow
any definitive statement regarding the effects of olfactory stimulation on these
electrophysiological measures is the combination of the noise with the smell.
Furthermore, that EP changes were found between groups receiving different ingestive
agents (but not "normal" meals) suggests an experiment in which subjects are not only
allowed to eat natural meals but also receive stimulation by olfactory stimuli alone. If
CCK exerts these effects in tandem with the sound and smell of food cooking, it is
arguable that food eaten to fullness will exert even more pronounced effects when
olfactory stimuli are presented without other sensory involvement.
As noted earlier, Pietrowsky et a / explain their findings by suggesting that "hungry"
subjects (i.e. saline/ low doses of CCK subjects) paid greater attention to the food
stimuli, hence the reduction in amplitude. Their attention was distracted by their
internal physiological state. Those having received high doses of CCK (and reporting
less hunger and fullness) could thus complete the oddball task with little distraction.
This is an attractive hypothesis. Ray & Cole (1985) report a series of results which
suggest the differentiation of the amount of alpha and beta activity on the basis of the
types of task component administered: beta changes reflected cognitive processing;
alpha, altentional demands. A recent study has reported that during the alpha stale, N1
and P2 amplitudes were higher during a passive listening tune hut not when
discrimination between two tones was required. If greater alpha activity is assumed to
reflect attentional processes this would suggest that less power in this band is an
indication of, amongst other factors, cognitive engagement as opposed to simple
attentional demands. In Stacher et al's study, an increase in EP amplitude and a
decrease in alpha activity was noted with increasing doses of CCK but a slight increase
in alpha was observed in subjects receiving saline. Subjects receiving high doses of
CCK also showed an increase in beta activity (saline subjects did not) which was most
marked during the period prior to exposure to the food stimuli.
Further evidence of the effects of food odour on the EEG is not plentiful. In one study,
the EEG della at three electrodes recorded from 8 week old babies during exposure to
the odours of chicken dinner, chocolate pudding, beef dinner and fish in tomato sauce,
appeared particularly susceptible to some odours (Kendal-Reed & Van Toller, 1992).
Increases in amplitude were found to chicken, fish and beef but not the tomato. The
study did not, however, appear to control for intake and other wavebands, for
methodological reasons, were not analysed.
Lorig and Schwartz (1988) used what might be described as food odours (spiced apple
and eucalyptus) in an early study, reporting that spiced apple produced less theta
activity in the right frontal and left posterior regions than did lavender and that both
"food" odours were associated with less anxiety and tension than lavender. These
findings are associated with the use of food imagery in traditional anxiety management
techniques and perhaps suggest a role for the theta band in affect although the evidence
presented in this study is highly circumstantial. One study has reported increased theta
in the right hemisphere during sexual orgasm (Cohen, Rosen & Goldstein, 1976) but it

would appear that the greatest changes in EEG as a result of different affective reactions
lies in the alpha band. This relationship between alpha and affect is discussed in
section 4.14.
4.13. EEG & food odour: cognitive mediation?
It is arguable that the response of the EEG to some odours, specifically food odours,
may be the result of cognitive mediation and not the direct result of the odour's sensory
or psychometric properties. Lorig & Schwartz (1988-89) report that relaxation
(thoughts and feelings of heaviness) and imagery of a favourite dessert produced a
greater amount of theta and a Factor 1 band at the right posterior electrode than did
other cognitively based tasks. Factor 1 activity was significantly greater for dessert and
relaxation tasks than for the maths tasks (subtraction). In the right frontal region,
dessert imagery and concentration on the word "one" produced more Factor 1 activity
than did the maths tasks. Relaxation produced more Factor I than subtracting threes.
Surprisingly the authors associate this increase in Factor 1 with previous reports of
decreased tension and alterness in an earlier abstract (Lorig &. Schwartz, 1987). This
study, however, reported fully as Lorig and Schwartz (1988) does not include the
factor-analysed Factor 1 but alpha. The frequency for Factor I has been described as
5.7-8 Hz for left and right frontal electrodes by Lorig and Schwartz (1989); alpha,
however, has a much larger range of 8-13 Hz. There is a marked difference, therefore,
between the two bands. They cannot be considered interchangeable.
The authors also state that since exposure to food odour and the imagery of food are not
of equivalent psychological status (see earlier Gevins critique, section 4.2.), the two
may not be studied and compared. This is arguable but since such an exploration has
not been undertaken, it is premature to disregard such an experiment entirely. One
could argue that the tasks used in the experiment were also not of equivalent status
(active counting with possible subvocalisation vs simply feeling heavy, for example).
The trigeminal effects of food odour could easily be circumvented with the use of
"olfactory" odours such as vanillin for sweet stimuli and the use of hot water as a
control stimulus to compare with the presentation of hot foods (cf. experiment three,
this volume). Apart from the limited data collected (significant results were apparent in
only two out of four electrodes), practical aspects of the study also raise doubts about
the reliability of the findings. The first is the recording period. Three ten second
epochs are described as being collected for each of the tasks undertaken, with no
baseline measure recorded. Since artifact-reduction measures are not described in the
method section, the integrity of the collected epochs is questionable. That no control
baseline was recorded is also unhelpful. The second doubt relates to the design of the
experiment. The repeated measures design, as noted in section 4.5., is likely to
inflate values of p if adequate corrections are not employed. The study did not employ
a M ANOVA approach and did not appear to correct values for p. The conclusion must
he reached, therefore, that the authors' interpretation of the results is suspect.
4.14. EEG, odour & affect.
From the evidence reviewed in C hapter 2 (section 2.4.), it is clear that certain
odours with differing affective valence have different effects on cognitive performance
and self-reported mood. EEG investigations have shown similar disparities with
positive and negatively perceived stimuli exerting different effects on the pattern of
EEG alpha, often reflected in frontal/anterior asymmetries. A salient defining
characteristic of odour, as noted in C hapter 2, is its hedonic property. Food odour,
in particular, is a robust precipitator of affective response, conditional on the internal
state of the subject. It may, therefore, be logical to hypothesize that odours of opposing
valence might exert similar effects on the EEG as do previously reported pictorial
stimuli (e.g., Davidson, 1992). From what is known of sensory-specific satiety, it
may also be argued that the nutritional state of the subject might also affect the hedonic-
response to odour, a suggestion which may conceivably be measured,
psychophysiologically, using the EEG.
Study of the latéralisation of emotional processes using EEG has not, until recently,
been of great interest to psychophysiology. Early studies of emotion and the brain in
humans focused on affective disturbances following head injury. A common finding
amongst these and later studies was that left-sided lesions tended to be associated with
depressive, negative symptomatology (such as crying, low self-esteem, misery)
whereas lesions to the right hemisphere were associated with increased elevation and
euphoria (Alford, 1933; Goldstein, 1939; Robinson & Benson, 1981; Sackheim,
Greenberg, Weiman, Gur, Gungerhuhler & Geschwind, 1982). These studies
demonstrated clearly that the common right-for-emotion hypothesis (Bear, 1983;
Bryden & Ley, 1983) was a partial truism at best, a bland caricature at worst and failed
to distinguish between the perception of affect and experience of it (Davidson &
Tomarken, 1989).
As Davidson (1984) noted, interest in the psychophysiology of affective processes and
their latéralisation has lagged behind that for cognitive processes. Table 4.2.
summarises the principal studies of human adult EEG and affect.

Table 4.2. summarising principal findings from the main studies of adult EEG response to non-olfactory affective stimuli.
7 6
STUDY SUBJECTS ELECTRODES/BANDS
CONDITIONS MAIN FINDINGS
Harman & Ray (1977)
20 m; 20 f r-hs
T3/4.All freqs. between 3-30 Hz.
Self-generated emot. memories.
Increase in I.II power during +ive affect; decrease during -ive. No effect for RII.
Davidson el al (1979)
17 r-hs F3/4, P3/4. Alpha.
Response to +ive ;uid -ive TV show segments.
Greater relative LF acliv. to +ive film; greater RF acliv. for -ive film clips.
Tucker el al (1981)
8 in: 191 F3/4, C3/4, P.3/4. 01/2.Alpha.
Induction of depressive ;uid euphoric states.
Symmetry during cuph.:incTcasc in RF acliv. during depression; decrease in LF activ.
Schaffer el a l (1983)
6 depres.6 non-dep.
1-3/4. P.3/4. Alpha.
Eyes closed baseline. Less LF acliv. in dcp. than non-dep. No parietal dilferccnces.
Tucker &Dawson(1984)
4m; 5f method actors
F3/4, P3/4, C'3/4. 01/2.Delta, theta, alpha beta.
Self-generated/ experimentally induced depu. and sexual arousal
Della-more I.F in both conds. esp. during sex.Thcta-grcalcr power in FRII leads. Alpha- greater power in dcp. cond . esp. in posterior regions.
Ahem & Schwartz (1985)
33 r-h f. F3/4. 1*3/4.Delta, theta, alpha beta & total power.
Answering qns. eliciting sadness, excitement, happiness Hi fear.
1 Inppiness-grcntcr 1.11 acliv. than fear. Greater relative Lll power in delta andtouil power Ui +ive qiis Theta & beta- increase in Kllahumlance for excil. ami fear rclalive lo hap..sad., or neutnil.

Ray & Cole (1985)
40 r-h m. F3/4, P.3/4, T3/4.Alpha, beta.
Remembering sad and and happy events and imagining pleasant & unpleasant future events.
More beta during positive Ilian negative tasks at temp, and parictid areas; more beta activity al R temporal area during positive Ulan negative tasks.
Davidson et al (1990)
11 r-h f. F3/4, P3/4, T.3/4, C3/4.Alpha & beta 1.
Facial reaction to +ive turd -ive film clips; eyes-open baseline.
Facial disgust assoed. with less alpha in KFII comp, with happy coral & baseline hut not El I power. Happy eond. assoc.d widi more L- sided, anterior activ.
Ekman et al (1990)
31 r-h f. F3/4. P3/4, T3/4, C3/4.Alpha and beta 1.
Smiling reaction while observing +ive films.
Decrease in RF & R ant. temp, alpha power to non- Duchcnnc smiles comp, with hashne. Similar decrease for pariet.Bela -less aelivily in UP comp, with baseline.
Tomarken el .32 r-li!'. al (1990)
F3/4. P3/4, T3/4, C.3/4.Alpha.
Exposure to +ive & -ive film clips. Eyes open & closed baseline.
Exposure to video clips eliciting hap., disgust, sadness and anger. Eyes open & closed baseline.
Increased RE activ. assoc.d with heightened alTcct to -ive films. Increased relative Ml acliv. assoc.d with increased disparity between -ive and +ive responses. F3/4 baseline asymmetry significantly predicted global negative affect.
Greater relative I.II activ. to happy clips than sad. or disgust. Greater Ull acliv. to sad. and disgust than to happy.+ive group showed greater relative l.ll activ.: -ive group:grcaler relative
Jones & Fox 12 r-h f. F3/4, P3/4. T3/4.(1992) rated high Alpha,
in +ive affectivity;11 r-h f.
rated high in negative affectivity.

Wheeler et al (1993)
Schellberg et al (1993)
RH aetiv. +ive gp. showed greater 1.11 activ. to happy stimuli in temporal region; -ive gp: relative Rll aetiv. +ive gp. showed greater RF activ. to disgust; -ive gp. didn't. +ive gp. showed greater L aetiv. at parietal areas; -ive gp.:R activ. High degree of disgust assocd.with less power in RF eomp. with I.F. Intense sadness assoc.d witli less RF compared with sad. of less intensity.
81 r-h f. F3/4, P3/4. T3/4, 2 sessions, .3 Greater relative I.FC.3/4, F7/8, CZ, weeks apart, of exp activ.assoc.d withPZ, FZ. osure to video clips reports of more -fiveAlpha. designed to elicit
hap., fear & disgust. Eyes open & closed baseline.
affect to -five clips and less -ive affect to -ive clips comp, with R activation. Increased I.F' activ. & decreased RF activ. predicted greater -five affect to -five films. Only increased RF' activ. predicted increased -ive allect.
33 r-h m. 1-3/4, P3/4, 01/2, Films processed Lower della for dieT3/4, C3/4, T.V6, cognitively or einot.clips at midlineCZ, FZ, PZ. affectively (-five. comp.with neut.&Della, theta, tdpha 1 -ive & neut. clips). cog. conds.(7.5-9.5 Hz), alpha 2 Eyes open & closed Greater alpha 1 power(9.5-12.5 Hz), beta 1 baseline. for neg. com! than& beta 2. for cog. but not for
others. Thispower was greater at parietal thanoccip.areas.Greater beta 2 power for -five than odicr films (esp. neg.) at lempor;d sites.

Biondi cl 8m: 61. al (1993)
s e p .s ERP correlation Subjects scoringwith MMI'I above the medianDepression Seale showed rightscores. frontal lateralisation
;uid shorter P300 right-hem. latencies.
KEY: 1= female; m=male; r-hs=right-h;uiders; LII=left hemisphere; RH=right hemisphere; RE acliv. =right frontal activation; euph.=euphoria; LF=left frontal; dep.=depressive; Rl-l 1= right front;tl hemisphere; temp.=temporal; L-sided= left-sided; ;uit. tetnp.= anterior temporal; Sl:Ps=M>mulnscnsory evoked potenials.
It is clear from the table that studies by Davidson and others using: EEG measures have
found hemispheric asymmetries similar in normal subjects which appear to reflect the
clinical findings found with brain-damaged patients. The affective stimuli employed
normally comprise self-contained film clips, pm-rated for positive and negative affect,
although more naturalistic materials have been used by others (e.g., Schellcbcrg,
Besthom, Pfleger & Gasser, 1993).
An early study by Harman & Ray (1977) suggested that the affective response could
be characterised by asymmetrical patterns of EEG activity. Specifically, increases in
left hemisphere power were obtained during generation of positive memories with
decreases accompanying the generation of negative memories. Greater relative left
frontal hemisphere activation to positive film clips and greater right frontal hemisphere
activation to negatively rated film clips was later reported (Davidson et al, 1979).
It is important to note the use of the terms activation and power. Power refers to the
total activity generated in a given frequency; activation, however, refers to the
underlying activity which is usually inversely related to the amount of power. If, for
example, increases in alpha power were demonstrated, this would indicate decreased
underlying activation; if alpha power decreased, this would indicate increased
underlying activation. As Davidson (1988) notes, " Activation is typically defined
operationally on the basis of the methods used in a particular study. In general, all
measures assume that increases in activation are associated with increases in neural
activity- an increase in the number of depolarizing cells per unit time in large
populations of neurons. In the case of EEG, it has been shown that desynchronized
activity...is associated with an increase in the number of action potentials from
neighbouring populations of neurons."
Other studies by Davidson and his colleagues have demonstrated similar asymmetries to
positive and negative emotional stimuli (see Table 4.2) although the frequencies they
study have been limited, in most investigations, to the alpha band. This frequency is
the one argued to be most susceptible to the experience of emotion but a small number
of other studies have found affect-related changes in delta (Tucker & Dawson, 1984;
Ahern & Schwartz, 1985; Schelleberg et til, 1993), theta (Tucker & Dawson, 1984;
Ahern & Schwartz, 1985) and beta (Ahern & Schwartz, 1985; Ray & Cole. 1985;
Eckman, Davidson & Friesen, 1990; Schelleberg et til, 1993). For the slower
frequencies (delta), left frontal power has been found to increase to positive emotional
stimuli (Ahern & Schwartz, 1985), depression and sexual arousal (Tucker & Dawson,
1984) or has been found to be low in positive conditions relative to other emotions
(Schelleberg et al, 199.3). Theta changes have been less well-documented. Tucker &
Dawson (1984), for example, report increased theta in frontal leads relative to other
electrode positions but that this increase was not related to affective response. Ahern &
Schwartz (1985) note that increases in right hemisphere beta and theta were evident for
conditions of excitement and fear relative to happiness, sadness or a neutral condition
whereas Ray & Cole (1985) noted no effect of affect on alpha but reported increases in
beta at temporal and parietal sites for positive emotion. These authors also observed
mote beta activity in the right temporal area during positive than negative tasks. Cohen,
Rosen & Goldstein (1976) has also reported increased theta activity in the right

hemisphere during sexual orgasm, although the quality of the recording in such a
condition would make one doubtful of its integrity.
4.15 Approach-withdrawal behaviour.
The increases in left frontal/anterior activation to positive stimuli and increased right
frontal/anterior activation to negative stimuli reported in the alpha band have been
suggested as representing approach-withdrawal behaviour (Davidson, 1984; 1992;
Flor-Henry, 1983). This hypothesis argues that affective differences between the two
sides of the brain reflect different motivational tendencies (Ehrlichman, 1986). The
evidence for the hypothesis has been obtained from normal subjects and from
individuals scoring high on depression inventories. Schaffer, Davidson & Saron
(1983), for example, found that depressed subjects showed less left frontal baseline
activation than non-depressed subjects. Right frontal hemisphere EEG variability has
also been reported in depressive patients (Perris, Monakhov, von Knorring, Botskarev
& Nikiforov, 1978). However, studies employing different experimental conditions
(such as induction of euphoric/depressive states or self-generated depression/sexual
arousal) have reported alpha symmetry or no left sided-activation (Tucker, Stenslie,
Roth & Shearer, 1981; Tucker & Dawson, 1984). It could be argued that these latter
studies contain an element of motor and perceptual activity that is not present when
viewing a film and rating it for its affective valence. The studies using film clips may,
therefore, be more reliable in terms of the methods they employ. It should he noted,
however, that Harman & Ray (1977) who also requested subjects to generate emotional
memories reported increased left hemisphere power during positive affect when
compared with negative affect. A recent study using evoked potential measures has
demonstrated significantly greater right frontal hemisphere lateralisation in individuals
scoring high on depression (Biondi, Parise, Venturi, Riccio, Brunelti & Pancheri,

1993). The latency of the P300 in these individuals was also shorter at right
hemisphere sites.
The presence of increased left frontal activation has been suggested as a metric of
baseline emotional response. Wheeler, Davidson & Tomarken (199.3), for example,
report that increased left frontal activation and decreased right frontal activation
predicted greater affective response to positive films whereas Tomarken, Davidson &
Henriques (1990) report that baseline asymmetry at frontal electrodes significantly
predicted global negative affect. Taken together with the reports of decreased left
frontal activation in depressed subjects, these findings suggest a diathesis model of
affective response. As Davidson (19X8) notes, "right frontal activation may be
necessary but not sufficient for the experience of negative emotion. Its presence may
mark a vulnerability for negative affect, given an appropriate elieilor."
4.16. Approach-withdrawal behaviour and odour.
The relationship between approach-withdrawal and EEC is particularly interesting
when considering olfactory perception. As noted earlier, one of the more primitive
uses of smell is as a caveat warning an organism of fire, bad food, noxious gases in a
similar way to the quality of bitterness which may be used as a warning agent for
gustation (see Chapters 2 & 3). Hines (1977-8) remarks that the role o f the right
hemisphere in olfactory perception and spatial relations suggests the use of the sense of
smell as a spatial sense, detecting food with the nose, detecting olT-odours from rolling
food and so on. Rotting food is an excellent example of a stimulus inducing
withdrawal behaviour. Fallon & Ro/.in (1983), for example, suggest that distaste,
danger and disgust are the three primary bases upon which the rejection of food is made
by humans. The distaste category comprises "sensory-affective" rejection based on

unpleasant taste or "other sensory (typically chemical sense) characteristics". The
perception of off-odour or malodour may, therefore, induce aspects of re jection.
In view of the relationship between heightened negative affect and increased right
frontal EEG activity, such an odour might be expected to produce similar asymmetries
to those generated by pictorial stimuli. However, this hypothesis assumes that the
stimuli ate equipotential, i.e. they stimulate the same affective response in similar ways.
Similarly, it could be argued that pleasant-smelling stimuli would result in increased left
frontal or anterior activation (approach behaviour) if visual and olfactory affective
responses are comparable. Furthermore, it could be hypothesised that the internal state
of the subject might also affect the response to odour, especially food odour. Hungry
subjects might react differently to food odour than would a satiated subject (as noted in
Chapter 3). There are therefore two general hypotheses which may relate to food
odour: the first is that unpleasant, particularly alerting, food odours win generate
different asymmetries to pleasant food odours; the second is that the hunger state of the
subject will modify the subject's psychometric and electrophysiological reaction to the
smell of food.
The evidence for odours of opposing valence generating different EEG asymmetries or
even differences in the pattern of EEG, is rare. This outcome is not the result of a
failure to find or replicate but due to the fact that investigations have not considered
possible affective asymmetries in their analyses or considered how the hedonic
properties of an odour may be related to their effects on the brain. One study has
specifically set out to explore the EEG correlates of olfactory annoyance using
discriminant analysis to determine how much of the power spectra was related to
subjective ratings (Brandi, Kohal & Platlig, 1980). 8091 of the power spectra
classified as "very unpleasant" in this study coincided with the subjective ratings of

"very unpleasant". Another study, reported in a conference abstract, compared EEG
response from frontal, parietal and occipital sites to the odours of jasmine, lemon and
valerian (Kanamura, Okazaki, Sakurai, Okabe, Fukuda & Torii, 1990). These authors
reported that a pleasant odour did not always induce a good mood hut that self-reports
of a "good mood” were related to greater alpha variation in the frontal region. "Bad
mood" was associated with variations in the right frontal region. It is difficult to
establish, however, how these odours were presented, how the data were analysed,
how the "good/bad mood" variations in frontal EEG were related to the odour, or what
asymmetry metrics were used. Another conference report has demonstrated a method
of Olfactory Evoked Potentials in which subjects generate larger EPs to the pleasant
odour at left hemisphere sites and lager EPs to the unpleasant odour at right frontal sites
(Miltner & Braun, 1993). Further, indirect evidence, based on the ipsilateral
connections between the perceiving nostril and the receiving hemisphere, suggests that
negative odours are less pleasant when presented to the right nostril (Ehrlichman,
1986). This finding, however, was obtained when the results of three studies were
pooled together. Singly, no one experiment showed a significant difference in affective
rating between nostrils.
The evidence to suggest that there exists some association between the hedonic
properties of odour and hemispheric lateralisation. therefore, is sparse but suggestive.
No study to date has examined the relationship between odour valence and EEG
asymmetry. This relationship will be considered in Chapters 6 & 7.
4.17. Conclusion.
Although there appears to be little experimental cohesion in the olfactory EEG literature,
current evidence suggests that exposure to odour exerts a fairly direct effect on central
nervous system activity. Particular wavebands, especially theta, appear it) be

selectively affected according to odour type and odour concentration. Furthermore,
interactions between exposure to food odour and ingestion of food have been found to
produce marked effects on event-related potentials in some studies. Here, odour is
associated with reduced ERPs in hungry subjects but comparatively larger ERPs in
satiated subjects.
In the following chapters, a series of three experiments will attempt to answer particular
questions relating to the electrophysiological concomitants of olfactory perception and
food ingestion. The primary aim of these experiments is to determine the extent of the
effect of exposure to odour on the EEC and ERP using food-related stimuli. These
odours are varied and hedonically different (the importance of this hedonic difference
is explained below). Some investigations have reported no changes in particular
wavebands as a result of olfactory stimulation; others have reported either increases or
decreases in particular frequencies. A small number of other studies have found
variable effects of odour on the ERP. Part of the confusion in the EEC literature may
lie in the type and number of odours used, differences in presentation and the period of
EEG recording actually selected for analysis between different studies. No study in the
ERP literature, for example, has examined the effects of supraihrcshold odour on the
ERP. To overcome possible internal consistencies of this kind, the present experiments
will employ a fairly standard and consistent technique of EEG and ERP recording and
data extraction analysis. Details regarding the type of odour selected lor ERP recording
and ERP measurement are given in C hapter 5. Details regarding the type of stimuli
used in the EEG experiments are given in Chapters 6 & 7.
The second aim of the thesis is to investigate possible pre- and post-prandial differences
in the course of the EEG and the appearance of the ERP. A number of studies suggest
that changes in die EEG and ERP may reflect diurnal changes in CNS and ANS activity

(section 4.8.). Others have considered the role of recency of food ingestion in
affecting electrophysiological and metabolic behaviour (sections 4.8. & 4.9.). No
study has directly examined the effects of meal ingestion on the course of the EEG. If
increases in the amount of alpha frequency is reflective of relaxation, for example, one
might expect increases in alpha activity post-prandially. Furthermore, if the
conclusions of food analogue studies are correct then ingestion of a meal will result in
increased ERP amplitude and that this amplitude will be affected by the food's
interaction with the perception of food odour. Evidence from the alliesthesia literature
suggests that the hedonic rating of food-related items is significantly lower after the
ingestion of a meal than before. This outcome is dependent on the time of testing, the
content of the meal, the nature of the food stimulus and the sensory properties of the
meal. Normally, individuals are asked to rate the taste of particular foods after having
ingested various quantities or after experiencing satiety. The effects of ingestion on the
appreciation of odour are not clear. Few studies have explored the notion of negative
olfactory alliesthesia and this concept will be examined in more detail in Chapters 5,
6 & 7. The relationship between the perception of food odour and food ingestion may
be reflected in the ERP. Would fed subjects, for example, give larger amplitude ERPs
during exposure to food odour than would unfed subjects? If so, would this group-
difference in ERP be dependent on attention, satiety or other factors? A further
discussion of these questions is provided in Chapter 5.
A great deal of the evidence reviewed in sections 4.14, 4.15 and 4.16. suggests
that stimuli of opposing emotional valence may exert different effects on the EEG.
Specifically, the experience of positive and negative stimuli generates significant frontal
and anterior EEG asymmetries. Given the hedonic properties of some odours, it may
be possible to demonstrate similar asymmetries using olfactory stimuli, if the visual and
olfactory stimuli are, in fact, considered equipotential. Furthermore, if an olfactory

stimulus known to be a well-known caveat (such as rotten food) is presented then it is
arguable that withdrawal-related frontal asymmetries may occur during the presentation
of this type of odour. In the context of the ingestion of food, however, and the general
decrease in the hedonic rating of food which appears to occur post-prandially, these
asymmetries might be in evidence after ingestion. Would fed and unfed subject's
electrophysiological response to a food odour differ? The third, and final, aim of the
study is thus to explore the relationship between an odour's hedonic component and the
EEG response. This aim is more explicitly discussed in Chapters 6 & 7.
In his original study, Moncrieff (1962) cautioned that the EEG may be nothing more
than the waste-end product of the brain’s activity, "the smoke from smouldering
biochemical fires". The aim of the following studies is to observe the smoke and to
determine the factors necessary to spark some of these biochemical fires.

CHAPTER 5
EXPERIMENT 1:MEAL INGESTION AND EXPOSURE TO FOOD ODOUR: THEIR EFFECTS ON THE AUDITORY
ODDBALL ERP TASK.METHOD & RESULTS.
EXPERIMENT 1
METHOD
5.1. Introduction.
Studies of the variables affecting the amplitude and latency of the Event-Related
Potential have largely concentrated on factors such as stimulus probability, novelty, and
divided attention. A few studies, however, have focused on more ecological factors
such as mood state, recency of food intake, dual tasks and lime-of-day (Heninger,
McDonald, Goff & Sollberger, 1969; Kerkhof, 1980; Israel et al, 1980; Broughton,
Aguirre & Dunham, 1988). A decrease in the amplitude of the N1-P2 complex, for
example, has been found to occur from morning to evening (Browman, 1979;
Kerkhof, 1982) with the amplitude and latency of the N100 reaching a peak al mid-
afternoon and declining thereafter. Others, however, have reported no diurnal
differences in the ERP (Heninger el al, 1969; Dalbokova & Kolev, 1989; Geisler &

Polich, 1992a,h.), have found larger amplitudes in the evening than morning
(Wesenstein et al, 1990) or have reported interactions between "diurnal type" and time-
ol'-day. Kerkhof (1980), for example, found that morning-type subjects gave
maximum N105-P194 values at 10 a.m. whereas intermediate evening/morning-
preferring types gave largest amplitudes at mid-late afternoon. A similar study has
found greater amplitude ERPs in both the visual and auditory modalities in the morning
for morning types and the reverse pattern for the evening-types (Kerkhof et al, 1980).
The N1-P2 complex is not the only ERP component to show inconsistencies. The
effects of time-of-day on the P300 have generated similar discrepancies. One
explanation for this inconsistency has been related to the subject's recency of food
ingestion and its effects on P300 amplitude (Geisler & Polich, 1990; Geisler & Polich.
1992a, b). Individuals starved for 6 hours have been shown to give larger amplitude
P3(K) than individuals starved for .3 hours (Geisler & Polich, 1992a). P.300 elicited 3
minutes after food ingestion has also been found to be larger than that elicited pre-
prandially (Geisler & Polich, 1992a). Unfed controls, however, were not used in these
studies in order to avoid the use of a wilhin-groups design. The authors argue that a
between-subjects design was more suitable in manipulating the "primary variable of
activity-preference, food and time-of-day" and suggest, in support of this design, that it
has the added advantage of not disrupting the subject's normal schedule of eating. It
would be advisable, however, to include some form of control in order to account for
pre-prandial group differences that were present and were not due to the intake of the
food. Furthermore, relying on the subject's self-report for when he or she last ingested
a meal might not provide the experimenter with much control over the actual food intake
pattern of these subjects. In fact, a remedial procedure whereby the subject is fed by
the experimenter has also been reported (Geisler & Polich, 1992a). In this study,
subjects were fed with peanut butter jelly sandwiches, and apple and a fruit drink with

the micronutrient content of the food unreported. Whether subjects were satiated by
this food and whether it was familiar to them as a meal or was novel, was also
unreported. Studies from food analogue studies would suggest that the satiety
produced by the ingestion of the meal is capable of producing marked alterations in the
ERP, as noted in Chapter 4 ( section 4.9.). Monitoring the subject's meal intake
and recording the degree of satiety would thus appear to be an important variable in the
study of meal-related alterations in the ERP.
Food analogue studies using cholecystokinin and saline have argued that the higher
amplitude N1-P2 and P300 witnessed in satiated subjects is the result of increased
attention to the task (Stacher et al, 1979). If this is so. then it is arguable that a food-
related stimulus might produce increased distraction in those subjects who remain
hungry and would therefore elicit smaller ERP amplitudes, and possibly slower
latencies (Stacher et al, 1979; Pielrowsky et al, 1989). Food odour may be capable of
distracting a hungry subject but not a satiated one; reduced amplitudes during exposure
to food odour should then be apparent in hungry subjects but not in satiated subjects.
There is some evidence to suggest that exposure to odour does influence the amplitude
of the ERP (Lorig, Huffman, DeMartino & DeMarco, 1991), but the use of food odour
and the combination of ingestion with exposure to food odour has not been considered.
This latter study, in fact, found increases in amplitude as a function of exposure to
odour and increasing concentration which seems to be at odds with the explanation
given in the study that the odour was distracting (see Chapter 4, section 4.11.).
In the following experiment, the involvement of time-of-day, food ingestion and
olfactory exposure to the alteration of N KM), P2(M) and P3(X) amplitude and latency are
assessed in an auditory oddball task using a within-suhjeets design. In order to ensure
that the food eaten is typical of the subject’s normal diet, hot, cooked versions of

familiar food arc used as ihe experimental group's lunch. To ensure that ingestion
effects may not he the result of differences between groups, both the experimental
group and control group are tested twice, once before mid-day, and once and hour
later. The experimental group receives its meal during the inter-session interval. If
diurnal variation is instrumental in producing alterations in ERP amplitude, then no EP
differences between groups should emerge at either testing session. If lunch ingestion
does affect the P300 in a manner similar to that reported elsewhere, then amplitude
should markedly increase. Furthermore, if the subject’s satiated state has any atlention-
realted effect on the size of the ERP, then the combination of exposure to food odour
and hunger in lasted subjects should result in lower amplitude ERPs compared with
subjects who are fed.
5.2. Subjects.
16 right-handed non-smokers responded to an advertisement posted in the department
of psychology and around campus at the University of Warwick, requesting volunteers
for an experiment in psychophysiology. Age ranged from 18 to 44. The subjects were
randomly assigned to two groups of eight: Group 1 (2 males; 6 females) would receive
no lunch in between the two testing sessions; group 2 (4 males; 4 females) would
receive a prescribed lunch. Handedness was measured using a variation of Annetl's
Hand Preference Questionnaire (Annett, 1970; see Appendix HI). Although one
group was balanced for sex, sex was not considered a variable in either this or the
experiments reported in Chapters 6 and 7. The relevance of the sex of subjects in
olfactory testing continues to be controversial (Koelega, 1994). While some studies
report female superiority for olfactory detection and identification and superior olfactory
sensitivity in women (c.g., Wysocki & Gilbert, 1989; Doty, 1991) others have shown
better detection for some odours but not others (Cain & Gent, 1991; Koelega & Rosier,
1974; Koelega, 1970; 1994). Since the present experiments do not examine explicitly

the phenomenon of olfactory sensitivity nor the superior ability to identify, the variable
of sex was not controlled in a systematic way. It was considered sufficient that
subjects be able to smell the odours presented and since all odours were delivered at
suprathreshold concentrations, this criterion was met. It is possible, however, that
female subjects might differ from their male counterparts in terms of the amount of food
consumed or in the ratings given to food odours after ingestion. However, although
some previous studies of alliesthesia and sensory specific satiety have reported greater
food intake in males than females (e.g.. Rolls et al, 1982; Rolls er al, 1984) no sex
differences have been reported in the subjective ratings of the pleasantness of the
stimuli used(Duclaux et al, 1973; Rolls er al, 1982; Rolls et al, 1984). Since the
puipose of the meal was to induce satiety, it was assumed that all subjects would eat as
much as they could to fullness. Thus, although males may eat more of the food than
females, both sexes would be similar in terms of the satiety experienced. Any subject
- regardless of sex- who followed a strict dietary regime was considered unsuitable for
the experiment and rejected at the recruitment stage.
Subjects were requested to have eaten no food for at least three hours before the start of
the experiment. Further instructions included the avoidance of the use of perfumed
products on the day of the experiment, the avoidance of the ingestion of any spicy,
pungent meals on the evening before and morning of the experiment and any heavily
caffeinated products (coffee, tea, cola) on the day of the experiment . In order to
determine the subjects' discriminatory ability and to screen for anosmia, a forced-choice
odour discrimination test was administered prior to the testing session. This required
the discrimination of a blank from three detectable odours and the identification of the
three odours (see Appendix B5). All subjects successfully completed this lest and
all reported no neurological injury, physical ailment, allergy or the use of medication.

5.3. Procedure.
Subjects were tested individually and entered the laboratory at either 11 a.m. or 12 p.m.
having followed a fasting regime for three hours before arrival. After screening for
anosmia, they were informed that they were to participate in an experiment in cognitive
neuropsychology. 28 tin-electrodes attached to an elasticated cap were applied to the
scalp following the 10/20 electrode placement system and referenced to linked earlobes.
This cap was attached by elastic straps to a band placed around the subject's chest.
This ensured that the cap remained in a fixed position throughout the experiment.
Electrodes were filled with high-conducting electrode gel (potassium/sodium chloride
Electro-gel). Impedance was below lOkohms. After the application of the electrodes,
subjects were tested in an ollactorium- a well-ventilated, aluminium-shielded, purpose-
built room designed for olfactory experimentation. This room covers an area of 7 m l
and contains vents for the dispersal of lingering odour. Temperature inside the room
was kept constant at 19‘C. Subjects were fitted with occluded goggles to prevent
extraneous visual stimulation and were instructed to keep their eyes closed in order to
reduce ocular artifact. The nature of the auditory oddball task was explained to them
and headphones applied. Subjects were seated in a comfortable arm-chair and were
requested to keep as still as possible, with their feet on the ground and their hands in
their laps or on the arms of the chair. This instruction was given in order to obviate
beta artifact produced by gross muscle movement. Before the task began, subjects
were further requested to breathe in through the nose and exhale via the mouth (in order
to prevent retro-nasal breathing) and were told to feel as relaxed as possible. When
subjects reported being adequately comfortable, the nature of the task was re-iterated
and the ERP recording began (see section 5.4, below). The presentation of the
odours is described below.

After completing the oddball task, subjects were led out of the olfaciorium and were
assigned to one of two conditions. Half of the subjects remained in the laboratory
under experimental supervision; the other half were led away to receive a prescribed
lunch. This standard hot lunch comprised a first course of vegetable soup (Heinz, 210
g) with brown roll followed by a main course of baked beans (Tesco, 22()g) with baked
potato (400g, unbuttered), and a cup of concentrated orange juice (140 ml). The foods
were selected were relatively high in carbohydrate, although no attempt was made to
control specifically the nutritional aspect of the meal. The choice of food was made on
the evidence reviewed in Chapter 3 with the aim of presenting subjects with foods
which they would find satiating and which would reduce subjects' feelings of hunger.
The results obtained supported this choice with all subjects who received the prescribed
food reporting satiety after consumption. The cooked foods were healed in a 650 watt
microwave oven in accordance with manufacturer's instructions.
Following this thirty minute break, subjects were led hack into the laboratory and
electrodes were re-applied. Subjects performed the same task as in the first session
with odours presented in counter-balanced order. After the completion of all live trials,
the electrodes were removed and subjects completed a brief psychometric test which
required them to rale each odour that had been presented in the experiment, on three
dimensions: pleasantness, strength and familiarity. These dimensions were represented
as 8.5 cm. analog Likert-like line scales with poles representing pleasant-unpleasant (0-
8.5 cm.), strong-weak (0-8.5 cm.) and familiar-unfamiliar (0-8.5 cm.) |see appendix
B2). These poles were alternately reversed to detect response set. Subjects marked
their responses along these dimensions and were allowed to sniff each of the odours for
as long as they wished. They were told, however, to complete the task as briskly as
possible and not to dwell on any particular odour. Subjects were also asked to identify

each of the odours. After completion of this test, subjects were debriefed, paid and
received a free brain-map.
5.4. Task.
The subjects' task was to perform a standard auditory oddball counting exercise. This
requires the silent counting of the number of low tones in a series of high and low tones
where low tones comprise approximately 25 % (32 tones) of the total stimuli.
Although some studied have favoured finger tapping as an observable, behavioural
indicator that the tones are being recognised, silent counting was employed here in
order to minimise movement. Silent counting has also been found to produce clearer
ERPs than do finger-tapping paradigms (Polich, 1987). The tones were delivered via
headphones. This task was undertaken six times. The first trial was a no-odour
practice designed to familiarise the subject with the task. The second trial comprised
the control condition where no odour was presented. Trials 3-6 were undertaken in the
presence of one of four food odours, in counter-balanced order. The odours were:
coffee dissolved in hot water (Nescafe, 1 12 ml, presented in a plastic beaker),
vegetable (2 microlitres of concentrate presented on a perfumer's strip; this odour
emitted an odour similar to that of potato), lemon (2 microlitres) and strawberry (2
microlitres). Pilot testing demonstrated the suprathreshold quality of the odour but
odours were also isointense. Apart from the coffee, all odorants were supplied by
Quest International.
The odours were selected on the basis of their representativeness of the sweet-savoury
dimension and on their relative familiarity. The "vegetable" odour used in the
experiment mirrored that of the baked potato used in the lunch. The odour of coffee
was selected to represent the aroma of a well-known beverage which subjects would
associate with a lunchtime meal. This odour is relatively well-identified (Desor &

Beauchamp, 1974). Both the lemon and strawberry odours were chosen on the basis
of their nearness to the category of dessert. These are normally regarded as pleasant-
smelling.
The odours were presented approximately 7 cms from the midline of the subject's face
at the beginning of each trial and removed at the end of the final tone. A 1-min interval
was allowed between each trial in order to allow the lingering smell of the previous
odorant to disperse. This "rest" period also allowed subjects to move their limbs and
maintain alertness before the beginning of the next trial.
5.5. ERP recording apparatus.
Auditory evoked potentials were recorded using a Neuroscience Brain Imager Series 111
model (see appendix C l). Tones were generated at 70-80 dB and were of 1 second
duration. Standard (high) tones were set a 1KH/.; target (low) tones were set at 5(X)Hz.
One trial comprised 32 target tones, i.e. 25% of the total number of tones. Filters were
set at 1.05 and 80Hz. Waveforms were averaged on-line.
5.6. Data reduction.
A sub-set of electrodes was selected for analysis. These electrodes were the customary
EP electrodes (FZ, CZ, PZ) and eight others selected to represent frontal (F3, F4),
central (C3, C4), parietal (P3, P4) and auditory-temporal regions (TCP I, TCP2) (see
Fig. 5). The additional electrodes were chosen in order to provide a "spread" of
electrodes covering the major lobe locations (Johnson, 199.3). ERP records were
visually inspected for artifact. Any record contaminated by eye-movement artifact was
removed. Five EPs were used in subsequent analysis: Target NlOO, P200 and P.300
(target condition) and standard NlOO and P200 (standard condition). The largest
negative wave occurring between 50 and 140 milliseconds following stimulus onset


was designated Nl(X); the largest positive waves appearing between 140 and 250 and
between 250 and 400 were designated P200 and the P.300 respectively. Peak latency
was defined as the point of maximum amplitude within the designated lime-window.
RESULTS
5 .7 . Psychometric data.
5.7.i. Odour identification.
To determine any differences between odours in terms of their identifiahility, Cochran's
test for repeated measures design and two response categories was applied to the data.
Following the procedure adopted by Davis (1981), odours were assessed as either
correct or incorrect and assigned the value of 'O' if incorrectly labelled (or if a subject
was unable to retrieve a name or descriptor) and T if the odour was correctly
identified. Also within this category resided any identification which belonged to the
same narrow class as the stimulus odour. Although this identification criterion was
applied pre-analysis for fear of a small number of direct identification hits, it was rarely
used since the majority of subjects labelled the odours correctly. A pair-wise sign test
revealed no significant differences between odours for identifiability (coffee vs
strawberry, p=0.063; coffee vs lemon, p=(). 125; coffee vs vegetable, p=0.25;
strawberry vs lemon, p= 1.00; strawberry vs vegetable, p=0.68; lemon vs vegetable,
p=1.00). T a b le 5a shows the odours ranked for identifiability and familiarity, from
most identifiable/familiar to least identifiable/familiar (see sec tio n 5.7.U., below).

Table 5a. Odours rated for familiarity (most to least familiar, means with standard
deviations in brackets) compared with odours most correctly identified.
Familiarity Identification
Coffee 0.23 (0.3) Coffee
Lemon 0.56 (0.9) Vegetable
Strawberry 1 (1.9) Lemon
Vegetable 1.2(1.03) Strawberry
5.7.H. Psychometric ratings: pleasantness, strength and familiarity.
A two-way repeated measures analysis of variance was applied to the psychometric data
with odour as a within subjects factor and lunch as the between subjects factor. Means
and standard deviations for the strength and pleasantness dimensions are displayed in
Table 5b.
Table 5b. Odours ranked for pleasantness (most pleasant to least pleasant) and
strength (strongest to weakest). Means with standard deviations in brackets.
Pleasantness Strength
Strawberry
Lemon
Coffee
1.18 (1.6)
1.26(1.5)
2.54 (2.8)
Coffee
Strawberry
Vegetable
Lemon
0.63 (0.6)
0.84 (1.01)
1.00 (0 .8 )
1.27 (0.9)Vegetable 5.88 (2.3)

No significant main effect of lunch was found on any of the dimensions (pleasantness:
[F (1,14)=0.122, p=0.732]; strength |F (1,14)=0.()()7, p=0.933J; familiarity |F
(1,14)= 1.71, p=0.212]). Neither was a significant main effect obtained for odour
strength or familiarity (strength: [F (1,14)=1.84, p=(). 172, Greenhouse-Geisser
corrected]; familiarity [F (1,14)=2.21, p=(). 100, G-G corrected]). Correlations
between the pleasantness ratings and strength ratings (see T a b le 5c below) indicated
no statistically significant relationship between these two dimensions for any odour
indicating that the odours were not rated for pleasantness on the basis of strength and
vice versa. From T a b le 5 b , however, it would appear that there are marked
differences in the subjective pleasantness ratings, especially between vegetable and the
other odours.
A significant effect of odour did emerge for odour pleasantness (F (1,14)=2 1.49,
pcO.OOl, G-G corrected). Post-hoc Tukey's tests revealed that the effect was due to
the vegetable odour. This odour was rated significantly less pleasant than coffee
(p=().(X)5), strawberry (p=().00023) or lemon (p=0.00025). Fig. 5.i. illustrates this
difference more clearly.

1 00Table 5c. Correlations between dimensions by odour. Significant values are
signified by an asterisk (p<().()5).COFFEE
PLEASANTNESS STRENGTH FAMILIARITY
PLEASANTNESS LOO
STRENGTH -0.023 1.00FAMILIARITY -0.018 0.631 * 1.00
STRAWBERRY
PLEASANTNESS STRENGTH FAMILIARITY
PLEAS ANTNliSS LOO
STRENGTH 0.257 1.00
FAMILIARITY 0.215 -0.07.3 1.00
LEM ON
PLEAS ANTNESS STRENGTH FAMILIARITY
PLEASANTNESS 1.00
STRENGTH 0.253 LOO
FAMILIARITY 0.152 0.454 1.00
VEGETABLE
PLEAS AN'INESS STRENGTH FAMILIARITY
PLEASANTNESS 1.00
STRENGTH -0.428 1.00FAMILIARITY -0.13 0.309 l.(X)
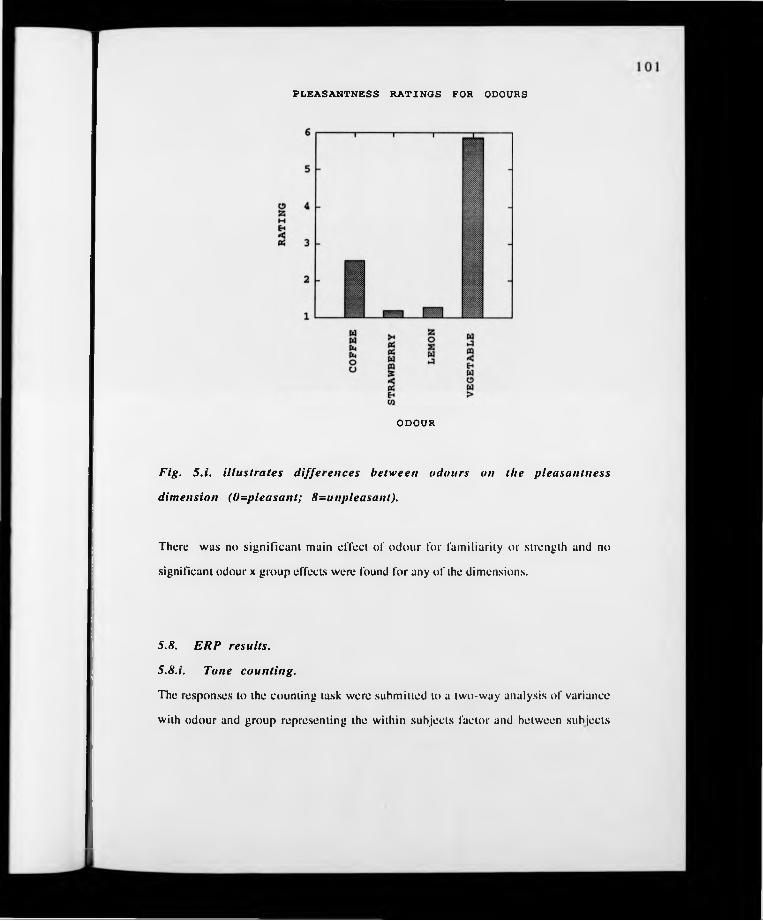
PLE A S A N T N E S S R A T IN G S FOR ODOURS
O D O U R
Fig. 5.i. illustrates differences between odours on the pleasantness
dimension (0=pleasant; 8=unpleasant).
There was no significant main effect of odour for familiarity or strength and no
significant odour x group effects were found for any of the dimensions.
5.8. ERP results.
5.8.i. Tone counting.
The responses to the counting task were submitted to a two-way analysis of variance
with odour and group representing the within subjects factor and between subjects

factor, respectively. There was no main effect of odour [F (1,14)=0.18, p=0.80) or
group [F (1,14)= 1.45, p=0.25]. No significant odour x group interaction was
obtained.
5.8.H. Amplitude data.
The data for each ERP component were analysed using a three factor (odour x group x
time-of-day) repeated measures analysis of variance (SYSTAT Inc. statistical
software). Each component (as well as each ERP measure- amplitude and latency)
was analysed separately.
(a) Effects on N100 amplitude.
There was no significant main effect of odour at any electrode site for the N100 to
target (low tones) or standard (high tones) stimuli. No group or time-of-day effects
were obtained. Neither were any of the group x odour, time-of-day x group, nor
odour x group x time-of-day interactions significant.
(b) Effects on P200 amplitude.
(b) i. Was there an effect o f group or odour?
A significant main effect of odour was obtained at FZ and at audilory/temporal regions
for the standard P200. All p values are corrected using Greenhouse-Geisser. (FZ: |F
(4, 48)=4.11, p=<0.01 ]; TCP1: [F (4,24)=3.39, p=i).04J; TCP2 |F (4,20)=4.34,
p=0.03]). The main effect at FZ was limited to amplitude for the blank being greater
than that for strawberry (t=4.01, df (13), p=().(M)l). Since the number of pairwise
comparisons is rather large, the Bonferroni principle was invoked in order to produce a
more conservative p value (0.05/number of pairwise comparisons) and to reduce the
likelihood of Type 1 errors. Thus, at the left audilory/lemporal area the odour of
strawberry was associated with a larger P200 than was the odour of lemon (1=3.62, df

(10), p=0.005) or vegetable (t=4.16,df (7), p=0.004). Right-sided amplitude,
however, was larger during exposure to the odour of coffee than vegetable, although
the conservative estimate of p would not allow this to be declared significant (t=2.84,
df (6), p=0.03). There was no significant main effect of group on either the target or
standard P200 at any electrode site and no main effect of odour was obtained for target
P200.
(b) ii. Was there an effect o f time-of-day?
Differences in amplitude between the two testing sessions were obtained in order to
explore possible diurnal changes in the ERP, to the exclusion of lunch and odour. A
significant main effect was obtained at the right "central" region for standard P200 |C4:
F (1,11)=5.43, p=0.04) with amplitude in this area being higher in the afternoon than
in the morning (t=2.12, df (12), p=().()5). Them were no other main effects of time-of-
day for standard or target P2(X).
(b) Hi. Did exposure to odour interact with group or time-of-day?
An odour x time-of-day interaction was obtained for the left frontal region |F3: F
(4,44)=4.07, p=().015). This interaction was due to a trend for the amplitude of the
standard wave during exposure to the vegetable odour to be larger in the afternoon than
the morning (1=2.08, df=12, p=0.06). There were no other odour x time-of-day
interactions for standard P200. No significant group x time-of-day interaction was
obtained for standard P2(X) amplitude.
A significant three-way interaction was obtained for target P200 at CZ |F (4,44)=3.11,
p=0.049) and FZ |F (4,28)=4.412, p=().()2). Post-hoc tests revealed that the effect at
CZ was restricted to the differences between the a.m. and p.m. amplitude of the lunch
group. Target P2(X) amplitude was significantly larger after lunch than before (t=2.63.

df (6), p=0.039) and appears to mirror the effects obtained previously in other studies
with the P3(X). The effect at FZ showed that the control group showed a significant
decrease in amplitude to the vegetable odour in the afternoon (1=2.59, df (7). p=0.036).
(c) Effects on P300 amplitude.
No main effect of odour, group or time-of-day was obtained for P300 amplitude at any
electrode site and no significant interactions emerged.
5.8.iii. Latency data.
(a) Effects on N100 latency.
There were no significant main effects of odour or group for any electrode site for
either target or standard Nl(X) latency although FZ showed a significant effect of time-
of-day for the target tones only [F (1,9)=5.53, p=0.043|. NMH) latency at this location
was significantly longer in the afternoon than the morning (t=2.31, df (12), p=0.()40).
A significant odour x time-of-day interaction was also obtained for target tones in the
left parietal region [P3: F (4,12)=8.09, p=().()2]. This interaction was due to the
vegetable odour which produced longer latencies in the afternoon compared with
morning performance (t=2.82, df(l 1), p=().()17).
(b) Effects on P2U0 latency.
(b) i. Was there a main effect o f group, odour or time-of-day?
A significant main effect of time-of-day was obtained at FZ for the target tones (F
(1.11 )=4.87, p=0.049). Post-hoc analysis revealed that a decrease in latency was
evident in the afternoon compared with morning (1=2.49, df (10), p=0.032). There
was no main effect of odour or group on P2(M) latency for either the target or standard
stimuli.

(c) Effects on P300 latency.
(c) i. Was there a main effect o f odour, group or time-of-day?
A significant effect of time-of-day was obtained at both left and l ight frontal sites [F.3:
(F (1,5)=7.08, p=0.044); F4: (F (1.7)= 19.00. p=0.0032)]. At both locations,
latency was longer in the afternoon than in the morning [F3: (t=2.93, df (6), p=().()26);
F4: (t=4.65, df (8), p=0.002)]. No significant main effects of odour or group were
obtained for P3(X) latency, neither were any three-way interactions obtained.
5.9. D iscussion.
5.9.i. Alliestltesia.
There were no post-prandial changes in the hedonic ratings of the food odours obtained
in the present experiment, a finding which is at odds with some previous findings
(e.g„ Ducleaux et al, 1973). At the extreme end, it is arguable that genuinely olfactory
alliesthesia does not exist as a replicable phenomenon even though negative gustatory
alliesthesia can be quite clearly demonstrated. In support of the extremist approach, a
number of studies which have sought to demonstrate olfactory alliesthesia have either
found little effect of ingestion on hedonic perception of odour (Warwick et al. 1993) or
have engineered satiety by giving infusions of glucose (Cabanac, 1971), thus depriving
the subject o f the sensory information obtained from normal eating. Yet, the lack of
replication does not explain the appearance of such a finding in the first instance. An
alternative, less extreme, explanation is that the pleasantness rating of food would be
obtained on condition that subjects rated food odours that were pai l of the meal ingested
between rating sessions. In the present experiment, however, such an hypothesis was
tested: Fed subjects rated a vegetable smell closely resembling that of baked potato (part
of the lunch) but did not give significantly different pleasantness ratings to those given
by unfed controls. Furthermore, in the one study which did report negative allicsthesia
in a realistic setting, the odours which showed evidence of allieslhesia did not comprise

part of the experimental meal (Dueleaux etal, 1973). The post-prandial hedonic ratings
of the odours of cheese, fish and beef were lower than pre-prandial ratings even
though these foods were not eaten. As a supplementary hypothesis, one could argue
that those odours associated with the third-course of a meal (e.g., coffee, dessert)
might be expected to increase in pleasantness following the ingestion of a savoury main
course, yet this effect was not found in the present study and would appear to confirm
Ducleaux et al ( 1973)'s stable pie- and post-prandial ratings for the odour of coffee.
A further possibility is that the range and number of odours used in the present study
was too limited to allow post-prandial effects to be found. In one study, for example,
nine food odorants weie rated pre- and post-prandially while only three odours showed
evidence of negative alliesthesia (Ducleaux et al, 197.3) even though another study has
used only one odorant and reported changes in the odour's rating for pleasantness after
intake of glucose (Cabanac, 1971). Thus the possibility arises that the hedonic
perception of only specific types of food odour are specifically affected by ingestion of
food or satiety so that the use of a large number of odorants will determine those odour
that are affected (this possibility is addressed in the next experiment. Chapter 6).
5.9.ii. Did lunch affect the P300 or any other ERP component?
The results of experiment 1 do not appear to support the finding that recency of food
ingestion is associated with increased P300 amplitude. Geisler & Polich ( 1992a) found
that food ingestion three hours prior to the experiment was associated with a significant
increase in P300 amplitude when compared with subjects who lasted for six hours. No
such increase in P300 was observed in the present experiment, however, although a
significant alteration in the amplitude (and latency) of other ERPs was found to be
related to lunch ingestion. Target P2(X) amplitude, for example was significantly higher
in the Lunch group than in controls.

In view of the striking lunch-related changes in ERPs reported elsewhere, the lack of a
food effect on P300 is surprising. Table 5d illustrates the methodological differences
between the present study and that of Geisler & Polich (1992a, h). Differences in
methodology are often cited in ERP studies as factors responsible for producing
negative results or inconsistency of results between studies. In the present experiment,
several methodological procedures were adopted in order to improve the validity of
study. In other studies, subjects were instructed not to eat for a given period prior to
testing, either three hours or six (Geisler & Polich, 1992a). Subjects in another study
were instructed not to eat from the evening prior to the day of the experiment, i.e.
subjects were fasted for 15 hours (Geisler & Polich, 1992b). In the present study,
subjects were requested to refrain from eating for three hours prior to the first testing
session. Given that the inter-session interval was of approximately one hour's
duration, the control group would have fasted for at least four hours prior to the
second, "post-prandial" session. All subjects gave self-reports of feelings of hunger at
the end of the first testing session. Those subjects fed prior to the second testing
session gave self-reports of satiety and fullness.
Thus, although not controlled in a particularly Draconian way, the nutritional status of
the subject was controlled in a fashion not reported in previous investigations where the
subjects' ingestion of food was not controlled, where subjects’ self-report regarding
their affective and nutritional state (full/not full, hungry/nol hungry) was not considered
and where the amount of food eaten was not monitored. The focus of previous studies
appears to have been, perhaps erroneously, on the physiological effects of recency of
intake rather than on the 'psychological' effects of intake.

108
T a b le 5d illustrates methodological differences between the present experiment and
those of Geisler & Polich (1992 a, b).
GEISLER & POLICH MARTIN (1993)
1992 a i. (1) 3 or 6 hour fasting period. 3 hour fasting period.(2) 24 subjects in each condition. 8 subjects in each.(3) FZ, CZ & PZ electrodes. FZ, PZ, CZ, TCP1,
TCP2, F3, F4, C3, C4, P3, P4.
(4) Tones every 2 seconds. Tones every 1 second.(5) 4 trial blocks (20 targets). 5 trial blocks,
presented twice (32 targets).
(6) No subject fed. Subjects fed.(7) 1000Hz/2(KM)Hz tones. 500Hz/l<XX)Hz. tones.(8) Finger-tapping discrimination. Silent counting.
1992 a ii. (1) Subjects fasted for 15 hours. As above.(2) 12 subjects per condition. As above.(.3) 3 blocks of trials presented 5 blocks presentedbefore and 5 and 30 minutes after before and 15 minutesingestion. alter ingestion.(4) Snack lood.(5) Plus (7) & (8) as above.
Hot, cooked meal.
1992 b . (1)8 groups of subjects (N=64). As above.(2) Groups divided by activity preference. Not divided.(3) Fasted for 3 or 6 hours. As above.(4) A.M. group tested at 8 or 11 a.m. All subjects tested at
P.M. group tested at 5 or 8 p.m. 11 a.m. and 1 p.m.
The nature of the ingested food in the the present study also differs from that previously
reported. Geisler & Polich (1992a), for example, presented subjects with snack-like
material. Other studies, such as those reviewed in s e c tio n s 4 .9 . & 4 .1 2 of
C h a p te r 4 and in se c tio n 5 .1 ., have used food analogues such as cholccystokinin

(vs a saline infusion), or in alliesthesia studies, glucose (Cabanac, 1971; 1979). The
subjects in the current study received a hot, cooked meal, the contents of which were
designed to be as close to a hot, satiating lunch as possible. The foods were substantial
and contained large amounts of carbohydrate. Thus it is possible that these differences
between the meals presented in the different experiments may be responsible for the
absence of the P300. This is not to argue that recency of meal ingestion has no
significant effect on the P300 but that different meals with markedly different
constituents might affect brain electrophysiology differently. Perhaps more
importantly, the alteration in P300 might be dependent not only on the type of food
eaten but on the affective response of the subject to the ingested meal, i.e. the subject's
feelings of hunger and satiety. The authors of other studies have argued, however, that
the effects of food ingestion on the P300 demonstrate a role for meal consumption in
the alteration o f brain metabolism (Geisler & Polich 1992 a, b). Given this hypothesis,
it is surprising that a standard, cooked meal should have had no effect on brain
metabolism. The times of testing were comparable between studies so that differences
in the rate of metabolism could not plausibly be responsible for the discrepancy.
There are also minor differences between these sets of studies although these
differences would not appear to have affected the results in any radical way. The
number of tone-blocks presented differed but not markedly so; the pilch of the tones
also differed with Geisler & Polich (1992a, b) using higher pitches and larger
qualitative differences between low and high tones (1()(M)H/. and 200013/ compared
with the present study's 1000Hz and 500H/.). The difference in pitch, however, could
not realistically be argued to have affected the outcome of these experiments. Subjects
in both were still able to distinguish one quality of tone from another and were thus
capable of the discrimination required in order to elicit an auditory oddball ERP.
Another source of difference may be the method of discrimination that the two studies

use. Geisler & Polich (1992a), for example, required subjects to indicate the presence
of a target tone by tapping their fingers; in the present study, subjects silently counted
the numbers. Silent counting has been reported to be a more effective method of
eliciting ERPs (Polich, 1987) so if any effects of lunch did exist, silent counting might
have enhanced their appearance.
In the present study, there was a significant group x odour x time-of-day interaction for
target but not standard P2(X) amplitude, supporting a previous report of diminished N 1 -
P2 amplitude in subjects satiated by a bolus injection of CCK and exposed to the noise
and smell of meal preparation (Stacher el al, 1979). Subjects in the lunch group gave
significantly higher P200 amplitude post-prandially than did control subjects who
received no meal. It has been argued that the P200 and P300 target components may
overlap considerably thus resulting in the effects on one being masked by the other.
Given this possibility, it is open to debate whether the effect of lunch found on target
P200 amplitude in the present study is simply a concealed effect on overlapping
components. It is more probable, however, that the effect of recency of food intake
may be general to late positive-going ERP changes and not specific to the P300.
Geisler & Polich (1992a) noted increases in P200 amplitude in subjects who had
recently eaten a meal compared with those who had not and suggest the possibility that
the lunch effect may not be specific to a particular ERP. The results from the present
study lend support to this hypothesis.
5.9.W. Did odour affect any ERP component?
Contrary to the previous finding on odour and ERP, no effect of odour was obtained
for the P300. A significant main effect of odour was obtained for standard P200
amplitude, however, at CZ. Here, the EP amplitude during exposure to strawberry
was significantly smaller than that to a blank, irrespective of recency of ingestion. At

auditory-temporal sites, there were additional bilateral olfactory influences for standard
stimuli with right-sided P2(M) amplitude being greater to coffee than to vegetable and
left-sided P2(X) amplitude being greater to strawberry than lemon. The vegetable odour
was also associated with shorter P200 amplitude in the unfed group during the second
recording session. The odour x lime-of-day x group interaction obtained demonstrates
for the first lime that unfed, hungry subjects' P200 amplitude may be selectively
diminished hy exposure to a food odour.
Selective diminution of the P200 has been reported following distraction (Millner,
Johns, Brach & Larbig, 1989) and lowered attentional demands (Courchesne,
Courchesne & Hillyard, 1978). It is plausible that the divided nature of presenting an
ERP task with olfactory exposure might generate similarly stunted P200 amplitudes
when compared with a blank control. This, in fact, was apparent but for the strawberry
odour only. It was also apparent for the three-way interaction obtained. Subjective
self-reports suggested that the odour of strawberry was rated the most pleasant of those
used but was also the least well-identified. It is possible that the difficulty in
identifying such an odour might have produced this attention-related diminution.
Furthermore, odour had selective effects at other sites. If the distraction/laek of
attention hypothesis of ERP diminution is correct, then the findings here suggest a
hierarchy of distractability based on individual electrode sites and odours. Thus
vegetable odour produced greater distraction than the odour of coffee and lemon odour
produced greater distraction than the odour of strawberry at right and left temporal sites
respectively. The use of citrus odours to increase alertness has been reported in a
number of Japanese industries (Manley, 1993). It is possible that odour of lemon used
in the present study diminished the P200 as a result of its alerting properties. The
odour of strawberry, on the other hand, is not as sharp as that of lemon and was rated
the most pleasant odour. It is arguable that when the two odours are compared, their

effects, at least in one specific brain region, are different. It is also notable that this
effect occurred at the anterior, left hemisphere region which has been reported in
various EEG studies to be involved in the experience of positive, emotional stimuli
(Davidson et al, 1979; Ahern & Schwartz, 1985; Wheeler et al, 1993). That the
pleasant odours exerted their effects at this particular region and that the most pleasant
odour was associated with a significantly greater increase in amplitude when compared
with the odour of lemon, suggests that this region may be specifically involved in the
processing of this form of affective information. Evidence also suggests right-sided,
anterior involvement in the processing of negative emotional stimuli (Davidson et al,
1990; Tomarken et al, 1990; Jones & Fox, 1992). In the present study, right-sided
anterior effects of odour were confined to the least pleasant odour, that of vegetable,
and coffee, a pleasant odour. The diminished amplitude found during exposure to
vegetable is perhaps not unexpected given its unpleasantness and the distraction it may
thus have caused. Evidence from cognition studies has suggested that distraction from
a task is often reported as a result of exposure to malodour (Lewis et til, 1970; Rollon et
al, 1978; 1979). Post-experimental debriefing also suggested that subjects found this
odour alerting so that the diminished ERP resulting from exposure to vegetable odour
may again be related to the alerting (and, ergo, distracting) property of the odour (cf.
lemon vs strawberry). That the effects should have been elicited at the right-anterior
region also suggests a role for this are in the mediation of negative, affective stimuli.
Although the evidence for this asymmetry specifically from ERPs is sparse, the
hypothesis is compatible with findings from studies analysing spontaneous EEG.
The olfactory findings reported above are contrary to those reported by Long et al
(1991) who noted increases in P200 and P.3(H) amplitude as a function of increasing
concentration of galaxolide. These authors suggested that the results may have been
due to decreased attention produced by exposure to the odour (as noted in Chapter 4,

section 4.11.). Of what is known regarding P200 and P300 determinants, however,
this seems unlikely. Given that the odour was not presented at uniformly
suprathreshold concentration in this study, it is possible that the weak nature of the
concentrations may have focused attention on the counting task and that subjects found
the exposure pleasant and relaxing thus eliciting significantly greater amplitude with
increasing concentration. An alternative, complementary explanation might he that the
odours used in the present experiment differed in some important way to that o f Long
et al's. (1991). The odour in the latter study was a commercial odorant often used as the
musk base for perfumes. The authors note that this odour would be relatively
unfamiliar to subjects or would be difficult to identify. They also suggest that exposure
to this odour might be construed as odd since the odour is presented out of context (i.e.
the perception of a perfume-base in an ERP experiment rather than in normal social
interaction). The odours in the present study, however, were selected as familiar
stimuli which subjects would not find difficult to process. These odours were
presented at suprathreshold concentration, were detectable, identifiable and were
familiar. The odour of galaxolide may have been only faintly detectable, be relatively
unfamiliar and would certainly have been unidentifiable to untrained subjects. Thus it
is possible that this odour might have generated less distraction as a result of its
"simple", possibly non-lexical, characteristics. The odours used in the present
experiment, detectable and familiar stimuli, may have exerted a different effect to that
of a synthetic musk due to their "psychological" complexity.
5.9.iV. Was any diurnal variation apparent fo r any component?
Although not specifically designed to demonstrate the effects of lime-of-day, the nature
of the present experiment allowed the observation of any diurnal variation which might
exist within the three hour period extending over the lunchtime period. Previous

studies of human performance have suggested that human performance at this particular
time of day (midday) may vary significantly (Folkard. 1982).
The expected fluctuations in P300 amplitude were not observed and neither was any
temporal alteration in N100 amplitude obtained. The P200 to standard stimuli,
however, was significantly affected by the time-of-day factor, showing significantly
greater amplitude during the afternoon session than in the morning at C4. The
amplitude of the P2()0 was also significantly greater at F3 during afternoon exposure to
vegetable than during morning exposure.
Although P3(X) amplitude appeared to show no diurnal fluctuation, P3(X) latency was
significantly longer at F3 in the afternoon than in the morning. As for P3(X) amplitude,
there was no significant interaction between group and time-of-day. Previous effects of
time-of-day and food ingestion on P3(X) latency have been modest (Geisler & Polich,
1992 a, b: Pietrowsky et al, 1989) and the effects of odour of latency have not been
considered (Lorig er al, 1991). Polich (1986), however, reports increased latency
when ignoring stimulus items when compared with actively discriminating between
them. One possible explanation for the longer latencies in the afternoon is the subjects'
attention decreased during the second session, perhaps due to familiarity with the
testing protocol. Polich (1989) has also reported longer latencies with repeated
presentation, although these latency effects were not particularly robust or significant.
The one hour interval inserted between the two testing session in the current
experiment, however, would suggest that slower latencies as a result of repeated
presentation is unlikely. Increases in P300 latency have been observed in retardation
(Squires, Galbraith & Aine, 1979) and dementia (Brown, Marsh & LaRuc, 1982;
Polich, Ehlers, Otis, Mandell & Bloom, 1986); shorter latencies have been associated
with impaired memory performance (Howard & Polich, 1985). Given the bewildering

array of contexts in which alterations in P300 latency may be observed, perhaps the
significance of this measure is questionable. The latencies for target N 100 and P200
also showed inter-session etlecls. The N100 latency at P.3 during exposure to vegetable
odour was also larger in the afternoon than in the morning. Latency for N100 was
longer in the afternoon than in the morning whereas P200 latency was shorter in the
afternoon than the morning. A steady overall decrease in P190 latency over the day has
been reported (Kerkhof, 1982) which appears to confirm the finding reported here.

CHAPTER 6
EXPERIMENT 2: MEAL CONSUMPTION, EXPOSURE TO FOOD
ODOUR & EEG ACTIVITY-AN INVESTIGATION USING BRAIN ELECTRICAL
ACTIVITY MAPPING.METHOD & RESULTS.
EXPERIMENT 2
6.1. Introduction.
The results of experiment one confirmed that exposure to certain odours modifies
specific components of the averaged evoked potential. Some of these modifications
appear to he related to the psychometric properties of the odour, particularly the odour's
hedonic quality. Significant, if unexpected, effects of meal ingestion were also
obtained with the lunch group showing larger amplitude P200 than the no-lunch
controls. The odour of vegetable was also associated with shorter P2(M) amplitude in
the unfed group in the second recording session. No negative olfactory alliesthesia was
found.
The nature ol the evoked potential is to give a gross electrophysiological measure of
exogenous and endogenous behavioural processes. The endogenous processes,
reflected in the P300 and to a lesser extent, the P2(M), largely comprise cognitive
processes such as decision-making or, more parsimoniously, context-updating since
these have been the types of cognitive processes thought to be reflected in late positive
going-waves (Ritter, Vaughan & Simson, 1983; Hillyard, 1984). Exogenous
components, as reflected in early negative components, largely reflect sensory
responses which would not normally be measurable, electrophysiologically, by other
psychophysiological techniques. The evoked potential is a useful way of demonstrating
the effects of external variables on sensory and cognitive processing. They are,
however, event-locked and require special experimental paradigms in order for them to
be elicited. Recording of the "spontaneous" EEG presents neither ol' these problems.
Although experimental manipulations and EEG recording are often synchronised,
studies exploring EEG concomitants of human performance determine the effects of
particular variables on normal, on-going EEG behaviour, using stimuli which arc not
often susceptible to the EP recording approach.
Effects of odour on the EEG, as reviewed in an earlier chapter (Chapter 4, sections
4 .1 0 ., 4 .1 2 -1 4 .) have been noted in a number of studies although the findings are
often contradictory (e.g., Lorig & Schwartz, 1988; Lorig el til, 1988; Klemm et al,
1992). The number and type of odours used in these studies have ranged from three
(Lorig & Schwartz, 1988) to seven (Klemm el al (1992) and from perfumes (Lorig &
Schwartz, 1988) and essential oils to common odorants (Klemm el al 1992). No EEG
study designed to elicit changes in the EEG as a result of exposure to odour have
explored the possibility of utilising food odour, a common, familiar and affectively
potent stimulus. Food odour may, in fact, be construed as more affectively weighed
than other pleasanl/unpleasant odours not simply due to the subject's immediate

response to a sweet or savoury-smelling food odour hut also due to the experience with
that odour in the past (Lawless, 1991a). A small number of studies have suggested
changes in the affective rating of food odour after the ingestion of a meal, for example,
although the experiment reported in C h a p te r 5 found no meal-related changes in the
pleasantness ratings of the food odours used. Recent studies (reviewed in C h a p te r 4,
se c tio n s 4 .14 -16 .) suggest that the affective response to a stimulus may he reflected
in EEG hemispheric asymmetries (e.g., Ahern & Schwartz, 1985; Davidson, 1984;
1988; 1992; Jones & Fox, 1992; Tomarken et al, 1992; Wheeler el al, 1993). These
studies normally employ visual stimuli that are rated by the subject for their affective
content (does it make the subject happy, disgusted, sad, angry? etc). The EEG
recorded during exposure to those stimuli (usually a film or video) eliciting the most
intense emotional response is "nagged". Asymmetries have been found for both
negative and positive emotional stimuli with increased left anterior hemispheric alpha
activation for positive stimuli and increased right anterior hemispheric alpha activation
for negative stimuli. Other, inconsistent waveband changes have also been reported
(see T a b le 4 b , C h a p te r 4).
In view of the hedonic component of odour and its ability to produce marked emotional
responses of pleasure and disgust (see Chapter 2), similar affective asymmetries may
be generated by olfactory stimuli if one accepts the assumption that the two senses-
vision and smell- are equipotential in this context. There are significant, self-evident
differences in the structures and operations of the visual and olfactory systems (Kandel
& Schwartz, 1987). The cognitive processing of each type of stimulus may also be
dissimilar (Serby & Chobor, 1992). If, however, EEG asymmetries occur to affective
stimuli, regardless of the sensory modality which transmits them, then odour and films
should both generate the pattern already reported for visual stimuli. Some authors have
argued that the affective asymmetries found represents the electrophysiological

representation of withdrawal and approach behaviours (Davidson, 1984; 1992;
Davidson, Ekman, Saron, Senulis & Friesen, 1990). In view of odour's role as a
caveat and attractant (as reviewed in C h a p te r 2), this stimulus would seem to he a
potentially effective elicitor of these two types of behaviour.
Also noted in C h a p te r s 3 & 5 was the potential for the rating of a food odour to
change after ingesting a meal. Evidence from C h a p te r 5 suggests that this finding is
not robust. It was noted, however, that the range of odorants used may have been of
limited usefulness to the experiment. In the present study, the psychometric procedure
is modified to include both pre- and post-prandial ratings of the odours specifically in
order to account for time-of-day effects (which may have influenced the results of
experiment one). More importantly, the range of food odours is also extended. If
previous studies are correct in concluding that the affective response to odour changes
post-prandially, and if the affective response to smell affects the EEG in a similar way
to that of a picture or photograph, then hemispheric asymmetries could be expected
post-prandially; fed subjects would be expected to show less left anterior alpha
activation than unfed controls. Alternatively, fed subjects may show increased right
anterior alpha activation if the odours are rated as less pleasant.
METHOD
6.2. Subjects.
Subjects comprised 21 right-handed, non-smoking students at the University of
Warwick plus respondents to a feature in a local newspaper distributed in the Coventry
area. Individuals had been pre-informed that the experiment was designed to
investigate the effects of food odour on brain activity. Age ranged from 17 to 37 years.

Handedness, anosmia and discrimination ability was assessed as in experiment one and
instructions for the preparation of the experiment (e.g., food consumption, health, use
of perfumed products) were identical to those in experiment one. The group was
divided into two conditions. Group 1 (N=12; 5 male, 7 female) received a prescribed
lunch in-between two testing sessions (Lunch Group); Group 2 (N= 9; 2 male, 7
female) did not receive lunch but remained in the laboratory under experimental
supervision (No-Lunch Group). The data from one subject in the lunch group were
rejected due to high levels of artifact. For EEG data purposes, this group thus
contained 11 subjects (5 male, 6 female).
6.3. Procedure.
Subjects were tested individually and entered the laboratory at either 11 a.m. or 12
noon when the olfactory discrimination task and a handedness questionnaire were
administered. Electrodes were applied as in experiment one. Following electrode
application, subjects were led into an olfactorium where they were told that the aim of
the experiment was to investigate the brain's response to food odour. They were
further told that they would receive a number of trials, lasting approximately one
minute, during which they may or may not be able to detect an odour. They were told
not to expect an odour to be present at every trial (this proviso was included in order to
avoid false hits). Occluded goggles were used to prevent extraneous visual cueing and
head-phones emitting soft "white" noise were worn to reduce external auditory
interference. In order to reduce eye artifact, subjects were instructed to keep their eyes
closed during each of the trials but were told that they would be free to move about after
the completion of each trial. Instructions regarding movement and respiration were the
same as in experiment one.

When subjects were comfortable EEG recording began, with a blank (control) always
presented at the first trial, as a baseline measure. Seven odours were presented, in
counter-balanced order, with a 1-minute inter-trial interval in order to allow the
dispersal of the previous odour. An extractor fan was in operation to facilitate the
dispersal of the odour. Following the first testing session, all subjects were led back
into the laboratory and completed a psychometric rating test. This involved rating the
seven odours to which they had been exposed in session one along five dimensions:
pleasantness, strength, familiarity, trigeminal and alertness using 12.5 cm. bipolar
Lickert-type line scales. The dimensions represented were pleasant (0 cms)-unpleasant
(12.5 cms), weak-strong, unfamiliar-familiar, stinging-soothing and relaxing-alerting.
Subjects were told not to spend too long rating any one odour. A further psychometric-
a hunger rating- was included at the end of the odour ratings. This test also involved
placing a mark along a 12.5 cm. line-scale, with "very hungry" representing one pole
(0 cms) and "not at all hungry" (12.5 cms) the other (see appendix B3).
After completion of the psychometric ratings, Group 2 remained in the laboratory for
approximately thirty minutes. Group 1 was led away for a prescribed lunch which was
of approximately thirty minutes duration. After this interval, subjects again completed a
hunger rating test and were prepared for the second session of EEG testing. The
procedure for this second session was identical to that in session one. After completion
of the second EEG session, subjects underwent the same odour rating exercise
completed after session one. Subjects were then debriefed, paid and received a free
brain-map.
6.4. The odours.
The odours differed slightly from those in experiment one for two reasons. In order to
determine any effect of odour valence on the EEG, the number of odours was increased

to include those that represented the odours of sweet and savoury foods. Pilot testing
indicated that some of these odours would be perceived and rated as more pleasant than
others. Thus a broader range of odorants was included in this experiment. The second
reason is closely tied to the first. Previous investigations of EEG response to odour
have chosen to present relatively few odours (see Table 4a in Chapter 4). Few of
the stimuli used have been food odours. The odours selected for this experiment
reflected a broad range of food odours and were used to determine whether the EEG
responds to olfactory stimulation in a general fashion (a "blanket", sensory response)
or whether it responds differentially to different odours (a "specific", perceptual
response).
Two microlitres each of chocolate (chocolate flavour, 1(X)%), spearmint (10% in DEP),
almond (10% in DEP), strawberry (10% in DEP), vegetable (100% ), garlic & onion
(1(X)%) and cumin (cumin seed oil, 100%) odour were used. All odorants were liquid
concentrates and supplied by Quest International. Odorants on strips were sealed in a
test tube until the time of the experiment and were re-prepared at the beginning of each
week in order to avoid diffusion and tainting. The choice of odours reflected the sweet-
savoury dimension of food aroma and were selected on the basis of food odorants
which were commercially available. The vegetable odour was also selected for its
unpleasantness (as demonstrated in experiment 1) and was used as an olfactory
analogue of a generally unpleasant visual or auditory stimulus in order to examine any
hemispheric EEG asymmetries in olfactory-emotional response. All odours were
delivered on perfumers' strips and were presented approximately 7 cms. from the
midline of the subject's face.

6.5. The lunch.
Lunch for Group 1 comprised a starter of vegetable soup (Heinz, 2l()g) followed hy
baked potato (4(X)g) with baked beans (Tesco, 22()g). A cup of carbonated mineral
water (140 ml) was supplied as liquid refreshment. All cooked meals were prepared as
described in experiment one.
6.6. EEG apparatus and recording protocol.
EEG activity was recorded in real-time from 28 electrode sites according to the 10/20
international placement system using a Neuroscience Brain Imager Series 3 model and
referenced to linked ears. Each of the 5 classical EEG frequency bands- della (0-311/),
theta (4-7Hz), alpha (8-12Hz), beta 1 (1.3-22H/.) and beta I I (23-3()Hz) was monitored
and recorded. Recording was undertaken at 256 microvolt sensitivity. The incoming
EEG waveform is represented by 4096 values. With the 256 microvolt dynamic range,
an accuracy of 256/4096 or 1/16 uvis obtained. Fillers were set at default settings (0.3
Hz & 40 Hz). A Fast-Fourier Transform algorithm decomposed the raw EEG into the
classical bandwidths at the rale of a 1(X) samples per second. This operation enables
the display and storage of the relative amplitude for each of the frequencies (see
Appendix C2).
The EEG is recorded as 2.56 seconds of averaged EEG activity (epochs). Power (uV2)
in each frequency band is calculated for each epoch. Imager software calculates the
amplitude for each electrode by taking the square root of the power. Data from each
electrode site are taken to determine the voltages between electrode points (via a 4-point
interpolation routine). Activity within this averaged epoch is consequently represented
in visual form as the topographic map. A numerical value (in microvolts) is also
obtained for each electrode site in each frequency band. The sampling rale is normally

twice the maximum frequency studied [the Nyquist frequency, Johnson (1980)].
Details of the brain imaging system are given in Appendix C l.
15 frames of no odour were recorded followed by 15 frames when the odour was
present. A further fifteen frames were recorded post-odour where no smell was
present. During the blank condition, 45 frames of no-odour were recorded. The aim
of recording the first set of frames was to accustom the subject to the experimental
setting and to enhance the feeling of relaxation. The final set of fifteen frames was used
in order to allow the odour lime to dissipate (the blank condition employed this
condition in order to keep all trials time-constant) and to allow the subject’s nose to
recover from possible olfactory fatigue. Records were visually inspected for artifact
employing a technique recommended by Neuroscience. Records showing significant
amounts of symmetrical theta or delta activity in frontal leads were removed from the
subject's overall EEG record. Those frames remaining were used in subsequent
analysis. All artifact detection was made blindly, i.e., without knowledge of which
record represented which odour condition.
RESULTS
6.7. EEG data reduction.
EEG data from nineteen electrodes were used for subsequent analysis. These
electrodes were selected on the basis of previous studies which have shown odour- and
affect-specific responses at these sites (see Tables 4a & 4b in C hapter 4). The
electrode locations represented broad delineations of lobe area: frontal (F.3, F4, F7, FX,
FZ), temporal (T3, T4, T5, T6), parietal (P3, P4, PZ), occipital (01, 02) and central
(C3, C4, CZ) [see Fig. 6], In addition to the theoretical parsimony of reducing the

Electrode array used for analysis in experiment tw
o.

number of electrodes and selecting them judiciously, there is also the statistical
advantage of avoiding p-inflation (see Section 4.5., Chapter 4) since large
quantities of EEG factors (such as electrode site) would certainly weaken the power of
an analysis of variance.
Data from each electrode in each waveband were downloaded from the Brain Imager to
a Macintosh hard disk using the Autoedit 4.1.2 downloading programme (Milligan,
1992).
One method of data reduction in experiments in which variables are numerous is to
create a simple macro programme which can be tailor-made to perform some specific
reductive function such as averaging or summing. This task is effectively undertaken
in SYSTAT (SYSTAT, Inc., 1992) by typing in the macro in the command editor
window. This manual procedure, however, is time-consuming and arduous since it
permits the submission of only one file at a time: alterations to the macro may have to
be made for each successive file.
To combat this wasteful expenditure of time and energy a programme compatible with
the SYSTAT statistical package was designed using SYSTAT software and HyperCard
2.0v2. "Systat Batch Commander" allows multiple files to be processed sequentially
and automatically (hence "batch") using a single command file (Milligan & Martin.
1994; see also Appendix D). This programme rapidly converts the EEG data into a
form suitable for analysis in SYSTAT. Imported and edited files were log transformed
in order to avoid skewedness and to remove nonstationary variability such as increasing
variance across lime. The transformed data then underwent a repeated measures
analysis of variance. Each electrode was analysed separately using an odour x group x
time-of-day mixed design in the first instance.

6.8.i. Odour identification.
The procedure for the correct classification of odour was as described for experiment
one. A post-hoc sign test revealed significant differences in the identifiability of some
odours. Spearmint was identified by more people than was cumin (p=0.039),
strawberry (0.022), garlic and onion (p=0.013) and almond (0.039). Furthermore,
more people identified the vegetable correctly than they did garlic and onion (p=0.021).
The odours, ranked for identifiability and familiarity, are presented in T a b le 6a.
Table 6a. Identification of odours (from most to least well identified) and familiarity
of odours (from most familiar to least). Means lor familiarity are given with standard
deviations in brackets.
6.8. Psychom etric results.
I d e n t i f i c a t i o n F a m il ia r i ty
Spearmint Spearmint 10.96 (1.56)
Chocolate Cumin 10.25 (1.74)
Vegetable Almond 10.17 (2.50)
{Cumin Chocolate 9.26 (2.67)
{Almond Strawberry 8.92 (3.06)
Straw be try G & () 8.9 (2.85)
Garlic & Onion Vegetable 8.22 (3.21)

6.8.H. Hunger ratings.
The data from the hunger rating scales were submitted to a two-way analysis of
variance with group as the between subjects factor and time-of-day as the within
subjects factor. There was a significant main effect of group [F (1.19)=21.51.
p<0.001) and time-ol-day [F (1,19)=21.17, p<().()() 1 ] as well as a significant
interaction between the two [F (1,19)=5.95, p=().()25]. Post-hoc Tukey's tests
showed that the results were largely due to differences between the a.m. and p.m.
responses of the Lunch group and differences between this group and the control group
for the p.m. ratings. Predictably, the lunch group gave a significantly higher rating in
the afternoon than in the morning (df=19, p<().(H)l), a finding which attests to the
satiating effect of the prescribed meal. There was no significant difference between the
a.m. and p.m. hunger ratings of the control group, indicating that their hunger rating
was relatively stable (a.m.=2.52, p.m. =4.07). This stability in the control group and
the alterations in the lunch group are seen in Fig. 6.i.

HUNGER R A T IN G S
Fig. 6. i. illustrates a.in. and p.m . differences between the lunch
(Group 1) and control groups' (Group 2) hunger ratings (O=not at all
hungry; 12.5=very hungry). A clear difference can be seen between the
lunch group's a.m. and p.m. rating and between the lunch and control
groups' p.m. rating.
There was no significant difference between the two groups' a.m. rating response
(Lunch Group=5.68, Control Group=2.52) thus confirming that both groups were
initially of similar "nutritional status". The groups' p.m. ratings differed significantly,
however, with the Lunch group giving a higher rating (i.e. indicating feelings of less
hunger) than did the controls (df=33, p<().(MM)5).

1 296.8 .iii. P sychom etric ratings: p leasantness, strength , fam ilia rity ,
trigeminal and alertness.
(a) Did the ingestion o f lunch affect any o f the psychometric ratings?
Data from each of the psychometric dimensions were submitted to a repealed measures,
three-factor analysis of variance with group as the between subjects factor and odour
and time-of-day as the within subjects factor. No three-way interaction was obtained
for any dimension nor was there a main effect of time-of-day.
(b) Did the odours differ significantly on any o f the dimensions?
The means and standard deviations for each dimension and odour are given in T a b le
6 b .
(b) i. Pleasantness.
Pilot testing had indicated that the vegetable and garlic and onion odours were rated
more unpleasant than other food odours tested. In fact, the present analysis
demonstrated significant differences between the odours along this dimension [F (6,
1 ()8)= 11.61, pcO.OOOOl). Fig. 6 .ii. illustrates these differences more clearly. Post-
hoc paired samples t-tests revealed that spearmint was rated as more pleasant than
strawberry (t=4.51, df (19), p< ().(X)1) or cumin (t=4.62, df(19), pcO.OOl). The
garlic and onion odour was rated as less pleasant than spearmint (1=5.93, df (19),
p<().(M)l) or chocolate (t=4.23, df (19), pcO.OOl) with a trend towards significance
for garlic-almond (t=3.46, df (19), p=0.(M)3) and garlic-strawberry (1=3.45, df (19),
p=().()()3).

O < o > to n 75 2
B O
oOft
^4
c35 ’
3o3
3*p*
3"8
HHjn
ftm(/)to
n k l C - to r - 3
8
h
•■o‘•oON
to
4^
y$K>K )
ynt/»<-*
to
y joro
to
y jO nOC
to
O nO 'to
octo
4*
3ftCA
S f3o .
k ivO L/\ 4*
O)roto
io O '
ft:n
Oo
Rffc°
CO
5 n= rO
>3
<o
Oftto
■Sncp *+■■i
9o
*p *
pNO
o3Cl ©
oft:*-i 3 ’ 3
Tftf i oo M NO ro p to <-♦~l VO ON to ON t/1 .w k ]
3*
n* 13 ro -o O o
RpV
u> ro to O ' NCos .
O ' tot/i S—^ 4*•o
tonC to
so ’p
gl iTi
<o
Oftoo
O
Rp
O
to-nft:
c r
nS '5?
>3c3
oc35 ’
751?ft:
*»5093
tO N> oo p a . _ — 09g■
ro
to‘vO
K )
ocNOto
toO ' © ro
O inCO'
1
*•<3 io bo ,.— „ JO -o ,— „
to ON3 7 )£ to
ly i■o£
O tON
n—'3ft:s'jr to n > to < n a &
*1175
i?ft:i
= r
s3o
3*
aere
33 , *
3*QTft3
Rft:
3C . p* 3 w 7 9
toNO
po - J p y » y* 4^ ok ) L n k| © k| o
>34* oo -o to
s. to ,._, /MS v* N J to U i
toJO JO to 5 ’
< NO 4 - t/i bo io erao tO O n tO 00 ro -oOft'll<o
OftG32o
to n to > < n o >
*8■•-t
3*s
5 3o
QOft
c3 .
ftn
y r 3c .
3 w3
era
-o ON ON y> 4* to 7 3
u 4 ^oo
4 t oc00 t/>
oft09
to to N J to to to p ©
5 5tnto
tou
t/ioc era
Table fib. O
dours ranked for pleasantness (most pleasant to least pleasant), strength (strongest to w
eakest), familiarity (m
ost

P L E A S A N T N E S S R A T IN G S FOR ODOURS (AM v s PM)
Ccc
a p m
E3 AM
a UJ > o s UJz :
cx<r
*—oc3<E
<r- Joo
xXD■3
<J
cXo
_JXXHu
LU o ■ -1 oC L X X X uin u H X X
<0 oODOUR
Fig. 6. ii. illustrates differences in the pleasantness ratings fo r all
odours grouped by a.m. and p.m . (Unpleasant; I2.5=unpleasant).
Although there are clear differences between odours, there appears to be
little effect o f lunch on pleasantness ratings.
Further significant differences in pleasantness were found with the vegetable odour
which was rated as significantly less pleasant than spearmint (1=7.21. df (19),
p<().()01), almond (1=3.96. df (19). p=().()01). chocolate (1=4.15, df (19), p=().()()l)
or strawberry (t=4.13. df (19). p=().(K)l).

There were no significant main effects of odour on strength, indicating that the odours,
although delivered at suprathreshold strength, were isointense. No significant effect of
group or time-of-day was observed and no significant interactions were obtained.
(b) Hi. Familiarity.
There was a significant main effect of odour on familiarity |F (6,102)=3.68, p=0.(K)9J
but this effect was restricted to the vegetable odour which was rated as less familiar
than spearmint (t=4.03, df (20), p=().(M)l). Fig. 6.iii. illustrates the relative
differences between the odours on this dimension. There were significant trends,
however, with the vegetable, again, being rated less familiar than cumin (1=2.91,
df(19), p=0.009) and spearmint being rated more familiar than strawberry (t=2.94. df
(20), p=0.008). The familiarity of spearmint in these examples appears to relied the
finding in section 6.8.i. where it was identified more correctly than other odours.
There were no other significant effects or interactions.
(b) ii. Strength.

F A M I L I A R I T Y R A T IN G S
Fig. 6. Hi. illustrates differences between odours on the fam iliarity
dimension. (0=unfamiliar; I2.5=familiar).
(b) iv. Stinging-soothing.
There was a significant effect of odour for the trigeminal dimension |F (6, 98)=8.5,
p<().()()()()5]. Post-hoc comparisons revealed marked differences between garlic,
vegetable and cumin with the other odours, as illustrated in Fig. 6.iv. Spearmint was
rated as more soothing than garlic and onion (t=6.16, df (19). p< 0.001), vegetable
(t=5.13, df (18), p=().(X)l) or cumin (t=5.48, df (19), p<0.00l). Two further odours
were rated as significantly different from vegetable, garlic and onion or cumin.
Almond was rated as more soothing than garlic and onion (t=3.86, df (19), p=0.00l)

or cumin (t=3.97, dt (18), p=().(K)l) while the chocolate odour was rated as more
soothing than garlic and onion (t=5.04, df (19), pcO.OOl) or vegetable (1=3.94, df
(18), p=0.001). The only other significant pairwise comparison was that between
spearmint and strawberry where spearmint was rated more soothing than strawberry
(t=3.68, df (19), p=0.002). No other main effects or interactions were obtained.
T R I G E M I N A L D I M E N S I O N
CO
O D O U R
Fig. 6. iv. illustrates differences between odours along the stinging-
soothing dimension (0=stinging; 12.5=soothing).

A significant effect of odour was also obtained on the alertness dimension |F (6,
108)=4.09, pcO.OOl]. Post-hoc pair-wise comparisons showed that this effect was
restricted to two pairs of odours: chocolate and garlic and onion (t=3.54, df (19).
p =0.002), and chocolate and vegetable (1=3.55, d f (19), p=0.002). In both examples,
chocolate was rated as more relaxing than the other two odours a finding which,
coupled with the results from the trigeminal ratings suggest that chocolate might have
pronounced effects on mood. A positive correlation was found between ratings for
chocolate on the trigeminal and alertness dimensions (r=0.885, pcO.OOl). Similar
correlations were found for the almond (r=0.898, pcO.OOl), cumin (r=0.785, p=().()l).
vegetable (r=0.983, pcO.OOl) and garlic and onion (r=0.733, p=0.05) odours.
Interestingly, there was also a positive correlation between the alertness responses of
vegetable and garlic and onion (r=0.733, pcO.OOl) which suggests dial these two
odours may represent similar positions along this dimension, a suggestion supported
by the results of the post-hoc analysis.
6.9. EEC results.
The data from each of the EEG bands were submitted to a three-way repeated measures
analysis of variance (odour x group x time-of-day).
6.9.i Effects o f odour.
No significant main effect of odour was found for delta, alpha, beta 1 or beta 2.
However, a significant main effect was found for the theta waveband |F (7,28)=4.39,
p=0.022, G-G corrected). This occurred at the right frontal region and was due to a
difference between the spearmint and strawberry odours. Strawberry odour was
associated with significantly greater theta than the odour of spearmint (1=4.22, df (6),
p=0.(K)6), as illustrated in Fig. 6. v.
(b) v . Alerting-relaxing.

ODOUR D I F F E R E N C E S I N T H ETA
034JrHo>ouo
>HEh
EhO<<enuXEh
2 . 3 8 r
2 .3 6
2 . 3 4 -
2 .3 2 -
” i----------1-----------r
2 . 30L 1I1u
I ■I I 1 ^
% .
1 «XZ<pCQ
PZosp4 Î
wEh4;pOUOXu
xDU
EhZHsX<wxw
>HXXwfflz4;XEhw
wpX<Ehwow>
O D O U R
Fig. 6. v. illustrates differences between odours in the theta frequency
for electrode F8. A significant difference was found between spearmint
and strawberry with the strawberry odour eliciting more theta than
spearmint. EEG data are fo r theta (log).
6.9.ii E ffect o f group.
There was no main effect of group at any site for any of the wavebands.

136
6.9.iii. E ffect o f time-of-day.
There was a significant effect of time-of-day at PZ for the alpha waveband [F
(l,40)=8.47,p=0.044) as seen in Fig. 6.vi. Activity in this band was greater in the
afternoon session than in the morning session (t=3.2, df (5), p=0.024). There were no
other effects of time-of-day.
AM -P M A L P H A A C T I V I T Y
Fig. 6. vi. illustrates time-of-day differences in the alpha frequency fo r
the electrode PZ. Significantly more activity in this waveband was
found in the afternoon session across both groups. EEC data are fo r
alpha (log).

6.9.iv. Did odour interact with group or time-of-day?
There were no odour x group interactions obtained, although a significant odour x time-
of-day interaction for theta was obtained [F (7,28)=4.92, p=0.036], This effect was
restricted to the vegetable odour which was associated with more theta during the
morning session than the afternoon session (t=4.13, df (5), p=0.009).
6.9.v. Were any odour x group x time-of-day interactions obtained?
To explore the possibility of EEG group differences in response to odour in the
morning and afternoon, a three-way interaction would support any post-prandial
changes if the effects were not restricted to the morning data alone. In fact, a
significant three-way interaction was obtained for alpha but lor no other waveband.
This effect was present at the right anterior region (T4: |F (7,28)=5.()5, p=().()22|).
and was due to the control group which showed less alpha activity in the morning than
in the afternoon (t=6.97, df (3), p=0.(H)6), as can be seen in Fig. 6,vii.

GROUP D IF F E R E N C E S I N ALPHA
FIG. 6.vii. illustrates group differences in alpha fo r electrode T4. The
control group appears to generate significantly more alpha activity in the
afternoon than in the morning. EEC data are fo r alpha (log).
6.9. vi. Was EEC asymmetry apparent fo r pleasant, unpleasant and
neutral odours?
To explore the relationship between cerebral asymmetry and hedonic valence the log
transformed data from eight electrode sites: left and right frontal (F3 and F4), left and
right anterior (T3 and T4), left and right parietal (P3 and P4) and left and right posterior
(C3-C4) were selected to give an asymmetry index (Log L-Log R). Thus a minus
score would indicate greater right-sided activity while a plus score would indicate
greater left-sided activity. This simple left-minus-right transformation is possible with
log transformed data which avoid the use of fractioned indices. To facilitate subsequent
analysis, 10 was added to the index in order to remove confusion over signs in the

software during statistical analysis. Alpha and theta wavebands were analysed, based
on the results of previous investigations which demonstrated hedonic and hedonic-
related EEG asymmetries restricted largely to these frequencies (see C hapter 4,
section 4.14.).
(a) EEG asymmetry and pleasantness.
The results obtained from the psychometric data demonstrated highly significant
differences in the pleasantness ratings of some odours. For the purposes of the
asymmetry analysis, the most unpleasant and pleasant-rated odours were selected along
with a neutral control (blank). The odours were spearmint and garlic and onion which
represented the extreme ends of the pleasant-unpleasant spectrum. For the first
analysis, all asymmetry indices for all odours were compared by region alone. This
one way analysis of variance revealed no significant differences in left-right activity at
any site in alpha (frontal: |F (2.28)= 1.04, p=0.33|; temporal: |F (2,28)=0.85, p=().42|;
parietal [F (2,16)=0.37, p=0.63]; central (F (2,28)=0.83, p=0.43|) or theta (frontal: F
(2,28)=0.51, p=().58J; parietal: |F (2,28)=0.51. p=0.46|; temporal : |F (2,28)=0.39,
p=0.68J. Asymmetry indices for both alpha and theta are displayed in Table ftc.
To examine possible changes in asymmetry between the control and lunch groups posl-
prandially, the data from the afternoon session were analysed separately using a
repeated measures two-way analysis of variance. No main effect of odour was
obtained but a significant main effect of group emerged for alpha at posterior sites
IF( 1,12)=7.2, p=().()2|. This effect was due to greater overall left posterior activity in
the control group compared with the lunch group (asymmetry index for lunch
group=9.87; control group= 10.34). Table 6d and fie show the F values and means
for these asymmetries.

Table 6c. F values fur pleasantness dilTcrcnccs in asymmetry lor u.m. data. Indices
are based on ihc calculation Log L-Log R + 10. Standard deviations tire given in
brackets.
ALPHA THETA
S 'n i in t G & O B lan k F S 'n i in t G & O B la n k F
FRONTAL 10.04 9.94 10.03 1.04 9.98 9.98 10.02 0.51(.33) (.13) (.03) (.18) (.12) (.22)
TEM PORA L 0.92 9.84 9.92 0.85 10 9.97 9.97 0.39
(.34) (.29) (.35) (.27) (.24) (.24)
PARIETAL 9.72 9.67 9.72 0.37 10.01 9.97 y.yy 0.68
(.45) (.4) (.46) (.26) (.19) (.26)
CENTRAL 9.9 9.87 9.93 .. .. ..(.19) (.22) (.2)
S'mint=spearmint; G&0=garlic & union.

141
Table fid. F values and means for Pleasantness differences in alpha asymmetry lor p.m. data. Indices arc based on the calculation Log L-Lou R + 10. Standard deviations are given in brackets.
S 'm in t G & O Blank F
Odour Group Odour x group
FRONTAL
(Lunch 9.98 9.15 9.96 1.5 0.38 0.14group) (.04) (.04) (.033)
(Controls) 10.02 9.98 9.99(.05) (.05) (.04)
TEMPORAL
(Lunch 9.94 9.81 9.92 2.28 1.48 .06group) (.13) (.11) (.12)
(Controls) 10.12 10.03 10.12(.15) (.12) (.13)
PARIETAL
(Lunch 9.94 9.89 9.98 1.72 .93 .06group) (.06) (.05) (.05)
(Controls) 10.05 9.96 9.99(.07) (.06) (.06)
CENTRAL
(Lunch 9.89 9.84 9.98 1.12 7.2* .07group) (.11) (.09) (.14)
(Controls) 10.34 10.27 10.35(.12) (.11) (.17)
* p<.()5
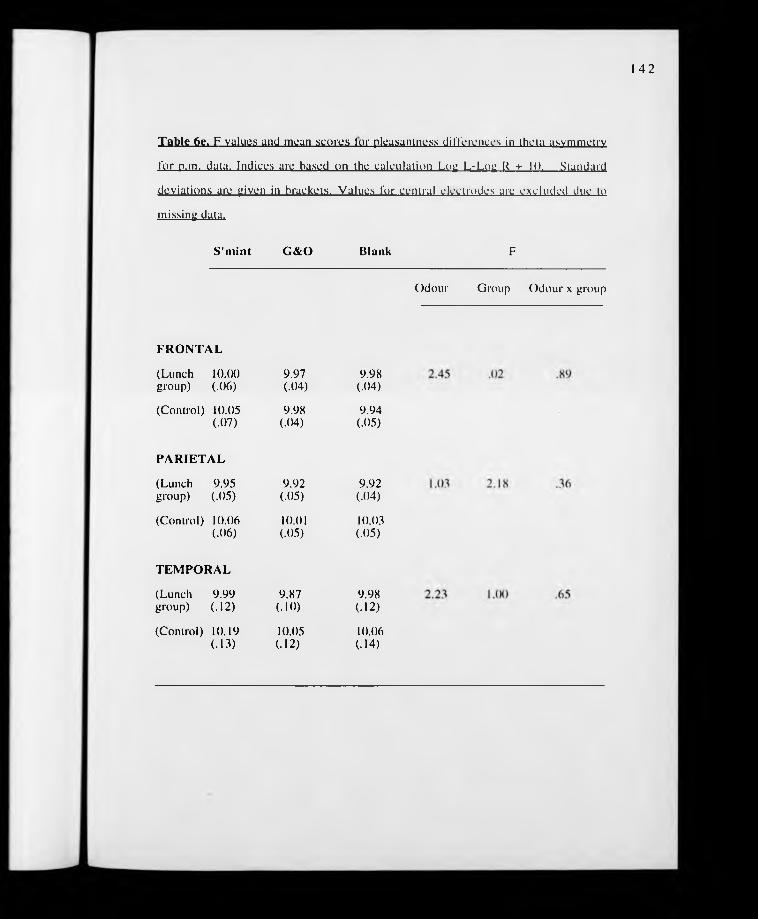
142
Table 6e. F values and mean scores lor pleasantness differences in them asymmetry
for n.in. data. Indices are based on the calculation Log L-Log R + 10. .Standard
deviations are given in brackets. Values for central electrodes arc ex eluded due u>
missing data,
S 'm int G&O Blank F
Odour Group Odour x group
FRONTAL
(Lunch 10.(K) 9.97 9.98group) (.06) (.04) (.04)
(Control) 10.05 9.98 9.94(.07) (.04) (.05)
PARIETAL
(Lunch 9.95 9.92 9.92group) (.05) (.05) (.04)
(Control) 10.06 10.01 10.03(.06) (.05) (.05)
TEMPORAL
(Lunch 9.99 9.87 9.98group) (.12) (.10) (.12)
(Control) 10.19 10.05 10.06(.13) (.12) (.14)

(b) EEG asymmetry and electrode position.
To explore possible differences in asymmetry by electrode position, each odour was
analysed separately by electrode site (frontal, temporal, posterior and central). There
were no differences in asymmetry across position for any odour in either alpha or theta.
Using the p.m. data from the two groups as before, however, a significant effect of
group emerged for the unpleasant (garlic and onion) odour [F (1,16)= 10.46, p=().()()5]
and the pleasant (spearmint) odour [F (1,15)=5.74, p=().()3] in alpha. Both effects
were due to greater relative overall left-hemisphere activity in the control group when
compared with the lunch group (for garlic & onion: lunch group index=9.89; control
group=10.04; for spearmint: lunch group index=9.87; control=l(). 10). There were no
position x group interactions. F values for odour, group and position p.m. effects are
displayed in Table 6f & 6g (see overleaf).

Table (if, F_yalues and means for position asymmetries (within region) in alpha and
(hptu (a.m.). Indices were calculalcd us described in ilic (ext, Sumclard deviations are
given in brackets. Central electrode data for theta arc excluded due to missing values.
(a) ALPHA
Odour Fr. Par. Temp. Cen. F
SPEARMINT 10.02(.33)
9.85(.46)
9.85(.35)
9.87(.20)
1.11
G&O 9.94(.13)
9.82(.45)
9.81(.34)
9.88(.19)
.89
BLANK 10.05(.34)
9.85(.4)
9.87(.29)
9.88(.22)
.69
(b) THETA
SPEARMINT 9.97(.18)
9.96(.26)
9.96(.27)
- .02
G&O 9.99(.12)
9.95(.19)
9.96(.24)
- .79
BLANK K).(K)(.22)
9.98(.20)
9.95(.24)
.44
Fr.=frontal; par.=parietal; tem p.=temporal; cen=central.

1 4 5
Table 6g. F values and means for position asymmetry (within region) fur alpha
(n.m. only). Standard deviations are given in brackets.
Odours Fr. Par. Temp. Cen. F
pos. group group x pos.
SPEARMINT
(Lunch group) 9.91(.12)
9.93(.06)
9.82(.11)
9.86(.10)
.93 5.74* 1.07
(Control) 10.18(.13)
9.97(.08)
10.02(.13)
10.24(.12)
G&O
(Lunch group) 9.96(.04)
9.94(.05)
9.8(.09)
9.86(.08)
1.72 10.46** 2.02
(Control) 9.99(.05)
9.97(.06)
9.99(.11)
10.2(.10)
BLANK
(Lunch group) 9.96(.03)
9.98(.05)
9.92(.12)
9.92(.12)
.16 1.63 .9
(Control) 9.99(.05)
9.99(.66)
10.12(.11)
10.12(.10)
postposition (electrode) *=p<.()5
**=p<.01

Table 6h. F vales and means for position asymmetry in theta (p.m. only), Suindard
deviations are given in brackets. Data for central electrodes arc excluded due to missing
.values.
Odour Fr. Par. Temp. F
pos. group group x pos.
SPEARM INT
(Lunch group) 10.01(.04)
9.97(.04)
9.97(.10)
.51 .92 .65
(Control) 10.03(.06)
9.99(.04)
10.12(.12)
G&O
(Lunch group) 9.98(.03)
9.95(.04)
9.9(.08)
.08 .99 .52
(Control) 9.98(.04)
10.01(.05)
10.01(.10)
BLANK
(Lunch group) 9.98(.04)
9.95(.05)
9.98(.12)
.43 .33 .59
(Control) 9.94(.05)
10.06(.06)
10.61(.10)

6.9. vii. Were differences in EEG asymmetry evident fo r alerting vs
calming vs neutral odours?
To examine the possible relationship between alertness and hemispheric EEG
differences, asymmetry indices for those odours rated least and most alerting were
calculated using the same electrode positions as those examined for pleasantness. The
most alerting odour was garlic & onion (3.56), the least alerting odour was chocolate
(7.47). Asymmetries in the alpha and theta wavebands were examined.
(a) Differences in asymmetry between odours.
There was no main effect of odour on EEG asymmetry, neither was there an interaction
between group and electrode position. A significant effect of group was obtained,
however, in alpha at central sites |F (1,10)=6.18, p=().()32|. This effect was due to
greater relative overall right hemisphere activity in the lunch group compared with the
control group (lunch group index=9.85; control group= 10.05) and appears to reflect
the respective asymmetries of both groups seen in section 6,9.vi.(b).
(b) Differences in asymmetry by position
There was a significant p.m. interaction between position and group for the chocolate
odour in the theta waveband |F (2,30)=4.65, p=().()38|. Post-hoc Tukey's tests
revealed that this interaction was due to the control group which showed greater left-
sided asymmetry in the temporal region (10.19) than the frontal (9.995) region (df=3(),
pcO.OOl) and differences between the p.m. activity of the control and lunch group.
The control group showed significantly greater left-sided asymmetry (9.86) in the
temporal region (for chocolate) than did the lunch group (10.187); |df=42, pcO.OOl |.

A significant effect of group emerged for the blank condition in alpha |F (1,I2)=7.27,
p=0.019]. Here, controls again showed greater overall left hemisphere activity
compared with the lunch group (lunch group index=9.93; control=IO.()5).
6.10. D iscussion.
6.10.i. Did ingestion o f lunch affect the hedonic ratings o f food odour?
As in experiment one, no effect of lunch were found for the post-prandial pleasantness
ratings of food odour. The expanded range of odorants (which included the odours of
both savoury and sweet foods) appeared to have no effect on selectively depressing
post-prandial ratings. This second failure to replicate suggests that the phenomenon of
negative olfactory alliesthesia may not be as replicable a phenomenon as its gustatory
counterpart. In Cabanac's (1971) study using the odour of orange syrup, subjects
rated this odour before and after a satiating injection of glucose. The decrease in
pleasantness following the glucose infusion suggests that either (a) hedonic perception
of food odour is genuinely related to the degree of satiety or (b) there is some special
property of glucose that results in these depressed hedonic ratings. The first
explanation does not appear to apply to the results reported here. Subjects receiving a
meal gave significantly lower ratings of hunger alter eating than before and responded
significantly differently on this dimension from unfed controls. Thus, if lack of hunger
is equated with satiety (and there there is a reasonable assumption that the two may be
highly correlated), then the experience brought about by the lunch appears to mirror that
of glucose. If, on the other hand, satiety is not equated with hunger and the two are
measurably different states, then it is perhaps satiety or fullness rather than lack of
hunger which results in post-prandial hedonic changes in food odour ratings. The
possibility that fullness is a more accurate index of satiety than hunger is discussed in
C hapter 7.

The second explanation, that glucose has specific properties which alter the hedonic
perception of food taste and odour, is plausible. Subjects fed naturally are exposed to a
number of different sensations-gustatory, olfactory, visual and tactile. An injection of
glucose, however, removes the complex sensory experience of the meal beyond the
subject's control. Food stimuli are regarded in isolation: there is simply a smell or a
taste to rate in an artificially engineered affective stale which the subject may, or may
not find comfortable. It is arguable that in order for truly robust hedonic changes in
olfactory rating to occur, it is necessary to use familiar but more salient food odours
such as cooked food. Ducleaux et al (1973), for example, used such stimuli and
reported significant post-prandial changes in hedonic ratings. It is possible, therefore,
that the stimulus requires some form of perceptual or appetitive salience before negative
olfactory alliesthesia may occur. This hypothesis is considered in more fully in
C hapter 7.
6.I0.U. The effects o f odour on the EEG.
In support of the findings of a number of other investigations, there were significant
changes in the theta frequency as a result of exposure to odour. Significantly greater
theta was evident for the odour of strawberry than the odour of spearmint at right
frontal regions. Further, odour x time-of-day effects were found for the vegetable
odour which was associated with greater theta in the morning than in the afternoon,
regardless of the experimental group. No odour-related changes were found for alpha
or beta.
The finding that strawberry elicited greater theta than spearmint in the right frontal
region is similar to previous finding using spiced apple and lavender (Lorig &
Schwartz, 1988). In the present experiment, the odour of spearmint was rated as
significantly more pleasant and soothing than was that of strawberry, cumin, garlic &

onion or vegetable. In the Long & Schwartz (1988) study, spiced apple was associated
with significantly less theta activity than was the lavender at right frontal and left
posterior regions (Long & Schwartz, 1988). The authors also reported that the spiced
apple odour was associated with self-reports of less tension and anxiety when
compared with the lavender odour. In view of the self-reported responses to these
odours, their effects on the theta frequency, and reports from others (Slacher et al,
1979; Klemm et a!, 1992) it is arguable that the theta frequency is the waveband which
is most susceptible to influence by exposure to odour and may be the dominant
frequency for the processing of the affective properties of odour. This hypothesis,
however, is not as clear-cut as it would appear. Although other authors have noted
changes in theta as a result of exposure to odour (Stacher et at, 1979; Lorig &
Schwartz, 1988; Lorig et al, 1990; Klemm et al, 1992), changes have also been found
in alpha (Lorig & Schwartz, 1988; Lorig et al. 1991). As discussed in Chapter 8,
these alterations in different bands may not be incompatible and are not unexpected.
The association between the theta frequency and the perception of odour and the notion
that this waveband represents the olfactory EEG channel is discussed and argued in
C hapter 8.
The reduced theta amplitude to the vegetable odour in the afternoon is intriguing.
Given the association between lowered theta and decreases in anxiety and tension, it is
possible that the response to vegetable was mediated by the psychometric property of
the odour. Vegetable was rated as significantly less pleasant than the odours of
spearmint, almond, chocolate or strawberry, significantly less soothing than the odours
of spearmint and chocolate and significantly more alerting than the odour of chocolate.
One possible explanation for the EEG finding is that EEG theta was lower in the
afternoon as a result of some form of affective habituation, i.e. the subject's response
to the odour during the first session would have been immediate; the odour would have

been novel and, possibly, startling. In view of vegetable's rating for alertness, the
likelihood that it was startling is likely. Experience of the odour during the second
session, when the odour was not novel and the subject had become familiar with the
experimental protocol might have resulted in reduced theta during this more "relaxed"
session. Whereas the response during the first session might have been partly hedonic
(perceiving the odour as unpleasant) and partly cognitive (trying to identify the odour),
the response during the second session may have been more analytic. Alternatively,
there is some evidence to suggest that greater involvement in cognitive and perceptual
processing is associated with increases in theta activity (Basar-Eroglu, Basar, Demiralp
& Schumann, 1992). It is possible that subjects exposed to the odour of vegetable for
the second time were inclined to pay less attention to the stimulus having become
accustomed to its properties. In Chapter 8, the significance of attention and theta
activity to olfactory information-processing is considered in more detail.
6.10.Hi. The effects o f time-of-day.
Significant increases in alpha activity were noted during the second testing session
compared with that obtained during the first session. These effects were unrelated to
exposure to odour or to the ingestion of lunch. Although not designed to explore the
effects of time-of-day in any detail, the results appear to show, as have a number of
psyehological/performance studies that changes in behaviour occur across the duration
of lunchtime (see, for example. Brown & Graeber, 1982). In the present experiment,
an hour and a quarter separated the two testing sessions. That alpha changes were
observed between the these two points either illustrates the the diurnal, rhythmic nature
of alpha or reflects a greater variability in the stability of alpha. Previous studies have
demonstrated robust inter-correlations between EEG alpha recorded at separate times
(usually weeks) [Gasser, Bacher & Steinberg, 1985; Burgess & Gru/elier, 1993;
Tomarken et al, 199.3], Others have reported circadian acrophases in sporadically
monitored EEG but with different temporal reference points to those of the present
experiment (Gundel & Hilbig, 1983). Lowered levels of alpha are commonly
associated with increased activation; increases in alpha have been interpreted as a
decrease in underlying activation. It has been argued that those performance effects
attributed to eating a lunch are in fact the result of circadian shifts at the time of day
when lunch is eaten (Brown, 1982; Nailoh, 1982; Folkard, 1982). The results
presented here would appear to support this hypothesis although to a limited degree.
The confident demonstration of such effects would entail monitoring EEG across large
time spans. This procedure would ensure that the effects obtained were genuinely
related to time-of-day and not to some other factor such as familiarity and ease with the
experimental selling which may be a strong confounding factor. Although ease should
be apparent with changes in beta (Linke er al, 1989), the present experiment reported
no diurnal effects of beta. Even so, the consideration of other potentially important
variables cannot be overlooked.
6.10.iv. Effects o f lunch.
No significant effect of group was found in the present experiment which suggests that
the ingestion of lunch has little effect on the pattern of EEG in any frequency. Odour x
group x time-of-day interactions were also absent which again suggests that the pre-and
post-prandial response to food odour changed little, in terms of the EEG. In view of
the fact that no negative olfactory alliesthesia was reported cither, the absence of a
three-way interaction is not altogether unexpected. In experiment one, however,
several changes in the P200 were observed as a result of ingestion of lunch. The lack
of a similarly significant EEG finding here suggests that either the ERP method is a
more sensitive measure of detecting metabolic changes or some other more
psychological changes as a result of food ingestion (which it might be) or that the ERP
is a more sensitive measure of cognitive/attentional processing than the EEG (which is

arguable). Others have reported differences in the amount of theta produced as a result
of either saline infusions or infusions of CCK during exposure to the noise and smell
of prepared and cooking food (Stacher er al, 1979). As noted in Chapter 4, however,
the ability to distinguish the effects of noise/infusion from those of the smell/infusion is
difficult. It is also possible, of course, that CCK has different metabolic and EEG
effects to that of conventionally ingested food and this possibility can not be disgarded.
On the basis of evidence presented here, however, there is no support for an EEG
signature for satiety.
6.10.V. EEG asymmetry fo r pleasant and relaxing odours.
There were no main effects of odour valence on EEG pleasantness asymmetry nor were
there position effects obtained for any odour. The results suggest that the ability of
odour to generate similar asymmetric EEG responses to visual stimuli in alpha is low.
There was, however, a group x odour interaction with the control group demonstrating
increased overall left-hemisphere alpha activity (i.e. less left hemisphere activation) to
garlic and onion and spearmint. If the alpha frequency can be characterised as an index
of wakefulness this result is unusual since it would be expected that hungry subjects
(controls) might react more attentively than the lunch group to food odour. The fact
that the control group showed no asymmetry for the blank condition suggests that the
effect obtained here is odour-related and not the result of generalised increases in left
hemisphere activity in the controls. It is possible that the decreased activation reflects
the lack-of-altention of the controls. These controls also showed greater overall left
central alpha activity than did the lunch group. They also showed overall greater left-
hemisphere alpha activity than the lunch group. The implications of these results will
be considered in Chapter 8.

The results from the alpha frequency data do not provide support for the notion that
unpleasant and pleasant olfactory stimuli behave in a similar electrophysio logical way to
pictorial stimuli. Alpha, however, as noted earlier, has been shown to be poorly
responsive to manipulation by odour. Those studies which do report odour-effects are
very few (see Chapter 4, section 4.10). The majority of EEG studies examining
cognitive and affective processes have utilised, to a large degree the visual and visual-
imagery systems (see Chapter 4, section 4.1.) which do, to a large degree, affect
the pattern of alpha activity (see Chapter 4, section 4.7.). In view of the effects
of odour exposure in theta, this frequency might be expected to show asymmetries
which alpha may not be 'sensitive' enough to detect. No effects in this frequency,
however, were found for any odour.
The EEG findings reported above and elsewhere (Long & Schwartz. 1988; Klemm et
a1, 1992) suggest that the tension-releasing and anxiety-alleviating effects of odour
might be mediated by, or be indicated by, changes in the theta frequency. Indeed, a
group x region effect was found in the theta frequency for the chocolate odour, the
stimulus rated as most relaxing. Here, greater left hemisphere theta was found at
temporal than at frontal sites in unfed subjects. Furthermore, greater left-hemisphere
theta was also found in the unfed group than the fed group at temporal sites. The
hypothesis by Long & Schwartz (1988) argues that the greater the degree of theta, the
less relaxing the odour. Thus, low theta is found with exposure to relaxing olfactory
stimuli when compared with stimuli rated as significantly less relaxing. In view of the
affective asymmetries reported elsewhere, the finding that less theta was found in the
left frontal region suggests that odours of a particular hedonic valence are capable of
generating within-hemisphere differences similar to those found with films of differing
hedonic valence. These other studies show increased activation in the left frontal areas
to pleasant films. It is possible that odour exerts its effects, as suggested above, via the

theta frequency. Furthermore, the relationship between the position effect reported and
the psychometric property of the odour (relaxation) suggests that what may he
measured in EEG studies using pictorial stimuli may not be the degree of happiness or
pleasantness experienced but how relaxing (and unthreatening) the stimulus is. Since
Davidson (1992) has suggested that approach-withdrawal may be reflected in EEG
asymmetries, comfort with a stimulus and its acceptance might indicate a relaxation
which is reflected by the left frontal increase in activity lie and his colleagues have
found. This hypothesis is considered in more detail in Chapter 8.

CHAPTER 7
EXPERIMENT 3: THE EFFECTS OF FOOD INGESTION AND THE ODOUR OF HOT,
COOKED FOOD ON THE EEC. METHOD AND RESULTS.
EXPERIMENT 3
7.1. Introduction.
The previous experiment demonstrated that simple food odorants were able to affect the
pattern of the spontaneous EEG. The only EEG frequency which was significantly
affected by exposure to odour was the theta waveband. Alterations in this frequency as
a result of exposure to odour, as noted in section ft.lO.ii. (Chapter 6), appears to
he an electrophysiologieal characteristic of exposure to odour and would suggest that
this frequency plays a special role in the mediation of olfactory experience, either at the
sensory, perceptual or emotional end of information-processing. Time-of-day was also
found to affect the EEG response significantly with greater alpha power found in the
afternoon session than the morning session. The reason for this disparate diurnal
response is unclear but may he related, as suggested in C hapter ft. to experimental
familiarity or diurnal variation in the pattern of EEG alpha. It was also found that
controls exhibited less alpha activity in the morning than in the afternoon. When activity
was further analysed in terms of asymmetry, a group by position interaction for theta

demonstrated that the control and lunch group's p.m. EEG response to chocolate
differed at temporal sites with the controls showing greater left-sided power then the
lunch group. The controls also showed more left-sided temporal power to chocolate
odour compared with frontal sites.
One of the aims of experiment two was to examine the possibility that exposure to
odours of different valence would exert similar effects on hemispheric EEG activity (in
terms of frontal/anterior asymmetry) to those reported with visual stimuli. These
asymmetries in alpha, however, were not obtained although left hemisphere region
differences were found with the most relaxing odour. Furthermore, the asymmetries
expected from hungry subjects exposed to food odour were not found although in
view of the finding that no negative alliesthesia was reported in fed subjects, the
absence of an electrophysiological index of alliesthesia for any odour may not be
altogether surprising. The controls, however, did show increased left-hemisphere
alpha activity to both the pleasant and unpleasant odours, when compared with the
lunch group.
One possible limitation of the stimuli used in experiment two (and, indeed, all other
studies of odour and human EEG) is that the stimuli presented may not have the
required ecological validity to produce aflect-relaled effects in EEG alpha asymmetry,
i.e., the stimuli used in this and other experiments may not have been perceived as
natural odours but as synthetic compounds (which they were). Several subjects in
experiments one and two commented on the "artificial” nature of some of the odorants
used. In fact, all odours were manufactured by a food flavour company. Arguably,
this may have been a plausible reason for the absence of any negative alliesthesia in
those fed subjects exposed to food odour after eating. Furthermore, it would be
instructive to examine the brain's response to a genuinely "biologically relevant" odour

that derives from source and is not a commercial analogue. Ii is possible, of course,
that as long as the odours are rated as significantly pleasant or unpleasant, and brain
responds to unpleasant and unpleasant smells in the same way it does pleasant and
unpleasant films, then any asymmetries should be evident. There also exists the
possibility that although rating scores for odours differ significantly on a pleasantness
dimension, this does not necessarily imply that an odour can rightly be classified as
"unpleasant". Its relationship with other odours is relative. Thus, a genuinely
unpleasant odour-one scoring fairly highly on an pleasantness scale-should generate the
affective asymmetries one would expect from an obnoxious stimulus. In view of the
findings reported in experiment two, it is likely that EEG alpha may be responsive only
to particular types of stimuli such as those considered relevant to approach and
withdrawal. In short, it is arguable that more salient, distinctively approachable and
repulsive olfactory stimuli are required before any such alpha asymmetry becomes
apparent.
In experiment three, a similar experimental protocol to that of the second is employed.
To determine the effects of genuine food aroma tin the EEG, subjects will be presented
with the odours of hot, cooked foods. The odours will also include those of foods
eaten by the lunch group in order to establish a more rigorous test of allieslhesia and
post-prandial EEG changes. As in experiment two, the relationship between EEG
asymmetry and psychometric evaluation will be examined further. II' the approach-
withdrawal hypothesis of frontal EEG asymmetry is correct and ifthc assumption that
pleasant or unpleasant odours exert the same effects on brain activity as do pleasant or
unpleasant films, then odours customarily perceived as warning stimuli or those which
alert, should produce an EEG pattern similar to that found with films rated as
"disgusting", i.e. increased frontal/anterior right hemisphere alpha activation. One
particular odour which meets the criteria of repulsion and the induction of withdrawal

behaviour is that of spoiled food (Janzen, 1977; Grey & Pearson. 1987). This is one
of odour's functional characteristics: to warn of the danger of ingesting harmful food.
In experiment three, the odour of rolling meat will be used as an evocative, unpleasant,
withdrawal-behaviour inducing stimulus with the odour of a familiar, well-liked food
used as the pleasant stimulus. In view of the realistic nature of the food odours used, it
is expected that olfactory negative alliesthesia, if it does exist, would be evident. If the
post-prandial alteration in rating for pleasantness is found, then it is fair to suggest that
the lunch group's frontal/anterior EEG asymmetry may alter in accordance, with less
alpha activation in the left frontal region and/or more theta activity generally evident.
7.2. Subjects.
15 right-handed non-smokers (11 female; 4 male) from the University of Warwick plus
readers of a local newspaper advertisement requesting subjects for an experiment on
brain mapping and the sense of smell participated in the experiment. All subjects were
screened for anosmia, odour discrimination, health and medication, as in experiments
one and two. Following the first testing session, the group was randomly assigned to
one of two conditions. Group 1 (4 female; 4 male) remained under laboratory
supervision before the second testing session (No-Lunch group-control); Group 2 (7
female) received a prescribed lunch (Lunch group). All subjects gave informed
consent.
7.3. The odours.
The odours in the experiment were chosen to be representative of the odours of
familiar, real and cooked food. Natural foodstuffs were prepared in the laboratory on
the day of the experiment to ensure freshness and to avoid tainting. The odorants were
baked beans (3()g in a microwaveable plastic beaker), hot water (NO ml. in a
microwaveable plastic beaker), coffee dissolved in hot water (110 ml. in a

microwaveable plastic beaker), chocolate (2 microlitres on a perfumer's strip) and
rotting pork (1 inch cubed, in a plastic beaker, see below). The baked beans, hot water
and coffee were heated in a 650 watt microwave oven according to manufacturer's
instructions and were presented piping hot. In view of the possibility that any
psychometric or EEG response to the heated beans and coffee may be mediated by
trigeminal stimulation from the steam emitted, hot water was used as a control for the
cooked foods.
The inclusion of the rotting pork determined whether the EEG responds to stimulation
by an off-odour and whether the human EEG responds more differently to this than an
odour considered more positively. The rancid odour of raw, decomposing or re-heated
meat (including restructured meat) is the result of lipid oxidation (see Janzen, 1977;
Gray & Pearson, 1987; Lillard, 1987; Sofos & Raharjo, 1989 for reviews). As tissue
membranes are disrupted, exposure to oxygen causes the so-called "warmed-over-
flavour" (or WOF, Tims & Watts, 1958). A number of factors affect the acceleration
of lipid oxidation, including the amount of fatly tissue, the diet of the animal and lipid
composition. Pork is one meat which rapidly oxidises and develops a rancid odour
(more so than animal lipids with more saturated laity acids). It also develops its WOF
more rapidly when cooked. For this experiment, 1 inch squared of pre-cooked pork
was allowed to develop rancidity for 1 week. It was kept in a sealed plastic container,
wrapped in selophane and stored away in a laboratory cupboard until time for
experimental preparation. This procedure was followed after consultation with food
management agencies (Campden Food & Drink Research Association). Pilot testing
confirmed the potency of the rancidity. Permission from the Departmental Safety
Officer was obtained for the use of this stimulus.

The chocolate and baked bean odours were used to determine the response of the EEG
to the odour of a food which the Lunch group had previously eaten. Although the
cooked foods were prepared immediately before presentation, this preparation was
undertaken well away from the subject. The olfactorium ensured that no pre
presentation food smells were detected and all subjects reported smelling no food odour
before the actual presentation. To further ensure the odour-free integrity of the testing
environment, all beakers containing food were sealed with a lid until the odour was
presented.
All odours were presented in counter-balanced order but for the hot water which was
always presented after baseline recording. The malodour was always presented last in
order that its quality would not affect the perception of other odours. The stimuli were
presented in their beakers (except for chocolate) about 7 ems from the midline of the
subject's face.
7.4. Procedure.
Subjects were tested individually and arrived at the laboratory at either 11 a.m. or 12
noon. Testing was undertaken in two sessions separated by a 30-40 minute interval.
Subjects had been instructed to eat no food, or ingest any caffeine for 3 hours prior to
the experiment. Pre-experiment instructions were given as in experiments one and two.
EEG electrodes were applied as described in experiments one and two. The recording
procedure was identical to that in experiment two but for one major variation (see
section 7.6. below). Subjects were tested in the olfactorium as before and were given
identical instructions to those in experiment two. A minor modification was made to
the subject's conditions. Whereas in the previous experiment subjects wore
headphones emitting white noise in order to preclude any extraneous auditory

stimulation, subjects in present study received no white noise and but did wear
headphones. This modification ensured that subjects were distracted neither by the
white noise or environmental noises.
Following the first testing session, subjects rated the odours they had smelled along
various dimensions (see below). The odours of hot, cooked foods were presented in
beakers (excepting chocolate which was presented on a perfumer's strip) beneath the
subject's nose. Subjects had their eyes closed during each of the presentations. When
subjects had received enough stimulation to enable them to make a rating, the odour
was removed and subjects made their rating. This was made along 12.5 cm. Lickert-
type line scales (as in experiment two) with the poles at 0 or 12.5. The dimensions
represented were pleasant-unpleasant (0-12.5), weak-strong (0-12.5), familiar-
unfamiliar (0-12.5), alerting-calming (0-12.5), makes me happy-does not make me
happy (0-12.5) and makes me hungry-does not make me hungry (0-12.5). The order of
the poles was reversed for each odour in order to avoid response set. In addition to the
odour ratings, subjects also completed a similar analogue-scale rating relating to their
nutritional state. These ratings took the form of two 12.5 cm. line scales representing
the dimensions of hunger ("not at all hungry-very hungry" and fullness ("not at all lull-
very lull") [see appendix A4],
Following completion of odour evaluation. Group 1 remained in the laboratory under
experimental supervision while Group 2 received a prescribed meal before both groups
again participated in a second EEG session. One methodological alteration in the
present experiment was that subjects completed the psychometric odour and
hunger/lullness rating exercise immediately after the first testing session and
immediately before the second testing session. The length of time between ingestion
and rating at the second session therefore would be no more than five minutes. It was

believed that this would potentiate any oll'aetory alliesthesia since it is possible that the
lime latency between eating and rating in experiments two and three may have
influenced the results. The second EEG session was run as in the first session.
Following completion of this second session, subjects were debriefed, paid and
received a free brain map.
7.5. The Lunch.
The lunch differed in content slightly from that of experiments one and two. Subjects
in the Lunch groups still received a bowl of vegetable soup, baked beans with potato,
and carbonated water (in measurements as described earlier) and also received a
chocolate dessert mousse. Thus the meal composition mirrored that of a complete meal
with starter, main meal and dessert. Cooked food was prepared as in experiments one
and two.
7.6. EEG recording.
EEG was collected as described in experiment two except that the odour exposure
period was extended to 30 epochs (1 min. 16 secs.) to allow for adequate artifact-free
epoch samples, with no pre- or post-odour recordings. In addition, 30 epochs of
"baseline" EEG were recorded before any of the odours were presented. This condition
represented the overall control. The inter-odour interval was 1 minute. No subject
reported detecting an odour prior to the presentation of the following stimulus. Data
were collected from 19 electrodes in all five frequencies (see Fig. 7). The nineteen
electrodes selected for analysis were those selected in experiment two. Artifact
procedures were followed as in the previous experiment.

OC
CIPITA
L
»*1oro"
Electrode array used for analysis in experiment three.

RESULTS
7.7. Psychometric results.
7.7.i. Hunger and fu llness ratings.
The data from the hunger and fullness seales were submitted to two, separate two-way
repeated measures analyses of variance with group and time-of-day as factors. There
was a significant main effect of time-of-day and a significant time-of-day x group
interaction [F (1,12)=9.97, p=0.()08j. As expected the lunch group gave significantly
lower hunger ratings after lunch than before (i.e. reported experiencing less hunger) as
well as giving lower ratings in the afternoon that did the control group (i.e. the lunch
group reported less hunger than the controls) [Tukey's HSD, df =12, p<().(H)()l and df
= 12, p<().()(K)5 respectively]. There was no significant difference between the a.m.
and p.m. ratings of the controls or between the u.m. ratings of the lunch and control
group.
Fullness ratings appeared to mirror those for hunger. Again, there was a significant
interaction between time-of-day and group |F (1,12)=38.96, p<().()()(M)5]. This
interaction paralleled that for hunger with the lunch group reporting greater fullness
after lunch than before (df=12, p<().(MK)5) and the lunch group also reporting greater
fullness in the afternoon than the controls (df=19, p=().(H)2). As expected, there was a
significant correlation between hunger and fullness ratings in the afternoon (r= -0.96,
p=<0.(K)(K)l) but not in the morning (r= -0.29, p=1.00) which presumably reflects the
variability of these two dimensions pre-prandially. The relationship between ingestion
and hunger and fullness ratings can be seen in Figs. 7. i. a &b.

HUNGER & F U L L N E S S (AM)
Fig. 7.i.a. illustrates the a.in. ratings o f hath groups fo r hunger and
fu llness (O-hungry/not fu ll; I2.5=not hungry/very fu ll). There appears
to be little group difference between the rating responses on either
dimension. Control group=Group I ; Lunch group=Group 2.

HUNGER & F U LL N E SS (PM)
Fig. 7. i.b. illustrates the p.m. ratings fo r hunger and fu llness fo r
controls (Group 1) and Lunch group (Group 2). O=hungry/not fu ll;
12.5=not hungry/very fu ll.
7.7.ii. Does the odour induce hunger?
To determine the relative ability of odours to induce hunger, pre-and post-prandially,
this dimension was submitted to a three-way ANOVA. A significant main effect of
odour [F (4,44)=7.38, p=().()()2| was found for this dimension. Post-hoc analysis
showed that the pairwise effects were limited to hot water-beans and heans-meat
comparisons where the beans made the subjects significantly more hungry relative to
hot water and the rolling meat. T a b le 7a . shows the odours ranked along this
dimension. The odour of baked beans appeared to be a stimulus which was able to
generate considerable feelings of hunger in hungry subjects. The lack of palatabilily of

hot water and rotting meat suggests that the odour of a pleasant, stereotypical foodstuff
can induce hunger to a greater extent than neutral or unpleasant food odours.
T a b le 7a, Odours rated for their ability to induce hunger (control vs lunch group
data). 0= Makes me very hungry; 12.5=Docs not make me at all hungry. There were 8
subjects in each group.
ODOUR GROUP 1 (No-Lunch) GROUP 2 (Lunch)
HOT WATER (AM) 8.51 (3.4) 10.8.3 (2.5)
(PM) 7.9 (3.3) 10.49 (2.7)
BAKED BEANS (AM) 2.75 (3.01) 6.16 (4.1)
(PM) 3.44 (3.3) 9.8 (2.8)
COFFEE (AM) 8.1 (3.2) 7.64 (4.7)
(PM) 6.83 (2.1) 1 1.09 (3.0)
CHOCOLATE (AM) 8.3 (.3.8) 6.81 (4.8)
(PM) 6.77 (.3.9) 10.2 (3.2)
ROTTING MEAT (AM) 11.3 (2.5) 9.83 (4.2)
(PM) 11.8 (1.06) 10.73 (4.2)
A significant time-of-day x group interaction [F (1,1 l)=l 1.97, p=0.005| was also
obtained. Odours induced greater hunger ratings in the control group than the lunch
group (1=2.91, df (12), p=().()13), a finding which attests to the satiating effects of the
ingested meal, as illustrated by Figs. 7.ii. a-c.

HUNGRY D I M E N S IO N FOR CONTROLS (AM v s PM)
G R O U P
Fig. 7.ii.a illustrates differences between the control group's a.in. and
p.m. response to the question, "does this odour make you hungry?"
(0=makes me hungry; 12.5-does not make me hungry). The group's
ratings do not appear to show any difference between sessions.

HUNGRY D IM E N S IO N FOR LUNCH GP (AM V S PM)
G R O U P
Fig. 7.ii.b. illustrates differences between the lunch group's a.in. and
p.m. responses to the question "does this odour make you hungry?"
(O-does make me hungry; l2.5=does not make me hungry), there is a
marked difference between the a.in. and p.m. responses to beans, coffee
and chocolate.

HUNGRY D IM E N S IO N PM (C O N TR O LS v s LUNCH)
Bi
G R O U P
Fig.7.ii. c. illustrates differences between the p.m. responses o f the
control and lunch groups to the question ",does this odour make you
hungry?" (O=does make me hungry; !2.5=does not make me hungry).
7.7.iii. Odour identification.
To investigate the possibility of differences in the idenlifiubilily of odours, a Cochran's
test for repeated measures design was used as in experiments one and two. A sign test
revealed significant differences between chocolate and hot water and rotting meal.
Chocolate was identified better than either of these odours (p=().()31 and 0.004
respectively) both of which tended to generate incorrect but plausible descriptors (eg..

cheese for rotting meat; tea for hot water). There were trends towards significance for
the beans-meat and coffee-meat comparisons but not significantly so. The trends
nonetheless indicated the relative unidentifiability of meat compared with the other
odours. The relationship between identification and the odour's familiarity is presented
in T a b le 7 b .
Table 7b. Odours ranked according to idcmifiabiliiv (most to least) and familiarity
(most to least). Means with standard deviations in brackets (lor familiarity only).
I d e n t i f ic a t io n F a m i l ia r i ty
Chocolate Baked beans 1.57 (1.02)
Baked beans Coffee 2.45 (2.71)
Coffee Chocolate 2.85 (1.9.3)
Hot water Hot water 5.42 (.3.16)
Rotting meat Rotting meal 6.9 (3.35)
(0= familiar; 12.5=not at all familiar)
7.7.iv Psychom etric ratings: p leasan tness, fa m ilia rity , strength,
alertness, happiness and hungriness.
The data from the psychometric ratings were submitted to separate three-way repeated
measures analyses of variance with group, time-of-day and odour as factors. The
results for the pleasantness, strength, familiarity, alertness and happiness dimensions
are summarised in T ab le 7c.

n n X 2X ow X tt>p i toC/3
fid*— pv u OJ p 3
LoO ' S
b ito 3
i t,0—> V w»— to p to p C/3
VO o Lk> vO pL n <01 ►— *—• ooN—'
X n o X ?o </3%
X cnn
X ■l3
p vO vO era
8toOJ 2 ?
'—•to p
beu>
’-ovC
vOoc 3
7 0 X n n X *»12 X £**\
p iX &9
3
6.9
to
tobe<Oi
to4 -'Oi
b i•o
5*n
«*—•p p — to(*>L/l 5
veOJ ■“
X n x n >X ro
p i2 to
-t3
00 p p p p <0vo be *-o o j C/3
C/3IO ov vO to ——, ,—,
tO to to tobv OJ bv be *ou> 4- 4 - vo
■— * X&?
S X n O X ■3*3
X X3*ftC/3
Ov p i p 4^ C/3
i—* ONoo
LoU i ^3 58
3*Q.to „_„ ,_, ,.—. c—> *— to to p oIO bo VC be <T
■O s—' O 'Oi to 3VO s—̂ s^ ’w 3
Means are given w
ith standard deviations in brackets. Ratings are ranked from
most to least (pleasant, strong, fam
iliar, etc.)

(a) Did the ingestion o f lunch affect any psychometric rating?
As in experiments one and two, there was no main effect of group nor any group x time
of day x odour interaction for pleasantness, familiarity, strength, alertness or
happiness.
(b) Did the odours differ along any o f the dimensions?
(b) i. Pleasantness.
As predicted, there was a significant main effect of odour on psychometric ratings of
pleasantness |F (4,48)=24.17, p<().()() 1 ]. Post-hoc tests revealed that the differences
between odours centred on the rotting meat which was rated as less pleasant than hot
water (t=6.82, df (13). pcO.OOl), baked beans (1=4.8. df (13), pcO.OOl), coffee
(t=8.65, df (13), p< 0.001) or chocolate (t=7.05, df (13). pcO.OOl). F ig . 7,iii.
illustrates these differences more clearly.

173
G r a p h i l l u s t r a t i n g d i f f e r e n c e s i n p l e a s a n t n e s s b e t w e e n o d o u r s
t i i i r
CO w wBKfM4
p£ E-<2 Eh p <<u
<a
Eh<
W2
m
Qw
oooSB
ou
£
EhO
O55M
B o SB Eh< Ehm O
«
O D O U R
Fig. 7.Hi. represents all odours rated fo r pleasantness (Unpleasant;
12.5-u np leasan t).
(b) ii. Strength.
There was a significant main effect of odour on strength ratings |F (4,44)=27.31,
p<0.()()()01] as seen in Fig. 7.iv. Post-hoc tests showed that the effect was, as
expected, largely the result of hot water/other odour pairwise comparisons. This
odour was rated weaker than baked beans (1=7.57. df (12), p<().(M)l), coffee (t=5.44.

df (12), p<0.001), chocolate (t=5.46, df (12), pcO.OOl) or rotting meat (t= 14.X2, df
(12), pcO.OOl). There was also a significant difference between chocolate and the
rotting meat where chocolate was rated weaker than the meat (1=3.48, df 912),
p=0.004).
S T R E N G T H D I M E N S I O N
ODOUR
Fig. 7.iv illustrates differences between the odours along the strength
dim ension (O-weak, l2.5=strong).
(b) Hi. Familiarity.
A significant main effect of odour was also obtained for familiarity |F (4,44)= 11.98,
p<().()(X)l). Post-hoc tests showed that this effect was largely confined to the meat
odour which was rated as significantly less familiar than baked beans (t=6.81, df ( 13),
p<().(X)l), coffee (1=4.31, df (1.3), p=().(X)l) or chocolate (1=3.89, df (13), p=().(X)2).

In view of the relative infrequency of contact with the malodour, this finding was not
altogether surprising. There was also a significant difference between rating for hot
water and baked beans with the beans being rated as more familiar than the hot water
(t=4.81, df (12), p<().(M)l). These differences can be seen in Fig. 7.v.
F A M I L I A R I T Y D I M E N S I O N
O¡awEH<06
ODOUR
Fig. 7.v. illustrates differences between odours along the fam iliarity
dimension (Unfamiliar; 12.5=unfamiliar).

(b) iv. Alertness.
There was a significant main effect of odour obtained for the alertness dimension [F
(4,44)=9.82, p<0.0005] which is illustrated in Fig. 7. vi. Post-hoc analysis showed
that this effect was due to the rotting meat which was rated as motv alerting than hot
water (1=4.38, df (12), p=().(K)l), baked beans (1=4.05. df (13), p=<>.<)<) I) or chocolate
(t=4.12, df (13), p=().(K)l). In view of the nature of this stimulus it is plausible that
this odour should be the one which subjects find the most alerting and attests to the use
of malodour as a caveat.

A L E R T N E S S D I M E N S IO N
OzMfrl<«
O D O U R
Fig. 7.vi. illustrates differences between odours along the alerting-
retaxing dimension (U=alerting; 12.5=relaxing).
(b) v. Does the odour induce happiness?
This dimension showed u significant main effect of odour |F (4,44)= 16.43,
p<().(M)(X)5] as seen in F ig . 7. vii. Post-hoc analysis revealed that this effect was
produced hy the rotting meat which was did not make subjects as happy as did the
baked beans (t=5.06, df (13), p<().(X)l), hot water (1=7.26, df ( 12), p<().(X)l). coffee
(t=7.39, df (13), p<().(X)l) or chocolate (t=6.45, df (13), p<0.(X)l).

H A P P I N E S S D I M E N S IO N
O DOUR
Fig. 7.vii. illustrates d ifferences between odours fo r the ",does the
odour make you happy" dimension? (<)=does not; l2.5=does). Rotting
meat, as expected, performs remarkably poorly on this dimension.
7.7.v. Would subjects eat the fo o d emitting the odours used?
To further determine the repugnant nature of the rolling meat and the payability of the
other foods, subjects were asked whether they would eat any food emitting the odour
they had smelled. Since this repeated measures design employs a Yes/No response,
Cochran's test was used to analyse the results. A sign lest showed that there were
significant differences between odours, largely the result of the influence of rotting

meat. Food emitting this odour would not he eaten hy the subjects in comparison to
baked beans (p=().(K)2), coffee (p=0.(M)4) or chocolate (p=().()()2).
7.8. EEG results.
Data from the EEG experiment were log transformed to account for possible skewing
and were submitted to a three-way repeated measures analysis of variance with group,
time-of-day and odour as factors. For each of the main factors, all EEG frequencies
were analysed.
7.8.i. Effects o f odour.
A main effect of odour was obtained for theta (FZ: |F (5,20)=90.08, pcO.OOl |; T5: |F
(5,20)=4.39, p=0.038]), alpha (Ol: [F (5,2<))=4.<>1, p=().()5|; 02: |F (5.20)=4.45,
p=0.049]) and beta 1 (C4: |F (5,20)=5.66, p=().OI3|). There were no main effects of
odour for delta or beta 2.
(a) Theta.
Post-hoc analysis showed that the main effects of odour were produced at FZ by the
chocolate odour which generated less relative theta activity than all other odours (no-
odour control-l=9.84, df (5), p<().(X)l; baked beans- t=13.94, df (5). pcO.OOl; col'fee-
t=9.99, df (5), p<().()() 1; hot water- 1=11.88, df (5), pcO.OOl; rotting meat- 1=16.88,
df (5), pcO.OOl). At T5, the odour of rotting meal generated significantly less theta
than did the no-odour control (t=5.18, df (6), p=0.002). F igs 7.viii. and 7,ix.
illustrate this relationship between the odours.

O D O U R D I F F E R E N C E S I N T H E T A
O DOU R
Fig. 7. viii. illustrates the differences in theta activity generated by the
odours at electrode site FZ. As is clear from the graph, chocolate
appears to produce a markedly different response in this frequency to
the other odours. EEG data are fo r theta (log).

ODOUR D I F F E R E N C E S I N THETA
Fig.7.ix. illustrates differences between odours in the theta frequency at
the T5 electrode site. There appear to be marked differences between
the blank ( control) and other odours, although only comparisons
between blank and the odour o f rotting meat reached significance. EEC
data are fo r theta (log).
(b) Alpha.
In both cases where significant results were obtained for alpha, more alpha activity was
present during exposure to chocolate than to meal (Ol: t=5.12, df (5), p=0.004; 02:
1=4.25, df (5), p=0.()08). The relationship between these odours can be seen more
graphically in Fig. 7. x.

ODOUR D I F F E R E N C E S I N ALPHA
Fig. 7.x. illustrates the EEC differences between odours fo r the
occipital electrodes 01 and 02. Data are fo r alpha (log).
(c) Beta 1.
A similar relationship between rotting meat and chocolate results was Ibund in beta 1
where chocolate was associated with significantly more activity in this frequency than
was the rotting meal odour (t=6.02, df (5), p=0.(M)2). There were no other effects of
odour.

7.8.H. Effects o f time-of-day.
There was a significant main effect of time-of-day for iheta (F7: [F (1,4)=26.68,
p=0.0()7];T3: [F(l,4)=6.89, p=().()5]; FZ: [F(l,4)=38.58, p=().()()3|), alpha (PZ:
[F(l,4)=7.15, p=().()5]), beta 1 (T3: [F (1,4)=20.41, p=().011J) and beta 2 (T3: [F
(1,4)=8.23, p=0.046]). From these initial results, it would appear that the left temporal
region appears especially sensitive to time-of-day effects in these bands.
(a) Theta.
For both left frontal and left anterior sites, theta activity was greater in the afternoon
than in the morning (F7: t=5.()5, df(5), p=0.004; T3: 1=2.87, df(5), p=(>.()35). For
frontal-central sites, however, there was significantly less theta in the afternoon than in
the morning (FZ: t=6.94, df (5), p=().(K) 1).
(b) Alpha.
At the central-parietal site, greater alpha was generated during the afternoon than during
the morning (PZ: t=2.99, df (50, p=0.03). There were no other time-of-day effects for
alpha.
(c) Beta 1 and 2.
At the left posterior site, beta 1 activity was greater in the morning than in the afternoon
(t=4.97, df (5), p=0.(X)4). Conversely, beta 2 activity was greater in the afternoon
than the morning (t=3.06. df (5), p=0.()28). The relationship between these two
electrodes can be seen in F ig . 7. xi. There were no other effects of time-of-day tut the
beta wavebands.

A M / P M D I F F E R E N C E S I N B E T A 1 & 2
F R E Q U E N C Y & T I M E
Fig. 7. xi. illustrates time-of-day differences fo r the beta I and beta 2
bands fo r the electrode, T3. An inverse relationship appears to exist
between the two frequencies: Activity increased the afternoon fo r beta 2
whereas activity decreased fo r beta l. Data are fo r beta I & 2 (log).
7.8.iii. Did odour and time-of-day interact?
There were odour x tiine-of-day interactions for alpha (FZ: |F (5,20)= 1 12.92,
pcO.OOl ]) and beta 2 (CZ: [F (5,20)=4.55, p=0.041 ]), both at central locations.
For alpha, less activity was generated during exposure to chocolate in the afternoon
than in the morning (t=l 1.77, df (5), p<().(X)l). For beta 2, the interaction was due to
hot water which was associated with greater beta 2 power in the afternoon than the
morning (t=3.47, df (5), p=().()18). There were no other significant odour x time-of-
day interactions.

1 85
7.8.iv. Did odour, group and time-of-day interact?
There was a significant three-way interaction for the alpha waveband at the right
anterior region (F8: |F (5,20)=3.91, p=().()55]). Post-hoc analysis revealed that this
interaction was due to the EEG activity of the lunch group, as reflected in Fig. 7.xii.
This group showed greater alpha activity post-prandially than pre-prandially (t=5.3(), df
(2), p =0.034).
Fig. 7.xii. illustrates group differences in alpha activity between the
two testing sessions (l=control group; 2 -lunch group) fo r the electrode
F8. As is clearly seen, there is a significant difference within the lunch
group with greater alpha generated during the second session. EEG data
are fo r alpha (log).

7.8. v. EEC asymmetry and pleasantness ratings.
(a) Asymmetry between odours.
As in experiment two, asymmetry indices were calculated lor four topographical
regions (frontal, parietal, anterior-temporal and central) for alpha and theta frequencies.
These indices were calculated for the odours which subjects rated most pleasant and
least pleasant and compared with a neutral control. From the psychometric data, it is
apparent that baked beans gave the highest pleasantness rating (3.52) and rotting meat
the highest unpleasantness rating (11.4). This was confirmed by ANOVA (see above).
The blank, no-odour condition was used as neutral control. To examine further the
possible effects of lunch consumption on EEG response during olfactory stimulation,
the p.m. data for each group were analysed separately from the a.m. data.
No main effect of odour was found for the alpha waveband. However, a significant
main effect of odour was obtained for theta [F (2,16)=4.54, p=().()3211 Post-hoc
analysis showed that this effect was due to the comparison between baked bean and
rotting meat odours (t=3.66, df (8), p=0.006). More left-sided frontal activity was
apparent for the baked beans (index: 10.04) relative to the rotting meat (10.005).
An odour x group effect interaction was obtained in the theta waveband |F
(2,2Q)=5.89, p=0.011). This interaction was largely due to the control group which
generated greater right-sided parietal activity to the odour of baked beans when
compared with the lunch group (Tukey's, df (16), p=0.031) (Controls' index: 9.87;
lunch group: 9.99). A significant difference was also found between the lunch group's
asymmetry for the blank condition (index: 9.91) and baked beans (9.99) (Tukey's, df
(20, p=().()27). For this group, greater right-sided parietal activity was found for the
blank condition with the baked beans approaching symmetry.

(b) Were there any differences in asymmetry location for each odour?
To determine whether there were differences in asymmetry for individual odours at
different locations, the data were submitted to a univariate ANOVA with position as
factor. As in the above analysis, the p.m. data were considered separately.
There was a significant main effect of position in alpha for the baked bean odour |F
(3,30)=3.1, p=0.056], as reflected in F ig . 7 . x iii. (overleaf). Post-hoc analysis
showed that this effect was due to a difference in asymmetry between frontal and
anterior-temporal sites (t=2.75, df (10), p=0.02). Greater left-sided activity was found
at frontal (index: 10.10) sites than at temporal locations (9.77).
A significant group x position interaction was obtained for the p.m. data in the alpha
waveband [F (3,33)=2.98, p=0.051]. Here, significantly greater asymmetry was
evident for the control group at anterior-temporal sites during exposure to rotting meat
(t=2.52, df (11), p=0.028). This group showed greater right-sided temporal aetivily to
rotting meat (Controls’ index: 9.72; luneh group: 9.97).
A main effect of group was obtained for the rotting meal in theta |F (1,11 )=6.031,
p=().()32]. This effect was due to greater relative overall tight hemisphere activity in the
control group compared with the lunch group (controls' index=9.88; lunch group=10).
As can be seen, the lunch group's index reflects perfect theta symmetry.

P O S I T I O N D I F F E R E N C E S I N ASYMMETRY
Fig. 7. xiii. illustrates differences in the distribution o f alpha
asymmetry fo r the baked bean odour. It is evident that frontal sites
generated greater left-sided activity than any o f the other sites. Data are
fo r alpha (log) based on the asymmetry index Log Left-Log Right + 10.
7.8.vi. EEC asymmetry and alertness ratings.
Data from those odours rated as most alerting, calming and neutral were taken to form
an asymmetry index for the four electrode-pair locations. These odours were rolling

meat (4.31) and hot water (8.92), respectively. Alpha and theta were analysed. The
p.m. data were considered separately.
(a) Differences between odours.
There was no effect of odour on position asymmetry for alpha but a significant effect
was obtained for theta [F (2,16)=3.61, p=0.055] at central areas. Post-hoc analysis
showed that the odour of rotting meat (index: 9.97) was associated with greater right-
sided activity than was the hot water (10.03) (Tukey’s, df (16), p=().()28).
A main effect of group was obtained in p.m. alpha at anterior-temporal regions |F
(1,11 )=5, p=0.047]. Here, there was a significant difference between the control and
lunch group for the rotting meat odour (t=2.52, df (II), p=0.<)28). Both groups
showed more right-sided activity but the control group showed greater right sided
activity compared to the lunch group (controls' index=9.73; lunch group=9.96).
(b) Differences in asymmetry by position.
There was a main effect of electrode position in p.m. alpha for the hot water stimulus
[F (3,33)=3.7, p=().()25]. The control group showed greater right-sided temporal
activity to this odour than did the lunch group (df (42), p=<().()() 1; controls'
index=9.66; lunch group=9.96). There was also a group x position interaction for hot
water in alpha [F(3,33)=3.89, p=().()21]. The interaction was due to effects within the
control group and to differences between the lunch and control group at central areas.
The control group showed greater right-sided activity at temporal areas than at frontal
(df (3.3), pcO.OOl), parietal (df (33), p< 0.001) and central (df (33), p<0.()()I) areas.
The control group also showed greater right-sided activity at central areas (index: 9.9)
than did the lunch group (9.96) (df (33), pcO.OOl). There were no other main effects
of position and no other interactions.

7.9. Discussion.
7.9.i. Pre- and post-prandial hedonic response to odour.
As in experiments one and two, and contrary to Duclcaux et al (1973) and Cahanac
(1979), no effect of lunch was found on post-prandial ratings of the pleasantness of
food odour. This finding was obtained even though two of the odours rated were
emitted by the ingested food. This evidence, coupled with that of the previous
experiments, lends strong support to the hypothesis that olfactory-specific satiety and
negative olfactory alliesthesia are highly irregular phenomena which are not easily
replicable.
The factor of time has been cited as a possible explanation for the variability of sensory
specific satiety (SSS) and negative alliesthesia (Rolls et al. 1986). Normally, the
greater the propinquity between ingestion and rating, the stronger the SSS and negative
alliesthesia. A greater latency between eating and rating may produce weaker
alliesthesia or no alliesthesia at all. In the current experiment, all subjects rated the food
odours immediately after eating their lunch (if they comprised the lunch group) or
immediately after the thirty minute inter-session interval (for the control subjects).
Thus, although the duration between eating and rating was kept to a minimum,
olfactory alliesthesia continued to be unobserved.
A possible objection raised in C h a p te r 6 was that hunger was not responsible for the
alliesthesia per se but the fullness experienced after a meal (i.e. satiety proper). Yet, in
the present experiment, those subjects who had eaten lunch reported being significantly
fuller after lunch than before and significantly fuller than controls. This effect was not
relative since the post-prandial rating was high (12). Thus the fullness factor appeared
to have no effect on the odour ratings.

Although fed subjects rated the the odours of chocolate, coffee and baked bean as less
hunger-inducing than did unfed controls, there was no concomitant decrease in odour
pleasantness. It appears, therefore, that exposure to food odour after ingesting a
lunchtime meal reduces the degree of hunger generated not only by the odours of the
foods eaten (baked beans, chocolate) but also by food not eaten (coffee). Surprisingly,
the rating given for the hunger-inducing ability of coffee was also significantly lower in
the fed group then in controls. One might have expected no change in the rating for
coffee or possibly an increase in its desirability following the ingestion of a meal. One
possible explanation for this finding may be due to the way in which the question was
worded. The subject was asked : "Does this odour (coffee| make you hungry?" It is
possible that this question was misinterpreted as "Does this odour make you generally
hungry?" and not "Does this odour make you hungry for coffee?" The subjects'
satiated state may thus have dictated their response to this question. The ratings for hot
water and rotting meat, as expected, showed no significant difference in rating before
and after lunch, between or within subjects.
On the basis of these findings, it is possible to construct a modified version of the
"strong" negative alliesthesia hypothesis which would state that the pleasantness of
food odour will decrease with satiety when compared with pre-prandial ratings. The
modified version would argue that it is not the hedonic component of the odour which
changes but the odour's effect on hunger for food. Subjects did not like the food
odours less after eating their lunch but these odours did not induce hunger to as
significant a degree as it did pre-lunch. This hypothesis and a general consideration of
the psychometric results reported here are discussed in C h a p te r 8.

7.9.ii. EEG results: Effects o f odour.
As in experiment two, marked differences were found hetween odours in the theta
frequency. At central locations, the odour of chocolate was associated with
significantly less theta activity than any other odour or blank baseline. Further theta
differences were found in the left temporal region with the odour of rotting meat
generating less theta compared with the blank condition. In experiment two, the odour
of chocolate was rated as highly relaxing and soothing. In the present experiment,
however, hot water was rated as the most relaxing of the odours. Rotting meal, not
surprisingly, was rated as significantly different from all other odours for the
pleasantness, alertness and happiness dimensions with all other odours rated
favourably by comparison. Chocolate, however, was rated fairly highly on the
pleasantness and relaxation dimensions which suggests that there may be some
psychophysical property of this odour (probably those mentioned) which affects the
theta frequency. In view of the hypothesis proposed in C hapter 6 that less
theta=increased relaxalion/decreased tension, this finding provides further evidence to
support such a hypothesis. No significant differences were found between hot water
and chocolate on the relaxation and alertness dimensions which suggests that there is a
property of chocolate odour which is capable of generating effects on the EEG,
particularly effects which are related to the odour's association with increased
relaxation. It is possible that the subjects were responding more to the tactile sensation
produced by the hot water and not its odour (for the simple reason that the water had no
odour). The odour of chocolate was also associated with differences in the alpha
frequency showing greater bilateral occipital activity to this odour than for rotting meat.
The significance of the alpha frequency to odour processing is unclear. As noted in
se c tio n 4 .1 0 ., C h a p te r 4, odour rarely exerts effects in this frequency. The
postulated generating site for alpha is the occipital region although even this is not
completely certain (Andersen & Andersson, 1968; Niedermeycr, 1987). That the

odour-effect should have been generated bilaterally in this area and to two odours
who's hedonic psychometric ratings differed markedly, suggests that this frequency in
this region may be particularly susceptible to these kinds of stimuli. The increased
activity to the odour of rotting meat suggests that the affected area of the scalp may be
highly influenced by a highly attention-reducing odour such as rotting meat. If a
stimulus is classed as alerting (which it was in this experiment) or distracting (which
wasn't examined), if alpha is considered a reliable index of attention (Ray & Cole,
1985), and if the generating source of alpha is in the occipital region, then the result
obtained here is not unexpected. Furthermore, the odour of rotting meat was also
associated with less theta activity compared with the no-odour control. This finding
would appear to support an attentional hypothesis of theta function as suggested in
section 6 .1 0 .H . of C h a p te r 6 . This hypothesis and the evidence for it will be
reviewed in greater detail in the following chapter. It is possible that it is this aitcntional
feature of olfactory perception which may account for the reliable changes in EEG
theta.
7.9.Hi. Tiine-of-day effects.
Time-of-day differences were observed in several wavebands with greater alpha and
theta (at left frontal and anterior regions) present in the second session than the first.
This change in alpha was also reported in experiment two. An inverse relationship
between beta 1 and 2 was observed at left temporal sites with greater beta I in the first
session than in the afternoon and greater beta 2 in the afternoon than in the morning. It
is interesting to note that all time-of-day effects were restricted to either midline or left
hemisphere electrodes. Very little is known concerning lime-of-day differences in the
waking EEG (Niedermyer, 1987). Many studies claim to have found Basic-Rest-
Activity-Cycles (BRAC, Aserinsky & Kleitman, 1953) in normal EEG (e.g.. Manseau
& Broughton, 1984) or have used much longer recording periods to that in the current

experiment (e.g., Gundel & Hilhig, 1983; Tsuji & Kohayasehi, 1988) or measure
electrophysiological fluctuations before, during and after sleep (Rechtschaffen & Kales,
1968; Torsvall & Aekerstedt, 1987). It is possible that waveband changes reported
here are related to time-of-day but, as noted in C h a p te r 6 (section 6 .10 .iii.), these
changes may be due to familiarity with the testing procedure and recording protocol.
7.9.1V. EEG asymmetry and odour pleasantness.
An intra-hemispheric difference in alpha activation was observed for the most pleasant
odour, that of baked beans, which appears to reflect the type of activation found by
Davidson and his colleagues. Significantly greater left hemisphere alpha activation was
found for this odour at frontal sites than at temporal sites. As noted above, previous
investigations using film clips have shown increases in alpha at similar regions as a
result of exposure to a pleasant film. The alpha asymmetry which reflects this affective
response would thus appear not to be modality specific. The different pattern of EEG
activity evidenced in studies using visual stimuli is also found with olfactory stimuli. It
may be worthwhile to consider whether these EEG asymmetries may also be elicited by
stimuli in other sensory modalities such as audition and touch. Although the neural
organization of these sensory systems differs considerably, it is reasonable to ask
whether the affective response to such a stimulus would be reflected in a homogeneous
region of the brain, viz., the frontal and anterior cerebral cortex, a region which may
play a considerable, if not instrumental, role in mediating emotional experience
(Robinson & Szetela, 1981; Sackeim, Greenberg, Weiman, Gur, Hungerbuhler &
Geshwind, 1982; Robinson, Kubos, Roa & Price, 1984). Evidence from clinical
studies, as reviewed briefly in section 4.14., Chapter 4, suggests that damage to
specific regions of the brain, in particular the frontal cortex, results in severe changes in
affective behaviour. The manifestation of the behaviour is dependent on whether the
damage is inflicted to the left or right frontal cerebral hemisphere so that depressive

symptomatology results from left frontal damage whereas euphoria and manic
behaviour can occur with right frontal damage (Gianotti, 1972; Tucker, 1981; Sackeim,
Greenberg, Weiman, Gur, Hungerbuhler & Geshwind, 1982; Slarkslein, Robinson &
Price, 1987). Davidson (1984) has also reviewed evidence from animal studies which
indicates that similar selective unilateral damage has affective consequences similar to
those found in humans. This hypothesis, that frontal brain regions may be important
areas of mediation for emotional experiences of differing valence, will be considered
more fully in the final chapter (C h a p te r 8). The regional difference in alpha found
for the most pleasant odour was not repeated for the theta frequency. Here, greater
relative, left frontal theta activity was found for the odour of baked beans when
compared with the odour of rotting meat. This would appear to be at odds with the
hypothesis put forward in C h a p te r 6 that reduced theta would accompany the
perception of odour that was relaxing and tension-reducing. The odour, however, was
not the most relaxing of the odours used but was still rated as fairly relaxing. In view
of the pleasantness rating of the baked beans it is plausible to argue that the asymmetry
reported for this odour when compared with that of rotting meat may not he related to
any "anxiety"-based property of the odour, but its overall quality of pleasantness. That
differences were found between the two extremes in the odour range (most pleasant and
least pleasant) and in the left frontal region and that this is the region associated with
different EEG patterns as a result of altering emotional valence, the hypothesis can be
pul forward that activity in the theta band operates in a fundamentally different, if
unsystematic, way from alpha. As noted in C h a p te r 6, the psychological significance
of theta has been related to changes in emotional response (Waller, 1959; Maulshy,
1971; Knott, 1976; Cohen et al, 1976; Lorig & Schwartz, 1988). It is possible that
this frequency may operate in a similar but different way to alpha when an individual is
exposed to odour which has distinct hedonic properties. If these distinct hedonic
properties are viewed as stimuli inducing approach and withdrawal behaviours, which
the stimuli used the present experiment ean be, then one can argue that activity in theta
reflects these properties for olfactory stimuli. Thus greater left hemisphere theta to an
"approach" stimulus (the baked bean odour) contrasts with the significantly less activity
generated as a result of exposure to a "withdrawal" stimulus (the odour of rolling
meat). Arguably, theta is the EEG index of this olfactory dichotomy. This notion, the
evidence for it, and an alternative interpretation is discussed in more detail in the next
chapter.
As no post-prandial changes in the hedonic rating of the food odour emerged from the
present study, hedonically-related alterations in EEG asymmetry as a result of food
ingestion were not expected. However, the lunch group showed significantly greater
right-sided temporal alpha activation to rotting meat than did controls, a finding which
partially supports previous studies showing increased activation in this area to negative
emotional stimuli (Wheeler el al, 1993). The temporal lobes, and especially the right
temporal lobe, have been argued to play an integral role in the perception of affective
stimuli, especially "negatively" rated stimuli since the efferent and afferent connections
between these lobes and the orbital frontal cortex and their connections with the
amygdala, are considerable (Naula, 1971; Hotel & Misanstone, 1974; Hotel, Keating
& Misanstone, 1975). Some authors have suggested a role for the temporal lobes in
the identification and detection of odour on the basis that damage to these areas result in
deficits in these tasks (Eskenazi, Cain, Novelly & Mattson, 1986; Jones-Gottman &
Zatorre, 1988a, b). Right-sided alpha activation has also been reported with negative
stimuli (Wheeler et al, 1993) and in depressed patients (Henriques & Davidson, 1989).
In view of the unpleasant nature of the rolling meat stimulus, this regional difference in
the activation of alpha is predictable. That the regional difference, however, occurred
between fed and unfed groups is more intriguing. The amygdala is known to play
some part in the regulation of eating (Urson, Rosvold & Vest, 1969). Rolls & Rolls

(1973) found that amygdala-lesioned rats ate novel and familiar foods indiscriminately
(whereas undamaged rats initially avoided the novel foods and gradually accepted
them). Weiskrantz (1956) has observed similar, indiscriminate eating behaviour as a
result of amygdala lesions. The connections between the amygdala and the temporal
lobes, in non-human organisms, are extensive. In the present study, the subjects'
previous experience with the rotting meat odour coupled with the ingestion of a
lunchtime meal suggests that the increased activation observed at the right temporal lobe
area represents some "affective gate", as the amygdala is argued to he (Kelley & Stinus,
1984). In the controls, this affective gale has functioned efficiently, and the individual
has adapted accordingly. In the lunch group, this gating has obviously been affected
by food ingestion which renders the odour of rotting meat, if this odour is seen as
inducing withdrawal-and the EEG evidence suggests that it does-even more
unapproachable. Thus, arguably, the nutritional state of the subject affects the response
to a withdrawal stimulus at areas known to mediate negative responses. It is important
to note that the nutritional state of the subjects and the food-related hedonic rating of the
odour is not relevant to this hypothesis since the right-sided temporal changes were
found with the most unpleasant odour, the food whose odour emitted this smell would
not be eaten.
7.9.v. Alertness asymmetry.
The pattern of activity obtained for the relaxing and alerting odours in experiment two
would suggest that significant group by odour differences would occur in theta at
frontal and temporal areas. In the previous experiment, greater left frontal than
temporal theta activity was found in the control group during exposure to the odour
rated as most relaxing, chocolate; greater relative left-hemisphere temporal theta activity
during presentation of the chocolate odour was also found in controls when compared
with the lunch group. In experiment three, no significant effect of the "relaxing odour"

was found in the ihcta frequency. This results is not altogether unexpected since the
"hot water" stimulus was not originally construed as an experimental odour hut as a
check on the effects of vapours arising from the cooked food used as olfactory stimuli.
The finding does suggest, however, that it is the perception of a particular odour which
affects brain asymmetry and not simply its relaxing properties per se. The perception
of an inhaled chemical's "good" qualities is dependent on the way in which the stimulus
is found relaxing. For the chocolate odour, the smell alone might be enough to enhance
the mood of the perceiver; for the hot water, however, the enhancement might, and
probably does, arise from the warm sensation in the nasal cavity produced by its
vapours since this stimulus is odourless. The "relaxing" nature of the hot water may,
therefore, be primarily trigeminally mediated.
The effects in theta which were obtained, however, were found with the rolling meal
odour which was associated with significantly greater right-sided activity at "central"
locations. This odour was also associated with greater right-sided temporal activity in
controls than the lunch group. The association between an unpleasant stimulus and
greater right-sided theta frequency activity has not been reported elsewhere although
increased alpha activation at frontal brain regions has been associated with the
experience of disgust or dislike (Wheeler et al, 1993). The finding in theta, as opposed
to alpha, provides further evidence for the implication of this frequency in the response
to odour, and in particular the odour's hedonic property. The significance of the
relationship between this frequency and odour perception and affect is further
elaborated in the following chapter. If one assumes that theta does mediate the hedonic
qualities of odour to a greater extent than alpha, then the finding of increased activity in
the right hemisphere lends support to previous hypotheses regarding the type of
hedonic information processed by the right hemisphere. Rotting meat was selected for
use in the current experiment because of its unpleasant smell and because it is a good

example of a stimulus which induces withdrawal-type behaviour (Fallon & Rozin,
1983). Again, if we assume the salience of theta in odour perception, the right-sided
activity observed here appears to provide some indirect evidence for the neural substrate
for withdrawal-behavour or, at least, for the type of stimulus capable of inducing
withdrawal.
The significance of the finding that controls showed significantly greater right-sided
temporal activity than did the lunch group during the presentation of the rotting meat is
unclear. One possible hypothesis that the physiological and psychological alterations
brought about by the ingestion of a meal in the lunch group in some way made the fed
subjects less susceptible to finding the odour repugnant, although no significant
difference between the two groups was found for the pleasantness rating of this odour
post-prandially. However, since this odour was rated the most alerting of those used,
it is arguable that its alerting properties continued to affect hungry, unsatiated subjects
whilst fed subjects, experiencing fullness and perhaps a degree of comfort after eating
and sitting in a comfortable armchair were not as susceptible to this feature of the
odour. Although the psychometric results show no significant difference between the
lunch and control groups' alertness ratings for this odour, this finding may perhaps
indicate that the psychometric measure was not sensitive to subtle shifts in the subject's
perception and experience. The second psychometric rating exercise was undertaken in
comfortable, but not overly comfortable, conditions whereas the subsequent second
EEG testing session was undertaken in a dark room with subjects wearing a blindfold
and headphones as they sal in a comfortable armchair. The context of the two
"responses" may thus have led to the absence of a significant group-difference for the
alertness dimension. This, however, is only a tentative suggestion.

The expected asymmetries in alpha were, as in experiment two, not obtained in the
present experiment. Moreover, hemispheric differences were localised to two brain
regions and their interaction with the type of group. Here, the control group showed
greater right-sided temporal than frontal alpha activity (i.e. comparatively greater frontal
activation) during presentation of the hot water stimulus while also showing greater
right-sided temporal alpha activity to this stimulus than did the lunch group. The
significance of these findings is unclear since this pattern would be expected in the
contralateral hemisphere. It is possible, as suggested above, however, that these
asymmetries may be a function of the type of stimulus used (namely, the hot water)
which although rated the least alerting stimulus was something of a rogue, for the
reasons outlined earlier. These findings may, therefore, not be odour-related.
7.9. vi. Conclusion to experiments 1, 2 & 3.
The experiments reported above suggest that exposure to odour may have a fairly direct
effect on Central Nervous System functioning but that the psychophysiological
consequences of meal ingestion are less pronounced. When these two variables are
combined, as seen in the findings from the asymmetry indices, the effect of odour has
been found to be dependent on the physiological state of the subject. It has been argued
here, based on the findings from experiments two and three, that theta may be the
dominant information-processing frequency for the perception of odour. This
hypothesis, the evidence for it, and the theoretical framework which could possibly
encompass it, is now assessed in the final chapter. The relationship between odour
perception and human CNS activity is also considered together with the effect of food
ingestion on electrophysiological behaviour. Implications for future research and
suggestions for further investigations are presented.

2 0 1
CHAPTER 8~ON EEG, EMOTION & ODOUR:
A RE-ASSESSMENT &
GENERAL DISCUSSION.
"Results alone are not sufficient. There must he a
framework within which to interpret them. There
must he a theoretical pa radium. "
D .A . N o rm a n (1 9 8 4 )
8.1. Aims o f the current thesis-revisited.
The aims of the present thesis were three-fold and broad. As outlined in C h a p te rs 1
& 4, the primary aim of the experiments reported here was to examine the effects of a
common and "biologically relevant" olfactory stimulus, such as food odour, on Central
Nervous System activity. Since little is known concerning the effects of exposure to
odour on human brain activity, especially when compared with the cerebral effects of
the "higher" senses, the principal objective was to demonstrate replicable
electrophysiological changes, reflected in the EEG, as a result of natural olfactory
stimulation. As noted in C h a p te r 4 , clues as to the primary EEG frequency affected
by olfactory perception are to be found in some of the published studies: The
hypothesis was raised in the discussion sections of C h a p te r s 6 & 7, that the most
likely waveband to respond to olfactory stimulation is theta, with significant but less

pronounced effects in alpha. This hypothesis receives strong support from a number of
other studies and will concern a large part of the remainder of this chapter.
The second aim of the thesis was also fundamental: the examination of the effects of
food intake on electrophysiological behaviour, primarily on the ERP, but also on the
spontaneous EEG (where effects have not been widely demonstrated). The ERP, and
especially late, positive-going ERPs such as the P200 and P300, is known to be highly
reflective of cognitive processing. The evidence reviewed in section 4 .8 . of
C h a p te r 4 suggests that this phenomenon may be altered by various experimental
manipulations, including exposure to odour and food consumption. Reason would
dictate that if changes in endogenous potentials (those presumably reflecting cognitive
processes) occur with exposure to certain stimuli or under certain conditions, these
conditions and stimuli may affect not only the appearance and form of the ERP but also
the cognitive process which is hypothesised to underlie the ERP (such as attention and
decision-making). Investigations of satiety argue that the greater ERP amplitude found
when subjects' hunger is quelled is the result of increased attention (e.g., Stacher et al,
1979). Whether this effect is the result of "psychological" factors such as feelings of
satiety or due to physiological changes, such as alterations in brain metabolism is, as
noted in the discussion in C h a p te r 5, unclear. It is argued here that while the
consumption of food certainly produces changes in brain metabolism (as Geislcr &
Polich, 1992a, suggest), the increase in ERP amplitude may not necessarily be a
consequence of this metabolic change. Rather, it is the satiety or experience of fullness
produced by specific meals which alters brain metabolism (and also
electrophysiological arousal) is the important factor in generating different evoked
potentials.

The experience of particular stimuli was related to the third aim of the thesis. The
discussion in C h a p te r 4 suggested that stimuli of different affective valence are likely
to produce significant differences in frontal EEG alpha asymmetry. Experience of
pleasant visual stimuli have been associated with left frontal, anterior hemispheric EEG
alpha activation; the emotion of disgust has been associated with increases in right
frontal hemispheric EEG alpha activation, at least in some studies (see T a b le 4.2. in
C h a p te r 4). The point was raised in C h a p te rs 6 an d 7 that olfactory stimuli may or
may not behave in a similar fashion to visual stimuli in generating different asymmetries
of this kind. Davidson et a I (1990) have argued, for example, that certain sensory
stimuli such as auditory stimuli are not studied in this way since this type of stimuli
may activate different brain regions or have other, non-affective features which might
affect the outcome of the investigation such as pitch, tone, timbre and so on. Odours,
however, are known to have reliable hedonic qualities. What is normally regarded as
pleasant to one subject may not be pleasant to another but universal hedonic responses
do exist, especially to familiar odours such as chocolate and to intuitively repellent
odours such as excrement, rotting food, hydrogen sulphide, etc. (Rozin & Vollmeeke,
1986). Related to the repellent nature of odour is the eoncept of withdrawal and
approach behaviour which has been argued by some to have electrophysiological
concomitants in the way of EEG frontal asymmetries (Davidson, 1984; 1992). While
visual stimuli such as films may only be indirectly relevant to approach-withdrawal,
however, smell is a much more potent and directly relevant stimulus. As noted in
C h a p te r 2, the use of smell as a caveat under certain circumstances attests to its ability
to repel and induce withdrawal. Food products such as meal, milk produce or
vegetables which emit an unpleasant off-odour would not customarily be eaten by
civilised societies. They invoke withdrawal behaviour. Whereas a pleasant odour will
be sniffed repeatedly in order to prolong the enjoyment of the experience, an unpleasant
odour will be approached in the opposite manner. Thus if any stimulus is capable of

inducing ihesc two forms of behaviour- approach and withdrawal- odour should
certainly be one of them. As noted earlier, if the EEG does reflect these two different
behavioural processes, then repellent odours should show the right frontal hemisphere
activation in alpha characterised by some disgusting visual stimuli. Conversely,
pleasant odours should show an increase in alpha activation in frontal cerebral areas. In
two experiments using odours which differed in quality and type, and with different
recording protocols, this clear-cut pattern did not emerge. However, certain
odour/affect-related asymmetries were obtained. The reasons for the lack of clear,
hemispheric EEG alpha asymmetries, and for the particular asymmetries which were
obtained, are discussed below. In addition, the findings obtained from the data relating
to food ingestion will also be considered in the context of psychophysiology and
negative alliesthesia. Of primary interest, however, is this relationship between
olfactory perception and psychophysiological response. How relevant are the data
from EEG studies to the understanding of the human olfactory system? Is the EEG a
sensitive enough measure of olfactory information-processing? Can it be regarded as a
measure of olfactory information-processing? Why are only certain EEG frequencies
affected? And how can the findings reported here assist in the understanding of the
neural correlates of olfactory perception?
8.2. EEG & odour II: The predominance o f theta.
In the review of the few studies of human EEG response to odour summarised in
C h a p te r 4, it was possible to reach three conclusions regarding the current knowledge
of human olfactory EEG. The first is that the experimental manipulation of odour
presentation in these experiments has been very limited. In view of the affective
properties of odour, for example, or the uncertain relationship between the sniffing
nostril and its receiving cerebral hemisphere (Ehrlichman, 1986; Kobal, Hummel &

Van Toller, 1992), there appears to he considerable scope for applying EEG to these
features.
Secondly, the EEG appears to be a reliable and valid method of measuring human
eleclrophysiological, CNS response to odour. The EEG has been commended for its
versatility in the measurement of various psychological variables from verbal and
spatial reasoning to emotional response (Davidson, 1983). Its use in measuring
response to sensory stimulation has also, although not very widely, been suggested.
The averaged form of the EEG, the ERP has been especially useful in permitting the
localising effects of somatosensory, visual and auditory stimuli although the recording
of ERPs to olfactory stimuli has been less widely attempted.
Until recently, the relevance of the EEG to the measurement of human olfactory
perception had not been considered, despite the increasing interest in mapping other
sensory functions. Studies attempting to monitor EEG response to odour conclude that
exposure to odour affects the pattern of EEG idiosyncratically and only in particular
wavebands. Delta, for example, has not been reported to be susceptible to alteration by
any olfactory stimulus in adult human subjects. The theta frequency, however, appears
to be highly responsive to this kind of stimulus. This is, perhaps, the most intriguing
conclusion that can be drawn from these studies. The strength of the relationship
between olfactory perception and theta alteration suggests a specific role for this
waveband in olfactory perception. First, however, the case against.
8.2.i. Objection I: Other wavebands as well as tlieta appear to be
affected by exposure to odour.
In the studies reviewed in C h a p te r 4, analysis is usually undertaken in a small number
of frequencies. Some studies select one waveband (Bushteva et al, 1958; Moncriel’f,

1962; Kendal-Reed & Van Toller, 1992; Van Toller et al, 1993), others have analysed
two (Long & Schwartz, 1988) three (Staeher et at, 1979; Lorig et al, 1988; Lorig et til,
1990) or four (Klemm et al, 1992). Further differences in frequency selection arise
when some studies distinguish waveband frequencies which differ from those of the
classical wavebands. Lorig & Schwartz (1989), for example, distinguish between the
alpha frequency and a Factor 1 waveband with a frequency of 5-8Hz which is almost
analogous to the theta frequency. With this variety of wavebands, inconsistencies and
idiosyncracies will arise. Of the eleven studies that have sought explicitly to examine
the relationship between the perception of an odour and the pattern of EEG activity,
three have analysed alpha only, one has analysed alpha and Factor I and six have
included both the theta and alpha frequencies.
The effects of odour on EEG alpha have included desynchronisation and general
suppression (Bushteva et al, 1958; Moncrieff, 1962), no effect on alpha (Lorig &
Schwartz, 1988; Lorig et al, 1990; Klemm et al, 1992). alpha reduction during
undetected odours (Lorig et al, 1991), "differences in the amount of alpha activity over
left and right hemispheres" (Lorig & Schwartz, 1988, p.283) or slight alpha increases
(Van Toller et al, 1993). With the exception of the last study, all studies have reported
either some diminution in EEG alpha as a result of exposure to odour or have found no
effect of odour on this frequency. The findings from the earliest studies (Bushteva et
al\ Moncrieff, 1962) may be disregarded on methodological grounds. No correction
for eye-movement was reported and no statistical analysis was provided: Analysis was
undertaken by visual inspection. Of two remaining studies which demonstrate alpha
changes, one obtained the result to an undetected odour, the other employed a
descriptive statistical technique (MDS) which may have produced different findings to
those studies employing ANOVA. The remainder of these studies show no alpha
effect.

2 0 7
The lack of alpha change is partly supported hy the present experiments. In experiment
2, no effect of alpha, beta nor delta was obtained for any odour. In experiment three,
however, a particular relationship emerged between the rotting meat and chocolate
odours with the odour of chocolate showing greater alpha activity at bilateral occipital
sites (thought to he the generating source of alpha) than did the odour of rotting meat.
As suggested in C h a p te r 7 , the hypothesis that alpha might reflect relaxed
wakefulness suggests that the greater activity to the odour rated as relaxing and pleasing
(chocolate) is possibly the result of the odour's psychometric property. Since the
rotting meal was rated as the most alerting and least pleasant of the odours, less alpha
during presentation of this stimulus when compared with the chocolate odour is not
unexpected. The absence of the effect in experiment two, however, still requires
explanation. Two possibilities arise: (i) the bilateral decrease to rolling meat is a fluke
and an artifact or (ii) the odours demonstrating the alpha effect have some special
properties which are not present in those used in experiment two. The first explanation
is unlikely. The probability value for the effect was small for both electrode sites, 01
and 02. The hilalerality of the finding and the appearance of the effect at electrode sites
hypothesised to overlie alpha's neural generators also argues against this explanation.
The second explanation is more persuasive since the odours selected for experiment
three were designed to be qualitatively different to those in experiment two. The earlier
experiment involved the presentation of synthetic odorants which although fairly good
analogues of the odour they were intended to re-create may not he regarded as
completely natural odours. Those stimuli chosen for experiment three were intended to
be as close to natural odours as possible, hence the use of cooked foods. If the human
brain is likely to respond to any odour, then it might he expected to respond to the
odour of items with which it is familiar and to which they have special meaning.
Rotting meat was clearly a potent stimulus which contrasted greatly with the pleasant

smell of chocolate. In view of alpha’s associations with relaxation (Niedermeyer,
1987; Schuman, 1980) the result is explicable. It could be argued, however, that alpha
simply reflects levels of vigilance (Gastaut, 1974; Dongier, McCallum, Torres and
Vogel, 1976; Ray & Cole, 1985; Perlini & Spanos, 1991) so that high levels of alpha
presumably reflect a low degree of vigilance and low levels of alpha indicate a high
degree of vigilance. This hypothesis is compatible with the findings reported in
C h a p te r 7. The pleasant and relaxing quality of an odour such as chocolate, it could
be argued, would he likely to produce less excitement and alertness than would an
odour rated as less pleasant and relaxing. Such a negative odour would more than
likely elicit some withdrawal behaviour, innervating the subject instead of calming and
therefore increasing attentiveness. It is possible that such an explanation is appropriate
and workable here.
Does the alteration of activity in one EEG band suggest that significant alterations in
another are not possible or contradict the view than one band may be more significantly
affected than others? It is unlikely. Most psychological variables measured by EEG
elicit changes in a number of wavebands. The concept of desynchronisation is such an
example. The interest lies in the particular bands which are affected and the electrode
sites at which change occurs. Focus has remained on alpha and beta because these
wavebands have been shown to be clearly affected by cognitive, perceptual and
affective processing (Gale and Edwards, 1983; Davidson, 1988). Other waveband
changes occur in tandem. Theta, for example, has also been implicated in EEG
response during problem-solving and perception of complex stimuli (Schacter, 1977).
The fact that some alteration in alpha has been found during exposure to certain odours
does not undermine the hypothesis that another band is the frequency most susceptible
to change during odour perception.
208

8.2.ii. Objection 2: Changes in theta have been found in tasks which
are not olfactory in nature.
This objection would he valid if the theta frequency was argued to he affected hy
stimulation hy olfactory stimuli only. Such an hypothesis, however, can be quickly
disputed since tasks which do not involve olfactory stimulation produce alterations in
theta (Mi/.uki, Masotoshi, Isozaki, Nishijima & Inanaga, 1980; Rugg & Dickens, 1982;
Mizuki, Takii, Nishijima & Inanaga, 1983; Rappelsberger & Pelsche, 1988). What is
suggested is the tentative proposal that theta, to a greater extent than the other
frequencies, is responsive to olfactory stimulation. It is possible that there are aspects
of this stimulus, other than the quality of "smell", which generate theta changes (and
these will be considered below) but the relationship between theta and olfactory
perception is greater than that between olfactory perception and any other waveband (as
seen above and in experiments two & three). Why, therefore, should theta be
responsive to odour?
8.3. Theta and olfactory perception: The case for.
In the discussion of their findings, and in particular the result that four of the odours
(jasmine, birch tar, lemon and lavender) used in their experiment were associated with
increases in left anterior theta activity when compared to pre-stimulus baseline, Klemm
et al (1992) suggest that that there may be an association between the increases reported
in theta and those associated with hypnosis and cognitive ability. The suggestion is
based on Schacter (I977)'s review of EEG theta and psychological phenomena. The
authors, however, do not go on to elaborate the details of what such a relationship
should be or is but note that some odours have been found to have a positive effect on
efficient cognitive performance (such as that reported by Warm et al (1991), see
C h a p te r 2). Others have suggested that the changes in the EEG and in theta activity

accompanying odour presentation may mediate changes in subjective mood states
(Long & Schwartz, 1988), although, again, no details of such a mechanism are given.
Experiments two and three also implicate theta in the perception of olfactory, food-
related stimuli. In experiment two, strawberry was found to produce greater theta than
spearmint at the right frontal region. In experiment three, chocolate was associated
with less theta than any of the other odours (at FZ) and rotting meal was associated
with less theta than a no-odour control at the left posterior site. Unlike the results of
Klemm et al (1992) but in support of Stacher et al (1979) and Lorig & Schwartz
(1988), all theta-related changes were comparative decreases in activity. An
explanation for this discrepancy could lie in the methods of analysis employed in the
present and other studies. Lorig & Schwartz (1988), for example, analysed data taken
from three epochs during odour presentation, the present experiments compared an
averaged epoch for each of the odours (including a no-odour control) during
presentation only, whereas Klemm et al (1992) pooled activity during and after odour
presentation and compared these data with those obtained during baseline, "pre-
delivery" recording. Excluding the possibility of "odour quality" differences in each
experiment which may have produced the effects reported, it is possible that the
olfactory emphasis in theta may be the result of the activation of some other
"psychological" process in which the olfactory stimulus is involved.
8.4. Odour, problem-solving, task difficulty and theta.
Changes in EEG theta have been associated with several factors including epilepsy
(Ciganek, 1961), sexual orgasm (Cohen, Rosen & Goldstein, 1976), hypnagogic
states (Schacter, 1976), REM sleep (Rechtsfallen & Kales, 1968), problem-solving
(Vogel, Broverman & Klaiber, 1968; Legewie, Siminova & Creutzfeldl, 1969; Jshihara
& Yoshii, 1972; Dolce & Waldeier, 1974; Lang, Lang, Diekmann & Kornhuher, 1987;

Davidson, Chapman, Chapman & Henriques, 1990), perceptual processing (Daniel,
1967; Gale, Christie & Penfold, 1971; Gale, Coles & Boyd, 1971) and affective
processing (Hoagland, Cameron and Rubin, 1938; Walter & Waller, 1949; Mundy-
Castle, 1951; Ahern & Schwartz, 1985). Schacter (1977) notes that those studies of
problem-solving which do result in theta changes normally report increases in activity.
Similarly, the more complex the processing of a stimulus the greater the theta activity.
He suggests that theta may be enhanced either due to "non-specific pre-stimulus
increments in alertness or to task-specific operations". The first explanation is unlikely
on the basis of the evidence available. An alternative suggestion is that these studies
show that "selective, narrowly focused processing and intensive 'mental effort' are
most consistently related to enhanced theta activity during problem-solving" (p. 59).
More recent studies have also reported increased theta activity during the performance
of repetitive mental arithmetic tasks (Miller, 1990) and during verbal and motor tasks
(Lang, Lang, Diekmann, Kornhuber, 1987). This emphasis on focused processing is
also suggested by the results of studies which have examined EEG responses to
complex perceptual stimuli (e.g.. Gale eta!, 1971).
The greater degree of theta activity found to some odours when compared with others,
a finding reported in the present experiments and some other studies, suggests, in light
of the "attention-processing theory" of theta responsivily, that the theta alterations
witnessed in olfactory EEG experiments may be a function of attention and not due to
the simple processing of an odour and its hedonic quality. This theory argues that the
decreased theta to certain odours is a function of either the alertness of or attention paid
to that particular stimulus. The theory is supported by a number of indirect findings.
For example, as noted above, some studies have reported increases in theta during
olfactory perception while others have reported decreases. This variation in theta
responsivity appears to be unrelated to the affective quality of the odour although Lorig

& Schwartz (1988) associated the lower theta activity occurring during presentation of
one odour with increased relaxation and decreased levels of anxiety on the basis of
subjects’ subjective odour ratings, arguably because this odour was perceived as less
alerting which explains the change in theta activity. Klcmm er til (1992) also report
little correlation between odour pleasantness and degree of theta activity. The main
effect of odour found in theta in the present experiments, however, indicates large
variability. In experiment two, the odour rated as most pleasant, spearmint, was
associated with significantly less theta activity than strawberry an odour rated as
pleasant (scoring 3.68 to spearmint's 1.82 on a scale of 0-12.5). In experiment three, a
moderately relaxing and pleasant odour, chocolate, generated less activity than the
odours of baked beans, hot water, coffee and rotting meat at FZ, an electrode thought
to show maximal theta (Ishihara & Yoshii, 1972; Westphal, Gro/inger. Diekmann,
Scherb, Reess, Leibling & Kornhuber, 1990). At the left posterior region, rolling
meat, the odour rated as least pleasant, most alerting and most likely to make subjects
unhappy, generated less theta activity than did a no-odour control. Thus on the basis
of psychometric property alone, there appears to he no simple relationship between an
odour's hedonic or affective quality and the odour's effect on theta.
If, however, theta reflects processing of complex stimuli and -by extension- the
attention paid to complex and interesting stimuli, one might argue that greater attention
would be paid to stimuli which the subject would be inclined to perceive as pleasant or
one which allows the subject time to "examine" it, thereby increasing the amount of
theta generated. Conversely, however, one could argue that an odour regarded as
pleasant might be analogous to a simple cognitive task and might thus be associated
with less theta activity than one which is analogous to a complex, 'strenuous' task. The
unpleasantness of rotting meal, for example, would not invoke a great deal of attention
because of its foul and distracting quality. The subject would consequently allocate

little time to perceiving the odour. A pleasant odour such as spearmint might be
perceived at length, thus allowing the subject a greater period in which to appreciate the
odour, its quality and possibly its associations [the evidence reviewed in se c tio n s
2 .4 .i. & 2 .4 .H . of C h a p te r 2 suggests that this may be the method by which
certain odours have a beneficial effect on task performance such as that seen in Warm et
al (1991)]. This hypothesis would appear to be partly supported by the finding that
spearmint was associated with less theta than strawberry in experiment two and that
chocolate was associated with less theta than all other odours in experiment three but
not by the fact that rotting meat was associated with less theta activity than a no-odour
control. However, it may be possible that some property of spearmint and chocolate is
responsible for the low degree of theta they generate when compared with other
odours. They are both pleasant and relaxing odours and their perception might be
analogous to performing a simple cognitive or perceptual task. Very few demands are
made on the subject's cognitive processes and although attention is paid to the stimulus
the attention is not highly motivated as it would be in a complex problem-solving task.
Why, however, should significantly less theta activity be generated during presentation
of rotting meat than during a no-odour control? It is possible that the degree of
attention the subject pays during blank presentations is considerable. The subject is
informed at the beginning of the experiment that an odour may or may not be present
during each trial. The order of the odours is randomised and the no-odor control is
always presented first although the subjects arc unaware of this. It is highly likely that
individuals may devote considerable atlentional resources to this task during a blank
trial since they may be expecting an odour to be present and are making a concerted
effort at detection. The belief that there is a weak odour in the environment might
additionally prompt this attentional executive into operation. The increased attention is
thus reflected in high levels of theta activity. Alternatively, the rolling meal odour, as

argued above, might reduce the attention paid during its presentation since the subject
may be distracted by it unpleasantness. With such lack of attention, decreases in theta
activity might be expected. If both these hypotheses are correct then the finding for
theta becomes explicable: attention paid during active detection (intensive task) is
associated with greater degree of theta than the distraction caused by perceiving an
unpleasant stimulus (simple task). Further investigation should establish the validity
of the hypothesis.
8.5. Odour and EEC asymmetry: replication or re-modification?
In the preeeeding section, the significance of the effect of odour on EEG was argued to
be largely due to 'cognitive' rather than specifically olfactory factors. Yet, the affective
quality of some odours has been thought to affect individual mood and cognition
(Rotton, 1983; Rotton, Barry, Frey & Solcr, 1978; Rollon, Frey. Barry, Milligan &
Fitzpatrick, 1979; Baron. 1980; 1990; Knasko & Gilbert, 1990; Knasko, 1992). In
EEG terms, some authors have sought to relate the changes in theta to the psychometric
properties of the odour, as noted above (e.g., Lorig & Schwartz, 1988). Such a
relationship, however, has been sought with little success.
Arguably, a considerable problem in the interpretation of the findings from studies of
olfactory EEG to dale has been the absence of a workable, theoretical framework. Part
of this problem resides in the fact that little research on human EEG response exists.
Consequently, the studies in this area, as in those of ERP discussed below, are largely
resulls-driven: The data from one study are presented; another study attempts a
replication with minor modifications and a clearer picture, it is hoped, emerges by
placing these pieces of this mosaic together. In view of the affective nature of smell (as
reviewed in C h a p te r 2 ), however, it is surprising that no research has, until now.

sought to relate odours of differing valence with EEC asymmetries, for which a
tentative theoretical framework does exist.
This framework, as discussed in C h a p te rs 4 , 6 & 7, suggests that alpha asymmetry
activation is a replicable electrophysiological concomitant of affective visual stimulus
processing. Davidson and his colleagues have demonstrated such asymmetries in
several studies using lilm and video clips (e.g., Davidson et al, 1979; Davidson et al,
1990; Ekman et al, 1990; Tomarken et al, 1990; Jones & Fox, 1992). It was argued in
C h a p te r 4 that, assuming all other factors are constant, similar asymmetries might be
obtained using olfactory stimuli.
In fact, results from experiments two and three only partly support such a model and
indicate that in order to explain affective processing adequately, slight but important
modifications to this framework may be necessary. In experiment two, forexample,
no significant main effect of site nor odour, or any interaction was found between the
food odours rated as most pleasant (spearmint) and least pleasant (garlic <& onion) either
in the alpha or the theta frequency. The reasons for the absence of clear, significant
asymmetries may have in some way been related to the possibility that the odours were
not adequately "relevant" (i.e. subjects were aware of the odour's synthetic quality) or
to the possibility that the odours were not sufficiently extreme (even though the range
from pleasant to unpleasant was 1.46 to 7.76). In experiment two, the odours were
selected to be both relevant and definitive. Here, significant asymmetries were found
for both the most pleasant (baked beans) and least pleasant (rolling meal) food odours
but in separate wavebands. Forexample, more left-sided frontal activity was present to
the baked bean odour when compared with the odour of rotting meal in the theta
frequency. However, an intrahemipshcric difference was found for the odour of baked
beans in the alpha frequency where greater left-sided frontal activity than temporal

activity was found. In the context of Davidson's model, this finding is interpreted as
greater temporal than frontal region activation during the perception of the most pleasant
stimulus. This is broadly consistent with the EEG model of approach-withdrawal
behaviour but the lack of a clear finding for the most unpleasant stimulus in alpha
indicates several possibilities which may account for the model's shortcomings.
8.6. Disparities & reasons fo r disparity.
One possibility which arises from the negative findings reported here is that the type of
stimulus used was inappropriate to the design and aim of the experiment and to the
affect-EEG model in general. This is the extreme view. It stales that any EEG
difference which might be apparent in response to stimulation from one sensory
modality will be different from that occurring with stimulation from another. As noted
in C h a p te r 4, asymmetries in alpha would have been expected had olfactory stimuli
behaved in a similar electrophysiological fashion to visual stimuli. However, there are
significant anatomical differences between the organization and structure of these two
systems which may have accounted for the absence of a cross-modal replication in
alpha (Kandel & Schwartz. 1985). Recent evidence suggests that the right orbitofrontal
and temporal cortex are heavily implicated in olfactory perception, discrimination and
identification (Rausch, Seraletinides & Crandall, 1977; Abraham & Mathai, 1983;
Eskenazi, Cain, Novelly & Mattson, 1986; Jones-Gotman & Zatorre. 1988a, 1988b;
Zatorre & Jones-Gotman, 1991). Zatorre, Jones-Gotman, Evans & Meyer (1992), for
example, using PET noted the unilateral activation of the right orbilofrontal cortex
during a simple, odour sniffing exercise. Odour recognition memory has also been
found to be impaired following right temporal or right orbilofrontal cortex impairment
(Jones-Gotman & Zatorre, 1993) as has the retention of nameable odours in patients
with epilepsy associated with the right temporal lobe (Carroll, Richardson &
Thompson, 1993). Evidence from primate studies has implicated the lateral posterior

orbitofrontal cortex in odour discrimination impairment and in the perception of specific
odours (Tanabe, Yarile, lino, Ooshima & Takagi, 1975; Tanabe, lino & Takagi, 1975).
Potter & Nauta (1979) have also postulated an important eorlicocortieal projection
between the prorhinal region in the temporal lobe and the orbitofrontal cortex. Deficits
in olfactory discrimination in rats has also been reported following orbitofrontal cortex
lesions (Eichenbaum, Shedlack & Eckmann, 1980).
The ability to discriminate would thus appear to be dependent on the integrity of the
right temporal lobe and also, to a large extent, on the orbitofrontal cortex although
bilateral and unilateral lesions to this area produce discrimination and identification
delicts. If these areas ate involved in the specific ability to discriminate between odours
and recognise odours then activation at these locations, in view of the site effects found
in the PET study noted earlier, might be witnessed in similar areas by the on-going
EEG. In fact, only one such effect was found. In experiment three, there was a
significant effect of electrode site in alpha for the baked bean odour. Greater left-sided
activation was noted at temporal than at frontal sites. The parsimony of this finding
suggests that, in spite of the orbitofrontal involvement in the olfactory system, the
presumed cortical site of olfactory processing is not clear on the basis of EEG
recording. It should be noted, however, that the experiment was not a direct
investigation of localisation of olfactory function but was concerned with possible
affective EEG asymmetries in olfactory processing. More suitable designs might
demonstrate significant task differences in the EEG according to electrode site. The
question then remains as to what specific function the temporal lobes serve in olfactory
processing since these areas are also known to be involved in memory for other
sensory modalities (Milner, 1978; McCarthy & Warrington, 1990; Samson & Zalorre,
1992). Carroll et a I (1995) suggest that since olfactory perception involves components
of autobiographical memory, then the likely site for recognition impairments in

olfactory processing would he the temporal lobes whose damage is associated with
global amnesia (McCarthy & Warrington, 1990). Such an hypothesis has not been
tested. In view of the orbilofrontal involvement in odour perception, however, the lack
of alpha frontal asymmetry in experiments two and three is pux/ling. If the right
orbitofrontal cortex is an important cortical site, it is surprising that the effects found in
experiments two and three were not more widespread. Hardly any significant effects at
this site between a no odour control and the odour were reported.
A less controversial alternative to the extreme interpretation -a modification to the
model- is that affective, olfactory asymmetries may be reflected in the EEC but only by
particular odours and in a waveband other than alpha. It is clear from the previous
sections that theta is particularly influenced by olfactory stimuli. If any waveband is to
show significant asymmetries to odours of opposing valence, therefore, one might
expect theta to do so. In fact, the finding from experiment three that greater frontal left
sided theta activity was present to baked beans than to rotting meat supports such an
hypothesis. Theta asymmetries are not uncommon and have been reported for
cognitive (e.g., Rappelsberger and Petsche, 1988) and affective tasks (Ahern &
Schwartz, 1985). The locus of the EEG asymmetry found for the odours in theta was
the frontal region a finding which is at least in keeping with the geographical spirit of
the affect-EEG model.
Another possibilty that must be considered is that there were serious methodological
differences between the present studies and those of Davidson and his colleagues. To
begin, EEG recording in Davidson's experiments occurred with the subject's eyes
open. In all the experiments reported here, subjects' eyes were closed and their hearing
(in the EEG studies) was limited. This difference although posing no threat to
adequacy of recording (Davidson et a! employ adequate artifact removal procedures; the

films used had the sound removed), suggests that the visual nature of stimulus
processing may have accounted for the discrepancy. The visual modality provides a
considerable degree of information to the perceiving organism and may provide a
greater fillip to imagination that might for example, an olfactory system processing a
single odour. The fact that subjects watched moving stimuli in the visual affect studies,
involving a degree of cognitive engagement, may have contributed to the differences
between the studies. However, in view of the psychological correlates of theta activity
discussed above, one might have expected, if EEG activity is affected by intense
cognitive engagement and attention, asymmetries to occur in this frequency. Davidson
et al, however, do not normally analyse activity in this frequency. Whether any effects
in theta were obtained, therefore, is unknown.
Indirect evidence to support the "attention" hypothesis is found in the findings from
experiment one. In C h a p te r 5 (sec tio n 5 .9 .iii.), it was suggested that the odours
employed reflected a hierarchy of distractability so that some stimuli would he more
alerting or distracting than others and would, therefore, produce differential effects on
ERP amplitude. In experiment one, a significant odour-related diminution of P200
amplitude was found to the odour of strawberry when compared to a no-odour control.
The odour of vegetable, similarly, was associated with significantly smaller P200
amplitude than the odour of coffee. The odours of strawberry and vegetable
represented the extreme ends of the hedonic dimension- one pleasant, the other
unpleasant. The hypothesis suggested in C h a p te r 5 and above is that the
unpleasantness and distractability of an odour are highly associated and may exert
similar perceptual effects. For example, a number of studies has found poor cognitive
performance during exposure to "negative" olfactory stimuli (Lewis et al, 1970; Rollon
et al, 1979). These studies and others reviewed in C h a p te r 2 suggest that it is the
odour’s unpleasantness which distracts the subject from the task being undertaken.

2 2 0
No study has yet considered a systematic investigation of this hypothesis although the
indirect evidence that is available and the literature from ERPs and attention would
suggest that there is considerable support for such an interpretation.
A recent paper has argued that the late positive-going wave recorded during an auditory
oddball paradigm may be associated with increased attention on the part of the subject
(Basar-Eroglu, Basar, Demiralp & Schurmann, 1992). This investigation recorded
ERPs and EEG delta and theta simultaneously and found that during increased
attention, significant increases in theta were recorded in frontal and posterior locations.
The link between increased attention and late positive-going waves such as the P300 is
not novel and has been suggested elsewhere (Woods, 1990). The association between
an ERP component known to be related to attention with significant increases in theta,
however, is of greater interest since it would confirm the hypothesis presented above
that the theta frequency is a putative index of attention. Furthermore, it was suggested
above that odours exhibit different degrees of distractahility: the greater the
distractability the lower the ERP amplitude. This, in fact, was observed. Considering
the data from the EEG and ERP studies together, therefore, a strong argument may be
put forward that electrophysiological effects associated with exposure to odour might
be mediated by some form of altentional executive which has its primary EEG
manifestation in the theta frequency.
8.7. Food ingestion, olfactory perception and the EEG.
The second aim of these experiments had two elements. The first element concerned
the relationship between the individual's response to food odour following lunchtime
meal consumption in the context of negative alliesthesia (Cabanac, 1971). The second

element was related to the individual's EEG response to food odour alter the ingestion
of a lunchtime meal.
8.7.i. Olfactory alliestliesia: a viable construct?
On the basis of the three experiments undertaken hem the concept of negative olfactory
alliesthcsia does not appear to be robust. In not one of the experiments did the hedonic
rating of the food odours differ between fed and unfed subjects. In experiment one, it
was suggested that a larger range of odorants might be necessary in order to
demonstrate an effect of alliesthcsia. Also, since the odours were rated once only and
after the second EEG session, the interval between ingestion and the rating may have
been loo long. In experiments two and three, the psychometric ratings were made both
before and after the inter-session interval. Even with these modifications, no effect was
observed. Furthermore when the odours of real food (and odours of food used as part
of the experimental lunch) were used as rated stimuli, the negative trend of these results
was further heightened. The reasons for the absence of an effect have been considered
in detail in s e c t io n 7 .9 .i. of C h a p te r 7 and will not be repeated here. It is
sufficient to suggest, however, that on the basis of ihe studies undertaken here, the
notion of olfactory alliesthesia does not appear to have strong validity.
Given this finding, no post-prandial differences in EEG asymmetry between the lunch
and control groups would be expected, based on odour pleasantness. This prediction
was partly supported by the findings from experiments two and three. In experiment
two, no expected frontal asymmetry differences between the control and lunch groups
was obtained in alpha, perhaps not altogether surprising given the absence of any
relevant, significant odour effects in the alpha frequency in this experiment. The
control group did, however, show greater overall left-hemisphere alpha activity than
did the lunch group and also showed significantly greater left-hemisphere activity to the

odours of spearmint and garlic and onion than did the lunch group. The difference in
alpha asymmetry in experiment three, however, was restricted to the EEG response to
the odour of rotting meat. In this experiment, the control group exhibited greater
relative right-anterior temporal EEG alpha activity to this odour, compared with the
activity of the lunch group. In view of the hemisphere in which one might expect to
respond to an offensive odour, this finding is illuminating. It is possible that the
controls found this odour more offensive than the fed group at the second presentation
although the lack of a group x pleasantness interaction for the psychometric scores
suggests that this is unlikely. Another possibility, however, is that the metabolic effect
of ingestion rendered electrophysiological response to offensive stimuli less receptive,
perhaps due to the reduction of the motivational drive for food or nonchalance towards
the offensive food-related stimulus engendered by satiety. The controls, having no
such motivational or metabolic restrictions, perceive and respond to the odour as before
with the net effect that EEG activity in the right hemisphere increases. This
interpretation clearly warrants further investigation.
8.7.ii. The electrophysiological response to food consumption.
A small number of studies reviewed in C h a p te r 4, suggests that the amplitude of the
ERP, and especially the amplitude of P3(K), depends on recency of ingestion. From the
evidence available from ERP and food analogue studies, it was hypothesised that an
interaction might occur between recency of food consumption and exposure to food
odour so that fed, satiated individuals would show larger amplitude ERPs during
exposure to food odour than would hungry individuals. As noted in the previous
section, however, the expected decrement in the hedonic ratings for food odours in
unfed subjects was not found. These predictions relating to psyehophysiological
response were partly supported by the findings reported in experiment one. The
amplitude of the P300 remained unaffected by the presence of odour, by the ingestion

of lunch or by time-of-day, a surprising lack of alteration given the effects obtained
elsewhere for P300 (Kerkhof; 1980; Geisler & Polich, 1992a. b; Lorig et at, 1991).
Possible reasons for this inconsistency have been discussed in some detail in C h a p te r
5. Apart from methodological differences, there may have been differences in
interpretation between the Geisler & Polich studies which showed increased P3(M)
amplitude with recency of food intake and the present experiment. These authors
associate the amplitude changes reported in their study with metabolic changes resulting
from food ingestion. The present thesis argues, however, that it is not the metabolic
alteration per se which effects this change in ERP size hut the subjective feeling of
satiety the subject experiences. The former studies did not employ any measure of
satiety or hunger in order to rule out any possible effects of subjective measures. It is
perhaps these subjective experiences which are responsible for the effects found for
P200. As noted in C h a p te r 5, it is possible that the P200 and P300 components
overlap significantly and that what has been obtained in the present experiment is. in
fact, an effect on P300. In view of the amplitude selection procedures undertaken,
however, this appears possible, although unlikely. The significant interaction between
group, odour and time-of-day found at CZ for P200 certainly mirrors that found
elsewhere for P300. Target P2(H) was significantly larger in the lunch group post-
prandially than pre-prandially, a finding which indicates that recency of food
consumption is able to alter the size of a late potential. Geisler & Polich (1992a)
reported small increases in the P200 of fed subjects and suggested that the effect of
ingestion may be general rather than specific to the P300. More interestingly, and in
support of Stacher et al (1979), a significant three-way interaction was also obtained at
FZ for target P200. At this site, the control group showed a significant decrease in
amplitude to the vegetable odour in the afternoon which does suggest that a food odour
is capable of altering the eleetrophysiological behaviour of an unfed subject but not a
fed subject. The finding, in fact, lends indirect support the hypothesis that a hungry.

unfed subject would be more easily distracted by the presence of food odour than
would a satiated, fed subject. The amplitude of the P200 and P3(M) is known to he
affected by diminished attention (Courchesne er al, 1978). Experiment one has
demonstrated for the first time that such a diminution can be obtained in unfed subjects
participating in an experiment administering natural foods and employing stimulation by
food odour, complementing different studies using food analogues and extraneous
stimuli such as the noise and smell of food preparation and other EPs such as the N200
(e.g., Pietrowsky et al, 1989).
The effect of meal consumption on the spontaneous EEC in the present experiments
was variable. In experiment three, the lunch group showed significantly higher levels
of alpha activity during the second, (post-prandial) session, than the first (pre-
prandial). In view of the nature of alpha and its associations with relaxed wakefulness,
this finding might indicate a greater relaxation in those subjects who had fed and whose
hunger has been quelled. The results from experiment two, however, appear
contradictory. In this experiment, control subjects showed the same general pattern of
alpha activity. This finding indicates two possibilities. The first is that little reliability
can be attached to the spontaneous EEG as a measure of satiety. This extreme view is
supported by the result that over two testing sessions, two different samples of subjects
gave contradictory responses. However, this possibility also raises another,
methodological possibility, namely, that the two groups differed significantly in some
way. Subjects in both experiments were issued with the same instructions regarding
food consumption. All subjects were told to refrain from eating or drinking three hours
before the beginning of the experiment. The testing protocol was virtually identical in
both studies. There were minor differences between the two studies, however. The
standard meal eaten by the lunch group in experiment three contained one item not
present in experiment two. Although possible, it is highly unlikely that the inclusion of

this item, chocolate mousse, would have dramatically altered the outcome of the
experiment. The EEG recording period for experiment three was extended to 30
epochs (2.56 seconds, x 30) per trial compared with 15 recorded during experiment
two. It is possible that this greater sampling of the EEG may have produced a more
reliable measure of brain response in experiment three. The ingestion of a meal is
unlike the presentation of an odour or a tone. The length of time required for brain
metabolism to alter may vary. As an event such as meal consumption is not time-
locked, it may appear necessary to record longer samples of EEG in order for an effect
of ingestion to manifest itself. If this hypothesis is correct, then the interpretation given
of the alpha effect in the lunch group is plausible on two counts. First, it is plausible
because of alpha's assumed relationship with relaxation and wakefulness and second, it
is plausible because a more reliable EEG recording sample was analysed.
Of some note is the significant time-of-day effect found in all three experiments. In
both the EEG studies, time-of-day was found to be significantly associated with
increases in alpha activity during the second session (p.m.). What is of even greater
interest is that this finding was replicated in experiment three and at the same electrode
location (PZ). The alteration in alpha reported in two .spontaneous EEG studies would
suggest that the EEG may be sensitive to individual diurnal changes (either in
temperature or some other unknown psychological variable) and may be indexed by a
particular electrode site. As discussed in C h a p te rs 6 a n d 7, however, whether these
changes truly relied diurnal "circadian" variation is uncertain. A longer recording
period than that used in the present studies would be required in order to examine more
carefully the changes in EEG over-time, using other physiological indices such as
blood glucose level and body and oral temperature. Kerkhof (1982), for example,
reported a trend for oral temperature as well as the PI90 ERP component to increase
from 9 a.m. to 9 p.m., a finding the author attributes to a general arousal mechanism.

Others have noted diurnal increases in body temperature (Colquhoun, 1971).
Comparing these various factors by measuring them comprehensively in tandem will
clarify the role of diurnal variation in physiological change.
8.8. Conclusions & fu ture considerations.
The findings of the present experiments confirm a number of previous observations
regarding olfactory perception and human EEG response. They have highlighted
specific EEG activity changes which occur during olfactory stimulation and also
suggest that food ingestion has a significant effect on brain electrophysiology.
The most prominent finding concerned the susceptibility of the theta frequency to food-
related olfactory stimuli. In the second experiment no other waveband but theta
appeared to show a significant effect of odour. In experiment three, other wavebands
showed significant, but not widespread effects of odour. The EEG results together with
the evidence from olfactory psychology reviewed in C h a p te r 2 , suggest that the
odours affecting theta activity produce the observed alteration via greater distractability.
In C h a p te r 2 it was argued that performance deficits observed in tasks completed in
the presence of an unpleasant odour were related to the degree of attention given to the
task. Offensive odours might thus cause significant distraction from the exercise
resulting in poor task performance. The relationship between theta activity and degree
of attention (especially focused attention as witnessed in EEG studies of perceptual and
cognitive processing) suggests a model whereby theta activity is explicitly affected by
the psychometric property of the odour. Thus, in olfactory cognitive experiments,
more errors are made on tasks requiring attention when subjects are exposed to
unpleasant, distracting odours (Rollon, 1983). Increases in attention are evident when
the odours are perceived and rated as quite pleasant (Warm et al, 1991; Baron, 1990).
Given that theta activity increases are associated with increased focused attention, the

results found in the present experiments suggest that it is this Ibeused (or nun-focused
in the case of unpleasant olfactory stimuli) attention which results in the alteration of the
pattern of activity found in theta. However, as discussed earlier, this relationship
between theta activity and olfactory perception is related not only to the type of odours
used but also to the properties of these odours. A hierarchy of influential odours is
proposed whereby some stimuli will generate greater theta activity increases than
others, depending on their distractability.
The effect of odour valence on EEG activity is less obvious. The expected frontal
asymmetries in alpha were not obtained in the second experiment but were present in
the third experiment in which the odours of real food (in this case, the odour of baked
beans was associated with greater frontal left hemisphere EEG alpha activation than left
temporal activation) were employed. Most odour-related asymmetries were obtained in
theta which is consistent with the hypothesis that the theta waveband is the principal
frequency for the transmission of olfactory information. One method of
comprehensively examining the relationship between affect and EEG alpha asymmetry
is by comparing EEG responses to stimuli from different modalities directly within the
same experiment: audition, vision and olfaction, for example. As noted in Chapter 2,
however, such an experiment would require the stimuli to be equated in order to rule
our some "verbal" or "nonverbal" superiority of one over the other which might affect
the outcome of the experiment. Provided that it is possible to equate these types of
stimuli for psychometric properties, a study such as this would elaborate more clearly
the cross-modality nature of affective response if, in fact, such cross-modality
interactions exist.
The ingestion of food was found to alter the course of the spontaneous EEG in erratic
ways. For example, in experiment two, controls showed less alpha activity in the

morning than in ihe afternoon whereas an identical pattern was found in experiment
three hut for the lunch group. As considered above, however, this difference may have
been due to the length of EEG recording chosen for analysis. It is reasonable to argue,
however, that the ingestion of a lunchtime meal in the experiments reported above had
no reliable effect on the spontaneous EEG.
In contrast to spontaneous EEG measures, the ERP appeared particularly sensitive to
recency of food ingestion. A significant increase in P200 amplitude was observed in
those subjects who had eaten when compared with those subjects who had not. The
significance of this increase may be related to the subject’s atlcniional resources whose
distribution the P200 is thought to reflect. The mechanism for the ingestive effect on
P200, however, is not clear. In a previous section, the suggestion was made that it is
not the metabolic changes occurring with ingestion perse which are responsible for the
changes in the ERP but the subject's affective state following ingestion. Thus the
comfort of satiety might enhance the attention of subjects in a task in which simple
attentional resources are required. This is in accordance with Smith's (1992)
conclusion that performance deficits following lunchtime ingestion are seen primarily in
tasks requiring sustained attention and infrequently on shorter exercises. This
increased attention following satiety may also be responsible for the larger P200 found
in fed subjects exposed to the odour of vegetable than in unfed control subjects.
Although studies employing food analogues and an assortment of Ibod-rclated stimuli
(noise of food preparation and cooking a well as food odour) in non-oddball, simple
auditory evoked potential investigations have reported similar increases in the NI-P2 in
satiated subjects during the presentation of these food stimuli, the results reported here
are the first to demonstrate such an effect in subjects consuming normal meals and
exposed to odour only.

Results from the studies of alliesthesia are not particularly supportive of an olfactory
analogue to negative gustatory alliesthesia. No evidence of negative olfactory
alliesthesia was found in any of the studies despite several manipulations in which the
potential for producing alliesthesia was maximised. It is possible that procedural
differences between the studies reported here and those reported elsewhere may have
determined the negative observations recorded. The time-scale between the first rating
session and feeding/fasting and the first rating session and the second rating session is
comparable to the closest experimental design reported elsewhere (Duclaux et at. 1973).
In Duclaux et ais experiment negative alliesthesia for food odours reached a maximum
60 minutes after food consumption and diminished in the following 60 minutes. In
experiments one and two of the present study, subjects rated the odours approximately
30 minutes after consuming/fasting. In experiment 3, subjects rated the odours 5
minutes after consuming lunch in order to establish a more rigorous test of alliesthesia.
The reports of negative olfactory alliesthesia reported in other studies (e.g., Cabanac &
Fantino, 1977) may be explained by the satiating methods used. In the Cabanac
studies, for example, gastric or duodenal injections of glucose or nonuhsorhed sugars
are adminstered directly by the subject. As noted earlier, however, this may not reflect
the genuine experience of eating or of satiety. It is possible that negative alliesthesia
was not observed due to the types of odour used and it is arguable that caution should
be invoked before concluding that the notion of negative olfactory allicsthesia may be
solely an experimental artifact. Although a range of sweet and savoury food odours
along with non-food odours were rated, the findings presented here do not exclude the
possibility that other specific odours might elicit different hedonic responses. It should
be worthy of note, however, that although the pleasantness ratings of these odours
were not affected by the ingestion of lunch, the ability of these odours to evoke feelings
of hunger was. Post-prandially, food odours were less likely to elicit hunger than pre-
prandially. Thus, it is perhaps not the hedonic response that studies of negative

olfactory alliesthesia are investigating but a much more simple but closely related
concept- the ability to induce hunger. This hypothesis is consistent with existing
knowledge regarding post-ingestive physiology (Cabanae & Fantino, 1977). On the
basis of the ratings of the odours employed in the present experiments, however,
olfactory alliesthesia may not be as robust a phenomenon as gustatory alliesthesia.
Taken together, these experiments indicate that olfactory stimuli are able to affect the
pattern of Central Nervous System activity directly and indirectly. The principal
information-processing frequency for olfactory stimuli would appear to be theta, a
waveband known to be affected by tasks requiring focused attention. The principal
ERP component which may be affected by exposure to olfactory stimuli is the P200, a
component known to reflect simple attention. This ERP component also appears to be
a more reliable index of satiety than the P300, a finding which may be explained by the
distribution of attentional resources which this component is thought to reflect. The
finding further indicates that certain precautions regarding subject's nutritional status
need to be considered before individuals participate in ERP studies.
The hypothesis that theta is altered by focused attention and the distractability of odour
requires further investigation. For example, one experiment might involve a
comparison of the EEG activity during performance of a complex, perceptual or
problem-solving task requiring such attention with that during the perception of
particularly complex and distracting odours. The only marginally related study to date
has focused on the comparison between the EEG activity during the imaging of a
favourite food and during the performance of relaxation imagery and mental arithmetic
(Lorig & Schwartz, 1988). A more specific study might assist in elaborating not only
the psychological significance of theta but also the significance of odour in the
modulation of EEG frequencies.

23 1
It may he arguable, of course, that nothing of value is really learned about the
attentional or hedonic mechanism in humans by using these measures that other less
complicated, behavioural measures might not detect. It is important, however, to
distinguish two types of response, similar in fact to the Watsonian dichotomy of
implicit and explicit responses. Data from explicit, behavioural, observable measures
may give an adequate index of the subjective experience of the individual. The aim of
the psychophysiologist, however, is to understand the neural mechanisms underlying
these subjective states and behavioural phenomena. Although a crude measure of
psychophysiological activity, the EEG provides a means of examining subjective slates
in a more objective fashion. The combination of EEG recording and psychological
manipulation may also help explain the more general problem of what EEG traces
mean. Are they reflective of particular emotional, motivational or behavioural states?
Are they merely the plumes of some extinguished sensory fires (as Moncrieff using a
different metaphor has suggested), reflective of an alteration brought about by general
sensory stimulation? Evidence accumulated thus far indicates that the 'generalisation'
hypothesis may not be the correct one. A number of other studies relate specific EEG
changes to specific psychological manipulations. However, the precise psychological
significance of the EEG is unknown. Data presented in the experiments reported here
suggest that one particular waveband may mediate a human organism's altentional
processes, thus suggesting an electrophysiological substrate of a psychological
phenomenon. Such discoveries are the aims of psychophysiology. While
acknowledging the importance of subjective, behavioural data, psychophysiology is
concerned primarily with relating such data to internal physiological states. The EEG
provides a peep-hole for observing those physiological states in the brain.

The EEG may he a workable psychophysiologicul measure of cognition, perception and
the affective processing of visual stimuli, however, but a more direct study of the effect
o f odour valence might be undertaken using MR1. A recent PET study has
demonstrated unilateral significant increases in activity in the right orbitofrontal cortex
in human subjects during olfactory perception (Zatorre cr al. 1992). The authors argue,
on the basis of previous investigations, that this finding adds support to the hypothesis
that strong olfactory connections are present in this area of cortex. Perhaps this
technique might be a more effective method of investigating frontal brain asymmetry
during perception of odours of opposing valence than is the EEG. There is also great
potential for such a method to elaborate the function of structures in the limbic system
such as the amygdala and hypothalamus in the perception of olfactory stimuli (Watson
et al, 1992) as well as more functional olfactory structures in healthy and unhealthy
subjects (Yousem, Turner, Cheng, Snyder & Doty, 1993). A study has yet to he
undertaken comparing the effects of pleasant and unpleasant odours during MRI but an
exploration in clearly justified.
The results from the ERP study are clearly interesting and warrant further investigation.
The hypothesis that odour is perceived along a dimension of distractablity has been
discussed in relation to the effect of olfactory stimuli on the theta frequency. It is also
relevant to the ERP literature since a distracting sensory stimulus may radically affect
the manifestation of particular components. The absence of an effect for P300 in this
experiment suggests that olfactory stimuli behave in different ways than other
disiraelors (such as secondary tasks) perhaps because these other distractors require
more cognitive processing resources than do odours. This would suggest that the P2UU
is affected by stimuli which are not weighted heavily on some cognitive component but
but by those which are sufficiently engaging to alter electrophysiology associated with
cognitive or aitentional engagement. As noted above, interpretation and theoretical

implications in ERP and EEG studies are largely data driven. In the EEG domain, there
are some models available which may be tested methodically and empirically.
Davidson's model of affective processing, for example, was explored in experiments
two and three. However, is is only by discovering new variables capable of
influencing brain behaviour that a better picture of cerebral functioning can be obtained.
There is a caveat in the findings reported here which should be of concern to ERP and
EEG investigators. In light of these findings, it would be advisable to monitor the food
intake of subjects prior to ERP testing in order to ensure that all subjects are of identical
nutritional status. Instructions to such effect could be administered prior to testing. It
is arguable that many of the inconsistencies found in the EEG and ERP literature are the
result of unconsidered variables such as recency of food ingestion. Furthermore, the
use of odour in electrophysiological testing environments should be observed and
controlled very closely so that these stimuli do not affect the recording. In view of the
findings reported here regarding odour distractability and those elsewhere reporting
EEG effects accompanying the presentation of odours of low concentration (Lorig et al,
1990; Lorig et al, 1991), caution in the use of olfactory stimulants is recommended in
the EEG environment.
In conclusion, the findings reported here suggest that olfactory stimuli may affect EEG
activity consistently. The primary channel for the transmission of information
regarding aspects of olfactory perception would appear to be the theta frequency, a
waveband which has been shown to be influenced by the presence of odour. Further
investigation of the ways in which this frequency is affected by other variables will
provided a clearer picture of theta function, if theta in fact has a specific function.
Olfactory stimuli may also affect more gross measures of brain elceirophysiology
thought to reflect simple altentional resources, such as the P200 component of the

auditory oddball task. Furthermore, satiety in combination with olfactory perception
may also significantly affect this component. Unfed, hungry controls exposed to the
odour of food manifest shorter P200 amplitude than fed, satiated subjects. The finding
indicates that the attentional resources of satiated subjects may be greater than those of
hungry subjects. Clearly, this finding is worthy of further investigation.
At the end of C h a p te r 4, Moncrieffs cautious remarks regarding the interpretation of
the EEG were invoked. Moncrieff adopted a sceptical view of the significance of the
EEG, understandably given the relatively unsophisticated EEG equipment and data
analysis which was utilised at the lime. The advancement of EEG technique, method
and investigation has resulted in a greater ability to explore the significance of the EEG
to human behaviour. Its application to studying aspects of human olfactory perception
has been reported elsewhere and is demonstrated in the present experiments. In tandem
with other techniques such as neuropsychological assessment and Magnetic Resonance
Imaging, the EEG may provide an effective, complementary aid to observing the
function and operation of the brain and how it processes odour. As Lorig (1989)
noted, "the nature of human odor response remains fascinating and elusive but the
development of new EEG techniques offers promise for its eventual resolution."

235
-REFERENCES-
REFERENCES ARE LISTED IN ALPHABETICAL ORDER AND FOLLOW BRITISH PSYCHOLOGICAL SOCIETY GUIDELINES ON PRESENTATION OF REFERENCES.
Abraham, A. & Mathai, K.V. (1983). The effect of right temporal lobe lesions on matching of smells. Neuropsvchologia. 21, 277-281.
Adrian, E.D. (1942). Olfactory reactions in the brain of the hedgehog. Journal of Physiology. 100, 459-473.
Adrian, E.D. & Mathews, B.H.C. (1934). The Berger rhythm: Potential changes from the occipital lobes in man. Brain. 4, 57, 355-385.
Adrian, E.D. & Yamagiwa, K. (1935). The origin of the Berger rhythm. Brain. 58, 32.3- 351.
Aggleton, J.P. (1992). The Amygdala: Neurohioloeical aspects of emotion, memory and mental dysfunction. Wiley-Liss, New York.
Aggleton, J.P. & Mishkin, M. (1986). The amygdala: Sensory gateway to the emotions. In R. Plulchik & H. Kellerman (Eds), Emotion: Theory, research and experience. Vol .3. Orlando, Florida: Academic Press, pp. 281-299.
Ahern, G. L. & Schwartz, G. E. (1985). Differential lateralization for positive and negative emotion in the human brain: EEG spectral analysis. Neuropsvchologia. 23, 6, 745-755.
Albone, E. S. (1984). Mammalian semiochemistrv. Chichester, Sussex: John Wiley.
Alford, L.B. (1933). Localization of consciousness and emotion. American Journal of Psychiatry. 12, 789-799.

2 3 6
Allen, W.F. (1941). Eflect of ablating the piriform amygdaloid areas and hippocampi on positive and negative conditioned reflexes and on conditioned olfactory discrimination. American Journal of Physiology. 132, 81-92.
Amoore, J.E. (1952). The stereochemical specificities of human olfactory receptors. Perfumes and Essential Oils Records. 43, 321-3.
Amoore, J.E. (1962a). The stereochemical theory of olfaction 1: Identification of the seven primary odours. Proceedings of the Science Section of The Toiletries Foods Association Special .Supplement. 37. 1-12.
Amoore, J.E. (1962b). The stereochemical theory of olfaction II: Elucidation of the stereochemical properties of the olfactory receptor sites. Proceedings of the Science Section of The Toiletries Foods Association Special Supplement, 37, 13-2.3.
Andersen, P. & Andersson, S.A. (1968). Physiological basis for the alpha rhythm. New York: Appleton Century Crofts.
Anderson, J.A. (1970). Two models for memory organization using interacting traces. Math. Biosci.. 8, 137-160.
Anderson, J.A. (1972). A simple network generating an interactive memory. Math. Biosci.. 13, 197-220.
Andreassi, J.L. (1989). Psychophysiology: Human behaviour and physiological response. (2nd edition). New York: Oxford University Press.
Andy, O.J., Jurko, M.F. & Hughes, J.R. (1975). The amygdala in relation to olfaction. Confin. Neurol.. 37. 215-222.
Annett, M. (1971). A classification of hand preference by association analysis. British Journal of Psychology. 61, 641-52.
Aserinsky, E. & Kleitman, N. (1953). Regularly occurring periods of eye motility and concomitant phenomena during sleep. Science. 118, 273-274.

2 3 7
Badia, P., Wesenstein, N., Lammers, W., Culpepper, J., & Harsh, J. (1989) Responsiveness to olfactory stimuli presented in sleep. Physiology and Behaviour. Vol 48, 87-90.
Bain, A. (1855) The senses and the intellect. London: J.W. Parker & Son.
Baron, R.A. (1980) Olfaction and human social behaviour: effects of pleasant scents on physical aggression. Basic and Applied Social Psychology. Vol 1, 2, 163-172.
Baron, R.A. (1981) Olfaction and human social behaviour: Effects of a pleasant scent on attraction and social perception. Personality and Social Psychology Bulletin. 7, 4, 611-616.
Baron, R.A. (1983). The "sweet smell of success”? The impact of pleasant artificial scents on evaluation of job applicants. Journal of Applied Psychology. 68, 709-713.
Baron, R.A. (1986). Self-presentation in job interviews: When there can be "too much of a good thing". Journal of Applied Social Psychology. 16, 16-28.
Baron, R.A. (1988) Perfume as a tactic of impression management in social and organizational settings. In S. Van Toller and G. Dodd (Eds), Perfumery: the psychology and biology of fragrance. London: Chapman Hall, pp 91-104.
Baron, R.A. (1990) Environmentally induced positive affect: Its impact on self- efficacy, task performance, negotiation and conflict. Journal of Applied Social Psychology. Vol 20, No 5, 368-384.
Basar-Eroglu, C., Basar, E., Demiralp, T. & Schurmann, M. (1992). P300-respon.se : possible psychophysiological correlates in delta and theta frequency channels. A review. International Journal of Psychophysiology. 13, 161-179.
Bassi, M. & Pascucci, F. (1942). Le reazioni vegitative agli stimuli odorosi. Rass Neurol. veg. 3, 68-93.

Bear, D.M. (1983). Hemispheric specialization and the neurology of emotion. Archives of Neurology. 40. 195-202.
Beaumont, J.G., Mayes, A.R. & Rugg, M.D. (1978) Asymmetry in EEG alpha coherence and power: Effects of task and sex. Electroencephalography & Clinical Neurophysiology. 45, 393-401.
Beebe-Center, J.G. (1930) The variability of affective judgements upon odors. Journal of Experimental Psychology. Vol 14,91-93.
Beebe-Center, J. G. (1932). The psychology of pleasantness and unpleasantness. Van Nostrand, New Turk.
Bell, I.R., Miller, C.S. & Schwartz, G.E. (1992) An olfactory-limbic model of multiple chemical sensitivity syndrome: Possible relationships to kindling and affective spectrum disorders. Biological Psychiatry. 32, 218-242.
Bell, I.R., Schwartz, G.E., Peterson, J. & Amend, D. (1992). Self-reported illness from chemical odors in young adults without clinical syndromes or occupational exposures. Paper presented at the Fourteenth Annual meeting of the Association for Chemoreception Sciences, Florida.
Benignus, V.A. & Prah, J.D. (1982) Olfaction: Anatomy, physiology and behaviour. Environmental Health Perspectives. 44, 15-21.
Berfield, K.A., Ray, W.J. & Neweombe. N. (1986). Sex role and spatial ability: an EEG study. Neuropsvchologia. 24. 5. 731-735.
Berg, H.W., Pangborn, R.M., Roessler, E.B., & Webb, A.D. (1963) Influence of hunger on olfactory acuity. Nature (Jan), Vol 197, p 108.
Berger, H. (1929). Uber das elektroenzephalogram des menschen. Arch. Psvchiatr. Nervenkr.. 87, 527-570.
Bergman. K.E. & Bergman, R.L. (1986). Regulation der Nahrungsaufnahme. Menschl Kindcrhcilkd.. 134. 387-92.
2 3 9
Biondi, M., Parise, P., Venturi, P., Riccio, L. , Brunotti, G. & Pancheri, P. (1993). Frontal hemisphere lateralization and depressive personality trails. Perceptual and Motor Skills. 77, 1035-1042.
Birch, L.L., Billman, J. & Richards, S.S. (1984) Time of day inflcnces food acceptability. Appetite. 5. 109-116.
Blake, M.J.F. (1971). Temperament and time of day. In W.P. Colquhoun (ed). Biological itylhms.amJ human PCliormaniY- London: Academic Press, pp 109-148.
Blundell, J.E. & Rogers, P.J. (1991). Hunger, hedonics and the control of satiation and satiety. In M.I. Friedman, M.G. Tardoff & M.C. Kare (Eds), Chemical senses. vol 4, appetite and nutrition. NY: Marcel Dekker.
Booth, D.A., Mather, P. & Fuller, J. (1982). Starch content of ordinary foods associatively conditions human appetite and satiation, indexed hy intake and eating pleasantness of starch-paired flavours. Appetite. .3. 16.3-184.
Box, G.E.P. (1954). Some theorems on quardatic forms applied in the study of analysis of variance problems: II. Effect of inequality of variance and of correlation between errors in the two-way classification. Annals of Mathematical Statistics. 25, 484-498.
Brandi, U., Kobal, G., & Platlig, K-H. (1980). EEG-Correlales of olfactory annoyance in man. In H. van der Stame. (Ed) Olfaction and taste. Vol VII, pp 410- 404. IRL Press.
Brewin, C.R. (1988). Cognitive foundations of clinical psychology. LEA:London.
Broadbenl, D. E. (1971). Decision and stress. Academic Press: London and New York.
Brodal, A. (1981). Neurological anatomy. New York: Oxford.

Broughton, R., Aguirre, M. & Dunham, W. (1988). A comparison of multiple and sleep latency and cerebral evoked potential (P300) measures in the assessment of excessive daytime sleepiness in narcolepsy-cataplexy. Sleep. 11,5.37-545.
Brown, F.M. & Graeber, R.C. (1982). Rhythmic aspects of human behaviour. LEA: Hillsdale.
Brown, F.M. (1982). Rhythmicity as an emerging variable for psychology. In F.M. Brown and R.C. Graeber (Eds), Rhythmic aspects of human behaviour. LEA: Hillsdale.
Brown, W.S., Marsh, J.T. & LaRue, A. (1982). Event-realled potentials inpsychiatry: Differentiating depression and dementia in the elderly. Bulletin of the Los Angeles Neurological Society. 47, 91-107.
Browman, C.P. (1979). Diurnal variation of the human auditory evoked potential. Physiological Psychology. 7, 3, 287-290.
Bryden, M.P. & Lee, R.G. (1983). Right hemisphere involvement in imagery and affect. In Perceman (ed), Cognitive processing in the right hemisphere. Academic Press.
Buck, L. & Axel, R. (1991). A novel multigene family may encode odorant receptors: a molecular basis for odor recognition. Cell. Vol 65, 175-187.
Burgess, A. & Gruzelier, J. (199.3). Individual reliability of amplitude distribution in topographical mapping of EEG. Electroencephalography & Clinical Neurophysiology.86, 219-223.
Bushteva, K.A., Polezhaev, E.F., and Semenenko, A.D. (1960) The influence of subliminal olfactory stimulations on reflex activity. Fiziol. zh. SSSR. Vol 46, 4, 452- 457.
Butler, S.R. & Glass, A. (1974). Asymmetries in the electroencephalograph associated with cerebral dominance. Electroencephalography and Clinical Neurophysiology. 36, 481 - 491.

Cabanac, M. (1971). Physiological role of pleasure. Science (Sept), Vol 17.3, 1103- 1107.
Cahanac, M. (1979). Sensory pleasure. The Quarterly Review of Biology. 54, 1, 1- 29.
Cabanac, M. & Fantino, M. (1977). Origin of olfactory-gustatory alliesthesia: Intestinal sensitivity to carbohydrate concentration? Physiology & Behaviour. 18, 1039-1045.
Cain, W.S. & gent, J.E. (1991). Olfactory sensitivity: reliability, generality and association with ageing. Journal of Experimental Psychology: Human Perception and Performance, 17.382-391.
Cain, W.S., Leaderer, B.P., Isseroff, R., Berglund, G., Huey, R.J., Lipsitt, E.D., & Perlman, D. (1983). Ventilation requirements in buildings 1. Control of occupancy odor and tobacco smoke odor. Atmospheric Environment. 17. 6. 1183-1197.
Caniggia, A. & Brogi, G. (1947). Sulle modifica/.ioni da stimoli sensoriali nell'uomo I. Varia/.ioni glicemiehe da stimoli luminosi, sonori, ollattivi, gustativi. Rass, Studi. psichiat., 36, 592.
Cann, A. & Ross D. A. (1989) Olfactory stimuli as context eues in human memory. American Journal of Psychology. Vol 102, 1.91-102.
Carrasco, M. & Ridoul, J.B. (1993). Olfactory perception and olfactory imagery: A multidimensional analysis. Journal of Experimental Psychology; Coenilion, Perception & Performance. 19, 2, 287-301.
Carroll, B., Richardson, J.T.E., & Thompson, P. (1993). Olfactory information processing and temporal lobe epilepsy. Brain & Cognition. 22, 230-243.
Cederof, R. (1964). Studies of annoyance connected with offensive smell from a sulphate cellulose factory. Nordisk Hvgienisk Tidskrift. Vol 45, .39-48.

Chapko, M.K. & Solomon, H. (1976). Air pollution anti recreational behaviour. Journal of Social Psychology. 1(H), 149-150.
Chitanondh, H. (1966). Stereotaxic amygdalotomy in the treatment of olfactory seizures and psychiatric disorders with olfactory hallucinations. Confin. Neurol.. 27, 181-196.
Christie, M.J. & MeBrearty, E.M. (1979). Psyehophysiologieal investigations of post-lunch state in male and female subjects. Ergonomics. 22, 307-323.
Ciganek, L. (1961). Theta discharges in the middle line-EEG symptom of temporal lobe epilepsy. Electroencephalography and Clinical Neurophysiolottv. 13, 669-673.
Clark, E.C. (1958). Anosmic gustation. New England Journal of Medicine. 278, 303.
Clark, E.C. & Dodge. H.W. (1955a). Extraolfactory components of flavor. Journal of the American Medical Association. 159, 18, 1721-1723.
Clark, E.C. & Dodge, H.W. (1955b). Effect of anosmia on the appreciation of food flavour. Neurology. Vol 5. 671-4.
Coburn, K. L. & Marco, A. M. (1988). Facts and artifacts in brain electrical activity mapping. Brain Topography. Vol 1, No 1, .37-45.
Cohen, H.D., Rosen, R.C., & Goldstein, 1. (1976). Eleetroenccphalographiclaterality changes during human sexual orgasm. Archives of Behaviour. Vol 5, No 3, 189-199.
Colquhoun, W.P. (1971). Circadian variations in menial efficiency. In W.P Colguhoun (Ed), Biological rhythms and human performance. London:Academic- Press, pp 39-107.
Connolly, K.J., Pharoah, P.O.D., & Hetzel, B.S. (1979). Fetal iodine deficiency and motor performance during childhood. The Lancet, ii. 1149-1151.

Cooper, R., Winter, A.L., Crow, J.J. & Walter, W.G. (1965). Comparison of subcortical, cortical and scalp activity using indwelling electrodes in man. Electroencephalography and Clinical Neurophysiology. 18,217-228.
Corbin, A. (1986). The fold and the fragrant: odor and the french social imagination. Cambridge, MA: Harvard University Press.
Cornell, C.E., Rodin, J. & Weingarten, H. (1989). Stimulus-induced eating when satiated. Physiology and Behaviour. 45, 695-704.
Courchesne, E., Courehesne, R.Y & Hillyard, S.A. (1978). The effect of stimulus deviation on P3 waves to easily recognised stimuli. Ncuropsvchologia. 16, 189-199.
Craig, A. (1986) Acute effects of meals on perceptual and cognitive efficiency. Nutrition Reviews. May, 16.3-171.
Craig, A., Baer, K. & Diekmann, A. (1981) The effects of lunch on sensory-perceptual functioning in man. International Archives of Environmental Health. 49, 105-1 14.
Cram, G. & Parkinson, I. (1992). Odour and toxicity problems in landfill gas. Environmental Health. March, 67-69.
Critelli, J.W. & Neumann, K.F. (1984). The placebo. American Psychologist. 39, 1,32- 39.
Dalbokova, D. & Kolev, P (1989). Diurnal variations of the event-related potential (ERP) in auditory vigilance task. Paper presented at the Ninth International Conference on Event- Related potentials of the Brain (EPIC IX), Amsterdam.
Daniel, R.S. (1967). Alpha and theta EEG in vigilance. Perceptual and Motor Skills. 25. 697-703.
Davidson, R.J. (1983). Hemispheric specialization for cognition and affect. In A. gale & J.A. Edwards (eds), Physiological correlates of human behaviour. London: Academic- Press Ltd.

Davidson, R.J. (1984). Affect, cognition , and hemispheric specialization. In C.E. Izard, J. Kagan & R. Zajonc (Eds). Emotion, cognition and behaviour. New York:Cambridge University Press.
Davidson, R.J. (1988). EEG measures of cerebral asymmetry: Conceptual and methodological isues. International Journal of Neuroscience. 39, 71 -89.
Davidson, R.J. (1992). Anterior cerebral asymmetry and the nature of emotion. Brain and Cognition, 20, 125-151.
Davidson, R.J., Chapman, J.P., Chapman, L.J. & Henriques, J.B. (1990) Asymmetrical brain electrical activity discriminates between psychometrically-matched verbal and spatial cognitive tasks. Psychophysiology. 27, 5, 528-543.
Davidson, R.J. & Ehrlichman, H. (1980). Laterali/.ed cognitive processes and the electroencephalogram. Science. 207. 1005-1006.
Davidson, R.J., Ekman, P., Saron, C.D., Senulis, J.A.. & Friesen, W.V. (1990). Approach-withdrawal and cerebral asymmetry: Emotional expression and brain physiology I, Journal of Personality and Social Psychology, 58, 2, 330-341.
Davidson, R.J. & Schwartz, G.E. (1977) Brain mechanisms subserving self-generated imagery: Electrophysiologieal specificity and patterning. Psychophysiology. 14, 6, 598- 602.
Davidson, R.J., Schwartz, G.E., Saron, C., Bennett, J & Goleman, D.J. (1979). Frontal versus parietal EEG asymmetry during positive and negative affect. Psychophysiology. 16, 2, 202-3.
Davidson, R.J. & Tomarken, A.J. (1989). Laterality and emotion: An electrophysiological approach. In F. Boiler & J. Grafman (Eds), Handbook of neuropsvcholouv. Vol .3, 419- 441. Elsevier Science Publishers B.V.
Davies, D.R. & Parasuraman, R. (1982). The psychology of vigilance. Academic Press: London and New York.

Davies, J.T. (1971). Olfactory theories. In L.M. Beidler (Ed) The handbook of sensory physiology. Vol IV: Olfaction. Springer-Verlag: Berlin, NY.
Davis, J.L. & Eichenbaum, H. (1992). Olfaction-a model system for computational neuroscience. MIT Press: Cambridge.
Davis, R.G. (1981). The role of nonolfactory context cues in olfactory identification. Perception & Psychophysics. 30, 83-89.
Dejoy, D.M. (1984). The nonauditory effects of noise: review and perspectives for research. Journal of Auditory Research. 24. 123-150.
Desor, J.A. & Beauchamp, G.K. (1974). The human capacity to transmit olfactory information. Perception and Psychophysics. Vol 16,3,551-556.
Dolce, G. & Waldeier, H. (1974). Spectral and multivariate analysis of EEG changes during mental activity in man. Electroencephalography and Clinical Neurophysiology. 36. 577-584.
Donchin, E. & Coles, M.G.H. (1988). Is the P300 component a manifestation of context updating? Behavioural and Brain Sciences. 11,357-374.
Donchin, E., Ritter, W., & McCallum, W.C. (1978). Cognitive psychophysiology: the endogenous components of the ERP. In E. Callaway, P. Tueiing and S. Koslow (Eds), Event -related potentials in man. New York: Academic Press.
Dongier, M., McCallum, W.C., Torres, F. & Vogel, W. (1976). Psychological and psychophysiological states. In A. Remond (ed). Handbook of electroencephalography and clinical neurophysiology, vol 6A. Amsderdam: Elsevier, pp. 195-256.
Doty, R.L. (1975a). Intranasal trigeminal detection of chemical vapors by humans. Physiology and Behaviour. 14, 855-859.
Doty, R.L. (1975b). An examination of relationships between the pleasantness, intensity and concentration of 10 odorous stimuli. Perception & Psychophysics. 17, 5, 492-496.

246
Doly, R.L. (1991). Psychophysical measurement of odor perception in humans. In D.G. Laing, R.L. Doty, & W. Breipohl (Eds), The human sense of smell. Berlin: Speinger-verlag, 95-134.
Doty, R.L., Brugger, W.E., Jurs, P.C., Orndoff, M.A., Synder, R.J., & Lowry, L.O. (1978). Intranasal trigeminal stimulation from odorous volatiles: Psychometric responses from anosmic and normal humans. Physiology and Behaviour. 81, 4.31- 439.
Doyle, J.C., Ornstein, R. & Galin, D. (1974). Lateral specialization of the cognitive mode II: EEG frequency analysis. Psychophysiology. 1 1, 567-578.
Dravnieks, A., Masurat, T. & Lamm, R.A. (1984). Hedonics of odors and odor descriptors. Journal of Air Pollution Control Association. 34, 7, 752-755.
Drenowski, A., Grinker, J.A. & Hirsch, J. (1982). Obesity and flavor perception: Multidimensional scaling of soft drinks. Appetite. 3, 361-368.
Ducleaux, R. , Fesithauer, J. & Cahanac, M. (197.3). Effets du repas sur 1'agrement d'odeurs alimentaires et nonalimentaires chez. l'homme. Physiology and Behaviour. Vol 10. 1029-1033.
Duffy, F.H. (1986). Brain Electrical Activity Mapping: Issues and answers. In F.H. Duffy (Ed) Topographic mapping of brain electrical activity. Bulterworlhs. 401-417.
Duffy, F.H. (1988). Issues facing the clinical use of Brain Electrical Activity Mapping. In G. Pfurtscheller & F.H. Lopes da Silva (eds). Functional brain imaging. Hand Nuber.
Duffy, F. H., Burchfiel, J. L., & Lombroso, C. T. (1979) Brain electrical activity mapping (BEAM): A method for extending the clinical utility of EEG and evoked potential data. Annals of Neurology. 5, 309-321.

DulTy, F. H., McAnully, G. B., & Schachter, S. C. (1984). Brain Electrical Activity Mapping. In N. Geschwind and A.M. Galihurda (Ed) Cerebral dominance: The biological foundation. Harvard U.P. 53-73.
Dumas, R. & Morgan, A. (1975). EEG asymmetry as a function of occupation, task, and task difficulty. Neuropsvchologia. 13, 219-228.
Dunn, J.T. (1992). Iodine deficiency-the next target for elimination? Journal of the American Dietetic Association. 76, 142-147.
Ehrliehman, H. (1986). Hemispheric asymmetry and positive-negative affect. In D. Ottoson (ed). Duality and unity of the brain: unified l'unctionint! and specialization of the hemispheres. London: Macmillan, pp. 19-46.
Ehrlichman, H. & Bastone, L. (1991). Odor experience as an affective stale: effects of odor pleasantness on cognition. Perfumer and Flavorist. Vol 16, 11-12.
Ehrlichman, H. & Bastone, L. (1992). Olfaction and emotion. In. M.J. Serby & K.L. Chobor (Eds), Science of olfaction. NY: Springer-Verlag.
Ehrlichman, H. & Halpern, J. N. (1988). Affect and memory: Effects of pleasant and unpleasant odours on retrieval of happy and unhappy memories. Journal of Personality and Social Psychology. Vol 55, No 5, 769-779.
Ehrlichman, H. & Wiener, M.S. (1979). EEG asymmetry during covert mental activity. Psychophysiology. 17, 1, 228-235.
Eich, J. E. (1978). Fragrances as cues for remembering words. Journal of Verbal Learning and Verbal Behaviour. 17, 103-111.
Eiehenbutim. H., Shedlack, K.J. & Eckmann, K.W. (1980). Thalamocortical mechanisms in odor-guided behaviour I: Effects of lesions of the mediodorsal thalamic nucleus and frontal cortex on olfactory discrimination in the rat. Brain. Behaviour & Evolution. 17, 155-175.

Ekman, P. (1982). Emotion in the human face. (2nd edition). Cambridge: Cambridge University Press.
Ekman, P., Davidson. R.J. & Friesen, W.V. (1990). The Dttchenne smile: Emotional expression and brain physiology II. Journal of Personality and Social Psychology. 58, 2, 342-353.
Elbert, T., Lutzenberger, W., Rockstroh, B. & Birbaumer, N. (1985). removel of ocular artifacts from the EEG- A biophysical approach to the EOG. Elcctrocnccphalouraphv and Clinical Neurophysiology. 60, 455-463.
Elliott, J.R. (1962) Adapting a fragrance theme to a "Line". American Perfumer and Cosmetics. 77, pt 10, 14-16.
Engen, T. (1965). The effect of expectation on judgement of odor. Acta Psychologica.36, 450-458.
Engen, T. (1982). The perception of odors. New York: Academic Press.
Engen, T. (1983). The human uses of olfaction. American Journal of Olalarvngology,4, 250-251.
Engen, T. (1987). Remembering odors and their names. American Scientist. 497-503.
Engen, T. & Ross, B.M. (1973). Long-term memory for odors with and without verbal description. Journal of Experimental Psychology. 100,221-7.
Eskenazi, B., Cain, W.S., Novelly, R.A. & Mattson, R. (1986). Odor perception in temporal lobe epliepsy patients with and without temporal lobectomy. Ncuropsvchologia. 24, 553-562.
Eslinger, P.J., Damasio, A.R., & van Hoesen, G.W. (1982). Olfactory dysfunction in man: Anatomical and behavioural aspects. Brain and Cognition. 1, 159-285.
248
Etevenon, P., Samson-Dollfus, D., kemali, D. & Perris, C. (1982). In quest of the best spectral EEG parameters. Advances in Biological Psychiatry. 9, 28-38.

2 4 9
Fallon, A.E. & Ro/.in, P. (1983). The psychological bases of food rejections hy humans. Ecology of Food and Nutrition. Vol 13, 13-26.
Fernstrom, J.D. & Wurtman, R.J. (1971). Brain serotonin content: increase following ingestion of carbohydrate diet. .Science. 174, 1023-1025.
Fernstrom, J.D. & Wurtman, R.J. (1972). Brain serotonin content: physiological regulation hy plasma neutral amino acids. Science. 178, 414-416.
Fiore, A.M. (1992). Effect of composition of olfactory cues on impressions of personality. Social Behaviour and Personality, 20, 3, 149-162.
Flesh, R. D., Burns, J. C., and Turk, A. (1974) An evaluation of community problems caused by industrial odors. In A. Turk, Johnston and Moulton (Eds), Human response to environmental odors. Academic Press.
Flor-Henry, P. (1983). Hemisyndrome of temporal lobe epilepsy: review of evidence relating psychopathological manifestations in epilepsy to right- and left- sided epilepsy. In M.S. Myslohodsky (ed), Hcmisvndromcs: Psychobiology, neurology, psychiatry. Academic Press: New York.
Folkard, S. (1982). Circadian rhythms and human memory. In F.M. Brown and R.C. Graeher (Eds). Rhythmic aspects of human behaviour. LEA: Hillsdale.
Fredricks, C. (1976). Psvchonutrition. New York: Grosset & Dunlap.
Freeman, W.J. (1983). The physiological basis of mental images. Biological Psychiatry. 18. 10, 1107-1125.
Freeman, W. J. (1991). The physiology of perception. Scientific American, Feh 91. p.34-41.
Freeman, W.J. & Schneider, W. (1982). Changes in spatial patterns of rabhit olfactory EEG with conditioning to odors. Psychophysiology. 19, I, 44-56.

Furchtgotl, E. & Friedman, M.P. (I960). The effects of hunger on taste and odour RLs. Journal of Comparative Physiological Psychology. 55, 418-424.
Fürst, C.J. (1976). EEG alpha asymmetry and visuospatial performance. Nature. Vol 260, 254-5.
Gale, A., Christie, B. & Penfold, V. (1971). Stimulus complexity and the occipital EEG. British Journal of Psychology. 62. 527-531.
Gale, A., Coles, M. & Boyd, E. (1971). Variations in visual input and the occipital EEG: II. Psvchonomic Science. 23, 99-100.
Gale, A. & Edwards, J. (1983). The EEG and human behaviour. In A. Gale & J.A. Edwards (eds). Physiological correlates of human behaviour. Academic Press Ltd.
Galin, D. & Ornstein, R. (1972). Lateral specialization of cognitive mode: An EEG study. Psychophysiology. 9, 412-418.
Gasser, T., Bacher, P. & Steinberg, H. (1985). Test-reiesi reliability of spectral parametersof the EEG. Electroencephalography and Clinical Neurophysiology. 60. 312-319.
Gastaul, H. (1974). Vom Berger-rhythmus zum alpha-kull und zur alpha-kultur. EEO-MEG. 5, 189-199.
Geisler, M.W. & Pölich, J. (1990). P300 and time-of-day: Circadian rhythms, food intake and body temperature. Biological Psychology. 31.117-136.
Geisler, M.W. & Pölich, J. (1992a). P300, food consumption and memoryperformance. Psychophysiology. 29, 1, 76-85.
Geisler, M.W. & Pölich, J. (1992b). P300 and individual differences:Moming/evening activity preference, food and lime-of-day. Psychphysiologv. 29, 1, 86-94.

Geisser, S. & Greenhouse, S.W. (1958). An extension of Box's results on the use of the F distribution in multivariate statistics. Annals of Mathematical Statistics. 29, 885-891.
Getchell, T.V., Bartochuk, L.M., Doty, R.L. & Snow, J.B. (Eds), Smell and taste in health and disease. Raven Press: NY.
Gevins, A.S., Zeillin, G.M., Doyle, J.C., Yingling, C.D., Schaffer, R.E., Callaway,E. & Yeager, C.L. (1979). EEG correlates of higher function. Science. 203, 665-668.
Gevins, A.S., Doyle, J.C., Schaffer, R.E., Callaway, E. & Yeager, C. (1980). Lateralized cognitive processes and the EEG. Science. 207, 1005-1007.
Gianotti, G. (1972). Emotional behaviour and hemispheric side of lesion. Cortex. 8, 41-55.
Gibbons, B. (1986). The intimate sense of smell. National Geographic. 170, 3, 324- 361.
Ginsberg, R.S., Feldman, M. & Nechles, H. (1948). Effect of odors on appetite. Gastroenterology. 10, 281-285.
Girgis, M. (1969). The amygdala and the sense of smell. Acta Anatomica. 72, 502- 519.
Goet/.l, F.R., Abel, M.S.. & Ahokas, A.J. (1950). Occurence in normal individuals of diurnal variations in olfactory acuity. Journal of Applied Physiology. Vol 2, 553- 563.
Goet/.l, F. R., Goldschmidt, M.. Wheeler, P. & Stone, F. (1949). Influence of sugar upon olfactory acuity and upon the sensation complex of appetite and satiety, Gastroenterology. Vol 12, No 2, 252-257.
Goetzl, F. R. & Stone, F. (1947). Diurnal variations in in acuity of olfaction and food intake. Gastroenterology. 9. 444-453.

Goetzl, F. R. & Stone, F. (1948). The influence of amphetamine sulfate upon olfactory acuity and appetite. Gastroenterology. Vol 10. 4, 708-713.
Goldman, W.P. & Seamon, J.G. (1992). Very long-term memory for odors: Retention of odor-name associations. American Journal of Psychology. 105, 4, 549- 563.
Goldsmith, J.R. (1969). Nondisease effects of air pollution. Environmental Research 2, 93-101.
Goldstein, K. (1939). The organism. New York: Academic Press.
Gray, J.I. & Pearson, A.M. (1987). Rancidity and warmed-over flavor. In A.M. Pearson & T.R. Dulson (Eds.). Advances in meat research Vol 3. Restructured meat and poultry produels. Van Nostrand, New York.
Green, A. (1988). Fragrance education and the psychology of smell. In S. Van Toller & G. Dodd (Eds), Perfumery: The psychology and biology of fraeiance. Chapman & Hall: London.
Grantham-McGregor, S., Schofield, W. & Powell, C. (1987). Development of severely malnourished children who received psychosocial stimulation: six-year followup. Paediatrics, 79, 247-254.
Guild, A.A. (1956). Olfactory acuity in normal and obese human subjects: diurnal variations and the effect of d-amphclamine sulphate. Journal of Laryneolottv. Vol 70, 408-414.
Gundel, A. & Hilbig, A. (1983). Circadian acrophases of powers and frequencies in the waking EEG. International Journal of Neuroscience. 22, 125-134.
Haberly, L.B. (1985). Neuronal circuitry in olfactory cortex: Anatomy and functional implications. Chemical Senses. 10,2,219-238.

Halgren, E., Babb., T.L., Rausch, R. & Crandall, P.H. (1977). Neurons in the human basolateral amygdala and hippocampal formation do not respond to odours. Neuroscience Letters, 4, 331 -335.
Hammer, F.J. (1951). The relation of odour, taste and flicker-fusion thresholds to food intake. Journal of Comparative and Physiological Psychology. Vol 44, 403- 411.
Hansen, J.C. & Hillyard, S.A. (1983). Endogenous brain potentials associated with selective auditory attention. Electroencephalography and Clinical Neurophysiology.49, 277-290.
Harman, D.W. & Ray, W.J. (1977). Hemispheric activity during affective verbal stimuli: An EEG study. Neuropsvchologia. 15, 157-460.
Hartman, E. & Elion, R. (1977). The insomnia of sleeping in a strange place. Psvchopharmaeologv. 53. 131-1.33.
Hartman, E., Lindsley, J.G. & Spinweber, C.L. (1983). Chronic insomnia: effects of tryptophan, flura/.epam, secobarbital and placebo. Psvchopharmacolottv. 80, 138-142.
Hartman, E. & Spinweber, C.L. (1979). Sleep induced by L-tryptophan: effect of dosages within the normal dietary intake. Journal of Nervous and Mental Diseases. 167, 497-499.
Harrington, A. & Rossario, V. (1992). Olfaction and the primitive: Nineteenth century medical thinking on olfaction. In. M.J. Serby & K.L. Chobor (Eds), Science of olfaction. Springer-Verlag:NY.
Henion, K.E. (1971). Odor pleasantness and intensity: A single dimension. Journal of Experimental Psychology. 90. 275-279.
Heninger, G.R., McDonald. R.K., Goff. W.R. & Sollberger, A. (1969). Diurnal variations in the cerebral evoked response and EEG: Relations to 17- hydroxicorticosteroid levels. Archives of Ncuroloav. 21,330-337.

Henning, H. (1916). Der Geruch. Leipzig: J A Barth.
Henriques, J.B. & Davidson, R.J. (1991). Left frontal hypoaelivalion in depression. Journal of Abnormal Psychology. HX), 535-545.
Hertz, R.S. & Cupchik, G.C. (1992). An experimental characterization of odor- evoked memories in humans. Chemical Senses. 17, 5, 519-528.
Hildebrandt, G., Rohmen, W. & Rutenfranz, J. (1974). Twelve and twenty-four hour rhythms in error frequency of locomotive drivers and the influence of tiredness. International Journal of Chronohioloev. 2, 175-180.
Hillyard, S.A. (1984). Event-related potentials and selective attention. In E. Donchin (ed). Cognitive psychophysiology; ERPs and the study of coanition. Vol I. LEA:Hillsdale.
Hillyard, S.A. & Picton, T.W. (1979). Event related brain potentials and selective information processing in man. IN J.E. Desmedt (ed). Progress in clinical neurophysiology, vol 6. Karger: Basel, pp. 1-50.
Hines, D.E. (1977-8). Olfaction and the right cerebral hemisphere. Journal of Altered States of Consciousness. .3.1.47-59.
Hoagland, H., Cameron, D.E. & Rubin, M.A. (1938). Emotion in man as tested by the delta index of the electroencephalogram: I. Journal of General Psychology. 19,227-245.
Horel, J.A., Keating, E.G. & Misanslone, L.J. (1975). Partial Kluver-Bucy syndrome produced by destroying temporal neocortex or amygdala. Brain Research. 94, 347-359.
Horel, J.A. & Misanslone, L.J. (1974). The Jluver-Bucy syndrome produced by partial isolationof the temporal lobe. Experimental Neurolocv. 42. 101-112.
Howard, L. & Pölich, J. (1985). P3(H) and memory span development. Developmental Psychology. 21, 28.3-289.

Howes, D. (1987). Olfaction and transition: an essay on the ritual uses of smell. Canadian Review of Sociolouv and Anlhropolot-v. 24. 3. 398-416.
Howes, D. (1988). On the odor of the soul: Spatial representation and olfactory classification in Eastern Indonesia and Western Melanesia. Biideratien Tot Dc Taal Land En Volken Kunde. 144, 84-113.
Huebener, J.J. Lyman, B.J. & Hertel, P.T. (1992) A laboratory test of the Proustian phenomenon: Memory for odours with emotional and neutral associations. Paper presented at the 14th Annual Meeting of the Association of Chemoreceplion Sciences, Florida.
Hughes, J.R. & Andy, O.J. (1979a). The human amygdala 1: Eleeirophysiological responses to odorants. Electroencephalography and Clinical Neurophysiology. 46, 428- 443.
Hughes, J.R. & Andy, O.J. (1979b). The human amygdala 11: Neurophysiological correlates of olfactory perception before and after amygdalcctomy. Elccirocnccphaloizraphv and Clinical Neurophysiology. 46. 444-451.
Hughes. J.R., Henrix, D.E., Andy, O.S., Wang. G., Peller, D. & Wetzel, N. (1972). Correlations between electrophysiological and subjective responses to odorants as recorded from the olfactory bulb, tract and amygdala of waking man. In G.G. Somjen (ed). Neurophysiology studied in man. Exeerpta Mediea: Amsderdam.
Hughlings-Jackson, J.H. & Stewart, P. (1899). Epileptic attacks with a warning of a crude sensation of smell and with the intellectual aura (dreamy stale) in a patient who had symptoms pointing to gross organic disease of the right temporo-sphenoidal lobe. Brain. 22, 534-549.
Huynh, H. & Feldt, L.S. (1970). Conditions under which mean square ratios repeated measurements designs have exact F distributions. Journal of the American Statistical Association. 65 (332), 1582-1589.
Hyman, A., Mentzer, T. & Calderone, L. (1979). The contribution of olfaction to taste discrimination. Bulletin of the Psvchonomic Society. 13,6,359-362.

2 5 6
International Federation Of Societies for EEG and Clinical Neurophysiology (1974). A glossary of terms used by clinical electroencephalographers. Electroencephalography and Clinical Neurophysiology. 37, 538-548.
Isaacson, R.L. (1974). The limhie system (2nd edition). New York: Plenum.
Ishihara, T. & Yoshii, N. (1972). Multivariate analytic study of EEG and mental activity in juvenile delinquents. Electroenccpahlotiranhv and Clinical Ncurophvsiolnuv. 33, 71-80.
Ishihara, T. & Yoshii, N. (1973). Theta rhythm in the mid-frontal region during mental work. Electroencephalography and Clinical Neurophysiolouv. 35. 701.
Israel, J.B., Chesney, G.L., Wickens, C.D., & Donchin, E. (1980). P300 and tracking difficulty: Evidence for multiple resources in dual-tasl performance. Psychophysiology. 17, 259-273.
Izard, C.E. (1977). Human emotions. New York: Plenum.
James, W. (1892). Briefer course psychology. Macmillan & Co.
Janowitz, H. D. & Grossman. M.I. (1949). Gusto-olfactory thresholds in relation to appetite and hunger sensations. Journal of Applied Physiolouv. Vol 2, 217-22.
Janzen, D.H. (1977). Why fruits rot. seeds mold and meal spoils. The American Naturalist. I l l , 980, 691-713.
Jellinek, G. (1985). Sensory evaluation of food: theory and practice. Ellis Howard, Chichester.
Johnson, J. & Vickers, Z. (1992). Factors influencing scnsory-spccillc satiety. Appetite. 19, 15-31.
Johnson, L.C. (1980). Measurement, quantification and analysis of cortical activity: recordings and analysis of brain activity. In 1. Marlin and P.H. Venables (eds). Techniques in psychophysiology. Chichester: Wiley.

2 5 7
Johnson, R. Jr. (1986). A trarchic model of P300 amplitude. Psychophysiology. 23, 367-384.
Johnson, R. Jr. (1993). On the neural generators of the P.300 component of the event- related potential. Psychophysiology. 30,90-97.
Jones. D. & Broadhent, D. (1991). Human performance and noise. In C. Harris (Ed), Handbook of acoustical measurements and noise control. 3rd. ed. McGraw Hill, NY. 18.1-18.19.
Jones, J.W. (1978). Adverse emotional reactions of nonsmokers to secondary cigarette smoke. Environmental Psychology and Nonverbal Behaviour, 125-7.
Jones, J.W. & Bogal, G.A. (1978). Air pollution and human aggression. Psychological Reports. 4.3, 721-722.
Jones, N.A. & Fox, N.A. (1992). Electroencephalogram asymmetry during emotionally evocative films and its reallion to positive and negative alTectivily. Brain & Cognition. 20. 280-299.
Jones-Gotman, M. & Zatorre, R.J. (1988a). Contribution of the right temporal lobe to odor memory. Epilepsia. 29, 5, p 661.
Jones-Gotman, M. & Zatorre, R.J. (1988b). Olfactory identification deficits in patients with focal cerebral excisions. Ncuropsychologia. 7, I 11-120.
Jones-Gotman, M. & Zatorre, R.J. (199.3). Odor recognition memory in humans: Role of the right temporal and orbilofronlal regions. Brain and Cognition. 22, 182-198.
Joyce. J. (1916). Portrait of the artist as a young man.
Kahn, E.M., Weiner, R.D., Brenner, R.P. & Coppola, R. (1988) Topographic maps of brain electrical activity-pitfalls and precautions. Biological Psychiatry. 2.3, 628-636.

Kanumura, S., Okazaki, Y., Sakurai, H., Okahe, H., Fukada. H. & Toni, S. (1990). The realtion between brain waves and emotion during presentation of various odors. Chemical Senses. August, 373-374.
Kandel, E.R. & Schwartz, J.H. (1985). Principles of neural science. (2nd edition). New York: Elsevier.
Kelley, A.E. & Stinus, L. (1984). Neuroanatomical and neurochemical substrates of affective behaviour. In N.A. Fox & R.J. Davidson (eds). The psychobiology of affective development. New Jersey: LEA.
Kendal-Reed, M. & van Toller, S. (1992). Brain electrical activity mapping: an exploratory study of infant response to odours. Chemical Senses. 17, 6, 765-777.
Kerkhof, G.A. (1980). Interindividual differences in the diurnal variation of the human auditory evoked potential. Physiological Psychology. 8. I, 141-143.
Kerkhof, G.A. (1982). Event-related potentials and auditory signal detection: Their diurnal variation for morning-type and evening-type subjects. Psychophysiology, 19, 1, 94-103.
Kerkhof, G.A., Korving, H.J., Willsemse-v.d. Geest, H.M.M. & Rietveld, W.J. (1980). Diurnal differences between moming-type and evening-type subjects in self- rated alertness, body temperature and the visual and auditory evoked potential. Neuroscience Letters. 16, 11-15.
Kidd, A.H. (197.3). relation of examination scores to tobacco smoking. Perceptual and Motor Skills. .36. 946.
King, J.R. (1988). Anxiety reduction using fragrances. In S. Van Toller and G. Dodd (Eds), Perfumery: The psychology and hioloitv of fragrance. London: Chapman Hall, pp 147-165.
Klemm, W .R., Lutes. S.D., Hendrix. D.V.. & Warrenherg. S. (1992).Topographical EEG maps of human responses to odors. Chemical Senses. 17, .347- 361.

2 5 9
Knasko, S.C. (1992). Ambient odor's effects on creativity, mood and perceived health. Chemical Senses. 17, 1,27-35.
Knasko, S.C. & Gilbert, A.N. (1990). Emotional state, physical well-being and performance in the presence of feigned ambient odor. Journal of Applied Social Psychology. 20, 16, 1345-1357.
Knott, J.R. (1976). The theta rhythm. In A. Remond (ed). Handbook of electroencephalography and clinical neuronhvsioloev. Vol 6A. pp 69-77. Amsterdam: Elsevier.
Kobal, G. & Hummel, T. (1991). Olfactory evoked potentials in humans. In T.V. Getchell, L.M. Bartochuk, R.L. Doty & J.B. Snow (Eds), Smell and taste in health and disease. Raven Press: NY.
Kobal, G., Hummel, T. & Van Toller, S. (1992). Differences in human chemosensory evoked potentials to olfactory and somatosensory chemical stimuli presented to left and right nostrils. Chemical Senses. 17. 3, 233-244.
Koelega, H.S. (1970). Extraversion, sex, arousal and olfactory sensitivity. Acta Psvcholoi’ica. 34, 51-56.
Koelega, H.S. (1994). Sex differences in olfactory sensitivity and the problem of the generality of smell acuity. Perceptual and Motor Skills. 78, 203-213.
Koelega, H.S. & Koster, E.P. (1974). Some experiments on sex differences in odor perception. Annals of the New York Academy of Sciences. 237, 234-246.
Laird, D.A. (1935). What can you do with your nose? Scientific Monthly. 41, 126-130.
Lake. M. (1987). Scents and sensuality: the essence of excitement. London: Murray.

Lambert, K., Neal, T., Noyes, J., Parker, C. & Worrel, P. (1991-2). Food-related stimuli inerease desire to eat in hungry and satiated human subjects. Current Psychology: Research & Reviews. 10, 4, 297-303.
Lang, M., Lang, W., Diekmann, V. & Kornhuber, H.H. (1987). The frontal theta rthythm indicating motor and cognitive learning. In R. Johnson, J.W. Rohrbaugh &R. Parasuraman (eds). Current trends in event-related potential research (EEG supnl,40), Elsevier: Amsterdam, pp 322-327.
Lawless, H. (1991a). The sense of smell in food quality and sensory evaluation. Journal of Food Quality. 14, 33-60.
Lawless, H. (1991b). Effects of odors on mood and behaviour: Aromatherapy and related effects. In D. G. Laing, R.L. Doty, & W. Breipohl (Eds), The human sense of smell. Springer-Verlag.
Leathwood, P. (1987). Nutrition and neurotransmilter synthesis. In J. Solms, D.A. Booth, R.M. Pangborn & O. Ramhardl (Eds). Food acceptance in nutrition. Academic Press. 245-265.
Leathwood, P. (1990). Food intake and food choice: from physiology to application. Why we eat what we eat. The British Nutrition Foundation Nuirilition Bulletin. 15, 1, pp 50-59.
Leathwood, P., & Pollet, P. (1982/3). Diet-induced mood changes in normal populations. Journal of Psychiatric Research. 17,2, 147-154.
Lee, V. M., and Linden, R.W.A. (1990). The effect of olfactory stimuli on the masticatory and gustatory salivary reflexes in humans. Journal of Physiology. Vol 423, 5. Abstract.
Lee, V. M. and Linden, R.W.A. (1992). An olfactory-submandibular salivary reflex in humans. Experimental Physiology. 77. 221-224.

Legewie, H., Siminova, (). & Creulzfeldt, O.D. (1969). EEG changes during performance of various tasks under open- and closed- eyed conditions. Electroencephalography and Clinical Neurophysiology. 27.470-479.
Legoff, D. B. & N.M. Spieglman, (1987). Salivary response to olfactory food stimuli as a function of dietary restraint and body weight. Appetite. Vol 8, 29-35.
Lehmann, D. & Knauss, T.A. (1976). Respiratory cycle and EEG in man and cal. Electroencephalography and Clinical Neurophysiology, 40. 187.
Lemagnen, J. (1971). Olfaction and nutrition. In L.M. Beidler (Ed), Handbook of sensory physiology, Vol IV, olfaction. Springer-Verlag. Berlin.
Lewis, J., Baddeley, A.D., Bonham, K.G., and Lovett, D. (1970). Traffic pollution and menial efficiency. Nature. Vol 225, 95-97.
Lieberman, H.R. (1987). The behavioural effects of foods. In J. Solms, D.A. Booth, R.M. Panghorn & O. Raunhardl (Eds), Food acceptance and nutrition. Academic Press. 267-281.
Lieberman, H.R., Corkin, S., Sprong, B.J., Growdon, J.H. & Wurtman, R.J. (1982). Mood and sensorimotor performance after neurotransmiller precursor administration. Society of Neuroscience. 8, 395.
Lieberman, H.R., Corkin, S., Spring, B.J., Growdon, J.H. & Wuriman, R.J. (1982/8.3). Mood, performance, and pain sensitivity: Changes induced by food constituents. Journal of Psychiatry Research. Vol 17, No 2. 135-145.
Lieberman, H.R. Spring, B.J. & Garfield, G.S. (1986). The behavioural effects of food constituents: Strategies used in studies of amino acids, protein, carbohydrate and caffeine. Nutrition Reviews. May Suppl, 61-70.
Lillard, D.A. (1987). Oxidative deterioration in meal, poultry and fish. In A.J. St Angelo & M.E. Bailey (Eds). Warmed-over flavor of meat. Academic Press Ltd. Orlando, Florida.

Lindslcy, D.B. (1952). Psychological phenomena and the electroencephalogram.
Lindsley, D.B. & Wicke, J.D. (1974). The electroencephalogram: Autonomous electrical activity in man and animals. In Bioelectric recording techniques. Vol IB. New york, London: Academic Press.
Lindvall, T. & Radford, E.P. (1973). Measurement of annoyance due to exposure to environmental factors. Environmental Research. 6. 1-36.
Linke, D.B., Reuter, B.M. & Kurthen, M. (1989) Brain lateralization in stress reactions. In K. Maurer (Ed), Topographic mapping of EECi and evoked potentials. Springer-Verlag: Berlin, p 326-328.
Linne, C. von (1756). Odores medicamentorum. Amoenitatcs academicae. 3. 195.
Loftus, E.F. & Loftus, G.R. (1980). On the permanence of stored information in the human brain. American Psychologist. 35, 409-420.
Lopes da Silva, F. (1982). EEG analysis: Theory and practice. In E. Niedermeyer &F. Lopes da Silva(Eds) Electroencephalography: Basic__principles,__gljpiynlapplications and related fields. Urban and Schwarzenberg. Germany, pp 685-732.
Long, T.S. (1986). EEG and task performance: A comparison of three analytic techniques. Physiological Psychology. 14, 3 & 4. 130-132.
Long, T. S. (1989). HumanEEGandodorrespon.se. Progress in Neurohiologv.33, 387-398.
Lorig, T.S. (1992). Cognitive and non-cognilive effects of odour exposure: Electrophysiologieul and behavioural evidence. In S. Van Toller & G. Dodd (Eds), Fragrance: The psychology and biology of perfume. Elsevier: Amsterdam, pp 161- 173.
Lorig, T. S., Herman, K. B., Schwartz, G. E. & Cain, W. S (1990). EEG activity during administration of low-concentration odors. Bulletin of the Psvchonomic Society. 28, (5), 405-408.
2 63
Lorig, T.S., Huffman, E., DcMartino, A., & DeMarco, J. (1991). The effects of low concentration odors on EEG activity and behaviour. Journal of Psychophysiology. 5, 69- 77.
Lorig, T.S., Mayer, T.S., Moore, H. & Warrenberg, S. (1993). Visual event-related potentials during odor labeling. Chemical .Senses. 18, 4, 379-387.
Lorig, T. S. & Roberts, M. (1990). Odor and cognitive alteration of the contingent negative variation. Chemical Senses. 15, 5, pp 537-545.
Lorig, T.S & Schwartz, G.E. (1987). Alteration of EEG by odor administration. Psychophysiology. 24, 5, 598-599.
Lorig, T. S. & Schwartz, G.E. (1988-89). EEG activity during food and relaxation imagery. Imagination, Counition and Personality. 8,201-208.
Lorig, T. S. & Schwartz, G. E. (1988). Brain and odor: I. Alteration of human EEG by odor administration. Psychobiology. 16 (3), 281-284.
Lorig, T.S. & Schwartz, G.E. (1989). Factor analysis of the EEG indicates inconsistencies in traditional frequency bands. Journal of Psychophysiology. 3, 369-375.
Lorig, T. S., Schwartz, G. E., Herman, K. B. & Lane, R. D. (1988). Brain and odor: II. EEG activity during nose and mouth breathing. Psychobiology. 16 (3), 285-287.
Lozol'f, B. (1989). Nutrition and behaviour. American Psychologist. 44, 2, 231-236.
Lucas, A., Morley, R., Cole, T.J., Lister, G. & Leeson-Payne, C. (1992). Brcasimilk and subsequent intelligence quotient in children born preterm. The Lancet. 339, 261-264.
Ludvigson, H. W. & Rottman, T. R. (1989). Effects of ambient odours of lavender and cloves on cognition, memory, affect and mood. Chemical Senses. 14, 4, 525-536.
Lydiard, R.B., Brewerion, T.D., Fossey, M.D., Laraia, M.T., Stuart, G., Beinfield, M.C. & Ballenger, J.C. (1993). CSF cholcystokinin octapeptide in patients with bulimia

nervosa and in normal comparison subjects. American Journal of Psychiatry. 150, 7, 1099-1101.
Manley, C.H. (1993). Psychophysiological efleet of odor. Critical Reviews in Food Science and Nutrition. 33, 1,57-62.
Manseau, C. & Broughton, R.J. (1984). Bilaterally synchronous ultradian EEG rhythms in awake adult humans. PsvchophvsioloL1. 21, 3, 265-273.
Martin, N. (1992). Human neocortical EEG response to food odour. Chemical Senses. 17, 6. 862.
Martin, N. (1993a). Sniffing out memories. The Psychologist. 6, 5, 226.
Martin, N. (1993b). Brain Electrical Activity Mapping and the human sense of smell. Journal of Psychophysiology. 7,3, 265.
Maulsby, R.L. (1971). An illustration of emotionally evoked theta rhythm in infancy: Hedonic hypersynchrony. Electroencephalography and Clinical Neurophysiology. 31, 157-165.
McCarthy, R.A. & Warrington, E.K. (1990). Cognitive neuropsychology: A clinical introduction. Academic Press: London.
McCartney, W. (1968). Olfaction and odours: An osphresiolottical essay. Springer- Verlag: Heidelberg.
McKee, G., Humphrey, B. <& McAdam, D.W. (1973). Scaled lateralization of alpha activity dining linguistic and musical tasks. Psychophysiology. 10, 441-443.
Michel, C.M., Lehmann, B. & Brandeis, D. (1992). Localization of the sources of EEG della,theta, alpha and beta frequency bands using the FFT dipole approximation. Elcclrcncenhaloeraphv & Clinical Neurophysiology , 82, 38-44.

Millar, K., Hammersley, R.H. & Finnigan, F. (1992). Reduction of alcohol-induced performance impairment by prior ingestion of food. British Journal of Psychology. 83, 261-278.
Miller, R. (1991). Cortico-hinnocampal interplay and the representation of contexts in the brain. Springer: Berlin-Heidelberg-New York.
Milligan, G. (1992). Autoedit 4.2.
Milligan, G. & Martin, G.N. (1993). Batch Commander: an automatic, time-saving programme for monotonous, multiple operations (manuscript submitted for publication).
Milne, L. & Milne, M. (196.3). The senses of animals and men. Andre Deutsch.
Milner, B. (1978). Clues to the cerebral organisation of memory. INSFRM Symposium. 6, 139-154.
Miltner, W. & Braun, C. (1993). ERPs and startle-reflex to different emotional odors. Psychophysiology. 30, Supplement 1, S6.
Millner, W., Johnson, R. Jr., Braun, C. & Larhig, W. (1989). Somatosensory event- related potentials to painful and non-painful stimuli: effects of attention. Pain. .38, 303-12.
Mi/.uki, Y., Masotoshi, T., Isokazi, H., Nishijima, H., & Inanaga, K. (1980). Periodic appearance of theta rthylhm in the frontal midline area during performance of a mental task. Elccirocnq~phak>giiiphy and Clinical Neurophysiology, 49, 345-351.
Mi/.uki, Y., Takii, ()., Nishijima, H. & Inanaga, K. (1983). The relationship between the appearance of frontal midlinc theta activity (FmO) and memory function. Electroencephalography and Clinical Neurophvsiolottv. 56. 56-66.
Moncrieff, R.W. (1962) Effect of odours on EEG records. Perfumery and Essential Oil Records. Vol 53, 757-760.

Morgan, A.H., MacDonald, P.J. & MacDonald, H. (1971). Differences in bilateral alpha activity as a function of experimental task with a note on lateral eye movements and hypnotizabilily. Ncuropsycholouia. 9, 459-469.
Moschandras, D.J. & Relwani, S.M. (1992). Perception of environmental tobacco smoke odors: An olfactory and visual response. Atmospheric Environment. 26B, 3, 26.3-269.
Moskowitz, H. R. (1978). Odors in the environment: Hedonics, perfumery and odor abatement. In C. Carterelte & M.P. Friedman (Eds), Handbook of perception Vol 10: Perceptual ecology. Academic Press: NY. 307-347.
Moskowitz, H.R., Dravnieks, A. & Gerbers, C. (1974). Odor intensity and pleasantness of butanol. Journal of .ExpcrimaUitl.Psychol.ouy, 103.216-223.
Moskowitz, H.R., Dravnieks, A. & Klarman, L.A. (1976). Odor intensity and pleasantness for a diverse set of odorants. Perception & Psychophysics. 19, 122-128.
Mozell, M. M., Smith, B. P., Smith, P.E., Sullivan, R. I., & Swcnder, P. (1969).Nasal chemoreception in flavor identification. Arch. Otalarvng.. 90, Sept, 367-373.
Mundy-Castle, A.C. (1951). Theta and beta in the electroencephalogram of normal adults. Ejcvirocnq-phulog'iiphy and Clinical Neurophysiology, .3. 477-486.
Murphy, C., Cain, W. S., & Bartoshuk, L. M. (1977). Mutual action of taste and olfaction. Sensory Processes. 1,204-211.
Murphy, C. & Cain, W. S. (1980) Taste and olfaction: Independence vs interaction. Physiology and Behaviour. Vol 24, 601-605.
Naatanen, R. (198.3). The N2 component of the evoked potential: a scalp reflection of neuronal mismatch of orienting theory. In J. Strelau, F. Farley & A. Gale (eds). The biological bases of personality and behaviour. New York: Hemisphere Press.
2 6 6
Naatanen, R. & Pielon, T. (1987). The N1 wave of the human electric and magnetic response to sound: A review and analysis of component structure. Psychophysiology, 24, 375-425.

26 7
Naitoh, P. (1982). Chronobiologic approach lor optimizing human performance. In F.M. Brown and R.C. Graeher (Eds), Rhythmic aspects of human behaviour. LEA: Hillsdale.
Nashold, B.S. & Wilson, W.P. (1970). Olfactory hallucinations evoked from stimulation of the human thalamus. Conl'inia Ncurologica. 32, 298-307.
Nauta, W.J.H. (1971). The problem of the frontal lobe: a reinterpretation. Journal of Psychiatric Research. 8. 167-187.
Nicholson, A.N. & Stone, B.M. (1979). L-tryptophan and sleep in healthy men. Electroencephalography and Clinical Ncurophvsiolouv. 47, 5.39-545.
Niedermeyer, E. (1987). The normal EEG of the waking adult. In E. Niedermeyer & F. Lopes da Silva (Eds) Electroencephalography: Basic principles, clinical applications and related fields. Urban and Schwarzenberg. Germany. (Chapt 9) pp 97-1 17.
Niedermyer, E. & Lopes da Silva, F. (1987). (eds). Electroencephalography: Basicprinciples, clinical__applications and related fields. Urban and Schwar/.enherg.Germany.
Nixdorf, R.D., Teerling, A. & Rosier, E.P. (1992). The effect of olfactory stimuli on the time spent by consumers in textile-department stores. Paper presented at the 14th Annual Meeting of the Association for Chemoreception Sciences, Florida.
Norman, D.A. (1984). Theories and models of cognitive psychology. In E. Donchin (Ed.), Cognitive psychophysiology: ERPs and the study of coanition. Vol I. LEA: Hillsdale.
Nunez, P.L. (1981). Electric fields of the brain: The ncuronhvsics of the EEG, New York: Oxford Press.
O'Donnell, B.F., Friedman, S., Swearer, J.M. & Drachman, D.A. (1992). Active and passive P3 latency and psychometric performance: influence of age and individual differences. International Journal of Psychophysiology. 12, 187-195.

2 6 8
Oldfield, R.C. (1971). The assessment and analysis of handedness: the Edinburgh Handedness Inventory. Ncumpsvcholoeia. 9, 97-113.
O'Mahoney, M. (1978). Smell illusions and suggestion: reports of smells contingent on tones played on television and radio. Chemical Senses. 3, 2, 18.3-189.
Ornstein, R., Johnstone, J., Herron, J. & Swencionis, C. (1979). Differential right hemipshere involvement in two reading tasks. Psychophysiology. 16. 398-401.
Ornstein, R., Johnstone, J., Herron, J. & Swencionis, C. (1981). Differential right hemisphere engagement in viduospatia! tasks. Ncuropsycholouia.
Pager, J. (1977) Nutritional stales, food odors, and olfactory function. In M.R. Rare and O. Mailer (Eds) The chemical senses and nutrition pp. 51-68. Academic Press.
Panghorn, R.M., Guinard, J-X. & Davis, R.G. (1988). Regional aroma preferences. Food Quality and Preference. 1, 1, 11-19.
Papez, J.W. (1937). A proposed mechanism foremotion. Archives of Ncurolouv and Psychiatry. 38, 725-74.3.
Patrick, G.T. (1899). On the confusion of tastes and odors. Psychological Review. 6, 160-162.
Pauling, L. (1968). Orthomolecular psychiatry. Scientific Journal, 160,265-271.
Perris, C., Monakhov, K., von Knorring, L., Botskarev, M. & Nikiforov, A. (1978). Systemic structural analysis of the electroencephalogram of depressed patients : general principles and preliminary results of an international collaborative study. Ncuropsvehohiolotiv. 4, 207-220.
Perlini, A.H. & Spanos, N.P. (1991). EEG alpha methodologies and hypnotizahiliiy: A critical review. Psychophysiology. 28, 5, 511-530.

PI'alTman, C. (I960). The pleasures of sensation. Psychological Review. Vol 67. 4. 253-268.
Penfield, W. (1958). Functional localization intemporal and deep sylvian areas. Prog- Ass, Research in Nervous and Mental Diseases. 36. 244-257.
Pietrowsky, R.. Fehm, H.L., Er, A., Bathelt, B & Born, J. (1990). Influences of the cholcyslokinin analog eeruletide on human sleep and evoked potentials. Neuropsvchohiologv. 2.3, 41-47.
Pietrowsky, R., Preuss, S., Born, J., Pauschinger, P. & Fehm, H.L. (1989). Effects of cholecystokinin and calcitonin on evoked brain potentials and satiety in man. Physiology & Behaviour. 46,513-519.
Pietrowsky, R., Schiemann. C. Fehm, H.L. & Born, J. (1993). The P2 amplitude of the auditory evoked potential is diminished by the cholecystokinin-analog ceruletide. Journal of Pathophysiology, 7, 3-l().
Pinching, A.T. (1977). Clinical testing of olfaction reassessed. Brain. 100, 377-388.
Plaltig, K-H. (1989). Electrophysiology of taste and smell. Clinical Physics and Physiological Measurement. Vol 10,2,91-125.
Polich, J. (1986). Attention, probability and task demands as determinants of P300 latency from auditory stimuli. Electroencephalography and Clinical Ncuronhysioloav.6.3. 251 -259.
Polich, J. (1987). Response mode and P300 from auditory stimuli. Biological Psychology. 25, 61-71.
Polich, J. (1989). Habituation of P3(K) from auditory stimuli. Psvchobioloev. 17, I, 19-28.
Polich, J., Elders, C.L., Otis, S„ Mandell, A.J. & Bloom. F.E. (1986). P.300 latency reflects the degree of cognitive decline in dementing illness. Electroencephalography and Clinical Neurophysiology. 6.3, 138-144.

2 7 0
Polich, J., Howard, L. & Starr, A. (1985). Effects of aging on the P300 component of the event-related potential from auditory stimuli: peak definition, variation and measurement. Journal of Gerontology. 40, 721-726.
Potter, H. & Naula, W.J.H. (1979). An assessment of olfactory deficits in patients with damage to prefrontal cortex. Ncuropsvchologia. 18,621-628.
Potter, H. & Naula, W.J.H. (1979). A note on the problrm of olfactory associations of the orhitofrontal cortex in the monkey. Neuroscience. 4, 361-367.
Pribram, K.H. & McGuinness, D. (1975). Arousal, activation and effort in the control of attention. Psychological Review. 82, 116-149.
Price, J.L. (1985). Beyond the primary olfactory cortex: olfactory-related areas in the neocortex, thalamus and hypothalamus. Chemical Senses. 10, 2, 239-258.
Pritchard, W.S., Brandi. M.E., Shape». S.A.. O'Dell, T.J. & Barratl. E.S. (1986). No decrement in visual P300 amplitude during extended performance of the oddball task. Intcrnauunitl Journal, of Nanyscicncv. 29, 199-204.
Rappelsherger, P. & Petsche, H. (1988). Probability mapping: Power and coherence analyses of cognitive processing. Brain Topography. Vol I. 1,45-54.
Rausch, R. , Serafetidines, E.A. & Crandall, P.H. (1977) Olfactory memory in patients with anterior temporal lobectomy. Cortex. 13, 445-452.
Ray, W.J. & Cole, H.W. (1985). EEG alpha activity reflects altentional demands, and beta activity reflects emotional and cognitive processes. Science. Vol 228, 750-752.
Rechtschaffen, A. & Kales, A. (1968). Manual of standardized terminology, techniques, and scoring system for sleep stages of human subjects. Brain Information Service/Brain Research Institute, University of California, Los Angeles.
Richardson, J. & Zucco, G. M. (1989). Cognition and olfaction: A review. Psychological Bulletin. 105, 3, 352-360.

Rimmel, E. (1868). The Book of Perfumes. London.
Rippere, V. (1984). Some varieties of food intoleranee in psychiatric patients: An overview. Nntrition and Health. 3. 125-135.
Rippere, V. (1985). Diet and mental illness. In S. Seely, D.L.J. Freed, G.A. Silverstone and V. Rippere (Eds). Diet-related diseases: The modern epidemic. Beckenham, U.K.: Croom Helm.
Ritter, W & Vaughan, H.G. Jr. (1969). Averaged evoked responses in vigilance and discrimination: A reassessment. Science. 164, 326-328.
Ritter, W. , Vaughan, H.G. Jr., & Simson, R. (1983). On relating event-related potential components to stages of information processing. In A.VV.K. Gaillard & W. Ritter (eds). Tutorials in ERP research: endogenous components. North Holland Publishing Co.
Roberts, A. & Williams, J.M.G. (1992) The effect of olfactory stimulation on fluency, vividness of imagery and associated mood: A preliminary study. British Journal of Mcilictd .Psychology. 65, 197-199.
Robinson, C.H., Lawler, M.R., Chenowetb, W.L. & Garwick, A.E. (1986). Normal and therapeutic nutrition (seventeenth edition). New York. Macmillan Publishing Company.
Robinson, R.G. & Benson, D.F. (1981). depression in aphasie patients: frequency , severity and clinical-pathological correlations. Brain and Language. 14, 282-291.
Robinson, R.G., Kubos, K.L., Starr, L.B.. Roa. K. & Price, T.R. (1984). Mood disorders in stroke patients: importance of location of lesion. Brain. 107, 81-9.3.
Robinson, R.G. & S/.etela, B. (1981). Mood change following left hemispheric brain injury. Annals of Neurology, 9, 447-45.3.
Rolls, B.J. (1986). Sensory-specific satiety. Nutrition Reviews. 4, 3, 93-101.

Rolls, B.J., Hetheringlon, M., Burley, V.J. & van Dili jvenvoorde, P.M. (1986). Changing hedonic responses during and after a meal. In MR. Rare and J.G. Brand (Eds) Interaction of the chemical senses with nutrition. Academic Press.
Rolls, B.J., Laster, L.J. & Summerfelt, A. (1991). Meal order reversal: Effects of eating a sweet course first or last. Appetite. Vol 16, 141-148.
Rolls, B.J., Rolls, E.T. & Rowe, E.A. (1981). Sensory-specific satiety in man. Physiology & Behaviour. 27, 137-142.
Rolls, B.J., Rowe, E.A . & Rolls, E.T. (1982) How sensory properties of foods affect human feeding behaviour. Phvsiolouv and Behaviour. 29, 409-417.
Rolls, B.J., van Duijvenvoorde, P.M., & Rolls, E.T. (1984). Pleasantness changes and food intake in a varied four-course meal. Appetite. 5, 337-348.
Rolls, E.T. & Rolls, B.J. (1973). Altered food preferences after lesions in the basolateral region of the amygdala in the rat. Journal of Comparative and Physiological Psychology. 83, 248-259.
Ross, G.R.T. (1906). (Ed), Aristotle: De sensu and dc memoria. Cambridge: Cambridge University Press.
Rottman, T.R. ¿Sc Ludvigson, H. W. (1988). The effects of pleasant environmental odor, odor variety, and personality on cognitive performance, mood and motivation. Chemical ■Senses. Vol 13, 4, 730-731.
Rotton, J. (198.3). Affective and cognitive consequences of malodorous pollution. Basic and Applied Social Psychology, Vol 4. 171-191.
Rotton, J., Barry, T., Frey, J., & Soler, E. (1978). Air pollution and interpersonal attraction. Journal of Applied Social Psychology, Vol 8, 1,57-71.

Rotton, J., Frey, J., Barry, T., Milligan, M., & Fitzpatrick, M. (1979). The air pollution experience and physical aggression. Journal of Applied Social Psychology. 9, 5, 397-412.
Rozin, P. and Fallon, A. (1980) The psychological categorization of Foods and non-foods: A preliminary taxonomy of food rejections. Appetite. Vol 1, 193-201.
Rozin, P. and Vollmecke, T. A. (1986) Food likes and dislikes. Annual Review of Nutrition. Vol 6, 433-456.
Rubin, D. C., Groth, E. & Goldsmith, D. J. (1984). Olfactory cuing of autobiographical memory. American Journal of Psychology. 97, 493-507.
Rugg, M.D. & Dickens, A.M.J. (1982). Dissociation of alpha and theta activity as a function of verbal and visuospatial tasks. Electroencephalography & Clinical Neurophysiology. 5.3, 201-207.
Sackeim, H.A., Greenberg, M.S., Weiman, A.L.. Gur, R.C., Hungerhuhler, J.P. & Gesehwind, N. (1982). hemispheric asymmetry in the expression of positive and negative emotions. Archives of Neurology. 39, 219-2 18.
Samson, S. & Zalorre, R.J. (1992). Learning and retention of melodic and verbal information alter unilateral temporal lobectomy. Neuropsvcholot.'ia. 30, 815-826.
Schaal, B. & Porter, R.H. (1991). "Microsmalie humans" revisited: The generation and perception of chemical signals. Advances in the Study of Behaviour. 20, 135-199.
Schah, F. R. (1990). Odors and remembrance of things past. Journal of Experimental Psychology: Learning. Memory and CoL'nition. 16, 4, 648-655.
Schab, F. R. (1991). Odor memory: taking stock. Psychological Bulletin. 109, 2, 242- 251.
Schab, F.R. & Cain, W.S. (1991). Memory for odors. In D.G. Laing, R.L. Doty & W. Breipohl (Eds), The human sense of smell. Springer-Verlag.

Sc hue ter, D.L. (1976). The hypnagogic slate: A critical review of the literature. Psychological Bulletin. 83, 452-481.
Sehacter, D.L. (1977). EEG theta waves and psychological phenomena: A review and analysis. Biological Psychology. 5, 47-82.
Schaffer, C.E., Davidson, R.J. & Saron, C. (198.3). Frontal and parietal electroeneephalographic asymmetry in depressed and non-depressed auhjects. Biological Psychiatry. 18, 753-762.
Schelleherg, D., Beslhorn, C. Pfleger, W. & Gasser, T. (1993). Emotional activation and topographic EEG hand power. Journal of Psychophysiology. 24-33.
Schiffman, S.S. (1974). Physiochemical correlates of olfactory quality. Science. 185 (July), 112-118.
Seely, S., Freed, D.L.J., Silverstone, G.A. & Rippere, V. (1985). (Eds), Diet-related diseases: the modern epidemic. Beckenham. UK:Croom Helm.
Selling hy Smell, (1957). Sweet scents invade industry and business: Steady increase of use of aromatic chemicals. Perfume and Essential Oil Records. July, 349-3.
Serhy, M.L. & Chohor, K.L. (1992). (Eds). Science of olfaction. NY: Springer-Verlag.
Sheckley, R. (1978). The alchemical marriage of Alistair Cromnion, Michael Joseph: London.
Shusterman, D. (1992). Critical review: The health significance of environmental odor pollution. Archives of Environmental Health, 47. 1.76-87.
Silver, A.J. & Motley, J.E. (1991). Role of CCK in regulation of food intake. Progress in Neurohiologv. 36, 23-34.
Simeon, D.T. & Grantham-McGregor, S. (1989). Effects of missing breakfast on the cognitive functions of school children of differing nutritional status. American Journal of Clinical Nutrition. 49, 646-53.

27 5
Sklare, D.A. & Lynn, G.E. (1984). Latency of the P.3 event-related potential : normative aspects and within-suhject variability. Electroencephalography and Clinical Neurophysiology. 59, 420-424.
Slosson, E.E. (1899). Perception by suggestion. Psychological Review. 6. 407-408.
Smith, A.P. (1992). Effects of meals on performance. Paper presented at the Welsh Branch of the British Psychological Society.
Smith, A.P. & Miles, C. (1986). Effects of lunch on selective and sustained attention. Ncuropsvchobiologv. 16, 117-120.
Smith, D.G., Standing, L., & DeMann, A. (1992). Verbal memory elicited by ambient odor. Perceptual and Motor Skills, 74, 339-343.
Solos, J.N. & Raharjo, S. (1990). Lipid oxidation in restructured meat products. In G. Charalambous (Ed) Flavors and off-flavors. Proceedings of the 6lh International Flavor Conference, Elsevier. Amsterdam.
Spinweber, C.L., Ursin, R., Hilbert, R.P., & Hildebrand, R.L. (198.3). L-tryptophan: effects on daytime sleep and on the waking EEG. Electrucnccphaloaraphv and Clinical Neurophysiology. 55, 652-661.
Spitzer, L. & Rodin, J. (1981). Human eating behaviour: a critical review of studies in normal weight and overweight individuals. Appetite. 2, 293-329.
Spring, B., Chiodo, J. & Bowen, D. J. (1987). Carbohydrates, tryptophan, and behaviour: A methodological review. Psychological Bulletin. 102, 2, 2.34-256.
Spring, B., Mailer, ()., Wurlman, J.. Digman, L. & Co/.olino, L. (1982/83). Effects of protein and carbohydrate meals on mood and performance: Interactions with age and sex. Journal of Psychiatric Research. 17,2, 155-167.
Squires, K.C., Donchin, E., Homing. R.I. & McCarthy, G. (1977). On the influence of task relevance and stimulus probability on event-realted potential components. Electroencephalography and Clinical Neurophysiology. 42. 1-14.
Squires, K.C., Galbraith, G. & Aine, C. (1979). Event-related potential assessment of sensory and cognitive deficits in the mentally retarded. In D. Lehmann & E. Callaway (eds). Human evoked potentials: Applications and problems. New York: Plenum Press.
Stacher, G., Bauer, H. & Steinringer, H. (1979). Choleeystokinin decreases appetite and activation evoked by stimuli arising from the preparation of a meal in man. Physiology & Behaviour. 2.4, 425-3.41.
Starkstein, S.E., Robinson, R.G. & Price, T.R. (19X7). Comparison of cortical and subcortical lesions in the production of post-stroke mood disorders. Brain. 110, 1045- 1059.
Stoddart, D.M. (1980). The ecology of vertebrate olfaction. Andover, Hants: Chapman and Hall.
Stoddart, D.M. (1990). The scented ape. New York: Cambridge University Press.
Suskind, P. (1985). Das parfnm. Diogenes Verlag A G, Zurich.
Sutton, S., Braren, M., Zuhin, J. & John, E.R. (1967). Evoked-potenlial correlates of stimulus uncertainty. Science. 150, 1187-88.
Swallwell, S. (1990). Packaging and advertising-Master or servant of product? Why we eat what we eat. The British Nutrition Foundation Bulletin. Vol 15, Supp 1,96-101.
Swann, H.G. (19.44). The function of the brain in olfaction. 11. The results of destruction of olfactory and other nervous centres upon the discrimination of odours. Journal of Comparative Neurology. 59. 175-201.
276
Takagi, S.F. (1989). Human olfaction. University of Tokyo Press.

Tanahe, T., lino, M. & Takagi, S.F. (1975). Discrimination of odors in olfactory hulh, pyrifrom-amygdaloid areas, and orbitofrontal cortex of ihe monkey. Journal of Neurophysiology. 38, 1284-86.
Tanabe, T., Yarita, H., lino, M., Ooshima, Y. & Takagi, S.F. (1975). An olfactory projection area in orbitofrontal cortex of the monkey. Journal of Neurophysiology. 38, 1284-1296.
Tims, M.J. & Watts, B.M. (1958). Protection of cooked meals with phosphates. Food Technology. 12, 240.
Tisserand, R. (1977). The art of aromatherapy. C.W. Daniels.
Tomarken, A.J., Davidson, R.J. & Henriques, J.B. (1990). Resting frontal brain asymmetry predicts affective responses to films. Journal of Personality and Social Psychology. 59, 4, 791-801.
Tomarken, A.J., Davidson, R.J., Wheeler, R.E. & Kinney, L. (1992). Psychometric properties of resting anterior EEG asymmetry: Temporal stability and internal consistency. Psychophysiology. 29, 5. 576-592.
Torii, S, Fukada, H., Kanemoto, H., Miyanchi, R., Hama/u, Y & Kawasaki, M. (1988). Contingent negative variation (CNV) and the psychological effects of odour. In S. Van Toller and G. Dodd (Eds) Perfumery: The psychology and biology of fragrance. Chapman Hall, pp 107-120.
Torsvall, L. & Akerstedt, T. (1987). Sleepiness on the job: continuously measured EEG changes in train drivers. Elcctrophvsiologv and Clinical Neurophysiology. 66, 502-51 I.
Tsuji, Y. & Kobayashi, T. (1988). Short and long uniradian EEG components in daytime arousal. Electroencephalography and Clinical Neurophysiology. 70. I 10-117.
2 7 7
Tucker, D.M. (1981). Lateral brain function, emotion and conceptualization. Psychological Bulletin. 89, 19-46.

Tucker, D.M. & Dawson, S.L. (1984). Asymmetric EEG changes as method actors generated emotions. Biological Psychology. 19,63-75.
Tucker, D.M., Stenslie, C.E., Roth, R.S. & Shearer, S.L. (1981). Right frontal lohe activation and right hemisphere performance. Archives of General Psychiatry. 38, 169- 174.
Tucker, W.G., Leaderer, B.P., Molhave, L. & Cain, W.S. (1992). Sources of indoor air contaminants: Characterizing emissions and health impacts. Annals of the N.Y. Academy of Sciences. 641.
Tulving, E. & Thomson, D.M. (1973). Encoding specificity and retrieval processes in episodic memory. Psychological Review. 80, 352-372.
Urson, H., Rosvold, H.E. & Vest, B. (1969). Food preference in brain lesioned monkeys. Physiology and Behaviour. 4, 609-61 2.
Ury, H.K., Pperkins, N.M. & Goldsmith, J.R. (1972). Motor vehicle accidents and vehicular pollution in Los Angeles. Archives of Environmental Health. 25, 314-322.
Valnet, J. (1982). The practice of aromatherapy. C.W. Daniel: England.
van Toller, S., Behan, J., Howells, P., Kendal-Rced, M. & Richardson, A. (1993).An analysis of spontaneous human cortical EEG activity it) odours. Chemical Senses.18, I, 1-16.
Vasey, M. W. & Thayer, J. F. (1987) The continuing problem of false positives in repeated measures ANOVA in psychophysiology: A multivariate solution. Psychophysiology. 24, 4, 479-488.
Vaughan, H.G. Jr. & Arezzo, J.C. (1988). The neural basis of event related potentials. In T.W. Pieton (ed). Human event related potentials: Handbook of electroencephalography and clinical neurophysiology. Vol III. Amsterdam: Elsevier.
Vogel, W., Broverman, D.M. & Klaiher, E.L. (1968). EEG and mental abilities. Electroencenhalot’iaphy and Clinical Ncurophysiolouv. 24, 166-175.

2 7 9
Vonderahe, A.R. (1943). The anatomic basis o!' emotion. Ohio Stale Medical Journal. 39, 325-330.
Von Haller. A. (1763). Elementa Phvsiologiac. Lausanne: Rimmel.
Walter, D.O. , Etevenon, P., Pidoux, B., Tortrat, D., & Guillou, S. (1984). Com puterized topo-EEG spectral maps: difficulties and perspectives. Ncuropsvchohiolpgy. 11, 264-272.
Walter, V.J. & Walter, W.G. (1949). The central effects of rhythmic sensory stimulation. Electroencephalography and Clinical Neurophvsiolouv. 1,57-86.
Walter, W.G. (1953). The living brain. Duckworth.
Waller, W.G. (1959). Instrinsic rhythms of the brain. In J. Field el al (eds). Handbook of physiology, pp 279-298. Washington, D.C.: American Physiological Society.
Warm, J.S., Demher, W.N., & Parasuraman, R. (1991). Effects of olfactory stimulation on performance and stress in a visual sustained attention task. Journal of the Society of Cosmetic Chemists, Vol 42, Pt 2, 199-210.
Warwick, Z.S.. Hall, W.G., Pappas, T.N., & Schiflman. S.S. (1993). Taste and smell sensations enhance the satiating effect of both a high-carbohydrate and a high-fat meal in humans. Physiology & Behaviour. 53, 553-56.3.
Watson, C., Andermann, F., Gloor, P., Jones-Goiman, M., Peters, T., Evans, A., Olivier, A., Melanson, D., & Leroux, G. (1992). Anatomical basis of amygdala and hippocampal volume measurement by magnetic resonance imaging. Neurology. 42, 1743- 1750.
Wayne, W.S., Wehrle, P.F., & Carroll., R.E. (1967). Oxidant air pollution and athletic performance. Journal of the American Medical Association. 199, 12, 151-154.
Weber-Tschopp, A., Jermini, C., & Grandjean, E. (1976). Luftverunreinigung und Belastigung dutch Zigarettenrauch. Sozial-und Praventiv-Medi/in. 21, 2/3, 101-106.

2 8 0
Weiskrantz, L. (1956). Behavioural changes associated with ablation of the amygdaloid complex in monkeys. Journal of Comparative and Physiological Psychology. 49, 381- 391.
Wernt/., D.A., Bickford, R.G., Bloom, F.E. & ShannaholT-Khasa, D.S. (198.3). Alternating cerebral hemispheric activity and the lateralization of autonomic nervous function. Human Neurohiologv. Vol 2, 39-43.
Wesenstein, N.J., Badia, P. & Harsch, J. (1990). Time of day, repealed testing and interblock interval effects on P.300 amplitude. Physiology & Behaviour. 47, 653-658.
Westphal, K.P., Gro/.inger, B., Diekmann, V., Scherb, W., Reess, J., Leibling, U. & Kornhuber, H.H. (1990). Slower theta activity ove the midfrontal cortex in schizophrenic patients. Acta Psvch. Scand.. 81. 1.32-138.
Wheeler, R.E., Davidson, R.J. & Tomarken, A.J. (199.3). Frontal brain asymmetry and emotional reactivity: A biological substrate of affective style. Psychophysiology. 30, 82- 89.
Wickens, C.D. (1984). Processing resources in attention. In R. Parasuraman & D.R. Davies teds). Varieties of attention. Academic Press.
Williams, K.B., Radefield, P.S., Binning, J.F. & Sudak, J.R. (199.3). When job candidates are "hard-" versus "easy-to-get": Effects of candidate availability on employment decisions. Journal of Applied Social Psychology. 2.3. 169-198.
Williams, K.J. & Keating, C.W. (1987). Affect and the processing of performance information. Paper presented at the meetings of the Society of Industrial and Organizational Psychology, Atlanta.
Wilson, S„ Orne, M. & Pakewitz, D. (1977). Individual differences in the interaction between alpha density and arousal. Psychophysiology. 14. 103-104.
Winneke, G., Hedler, P. & Koeppe, G.M. (1989). Perception and hedonic evaluation of odour stimuli in the presence of traffic-noise exposure. Chemical Senses. 14, I.

28 1
Wong, P.K.H. (1991). Introduction to hrain topography. New York & London: Plenum Press.
Wong, P.K.H. & Weinberg, H. (1988). Source estimation of scalp EEG focus. In G. Pfurtscheller & F.H. Lopes da Silva (Eds), Functional hrain imauing. Hans Huber.
Woods, D.L. (1990). The physiological basis of selective attention: implication ol'event- realted potential studies. In J.W. Rohrbaugh, R. Parasuraman & R. Johnson, Jr. Event- related brain potentials : Basic issues and applications. Oxford University Press, Oxford, pp 178-209.
Woodworth, R.S. & Schlosberg, H. (1954). Experimental psychology. Methuen.
Wright, P. (1992). Food for thought. The Psychologist. 15, 9, 400-402.
Wurtman, J.J. (1986). Managing vour mind and mood throutth food. New York: Rawson.
Wurtman, R.J., Hefli, F. & Melamed, E. (1981). Precursor control of neurotransmitter synthesis. PharmocoloL'ical Review. 32, 315-335.
Wysocki, C.J. & Gilbert, A.N. (1989). National Geographic smell survey: effects of agre are heterogeneous. Annals of the New York Academy of Sciences, 561. 12-28.
Yingling, C.D. (1980). Cognition, action and mechanisms of EEG asymmetry. In G. Pfurtscheller et al (Eds), Rhythmic EEG activities and cortical functioninu. Elsevier/North Holland Biomedical Press.
Yousem, D.M., Turner, W.J.D., Cheng, L., Snyder, P.J. & Doty, R.L. (1993). Kallmann syndrome: MR evaluation of olfactory system. American Journal of Ncuroradiologv. 14, 8.39-84.3.
Yuwiler, A., Brammer, G.L., Motley, J.E., Raleigh, M.J., Flannery, J.W. & Geller, E. (1981). Short-term and repetitive administration of oral tryptophan in normal men. Archives of General Psychiatry. .38, 619-626.

282
Zatorre, R. J. & Jones-Gotman, M. (1991). Human oll’aclory discrimination after unilateral frontal or temporal lobectomy. Brain. 114, 71-84.
Zatorre, R.J., Jones-Gotman, M., Evans, A.C. & Meyer, E. (1992). Functional localization and lateralization of human olfactory cortex. Nature. 360, 339-340.
Zellner, D.A. (1991). How foods gel to be liked: Some general mechanisms and some special cases. In R.C. Bolles (Ed), The hcdonics of taste. Lawrence Erlbaum Associates. USA. 199-217.
Ziem, G.E. & Davidoff, L.L. (1992). Illness from chemical "odours": Is the health significance understood? Archives of Environmental Health. 47. 1,88-91.
Zillmann, D., Baron, R. A., & Tamborini, R. (1981). Social costs of smoking: Effects of tobacco smoke on hostile behaviour. Journal of Applied Social Psychology. 11.6, 548- 561.
Zwaardemaker, H. (1925). L'Odorat. Doin: Paris.

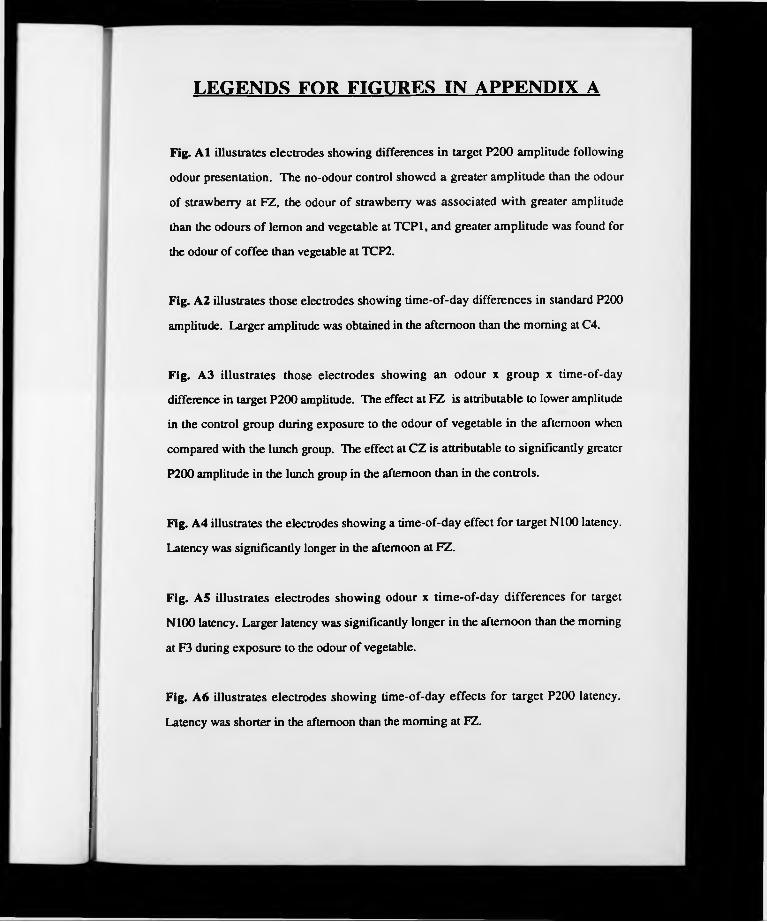
LEGENDS FOR FIGURES IN APPENDIX A
Fig. A1 illu stra tes e lec trodes show ing d ifferences in ta rge t P 200 am plitude follow ing
odour p resen tation . T h e no-odour contro l show ed a g rea ter am p litu d e than the odour
o f straw berry a t F Z , the odour o f straw berry w as assoc ia ted w ith grea ter am plitude
than the odou rs o f lem on and vegetab le at T C P 1, an d grea ter am p litu d e w as found for
the odour o f co ffee than vegetable a t TCP2.
Fig. A2 illu stra tes th o se electrodes show ing tim e-o f-d ay d iffe ren ces in standard P200
am plitude. L arger am plitude w as obtained in the afternoon than th e m orning at C4.
Fig. A3 i l lu s tra te s those e lec tro d e s sho w in g a n o d o u r x g ro u p x tim e-o f-day
difference in ta rg e t P 2 0 0 am plitude. T he effect a t F Z is a ttribu tab le to low er am plitude
in the con tro l g ro u p during exposure to the odou r o f vegetab le in th e afternoon when
com pared w ith the lunch group. T he effect at C Z is a ttribu tab le to significantly greater
P200 am plitude in th e lunch group in the afternoon th an in the con tro ls.
Fig. A4 illu stra tes th e electrodes show ing a tim e-o f-day effec t fo r ta rg e t N 100 latency.
L atency w as s ign ifican tly longer in the afternoon at FZ .
Fig. AS illu s tra te s e lec tro d es sh ow ing odou r x tim e -o f-d ay d iffe ren ce s fo r ta rge t
N 100 latency. L arg er latency w as significantly longer in the afternoon than the m orning
a t F3 during ex p o su re to the odour o f vegetable.
Fig. A6 illu s tra te s e lec tro d es sho w in g tim e-o f-d ay e ffec ts fo r ta rg e t P 200 latency.
L atency w as sho rte r in the afternoon than the m orn ing a t FZ.

Fig. A7 illu s tra te s e lec tro d es sh o w in g tim e-o f-day d iffe ren ce s fo r P 3 0 0 la tency .
L a ten cy was longer in the afternoon than the m orning at F3 an d F4.
Fig. A8 illu s tra te s e lec tro d es sh o w in g ch an g es to odou r in the the ta freq u en cy in
ex p e rim en t 2. S traw berry od o u r w as associa ted w ith sig n ifican tly g rea te r the ta than
sp ea rm in t odour a t F8.
Fig. A 9 illustra tes e lec trodes show ing tim e-o f-day d iffe ren ces in the a lp h a frequency
in ex p e rim en t 2. S ign ifican tly g rea te r a lp h a ac tiv ity w as seen to be genera ted in the
a fte rnoon than the m orning a t PZ.
Fig. A 1 0 illu s tra te s e lec tro d es sh ow ing an e ffec t o f o d o u r in the a lp h a and theta
frequenc ies in experim en t 3. C hocola te odou r w as associated w ith sign ifican tly greater
th e ta activ ity than w as any o the r od o u r a t FZ ; the odour o f ro ttin g m eat w as associated
w ith less theta ac tiv ity w hen com pared w ith a no -odour co n tro l a t T 5. A t 01 and 02,
s ign ifican tly g rea ter alpha w as associated w ith the odour o f choco la te than the odour o f
ro ttin g meat.
Fig. A l l illu s tra te s e lec tro d es sho w in g tim e-o f-day d iffe ren ces in the th e ta , alpha,
b e ta 1 and beta 2 frequenc ies in ex p erim en t 3. A sign ifican t increase in the ta activ ity
w as found in th e a fte rn o o n than in the m orn ing fo r F7 and T 3 . A s ig n ific an t p.m .
d ec rease was found in this w aveband a t FZ . P Z show ed increased alpha ac tiv ity in the
a f te rn o o n . G rea te r beta 2 ac tiv ity w as observed in the a fte rn o o n a t T 3 w hereas less
beta 1 activity w as observed in the afternoon for the sam e electrode.

Fig. A12 illustra tes e lec trodes show ing odou r x tim e-o f-d ay changes in experim en t 3.
S ig n ifican tly less a lp h a ac tiv ity w as associa ted w ith the odour o f choco la te in the
a fte rn o o n than the m orn ing a t FZ. G reater be ta 2 ac tiv ity w as observed for the ho t
w ater stim ulus in the afternoon than the m orning a t C Z .

PA
RIETA
L VER
TEX
RIG
HT

RIG
HT

RIG
HT

INION
RIG
HT

PAR
IETAL VER
TEX
>f<
Oz-4>f<
mX
*1ora*
>en
lHO
ltJ

INIO
N
RIG
HT

1V13
IHV4
**1QTQ
>n )
RIG
HT

RIG
HT

era>ve
RIG
HT

OCCIPITAL
soro’R
IGH
T

RIG
HT

OC
CIPITA
L
•m n 1%> n 9a z o
\ i I ora’
>K>
aox

-APPENDIX B~
Testing materials
B l. Handedness questionnaire.B2. Psychometric odour rating sheets for experiment 1.B3. Psychometric rating sheets for experiment 2.B4. Psychometric odour rating sheets for experiment 3.B5. Odour discrimination test.


DO a m cfl cs 41 m a s s (DmssttflcDaQmQnGrs
Name.......................................................... flge............ Sew
fire any of your immediate relatlues left - handed?.
If so, please indicate their relationship to you (eg.
mother, father,sister)..............................................................
Please indicate y o u r preferences in the use o f the hands in the following activities Py putting ♦ in the appropriate column.Where the preference is so strong that you would never try to use the other hand unless absolutely forced to, put + + . In any case where you are really indifferent, put ♦ in both columns.
Which hand do uou use
. LEFT RIGHT1. To write a letter?
2. To throw a bail at a target?
3. To hold a tennis raquet?
a To hold a match whilst striking it?
5. To cut with scissors?
6. To guide a thread through the eye of a needle?
7. At the top of a broom when sweeping?
S. At the top of a shove! when digging?
9. To deal playing cards?
10. To hammer a nail into wood?
1 1. To hold a toothbrush when using it?
12. To unscrew the lid of a jar?
5 0


ODOUR RATIN G SCA LES
R a t e t h e o d o u r o n t h e f o l l o w i n g s c a l e s b y m a r k i n g
a c r o s s o r a h a t c h m a r k o n t h e s c a l e a t t h e p o i n t
w h i c h c o r r e s p o n d s t o y o u r j u d g e m e n t .
U N FA M IL IA R F A M IL IA R
WEAK STRONG
U N PLEASAN T P L E A S A N T

ODOUR RATING SCALES
R a t e t h e o d o u r o n t h e f o l l o w i n g s c a l e s b y m a r k i n g
a c r o s s o r a h a t c h m a r k o n t h e s c a l e a t t h e p o i n t
w h i c h c o r r e s p o n d s t o y o u r j u d g e m e n t .
P L E A SA N T UNPLEASANT
STRON G WEAK
F A M IL IA R U N FAM ILIA R

e e
ODOUR
PLEASANT NOT AT ALL PLEASANT
WEAE
--------------------------------- 1
STRONG
UNFAMILIAR FAMILIAR
STINGING SOOTHING
ALERTING RELAXING
t—
NOT AT ALL SWEETSWEET
•
NOT AT ALL SAVOURYSAVOURY
\-------------------------------------------------------------------------- Í

to your judgement.
ODOUR..............
NOT AT ALL PLEASANTPLEASANT
l---------------------------------- -------------------------------------—i
STRONG WEAK
FAMILIAR UNFAMILIAR
------ ---------------- ■—|
SOOTHING STINGING
RELAXING ALERTING
SWEET NOT AT ALL SWEET
SAVOURY
1------------------------------------- -
NOT AT ALL SAVOURY

(QIBXDUm IRATTHMGS
PLEASE RATE THE ODOUR ON THE FOLLOWING DIMENSIONS. PLACE A MARK AT THAT POINT WHICH YOU THINK CORRESPONDS TO YOUR JUDGEMENT. TRY AND WORK THROUGH THE ODOURS AS QUICKLY AS POSSIBLE.
PLEASANT
1
NOT AT ALL PLEASANT
1
WEAK|
STRONG_]
FAMILIAR
1
NOT AT ALL FAMILIAR
1
ALERTING1
CALMING1
MAKES ME HAPPY
1
DOES NOT MAKE ME HAPPY
1
MAKES ME HUNGRY
|
DOES NOT MAKE ME HUNGRY
1
WHAT IS THE NAME OF THE ODOUR? ODOUR CODE:
WOULD YOU, ON ANY OCCASION, EAT (OR DRINK) THE FOODEMITTING THIS AROMA?Y E S /N O

(DIBXDUm IRATTIINGS
PLEASE RATE THE ODOUR ON THE FOLLOWING DIMENSIONS. PLACE A MARK AT THAT POINT WHICH YOU THINK CORRESPONDS TO YOUR JUDGEMENT. TRY AND WORK THROUGH THE ODOURS AS QUICKLY AS POSSIBLE.
NOT AT ALL PLEASANTPLEASANT
STRONG WEAK
NOT AT ALL FAMILIARFAMILIAR
CALMING ALERTING
DOES NOT MAKE MAKES MEME HAPPY HAPPY
I_________________________________________________________________ I
DOES NOT MAKE ME HUNGRY
MAKES ME HUNGRY
WHAT IS THE NAME OF THE ODOUR? ODOUR CODE:
WOULD YOU, ON ANY OCCASION, EAT (OR DRINK) THE FOOD EMITTING THIS AROMA?
Y E S /N O

H O W H U N G RY ARE Y O U ?
VERY HUNGRY NOT AT ALL HUNGRYI_________________________________________________________________ I
HOW FULL ARE YOU?
VERY FULL NOT AT ALL FULL

H O W H U N G R Y ARE Y O U ?
NOT AT ALL HUNGRY VERY HUNGRY
HOW FULL ARE YOU?
NOT AT ALL FULL VERY FULL


Odour discrimination test
T h e d isc rim in a tio n te st w as a s im p le , fo rc ed -ch o ic e ta sk re q u ir in g su b je c ts to
d iscrim inate three o d o ran ts from a blank, no -odour con tro l. T he odo ran ts w ere banana
(2 m ic ro litres , 10% in D E P , su p p lied by P P F ), peach (2 m ic ro litre s , H & R ) and
euca lyp tu s (2 m ic ro litre s o f eu ca ly p tu s o il, H & R ) and w ere p resen ted on p e rfu m ers’
strip s kep t in test tu b e bottles. T he no -o d o u r con tro l w as a p erfum er's strip un ta in ted
by any odorant. S ub jec ts w ere instructed to sn iff each strip fo r as long as required and,
after all strips had b e e n sam pled, w ere required to give th e ir ju d g e m e n t T hose subjects
ab le to d istingu ish b e tw een the n o -o d o u r co n tro l and th e odo ran ts w ere a llo w ed to
participate in the E E G experim ents.
-APPENDIX C~
EEG recording eqiupment
Cl. The NeuroscienceBrain Imager Series III model.C2. Waveform decomposition.C3. Experimental conditions.C4. Materials.


The Neuroscience Brain Imager series III model records real-time EEG from 28
channels in five frequencies: delta (l-4Hz), theta (4-8Hz), alpha (8-13Hz), beta 1 (14-
22Hz) and beta 2 (22-30Hz). The 28 electrodes area attached to an elastic cap, to
allow flexibility in covering the subject's scalp, and are arranged according to the 10/20
International Placement System. The imaging system may be used to record real-time
EEG or time/event-locked EEG (ERPs). The mapping system allows the relative shifts
in frequency activity to be monitored via coloured topographical representations of EEG
activity. These colours represent amplitude within a specific frequency. A Fast-
Fourier Transform algorithm analyses and separates the raw EEG waveform in to the
five classical frequencies (as illustrated in Appendix C2). The Imager acquires an
average of 2.56 seconds of activity (epochs or frames) and converts the activity into a
coloured topographical map (as described in section 6.6. of C h ap ter 6). The
voltage from each active electrode is compared with a less active reference (in the
experiments described in Chapters 5-7, linked earlobes were used as references.
There continues to be controversy over the most ideal site for the location of reference
electrodes (see, e.g., Davidson, 1988; Kahn et al, 1988) since most sites of the body
are electrically active (Nunez, 1981). Linked ears, however, have proved to be one of
the more effective noncephalic references since a common reference is provided for
electrodes on both sides of the scalp. It should be noted, however, that no
comprehensive study has explored the relative effectiveness of the various available
electrode reference sites).
The resulting image is a conceptually simple representation of the EEG's scalp-activity
enabling the "clinician to more easily localise the site of any abnormality"
(Neuroscience promotional material). This ability to give simple indicators of gross
brain pathology is one of the primary advantages of the mapping system. However,
for the analysis of more subtle and visually inconspicuous changes in EEG topography

or amplitude, numerical values (amplitude in microvolts) may be obtained on hardcopy
or transfered to an alternative computer store (via its RS-232 port) where more complex
statistical analysis may take place. The Imager has the facility for simple statistical
analysis such as t-tests and is able to create group averages create normative data. For
complex analysis, however, the data are most appropriately analysed using a statistical
package. In the present thesis, SYSTAT Inc. statistical software was used to analyse
the data, off-line.
Storage of the EEG recording may be made on floppy (magnetic) or optical (non
magnetic) disk. The advantage of the optical disk is that data are recorded onto a disk
via laser thus ensuring a greater degree of disk security than normal magnetic disks.
Data (including both EEG waves and brain maps) may be stored in this way and can
not be deleted. However, storage of Evoked Potential data may be made only on non-
optical disks. Magnetic disks may also store the brain maps but not the EEG
waveforms.


C3: Testing conditions:
(i) Subject in low odour room(ii) Odour presentation
(iii) Debriefing


C4: Materials
(i) Imager and electrode equipment (ii) Olfactory testing materials


Appendix C4 (i) kev
1. Imepedance meter.
2. Electro-gel.
3. Chest band for attaching elecrode cap chin straps.
4. Headphones.
5. Occluded goggles.
6. Pipette and pipette nibs (used for dispensing odorants).
7. Syringe for the application of electro-gel.
8. Electrode cap with chin straps.
Ear reference electrodes.9.


Odour presentation and storage
Odours were either presented on perfumers’ strips (seen in the test tubes in the
photograph) or in plastic beakers (also seen). The method of strorage and presentation
was dictated by type of stimulus material. Simple odorants were presented on the
perfumers' strips. Those odorants derived from foodstuffs not available as commercial
odorants were presented in odourless plastic beakers. Stimuli kept in beakers were
sealed until presented to the subject. These were disposed of at the end of each
experimental session. Fresh stimuli were prepared on the morning of each testing
session.

-APPENDIX D~
BatchCommander programme
(c) G. Milligan Department of Psychology
University of Warwick

on OFileglobal OldFile,OText, LoadOK
if OldText is empty then put "Select file for conversion." into OText set lockScreen to true put fileNamefTEXT",OText) into OldFile if OldFile is "Cancel" or OldFile is empty then
put 0 into LoadOK exit OFile
elseput 1 into LoadOK
end ifset lockScreen to false put empty into OText
end OFile
on SFileglobal NewFile.SText,OldFile, SaveOKif SText is empty then put" Name of new File" into STextset lockScreen to trueget NewFileName (stext,"Master Command File") if it is empty or it is "Cancel" or it contains " _f C ' H " then
put 0 into SaveOK exit SFile
elseput 1 into SaveOK
end ifput it into NewFile set lockScreen to false
end SFile
on OpenStack global fileOK, CommandOk hide menubar put 0 into cd fid "totalfile“ put 0 into fileOK put 0 into CommandOk put empty into cd fid "DataFileDisplay" put empty into cd fid "CommandDataDisplay"
end OpenStack
on CloseStack put 0 into cd fid "totalfile"

put 0 into fileOK put 0 into CommandOk put empty into cd fid "DataFileDisplay" put empty into cd fid "CommandDataDisplay" put the UserLevel into user set the UserLevel to 5 DoMenu "Compact Stack" set the UserLevel to user
end CloseStack-- - 1 BackGgrounds
-- BackGground 1
- number of BackG round Fields 0
-- number of BackGround buttons 0
-- Foreground CARD 1
- number of Card Fields 7
-- script of card field "DataFileDisplay" (# 1 )
- script of card field "CommandDataDisplay* (# 2 ) on MouseClick
global CommandDataput cd fid "CommandDataDisplay" into CommandData
end MouseClick-- script of card field id 7 (# 3 )
- script of card field id 8 (# 4 )
-- script of card field id 9 (# 5 )
- script of card field id 13 (# 6 )
- script of card field “totalfile" (# 7 )
~ number of Card Buttons 6
- script of card button "Select Data Files" (# 1 ) on mouseUp
global fileList, fileOk, LoadOK, OldFile

put FullSFPack(M,BINA„,"Select required systat data files") intodump
- CHECK FOR CANCELif dump is empty then exit mouseUp
- CHECK FOR ERRORSif dump = "Error: FulISFPack needs System 7.0" then
~ I EXPECT WE ARE RUNNING SYSTEM 6 RUNNING SYSTEM 6answer file "Select text list of systat files to import"if it is empty then exit MouseUpput it into OldFileput 1 into LoadOK
-- put "Select list of files to import" into OText -- OFile-- if LoadOK <> 1 then exit mouseUp -- put OldFile into filename
- GET LIST OF FILENAMES open file OldFile put empty into dump repeat
read from file OldFile for 16384 if it is empty then exit repeat put it after dump
end repeat close file OldFile
elseif dump = "Error: Missing or empty parameter" or - i dump = "Error: Bad action parameter" then
beepanswer dump & ". Contact Greg Milligan for advice (EMail:
[email protected])." with "Ok" put 0 into fileOk exit mouseUp
end if end if
~ INFO LOOKS OK put dump into fileList

put fileList into cd fid DataFileDisplay if fileList is empty then
put 0 into fileOk put “0" into cd fid “totalfile“
elseput 1 into fileOkput the number of lines of fileList into temp put temp into cd fid "totalfile"
end ifend mouseUp--- script of card button “Select Cmd Template“ (# 2 ) on mouseUp
global OldFile, OText, CommandData, CommandOK,
put “Select command file' into OText
OFile- CHECK FOR CANCEL
if LoadOK = 0 then beepexit mouseUp
end if
put empty into CommandDataput empty into cd fid “CommandDataDisplay“
open file OldFile repeat
read from file OldFile for 16384 if it is empty then exit repeat put it after CommandData
end repeat close file OldFile
put CommandData into cd fid “CommandDataDisplay" if CommandData is empty then
put 0 into CommandOk else
put 1 into CommandOK end if
end mouseUp---- script of card button “Generate Command File“ (# 3 ) on mouseUp
LoadOK

global fileOk, CommandOk, SaveOK, LoadOK global NewFile.SText.OldFile, CommandData, fileList
- UPDATE COMMAND DATA FROM EDITORS WINDOW put cd fid "CommandDataDisplay" into CommandDataif CommandData is empty then
put 0 into CommandOk else
put 1 into CommandOk end if
- ARE WE READY TO GENERATE COMMAND FILE if fileOk <> 1 then
beepanswer "Please select at least one data file to work with via the
'Select Data Files' button." with "Ok" exit to hypercard
end if
if CommandOk <> 1 then beepanswer "Either select a command template to work with, or type
the routine in the command editor window below." with "Ok" exit to hypercard
end if
- RESET VARIABLES put 1 into linecounter put 1 into charcounter put 1 into filecounter
put the number of lines in fileList into maxfileput the number of characters in CommandData into maxchar
- INSURE THAT THE ROUTINE IS TERMINATED WITH A <CR> if character maxchar in CommandData <> return thenput return after CommandData add 1 to maxchar
end if
- ASK USER FOR NAME OF MAC GENERATED COMMAND FILE put "Name new command file" into STextSFileif SaveOK = 0 then

beepexit MouseUp exit to HyperCard
end if
open file NewFile set cursor to busyWrite "SYSTAT" && return to file NewFile
- START CREATING COMMAND FILE repeat for maxfile
set cursor to busy put 1 into charcounterput line filecounter of fileList into OldFileName
- CHECK TO SEE IF WE HAVE ENOUGHT CHARACTORS TO ADD ASUFFIX
put OldFileName into dumpl
- SCAN BACKWARDS FOR COLON (USED IN FULL PATH NAMES) if dumpl contains colon then
put empty into dump2put the number of characters of dumpl into backcounter
- SEARCH FOR START OF REAL FILE NAME FROM FULL PATH NAME repeat for (the number of characters of dumpl)if char backcounter of dumpl is then exit repeat put char backcounter of dumpl before dump2 add -1 to backcounter
end repeat
- FOUND START OF FILE NAME AND APPEND THIS TO NEW FILENAME
put 1 into forwardcounter put empty into dump3 repeat for backcounterput char forwardcounter of dumpl after dump3 add 1 to forwardcounter
end repeat
- CHECK REAL FILENAME FOR GREATER THAN 26 CHARS IN NAME if the number of characters of dump2 > 26 then

put 1 into counter repeat for 26
put char counter of dump2 after dump3 end repeatput dump3 into dumpl
end if
end if
- CREATE SAVE FILENAME WITH SUFFIX put dumpl & “.Covt" into NewFileName
-- START READING COMMAND DATA repeat for maxchar
set cursor to busyif char charcounter of CommandData <> then
put char charcounter of CommandData into temp write temp to file NewFile add 1 to charcounter
else
- SCAN FOR SPECIAL INSTRUCTION put 0 into offset put empty into junk
repeatset cursor to busyif char (charcounter + offset) of CommandData = " " then exit
repeatif char (charcounter + offset) of CommandData = return then
exit repeatif char (charcounter + offset) of CommandData = linefeed then
exit repeatput char (charcounter + offset) of CommandData after junk add 1 to offset
end repeat
-- CONVERT OLD FILE NAME if junk = " @ IMPORTFILENAME" then
write quote & OldFileName & quote to file NewFile add offset to charcounter set cursor to busy
end if

-- CONVERT NEW FILE NAME if junk = *@EXPORTFILENAME" then write quote & NewFileName & quote to file NewFile add offset to charcounter set cursor to busy
end if
~ ADD <CR>if char charcounter of CommandData = return then write return to file NewFile add 1 to charcounter set cursor to busy
end if
if char charcounter of CommandData = linefeed then write return to file NewFile add 1 to charcounter set cursor to busy
end if
- HEY GUYS THIS IS WHERE YOU CAN INSTALL NEW COMMANDS /LABELS
~ INTO BATCH COMMANDER.
- FOR EXAMPLE- TO SET A VARIABLE 'SUBJ' IN EACH DATA FILE.
-- if junk = -@SUBJ* then-- write quote & "LET SUBJ = ' & SUBJECTNAME & quote &
return to file NewFile- add offset to charcounter -- set cursor to busy- end if
- OF COURSE YOU WILL NEED TO IMPORT THE SUBJECT NAME AND- STORE IT IN THE VARIABLE 'SUBJECTNAME1.
- HEY....WHAT DO YOU WANT BLOOD ? HAHA......
-- PS CHECK OUT OFILE AND SFILE SCRIPTS AT STACK LEVEL

- STANDBY DUMB IDEA FOLLOWS
- HEY YOU COULD EVEN PROGRAM HYPERCARD TO BUILD A COMMAND FILE
- AND LAUNCH SYSTAT WITH THE COMPLETED COMMAND FILE. HOPEFULLY ?
- (SUBMITING IS NOT THE SAME AS OPENING !)
- WHEN SYSTAT FINISHES, COMMAND FILE INSTRUCTS SYSTAT TOQUIT,
- CONTROL RETURNS TO HYPERCARD, THEN HYPERCARD USES A SHUTDOWN XCMD WHEN QUITING
- TO SWITCH MAC OFF. AND THERE YOU HAVE IT MIDNIGHT BATCH PROCESSING !
end ifend repeat
- RESET FOR NEXT DATA FILE set cursor to busy add 1 to filecounter put 1 into charcounter write return & return to file NewFile
end repeat
- TIDY UP AND GO HOME if hilite of cd btn id 16 is true then write "QUIT" & return to file NewFile
end if
close file NewFile set cursor to hand beep
end mouseUp—- script of card button "Quit" (# 4 ) on mouseUp
DoMenu "Quit HyperCard" end mouseUp—- script of card button "On-Line Help" (# 5 ) on mouseUp

go cd "Help" end mousellp---- script of card button "Quit Systat After running command file" (# 6
— Foreground CARD 2
-- number of Card Fields 2
-- script of card field id 3 (# 1 )
— script of card field id 5 (# 2 )
-- number of Card Buttons 1
- script of card button "Return" (# 1 ) on mouseUp
go cd "Main" end mouseUp-


Various studies have postulated a role for epidcrmally secreted semiochemicals and scents
emitted by the sex glands in faciliatating communication (and especially sexual
communcication) in human species (Kloek, 1961; McClintock, 1971; Comfort, 1974;
Berliner, Jennings-White and Lavker, 1991). The primary candidate for this human
"pheromone" has been the steroid androstenone (and its alcohol form, androstenol), a pig-
pheromone which incites lordosis in sows thus enabling the insemination of the animal
(Melrose, Reed and Petersen, 1971; see Vandenbergh, 1983 for review). The findings
from human studies, however, are highly inconclusive. Kirk-Smith, Booth, Carroll and
Davies (1978) report that both men and women rated photographs of women as sexier and
more attractive in the presence of androstenol than did those in a control group, concluding
that this finding was "the first clear characterization of an effect of a naturally secreted pure
odour on measurements of sexual relationships among human subjects." Other similar but
idiosyncratic effects have also been found (Kirk-Smith and Booth, 1980; Cowley,
Johnstone and Brooksbank, 1977; Cowley, Harvey, Johnstone and Brooksbank, 1980;
Filsinger, Braun, Monte and Linder, 1984; Filsinger, Braun and Monte. 1986; Cowley
and Brooksbank, 1991). Morris and Udry (1978), Black and Biron (1982), Benton
(1982) and Gustavson, Damon and Bonnett (1987), however, report negative findings.
The majority of these experiments tend to expose subjects to volatile chemicals in contexts
which are not generally appropriate using measures which are not designed to enhance
ecological validity (cf. Kirk-Smith and Booth, 1980; Cowley et a! 1977; 1979). For
example, subjects have rated imaginary verbal descriptions of people (Cowley et al, 1979;
Filsinger et al, 1984), pictures and slides of buildings, people and animals (Kirk-Smith and
Booth, 1977; Kirk-Smith et al, 1978), worn masks impregnated with an odour (Cowley et
al, 1980) or a necklace with the odour (Cowley and Brooksbank, 1991), worn the odour
on the top lip (Benton, 1982), chosen to sit on a chair (Kirk-Smith and Booth, 1980),
The behavioural effects o f semiochemicals in humans: an overview.

used a doctored changing room cubicle (Gustavson et al, 1987) or indicated the number of
sexual partners they have recently had (Filsinger and Monte, 1986). Black and Biron
(1982), who required subjects to interact with a confederate of the opposite sex who wore
either androstenone or exaltolide reported no effect of these chemicals on the rated
attractiveness of the confederate.
The methodological limitations of these studies are considerable and obvious.
Investigations have used same sex subjects, used no additional experimental odours and
failed to take into account whether the odour was detected by subjects. If one were to
support the hypothesis that social and sexual behaviour may be altered or precipitated by
the presence of androstenone, the context in which testing takes place would have to have
some degree of ecological validity. The odour would, therefore, need to be ambient and/or
emitted by the individual. Individuals in the experiments would also need to interact.
Black and Biron, whose study fulfilled these criteria, demonstrated no effect of
semiochemistry on behaviour. This finding is not altogether surprising. As Filsinger et al
(1986) argue, it is not merely olfactory stimulation which may affect 'sexual' behaviour
but a panoply of sensory stimulators (visual, auditory, tactile and even gustatory) any of
which may have additive or synergistic effects. Thus some combination of visual and
olfactory stimulation may be needed in order to elicit a pheromonal response. The odour
may not, therefore, in this context, be described as "pheromonal" since it does not of itself
elicit a stereotypical behavioural response. It thus appears unlikely that semiochemical
odours influence sexual behaviour and affective judgements in a replicable and context-
appropriate fashion (Hassett, 1978; Rogel, 1979; Doty, 1981; Filsinger and Fabes, 1985;
Schaal and Porter, 1991). As Cain (1978) noted: "Insofar as odor has generally played a
part in the initial selection of a mate, it is perfume, rather than body odor, that must take the
credit" (p. 203).

R eferen ces
Benton, D. 91982). The influence of andtrostenol- a putative human pheromone-on mood
throughout the menstrual cycle. Biological Psychology. 15,249-256.
Berliner, D.L., Jennings-White, C. & Lavker, R.M. (1991). The human skin: Fragrances
and pheromones. Journal of Steroid Biochemistry and Molecular Biology. 39. 4B. 671-
679.
Black, S.L. & Biron, C. 91982). Androstenol as a human pheromone: no effect on
perceived physical attractiveness. Behavioural and Neural Biology. 34, 326-330.
Cain, W.S. (1978). History of research on smell. In E.C. Carterette and M.P. Friedman
(eds). Handbook of perception 6a: tasting and smelling. Academic Press: Nyew York,
London, pp. 197-229.
Comfort, A. (1974). The likelihood of human pheromones. In H.C. Birch (ed).
Pheromones. North Holland, pp. 386-396.
Cowley, J.J. & Brooksbank, B.W.L. (1991). Human exposure to putative pheromones
and changes in aspects of social behaviour. Journal of Steroid Biochemistry and Molecular
Biology. 39, 4B, 647-659.
Cowley, J.J., Harvey, F., Johnson, A.T. & Brooksbank, B.W.L. (1980). Irritability and
depression during the menstrual cycle-possible role for an exogenous pheromone? Irish
Journal of Psychology. 3, 143-156.

Cowley, J.J., Johnson, A.L. & Brooksbank, B.W.L. (1977). The effect of two odorous
compounds on performance in an assessment-of-people test. Psvchoneuroendochrinologv.
2, 159-172.
Doty, R.L. (1981). Olfactory communication in humans. Chemical Senses. 6. 351-376.
Filsinger, E.E., Braun, J.J., & Monte, W.C. (1985). An examination of the effects of
putative pheromones on human judgements. Ethology and Sociohiologv. 6, 227-236.
Filsinger, E.E., Braun, J.J., Monte, W.C. & Linder, D.E. (1984). Human (homo
sapiens) responses to the pig (sus scrofa) sex pheromone 5 alpha-androst-16-en-3-one.
Journal of Comnarative Psychology. 98, 2, 219-222.
Filsinger, E.E. & Fabes, R.A. (1985). Odor communication, pheromones and human
families. Journal of Marriage and the Family, may, 349-359.
Filsinger, E.E. & Monte, W.C. 91986). Sex history, menstrual cycle and psychophysical
ratings of alpha androstenone: A possible human sex pheromone. The Journal of Sex
Bss&aish. 22, 2, 243-248.
Gustavson, A.R., Dawson, M.E. & Bonett, D.G. (1987). Androstenol, a putative human
pheromone, affects human (homo sapiens) male choice performance. Journal of
Comparative Psychology. 101, 2, 210-212.
Kirk-Smith, M. & Booth, D.A. (1977). Effects of androstenol on sexual and other social
attitudes. In J. leMagnen & P. Macleod (eds). Olfaction and taste. Vol 6. IRL
Press:London

Kirk-Smith, M. & Booth, D.A. (1980). Effects of androstenone on choice of location in
others' presence. In H. Van Der Starrre (ed). Olfaction and taste, vol 7. IRL
Press:London, pp. 397-400.
Kirk-Smith, M., Booth, D.A., Carroll, D. & Davies, P. 91978). Human social attitudes
affected by androstenol. Research and Communications in Psychology. Psychiatry and
Behaviour. 3, 379-384.
Kloek, J. (1961). The smell of some steroid sex hormones and their metabolites:
Reflections and experiments concerning the significance od smell for the mutual relation of
the sexes. Psvchiatria. Neurologia & Ncurochiruritia. 64, 309-344.
McClintock, M. (1971). Menstrual synchrony and suppression. Nature. 229, 244-245.
Melrose, D.R., Reed, H.C.B. & Patterson, R.L.S. (1971). Androgen steroids associated
with boar odour as an aid to the detection of oestrus in pig artificial insemination. British
Vetinary Journal. 127,497-502.
Morris, N.M. & Udry, J.R. (1978). Pheromonal influences on human sexual behaviour:
An experimental search. Journal of Biosocial Science. 10, 147-157.
Rogel, M.J. 91978). A critical evaluation of the possibility of higher primate reproductive
and sexual pheromones. Psychological Bulletin. 85, 4, 810-830.
Schaal, B. & Porter, R. H. (1991). "Microsmatic humans" revisited: The generation and
perception of chemical signals. Advances in the Study of Behaviour. 20. 815-826.


1. Odour and ill-health: Introduction
A number of recent popular publications have described the ways in which the perception
of specific odours is associated with beneficial effects on health and with the enhancement
of well-being (e.g., Valnet, 1980; Tisserand, 1988; Worwood, 1990). Much of this
popularisation has been attributed to so-called aromatherapy and its claims to alleviate
illness by exposure to odour (in conjunction with other methods) (Martin, 1992; Warren &
Warrenburg, 1993). This practice, normally regarded as a fringe interest undertaken by
those with little or no scientific or medical training, has received little consideration from
the established medical sciences. In view of the lack of experimental rigour which is
characteristic of aromatherapy, this neglect is not unexpected. Recent studies in olfactory
psychology, however, have focused on the ways in which odour affects aspects of human
behaviour such as mood, cognition, memory, person perception and psychophysiology
and have suggested a re-appraisal of this unorthodox approach to the mitigation of physical
and mental health problems.
It is important at the beginning to distinguish two separate, although not autonomous, areas
of activity which co-exist beneath the umbrella of "olfactory remediation". The first is that
commonly known as aromatherapy. This area is largely business-driven and does not rely
heavily on scientific method. Its practitioners are not normally trained doctors, biochemists
or psychologists but are self-trained, interested individuals. The claims made by this area
are largely founded on folklore and anecdote. The other area is largely science-driven.
Here olfactory stimulation is used as a means of alleviating particular ailments or to induce
a particular affective state in a clinical or scientific setting. There are much stricter, tighter
controls on the conduct of such a study and these endeavours are not normally considered
to be part of aromatherapy but as contributions to psychology or medicine. The former
practice will be discussed in a later section. The latter will concern the remainder of this
section.
Studies demonstrating the beneficial effects of odour on illness have been few. Early,
intelligent reports were anecdotal. Montaigne (1580), for example, noted that odours
caused in him "an alteration in me and work upon my spirits". Watson (1871) suggested
the use of aromatic fumes for the treatment of mental disorders. Neither observation,
however, precipitated a deluge of experimental research into these idiosyncratic effects.
Rovesti (1973), in one of the few and slender reports of its kind, credited bergamot, lime,
citrus, jasmine and ylang ylang with alleviating depression but in common with many other
studies of the type, it refers primarily to diverting anecdotes and gives no detail of
experimentation. Most other early studies reported behaviour-changing effects of olfactory
stimulation in frogs, rats and freshly cultivated bacteria (Binz, 1879; Pouchet & Chevalier,
1903; Mayer, 1886; Macht & Ting, 1921; Macht & Kunkel; 1920).
The association between foul odours and ill-health are common. The existence of an
association between a "bad" odour and bad health has been illustrated by Cain (1978) who
cites the example of unpleasant odours arising from poor sanitary conditions as fostering
such an association. Other examples might include the odour of rotting food, which acts as
an effective caveat, warning of the potentially fatal danger of ingestion (Hines, 1977-8;
Rozin & Vollmecke, 1986). Certain illnesses are also characterised by the emissions of
distinctive, obnoxious odours (Liddell, 1976; Mace, Goodman, Centerwall & Chinnock,
1976; Doty, 1981). Phenylketenuria, a metabolic disorder of amino acid metabolism, is
associated with a musty, mousy odour; diabetes mellitus is characterised by acetone on the
patient's breath; Oasthouse urine disease is associated with yeast-like odour. Cain (1978)
suggests that the converse hypothesis -that a strong association exists between pleasant
odours and health benefits- is unlikely. There have been examples in which exposure to

odour has been shown to be associated with beneficial alterations in mood (Baron, 1990;
Knasko & Gilbert, 1990; for a discussion of the non-health associations between odour
and behaviour, see Martin, 1994) although there are a small number of other studies which
have shown apparent alleviation of illness or an undesirable behaviour as a result of the
administration of odour. These studies, however, have several shortcomings in their
methodology and interpretation of results and will be considered below.
Ionasescu (1961), in one case of temporal lobe epilepsy, reported an inhibition of seizures
by unpleasant odours or a precipitation by a pleasant one. Gowers (1881) observed that
epileptic attacks could sometimes be arrested by a strong olfactory stimulus or by the
application of ammonia. Passouant (1965) observed that odours may not only precipitate a
seizure but may also prevent it. Efron (1956) reported that in one case of Jacksonian
epilepsy, fits could be suppressed by the presentation of hydrogen sulphide and
dimercaprol. There was no decrease in the frequency of seizures but depersonalization and
the actual seizures ceased. Rood (1959), one of the first therapists to explore the potential
of sensory stimulation in therapy, claimed a primitive form of response in a polio patient
exposed to vinegar. Fox (1965) found that olfactory stimulation by peppermint oil
temporarily improved tactile function in 10 congenitally blind children. Kaada (1951)
reported that muscle tone or movement may be inhibited by olfactory stimulation although
Schwartz (1979) found that only a small percentage (approximately 10%) of muscle
movement records was affected by inhalation of ammonia and peppermint oil. Blood
pressure has also been reported to increase in response to irritating odours (Allen, 1929;
Yamamoto and Iwana 1961) and Ottoson (1963) reported that olfactory stimulation
produced alterations in blood sugar level.
Baumeister and Baumeister (1978) reports that in two retarded young girls who engaged in
repetitive self-injurous behaviour, ammonia produced rapid and durable suppression of
violence. A similar result was reported by Tanner and Zeiler (1975) in the treatment of a
self-injurous 20 year old autistic female. The effect of the use of chemicals in these later
studies is almost certainly, however, the result of stimulation of the trigeminus and not
primarily the olfactory nerve.
King (1983, 1988) recently reported a method of anxiety-alleviating therapy which
combines traditional relaxation therapy, imagery instructions and the presentation of a
scene-appropriate fragrance and claimed that this method may reduce anxious tension. No
statistical analysis was provided to support this conclusion and the method was only
employed with a small number of highly anxious subjects with no control group. A further
complication is that there is difficulty in partialling out the effects of the various
components of the therapy. The respective contributions of each element of the therapy is
unknown and unquantified. It may not be the odour which alleviates anxiety, therefore,
but some other component of the treatment. A second and third experimental group-one
employing traditional relaxation therapy and the other an odour only would help establish
the relative contribution each component makes to anxiety treatment.
Schiffman and Siebert (1991), drawing on unpublished data, report that a behaviour
technique which teaches patients to associate an odour (apricot) with a state of relaxation
resulted in self-reports of relaxation when the odour alone was presented. Interestingly,
early systematic desensitization studies sometimes employed food odour as the conditioned
stimulus. Foreyt and Kennedy (1971) treated overweight patients by pairing unpleasant
smells with the patient's favourite food. After nine weeks of conditioning, the
experimental group showed a weight loss of over 13 pounds in comparison to 11 pounds
for controls. At 48 weeks, the sample had lost 91 pounds whereas the controls had gained
11 pounds. A recent report has suggested similar weight reduction occurring with
inhalation of 2-acetylpyridine (Hirsch, 1993). Schiffman (1992) also reports that

alleviation of depressive moods was effected by inhalation of food and fruit odours from
bottles and when these odours were pumped surreptitiously into patients' rooms although
no details of methodology of statistical analysis are provided.
A similar finding to that of Schiffman and Siebert has been reported by Mann and Redde
(1991) who found that patients undergoing a CAT scan in the presence of heliotropin -a
vanilla-like scent- reported 63% less overall anxiety than patients exposed to no odour.
However, these results are also similarly unpublished and statistical analyses are absent.
It would be interesting to discover whether the valence of an odour produces these effects
and whether the odour is simply a distraction and not an anxiety-alleviative as such. The
odour may not directly reduce anxiety via relaxation, association, direct limbic link or
biochemical alteration but may be a fragrant curio which displaces attention from scanning
to smelling. It is a strong possibility that the pleasantness of the odour is a potent
mediating variable.
2. A rom atherapy.
Aromatherapy has a long history. The therapeutic use of odour via fumigation has been
reported in many ancient civilisations. The ancient Babylonians, 15(H) B.C., used the
odour of frankincense to exorcise demons (Roebuck, 1988). The use of frankincense to
heighten religious experience has been reported for centuries. The odours of various plants
and animals are common folkloric elements in warding off demons and illness (Mackenzie,
1886). Medieval attrihutions for some odours included chronic disease, convulsions,
abortion and death (Cain, 1978) whereas the 16th, 17th and 18th centuries saw the use of
odorous pomanders and vinaigrettes as stimulants and antiseptics (Roebuck, 1988). The
scientific developments of the nineteenth century, however, were critical in establishing that
disease was not contracted hy volatile particles transmitted via the air but by direct contact
(Corbin, 1986).

Aromatherapy was first explicitly described in the 1920s by Gattefosse who suggested the
use of essential oils for medicinal purposes (Gattefosse, 1928). Its modern incarnation has
been described as "the therapeutic use of volatiles to cure or to mitigate or to prevent
diseases, infections and indispositions only by means of inhalation." (Buchbauer, 1990)
which, in view of a great deal of modem practice, is a rigid and narrow definition since a
number of publications suggest not only the use of inhalation as a means of mitigation but
also the use of other "therapies" such as massage, the common concomitant of inhalation
(Tisserand, 1988).
A considerable problem associated with these reports is objectivity. Frequently, studies are
conducted with no objective measurement, no follow-up and no alternative treatment
programmes (including placebo) with which to compare the effects of the experimental
variable. One recent study has attempted to establish more objective criteria for the
assessment and application of odour by conducting interviews, instructing subjects when
and where to inhale the odour (incense) and using a medical index. Its results, however,
were highly variable with treatment being highly effective in only 23% of cases
(Hasegawa, 1978; cited in Takagi, 1989).
The methodological difficulties in such treatments are obvious. In a review of the practice
of aromatherapy, Dodd (1988) presents several strong arguments against many of the
claims of its practitioners. Frequently in such sessions there is rarely a follow-up period
whereby the effects of the odour can be assessed. When these effects are assessed, they
are done on the basis of the aromatherapist's observation. The degree of subjectivity
involved in this assessment and the probable influence of "experimenter bias" suggests a
less odorous explanation for the apparent effects observed.

Perhaps a more serious criticism is the failure to carry out a proper "medical" trial which
would establish the genuine therapeutic effects of stimulation by odour. This would entail
not only the follow-up periods undertaken by normal medical trials but also a large sample
(most subjects undergoing aromatherapy are individual cases with varied medical and
psychological histories), a proper description of the ailment for which a cure is sought, the
proper diagnosis of such an ailment and the employment of a placebo, a no-therapy control
and alternative experimental conditions.
Another difficulty, as noted above, is that aromatherapy may include not only inhalation but
other aspects of therapy as well. This varied package of treatment is not unique and is seen
in phobia and anxiety management. It does, however, render the assessment of the
respective contributions of each element to the successful mitigation of the problem
presented, difficult. In this respect, Dodd (1988) argues that the term aromatherapy is, in
fact, a misnomer since the primary form o f "treatment" in aromatherapy is massage with
essential oil. He suggests the less misleading alternative term "osmotherapy". Some
aromatherapists have claimed that therapeutic odour effects are present even without
massage. One, for example, attributes increased levels of relaxation and "lessening of
depression" to aromatherapy and argues that this result cannot be "explained away by the
actual effects of the massage as I ran many test treatments in my Institute with and without
the essential oils and this fact is supported by other colleagues that I have trained.”
(Roebuck, 1988). Whether this author had any objective measurement of the assumed
improvement in well-being is unknown. The anecdotal evidence that is presented is a
common example of the type of evidence considered valid in aromatherapeulic circles. It
would not be acceptable in medical and scientific discourse.
Ignorance of the chemistry of odours is also common. Tisserand (1977), for example,
states that "organic structures like essential oils have a structure which only Mother Nature

can put together. They have a life force which can only be found in living things."
However, as Dodd (1988) suggests, so long as impurities are absent from the sample used
an oil synthesized in a laboratory will be chemically no different from that isolated from a
plant. Further confusion and incomprehension arises over the use of the term essential.
As oils contain secondary primary metabolites and are not essential for the life of living
cells, the use of the term essential is rather inaccurate.
The foregoing argument states that very little scientific credibility can be attributed to an
area of endeavour which has assumed the cachet of medical and scientific credibility.
However, this is not to argue that odour may not precipitate genuine beneficial effects on
mood and well-being. Properly-controlled psychological studies have recently
demonstrated significant effects of odour on mood, social behaviour and cognition (Baron,
1980, 1990; Warm, Dember & Parasuraman, 1991; Knasko & Gilbert, 1990; Knasko,
1992)
3. Odour and bulimia.
A traditional form of eliminating undesirable behaviour in psychiatric cases- specific
paraphilias, certain types of neuroses and even alcoholism- is the employment of a form of
classical conditioning whereby a problem behaviour is reduced by repeatedly pairing it with
an aversive stimulus. The aversive stimulus (the conditioned stimulus in classical
conditioning parlance) is thought to be associated in the patient's mind with the undesirable
behaviour. Since the unwanted stimulus is presented only when the problem behaviour
occurs, the patient learns that if he or she is to avoid this unpleasant stimulation, the
behaviour with which it is paired must be eliminated.
Food aversions also appear to be learned partly in this way. Children and adults, for
example, tend to eat less of a particular flavoured ice-cream if ingestion has been previously

associated with an aversive stimulus such as an emetic, but not of others (Bernstein 1978;
Bernstein and Webster 1980). The bitter taste has a genetic component which insures
against the ingestion of noxious agents: most poisonous flora and fauna contain a quinine
like substance whose taste should dissuade a human organism from ingesting further. The
liking for the bitter and pungent tastes of coffee and chilli is generally acquired via
experience and develops during early adulthood (Zellner, 1991).
Rozin and Fallon (1981) and Fallon and Rozin (1983) suggest that food rejected by
humans on psychological grounds have a predictable taxonomy: for a food to be rejected it
is necessary that it is perceived as being (1) sensorily and affectively unpleasant to taste
(usually those foods for which individuals develop a liking, e.g., black coffee, lima beans);
(2) dangerous (rejection is based on anticipated harm: Examples include poison
mushrooms, carcinogens); (3) disgusting (appearance on hands or in stomach is
objectionable-usually animals or animal products such as faeces, or pork for Jews).
The possibility thus arises that the bingeing characteristic of emotional eating and bulimia
nervosa might be alleviated on the basis of the knowledge of characteristic rejection of
foods in non-bingeing subjects. Emotional eating and bulimia nervosa is characterised by
an attempt at weight loss after binge eating through severe dieting, vomiting or laxative
use. Prevalence estimates range from 2 to 10 percent of the general population (Fairbum &
Cooper, 1983). The weight of the sufferer appears to be irrelevant to the incipience of the
disorder (Mitchell, Pyle & Eckert, 1981) although the bulimic subject is likely to
overestimates the size of her body significantly (Powers, Schulman, Gleghorn & Prange,
1987). One review has characterised the typical bulimic as Caucasian, female, in her mid
twenties, within the normal weight range and binges/purges from once a day to once a
week (Schlesier-Stropp, 1984). The consequences of the bingeing and vomiting are
severe. The effects of vomiting include swollen parotid glands, reduction of tooth enamel

by gastric acid, gastrointestinal disturbances and gastric and rectal irritation. Treatment for
this disorder has included psychotherapy (Fairburn, Jones, Peveler, Hope & O' Connor
1993), antidepressant medication (Pope, Hudson, Jones, Yurgelun-Todd, 1983) and
cognitive-behavioural therapy in which the patient is taught to consume enjoyable foods
without vomiting afterwards (Rosen & Leitenberg, 1982), with, however, variable results.
(1) The treatment proposed here would affect the stimulus precipitating the bingeing and
vomiting directly, namely, the food. There would seem to be little point in pairing the
desired food with an emetic since bulimics in some cases characteristically regurgitate their
food after the binge. One likely possibility might be to contaminate the food (without
harming the subject) eaten by bulimics in order to alter significantly its taste. Chocolates,
fries, milk, sweets may be impregnated with quinine, for example, which should radically
alter the accustomed taste of the preferred foods. Although there is the possibility that
texture and mouth feel also contribute to the choice of the bulimics' food, the variety of
foods ingested suggests that it is their olfactory and gustatory components which primarily
determine their selection. Aversion strength could then be tested against habit strength.
(2) Although the dominant component of food flavour is olfactory, the fact is frequently
overlooked. The use of odour in classical conditioning paradigms in humans has not met
with much evident success presumably because the conditioned stimulus is too weak to
alter the unconditioned response. Interestingly, however, one of the primary responses to
the perception of any odour is hedonic with responses elicited along a pleasantness-
unpleasantness dimension. With food odours, one would imagine that this response would
be considerably marked especially since food odour carries with it quite robust emotional
and affective connotations (usually one of pleasure pre-prandially, displeasure post-
prandially or disgust with certain off-odours or taints). It is plausible that a robust enough
odour-possibly a food odour or an off-odour- would be potent enough to condition an

individual against the ingestion of a food if that particular odour accompanies it. The
Foreyt and Kennedy (1971) example above is a persuasive indicator. Odours in the
repugnant category may include asafoetida (an ingredient in some Indian cooking but
which alone, and to some, is repulsive), rotting vegetables and meat, and hydrogen
sulphide (rotten eggs). It is important to note, however, that one case of bulimia with
anosmia and partial ageusia resulted in little reduction in the bingeing (Fahy, DeSilva,
Silverstone and Russell, 1989). Preference for the texture of food was manifested as was
an increase in sugar and salt added to foods.
(3) It is also highly likely that some stimulation of the trigeminus, implicated in the Tanner
and Zeiler (1975) and Baumeister (1978) studies, might bring a cessation of eating. The
inhalation of ammonia is a potent arouser and can be acutely painful. The stark, reliable
and replicable effects of ammonia, which may inhibit behaviour, could therefore be applied
to inhibit the bingeing bouts characteristic of emotional eating by repeatedly pairing the
stimulus with ingestion. The potency of trigeminal stimulation would suggest that the
contiguity of arousal/pain and eating would be highly associative. The ingestion of food
during bingeing or even the sight of the food to be consumed might therefore set off an
aversive reaction. It may, of course, be possible to condition aversion at an earlier stage-
while the subject images gross food consumption, while the food is presented to her. The
methodologies for these experiments will need to be examined closely.

References
Allen, W. (1929). Effects of various labelled vapours on respiration and blood pressure in anaesthatized and unanaesthatized, sleeping and anosmie subjects. American Journal of Physiology. 1988, 620-632.
Baron, R.A. (1980). Olfaction and human social behaviour: effects of pleasant scents on physical aggression. Basic and Applied Social Psychology. 1, 2, 16.3-172.
Baron, R.A. (1990). Environmentally-induced positive affect: Its impact on self-efficacy, task performance and conflict. Journal of Applied Social Psychology. 20, 5, 368-384.
Baumeister, A.A. and Baumeister, A.A. (1978). Suppression of repetitive self-injurious behaviour by contingent inhalation of aromatic ammonia. Journal of Autism and Childhood Schizophrenia. 8, 1,71-77.
Bernstein, I.L. (1978). Learned taste aversions in children receiving chemotherapy. Science. 200, 1302-03.
Bernstein, I.L. and Webster, M.M. (1980). Learned taste aversions in humans. Physiology and Behaviour. 25, 363-366.
Buchbauer, G. (1990). Aromatherapy: Do essential oils have therapeutic properties? Perfumer and Flavorist. 14,47-50.
Cain, W.S. (1978). History of research on smell. In E.C. Carterette & M. P. Friedman (eds). Handbook of perception. Vol 6a: Tasting and smelling. Academic Press: London.
Dodd, G.H. (1988). The molecular dimension in perfumery. In S. Van Toller & G.H. Dodd (eds). Perfumery: The psychology and biology of fragrance. Chapman Hall: London.
Doty, R.L. (1981). Olfactory communication in humans. Chemical Senses. 6,4, 351 - 376.

Efron, R. (1956). The effect of olfactory stimuli in arresting uncinate fits. Brain. 79, 267- 281.
Fairbum, C. & Cooper, P. (1983). The epidemiology of bulimia nervosa. International Journal of Eating Disorders. 2, 61-67.
Fairburn, C.G., Jones, R., Peveler, R.C., Hope, R.A., & O'Connor, M. (1993). Psychotherapy and bulimia nervosa. Archives of General Psychiatry. 50, 419-428.
Fahy, T.A., DeSilva, P., Silverstonc, P. and Russell, G.F.M. (1989). The effects of loss of taste and smell in a case of anorexia nervosa and bulimia nervosa. British Journal of Psychiatry. 144, 860-861.
Fallon, A.E. and Rozin, P. (1983). The psychological bases of food rejections by humans. Ecology of Food and Nutrition. 13, 15-26.
Focus on Fragrance 11991) Summer edition.
Foreyt, J.P. and Kennedy, W.A. (1971). Treatment of overweight by aversion therapy. Behaviour Research and Therapy. 9, 29-34.
Fox, J. (1965). Improving tactile stimulation of the blind. American Journal of Therapy. 19, 5-7.
Gattefosse, R.M. (1928). Aromatherapie. Girardot editeur: Paris.
Gowers, W.R. (1881). Epilespv and other chronic convulsive diseases. London.
Hirsch, A.R. (1993). Inhalation of 2-acetylpyridine for weight reduction. Chemical Senses. 18, 5, 570.
Ionasescu, V. (1961). The relationship between olfactory and vestibular sensory impulses and temporal epilepsy. Acta Psvchiatrica el Nenrolopica. 36, 415-426.

Kaada, B. (1951). Somato-motor, autonomic and electrocortiographic responses to electrical stimulation of "rhinecephalic" and other structures in primates, cat and dog. Acta Psvcholopiea Scandinavia. 23, Suppl 83, 285.
King, J.R. (1983). Have the scents to relax. World Medicine. 19, 29-31.
King, J.R. (1988). Anxiety reduction using fragrances. In S. Van Toller and G. Dodd (Eds). Perfumery: The psychology and biology of fragrance. London: Chapman, pp. 147- 165.
Knasko, S.C. (1992). Ambient odor's effects on creativity, mood and perceived health. Chemical Senses. 17, 1, 27-35.
Knasko, S.C. & Gilbert, A.N. (1990). Emotional state, physical well-being and performance in the presence of feigned ambient odor. Journal of Applied Social Psychology. 20, 16, 1.345-1357.
Liddell, K. (1976). Smell as a diagnostic marker. Postgraduate Medical Journal. 52, 136- 138.
Mace, J.W., Goodman, S.I., Centerwall, W.R., & Chinnock, R.F. (1976). the child with an unusual odor. Clinical Pediatrics. 15, 1, 57-62.
Martin, G.N. (1992). Smell psychology. PsvPAG Quarterly. 8. 20-21.
Martin, G.N. (1994). Olfactory psychology: a review of the effects of odour on human behaviour (manuscript submitted for publication).
Mitchell, J.E., Pyle, R.L. & Eckert, E.D. (1981). Frequency and duration of hinge-eating episodes in patients with bulimia. American Journal of Psychiatry. 138, 835-836.
Montaigne, M. de (1580/1979). Essays. Harmondsworth: Penguin Books.
Ottoson, D. (1964). Some aspects of the function of the olfactory system. Pharmacological Review. 15, 1-42.

Pope, H.G., Hudson, J.I., Jonas, L„ & Yurgelun-Todd, D. (1983). Bulimia treated with imipramine: A placebo-controlled, double-blind study. American Journal of Psychiatry. 140, 554-558.
Powers, P.S., Schulman, R.G., Gleghom, A.A. & Prange, M.E. (1987). Perceptual and cognitive abormalities in bulimia. American Journal of Psychiatry. 144, 1456-1460.
Roebuck, A. (1988). Aromatherapy: Fact or fiction. Perfumer and Flavorist. 13. 43-45.
Rood, M. (1959). Neurophysiology in the treatment of neuromuscular dysfunction. In C. Moyer and A. Davis (Eds), National Society for Crippled Children and Adults. Chicago.
Rosen, R.C. & Leitenberg, H. (1982). Bulimia nervosa: Treatment with exposure and response prevention. Behaviour Therapy. 13, 117-124.
Rovesti, P. (1973). Aromatherapy and aerosols. Soap. Perfumery and Cosmetics. 46, 475-7.
Rozin, P. and Fallon, A. (1980). Psychological categorization of foods and non-foods: A preliminary taxonomy of food rejections. Appetite. 1, 193-201.
Schiffman, S. (1992). Ageing and the sense of smell: Potential benefits of fragrance enhancement. In S. Van Toller and G. Dodd (eds). Fragrance: The psychology and biology of perfume.
Schlesier-Stropp, B. (1984). Bulimia: a review of the literature. Psychological Bulletin. 95, 247-257.
Schwartz, R.K. (1979). Olfaction and muscle activity: an EMG pilot study. Americal Journal of Occupational Therapy. 33, 185-192.
Tagasaki, S.F. (1989). Human olfaction. Univ. Tokyo Press.
Tanner, B.A. and Zeiler, M. (1975). Punishment of self-injurious behaviour using aromatic ammonia as the aversive stimulus. Journal of Annlied Behaviour Analysis. 8, 53- 57.

Tisserand. R. (1977). The art of aromatherapy. New York: Destiny Books.
Tisserand, R. (1988). Aromatherapy for everyone. Harmondsworth: Penguin Books.
Valnet, J. (1980). Aromathérapie. Librarie Maloine: Paris.
Warm, J.S., Dember, W.N. & Parasuraman, R. (1991). Effects of olfactory stimulation on performance and stress in a visual sustained attention task. Journal of the .Society of Cosmetic Chemists. 42, 2, 199-210.
Warren, C. & Warrenberg, S. (1993). Mood benefits of fragrance. Perfumer and Flavorist. 18, 9-16.
Watson, W.S. (1875). On the therapeutical influence of odours. The Medical Press and Circular. Aug 25, 143-144.
Worwood, V. (1990). The fragrant pharmacy. Macmillan Publishin Co.: London.
Yamamoto, C. and Iwama, K. (1961). Arousal reaction of the olfactory bulb. Japanese Journal of Physiology. 11, 335-345.
Top Related
Copyright © 2022 FDOKUMEN

