


Bahasa
Halaman
Hukum

Sensors 2002, 2, 384-396
sensors ISSN 1424-8220 © 2002 by MDPI
http://www.mdpi.net/sensors Dibenzocyclamnickel(II) as Ionophore in PVC-Matrix for Ni2+-Selective Sensor
Vinod K. Gupta*, Rajendra Prasad and Azad Kumar Department of Chemistry, Indian Institute of Technology, Roorkee, Roorkee -247667, India.
Tel: 91-1332-85801(O), 85043 (R). Fax: 91-1332-3560
* Author to whom correspondence should be addressed. E-mail: [email protected]
Received:10 September 2002 / Accepted:1 October 2002 / Published: 8 October 2002
Abstract: The tetramethyldibenzocyclam derivative, was synthesized and characterized and
was used for fabrication of potentiometric sensor for Ni2+ metal ion. 5,7,8,14-
tetramethyldibenzo[b,i]-1,4,8,11-tetrazacyclotetradecanenickel(II)chloride,
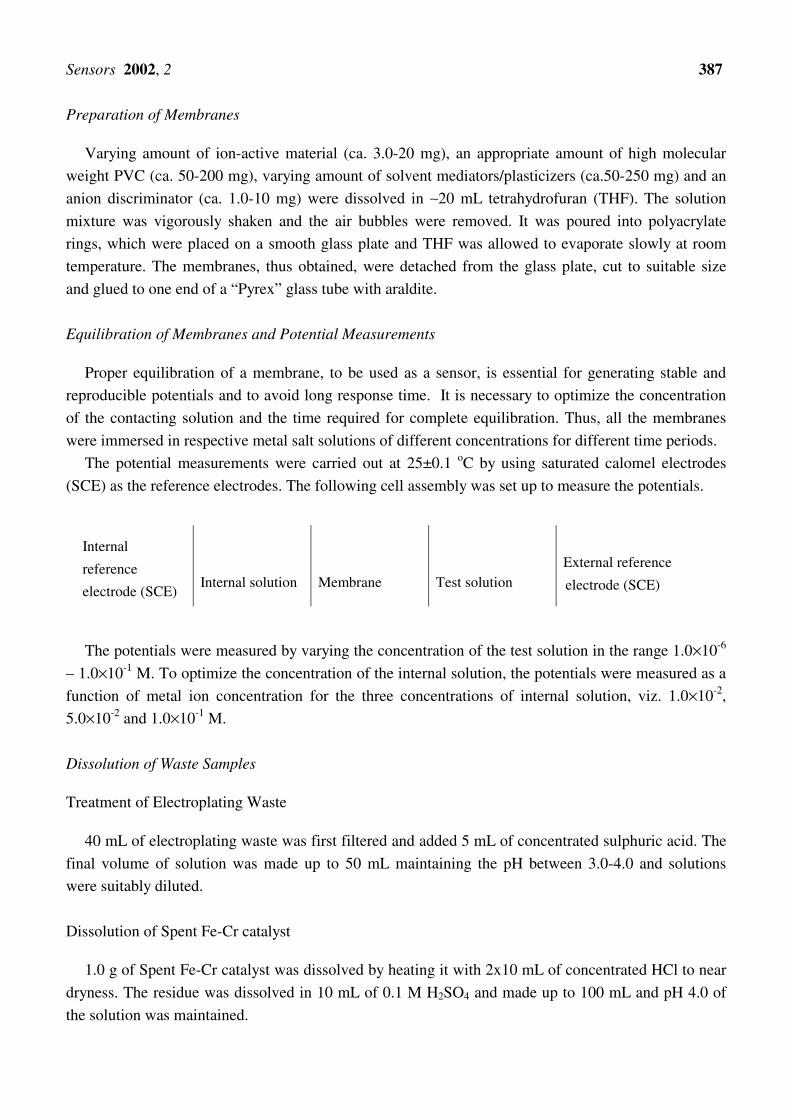
([Ni(Me4Bzo2[14]ane N4)]Cl2) (II) was obtained in good yield as orange red salt by Fe/HCl
reduction of the corresponding tetraazaannulene complex [Ni(Me4Bzo2taa)], (I). Membrane
having [Ni(Me4Bzo2[14]aneN4)]Cl2 (II) as electroactive material, sodium tetraphenylborate
(NaTPB) as an anion discriminator, dibutyl butylphosphonate (DBBP) as plasticizer in PVC
matrix in the percentage ratio 5.0:2.5:200:200 (II:NaTPB:DBBP:PVC)(w/w) exhibits a
linear response to Ni2+ in the concentration range 7.0×10⁻⁶- 1.0×10⁻¹M with a slope of
29.8±0.2 mV/decade of activity and a fast response time of 12s. The sensor works well in
the pH range 2.0-7.6 and can be satisfactorily used in presence of 40% (v/v) methanol,
ethanol or acetone. The sensor is highly selective for Ni2+ over a large number of mono-, bi-
and trivalent cations. The sensor has been successfully used as indicator electrode in the
potentiometric titration of Ni2+ against EDTA. These electrodes can be used to determine
the concentration of Ni2+ in real samples.
Keywords: Dibenzocyclam, Ni2+; Potentiometric Sensor; PVC, Selectivity
Introduction
Nickel is frequently used in catalytic processes and occurs in industrial effluents. It is also present in
low concentration in chocolates, soyabeans, nuts, oatmeal, cottonseed, cornmeal, hydrogenated
vegetable oils, milk and milk products. Dissolved nickel levels in unpolluted fresh waters typically
Sensors 2002, 2 385
range from 0.001 to 0.005 mgL-1 [1]. If nickel concentration exceeds the normal level it may become
potential health hazard. Nickel toxicity can cause acute pneumonitis, dermatitis, asthama, eczema,
cancer of lungs and sinus, stomachaches, adverse effects on blood (increase red blood cells) and
kidneys (increase protein in urine), other disorders of respiratory system and central nervous system.
Availability of highly selective and economic ionophores has opened up the prospect of fabricating
newer/better ion-selective electrode for the determination of nickel.
The cyclam derivatives exhibit very rich coordination chemistry with a variety of transition metal
ions [2,3]. Among these, the planar nickel(II) complexes in particular, due to their remarkable
thermodynamic and kinetic stability, have been used in several catalytic reactions viz. electroreduction
of CO2 [4] and NO2- [5], epoxidation of olefins [6], chemical and electrochemical reduction of alkyl
halides [7], medical diagnosis as contrast media for NMR imaging [8] and in the fabrication of ion-
selective membrane electrodes [9]. The ion-selective electrodes reported for the determination of Ni2+
in literature till date has poor selectivity, narrow concentration range, non-Nernstian response, long
response time and poor reproducibility [10-20]. Contrary to this, the dibenzocyclam macrocycles could
prove to be a better candidate for development of Ni2+ selective electrodes. The γ-carbon atoms in
MR4taa complexes possess remarkable nucleophilicity [21], which can be exploited for binding a
variety of groups in order to build molecular super-structures and supramolecular assemblies [22]. The
R4Bzo2[14]aneN4 type dibenzocyclam derivatives due to their flat geometry are also expected to form
stacks in solid lattices and are also expected to possess good miscibility with the PVC matrix for the
rapid exchange of metal ions [23]. Consequently, they can be used as active material in the membrane
phase to prepare selective electrode for a particular metal ion [24-26]. In this paper, results on the PVC
matrix membrane sensor incorporating ([Ni(Me4Bzo2[14]ane N4)]Cl2) ionophore for the determination
of nickel in aqueous solutions have been presented and discussed.
Experimental
Reagents and Materials
All the reagents were of Analytical Grade and were used as received, unless otherwise stated.
Nickel acetate from Veb lab (Germany); acetylacetone from Sigma (U.S.A.) and o-phenylenediamine,
and Butanol from Loba Chemie (India) were employed. Different solvent mediators/plasticizers such
as chloronaphthalene (CN), and tri-n-butyl phosphate (TBP) were obtained from Merck (Germany),
dibutyl butylphosphonate (DBBP), tri-n-butyl phosphate (DOP) and dibutyl phthalate (DBP) from
Reidel (India). High molecular weight poly(vinyl chloride) (PVC) was obtained from Fluka
(Switzerland) and sodium tetraphenyl borate (NaTPB) from BDH (U.K.) and used as such. AR grade
tetrahydrofuran (THF), nitric acid and sulfuric acid were obtained from E.Merck (India) and sodium
hydroxide from Ranbaxy (India). All the metal salts used were of analytical reagent grade. Solutions
of metal nitrates were prepared in doubly distilled water and were standardized by appropriate
chemical methods. Solutions of different concentration were prepared by diluting the stock solution of
0.1 M concentration.
Sensors 2002, 2 386
Synthesis of [Ni(Me4Bzo2taa)] Complex(I)
This was prepared using template synthesis as given by Chipperfield and Woodwards [27]. 10
mmol (2.547 g) of nickel acetate tetrahydrate and 20 mmol (2.1628 g) of o-phenylene diamine were
placed in a 100 mL round bottom flask equipped with a reflux condensor, 30 cm3 of dry butane-1-ol
was added to it. The solution was refluxed using oil bath and was continuously stirred throughout
using magnetic stirrer. 20 mmol (2.017 cm3) of acetyl acetone was added drop wise during the initial
stages of refluxing. The mixture was subsequently refluxed with continuous stirring for 3 hours. The
solution was cooled to room temperature (ca 25oC), and 30 cm3 of dry methanol was added to it. It was
subsequently cooled in refrigerator overnight. Dark purple microcrystals separated out. They were
collected by filtration. Compound was washed with water followed by methanol twice and dried in air.
Yield: 0.32 g (70%).
Synthesis of [Ni(Me4Bzo2[14]aneN4)]Cl2 Macrocycle (II)
[Ni(Me4Bzo2taa)], (I) (1.0 g, 2.5 mmol) and concentrated HCl (30 cm3) were placed in a two-
necked 100 cm3 round bottom flask. Iron fillings (ca 2.0g) were added and the mixture was gently
warmed at 50-60 oC for 30 min. The solution was stirred and a slow stream of HCl was passed through
it. The initial yellow solution gradually changed to orange-red and, finally, a copious amount of red
solid separated. It was filtered off, washed with concentrated HCl (5 cm3) and the unreacted iron
fillings were removed by extracting the compound with Me2CO. The HCl washing was combined with
the aqueous filtrate, which was evaporated to dryness on a rotatory evaporator. The dry solid was
extracted with Me2CO (3x10cm3) portions. All Me2CO extracts were combined and evaporated to
dryness on a rotatory evaporator, then re-extracted with Me2CO, so as to remove traces of the FeCl2.
The product was purified by passage through a 20x2.5 cm Al2O3 column eluting with 1:1
CHCl3/Me2CO. The initial rapidly moving yellow band was discarded. The main orange-red band,
which moved fairly slowly, was collected and the solvent was removed at reduced pressure. The
residue was recrystallized from MeOH/CHCl3 and was dried over CaCl2. Yield: 0.9 g (75%). [1H
NMR (CDCl3): δ 14.72(br, 4H, NH), 7.47-7.71(d, 8H, C6H6), 2.73(d, 12H, CH3), 2.47(m, 4H, C-H),
1.17(t, 4H, CH2). IR (KBr pellet) 3488m, 3456m (N-H), 2911w (CH3), 1627vs(N-H gr. Bending),
1500w, 1461w, 1400m (C=C,Ph), 750m (δ C-H, Ph), Electronic spectra at λmax 435, 276, 242 nm. ∧M
290 Ω-1 (at 1x10⁻⁴ M in Me2CO). ESI MS observed m/z 410, 412 (M + e)+, calcd. For C22H32N4Ni,
410,412].
Sensors 2002, 2 387
Preparation of Membranes
Varying amount of ion-active material (ca. 3.0-20 mg), an appropriate amount of high molecular
weight PVC (ca. 50-200 mg), varying amount of solvent mediators/plasticizers (ca.50-250 mg) and an
anion discriminator (ca. 1.0-10 mg) were dissolved in ∼20 mL tetrahydrofuran (THF). The solution
mixture was vigorously shaken and the air bubbles were removed. It was poured into polyacrylate
rings, which were placed on a smooth glass plate and THF was allowed to evaporate slowly at room
temperature. The membranes, thus obtained, were detached from the glass plate, cut to suitable size
and glued to one end of a “Pyrex” glass tube with araldite.
Equilibration of Membranes and Potential Measurements
Proper equilibration of a membrane, to be used as a sensor, is essential for generating stable and
reproducible potentials and to avoid long response time. It is necessary to optimize the concentration
of the contacting solution and the time required for complete equilibration. Thus, all the membranes
were immersed in respective metal salt solutions of different concentrations for different time periods.
The potential measurements were carried out at 25±0.1 oC by using saturated calomel electrodes
(SCE) as the reference electrodes. The following cell assembly was set up to measure the potentials.
Internal
reference
electrode (SCE)
Internal solution
Membrane
Test solution
External reference
electrode (SCE)
The potentials were measured by varying the concentration of the test solution in the range 1.0×10⁻⁶
– 1.0×10⁻¹ M. To optimize the concentration of the internal solution, the potentials were measured as a
function of metal ion concentration for the three concentrations of internal solution, viz. 1.0×10⁻²,
5.0×10⁻² and 1.0×10⁻¹ M.
Dissolution of Waste Samples
Treatment of Electroplating Waste
40 mL of electroplating waste was first filtered and added 5 mL of concentrated sulphuric acid. The
final volume of solution was made up to 50 mL maintaining the pH between 3.0-4.0 and solutions
were suitably diluted.
Dissolution of Spent Fe-Cr catalyst
1.0 g of Spent Fe-Cr catalyst was dissolved by heating it with 2x10 mL of concentrated HCl to near
dryness. The residue was dissolved in 10 mL of 0.1 M H2SO4 and made up to 100 mL and pH 4.0 of
the solution was maintained.
Sensors 2002, 2 388
Dissolution of Chocolates Samples
A 10 g chocolate sample was ashed in silica crucible for 4 h on a hot plate and the charred material
was transferred to Muffle furnace for overnight heating at 350 °C. The residue was cooled, treated with
2.0 mL concentrated nitric acid and again kept in furnace for 2 h at the same temperature so that no
carbon traces are left. The final residue was treated with 0.5 mL concentrated hydrochloric acid and 1-
2 mL 70% perchloric acid and evaporated to fumes, so that all the nickel metal change to nickel ions.
The solid residue was dissolved in water, filtered and by keeping the pH at ∼4.0 made up to 25 mL.
The all dissolved solutions were suitably diluted and metals concentration were determined with
Atomic Absorption Spectrophotometer.
Result and Discussion
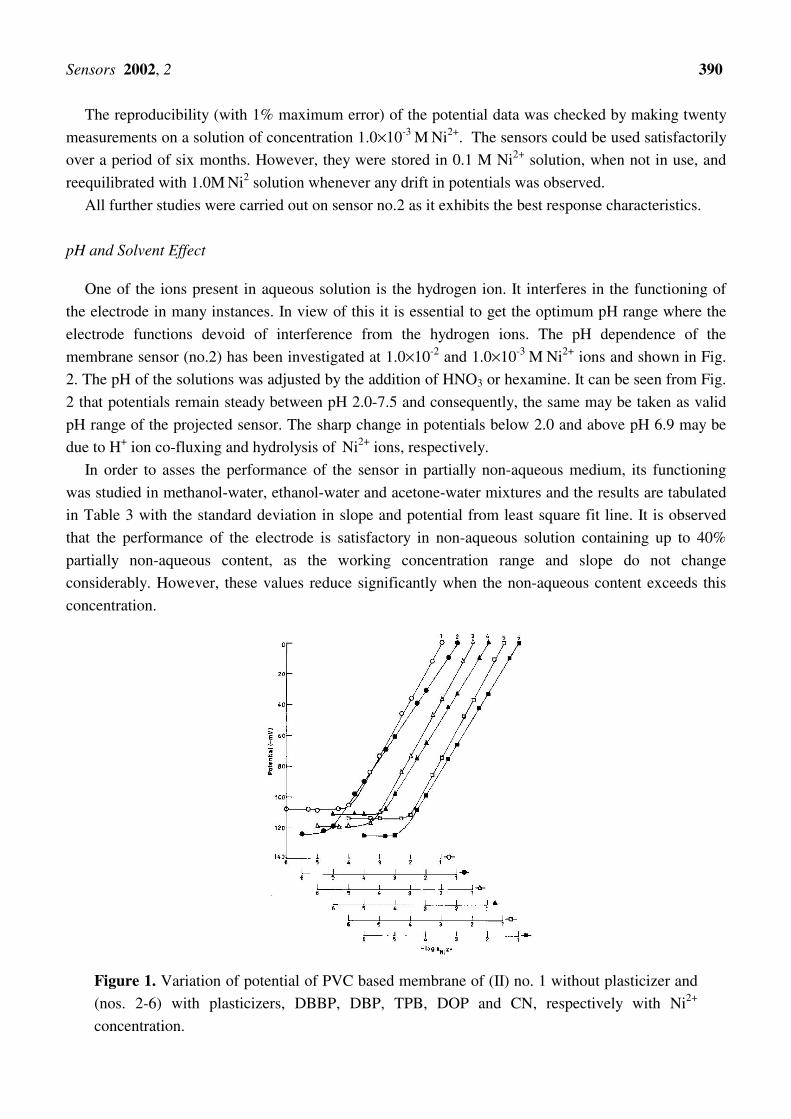
The potential response of all the membranes (numbered 1-6) for Ni2+ ions was studied at 1.0×10⁻¹M
concentration of internal solution and by varying the concentration of the test solution from 1.0×10⁻⁶-
1.0×10⁻¹M. The potentials observed are plotted against the activity of Ni2+ions in Fig.1. The effect of
concentration of the internal solution on the functioning of the membrane sensors was also studied by
measuring the potentials at varying concentration of internal or reference solution viz. 1×10⁻², 5×10⁻²
and 1.0×10⁻¹ M Ni2+. The results showed that the variation of the concentration of the internal solution
do not cause any significant difference in the corresponding potential response, except for an expected
change in the intercept of the resulting Nernstian plots. The potential generated showed opposite sign
when the concentration of the test solution became more than that of the reference solution. Since the
upper limit of the concentration of the test solution was 1.0×10⁻¹ M, the concentration of the internal
solution was, therefore, chosen as 1.0×10⁻¹ M for the sake of convenience.
The working concentration ranges with slopes of the least square fit line and standard deviation in
the observed values of potential from this line for all membranes are given in Table 1. It has been
observed that the membrane no.1 without plasticizer exhibits a narrow working concentration range of
1.12×10⁻⁴ – 1.0×10⁻¹ M with a non-Nernstian slope of 34.9±0.5 mV/decade of activity with standard
deviation of 2.78 mV in potential. The characteristics of the membrane improved, especially the
working concentration range and slope, by the addition of anion discriminator (NaTPB) and solvent
mediators (DBBP, DBP, TBP, DOP or CN) (Table 1). Further, the best performance is exhibited by
membrane no. 2 incorporating DBBP as solvent mediator, which works well over a wide concentration
range (7.08×10⁻⁶ – 1.0×10⁻¹ M) with a Nernstian slope (29.8±0.2 mV/decade of activity). The
composition of this membrane is 5.0:2.5:200:200 (II:NaTPB:DBBP:PVC). This membrane gives
standard deviation of 1.4 mV in potentials from the least square fit line and excellent consistency in
slope with 90% confidence limit lying within ±0.2 mV/decade of activity. A comparative data for the
sensors presented in this paper with those reported in literature is summarized in Table 2.
Response and Life Time
The response time i.e., the time required by the electrode assembly to generate stable, noiseless and
reproducible potentials is 40s for the sensor (no. 1) fabricated without any solvent mediator (Table 1).
Sensors 2002, 2 389
This is not desirable as it makes the electrode unfit in applications like on-line monitoring. However,
the addition of solvent mediators improves the response time, as observed for membranes 2-6. It can
be seen from Table 1 that best performance, with regard to response time, is given by sensor no.2
containing DBBP as the plasticizer as it shows a fast response time of 12s as compared to the rest of
the sensors.
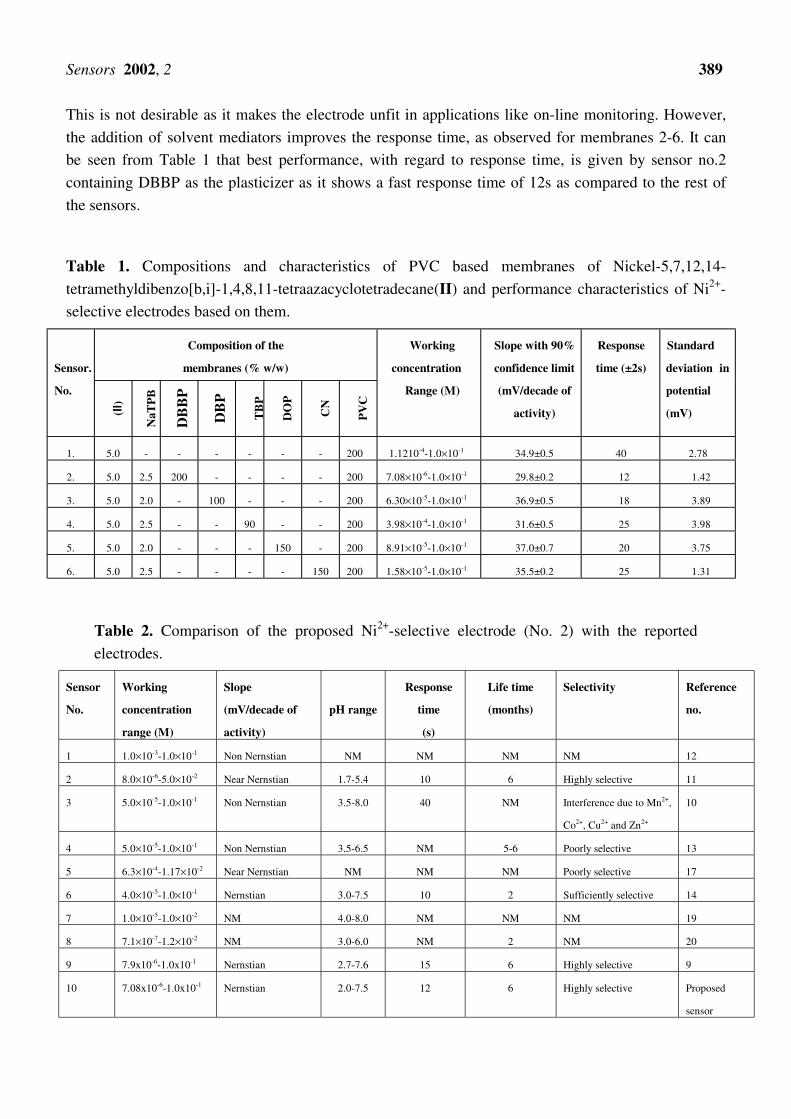
Table 1. Compositions and characteristics of PVC based membranes of Nickel-5,7,12,14-
tetramethyldibenzo[b,i]-1,4,8,11-tetraazacyclotetradecane(II) and performance characteristics of Ni2+-
selective electrodes based on them.
Composition of the
membranes (% w/w)
Sensor.
No.
(II )
NaT
PB
DB
BP
DB
P
TB
P
DO
P
CN
PV
C
Working
concentration
Range (M)
Slope with 90%
confidence limit
(mV/decade of
activity)
Response
time (±2s)
Standard
deviation in
potential
(mV)
1. 5.0 - - - - - - 200 1.1210-4-1.0×10⁻¹
34.9±0.5 40 2.78
2. 5.0 2.5 200 - - - - 200 7.08×10⁻⁶-1.0×10⁻¹ 29.8±0.2 12 1.42
3. 5.0 2.0 - 100 - - - 200 6.30×10⁻⁵-1.0×10⁻¹ 36.9±0.5 18 3.89
4. 5.0 2.5 - - 90 - - 200 3.98×10⁻⁴-1.0×10⁻¹ 31.6±0.5 25 3.98
5. 5.0 2.0 - - - 150 - 200 8.91×10⁻⁵-1.0×10⁻¹ 37.0±0.7 20 3.75
6. 5.0 2.5 - - - - 150 200 1.58×10⁻⁵-1.0×10⁻¹ 35.5±0.2 25 1.31
Table 2. Comparison of the proposed Ni2+-selective electrode (No. 2) with the reported
electrodes.
Sensor
No.
Working
concentration
range (M)
Slope
(mV/decade of
activity)
pH range
Response
time
(s)
Life time
(months)
Selectivity Reference
no.
1 1.0×10⁻³-1.0×10⁻¹ Non Nernstian NM NM NM NM 12
2 8.0×10⁻⁶-5.0×10⁻² Near Nernstian 1.7-5.4 10 6 Highly selective 11
3 5.0×10⁻⁵-1.0×10⁻¹ Non Nernstian 3.5-8.0 40 NM Interference due to Mn2+,
Co2+, Cu2+ and Zn2+
10
4 5.0×10⁻⁵-1.0×10⁻¹ Non Nernstian 3.5-6.5 NM 5-6 Poorly selective 13
5 6.3×10⁻⁴-1.17×10⁻² Near Nernstian NM NM NM Poorly selective 17
6 4.0×10⁻⁵-1.0×10⁻¹ Nernstian 3.0-7.5 10 2 Sufficiently selective 14
7 1.0×10⁻⁵-1.0×10⁻² NM 4.0-8.0 NM NM NM 19
8 7.1×10⁻⁷-1.2×10⁻² NM 3.0-6.0 NM 2 NM 20
9 7.9x10⁻⁶-1.0x10⁻¹ Nernstian 2.7-7.6 15 6 Highly selective 9
10 7.08x10⁻⁶-1.0x10⁻¹ Nernstian 2.0-7.5 12 6 Highly selective Proposed
sensor
Sensors 2002, 2 390
The reproducibility (with 1% maximum error) of the potential data was checked by making twenty
measurements on a solution of concentration 1.0×10⁻³ M Ni2+. The sensors could be used satisfactorily
over a period of six months. However, they were stored in 0.1 M Ni2+ solution, when not in use, and
reequilibrated with 1.0M Ni2 solution whenever any drift in potentials was observed.
All further studies were carried out on sensor no.2 as it exhibits the best response characteristics.
pH and Solvent Effect
One of the ions present in aqueous solution is the hydrogen ion. It interferes in the functioning of
the electrode in many instances. In view of this it is essential to get the optimum pH range where the
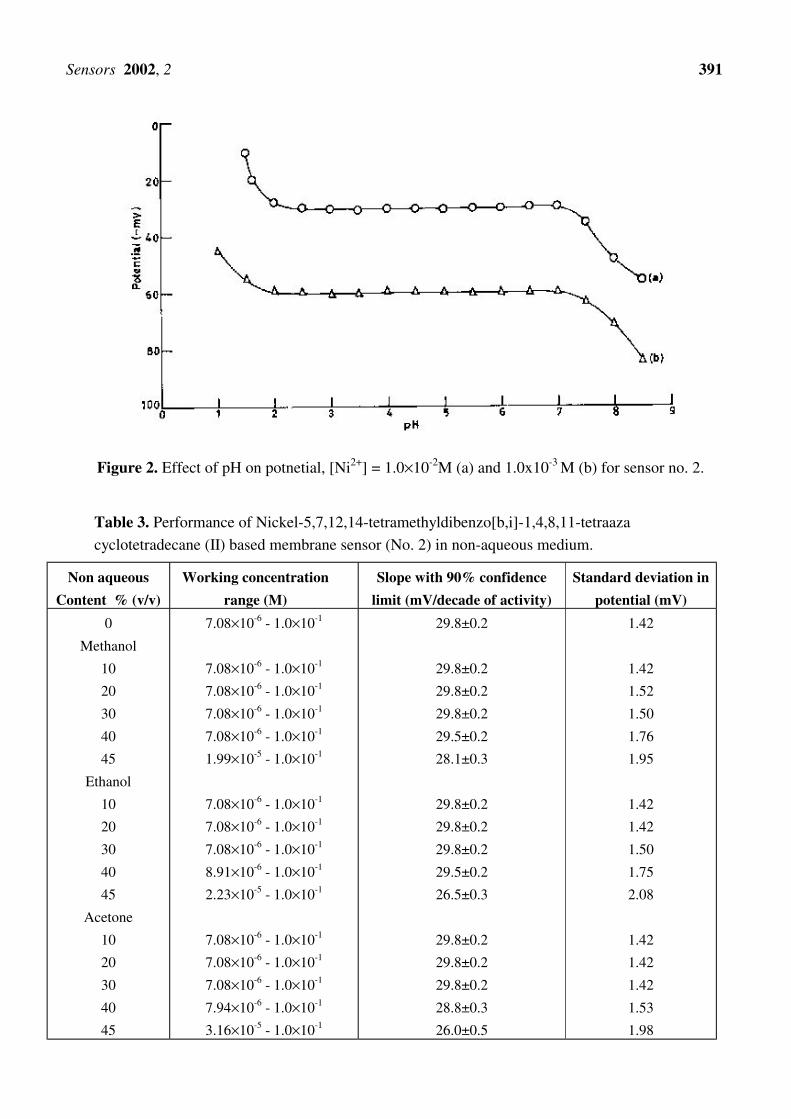
electrode functions devoid of interference from the hydrogen ions. The pH dependence of the
membrane sensor (no.2) has been investigated at 1.0×10⁻² and 1.0×10⁻³ M Ni2+ ions and shown in Fig.
2. The pH of the solutions was adjusted by the addition of HNO3 or hexamine. It can be seen from Fig.
2 that potentials remain steady between pH 2.0-7.5 and consequently, the same may be taken as valid
pH range of the projected sensor. The sharp change in potentials below 2.0 and above pH 6.9 may be
due to H+ ion co-fluxing and hydrolysis of Ni2+ ions, respectively.
In order to asses the performance of the sensor in partially non-aqueous medium, its functioning
was studied in methanol-water, ethanol-water and acetone-water mixtures and the results are tabulated
in Table 3 with the standard deviation in slope and potential from least square fit line. It is observed
that the performance of the electrode is satisfactory in non-aqueous solution containing up to 40%
partially non-aqueous content, as the working concentration range and slope do not change
considerably. However, these values reduce significantly when the non-aqueous content exceeds this
concentration.
Figure 1. Variation of potential of PVC based membrane of (II) no. 1 without plasticizer and
(nos. 2-6) with plasticizers, DBBP, DBP, TPB, DOP and CN, respectively with Ni2+
concentration.
Sensors 2002, 2 391
Figure 2. Effect of pH on potnetial, [Ni2+] = 1.0×10⁻²M (a) and 1.0x10⁻³ M (b) for sensor no. 2.
Table 3. Performance of Nickel-5,7,12,14-tetramethyldibenzo[b,i]-1,4,8,11-tetraaza
cyclotetradecane (II) based membrane sensor (No. 2) in non-aqueous medium.
Non aqueous
Content % (v/v)
Working concentration
range (M)
Slope with 90% confidence
limit (mV/decade of activity)
Standard deviation in
potential (mV)
0
Methanol
10
20
30
40
45
Ethanol
10
20
30
40
45
Acetone
10
20
30
40
45
7.08×10⁻⁶ - 1.0×10⁻¹
7.08×10⁻⁶ - 1.0×10⁻¹
7.08×10⁻⁶ - 1.0×10⁻¹
7.08×10⁻⁶ - 1.0×10⁻¹
7.08×10⁻⁶ - 1.0×10⁻¹
1.99×10⁻⁵ - 1.0×10⁻¹
7.08×10⁻⁶ - 1.0×10⁻¹
7.08×10⁻⁶ - 1.0×10⁻¹
7.08×10⁻⁶ - 1.0×10⁻¹
8.91×10⁻⁶ - 1.0×10⁻¹
2.23×10⁻⁵ - 1.0×10⁻¹
7.08×10⁻⁶ - 1.0×10⁻¹
7.08×10⁻⁶ - 1.0×10⁻¹
7.08×10⁻⁶ - 1.0×10⁻¹
7.94×10⁻⁶ - 1.0×10⁻¹
3.16×10⁻⁵ - 1.0×10⁻¹
29.8±0.2
29.8±0.2
29.8±0.2
29.8±0.2
29.5±0.2
28.1±0.3
29.8±0.2
29.8±0.2
29.8±0.2
29.5±0.2
26.5±0.3
29.8±0.2
29.8±0.2
29.8±0.2
28.8±0.3
26.0±0.5
1.42
1.42
1.52
1.50
1.76
1.95
1.42
1.42
1.50
1.75
2.08
1.42
1.42
1.42
1.53
1.98
Sensors 2002, 2 392
Selectivity
Selectivity is the most significant characteristic of any sensor, which defines the extent to which it
may be used to estimate that meticulous ionic species in real samples. To be a good sensor, it is
essential for it to be selective over all the ions likely to be present in real samples along with the
analyte. The selectivity of a sensor is specified by the selectivity coefficient values defined in terms of
Nicolksy equation. The selectivity coefficients were evaluated by modified form of the fixed
interference method as recommended by Sa’ez de Viteri and Diamond [28] and also by matched
potential method [29] at 1.0×10⁻² M interfering ion concentration. The selectivity coefficient values Pot
B,Ni 2K + (Table 4) clearly point out that the electrode is moderately selective to Ni2+ over a number of
other cations except for Na+ and Cu2+. Even though Na+ and Cu2+ are likely to cause some interference
as the selectivity coefficient values for these ions are higher than other cations, but at low
concentrations still these would not cause much interference. To determine the maximum tolerance
limit of these ions in the determination of Ni2+, some mixed run studies were performed [30-34]. It is
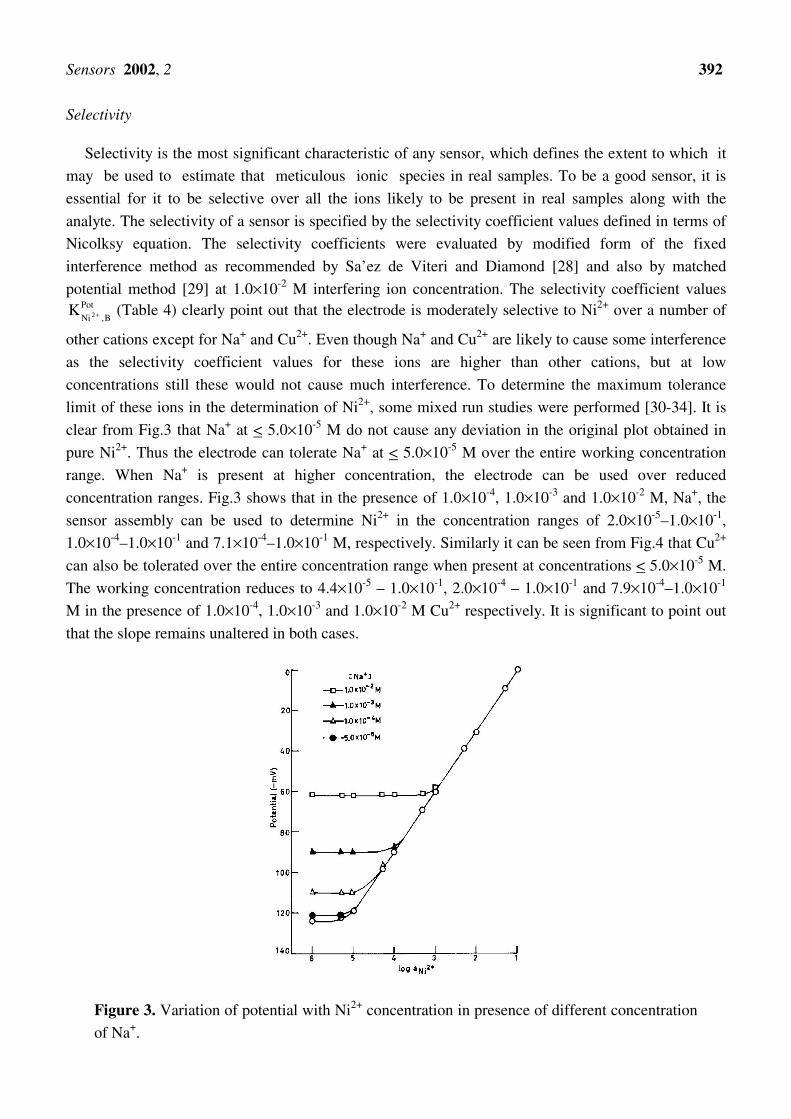
clear from Fig.3 that Na+ at < 5.0×10⁻⁵ M do not cause any deviation in the original plot obtained in
pure Ni2+. Thus the electrode can tolerate Na+ at < 5.0×10⁻⁵ M over the entire working concentration
range. When Na+ is present at higher concentration, the electrode can be used over reduced
concentration ranges. Fig.3 shows that in the presence of 1.0×10⁻⁴, 1.0×10⁻³ and 1.0×10⁻² M, Na+, the
sensor assembly can be used to determine Ni2+ in the concentration ranges of 2.0×10⁻⁵–1.0×10⁻¹,
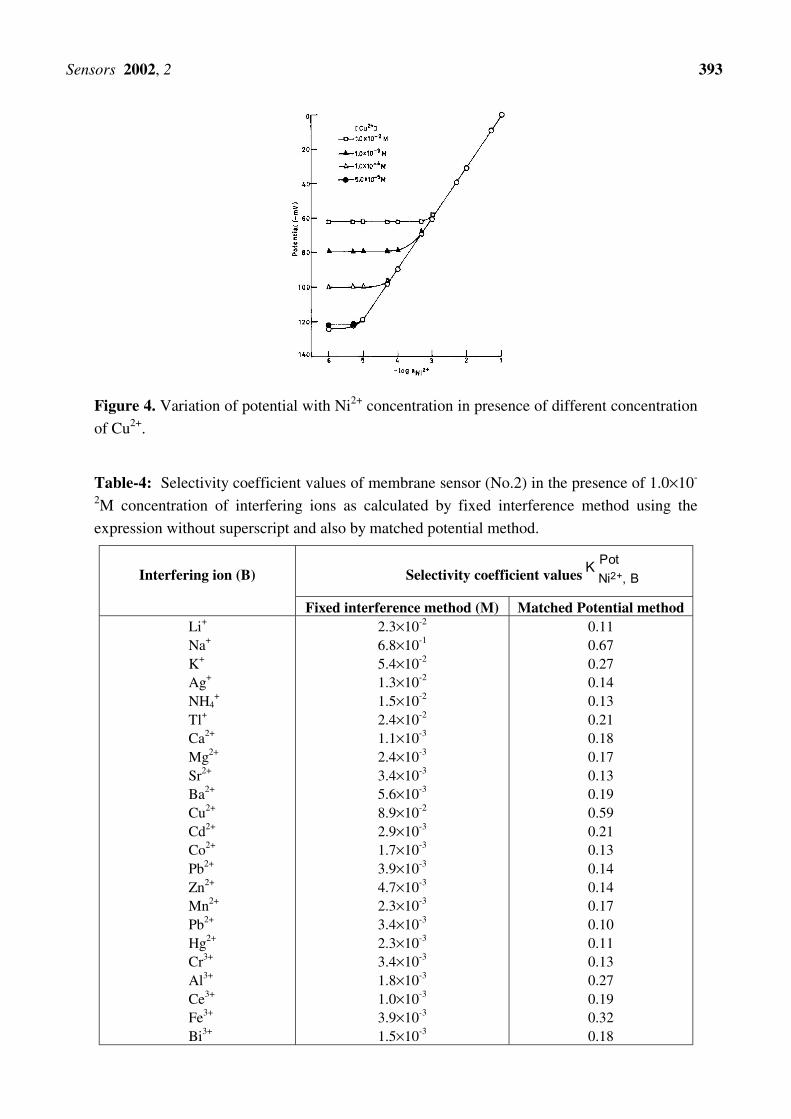
1.0×10⁻⁴–1.0×10⁻¹ and 7.1×10⁻⁴–1.0×10⁻¹ M, respectively. Similarly it can be seen from Fig.4 that Cu2+
can also be tolerated over the entire concentration range when present at concentrations < 5.0×10⁻⁵ M.
The working concentration reduces to 4.4×10⁻⁵ – 1.0×10⁻¹, 2.0×10⁻⁴ – 1.0×10⁻¹ and 7.9×10⁻⁴–1.0×10⁻¹
M in the presence of 1.0×10⁻⁴, 1.0×10⁻³ and 1.0×10⁻² M Cu2+ respectively. It is significant to point out
that the slope remains unaltered in both cases.
Figure 3. Variation of potential with Ni2+ concentration in presence of different concentration
of Na+.
Sensors 2002, 2 393
Figure 4. Variation of potential with Ni2+ concentration in presence of different concentration
of Cu2+.
Table-4: Selectivity coefficient values of membrane sensor (No.2) in the presence of 1.0×10-
2M concentration of interfering ions as calculated by fixed interference method using the
expression without superscript and also by matched potential method.
Selectivity coefficient values
Interfering ion (B)
Fixed interference method (M) Matched Potential method Li+ Na+
K+
Ag+ NH4
+ Tl+
Ca2+ Mg2+ Sr2+ Ba2+ Cu2+ Cd2+
Co2+ Pb2+ Zn2+ Mn2+
Pb2+ Hg2+ Cr3+
Al3+
Ce3+
Fe3+ Bi3+
2.3×10⁻²
6.8×10⁻¹
5.4×10⁻²
1.3×10⁻²
1.5×10⁻²
2.4×10⁻²
1.1×10⁻³
2.4×10⁻³
3.4×10⁻³
5.6×10⁻³ 8.9×10⁻²
2.9×10⁻³
1.7×10⁻³
3.9×10⁻³
4.7×10⁻³
2.3×10⁻³
3.4×10⁻³
2.3×10⁻³
3.4×10⁻³
1.8×10⁻³
1.0×10⁻³
3.9×10⁻³
1.5×10⁻³
0.11 0.67 0.27 0.14 0.13 0.21 0.18 0.17 0.13 0.19 0.59 0.21 0.13 0.14 0.14 0.17 0.10 0.11 0.13 0.27 0.19 0.32 0.18
K Pot
Ni2+, B
Sensors 2002, 2 394
Analytical applications
Potentiometric titration
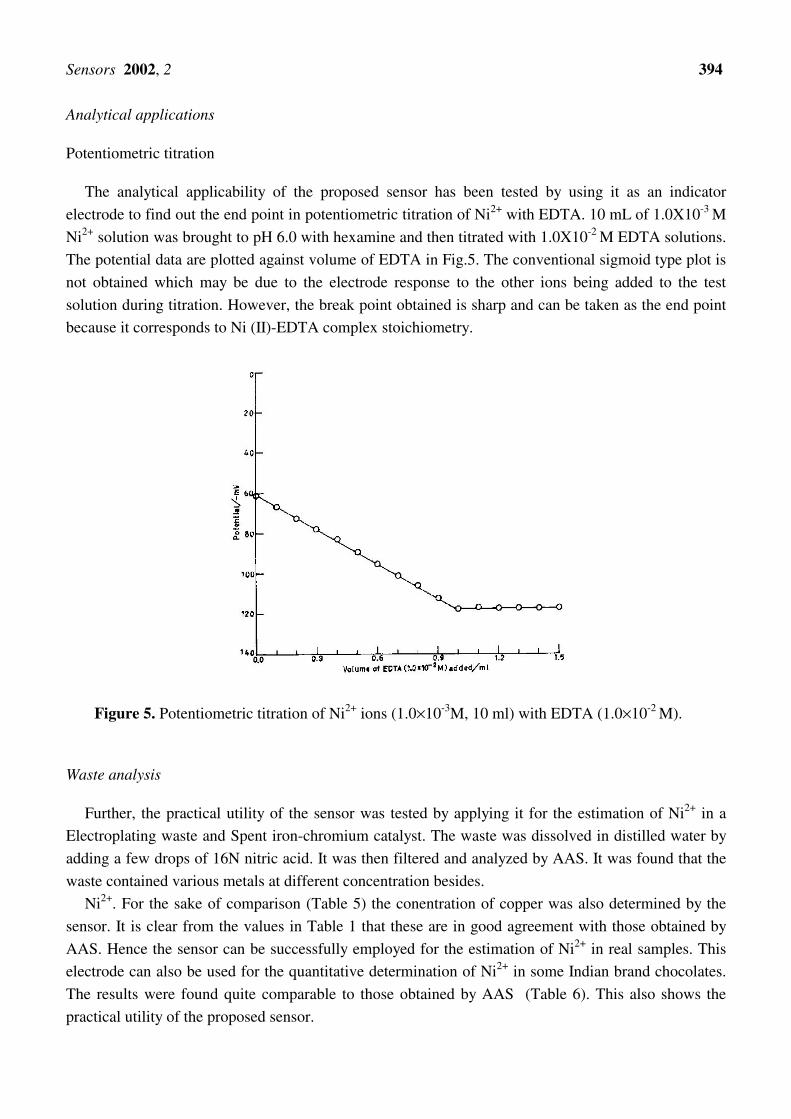
The analytical applicability of the proposed sensor has been tested by using it as an indicator
electrode to find out the end point in potentiometric titration of Ni2+ with EDTA. 10 mL of 1.0X10⁻³ M
Ni2+ solution was brought to pH 6.0 with hexamine and then titrated with 1.0X10⁻² M EDTA solutions.
The potential data are plotted against volume of EDTA in Fig.5. The conventional sigmoid type plot is
not obtained which may be due to the electrode response to the other ions being added to the test
solution during titration. However, the break point obtained is sharp and can be taken as the end point
because it corresponds to Ni (II)-EDTA complex stoichiometry.
Figure 5. Potentiometric titration of Ni2+ ions (1.0×10⁻³M, 10 ml) with EDTA (1.0×10⁻² M).
Waste analysis
Further, the practical utility of the sensor was tested by applying it for the estimation of Ni2+ in a
Electroplating waste and Spent iron-chromium catalyst. The waste was dissolved in distilled water by
adding a few drops of 16N nitric acid. It was then filtered and analyzed by AAS. It was found that the
waste contained various metals at different concentration besides.
Ni2+. For the sake of comparison (Table 5) the conentration of copper was also determined by the
sensor. It is clear from the values in Table 1 that these are in good agreement with those obtained by
AAS. Hence the sensor can be successfully employed for the estimation of Ni2+ in real samples. This
electrode can also be used for the quantitative determination of Ni2+ in some Indian brand chocolates.
The results were found quite comparable to those obtained by AAS (Table 6). This also shows the
practical utility of the proposed sensor.
Sensors 2002, 2 395
Conclusion
The membrane sensor using [Ni(Me4Bzo2[14]aneN4)]Cl2 (II), NaTPB as anion discriminator and
DBBP plasticizing solvent mediator in PVC matrix in the ratio 2.5:1:100:100
(II:NaTPB:DBBP:PVC)(w/w) works well in the concentration range 7.0x10⁻⁶-1.0x10⁻¹M with a slope
29.8±0.2 mV/decade of activity, response time as fast as 12s and good selectivity over a number of
cations. The useful pH range of the electrode is 2.0-7.6. The sensor can work satisfactorily in 40%(v/v)
water-methanol, ethanol and acetone mixtures, and can be used over a period of 5 months without any
drift in potentials. The electrode has been used as an indicator electrode in the potentiometric titration
of Ni2+ against EDTA and can be used in the determination of Ni2+ in real samples.
Acknowledgements
The authors are highly thankful to Council of Scientific and Industrial Research (CSIR), New Delhi,
India, for providing financial assistance to complete this work.
References
1. Moore, J.W. Inorganic contaminments of surface water. Springer-verlag, New York 1991, 215.
2. Dietrich, B.; Viout, P.; Lehn, J.M. Macrocyclic Chemistry. VCH, Weinheim 1993.
3. Kimura, E. Pure Appl. Chem 1989, 61, 823.
4. Creutz, C. in Sullivan, B.P.; Krist, K.; Guard, H.E. (Eds.), Electrochemical and
Electrocatalytic Reduction of Carbon Dioxide. Elsevier, Amsterdam 1993, 19.
5. Taniguchi, I.; Nakashima, N.; Yasukouchi, K. J. Chem. Soc. Chem. Commun. 1986, 1814.
6. Kinneary, J.F.; Albert, J.S.; Burrows, C.J. J. Am. Chem. Soc. 1988, 110, 6124.
7. Stolzenberg, A.M.; Zhang, Z. Inorg. Chem. 1997, 36, 593.
8. Kaden, T.A. Top. Curr. Chem. 1984, 121, 157.
9. Gupta, V.K.; Prasad, R.; Kumar, P.; Mangla, R. Anal, Chim. Acta 2000, 20655, 1.
10. Lal, U.S.; Chattopadhyaya, M.C.; Dey, A.K. J. Ind. Chem. Soc. 1982, 59, 493.
11. Jain, A.K.; Gupta, V.K.; Singh, R.D.; Khurana, U.; Singh, L.P. Sens. Actuators B 1997, 40, 15.
12. Pungor, E.; Toth, K.; Havas, J. Acta Chim. Acad. Sci. Hung. 1966, 48,17.
13. Awasthi, S.P.; Kulkarni, V.T.; Sundaresan, M. J. Electrochem. Soc. India 1988, 37, 309.
14. Rao, G.N.; Srivastava, S.; Srivastava, S.K.; Singh, M. Talanta 1966, 43, 1821.
15. Luca, C.; Pleniceanu, M.; Muregasan, N. Chem. Rev. 1976, 27,1088.
16. Smirnova, E.A.; Petrukhin, O.M.; Rogatinskaya, S.L. Zh. Anal Khim. 1982, 37,2137.
17. Hampton, M.D.; Peters, C.A.; Wellington, L.A. Anal. Chim. Acta 1987, 194, 171.
18. Gupta, V.K.; Jain, A.K.; Singh, L.P.; Khurana, U. Anal. Chim. Acta 1997, 355, 33.
19. Ganjali, M.R.; Hosseini, S.M.; Javanbakht, M.; Hashemi, O.R. Anal. Lett. 2000, 33, 3139.
20. Shamsipur, M.; Kajemi, S.Y. Electroanalysis 2000, 12, 1472.
21. Streeky, J.A.; Pillsbury, D.G.; Busch, D.G. Inorg. Chem. 1980, 19, 3148.
22. Lehn, J.M. Supramolecular Chemistry, Concepts and Perspectives. VCH, Weinheim, 1995.
Sensors 2002, 2 396
23. Tsukube, H. Talanta 1993, 40, 1313.
24. Jyo, H.; Minakami, R.; Kanda, Y.; Egawa, H. Sensors and Actuators B 1993, 13/14, 200.
25. Chaniotakis, N.A.; Chasser, A.M.; Meyerhoff, M.E. Anal. Chem. 1988, 60, 88.
26. Gao, D.; Jun, G.; Yu, R.; Zheng, G. Analyst 1995, 120, 499.
27. Chipperfield, J.P.; Woodward, S. J. Chem. Educ. 1994, 71, 75.
28. Sa’ez de Viteri, F.I.; Diamond, D. Analyst 1994, 119, 749.
29. Gadzekpo, V.P.Y.; Christian, G.D. Anal. Chim. Acta 1984, 164, 279.
30. Gupta, V.K.; Kumar, P. Anal. Chim. Acta 1999, 389, 205.
31. Gupta, V.K. Sensors and Actuators B 1999, 55, 195.
32. Gupta, V.K.; Jain, A.K.; Singh, L.P.; Khurana, U. Sensors and Actuators B 1999, 55, 201.
33. Gupta, V.K.; Jain, A.K.; Singh, L.P.; Khurana, U. Electrochim. Acta 1998, 43, 2047.
34. Gupta, V.K.; Khurana, U.; Mangla, R.; Kumar, P. Electroanalysis 1999, 11, 573.
Sample Availability: Available from the authors.
© 2002 by MDPI (http://www.mdpi.net). Reproduction is permitted for noncommercial purposes.
Top Related
Copyright © 2022 FDOKUMEN

