


Bahasa
Halaman
Hukum


Development of a processing chain of multispectral Sentinel–2 data to extract meandering river courses
for geomorphometric analysis in Central Amazonia Region
NOÉMI KÓSA* and Balázs Székely
ELTE Eötvös Loránd University, Department of Geophysics and Space Science, Hungary
https://doi.org/10.5194/egusphere-egu2020-17488

INTRODUCTION
Freely-meandering rivers are sensitive indicators of neotectonic activity in low-relief areas.
The first objective of this project was to develop a processing chain of multispectralSentinel–2 data to extract meandering river courses.
Then sinuosity analysis has been carried out on 20 main rivers and tributaries of CentralAmazonia Region as an aid for localization of river channel patterns influenced by on-goingtectonic activity.
Petrovszki et al. 2012
(Timár 2003, Zámolyi et al. 2010, Petrovszki et al. 2012, Ibanez et al. 2014)
Kósa & Székely EGU2020-17488
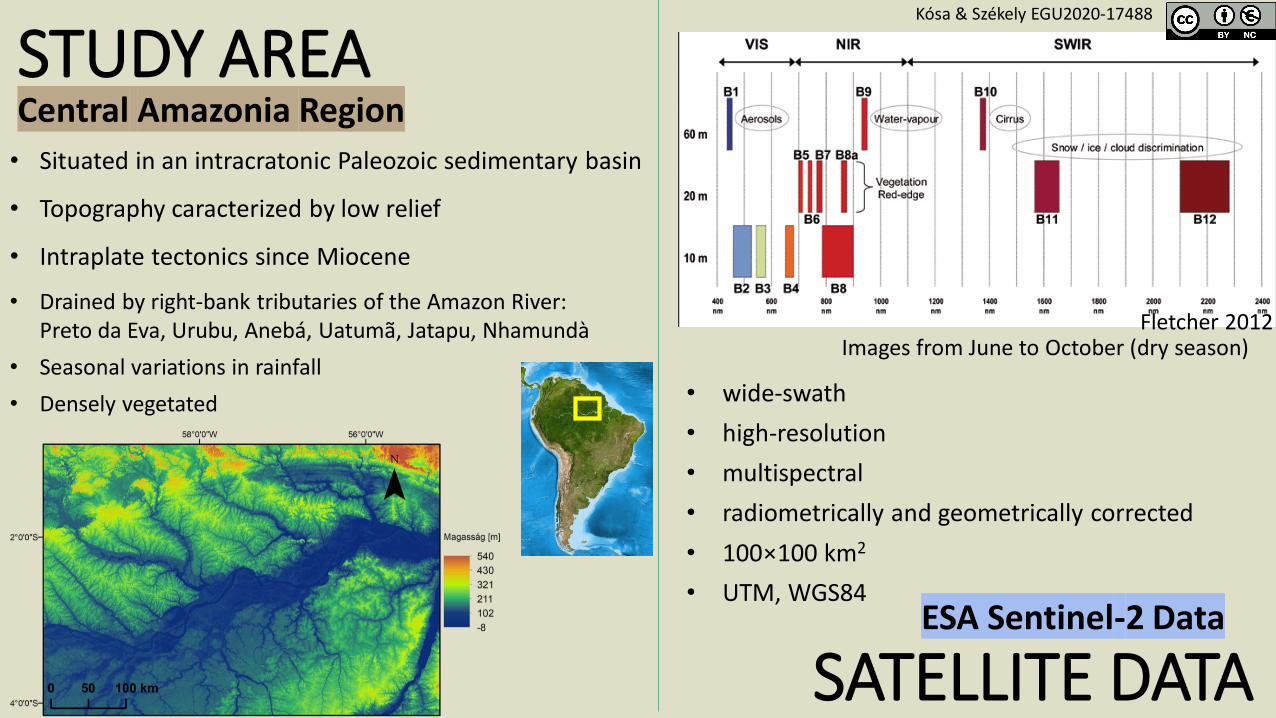
STUDY AREACentral Amazonia Region
• Situated in an intracratonic Paleozoic sedimentary basin
• Topography caracterized by low relief
• Intraplate tectonics since Miocene
• Drained by right-bank tributaries of the Amazon River: Preto da Eva, Urubu, Anebá, Uatumã, Jatapu, Nhamundà
• Seasonal variations in rainfall
• Densely vegetated
SATELLITE DATA
• wide-swath
• high-resolution
• multispectral
• radiometrically and geometrically corrected
• 100×100 km2
• UTM, WGS84ESA Sentinel-2 Data
Images from June to October (dry season)Fletcher 2012
Kósa & Székely EGU2020-17488

DATA PROCESSING CHAIN
Different rivers (colour, width) → needs more spectral filteringMultispectral
satellite images
Resampling &
Spectral Filtering
Binarizing
Skeletonizing
Creatingpolylines
Vectorized
river sections
Noise removal
Continous digitizedriver sections
a quick and accurate way to digitize river sections
Kósa & Székely EGU2020-17488

SINUOSITY INDEX CALCULATIONContinous digitized
river sections
S: sinuosity index assigned to point P
A: window size (along-track distance)
D: shortest path-length
d: resolution
Defining differentwindow sizes
Sinuosity Index Calculation
Tímár 2003
Classification of values Visualization RESULTS
Kósa & Székely EGU2020-17488

RESULTSName Number
Digitized
length
Urubu 1 141,5 km
Uatumã 2 169,4 km
Abacate 3 90,7 km
Capucapu 4 163,3 km
Cararà 5 56,3 km
Jatapu 6 349,5 km
Nhamundà 7 412,3 km
Igarapé Pitinga 8 83,6 km
Igarapé Jauari 9 40,2 km
Acari 10 84,3 km
Cachorrinho 11 139,9 km
Cachorro 12 227 km
Rio das Antas 13 74,8 km
Rio do Prato 14 75,3 km
Igarapé Repartimento 15 50 km
Turuna 16 128,3 km
Rio Velho 17 56,2 km
Igarapé Caxipacoro 18 127,8 km
Igarapé Água Fria 19 61,5 km
Rio Acapu 20 164,2 km
Sinuosity values calculated on 20 main rivers and tributaries.
Analysis of distribution of sinuosity variations using:• classification• various representations (mapping, cross-plots, spectrum)
1
1,5
2
2,5
3
3,5
1 1,5 2
Kósa & Székely EGU2020-17488

Small window size (1 000 - 2 000 – 5 000 m)
Natural Breaks Classification
Sensitive for small, short wavelength, zigzag shape meanders.
Used for making cross-plots (x-axis):
1
1,5
2
2,5
3
3,5
4
1 1,5 2 2,5 3
SI v
alu
esca
lcu
late
dw
ith
20 0
00 m
win
do
wsi
ze
SI values calculated with 1000 m window size
Sinuosity values of AcapuRiver
Kósa & Székely EGU2020-17488
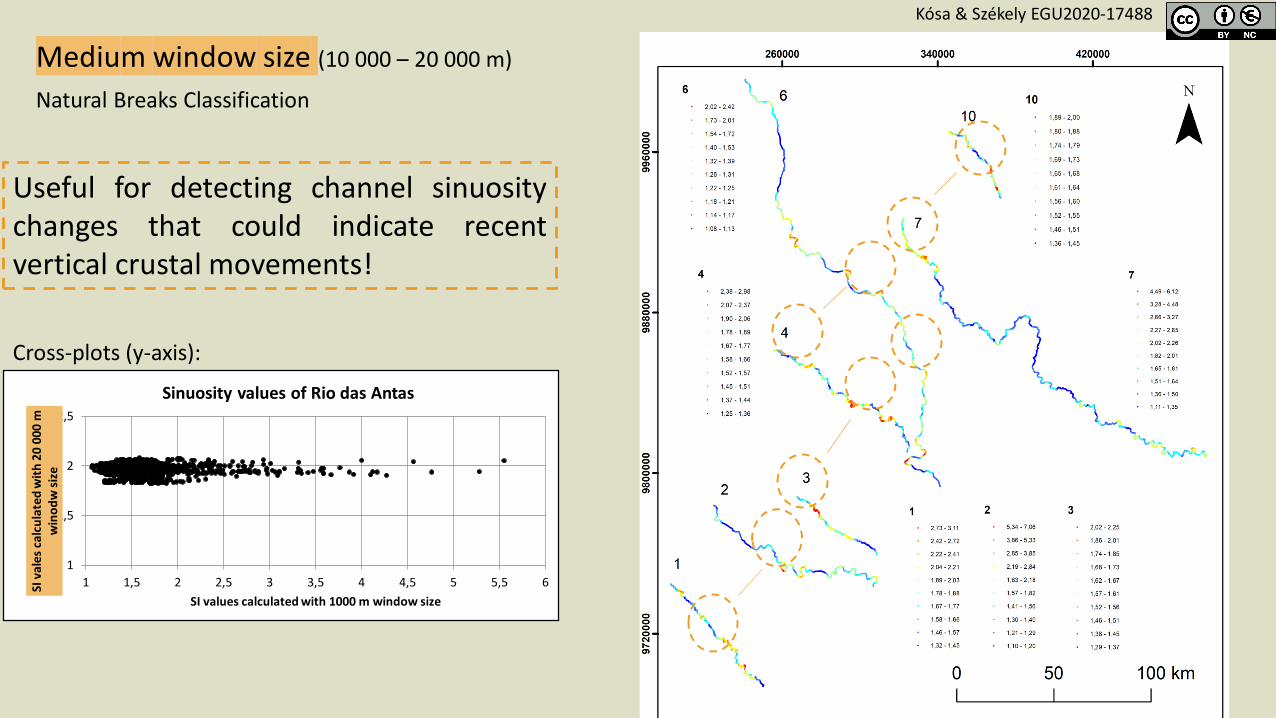
Medium window size (10 000 – 20 000 m)
Useful for detecting channel sinuositychanges that could indicate recentvertical crustal movements!
Natural Breaks Classification
Cross-plots (y-axis):
1
1,5
2
2,5
1 1,5 2 2,5 3 3,5 4 4,5 5 5,5 6SI v
ales
calc
ula
ted
wit
h20
000
m
win
od
wsi
ze
SI values calculated with 1000 m window size
Sinuosity values of Rio das Antas
Kósa & Székely EGU2020-17488

Large window size (25 000 m – )
SI values of Nhamundà River, window size: a) 10 000 m, b) 20 000 m, c) 40 000 m
Sinuosity spectrum of Nhamundà River
As the visualization methodscomplement each other thevariations in sinuosity values can behighlighted and verified in severalaspects.
1
2
3
4
1 2 3 4 5 6 7 8 9SI v
alu
esca
lcu
late
dw
ith
20
000
m
win
do
wsi
ze
SI values calculated with 1000 m window size
Sinuosity values of Nhamundà River
The case of Nhamundà River
Kósa & Székely EGU2020-17488

CONCLUSIONS
The results compared to former neotectonic studies some significant sinuosity changes can be correlated to known faults (Costa 1996).
The mentioned sinuosity variations coincides with the location of NW–SE normal and thrust faults active since Pleistocene times and NE–SW Miocene normal faults supporting the idea that these structures may have beenreactivated (Ibanez 2014).
Multi-window sinuosity index calculation applied to satellite data based digitized water
courses is a useful tool for recognizing recent tectonic activity in large low-relief areas,
such as Central Amazonia.
Our data processing method of high resolution satellite images provides a quick andaccurate way to digitize river sections of a large part of the sedimentary basin.
THANK YOU FOR YOUR ATTENTION!Questions and suggestions are welcome!
Kósa & Székely EGU2020-17488
https://doi.org/10.5194/egusphere-egu2020-17488

REFERENCES• COSTA, J. B. S. (1996): A neotectônica na Amazônia. In: Simpósio de Geologia da Amazônia, 5., Belém. Anais... Belém:
SBG/NO, 1996, v. 1, p. 35-8.
• FLETCHER, K. (2012): Sentinel-2: ESA's optical high-resolution mission for GMES operational services. Noordwijk: ESA Communications.
• IBANEZ, D.M., RICCOMINI, C., DE MIRANDA, F.P. (2014): Geomorphological evidence of recent tilting in the CentralAmazonia Region. Geomorphology 214:378-387.
• PETROVSZKI, J., SZÉKELY, B., TIMÁR, G. (2012): A systematic overview of the coincidences of river sinuosity changes and tectonically active structures in the Pannonian Basin. Global and Planetary Change 98–99:109-121.
• TIMÁR, G. (2003): Controls on channel sinuosity changes: a case study of the Tisza River, the Great Hungarian Plain. Quaternary Science Reviews 22:2199-2207.
• ZÁMOLYI, A, SZÉKELY, B, DRAGANITS, E, TIMÁR, G. (2010): Neotectonic control on river sinuosity at the western margin of the Little Hungarian Plain. Geomorphology 122(3-4):231-243.
Kósa & Székely EGU2020-17488
Top Related
Copyright © 2022 FDOKUMEN

