


Bahasa
Halaman
Hukum

Masterarbeit
Development of a Location-BasedInformation and Navigation System for
Indoor and Outdoor Areas
zur Erlangung des akademischen GradesMaster of Science
vorgelegt demFachbereich Mathematik, Naturwissenschaften und Informatik
der Technischen Hochschule Mittelhessen
Nils Beckerim März 2014
Referent: Prof. Dr. Michael Jäger
Korreferent: Sebastian Süß

Eidesstattliche Erklärung
Hiermit versichere ich, die vorliegende Arbeit selbstständig und unter aus-schließlicher Verwendung der angegebenen Literatur und Hilfsmittel erstelltzu haben.
Die Arbeit wurde bisher in gleicher oder ähnlicher Form keiner anderen Prü-fungsbehörde vorgelegt und auch nicht veröffentlicht.
Gießen, den 12. März 2014Nils Becker

Abstract
Modern smart phones offer the computing power, connectivity and sensorsneeded to assist their users in daily life. Therefore, the development of themobile campus information system (MoCaInfo) has been initiated in 2011, toprovide a digital helping hand to students and university staff at a continu-ously growing and changing campus. Besides location-based information, thesystem offers point-to-point navigation in buildings and at the campus area.In contrast to other location-based information systems, MoCaInfo focuses onassisting visually impaired people, as well as sighted people.
In this thesis, the requirements for a location-based information and navigationsystem are analyzed, also considering the special requirements which arise dueto the assistants of visually impaired users. This includes a low-vision userinterface for the mobile application and particular navigation instructions.
Furthermore, a library for mobile indoor and outdoor navigation has been de-veloped, since existing solutions barely support indoor navigation. For this, asmuch existing approaches as possible have been used and integrated into thesystem, to build upon established components. To these components belongGoogle Maps and OpenStreetMap with its toolchain. In order to assist visu-ally impaired users as well, additional navigation information, e.g. about thecondition of the floor, is offered.
With the purpose of providing a point-to-point navigation system, a position-ing system is essential, too. It uses Wi-Fi signals for absolute positioning inbuildings, in combination with relative positioning information gathered byanalyzing data of the smart phone’s accelerometer, magnetometer and gyro-scope. Due to the conjunction of this positioning information, an average errorof 1.67 meters has been achieved.
i
Contents
Contents
I Project Overview 1
1 Introduction 21.1 Aim of the Thesis . . . . . . . . . . . . . . . . . . . . . . . . . . 31.2 Structure of the Thesis . . . . . . . . . . . . . . . . . . . . . . . 3
2 Requirements 62.1 Stakeholders . . . . . . . . . . . . . . . . . . . . . . . . . . . . . 62.2 Functional Requirements . . . . . . . . . . . . . . . . . . . . . . 72.3 Non-Functional Requirements . . . . . . . . . . . . . . . . . . . 9
3 Architecture 113.1 Component Overview . . . . . . . . . . . . . . . . . . . . . . . . 113.2 Logical Architecture . . . . . . . . . . . . . . . . . . . . . . . . 133.3 Data Model . . . . . . . . . . . . . . . . . . . . . . . . . . . . . 17
4 Content Model and Managment 194.1 Content Parts . . . . . . . . . . . . . . . . . . . . . . . . . . . . 194.2 Content Management System . . . . . . . . . . . . . . . . . . . 21
II Mobile Application 25
5 Introduction to the Mobile Application 26
6 Incremental Data Synchronization 286.1 Database Dump . . . . . . . . . . . . . . . . . . . . . . . . . . . 286.2 Incremental Synchronization . . . . . . . . . . . . . . . . . . . . 30
7 User Interface 337.1 User Interfaces for Visually Impaired People . . . . . . . . . . . 337.2 Graphical User Interface . . . . . . . . . . . . . . . . . . . . . . 387.3 User Interface Structure . . . . . . . . . . . . . . . . . . . . . . 437.4 Textual User Interface . . . . . . . . . . . . . . . . . . . . . . . 447.5 Interim Conclusion . . . . . . . . . . . . . . . . . . . . . . . . . 47
ii
Contents
III Navigation 49
8 Introduction to the Navigation System 50
9 Existing Mobile Navigation Systems 519.1 Google Maps . . . . . . . . . . . . . . . . . . . . . . . . . . . . 519.2 OpenStreetMap . . . . . . . . . . . . . . . . . . . . . . . . . . . 51
10 OpenStreetMap meets Google Maps 5910.1 Map File . . . . . . . . . . . . . . . . . . . . . . . . . . . . . . . 5910.2 Reading Data: SpatiaLite . . . . . . . . . . . . . . . . . . . . . . 6010.3 Pathfinding: SpatiaLite . . . . . . . . . . . . . . . . . . . . . . . 6110.4 Data Mapping: MoCaInfo and SpatiaLite . . . . . . . . . . . . . 61
11 Navigation Instructions 6311.1 Additional Instructions for Visually Impaired Users . . . . . . . 63
12 Navigation System’s User Interface 65
13 Navigation System’s Software Architecture 67
IV Indoor and Outdoor Positioning 69
14 Introduction to Indoor and Outdoor Positioning 70
15 Absolute Positioning 7115.1 Global Positioning System . . . . . . . . . . . . . . . . . . . . . 7115.2 GSM . . . . . . . . . . . . . . . . . . . . . . . . . . . . . . . . . 7215.3 Wi-Fi . . . . . . . . . . . . . . . . . . . . . . . . . . . . . . . . 7515.4 Optical . . . . . . . . . . . . . . . . . . . . . . . . . . . . . . . . 7815.5 Near Field Communication . . . . . . . . . . . . . . . . . . . . . 8015.6 Roundup . . . . . . . . . . . . . . . . . . . . . . . . . . . . . . . 82
16 Relative Positioning 8316.1 Robot’s Positioning . . . . . . . . . . . . . . . . . . . . . . . . . 8316.2 Pedestrian Positioning . . . . . . . . . . . . . . . . . . . . . . . 84
17 Absolute Positioning in MoCaInfo 85
iii
17.1 GSM . . . . . . . . . . . . . . . . . . . . . . . . . . . . . . . . . 8517.2 Optical . . . . . . . . . . . . . . . . . . . . . . . . . . . . . . . . 8617.3 Global Positioning System . . . . . . . . . . . . . . . . . . . . . 8617.4 Near Field Communication . . . . . . . . . . . . . . . . . . . . . 8617.5 Wi-Fi . . . . . . . . . . . . . . . . . . . . . . . . . . . . . . . . 88
18 Relative Positioning in MoCaInfo 10118.1 Step Detection . . . . . . . . . . . . . . . . . . . . . . . . . . . 10118.2 Compass . . . . . . . . . . . . . . . . . . . . . . . . . . . . . . . 109
19 Dead Reckoning 12219.1 Weighting of Location Sources . . . . . . . . . . . . . . . . . . . 12219.2 Adaptive Weighting . . . . . . . . . . . . . . . . . . . . . . . . . 12419.3 Multiple Absolute Location Sources . . . . . . . . . . . . . . . . 126
V Conclusions and Future Work 129
20 Conclusions 13020.1 Mobile Application . . . . . . . . . . . . . . . . . . . . . . . . . 13020.2 Navigation . . . . . . . . . . . . . . . . . . . . . . . . . . . . . . 13120.3 Indoor and Outdoor Positioning . . . . . . . . . . . . . . . . . . 131
21 Future Work 13521.1 Mobile Application . . . . . . . . . . . . . . . . . . . . . . . . . 13521.2 Navigation . . . . . . . . . . . . . . . . . . . . . . . . . . . . . . 13621.3 Indoor and Outdoor Positioning . . . . . . . . . . . . . . . . . . 137
22 Final Words 143
A Bibliography i
B Glossary ix
iv
List of Figures
List of Figures
3.1 Logical Component Overview . . . . . . . . . . . . . . . . . . 123.2 Layers Architecture . . . . . . . . . . . . . . . . . . . . . . . . 143.3 Architectural Pattern: Layers . . . . . . . . . . . . . . . . . . 163.4 Entity-Relationship Diagram of MoCaInfo’s Data Model . . . 17
4.1 Sketch of a Content Part, Using the Big Picture Template . . . 204.2 Example Content Composed of Two Content Parts . . . . . . 204.3 Screenshot of the Content Management System . . . . . . . . 214.4 Asynchronous Client Server Communication with GWT . . . . 23
6.1 Performance Overview, Inserting 1500 and 50000 Rows IntoSQLite Database . . . . . . . . . . . . . . . . . . . . . . . . . 30
6.2 Data Synchronization Between Client and Server . . . . . . . . 316.3 Data Synchronization using GSON . . . . . . . . . . . . . . . 32
7.1 Screenshots of Android’s Accessibility Features . . . . . . . . . 387.2 Examples of the Dashboard UI Design Pattern . . . . . . . . . 407.3 Examples of the Action Bar UI Design Pattern . . . . . . . . . 417.4 Examples of the Quick Actions UI Design Pattern . . . . . . . 427.5 Examples of the Navigation Drawer UI Design Pattern . . . . 437.6 Wireframe of Graphical User Interface . . . . . . . . . . . . . 447.7 Navigation with Volume Control Buttons . . . . . . . . . . . . 46
8.1 Overview of a Navigation System’s Components . . . . . . . . 50
9.1 Screenshot of JOSM . . . . . . . . . . . . . . . . . . . . . . . 57
10.1 Background Layer between Google Maps and Building Overlay 6010.2 Data Mapping Concept . . . . . . . . . . . . . . . . . . . . . . 62
11.1 Navigation Instruction with and without Door and CorridorInformation . . . . . . . . . . . . . . . . . . . . . . . . . . . . 64
12.1 Screenshot of MoCaInfo’s Navigation Component . . . . . . . 66
13.1 Navigation Component’s Architecture . . . . . . . . . . . . . . 67
v
List of Figures
15.1 Principle of Satellite Positioning. Illustrated in [27]. . . . . . . 7215.2 Illustration of a AoA Triangulation. α and β are Known Be-
cause of the Antenna Arrays . . . . . . . . . . . . . . . . . . . 7415.3 Illustration of Time of Arrival (TOA) . . . . . . . . . . . . . . 7715.4 Model of a Room in CityGML[43] . . . . . . . . . . . . . . . . 7915.5 Projected Markers used by CLIPS[45] . . . . . . . . . . . . . . 80
17.1 Device Scanning a Passive NFC Tag . . . . . . . . . . . . . . . 8717.2 Flow from Wi-Fi Measurement to Location Determination . . 8917.3 Compass Filter’s Functional Principle . . . . . . . . . . . . . . 9017.4 Distribution of P (C) with a Fingerprint Distance of Two Meters 9417.5 Wi-Fi Positioning Test Area with Fingerprints . . . . . . . . . 9517.6 Comparison of Various Distance Methods as a Box Plot . . . . 9617.7 Impact of a Last Location Depended P (C) on the Accuracy
as a Box Plot . . . . . . . . . . . . . . . . . . . . . . . . . . . 9717.8 Impact of the Number of Neighbors in Weighted Nearest Neigh-
bor Algorithm on Accuracy . . . . . . . . . . . . . . . . . . . . 9817.9 Estimated Positions with Naïve Bayes Classifier and Canberra
Distance . . . . . . . . . . . . . . . . . . . . . . . . . . . . . . 9917.10 Map Showing Two Tracks, Estimated with Canberra Distance
Approach and Naïve Bayes classifier. . . . . . . . . . . . . . . 100
18.1 Steps of Signal Preparation . . . . . . . . . . . . . . . . . . . . 10218.2 Acceleration Measurements after Various Enhancement Steps . 10418.3 Step Detection Example. Red Squares in Figure (b) Represent
Detected Steps . . . . . . . . . . . . . . . . . . . . . . . . . . 10518.4 Procedure of Peak Detection . . . . . . . . . . . . . . . . . . . 10618.5 Bar Chart Comparing the Step Detection Accuracy . . . . . . 10718.6 Comparison of Prepared and Low-Pass Filtered Signal . . . . . 10818.7 Normalized Vectors, used for Azimuth Calculation. Example
Vectors result in an Azimuth of approximately 90◦ . . . . . . . 11018.8 Low-Pass Filter Applied to Z-Axis of an Acceleration Vector
over Time . . . . . . . . . . . . . . . . . . . . . . . . . . . . . 11218.9 Decreasing Weights of an EMA with α = 0.125 . . . . . . . . . 11318.10 EMA Filter Applied to Z-Axis of an Acceleration Vector over
Time . . . . . . . . . . . . . . . . . . . . . . . . . . . . . . . . 114
vi
List of Figures
18.11 Structure of a Sensor Fusion Model, Using Accelerometer, Mag-netometer and Gyroscope for Orientation Estimation . . . . . 115
18.12 Azimuth Computed by Fusing Data from Gyroscope, Accelerom-eter and Magnetometer . . . . . . . . . . . . . . . . . . . . . . 117
18.13 Comparison of Compass Filters and Approaches. Determina-tion with a Magnetic Disturbance . . . . . . . . . . . . . . . . 118
18.14 Comparison of Compass Filters and Approaches. MagneticDisturbance Between Second 20 and 24 . . . . . . . . . . . . . 119
18.15 Comparison of Compass Filters and Approaches. Walking Downa Floor and Rotate Approx. 80◦ After 23 Seconds . . . . . . . 120
19.1 Concept of Dead Reckoning . . . . . . . . . . . . . . . . . . . 12219.2 Comparison of Different Weightings Between Location Sources 12419.3 Dead Reckoning with an Adaptive α Between 0.5 and 0.95 . . 12519.4 Comparison of Wi-Fi-only Positioning and Dead Reckoning . . 12519.5 Concept of Dead Reckoning with Multiple Absolute Location
Sources . . . . . . . . . . . . . . . . . . . . . . . . . . . . . . . 126
20.1 Position Estimation with Dead Reckoning (Red) and Wi-Fi-Only (Blue). Green Line Shows the Actual Walked Track . . . 133
21.1 Clock Model for Orientation . . . . . . . . . . . . . . . . . . . 13721.2 Gimbal Proximity Beacon Series 10 (left) and Series 20 by
Qualcomm[76] . . . . . . . . . . . . . . . . . . . . . . . . . . . 13921.3 Magnetic Field with Artificial Magnetic Interference . . . . . . 14121.4 Magnetic Field During a Walk in a Building . . . . . . . . . . 142
vii


Part I.
Project Overview
1
1. Introduction
1. Introduction
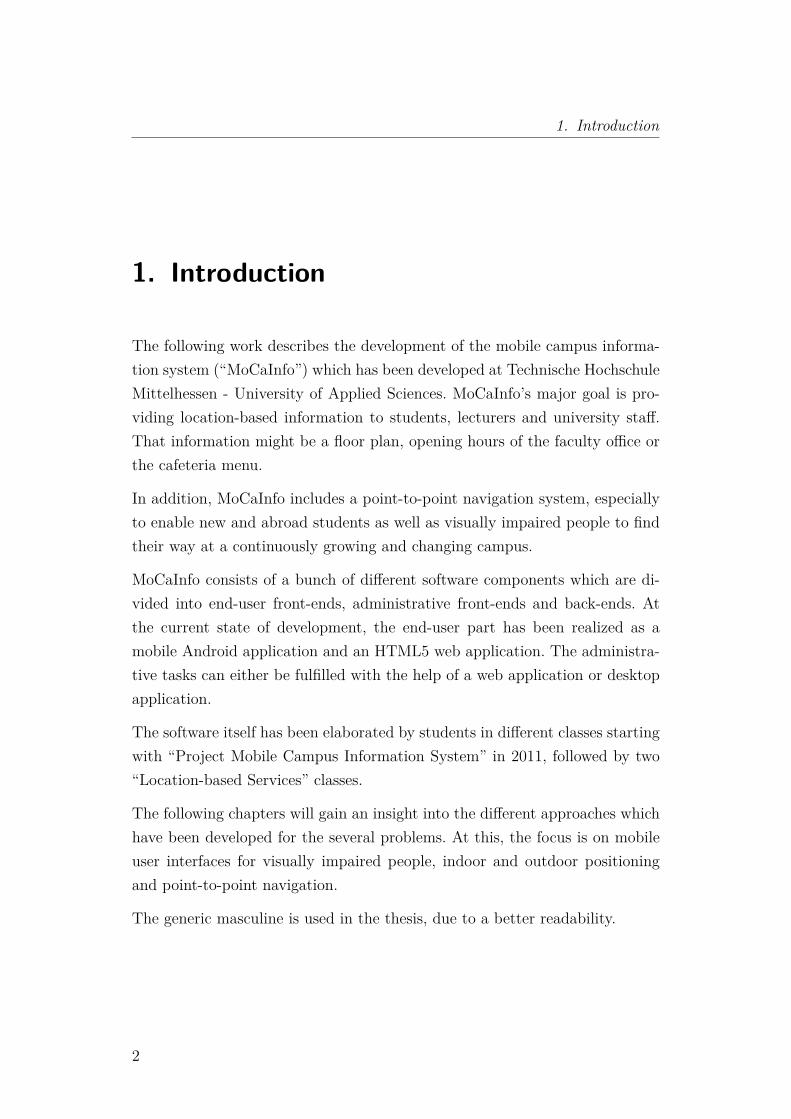
The following work describes the development of the mobile campus informa-tion system (“MoCaInfo”) which has been developed at Technische HochschuleMittelhessen - University of Applied Sciences. MoCaInfo’s major goal is pro-viding location-based information to students, lecturers and university staff.That information might be a floor plan, opening hours of the faculty office orthe cafeteria menu.
In addition, MoCaInfo includes a point-to-point navigation system, especiallyto enable new and abroad students as well as visually impaired people to findtheir way at a continuously growing and changing campus.
MoCaInfo consists of a bunch of different software components which are di-vided into end-user front-ends, administrative front-ends and back-ends. Atthe current state of development, the end-user part has been realized as amobile Android application and an HTML5 web application. The administra-tive tasks can either be fulfilled with the help of a web application or desktopapplication.
The software itself has been elaborated by students in different classes startingwith “Project Mobile Campus Information System” in 2011, followed by two“Location-based Services” classes.
The following chapters will gain an insight into the different approaches whichhave been developed for the several problems. At this, the focus is on mobileuser interfaces for visually impaired people, indoor and outdoor positioningand point-to-point navigation.
The generic masculine is used in the thesis, due to a better readability.
2
1.1 Aim of the Thesis
1.1. Aim of the Thesis
Todays smart phones offer decent CPU and memory resources as well as vari-ous sensors, enabling developers to implement location-based information sys-tems. However, today’s information systems have deficits when it comes topoint-to-point navigation. Main reason for this is the lack of standard indoorpositioning techniques. Furthermore, the needs of visually impaired people arebarely considered in existing location-based information systems.
Therefore, the aim of this thesis is to provide possible solutions for the men-tioned problems and share the experiences made during the development ofa university location-based information system. One distinguishing feature ofthe proposed system is an indoor and outdoor point-to-point navigation sys-tem. The system has to be usable at current Android smart phones. In order toachieve such a navigation system, one of the problems to be solved is indoor po-sitioning. At this, it is important to use sensors and connectivity technologies,which are available in today’s smart phones.
Furthermore, a system for outdoor and indoor map creation, rendering andpathfinding is needed. Particular requirements for these components arise be-cause visually impaired people shall be guided by the navigation system aswell. This user group is often ignored by existing systems, even though theybenefit even more from a navigation system than sighted users as they arenot able to orientate with the help of usual signposts. For this reason, muchadditional information has to be gathered and considered by the componentsinvolved in navigation.
This thesis builds upon the previous insights of many students and co-workerswho worked at the MoCaInfo project in the past years. Those insights arecombined with own thoughts and other current research findings.
1.2. Structure of the Thesis
The document is divided into five major parts, which are briefly introduced inthe following enumeration.
3
1. Introduction
I. Project Overview gives a brief introduction into the MoCaInfo project, ex-plaining the stakeholders and resulting requirements for the informationand navigation system. Section 3 describes the components and datamodel, needed to realize the previously defined requirements. The partends with an explanation of MoCaInfo’s content model.
II. Mobile Application addresses the actual end user interface of MoCaInfo,the mobile Android application. The part begins with a brief introduc-tion. Followed by an explanation of the mobile application’s data syn-chronization feature, which enables users to use most features withouta network connection. After that, the pros and cons of a user interfacewhich follows the universal design approach and a dedicated low-visionuser interface are discussed.
III. Navigation deals with the problem of indoor and outdoor navigation. Atfirst existing map and navigation solutions are evaluated, in order to findout if and how they can be used in the given scenario. Section 10 explainsthe approach used for implementing an indoor and outdoor navigationsystem, using as many established technics and libraries as possible. Thefollowing sections outline additional information which have to be con-sidered in order to provide a good navigation experience for visuallyimpaired people. The navigation part ends with a description of the nav-igation component’s user interface and its software architecture.
IV. Indoor and Outdoor Positioning gives an overview about existing posi-tioning technologies and approaches. At this, it is distinguished betweenabsolute positioning approaches, which are able to determine the ab-solute position on earth and relative positioning approaches, which areonly able to detect changes in position. After this general explanation,the actual positioning system which has been developed for MoCaInfois introduced. To these belongs a Wi-Fi fingerprinting approach, whichis explained in section 17.5. Those Wi-Fi positions are reckoned with arelative positioning component, which is made of a step detection algo-rithm and a compass. Additionally, NFC and GPS information are usedfor position determination when available. The different algorithms andapproaches are explained in section 18.
4

1.2 Structure of the Thesis
V. Conclusions and Future Work summarizes the insights about mobile userinterfaces for visually impaired people as well as indoor and outdoornavigation and positioning. The thesis ends with thoughts about futurework for further improvements, followed by some final words how indoorpositioning and navigation may change within the next couple of years.
5
2. Requirements
2. Requirements
The following section describes the stakeholders involved in MoCaInfo. Basedon those stakeholder descriptions, functional and non-functional requirementsfor the system are defined.
The general purpose of MoCaInfo is to provide students, staff and guests ofTechnische Hochschule Mittelhessen with valuable, often location-based, in-formation. To achieve this basic goal, client applications for end users as wellas administrative applications for data acquisition need to be designed andimplemented.
As the overall development of MoCaInfo uses an agile approach, there is nocontract style list of requirements or anything similar. Instead user storieshave been described verbally, using the classical approach: “As a <role> Iwant to <feature/ability of the system> so that <value the role receives fromthe feature>” [1, p. 102ff].
Before user stories and requirements can be defined, it is common practice toanalyze the stakeholders who are involved in the software system[1, p. 119ff].
2.1. Stakeholders
At first glance there are two stakeholders, end users who use the system andadministrators who maintain the information system and its data. Lookingmore deeply into these stakeholders one notices that a more detailed separationis necessary. End users can be seen as a group which contains more preciselydefined stakeholders.
6
2.2 Functional Requirements
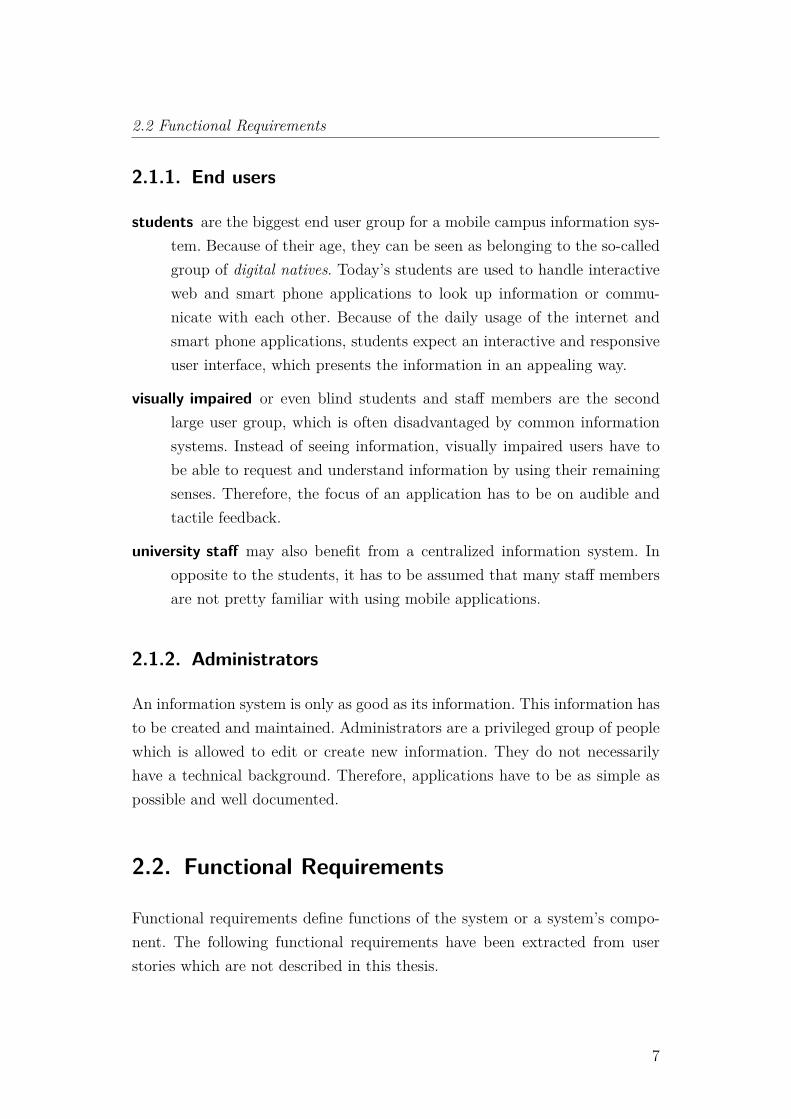
2.1.1. End users
students are the biggest end user group for a mobile campus information sys-tem. Because of their age, they can be seen as belonging to the so-calledgroup of digital natives. Today’s students are used to handle interactiveweb and smart phone applications to look up information or commu-nicate with each other. Because of the daily usage of the internet andsmart phone applications, students expect an interactive and responsiveuser interface, which presents the information in an appealing way.
visually impaired or even blind students and staff members are the secondlarge user group, which is often disadvantaged by common informationsystems. Instead of seeing information, visually impaired users have tobe able to request and understand information by using their remainingsenses. Therefore, the focus of an application has to be on audible andtactile feedback.
university staff may also benefit from a centralized information system. Inopposite to the students, it has to be assumed that many staff membersare not pretty familiar with using mobile applications.
2.1.2. Administrators
An information system is only as good as its information. This information hasto be created and maintained. Administrators are a privileged group of peoplewhich is allowed to edit or create new information. They do not necessarilyhave a technical background. Therefore, applications have to be as simple aspossible and well documented.
2.2. Functional Requirements
Functional requirements define functions of the system or a system’s compo-nent. The following functional requirements have been extracted from userstories which are not described in this thesis.
7
2. Requirements
2.2.1. Information System
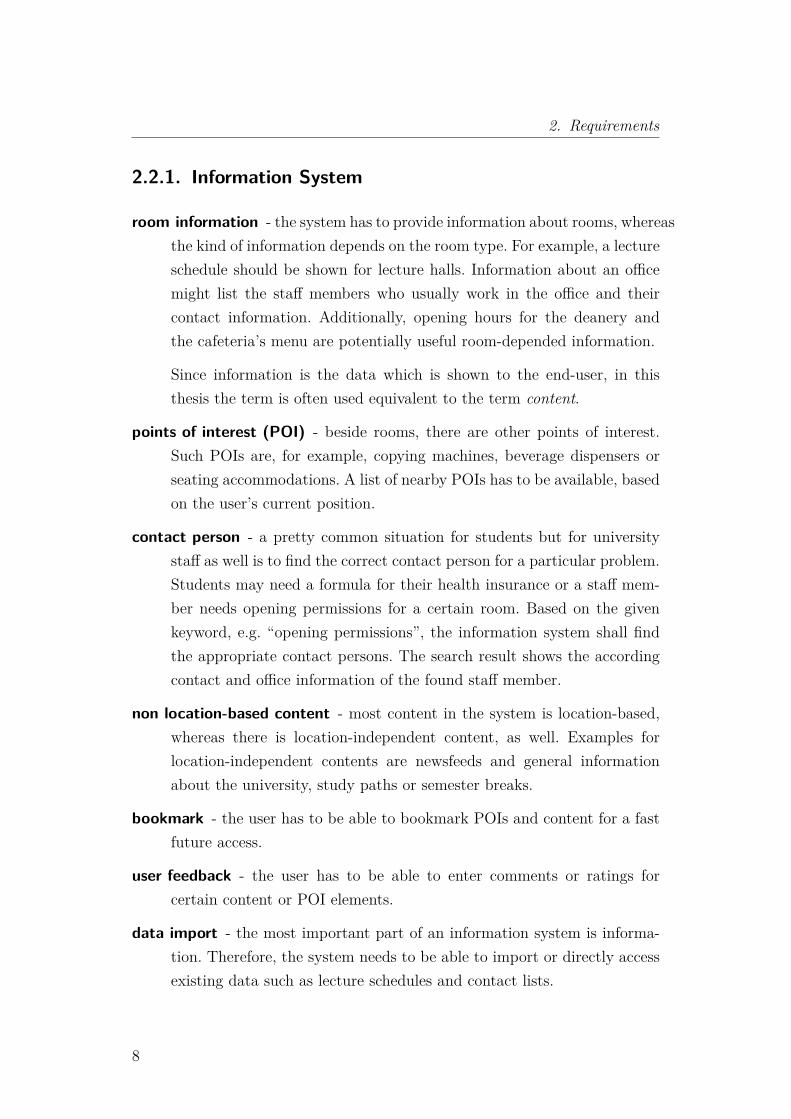
room information - the system has to provide information about rooms, whereasthe kind of information depends on the room type. For example, a lectureschedule should be shown for lecture halls. Information about an officemight list the staff members who usually work in the office and theircontact information. Additionally, opening hours for the deanery andthe cafeteria’s menu are potentially useful room-depended information.
Since information is the data which is shown to the end-user, in thisthesis the term is often used equivalent to the term content.
points of interest (POI) - beside rooms, there are other points of interest.Such POIs are, for example, copying machines, beverage dispensers orseating accommodations. A list of nearby POIs has to be available, basedon the user’s current position.
contact person - a pretty common situation for students but for universitystaff as well is to find the correct contact person for a particular problem.Students may need a formula for their health insurance or a staff mem-ber needs opening permissions for a certain room. Based on the givenkeyword, e.g. “opening permissions”, the information system shall findthe appropriate contact persons. The search result shows the accordingcontact and office information of the found staff member.
non location-based content - most content in the system is location-based,whereas there is location-independent content, as well. Examples forlocation-independent contents are newsfeeds and general informationabout the university, study paths or semester breaks.
bookmark - the user has to be able to bookmark POIs and content for a fastfuture access.
user feedback - the user has to be able to enter comments or ratings forcertain content or POI elements.
data import - the most important part of an information system is informa-tion. Therefore, the system needs to be able to import or directly accessexisting data such as lecture schedules and contact lists.
8
2.3 Non-Functional Requirements
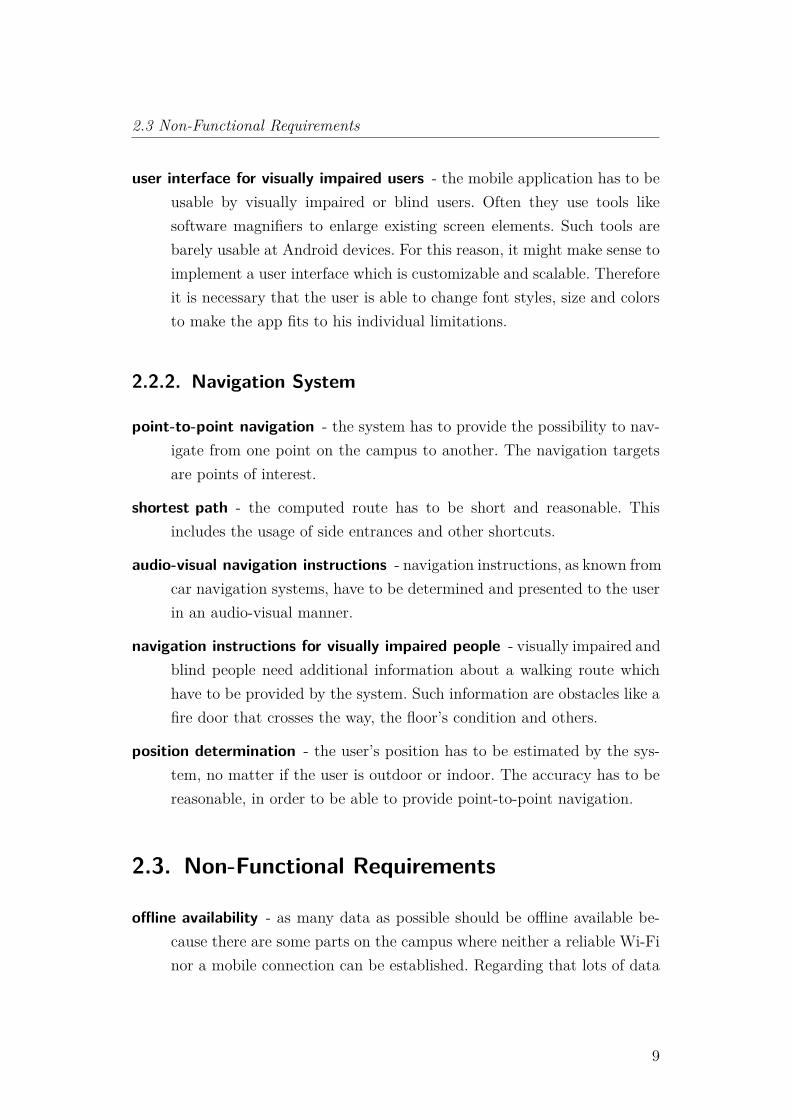
user interface for visually impaired users - the mobile application has to beusable by visually impaired or blind users. Often they use tools likesoftware magnifiers to enlarge existing screen elements. Such tools arebarely usable at Android devices. For this reason, it might make sense toimplement a user interface which is customizable and scalable. Thereforeit is necessary that the user is able to change font styles, size and colorsto make the app fits to his individual limitations.
2.2.2. Navigation System
point-to-point navigation - the system has to provide the possibility to nav-igate from one point on the campus to another. The navigation targetsare points of interest.
shortest path - the computed route has to be short and reasonable. Thisincludes the usage of side entrances and other shortcuts.
audio-visual navigation instructions - navigation instructions, as known fromcar navigation systems, have to be determined and presented to the userin an audio-visual manner.
navigation instructions for visually impaired people - visually impaired andblind people need additional information about a walking route whichhave to be provided by the system. Such information are obstacles like afire door that crosses the way, the floor’s condition and others.
position determination - the user’s position has to be estimated by the sys-tem, no matter if the user is outdoor or indoor. The accuracy has to bereasonable, in order to be able to provide point-to-point navigation.
2.3. Non-Functional Requirements
offline availability - as many data as possible should be offline available be-cause there are some parts on the campus where neither a reliable Wi-Finor a mobile connection can be established. Regarding that lots of data
9
2. Requirements
like room information and contact persons are valid for certain monthsor even years, further approves the reasonableness.
low resource consumption - the mobile application has to be able to runon lower midrange devices without limitations. Therefore, using efficientalgorithms and technologies to achieve the intended features is necessary.Furthermore, old Android versions, which are still wide-spread, have tobe supported.
maintainability - is important for any software project, but in this case it isparticularly important because many students only work at the projectfor several months. Therefore, it should be easy for students to makethemselves familiar with the project and its source code. To achieve this,any source code has to be written in Java because it is the first learnedprogramming language at Technische Hochschule Mittelhessen.
intuitive user interface - the user interface has to follow well-known user in-terface design patterns in order to make the usage as intuitive as possible.
10
3. Architecture
The requirements listed and explained in chapter 2 influence the software ar-chitecture. Therefore, the first step of creating the architecture is to describelogical components, needed to fulfill those requirements. Afterwards, the singlecomponents are transferred into a logical architecture. The chapter ends withan introduction to the system’s data model.
3.1. Component Overview
The term component does not define how it is actually implemented. In caseof MoCaInfo, some components are realized as standalone applications othershave a programming library behavior.
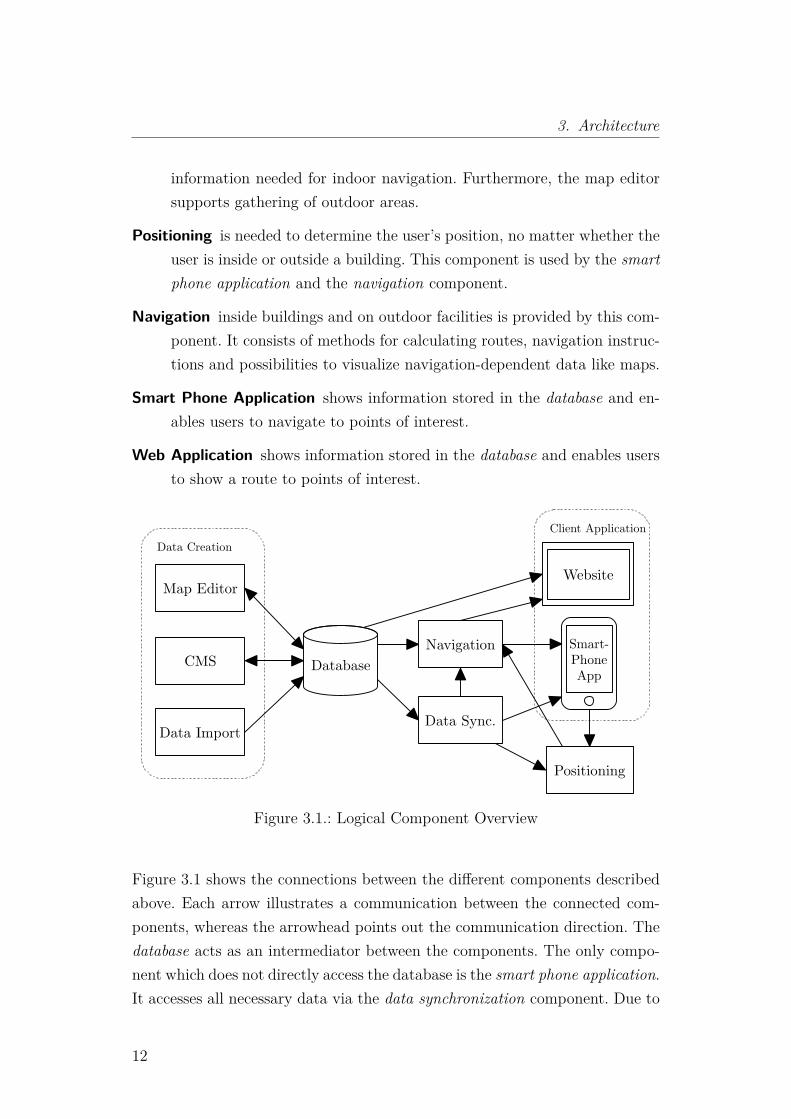
Content Management System enables privileged users to create, edit or dis-miss content which is available within the client applications.
Database stores data which is needed for the information system and compo-nents like positioning and navigation. The data itself is inserted by thecontent management system and the data import component.
Data Import uses existing data sources and stores them into the database. Toachieve this, the existing data has to be transformed into a specific datastructure.
Data Synchronization synchronizes data from the global database to a locallyavailable database. This is needed because the smart phone applicationhas to be as network independent as possible.
Map Editor enables privileged users to create indoor maps of buildings. Thosemaps include meta-information about buildings and its levels as well as
11
3. Architecture
information needed for indoor navigation. Furthermore, the map editorsupports gathering of outdoor areas.
Positioning is needed to determine the user’s position, no matter whether theuser is inside or outside a building. This component is used by the smartphone application and the navigation component.
Navigation inside buildings and on outdoor facilities is provided by this com-ponent. It consists of methods for calculating routes, navigation instruc-tions and possibilities to visualize navigation-dependent data like maps.
Smart Phone Application shows information stored in the database and en-ables users to navigate to points of interest.
Web Application shows information stored in the database and enables usersto show a route to points of interest.
Client ApplicationData Creation
Database
Data Import
CMS
Map Editor
Data Sync.
Navigation
Positioning
Website
Smart-PhoneApp
Figure 3.1.: Logical Component Overview
Figure 3.1 shows the connections between the different components describedabove. Each arrow illustrates a communication between the connected com-ponents, whereas the arrowhead points out the communication direction. Thedatabase acts as an intermediator between the components. The only compo-nent which does not directly access the database is the smart phone application.It accesses all necessary data via the data synchronization component. Due to
12
3.2 Logical Architecture
that approach, the smart phone application does not depend on an ongoingconnection to the database.
A more detailed description of the single components can be found in thefollowing chapters.
3.2. Logical Architecture
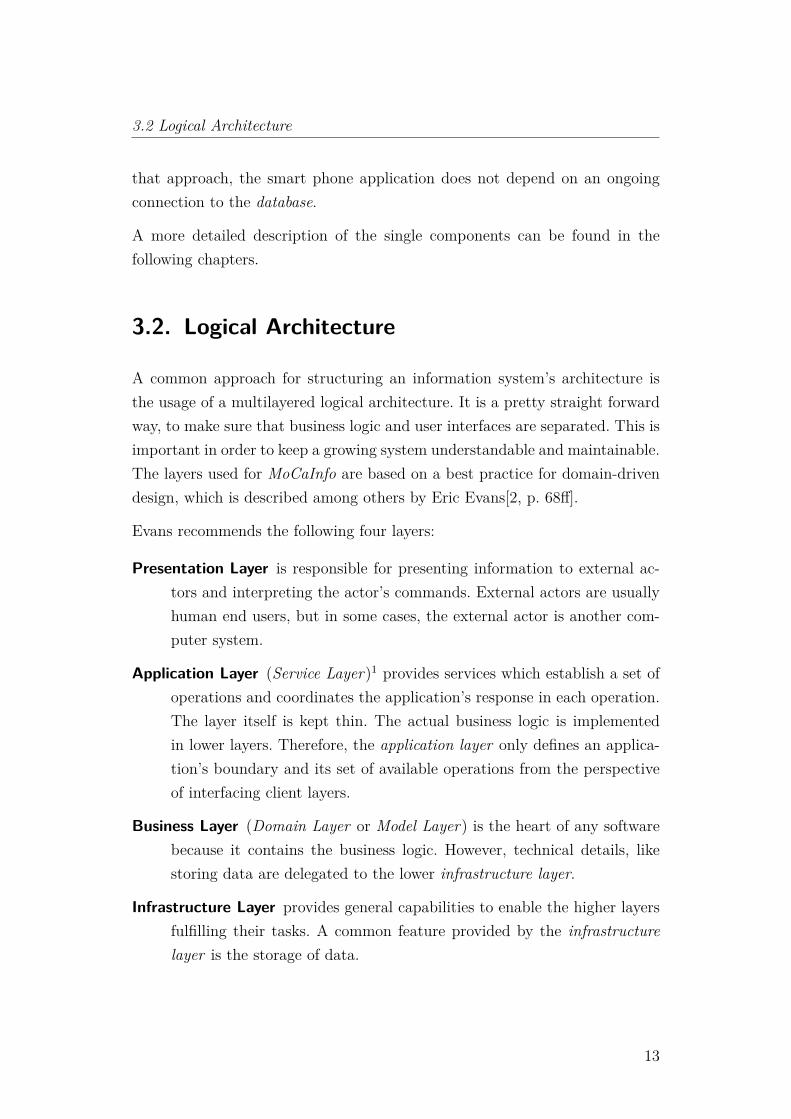
A common approach for structuring an information system’s architecture isthe usage of a multilayered logical architecture. It is a pretty straight forwardway, to make sure that business logic and user interfaces are separated. This isimportant in order to keep a growing system understandable and maintainable.The layers used for MoCaInfo are based on a best practice for domain-drivendesign, which is described among others by Eric Evans[2, p. 68ff].
Evans recommends the following four layers:
Presentation Layer is responsible for presenting information to external ac-tors and interpreting the actor’s commands. External actors are usuallyhuman end users, but in some cases, the external actor is another com-puter system.
Application Layer (Service Layer)1 provides services which establish a set ofoperations and coordinates the application’s response in each operation.The layer itself is kept thin. The actual business logic is implementedin lower layers. Therefore, the application layer only defines an applica-tion’s boundary and its set of available operations from the perspectiveof interfacing client layers.
Business Layer (Domain Layer or Model Layer) is the heart of any softwarebecause it contains the business logic. However, technical details, likestoring data are delegated to the lower infrastructure layer.
Infrastructure Layer provides general capabilities to enable the higher layersfulfilling their tasks. A common feature provided by the infrastructurelayer is the storage of data.
13
3. Architecture
Infrastructure Layer
Business Layer
Application Layer
Presentation Layer
...Node
CMSMap Editor
Navigation Service Positioning Service
Website
SmartPhoneApp.
DatabasePath Finding Data Abstraction
Data Sync.
Sync. Web Service
Geo. Lib.
Data AbstractionUtility
Data Service
POI
Models
NavigationUtility
Figure 3.2.: Layers Architecture
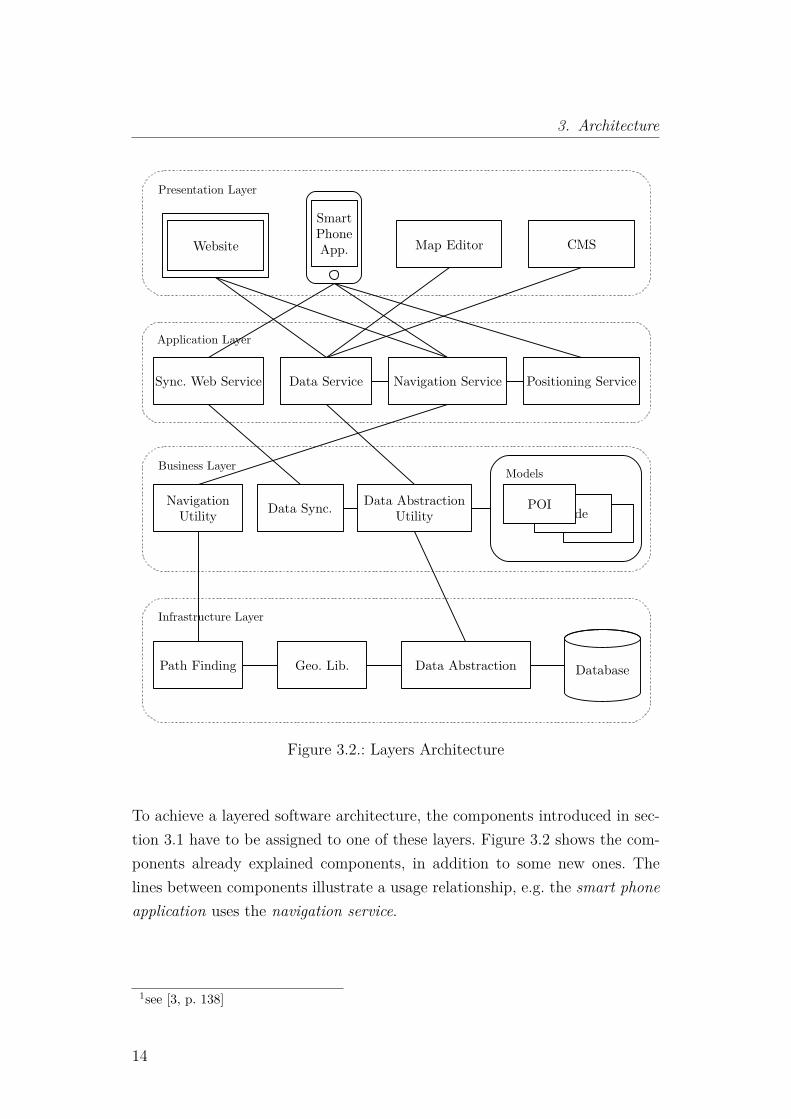
To achieve a layered software architecture, the components introduced in sec-tion 3.1 have to be assigned to one of these layers. Figure 3.2 shows the com-ponents already explained components, in addition to some new ones. Thelines between components illustrate a usage relationship, e.g. the smart phoneapplication uses the navigation service.
1see [3, p. 138]
14
3.2 Logical Architecture
The presentation layer holds all applications which are visible to end users:the website, the smart phone application, the map editor and the content man-agement system.
The application layer’s components act as interfaces between the actual busi-ness logic provided by components in the business layer and components fromthe presentation layer. The technical realization of these interfaces slightly dif-fer from component to component. In case of the synchronization web servicewhich is the interface for the incremental data synchronization, operations areprovided via a RESTful web API. Other components like data service justabstract direct access to other components from a developer’s point of view.Navigation service is used by the smart phone application and the website tocompute and visualize routes and other navigation-related information. Posi-tioning service is used by the smart phone application to determine the user’scurrent position.
The business layer’s components implement the business logic. Together withother components from the infrastructure layer, the navigation utility findsthe shortest path between two POIs and offers other navigation related op-erations to the upper layer. Another important part of the business layer isthe data model, which is represented by a couple of components on the rightside of the figure. It should be noted that figure 3.2 only shows the modelcomponents POI and node, but the complete architecture contains a lot of ad-ditional models, e.g. to represent content, Wi-Fi fingerprints and many more.The data synchronization component implements methods which are neededfor an incremental data synchronization. The data abstraction utility providesfunctions to load and modify model components.
The lowest layer offers pretty general, low level operations, like a pathfindingalgorithm or tools to convert between different geographical location formats.The data abstraction component implements the actual database access.
15
3. Architecture
3.2.1. Architectural Pattern: Layers
For a better understanding of the architecture described above, this sectionsummarizes and explains the general properties of the layers pattern. Thedescription is based on Buschmann et al.[4, p. 31ff].
The probably best-known example of a layered architecture is the ISO/OSI7-Layer model. The layered approach is considered to be better practice thanimplementing a protocol as a monolithic block because of several benefits. Firstof all, development tasks in a layered architecture can be distributed to dif-ferent developers or teams more easily because the different parts of differentlayers are more or less independent, if the pattern is used pervasive. Havingsemi-independent parts, also enables an easier exchange of individual compo-nents at a later date because the section of code, which has to be replaced, isclearly delimited.
Layer N-1
Layer NUser uses
Layer 1
highest level of abstraction
lowest level of abstraction
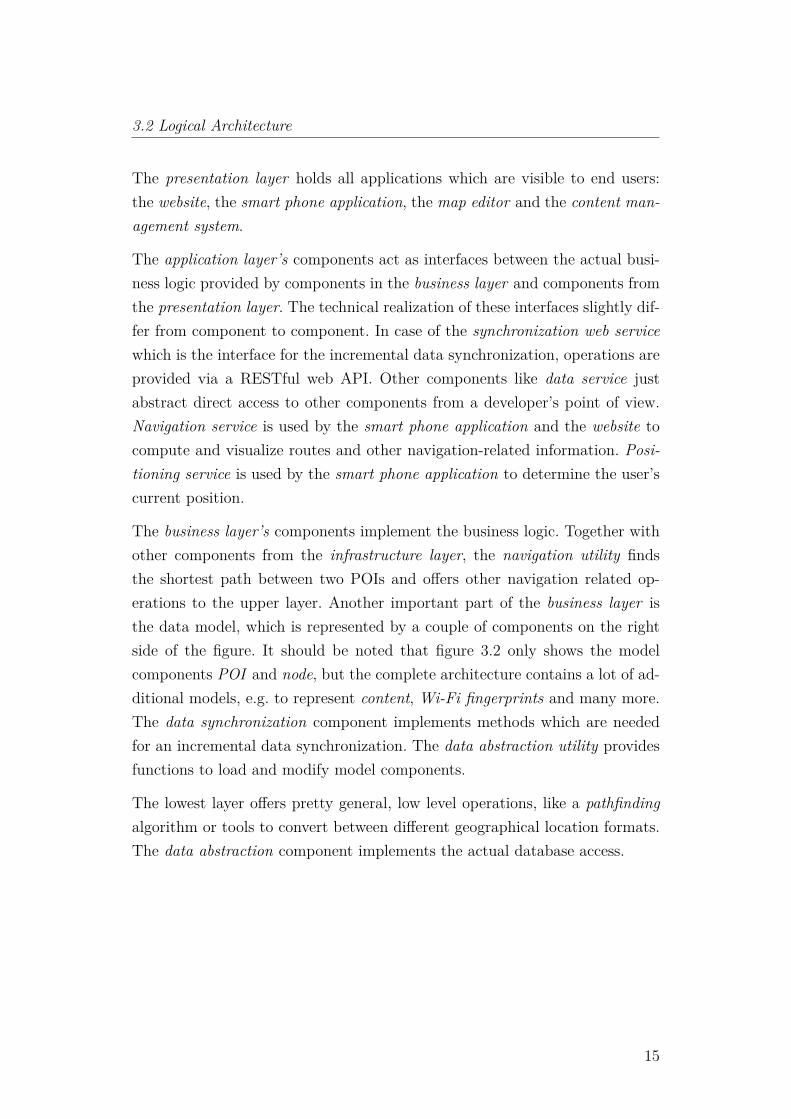
Figure 3.3.: Architectural Pattern: Layers
A typical system, which is predestined for a layers architecture, has differentlevels of abstraction. The uppermost layer starts with a pretty high-level of ab-straction, which usually acts as an interface to the user. The level of abstractiondecreases at lower layers. The higher levels rely on operations, provided by thelower level. As shown in figure 3.3 it is an essential principle of the patternthat any element of a layer depends only on elements in the same layer or onelements of the layer below.
16
3.3 Data Model
A single layer does not necessarily have to be composed of one single com-ponent. Often a layer is a complex entity, consisting of different componentswhich may even communicate with each other. To keep the advantage of a loosecoupling, it is important to abstract the communication between componentsat different layers by a layer interface.
3.3. Data Model
The following section gives an overview on the system’s data model. As it isused across all components, it can be seen as the lowest common factor of thedifferent components.
Category
Content ContentPart
Level NodeBuilding WiFiMeasurement
Comment
Fingerprint
Rating
Channel
Content
Location Positioning
User Feedback
POI
*
***
*1
1
*
*
1
1 * 1 * *1 1 *
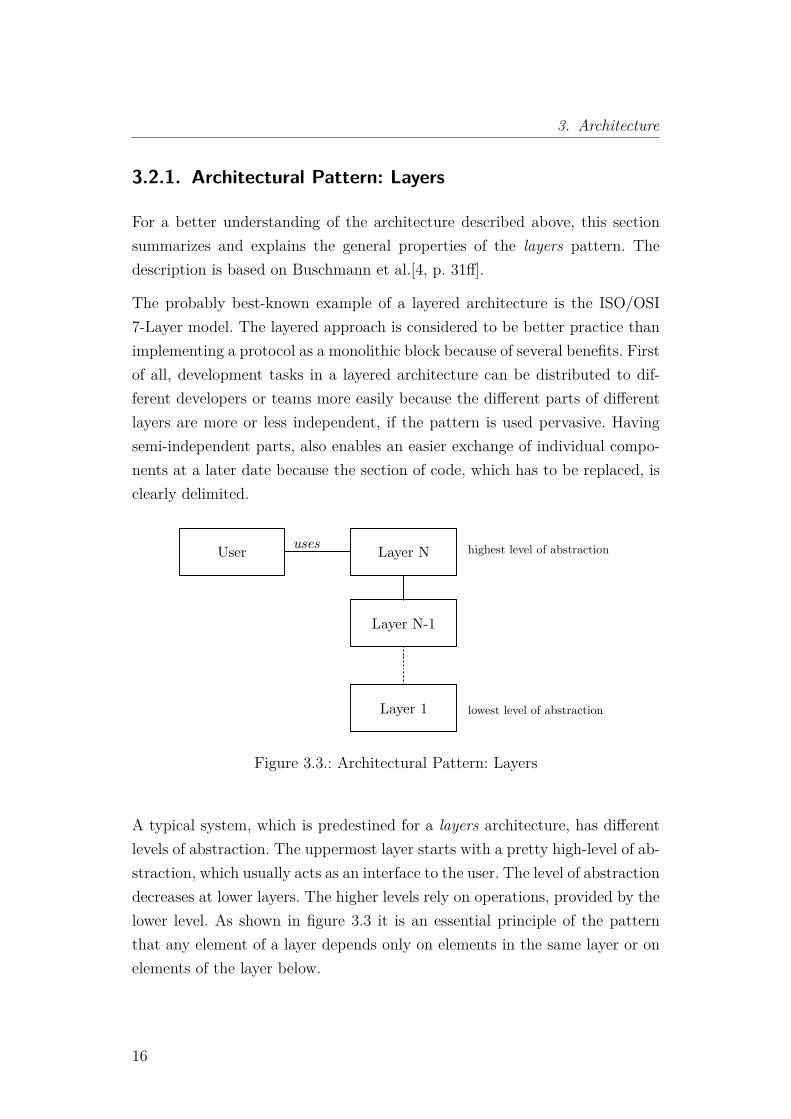
Figure 3.4.: Entity-Relationship Diagram of MoCaInfo’s Data Model
Figure 3.4 visualizes the data model’s main parts. For reasons of clarity, theentity-relationship diagram does not show any attributes or named relation-ships. The actual implementation of the data model is realized by a MySQLdatabase on the server side and an SQLite database on the mobile device,which are kept in sync.
17
3. Architecture
The different tables can be classed into four different logical categories. Thefirst one is user feedback which holds comments and ratings about content andPOIs.
Another logical category represents content, which also includes an identicallynamed table. Content may be assigned to so-called channels. Each channelrepresents a collection of content about a certain topic or addresses a certaininterest group. For example, there is a channel for all computer science studentswhich contains recent events about lecture cancellation and guest lectures. Thedetailed architecture and meaning of content is explained in chapter 4. A POIis represented by a describing content and a node which holds the geographiclocation. Therefore, the POI can be seen as a connector between the categoriescontent and location.
The actual location of a node is described by its geographical location and thebuilding plus level, whereas outdoor nodes are member of a pseudo building.
The positioning system uses a Wi-Fi fingerprint approach, details described insection 17.5. The according data is stored in the database tables fingerprintand Wi-Fi measurement.
18
4. Content Model and Managment
One of the most important aspect of an information system is the informationwhich it provides. In case of MoCaInfo, any information is considered to becontent. This chapter describes the content’s data model, followed by a shortintroduction of the content management system.
MoCaInfo’s content model, on the one hand, has to be flexible in order todescribe different kinds of information, but on the other hand it has to prescribea structure. This structure is needed, to visualize content in similar ways, nomatter whether it is a room schedule, the cafeteria menu or something else.
Furthermore, content has to be reusable. For example, a professor’s digitalbusiness card has to be shown as part of his office’s room information and ina list which shows all lecturers of the faculty.
The following section describes the concept of content parts followed by anintroduction to the content management system.
4.1. Content Parts
In order to achieve the goals of flexibility, structure and reusability a datamodel has been designed, which defines content as a set of content parts. Atthis, content is the object which is assigned to a POI or accessible via in-formation channels, and content part is the object which holds the actualinformation.
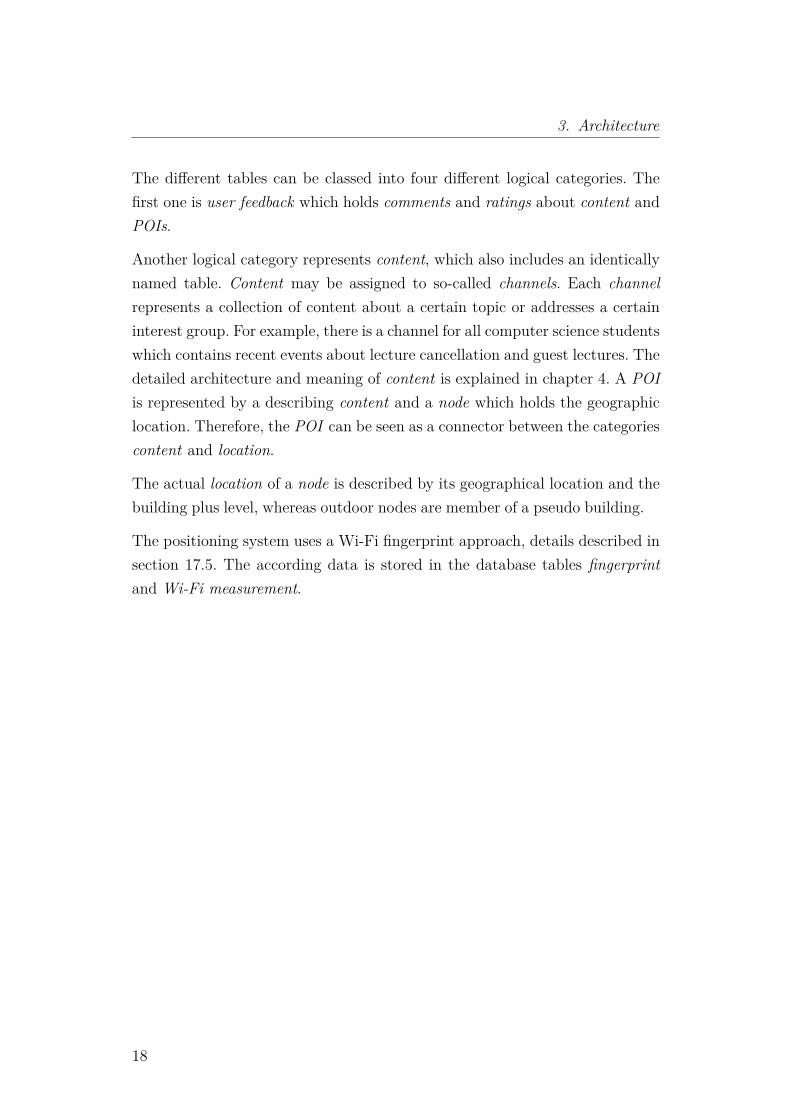
A content part consists of a header, an optional rich content and textual con-tent. The textual content can either be plain text or use HTML markups forbasic formatting. Rich content is defined by an URI and usually refers to anHTTP resource, e.g. an image or a video. Furthermore, the rich content can
19
4. Content Model and Managment
Lorem ipsum
Lorem ipsum dolor sit amet, consectetur adi- piscing elit. Aenean tincidunt rhoncus turpis, fringilla ornare leo feugiat nec.
Header
Rich Content
Textual Content
Figure 4.1.: Sketch of a Content Part, Using the Big Picture Template
point to internal resources, e.g. to show a floor map with the currently selectedPOI highlighted.
Office A20.1.09
Tel: +49 1234567Mail: [email protected] Hours: Mo. 13:00 – 14:00
Content Header
Big Picture Content Part without Textual Content
Mr. Smith
Floor Plan
Left Picture Content Part with HTML Formatted Textual Content
Figure 4.2.: Example Content Composed of Two Content Parts
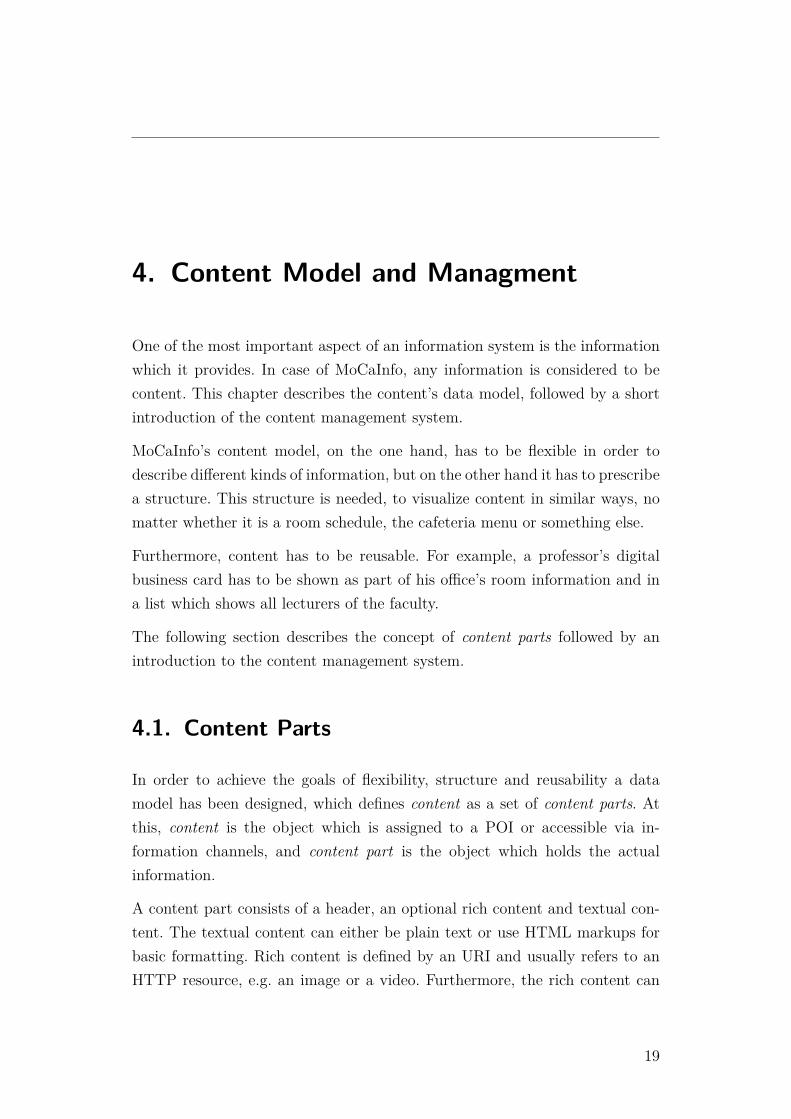
The arrangement of the rich content element and its size is defined by a tem-plate. Currently there are three templates. One template showing a screenwidth filling rich content. It is called the big picture template. Two other tem-plates only have a small square for rich content, either left or right beside thetextual content.
20
4.2 Content Management System
Besides flexibility and structuring, content parts contribute to offline availabil-ity. As headers and textual content are stored in the database, it is offlineavailable on the mobile device because of the data synchronization mechanismdescribed in section 6. Only external rich content elements, such as images, areloaded on demand and may require a network connection. But even those richcontent elements are cached, which makes them offline available when theyhave been loaded once before.
An example of a content object consisting of two different content parts isillustrated by figure 4.2.
4.2. Content Management System
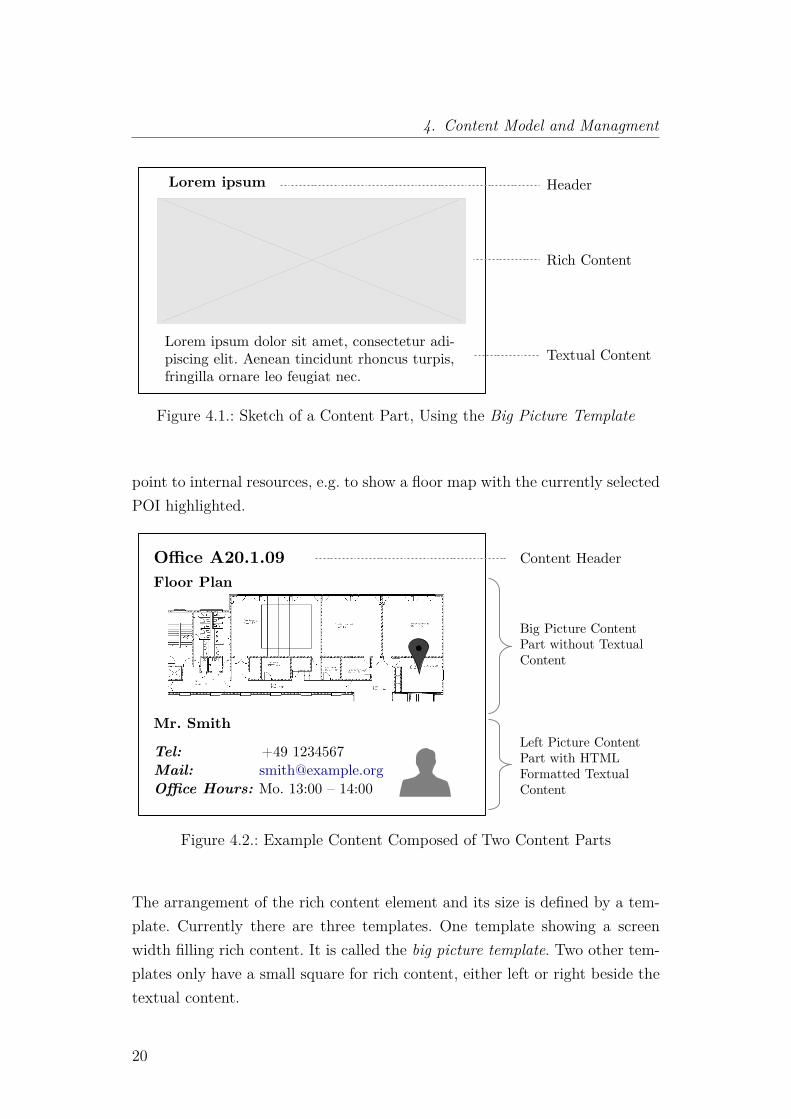
In order to create, edit and delete content, a content management system(CMS) has been developed. The CMS is web-based so that content adminis-trators only need a web browser to access the CMS.
Figure 4.3.: Screenshot of the Content Management System
At the current state of development, the content management system is notmuch more than a database editor, which enables privileged users to insert or
21
4. Content Model and Managment
update elements of the content_part and content database tables. In a futureversion, the CMS will assist the creation of certain content types, in order tomake sure that similar content is gathered in the same way. Candidates forunified content types are for example, room information, digital business cardsand general POI information.
4.2.1. Google Web Toolkit
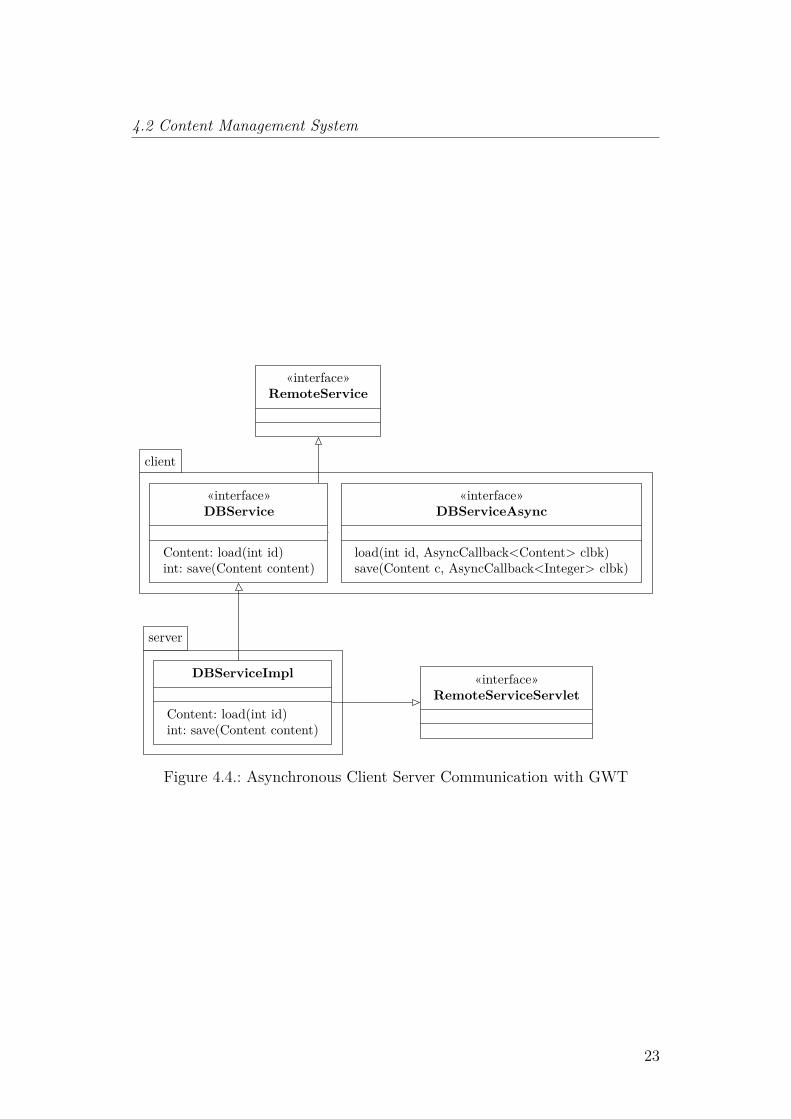
The web-based CMS has to be written in Java, since one of the non-functionalrequirements imposes that all MoCaInfo projects have to be implemented withthis programming language. Therefore, the Google Web Toolkit (GWT) hasbeen used for development. GWT allows web application developers, to writeplain Java sourcecode without taking care of web technologies. The GWTcompiler creates HTML, CSS and JavaScript files for the front-end and JavaEEservlets for server-sided application parts. Typical candidates for such servletsare components which interact with server resources, such as the database.
The communication between the client’s webinterface and servlets is asyn-chronous, using the AJAX technology. At sourcecode level, those asynchronousmethod calls are achieved by implementing a RemoteServiceServlet and aRemoteService. The client code calls an asynchronous interface RemoteServicewhich in turn delivers data by triggering a callback method. In figure 4.4, thisclass is DBServiceAsync. Interesting from a developers point of view is thefact that the asynchronous interface does not need an implementation at all.The implementation is done by the GWT framework automatically. Figure 4.4shows the Java classes involved in client-server communication, in a simplifiedUML diagram.
22
4.2 Content Management System
client
server
«interface»RemoteService
«interface»DBService
Content: load(int id)int: save(Content content)
«interface»DBServiceAsync
load(int id, AsyncCallback<Content> clbk)save(Content c, AsyncCallback<Integer> clbk)
«interface»RemoteServiceServlet
DBServiceImpl
Content: load(int id)int: save(Content content)
Figure 4.4.: Asynchronous Client Server Communication with GWT
23

Part II.
Mobile Application
25
5. Introduction to the Mobile Application
5. Introduction to the Mobile Application
Two applications exist which provide the system’s information to the users - awebsite and a mobile application. The website is nice to get a brief overviewabout certain information, but the mobile application is able to present thelocation-based information where it is needed. Furthermore, some of the pro-posed features, such as point-to-point navigation, cannot be achieved with awebsite.
Android is the targeted platform of the mobile application for various reasons.First of all, Android is the mobile operating system with the largest marketshare[5]. Second of all, Android devices offer all sensors and connectivity tech-nologies which are needed to fulfill the requirements explained in section 2. Inaddition, Android applications are written in Java, and there are lectures atthe university addressing Android development. Thus, there are students withthe precognition needed to develop such an application from scratch.
An alternative, which has been considered, is a hybrid cross-platform approach.Such cross-platform applications are implemented using HTML5, JavaScriptand CSS. By means of special frameworks, it is even possible to access nativeAPIs, e.g. to be able to use the device’s NFC reader. But those web-based so-lutions lack of techniques to support visually impaired end users. Furthermore,web and hybrid applications offer a worse responsiveness and user experiencecompared to native apps[6].
The application’s first prototype has been developed by Artur Klos and PatrickWinter, former students of Technische Hochschule Mittelhessen, during theirconclusion phase in 2011. Patrick Winter describes the development in de-tail in his bachelor thesis “Entwicklung eines mobilen Campusinformations-systems”2[7]. This chapter summarizes his thoughts, in addition to the further
2german for: “development of a mobile campus information system”
26
development since August 2011. The second major part of the mobile appli-cation, beside the information system is navigation and localization, which isdescribed in chapter IV starting at page 70.
The following sections use an Android-specific terminology. Those terms aredescribed in the glossary at the end of this thesisDue to a better flow of read-ing.
27
6. Incremental Data Synchronization
6. Incremental Data Synchronization
One of the mobile application’s key features is the ability to provide as muchinformation as possible without having an active network connection. This isimportant because Wi-Fi and cellular network connections cannot be assumedto be available all the time. For this reason, the server’s database has to besynchronized with the Android client’s database whenever a network connec-tion is available. This chapter describes the incremental data synchronization,including some issues which appeared during the development.
The data described in section 3.3 is stored globally in a MySQL database ata server. In order to be able to use one data abstraction library for server-sided and client-sided applications, the same database structure is needed onthe server and the Android client. Since Android does not support MySQLdatabases, the mobile application uses a SQLite database which is perfectlysupported by the Android framework.
Due to the two different database systems a MySQL database dump has tobe converted into a SQLite database. This database dump has to retain thedatabase structure as well as the data sets.
6.1. Database Dump
A common approach, described and discussed in many newsgroups is the shellscriptmysql2sqlite.sh3, created and published by a user called esperlu. The shellscript produces a MySQL database dump and uses a lot of regular expressionsto map the MySQL syntax to an SQLite compatible one. The resulting SQLstatements are used to create the corresponding SQLite database with the helpof SQLite command line utilities.
3https://gist.github.com/esperlu/943776
28
6.1 Database Dump
This approach worked well in the MoCaInfo environment at an early stateof development, only having some non-representative sample contents in thedatabase. With a growing amount of data, errors occurred either when creatingthe initial MySQL database dump or when creating the SQLite database fromthe modified dump. Reasons for these errors are some special characters andquotation marks inside the MySQL database’s content tables.
Improving the regular expressions which modify the MySQL dump is one pos-sibility to fix this issue. But, this approach further increases the complexity ofthe already pretty confusing and hardly maintainable regular expressions.
Therefore, an approach has been developed which does not need to change thedatasets with the help of regular expressions. Thus, the database’s data is sepa-rated from the database’s structure. The structure is created by mysql2sqlite.shas described above, but the MySQL dump is used for modification, only in-cludes the database’s structure without any data. This results in an emptySQLite database with the same database structure. The data is transferredby a tiny application which connects to the MySQL database server and theSQLite database. It selects all data from the MySQL database and inserts itto the empty SQLite database.
6.1.1. Performance Issues
Selecting the data from MySQL and inserting it row by row results in a criticalperformance issue with SQLite. Within a test environment, it took more than10 minutes to copy 1500 rows from MySQL to SQLite. This issue is caused bySQLite’s transaction management. SQLite is designed to wrap any SQL insertinto one atomic transaction[8]. As a result, inserting 1500 rows generate 1500database transactions. By default, a SQLite transaction waits until the datais safely stored on the hard disk’s surface before it completes.
According to SQLite’s FAQ[8] the maximum number of transactions per secondis about 60, at current 7200 rpm hard drives. In MoCaInfo’s test environment,the number of transactions per second is even limited to 2.5.
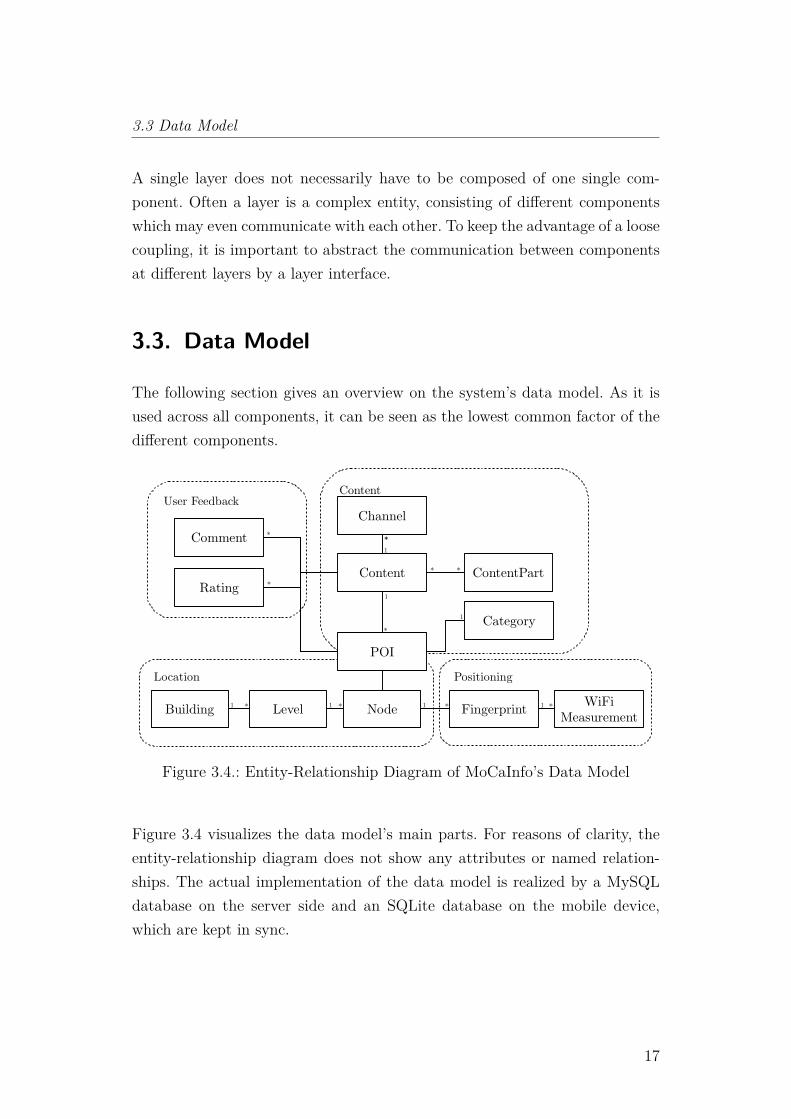
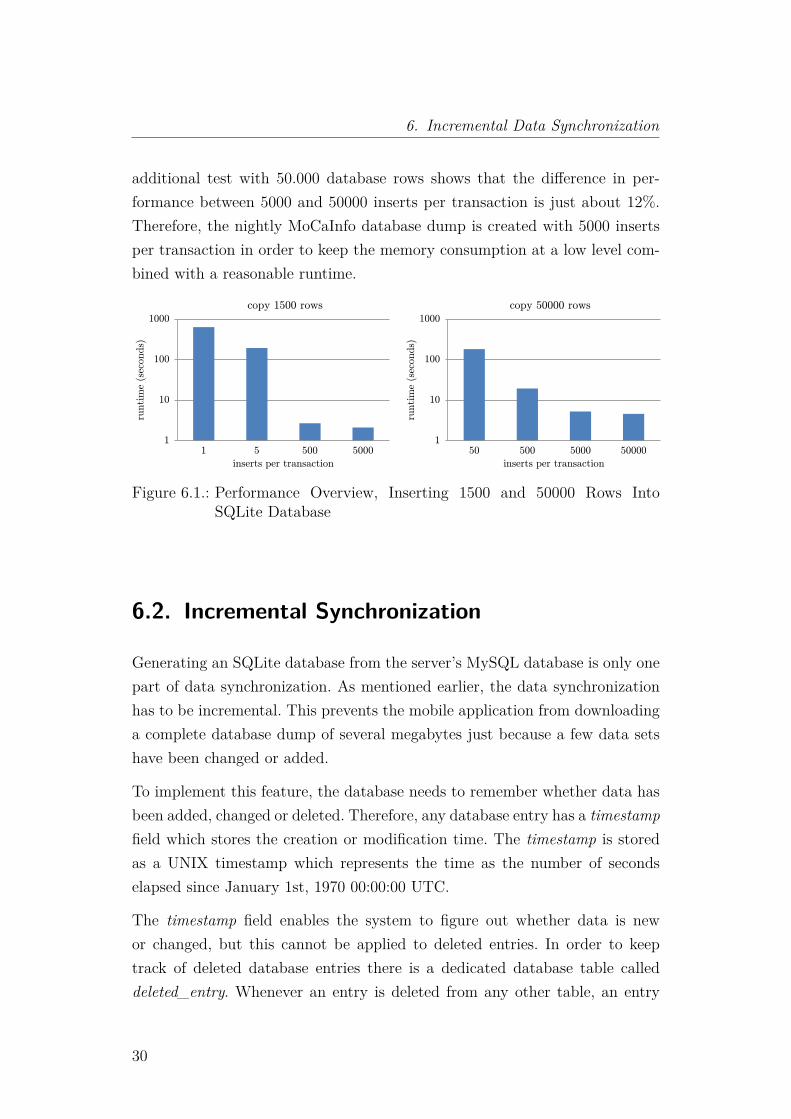
To get rid of this problem, multiple inserts have to be combined into onetransaction. Figure 6.1 shows the tremendous performance improvement. An
29
6. Incremental Data Synchronization
additional test with 50.000 database rows shows that the difference in per-formance between 5000 and 50000 inserts per transaction is just about 12%.Therefore, the nightly MoCaInfo database dump is created with 5000 insertsper transaction in order to keep the memory consumption at a low level com-bined with a reasonable runtime.
1
10
100
1000
1 5 500 5000
runti
me
(sec
onds)
inserts per transaction
1
10
100
1000
50 500 5000 50000
runti
me
(sec
onds)
inserts per transaction
copy 1500 rows copy 50000 rows
Figure 6.1.: Performance Overview, Inserting 1500 and 50000 Rows IntoSQLite Database
6.2. Incremental Synchronization
Generating an SQLite database from the server’s MySQL database is only onepart of data synchronization. As mentioned earlier, the data synchronizationhas to be incremental. This prevents the mobile application from downloadinga complete database dump of several megabytes just because a few data setshave been changed or added.
To implement this feature, the database needs to remember whether data hasbeen added, changed or deleted. Therefore, any database entry has a timestampfield which stores the creation or modification time. The timestamp is storedas a UNIX timestamp which represents the time as the number of secondselapsed since January 1st, 1970 00:00:00 UTC.
The timestamp field enables the system to figure out whether data is newor changed, but this cannot be applied to deleted entries. In order to keeptrack of deleted database entries there is a dedicated database table calleddeleted_entry. Whenever an entry is deleted from any other table, an entry
30
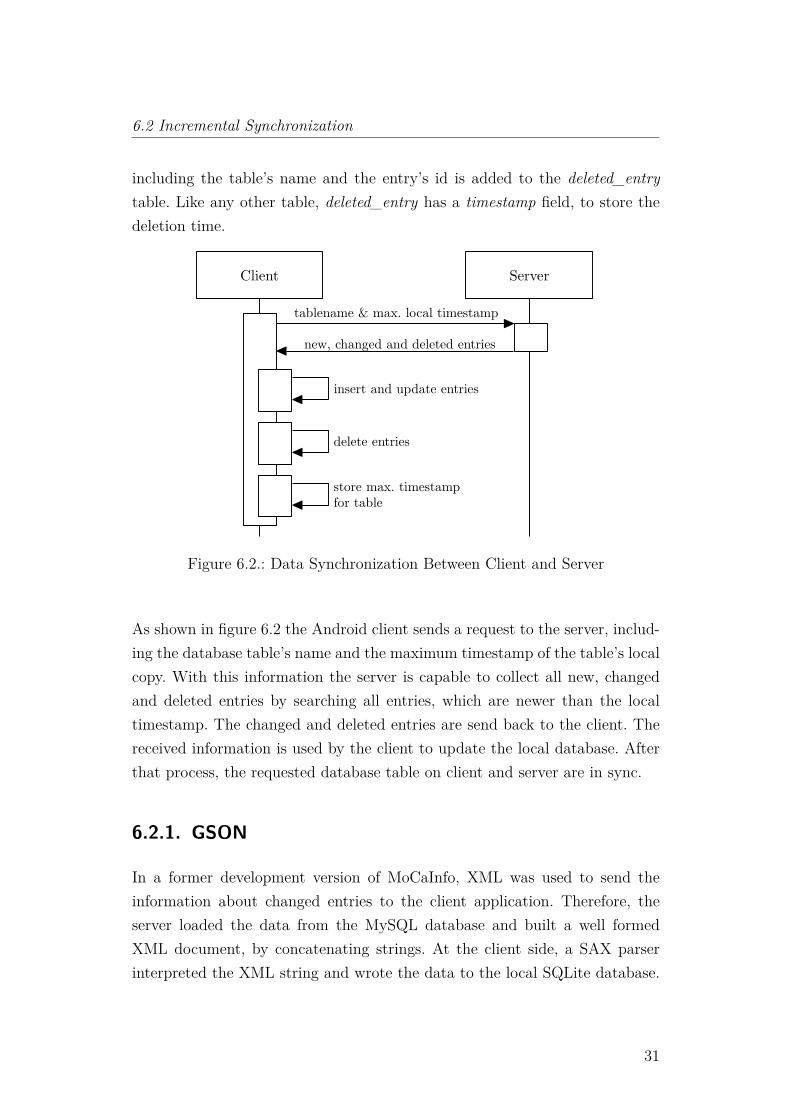
6.2 Incremental Synchronization
including the table’s name and the entry’s id is added to the deleted_entrytable. Like any other table, deleted_entry has a timestamp field, to store thedeletion time.
Client Server
tablename & max. local timestamp
new, changed and deleted entries
insert and update entries
delete entries
store max. timestampfor table
Figure 6.2.: Data Synchronization Between Client and Server
As shown in figure 6.2 the Android client sends a request to the server, includ-ing the database table’s name and the maximum timestamp of the table’s localcopy. With this information the server is capable to collect all new, changedand deleted entries by searching all entries, which are newer than the localtimestamp. The changed and deleted entries are send back to the client. Thereceived information is used by the client to update the local database. Afterthat process, the requested database table on client and server are in sync.
6.2.1. GSON
In a former development version of MoCaInfo, XML was used to send theinformation about changed entries to the client application. Therefore, theserver loaded the data from the MySQL database and built a well formedXML document, by concatenating strings. At the client side, a SAX parserinterpreted the XML string and wrote the data to the local SQLite database.
31
6. Incremental Data Synchronization
Both, the Android application and the web service which creates the XMLstring, are written in Java.
This XML solution has some problems, especially regarding the maintainabil-ity. Whenever the server’s XML structure changes, the client’s SAX parserneeds to be adjusted accordingly. The problem is that developers will not getany compile-time errors even if the SAX Parser and the XML generator areincompatible. As a result, incompatibilities and resulting errors only appearat runtime. A general programming paradigm is to catch errors as early aspossible because earlier errors are easier to handle. Therefore, compile-timeerrors are preferred to run-time errors[9].
UpdatedEntry
DataUpdate
DeletedEntry
ServerGson.toJson(...)
ClientGson.fromJson(...)
*
*
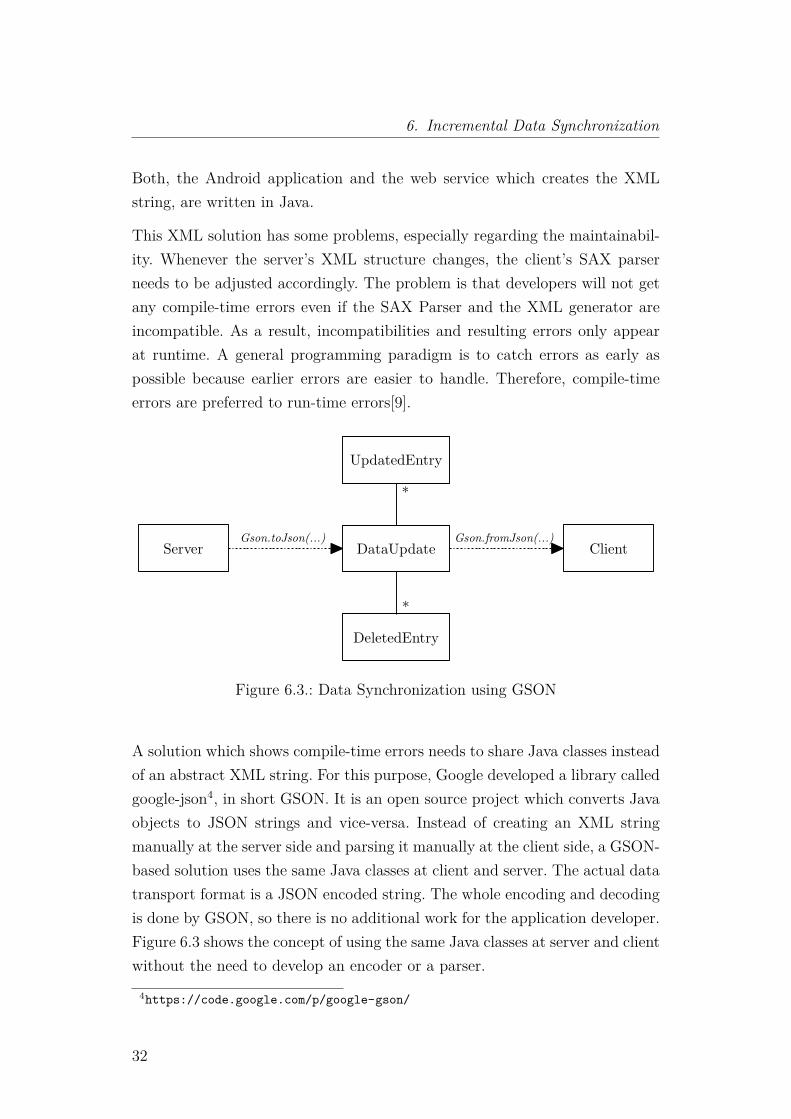
Figure 6.3.: Data Synchronization using GSON
A solution which shows compile-time errors needs to share Java classes insteadof an abstract XML string. For this purpose, Google developed a library calledgoogle-json4, in short GSON. It is an open source project which converts Javaobjects to JSON strings and vice-versa. Instead of creating an XML stringmanually at the server side and parsing it manually at the client side, a GSON-based solution uses the same Java classes at client and server. The actual datatransport format is a JSON encoded string. The whole encoding and decodingis done by GSON, so there is no additional work for the application developer.Figure 6.3 shows the concept of using the same Java classes at server and clientwithout the need to develop an encoder or a parser.
4https://code.google.com/p/google-gson/
32
7. User Interface
This chapter describes the mobile application’s user interface. Two differentapproaches for user interfaces for visually impaired people are discussed. Af-terwards, the graphical user interface is introduced followed by a descriptionof a textual user interface. The chapter ends with an evaluation of the chosenuser interface approach.
The user interface of an application is the system by which human users inter-act with the machine. A user interface has to provide the application’s featuresin a feasible and appealing way. In case of MoCaInfo’s mobile application, thereare few additional things to consider, regarding the accessibility, which is ig-nored by most mobile applications.
7.1. User Interfaces for Visually Impaired People
As mentioned in section 2 visually impaired or blind people have totally dif-ferent requirements for a user interface compared to sighted people. Sightedusers tend to like fancy, colored user interfaces with fluid animations and tran-sitions. For a better look and feel, buttons are often replaced by nice lookingicons without any textual description. Those kinds of user interfaces, howeverare not at all appropriate for visually impaired users.
In fact, there are two different approaches to design user interfaces for visuallyimpaired. The first possibility is to consider Android’s accessibility featureswhen designing the graphical user interface for sighted people. Blind peoplethen should be able to use the usual graphical interface with the help of gesturesand screen readers[10]. This concept is also known as Universal Design[11]. Asa second approach an application can provide two different user interfaces,whereas one uses so-called low-vision controls instead of graphical ones.
33
7. User Interface
7.1.1. Low-Vision User Interface
According to Sierra and Togores[12] the best way to afford a good user experi-ence for visually impaired and blind people is to design the app directly for thisuser group. They say that the result usually is much better then designing anapplication for sighted people and try to make it usable for visually impairedby using accessibility tools like screen readers afterwards.
A usable accessible design uses low-vision controls. Those controls are designedto be larger than usual controls for sighted users and tend to use a pretty highcontrast, whereas white on black is the best contrast for most visual impair-ments. The different controls and lists have to be usable through gestures.Furthermore, haptic feedback and text-to-speech should be used whenever itis possible. Besides that, low-vision controls should be customizable in size andcolor to fit best to the users’ capabilities and disabilities.
These statements match with those of Niehaus[13], a former student of Tech-nische Hochschule Mittelhessen, who is visually impaired himself. Beside theidea of large, high contrast controls, gestures and text-to-speech, he also statessome possible incompatibilities which might occur between the low-vision userinterface and other installed accessibility utilities. A common example he men-tions is a conflict between a screen reader and an app which does self-voicing.One the on hand, self-voicing applications assist users by using text-to-speech,a classical feature of a low-vision user interface. On the other hand, screenreaders try to read out the currently selected UI element. In many cases thismeans that a text is read twice, which is a really disturbing user experience.
7.1.2. Universal Design
Universal Design is a term which has been coined by Ronald L. Mace an ar-chitect and product designer. In one of his last works, he explains his ideastogether with Molly Follette Story and James Mueller[11]. The concept of uni-versal design describes a design which addresses each human, no matter whatage, size, abilities, talents and preferences he or she has. To make productdesigners understand the various human abilities, he grouped them into cog-nition, vision, hearing and speech, body function, arm function, hand function
34
7.1.2.1 Android Design Patterns: Accessibility
and mobility. By considering the different capabilities and needs, a productshould be easily usable by all potential users, without the need to design adistinguished product for each user group.
7.1.2.1. Android Design Patterns: Accessibility
The Android design patterns by Google were created in accordance with uni-versal design principles[10]. Together with the following Android accessibilityfeatures and tools, applications which are appealing for sighted users shouldbe usable by visually impaired users, too.
TalkBack is a pre-installed screen reader. It uses spoken feedback to describethe results of actions, such as launching an app or events such as notifi-cations.
Explore by Touch is a system feature that works together with TalkBack. Itallows users to touch the device’s screen and hear what is under theirfinger via spoken feedback.
Accessibility Settings allows modification to display and sound options, suchas increasing text size or changing the speed of text-to-speech output.
In order to work correctly, this requires that application developers and de-signers follow some principles. The first principle from the user’s perspectiveis “I should always know where I am” [10]. To accomplish this principle, theuser needs feedback while navigating through an application in order to beable to create a mental model of where he or she is. For most users, this canbe achieved by a visual and haptic feedback during the navigation, such aslabels, icons or touch feedback. As described in section 7.1.1 users with lowvision benefit from verbal descriptions and large visuals with high contrast.Furthermore, the navigation should be intuitive, which can be achieved bydesigning well-defined and clear task flows with minimal navigation steps. Es-pecially major user tasks should be reached within a minimum amount of stepsor commands. In order to be able to control the application via accessibilitygestures, any task needs to be accessible via focusable controls.
35
7. User Interface
In addition, touch targets should have a size of 48 dp at least. This is importantfor sighted users to be able to touch the desired button and for visual impairedusers to be able to find it via Explore by Touch.
In order to let TalkBack read out reasonable descriptions for any kind of impor-tant user interface element, a content description has to be applied. A contentdescription is particularly needed for touch controls which only use an iconwithout any textual description. In this case, the content description is usedfor text-to-speech.
To sum things up, an accessible user interface should have an intuitive navi-gation, touch targets should not be too small and control elements should belabeled meaningfully.
7.1.2.2. Implementation
One of the key concerns for developers or project managers regarding accessi-bility is the additional effort necessary to achieve a good result in comparisonto the relatively low amount of benefiting users.
When looking at the recommendations mentioned in the last section, one no-tices that most advices also improve the user interface for non-visually impairedusers so they should be regarded anyway. Other accessibility needs like labeleduser interface elements and a focusable navigation can be achieved by a fewsimple changes[14].
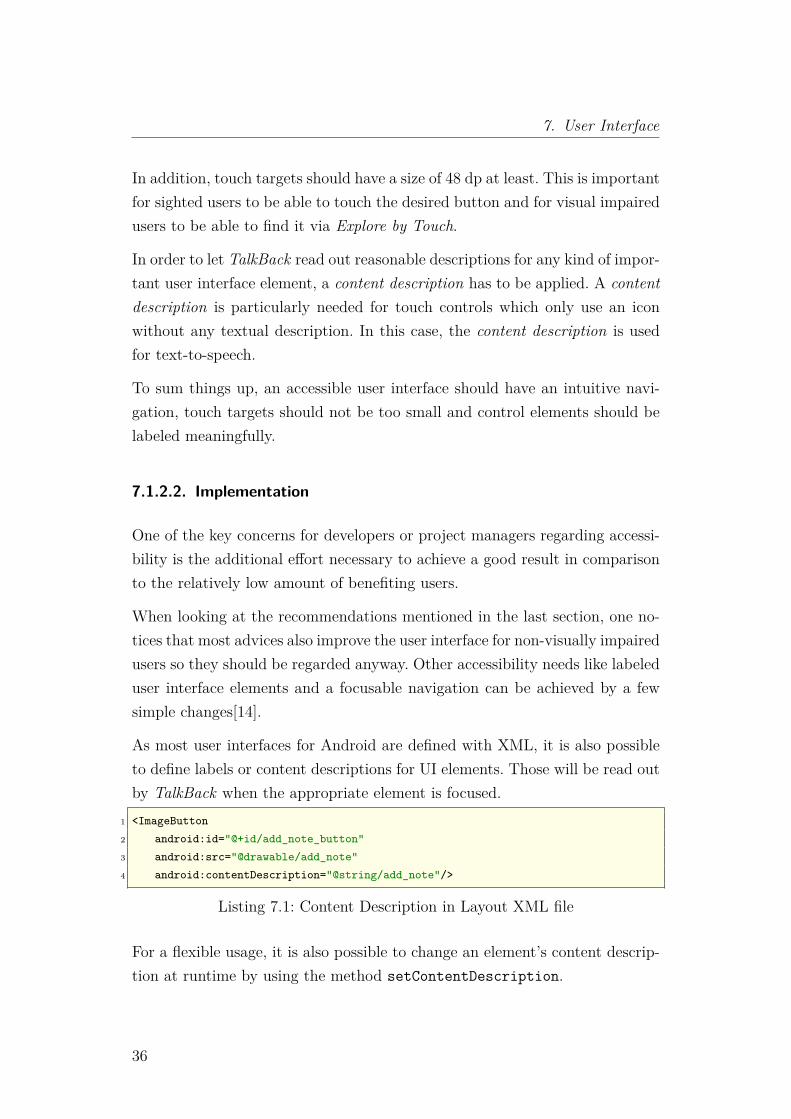
As most user interfaces for Android are defined with XML, it is also possibleto define labels or content descriptions for UI elements. Those will be read outby TalkBack when the appropriate element is focused.
1 <ImageButton2 android:id="@+id/add_note_button"3 android:src="@drawable/add_note"4 android:contentDescription="@string/add_note"/>
Listing 7.1: Content Description in Layout XML file
For a flexible usage, it is also possible to change an element’s content descrip-tion at runtime by using the method setContentDescription.
36
7.1.2.3 History of Accessibility in Android
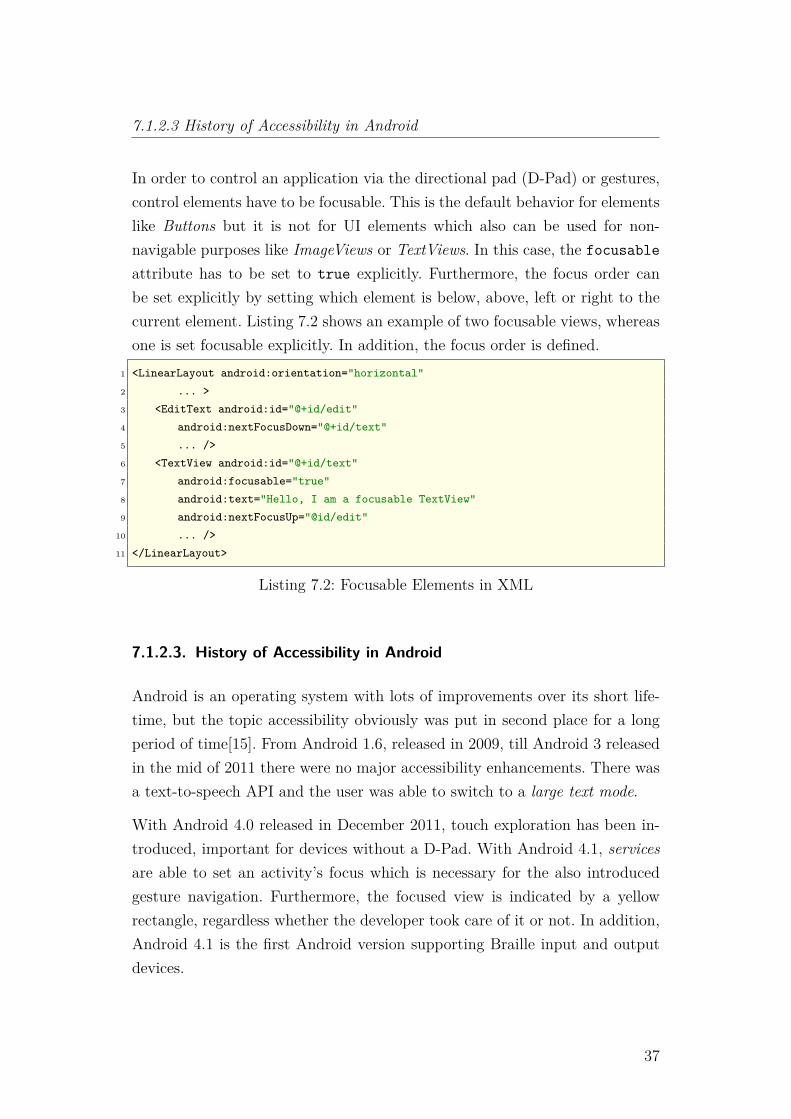
In order to control an application via the directional pad (D-Pad) or gestures,control elements have to be focusable. This is the default behavior for elementslike Buttons but it is not for UI elements which also can be used for non-navigable purposes like ImageViews or TextViews. In this case, the focusableattribute has to be set to true explicitly. Furthermore, the focus order canbe set explicitly by setting which element is below, above, left or right to thecurrent element. Listing 7.2 shows an example of two focusable views, whereasone is set focusable explicitly. In addition, the focus order is defined.
1 <LinearLayout android:orientation="horizontal"2 ... >3 <EditText android:id="@+id/edit"4 android:nextFocusDown="@+id/text"5 ... />6 <TextView android:id="@+id/text"7 android:focusable="true"8 android:text="Hello, I am a focusable TextView"9 android:nextFocusUp="@id/edit"
10 ... />11 </LinearLayout>
Listing 7.2: Focusable Elements in XML
7.1.2.3. History of Accessibility in Android
Android is an operating system with lots of improvements over its short life-time, but the topic accessibility obviously was put in second place for a longperiod of time[15]. From Android 1.6, released in 2009, till Android 3 releasedin the mid of 2011 there were no major accessibility enhancements. There wasa text-to-speech API and the user was able to switch to a large text mode.
With Android 4.0 released in December 2011, touch exploration has been in-troduced, important for devices without a D-Pad. With Android 4.1, servicesare able to set an activity’s focus which is necessary for the also introducedgesture navigation. Furthermore, the focused view is indicated by a yellowrectangle, regardless whether the developer took care of it or not. In addition,Android 4.1 is the first Android version supporting Braille input and outputdevices.
37
7. User Interface
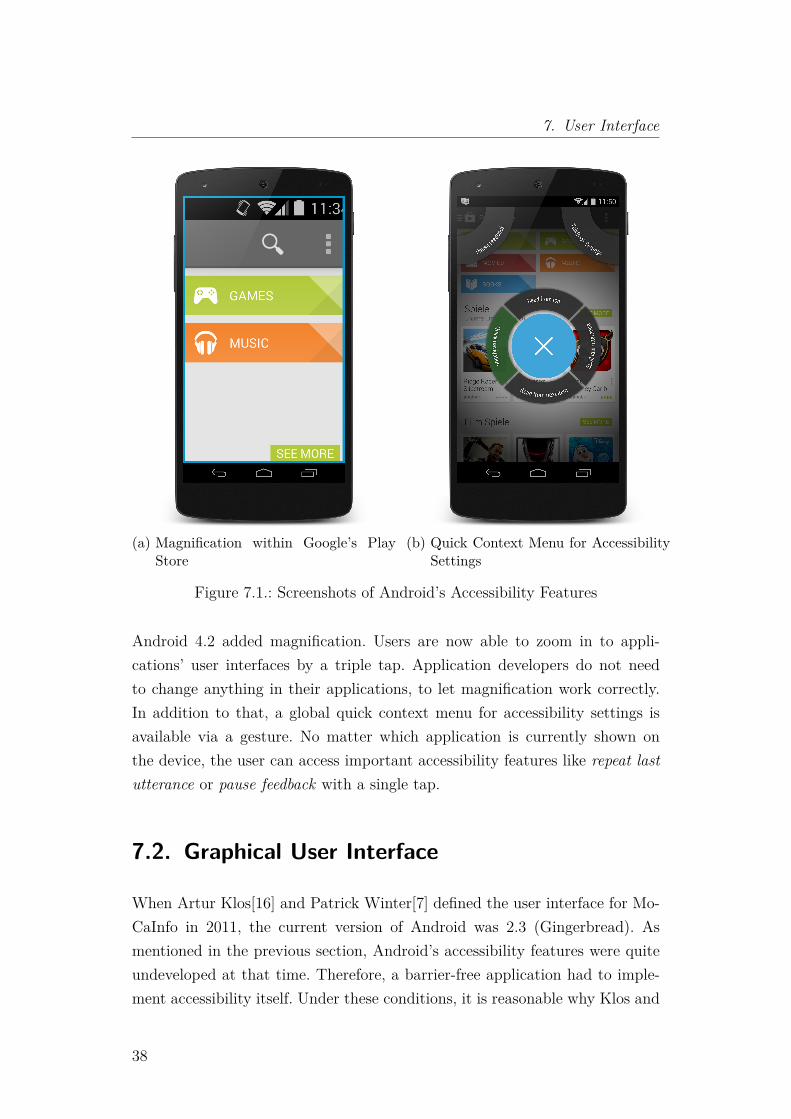
(a) Magnification within Google’s PlayStore
(b) Quick Context Menu for AccessibilitySettings
Figure 7.1.: Screenshots of Android’s Accessibility Features
Android 4.2 added magnification. Users are now able to zoom in to appli-cations’ user interfaces by a triple tap. Application developers do not needto change anything in their applications, to let magnification work correctly.In addition to that, a global quick context menu for accessibility settings isavailable via a gesture. No matter which application is currently shown onthe device, the user can access important accessibility features like repeat lastutterance or pause feedback with a single tap.
7.2. Graphical User Interface
When Artur Klos[16] and Patrick Winter[7] defined the user interface for Mo-CaInfo in 2011, the current version of Android was 2.3 (Gingerbread). Asmentioned in the previous section, Android’s accessibility features were quiteundeveloped at that time. Therefore, a barrier-free application had to imple-ment accessibility itself. Under these conditions, it is reasonable why Klos and
38
7.2.1.1 Dashboard
Winter designed two different user interfaces instead of choosing a universaldesign. This section describes the graphical user interface for sighted peopleand its design patterns.
7.2.1. Design Patterns
Even for user interfaces, which do not take care of accessibility, it is highlyrecommended to use user interface design patterns. Design patterns becamecommon practice since Gamma et al. released the book Design Patterns: El-ements of Reusable Object-oriented Software[17] in 1995. The design patternsdescribed in it are targeting the software design at source code level, but theprinciple of patterns has been adapted for user interface design as well. A de-sign pattern describes a reusable solution for a defined problem class within agiven context. User interface design patterns do the same for user interfaces.Users, as well as developers, benefit from them. From a user’s perspective, ap-plications which use well-known UI design patterns, are easier to use becausethe user probably already has used a similar user interface before. From adeveloper’s perspective UI design patterns are important for various reasons.One reason is that UI design patterns are usually highly accepted by usersif used in the right context. This leads to a better user satisfaction. Further-more, a developer does not need to reinvent the wheel. In most cases, thereare libraries which enable developers to implement UI design patterns with aminimal amount of effort
UI design patterns for Android are described by Google itself[18] as well as byvarious authors who have a focus on mobile user experience and mobile userinterfaces, e.g. Lehtimaki. The following descriptions are based on one of hisbooks[19].
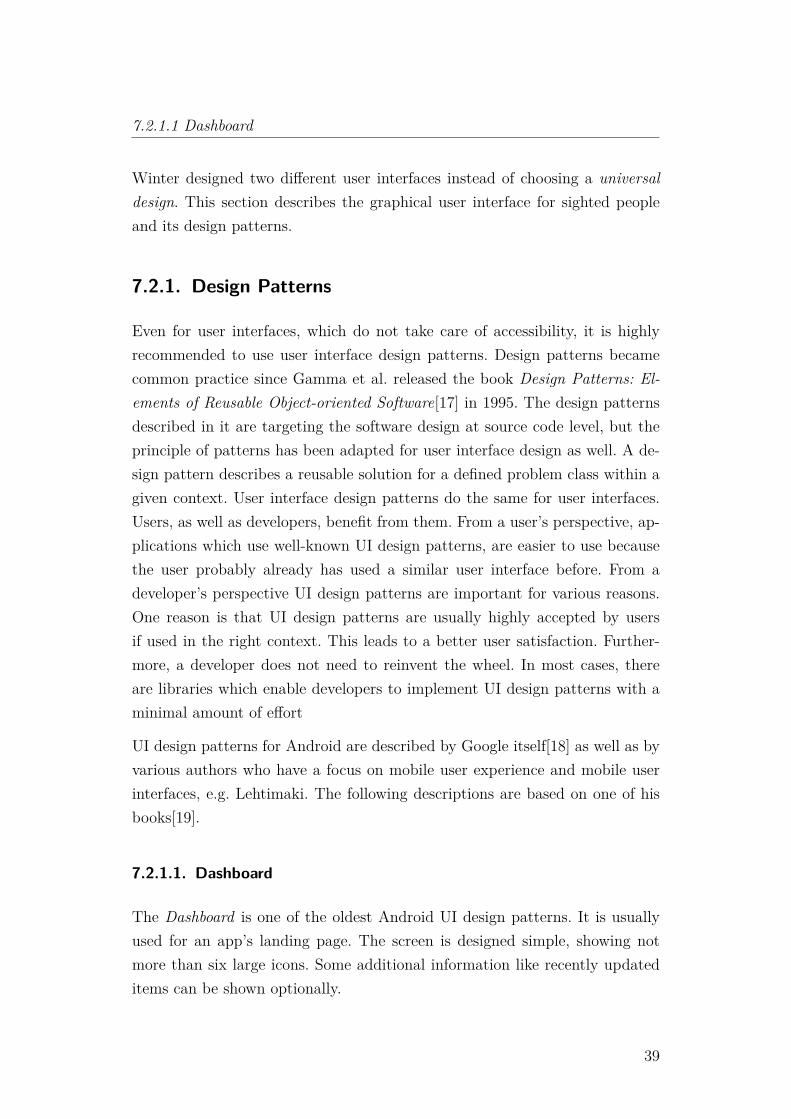
7.2.1.1. Dashboard
The Dashboard is one of the oldest Android UI design patterns. It is usuallyused for an app’s landing page. The screen is designed simple, showing notmore than six large icons. Some additional information like recently updateditems can be shown optionally.
39
7. User Interface
The design pattern is recommended for applications with more than one logicalpart. Any dashboard icon provides a direct link to the appropriate part of theapplication. In case of MoCaInfo candidates for dashboard icons are news,nearest POIs, bookmarks, navigation, search and QR code scanner.
(a) MoCaInfo (b) Evernote
Figure 7.2.: Examples of the Dashboard UI Design Pattern
7.2.1.2. Action Bar
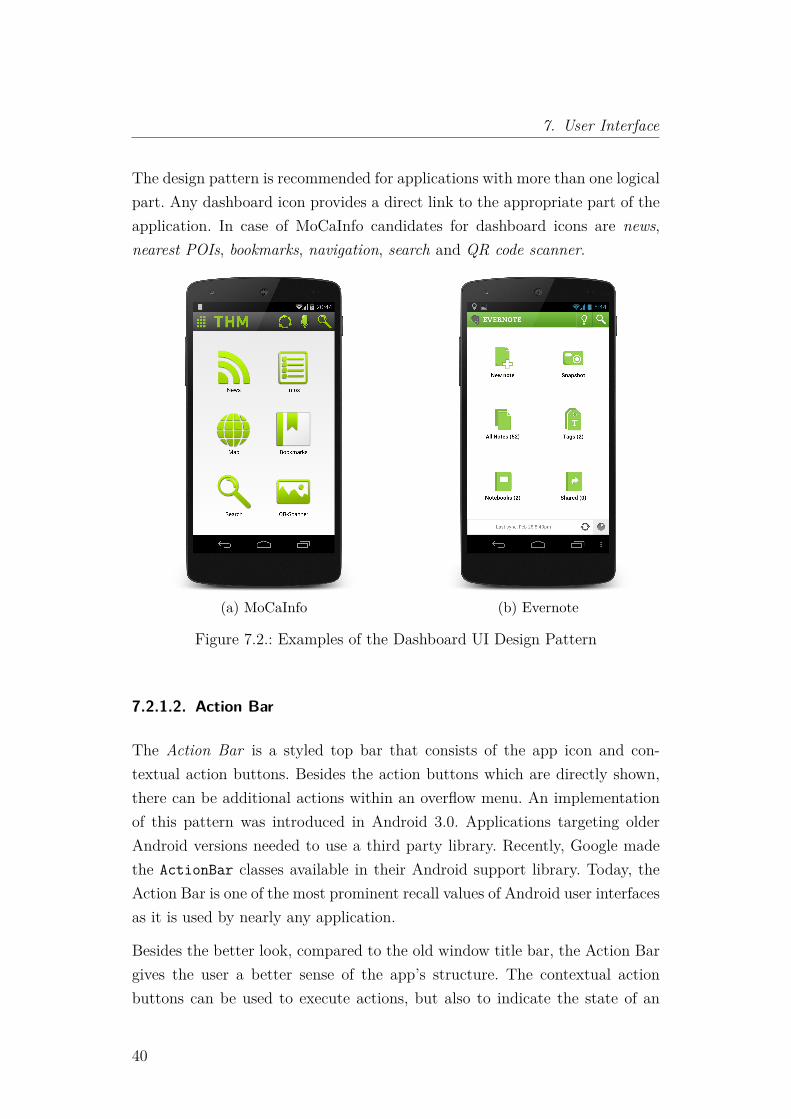
The Action Bar is a styled top bar that consists of the app icon and con-textual action buttons. Besides the action buttons which are directly shown,there can be additional actions within an overflow menu. An implementationof this pattern was introduced in Android 3.0. Applications targeting olderAndroid versions needed to use a third party library. Recently, Google madethe ActionBar classes available in their Android support library. Today, theAction Bar is one of the most prominent recall values of Android user interfacesas it is used by nearly any application.
Besides the better look, compared to the old window title bar, the Action Bargives the user a better sense of the app’s structure. The contextual actionbuttons can be used to execute actions, but also to indicate the state of an
40
7.2.1.3 Quick Actions
application, e.g. if it is currently loading data or not. Furthermore, ActionBars can be supplemented with a search capability. Both, loading indicationand searching of is used in MoCaInfo.
(a) MoCaInfo (b) Google Play Store
(c) MoCaInfo (Search) (d) Google Play Store (Search)
Figure 7.3.: Examples of the Action Bar UI Design Pattern
7.2.1.3. Quick Actions
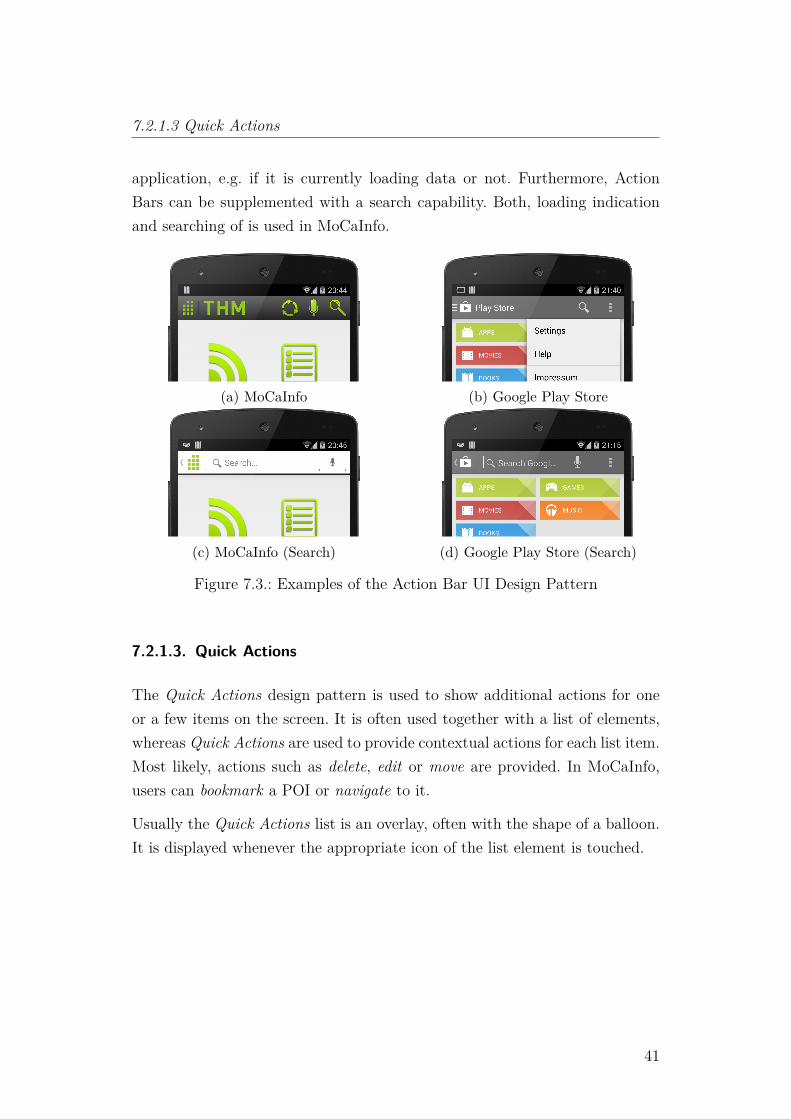
The Quick Actions design pattern is used to show additional actions for oneor a few items on the screen. It is often used together with a list of elements,whereas Quick Actions are used to provide contextual actions for each list item.Most likely, actions such as delete, edit or move are provided. In MoCaInfo,users can bookmark a POI or navigate to it.
Usually the Quick Actions list is an overlay, often with the shape of a balloon.It is displayed whenever the appropriate icon of the list element is touched.
41
7. User Interface
(a) MoCaInfo (b) Dropbox
Figure 7.4.: Examples of the Quick Actions UI Design Pattern
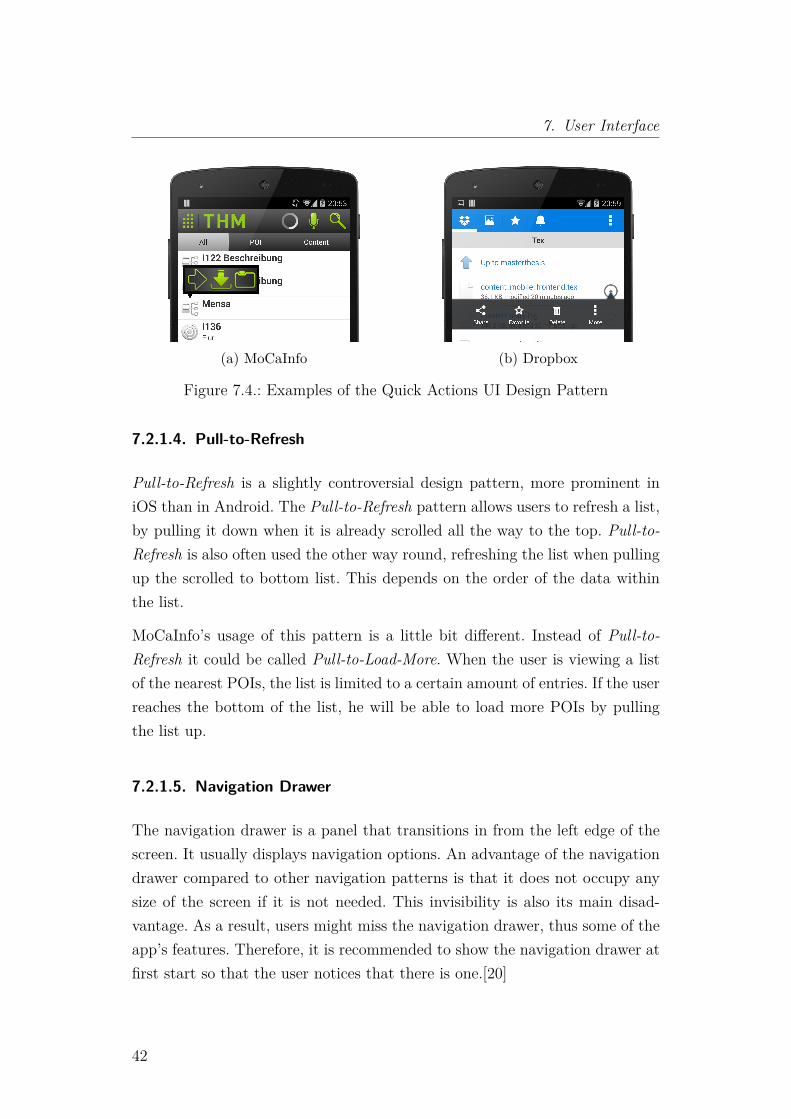
7.2.1.4. Pull-to-Refresh
Pull-to-Refresh is a slightly controversial design pattern, more prominent iniOS than in Android. The Pull-to-Refresh pattern allows users to refresh a list,by pulling it down when it is already scrolled all the way to the top. Pull-to-Refresh is also often used the other way round, refreshing the list when pullingup the scrolled to bottom list. This depends on the order of the data withinthe list.
MoCaInfo’s usage of this pattern is a little bit different. Instead of Pull-to-Refresh it could be called Pull-to-Load-More. When the user is viewing a listof the nearest POIs, the list is limited to a certain amount of entries. If the userreaches the bottom of the list, he will be able to load more POIs by pullingthe list up.
7.2.1.5. Navigation Drawer
The navigation drawer is a panel that transitions in from the left edge of thescreen. It usually displays navigation options. An advantage of the navigationdrawer compared to other navigation patterns is that it does not occupy anysize of the screen if it is not needed. This invisibility is also its main disad-vantage. As a result, users might miss the navigation drawer, thus some of theapp’s features. Therefore, it is recommended to show the navigation drawer atfirst start so that the user notices that there is one.[20]
42

7.3 User Interface Structure
In MoCaInfo, the navigation drawer is used to select a building and one of itslevels to show it at the map.
(a) MoCaInfo (b) Google Play Music
Figure 7.5.: Examples of the Navigation Drawer UI Design Pattern
7.3. User Interface Structure
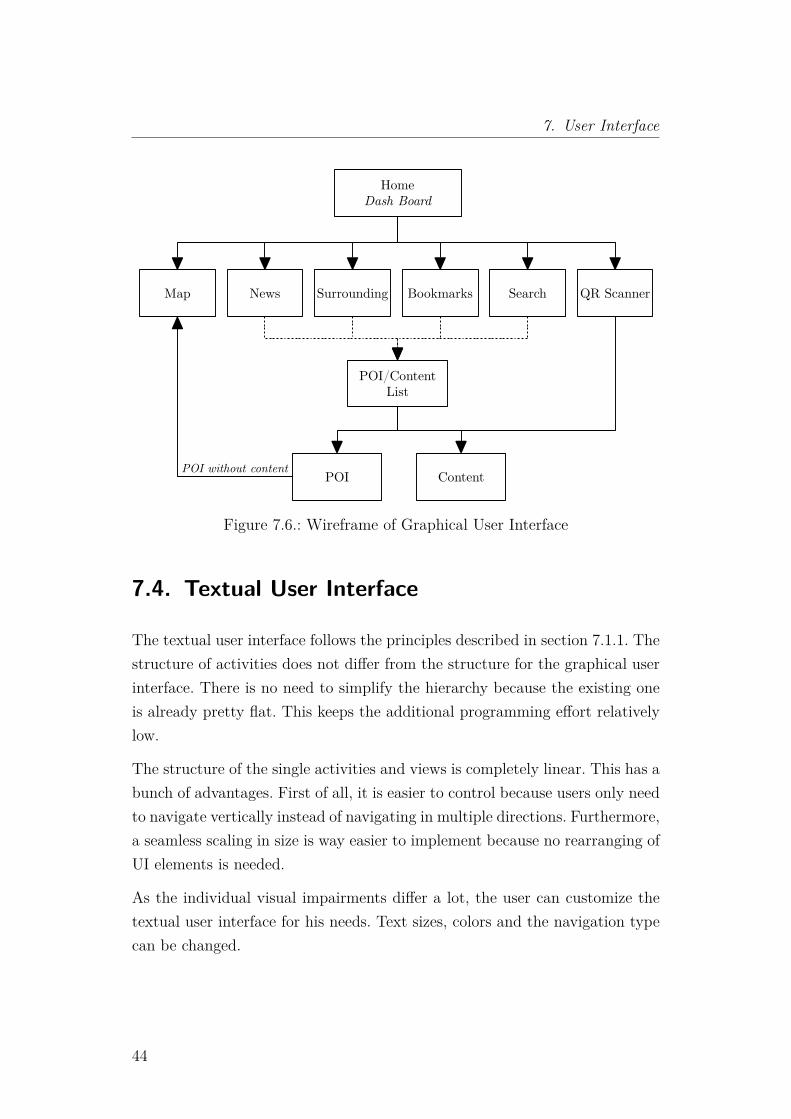
Figure 7.6 shows the structure of the graphical user interface. Any box rep-resents an Android Activity, except for POI/content list which has a moreabstract meaning. It just visualizes that the connected boxes like news, sur-rounding, etc. list POI and content elements.
As described in section 7.2.1.1, the dashboard pattern suits perfectly for anapplication with 2 to 6 parts. Therefore, the home screen has icons which leadto six other screens. If the user decides to open the map screen, he will seehis current position, at an indoor or outdoor map. This depends on whetherthe user is inside a building or not. News, surrounding, bookmarks and searchare pretty similar. All screens show a list of POIs and content elements. Onlythe selection of elements differs between the screens. From those list views, theuser is able to show a more detailed view of a chosen POI or content element.As QR codes are directly linked to a POI or content element, the QR Scanneropens the appropriate view when a code has been recognized successfully.
43
7. User Interface
HomeDash Board
POI Content
POI/ContentList
News Surrounding Bookmarks Search QR ScannerMap
POI without content
Figure 7.6.: Wireframe of Graphical User Interface
7.4. Textual User Interface
The textual user interface follows the principles described in section 7.1.1. Thestructure of activities does not differ from the structure for the graphical userinterface. There is no need to simplify the hierarchy because the existing oneis already pretty flat. This keeps the additional programming effort relativelylow.
The structure of the single activities and views is completely linear. This has abunch of advantages. First of all, it is easier to control because users only needto navigate vertically instead of navigating in multiple directions. Furthermore,a seamless scaling in size is way easier to implement because no rearranging ofUI elements is needed.
As the individual visual impairments differ a lot, the user can customize thetextual user interface for his needs. Text sizes, colors and the navigation typecan be changed.
44
7.4.1.1 Virtual Directional Pad
7.4.1. Navigation
Beside the better readability for users with remaining eyesight, the textualinterface needs to be easily navigable, even by blind users. Depending on theuser’s preferences and device, there are different possibilities to achieve this.
7.4.1.1. Virtual Directional Pad
A common approach, even to control usual graphical user interfaces, is a vir-tual directional pad. The virtual D-pad allows a user to change the currentlyselected UI element. In combination with Talk Back, which presents the cur-rent element acoustically, even blind users are able to use the application. Thisassumes that a visual impaired user is able to use the virtual D-pad.
7.4.1.2. Gesture
An alternative to a virtual D-pad is gesture-driven navigation. By swiping upor down, the user changes the currently selected UI element. Due to the linearhierarchy, the user is able to picture the logical structure to himself easily.It should be noted that gestures need to have a simple, linear shape. Morecomplex shapes, which includes circles, are hard to reproduce by many visualimpaired users [13, p.73f].
7.4.1.3. Hardware Buttons
A problem with touchscreens for visually impaired users is the lack of hapticfeedback. Therefore, users either need to discover the screen with the help of ascreen reader systems or they need to fix some tactile object upon the screenat an appropriate position. Many visually impaired smart phone users gluesellotape at the position of the virtual D-pad in order to be able to hit thetouchscreen buttons reliably.
As an alternative, some devices offer hardware D-pads or even hardware qwertykeyboards which are superior to touchscreen-only devices for visually impairedusers. There are no official numbers about the amount of available devices, but
45
7. User Interface
looking at current Android devices by major manufacturers, devices with hard-ware D-pads or even keyboards are rare. According to the German comparisonshopping site gh.de only 18 out of 712 listed Android devices offer a hardwarekeyboard, whereas only one device comes with Android 4.0, a version whichhas been released in October 2011. All other devices are shipped with evenolder versions of Android5. It should be noted that this does not necessarilyrepresent the whole Android device market, but it shows that this kind ofdevices are rare and getting even less popular over the last years.
normal button press: navigation
previous
next
volume up
volume down
long button press: volume control
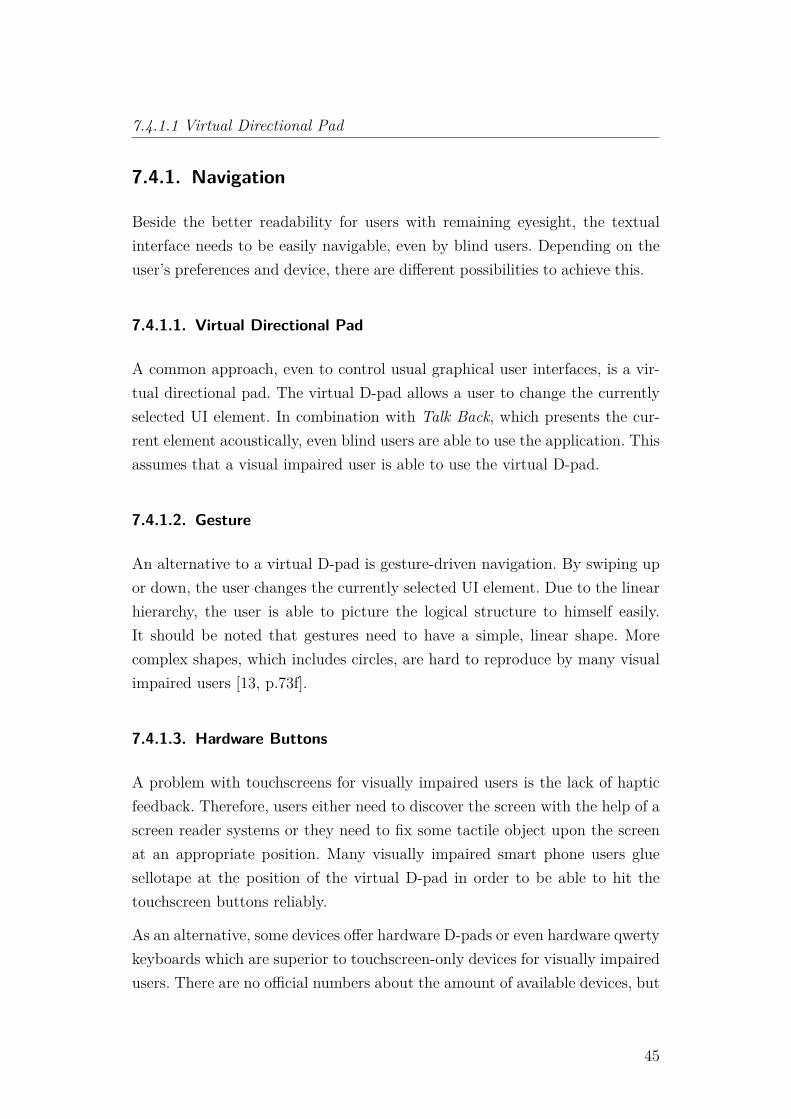
Figure 7.7.: Navigation with Volume Control Buttons
One workaround for a better usability for devices without dedicated hardwarebuttons is the usage of the volume control buttons. Those buttons exist atnearly any Android smart phone to date. They are usually realized as hard-ware buttons with haptic feedback. Instead of changing the volume, the cur-rently selected UI element is changed. Admittedly, this workaround leads toa problem because the user is not able to change the audio output’s volumeanymore, which is particularly important for users who rely on text-to-speechfor navigation. Therefore, a second workaround has been developed. Users areable to change the volume by long-pressing the appropriate volume button.
5Effective August 13, 2013
46
7.5 Interim Conclusion
7.5. Interim Conclusion
Having two separate user interfaces, one for blind and visually impaired usersand one for sighted users results in an additional development effort and com-plicates the maintainability. As Android’s accessibility features are getting bet-ter and probably will further improve in the future, the additional expenditureseems to be unjustifiably high. Considering that only users with a remain-ing eyesight benefit from a dedicated low-vision user interface compared to auniversal design, the low-vision UI is getting even more unattractive.
On the other hand, the numbers of the German Federal Office of Statisticsclarify that the group of users with a remaining eyesight is bigger than onemight expect at first glance. According to their report[21] 102,789 visually im-paired people, aged 18 to 65, were living in Germany at 2011, 31th December.Only 22,973 of them were classified as blind. The remaining 79,816 peopleeither have a high grade visually impairment or other visually impairments.This means, about 77% of the second largest target group potentially benefitfrom a dedicated low-vision user interface.
Because 77% of a target group cannot be ignored, MoCaInfo will stick to theapproach of two different user interfaces, one for sighted and one for visuallyimpaired users.
47

Part III.
Navigation
49
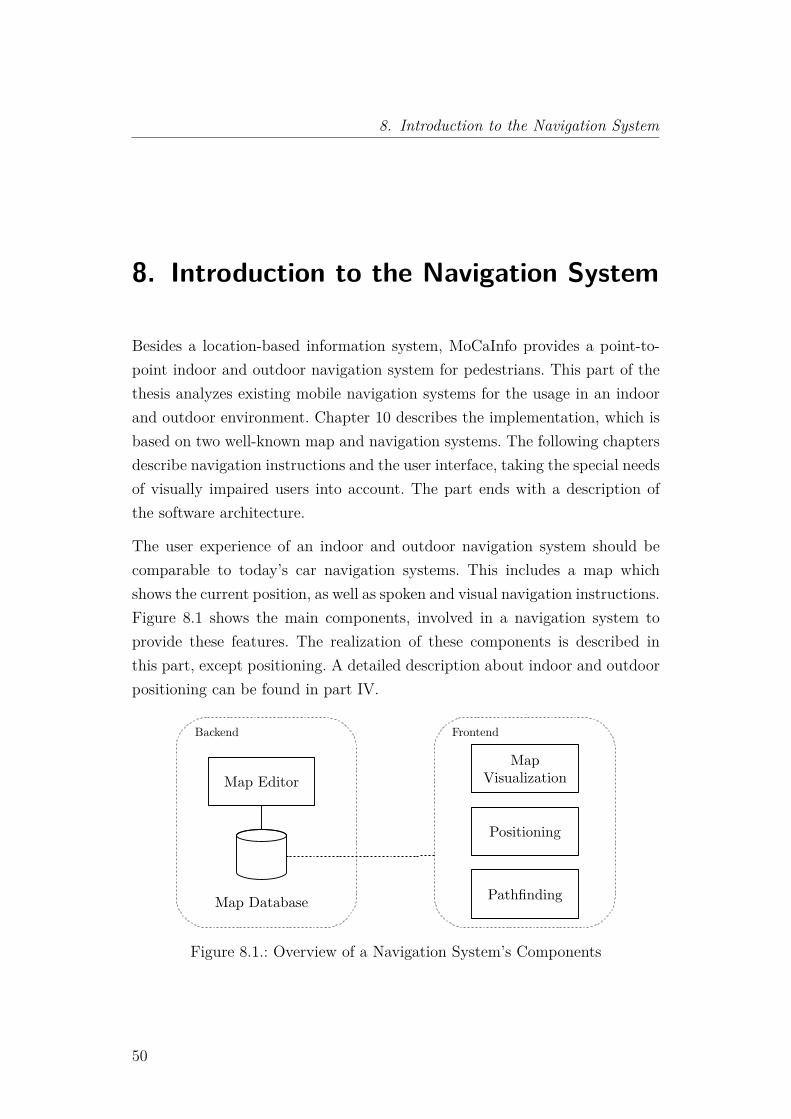
8. Introduction to the Navigation System
8. Introduction to the Navigation System
Besides a location-based information system, MoCaInfo provides a point-to-point indoor and outdoor navigation system for pedestrians. This part of thethesis analyzes existing mobile navigation systems for the usage in an indoorand outdoor environment. Chapter 10 describes the implementation, which isbased on two well-known map and navigation systems. The following chaptersdescribe navigation instructions and the user interface, taking the special needsof visually impaired users into account. The part ends with a description ofthe software architecture.
The user experience of an indoor and outdoor navigation system should becomparable to today’s car navigation systems. This includes a map whichshows the current position, as well as spoken and visual navigation instructions.Figure 8.1 shows the main components, involved in a navigation system toprovide these features. The realization of these components is described inthis part, except positioning. A detailed description about indoor and outdoorpositioning can be found in part IV.
MapVisualization
Positioning
PathfindingMap Database
Map Editor
FrontendBackend
Figure 8.1.: Overview of a Navigation System’s Components
50
9. Existing Mobile Navigation Systems
The development of a navigation system, including pathfinding, map renderingand map editing from scratch is a lot of effort. Considering that point-to-pointnavigation is just a single part of the overall project, solutions based on exist-ing tools have to be considered to reduce the development effort. Therefore,existing navigation tools are evaluated for extensibility to support indoor andoutdoor navigation.
9.1. Google Maps
As MoCaInfo targets Google’s Android platform, the first navigation systemwhich comes into someone’s mind is Google Maps. Since 2012, Google Mapsalso provides indoor map rendering. For a few buildings, even indoor navigationexist[22].
A floor plan is uploaded as a picture, to enable Google to create a GoogleMaps indoor floor plan. Those floor plans are publicly available. Furthermore,there is no possibility to change existing floor plans or accelerate the releaseof floor plans by building owners. As the floor plans of the university mustnot be publicly available and editing has to be possible at any time, Google’sIndoor Maps are not usable for MoCaInfo. An additional exclusion criterion isthe miss of navigation instructions for blind and visually impaired users.
9.2. OpenStreetMap
OpenStreetMap (OSM) is a project, founded in 2004, with the goal to createa free and open geo database, which covers the whole world. To achieve thisgoal, OpenStreetMap motivates users to contribute geo and map data to the
51
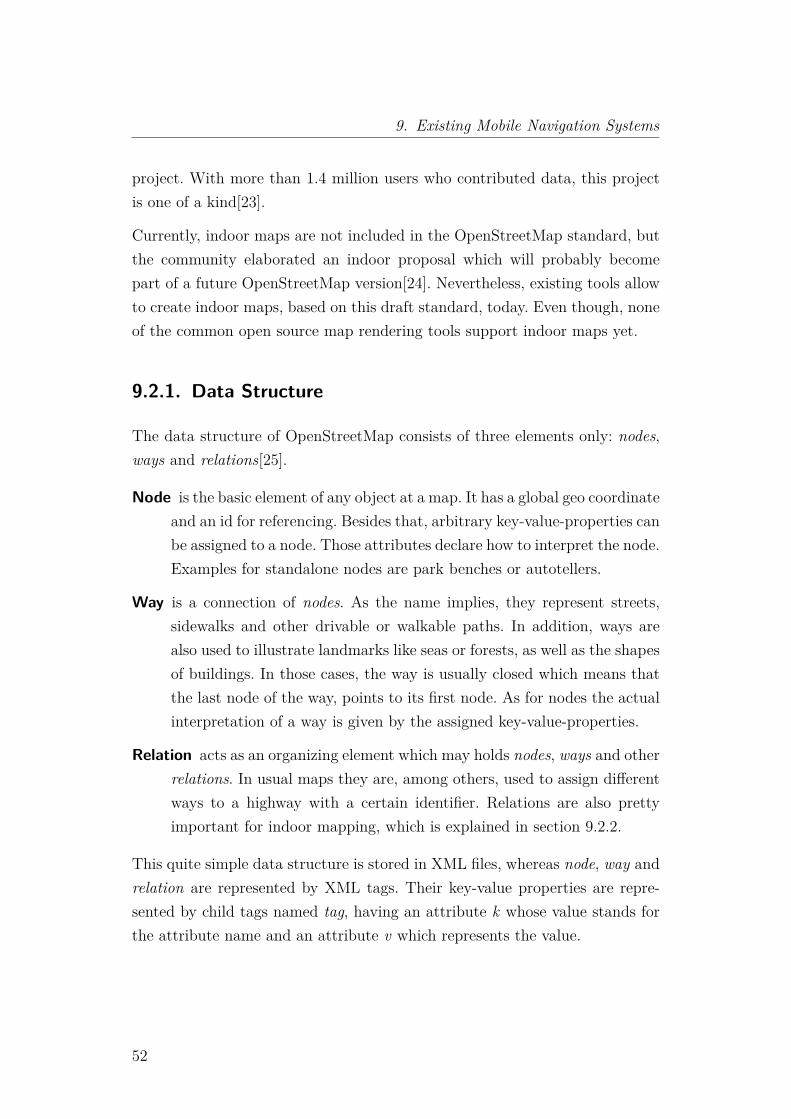
9. Existing Mobile Navigation Systems
project. With more than 1.4 million users who contributed data, this projectis one of a kind[23].
Currently, indoor maps are not included in the OpenStreetMap standard, butthe community elaborated an indoor proposal which will probably becomepart of a future OpenStreetMap version[24]. Nevertheless, existing tools allowto create indoor maps, based on this draft standard, today. Even though, noneof the common open source map rendering tools support indoor maps yet.
9.2.1. Data Structure
The data structure of OpenStreetMap consists of three elements only: nodes,ways and relations[25].
Node is the basic element of any object at a map. It has a global geo coordinateand an id for referencing. Besides that, arbitrary key-value-properties canbe assigned to a node. Those attributes declare how to interpret the node.Examples for standalone nodes are park benches or autotellers.
Way is a connection of nodes. As the name implies, they represent streets,sidewalks and other drivable or walkable paths. In addition, ways arealso used to illustrate landmarks like seas or forests, as well as the shapesof buildings. In those cases, the way is usually closed which means thatthe last node of the way, points to its first node. As for nodes the actualinterpretation of a way is given by the assigned key-value-properties.
Relation acts as an organizing element which may holds nodes, ways and otherrelations. In usual maps they are, among others, used to assign differentways to a highway with a certain identifier. Relations are also prettyimportant for indoor mapping, which is explained in section 9.2.2.
This quite simple data structure is stored in XML files, whereas node, way andrelation are represented by XML tags. Their key-value properties are repre-sented by child tags named tag, having an attribute k whose value stands forthe attribute name and an attribute v which represents the value.
52
9.2.2.1 Building
9.2.2. Indoor Proposal
The indoor proposal, also called IndoorOSM[24], is a possible scheme for map-ping indoor facilities in OpenStreetMap. It is currently in draft status, whichmeans that it is not included in the OpenStreetMap standard yet.
In the following, the main parts of the tagging scheme are explained. It shouldbe noted that several tags, which are not needed for the indoor maps in Mo-CaInfo, are left out for reasons of clarity and comprehensibility. Those left outtags serve mainly to describe the exterior view of buildings.
9.2.2.1. Building
A building is represented by a relation whereby the tag type of the relation is setto building. The shape of the building is, as usual in OSM maps, a closed way.In IndoorOSM, this is also a member of the building relation. Furthermore,any level of the building is a member of the building relation. In addition tothose relations, other describing tags are relevant:
key description example
building is the relation a building? building=yesbuilding:levels number of levels building:levels=4building:min_level minimum level building:min_level=-1building:max_level maximum level building:max_level=4name name of the building name=Main Buildingtype type of the relation type=building
9.2.2.2. Levels/Floors
Each level of a building is mapped as an OSM relation, which is a member ofthe building relation. Basically, the level relations refer to OSM ways whichrepresent parts of the level such as rooms, stairways, corridors in addition tonavigation information like footpaths.
53
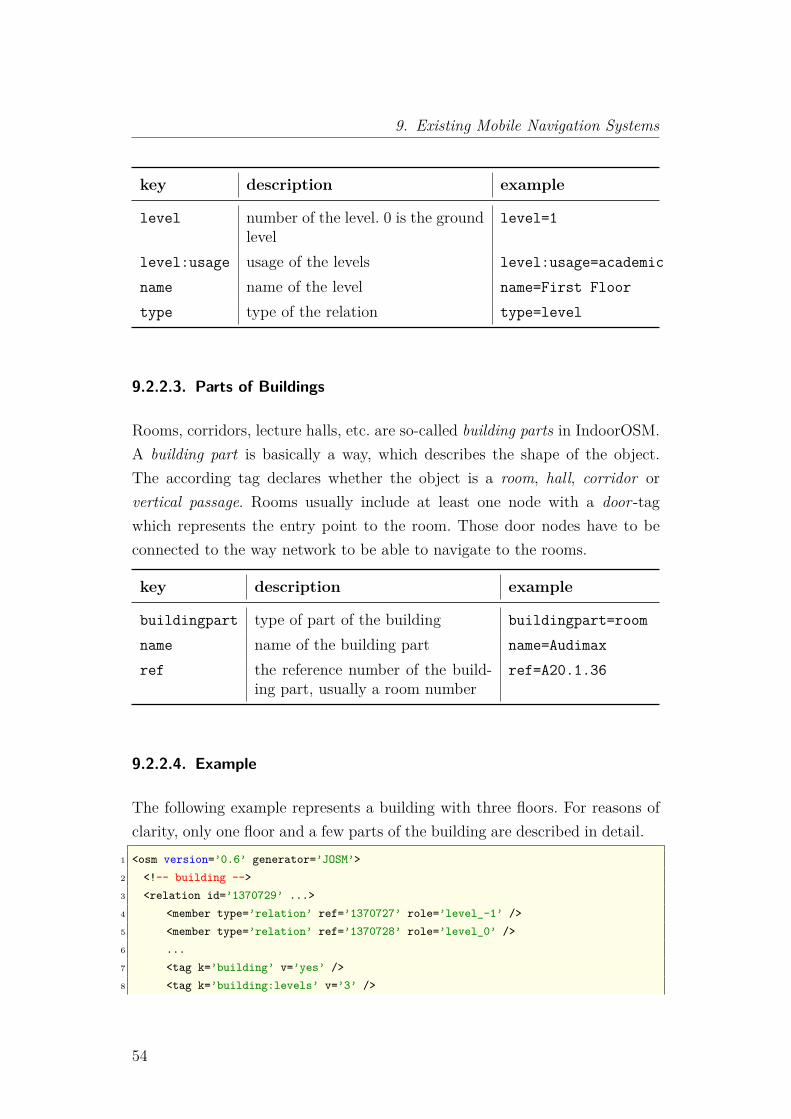
9. Existing Mobile Navigation Systems
key description example
level number of the level. 0 is the groundlevel
level=1
level:usage usage of the levels level:usage=academic
name name of the level name=First Floor
type type of the relation type=level
9.2.2.3. Parts of Buildings
Rooms, corridors, lecture halls, etc. are so-called building parts in IndoorOSM.A building part is basically a way, which describes the shape of the object.The according tag declares whether the object is a room, hall, corridor orvertical passage. Rooms usually include at least one node with a door-tagwhich represents the entry point to the room. Those door nodes have to beconnected to the way network to be able to navigate to the rooms.
key description example
buildingpart type of part of the building buildingpart=room
name name of the building part name=Audimax
ref the reference number of the build-ing part, usually a room number
ref=A20.1.36
9.2.2.4. Example
The following example represents a building with three floors. For reasons ofclarity, only one floor and a few parts of the building are described in detail.
1 <osm version=’0.6’ generator=’JOSM’>2 <!-- building -->3 <relation id=’1370729’ ...>4 <member type=’relation’ ref=’1370727’ role=’level_-1’ />5 <member type=’relation’ ref=’1370728’ role=’level_0’ />6 ...7 <tag k=’building’ v=’yes’ />8 <tag k=’building:levels’ v=’3’ />
54
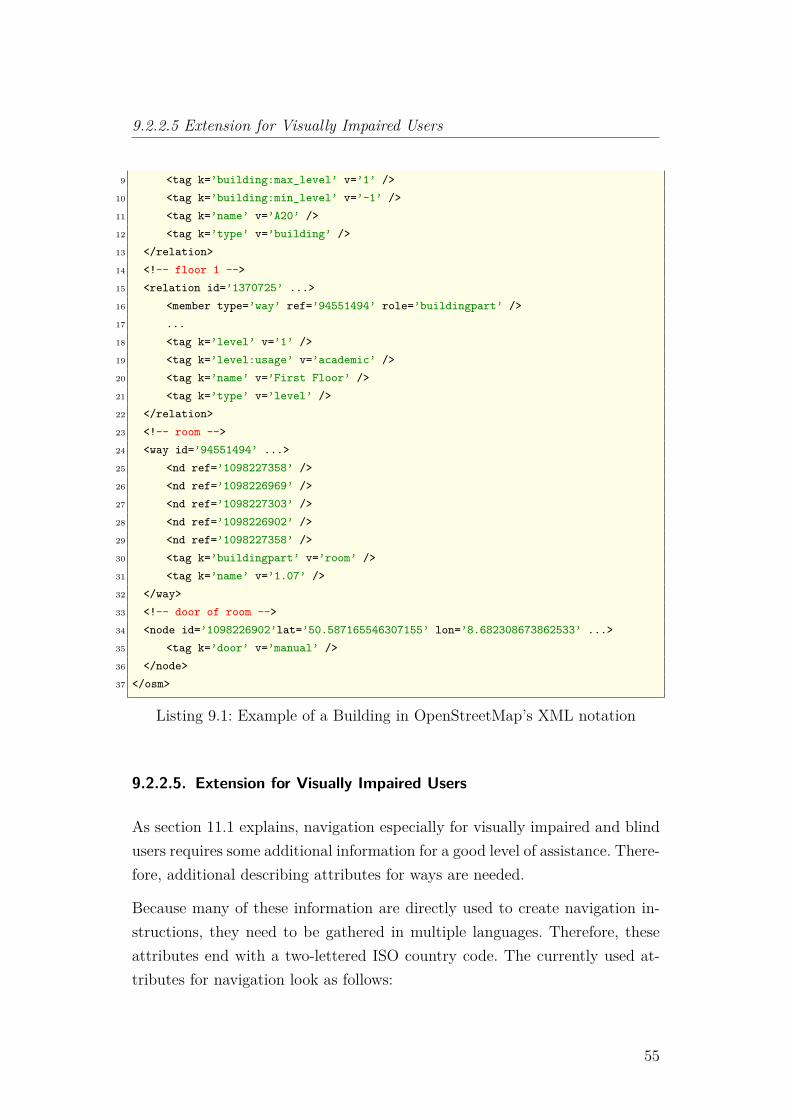
9.2.2.5 Extension for Visually Impaired Users
9 <tag k=’building:max_level’ v=’1’ />10 <tag k=’building:min_level’ v=’-1’ />11 <tag k=’name’ v=’A20’ />12 <tag k=’type’ v=’building’ />13 </relation>14 <!-- floor 1 -->15 <relation id=’1370725’ ...>16 <member type=’way’ ref=’94551494’ role=’buildingpart’ />17 ...18 <tag k=’level’ v=’1’ />19 <tag k=’level:usage’ v=’academic’ />20 <tag k=’name’ v=’First Floor’ />21 <tag k=’type’ v=’level’ />22 </relation>23 <!-- room -->24 <way id=’94551494’ ...>25 <nd ref=’1098227358’ />26 <nd ref=’1098226969’ />27 <nd ref=’1098227303’ />28 <nd ref=’1098226902’ />29 <nd ref=’1098227358’ />30 <tag k=’buildingpart’ v=’room’ />31 <tag k=’name’ v=’1.07’ />32 </way>33 <!-- door of room -->34 <node id=’1098226902’lat=’50.587165546307155’ lon=’8.682308673862533’ ...>35 <tag k=’door’ v=’manual’ />36 </node>37 </osm>
Listing 9.1: Example of a Building in OpenStreetMap’s XML notation
9.2.2.5. Extension for Visually Impaired Users
As section 11.1 explains, navigation especially for visually impaired and blindusers requires some additional information for a good level of assistance. There-fore, additional describing attributes for ways are needed.
Because many of these information are directly used to create navigation in-structions, they need to be gathered in multiple languages. Therefore, theseattributes end with a two-lettered ISO country code. The currently used at-tributes for navigation look as follows:
55
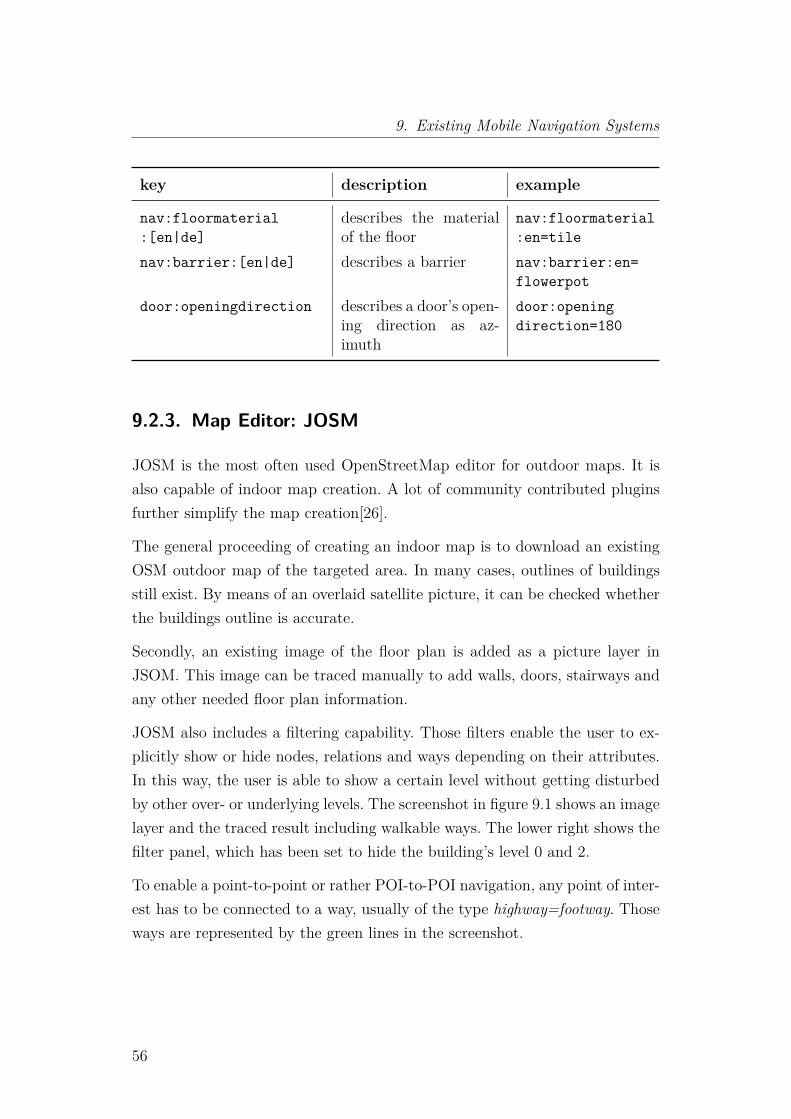
9. Existing Mobile Navigation Systems
key description example
nav:floormaterial:[en|de]
describes the materialof the floor
nav:floormaterial:en=tile
nav:barrier:[en|de] describes a barrier nav:barrier:en=flowerpot
door:openingdirection describes a door’s open-ing direction as az-imuth
door:openingdirection=180
9.2.3. Map Editor: JOSM
JOSM is the most often used OpenStreetMap editor for outdoor maps. It isalso capable of indoor map creation. A lot of community contributed pluginsfurther simplify the map creation[26].
The general proceeding of creating an indoor map is to download an existingOSM outdoor map of the targeted area. In many cases, outlines of buildingsstill exist. By means of an overlaid satellite picture, it can be checked whetherthe buildings outline is accurate.
Secondly, an existing image of the floor plan is added as a picture layer inJSOM. This image can be traced manually to add walls, doors, stairways andany other needed floor plan information.
JOSM also includes a filtering capability. Those filters enable the user to ex-plicitly show or hide nodes, relations and ways depending on their attributes.In this way, the user is able to show a certain level without getting disturbedby other over- or underlying levels. The screenshot in figure 9.1 shows an imagelayer and the traced result including walkable ways. The lower right shows thefilter panel, which has been set to hide the building’s level 0 and 2.
To enable a point-to-point or rather POI-to-POI navigation, any point of inter-est has to be connected to a way, usually of the type highway=footway. Thoseways are represented by the green lines in the screenshot.
56
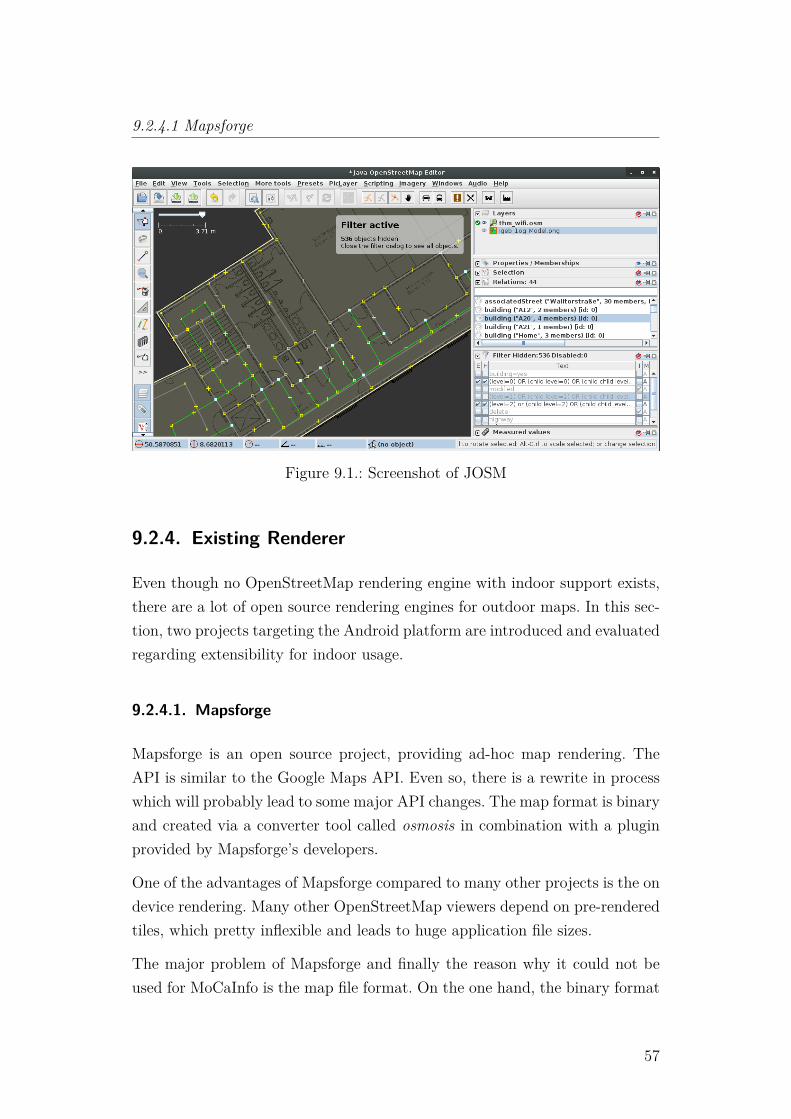
9.2.4.1 Mapsforge
Figure 9.1.: Screenshot of JOSM
9.2.4. Existing Renderer
Even though no OpenStreetMap rendering engine with indoor support exists,there are a lot of open source rendering engines for outdoor maps. In this sec-tion, two projects targeting the Android platform are introduced and evaluatedregarding extensibility for indoor usage.
9.2.4.1. Mapsforge
Mapsforge is an open source project, providing ad-hoc map rendering. TheAPI is similar to the Google Maps API. Even so, there is a rewrite in processwhich will probably lead to some major API changes. The map format is binaryand created via a converter tool called osmosis in combination with a pluginprovided by Mapsforge’s developers.
One of the advantages of Mapsforge compared to many other projects is the ondevice rendering. Many other OpenStreetMap viewers depend on pre-renderedtiles, which pretty inflexible and leads to huge application file sizes.
The major problem of Mapsforge and finally the reason why it could not beused for MoCaInfo is the map file format. On the one hand, the binary format
57
9. Existing Mobile Navigation Systems
is quite nice because a 2MB OpenStreetMap XML file becomes a 200kb binaryfile, but on the other hand, this leads to a loss of information and accuracywhich is unacceptable for indoor purposes. Because of the loss of accuracy,rectangular rooms become crooked, or a corridors become slightly longer thanthe building’s shape.
9.2.4.2. OsmAnd
OsmAnd is an Android application for point-to-point navigation. It is opensource, which enables other developers to use the rendering engine. Similar toMapsforge, OsmAnd uses a native map format called .obf. Those files containthe drawing information in an own vector graphics format. The rendering resultitself looks really professional, and the API is easy to use.
To enhance the performance, OsmAnd caches rendered parts of the map inimage files. This principally useful feature does not support multi-layered mapsand therefore, no floors. For that reason, the cache would have to be disabled,accepting a bad performance. As an alternative, OsmAnd could be patched tosupport multi-layered rendering. As the rendering and caching components arestrongly coupled, this would affect a lot of sourcecode. But even then, wholetiles of the screen would have to be reloaded when the drawn floor changes,which is not a good user experience.
Finally, the necessary changes of OsmAnd would be much of an effort with amoderate result.
58
10. OpenStreetMap meets Google Maps
The evaluated OpenStreetMap rendering engines are not flexible enough toextend them with indoor rendering features, with a reasonable effort. Thedifferences between a usual single layered street map and a multilevel buildingmap demand strong changes of the renderer’s architecture and map formats.
Anyways, OpenStreetMap is worth using because of the existing toolchain,like JSOM for editing the map and libraries for pathfinding. However, thedevelopment of an OpenStreetMap outdoor and indoor renderer from scratchwould be overkill.
An alternative to this approach is using an existing outdoor map solutionand draw all necessary indoor information like floor plans on top of it. BecauseGoogle Maps offers a good map rendering performance on Android devices, andan API for drawing custom overlays, it is a perfect fit for such an approach.
10.1. Map File
The map file follows the IndoorOSM approach described in section 9.2.2 withone additional layer. This layer is a background layer which is drawn betweenthe GoogleMaps map and the building overlay. It makes sure that the existingGoogleMaps building shape is overlaid, as it is usually not as accurate as thebuilding shape provided in the OpenStreetMap file. The background layer isstored as a closed way in the OpenStreetMap file.
59
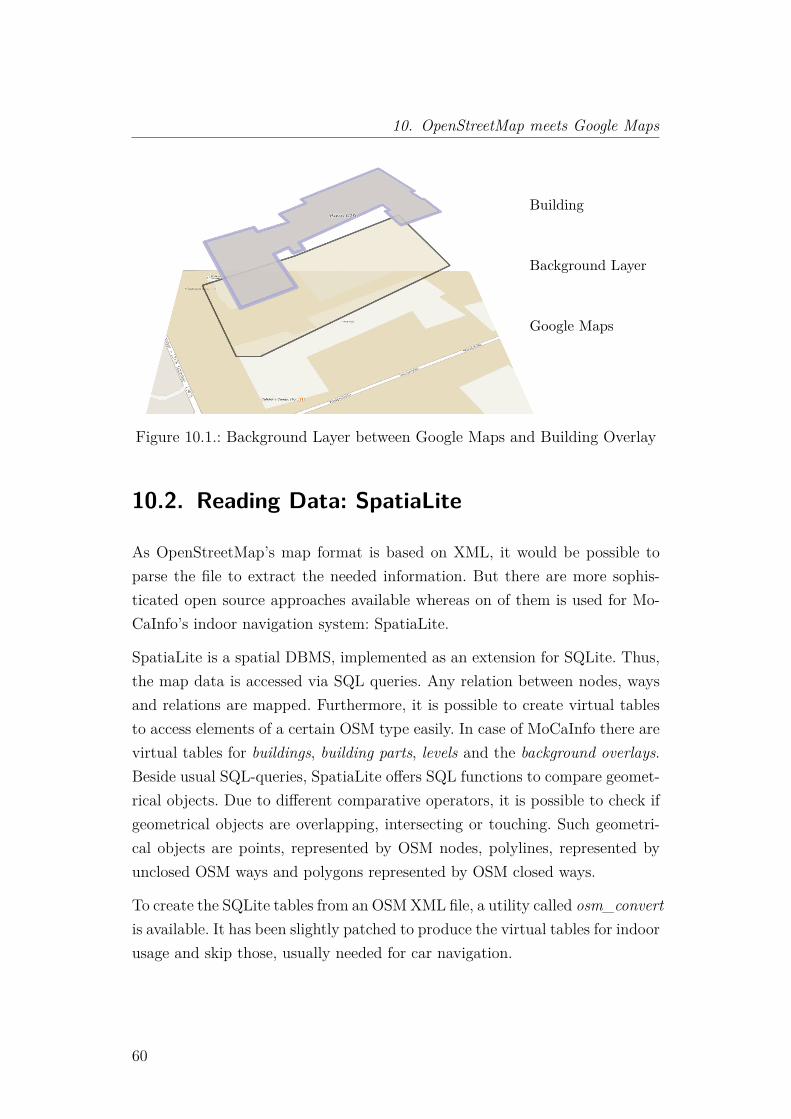
10. OpenStreetMap meets Google Maps
Google Maps
Background Layer
Building
Figure 10.1.: Background Layer between Google Maps and Building Overlay
10.2. Reading Data: SpatiaLite
As OpenStreetMap’s map format is based on XML, it would be possible toparse the file to extract the needed information. But there are more sophis-ticated open source approaches available whereas on of them is used for Mo-CaInfo’s indoor navigation system: SpatiaLite.
SpatiaLite is a spatial DBMS, implemented as an extension for SQLite. Thus,the map data is accessed via SQL queries. Any relation between nodes, waysand relations are mapped. Furthermore, it is possible to create virtual tablesto access elements of a certain OSM type easily. In case of MoCaInfo there arevirtual tables for buildings, building parts, levels and the background overlays.Beside usual SQL-queries, SpatiaLite offers SQL functions to compare geomet-rical objects. Due to different comparative operators, it is possible to check ifgeometrical objects are overlapping, intersecting or touching. Such geometri-cal objects are points, represented by OSM nodes, polylines, represented byunclosed OSM ways and polygons represented by OSM closed ways.
To create the SQLite tables from an OSMXML file, a utility called osm_convertis available. It has been slightly patched to produce the virtual tables for indoorusage and skip those, usually needed for car navigation.
60
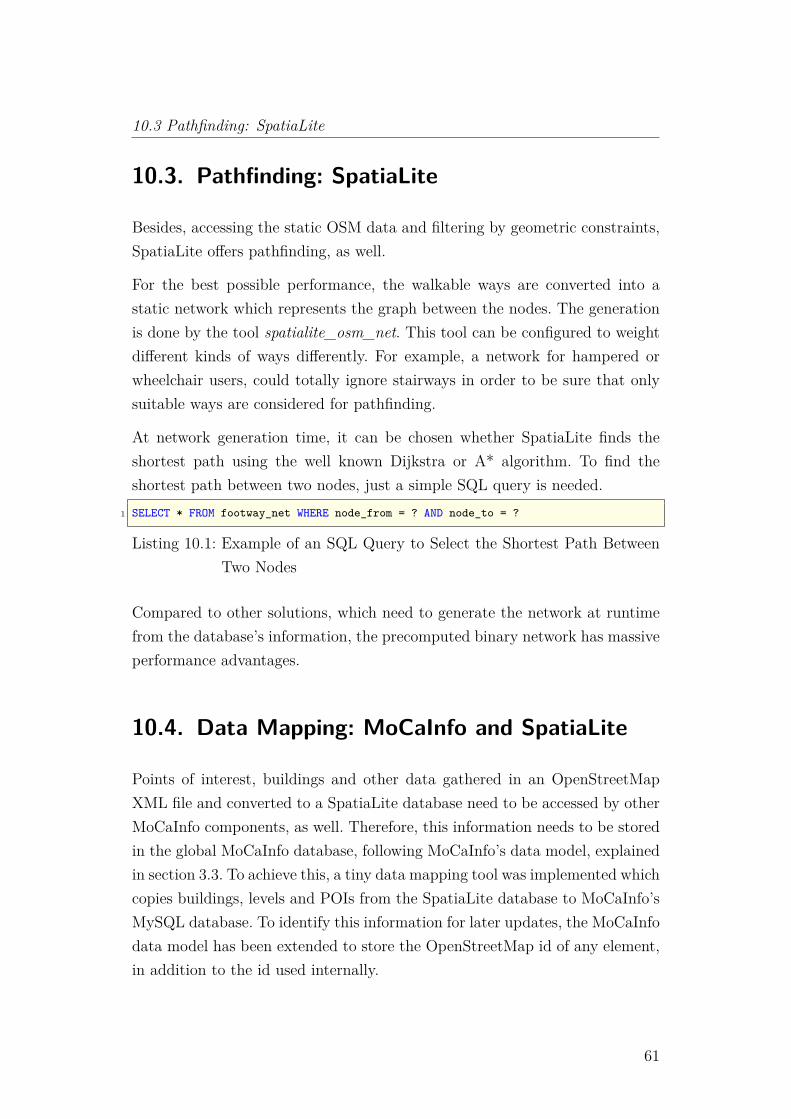
10.3 Pathfinding: SpatiaLite
10.3. Pathfinding: SpatiaLite
Besides, accessing the static OSM data and filtering by geometric constraints,SpatiaLite offers pathfinding, as well.
For the best possible performance, the walkable ways are converted into astatic network which represents the graph between the nodes. The generationis done by the tool spatialite_osm_net. This tool can be configured to weightdifferent kinds of ways differently. For example, a network for hampered orwheelchair users, could totally ignore stairways in order to be sure that onlysuitable ways are considered for pathfinding.
At network generation time, it can be chosen whether SpatiaLite finds theshortest path using the well known Dijkstra or A* algorithm. To find theshortest path between two nodes, just a simple SQL query is needed.
1 SELECT * FROM footway_net WHERE node_from = ? AND node_to = ?
Listing 10.1: Example of an SQL Query to Select the Shortest Path BetweenTwo Nodes
Compared to other solutions, which need to generate the network at runtimefrom the database’s information, the precomputed binary network has massiveperformance advantages.
10.4. Data Mapping: MoCaInfo and SpatiaLite
Points of interest, buildings and other data gathered in an OpenStreetMapXML file and converted to a SpatiaLite database need to be accessed by otherMoCaInfo components, as well. Therefore, this information needs to be storedin the global MoCaInfo database, following MoCaInfo’s data model, explainedin section 3.3. To achieve this, a tiny data mapping tool was implemented whichcopies buildings, levels and POIs from the SpatiaLite database to MoCaInfo’sMySQL database. To identify this information for later updates, the MoCaInfodata model has been extended to store the OpenStreetMap id of any element,in addition to the id used internally.
61
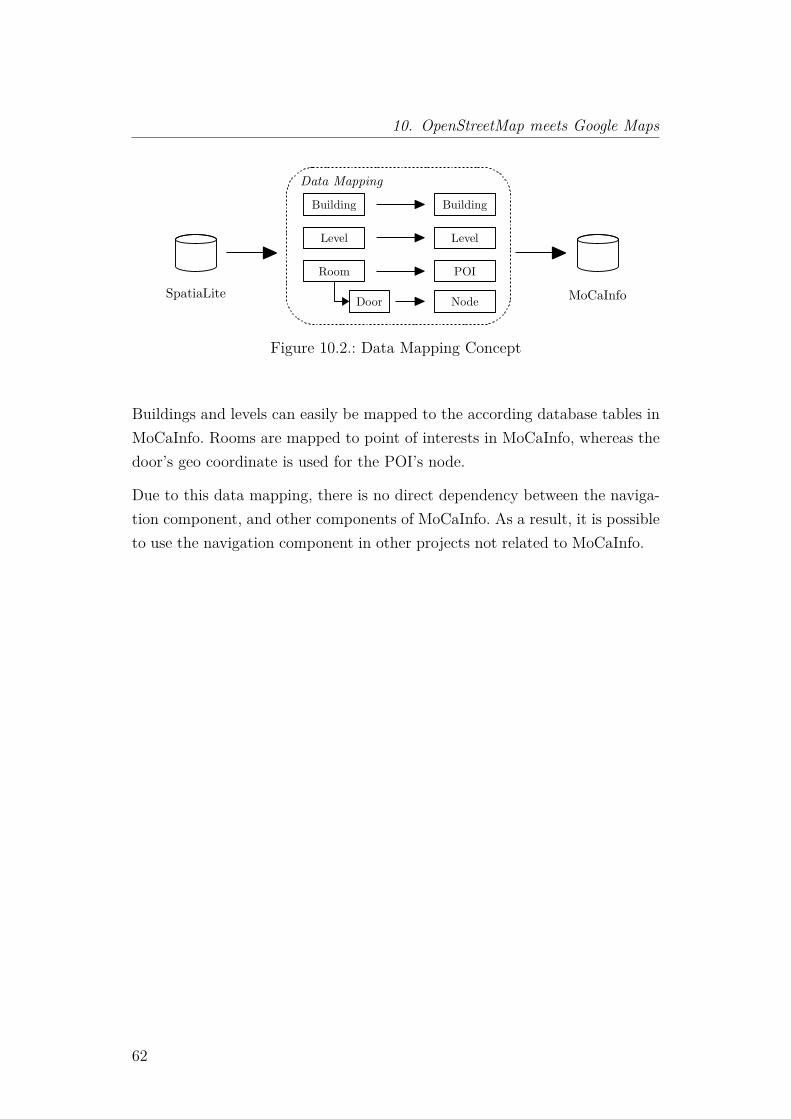
10. OpenStreetMap meets Google Maps
MoCaInfoSpatiaLite
Data MappingBuilding Building
Level Level
Room
Door
POI
Node
Figure 10.2.: Data Mapping Concept
Buildings and levels can easily be mapped to the according database tables inMoCaInfo. Rooms are mapped to point of interests in MoCaInfo, whereas thedoor’s geo coordinate is used for the POI’s node.
Due to this data mapping, there is no direct dependency between the naviga-tion component, and other components of MoCaInfo. As a result, it is possibleto use the navigation component in other projects not related to MoCaInfo.
62
11. Navigation Instructions
Point-to-point navigation systems use navigation instructions, which are rep-resented by symbols and an audiovisual explanation, to guide the user to thetarget destination. Pedestrian navigation systems slightly differ from car nav-igation systems. In contrast to car navigation systems, pedestrian navigationsystems do not need to take care of roundabouts or multi-lane roads. On theother hand, additional instructions dealing with stairways and building en-trances have to be considered.
The following enumeration lists navigation instructions needed for a reasonableindoor and outdoor pedestrian navigation system.
turn directions are the most common navigation instructions in point-to-point navigation systems. In detail, there are instructions for slightly,normal and sharp turns to the left or right direction.
stairways are navigation instructions which are dedicated for indoor pedes-trian navigation. The navigation system also show the user whether thestairway goes up or down.
elevators are another form of vertical passages which have to be described ifthey are on the user’s way.
entrances indicate to the user that he enters a new building.
11.1. Additional Instructions for Visually ImpairedUsers
As already stated in section 2 and section 7.1, visually impaired and blindpeople need to have some additional information in order to be able to bene-
63
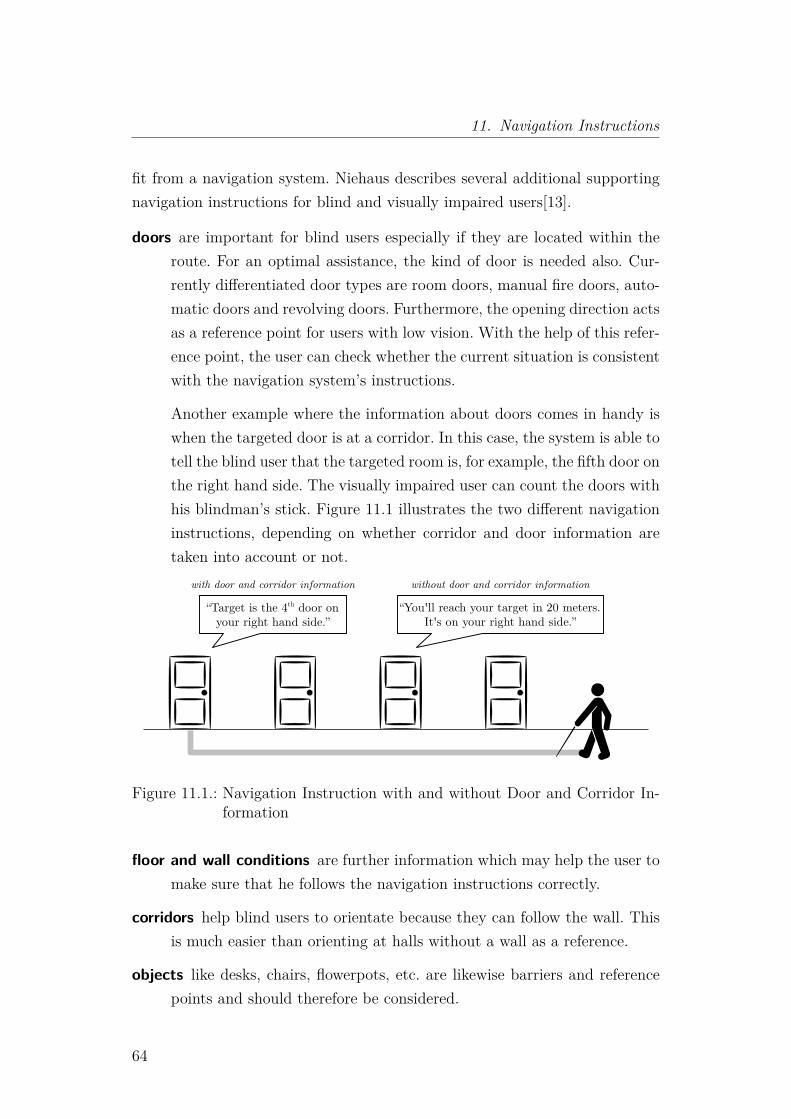
11. Navigation Instructions
fit from a navigation system. Niehaus describes several additional supportingnavigation instructions for blind and visually impaired users[13].
doors are important for blind users especially if they are located within theroute. For an optimal assistance, the kind of door is needed also. Cur-rently differentiated door types are room doors, manual fire doors, auto-matic doors and revolving doors. Furthermore, the opening direction actsas a reference point for users with low vision. With the help of this refer-ence point, the user can check whether the current situation is consistentwith the navigation system’s instructions.
Another example where the information about doors comes in handy iswhen the targeted door is at a corridor. In this case, the system is able totell the blind user that the targeted room is, for example, the fifth door onthe right hand side. The visually impaired user can count the doors withhis blindman’s stick. Figure 11.1 illustrates the two different navigationinstructions, depending on whether corridor and door information aretaken into account or not.
“Target is the 4th door onyour right hand side.”
“You'll reach your target in 20 meters.It's on your right hand side.”
with door and corridor information without door and corridor information
Figure 11.1.: Navigation Instruction with and without Door and Corridor In-formation
floor and wall conditions are further information which may help the user tomake sure that he follows the navigation instructions correctly.
corridors help blind users to orientate because they can follow the wall. Thisis much easier than orienting at halls without a wall as a reference.
objects like desks, chairs, flowerpots, etc. are likewise barriers and referencepoints and should therefore be considered.
64
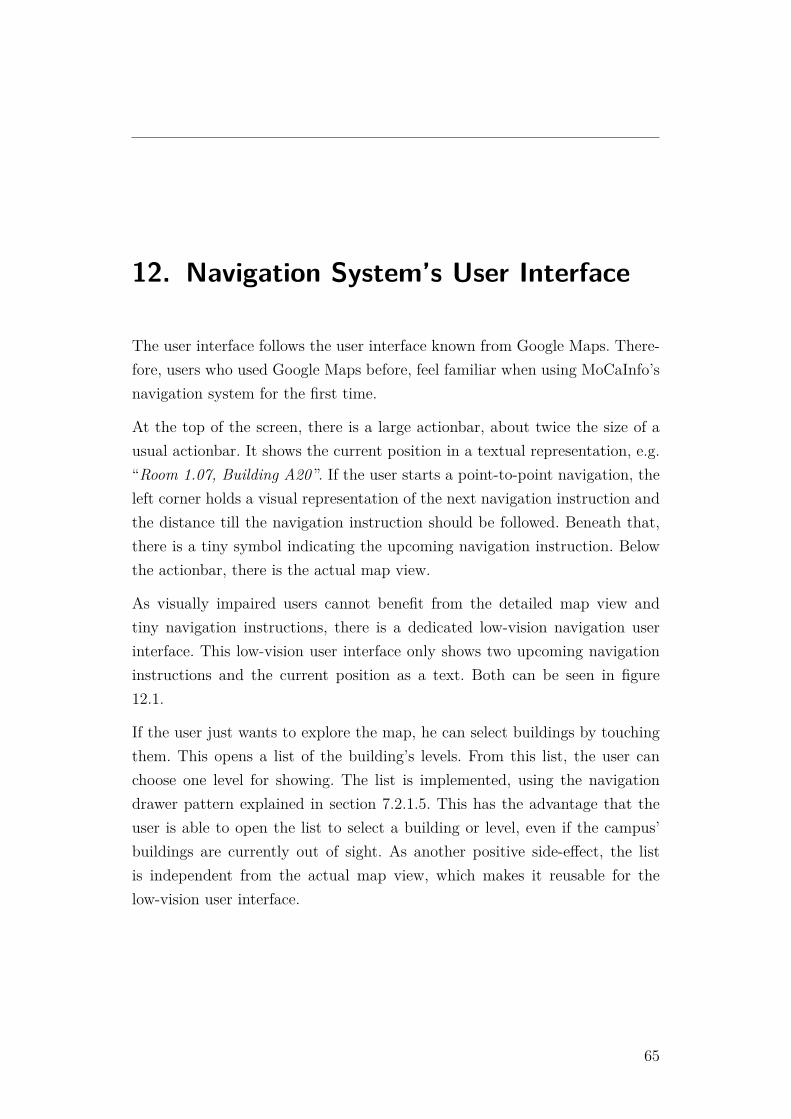
12. Navigation System’s User Interface
The user interface follows the user interface known from Google Maps. There-fore, users who used Google Maps before, feel familiar when using MoCaInfo’snavigation system for the first time.
At the top of the screen, there is a large actionbar, about twice the size of ausual actionbar. It shows the current position in a textual representation, e.g.“Room 1.07, Building A20”. If the user starts a point-to-point navigation, theleft corner holds a visual representation of the next navigation instruction andthe distance till the navigation instruction should be followed. Beneath that,there is a tiny symbol indicating the upcoming navigation instruction. Belowthe actionbar, there is the actual map view.
As visually impaired users cannot benefit from the detailed map view andtiny navigation instructions, there is a dedicated low-vision navigation userinterface. This low-vision user interface only shows two upcoming navigationinstructions and the current position as a text. Both can be seen in figure12.1.
If the user just wants to explore the map, he can select buildings by touchingthem. This opens a list of the building’s levels. From this list, the user canchoose one level for showing. The list is implemented, using the navigationdrawer pattern explained in section 7.2.1.5. This has the advantage that theuser is able to open the list to select a building or level, even if the campus’buildings are currently out of sight. As another positive side-effect, the listis independent from the actual map view, which makes it reusable for thelow-vision user interface.
65
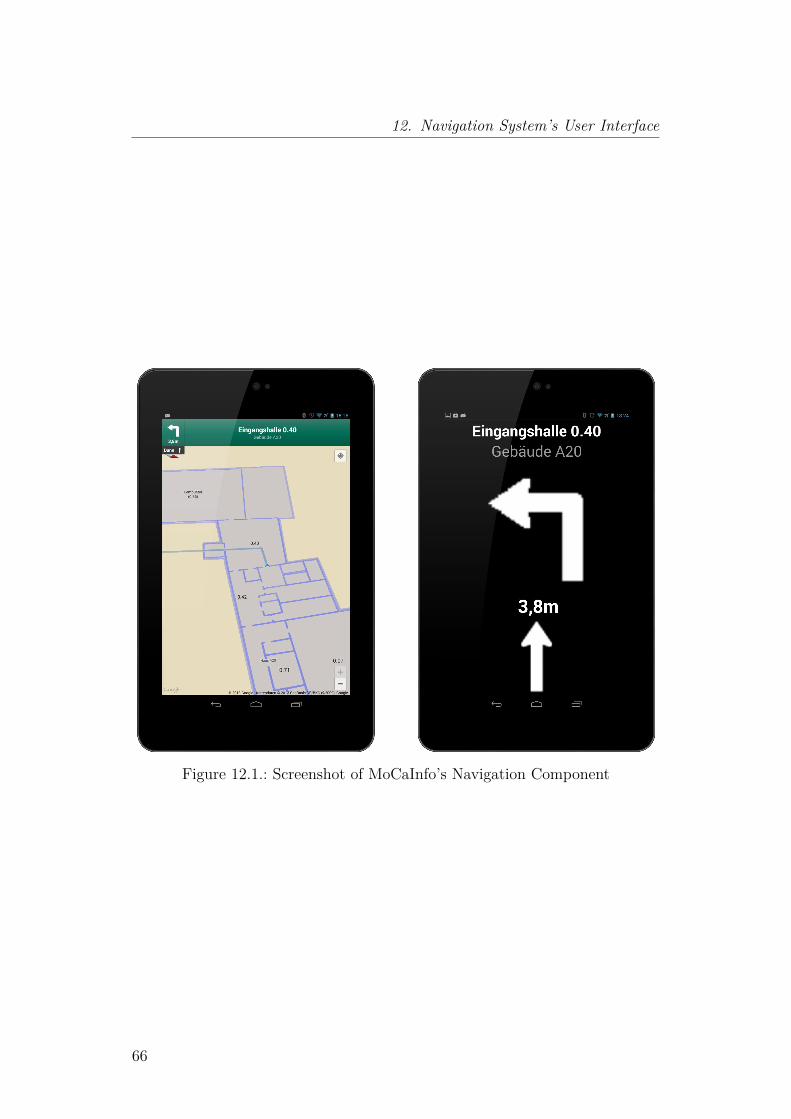
12. Navigation System’s User Interface
Figure 12.1.: Screenshot of MoCaInfo’s Navigation Component
66
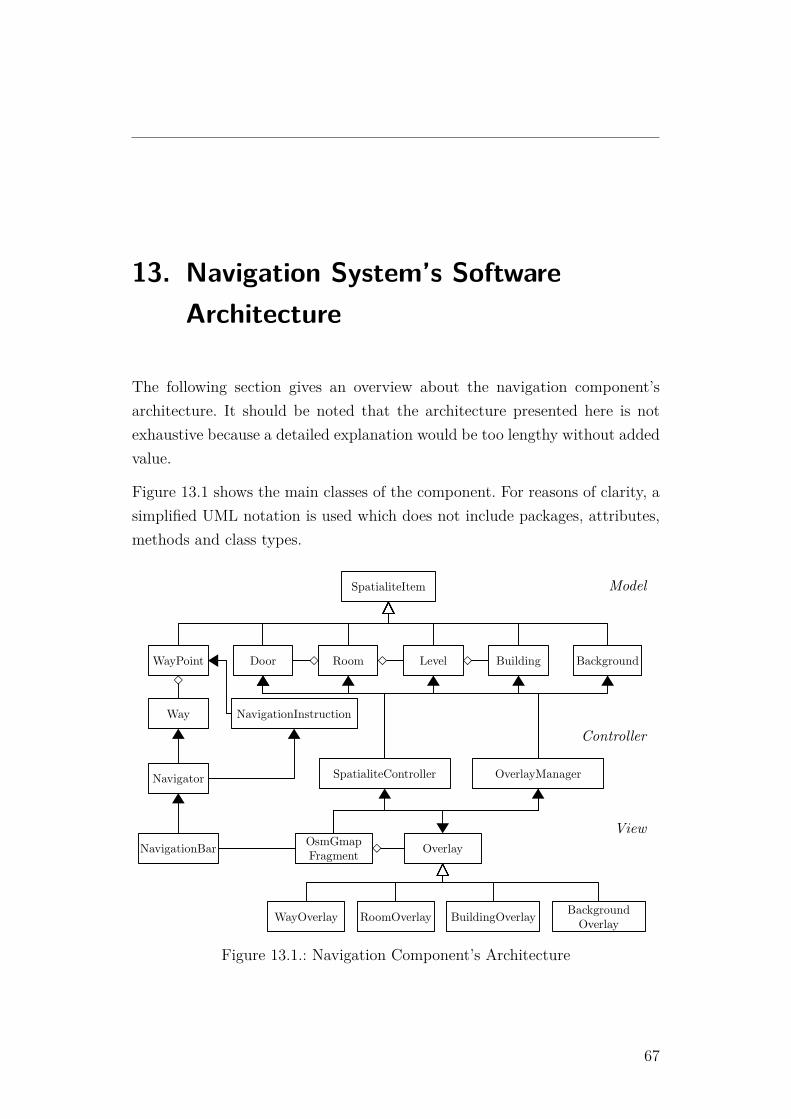
13. Navigation System’s SoftwareArchitecture
The following section gives an overview about the navigation component’sarchitecture. It should be noted that the architecture presented here is notexhaustive because a detailed explanation would be too lengthy without addedvalue.
Figure 13.1 shows the main classes of the component. For reasons of clarity, asimplified UML notation is used which does not include packages, attributes,methods and class types.
SpatialiteItem
Door Room Level Building BackgroundWayPoint
Way
Model
Navigator
NavigationInstruction
SpatialiteController OverlayManager
WayOverlay
Overlay
RoomOverlay BuildingOverlay BackgroundOverlay
OsmGmapFragmentNavigationBar
Controller
View
Figure 13.1.: Navigation Component’s Architecture
67
13. Navigation System’s Software Architecture
The architecture follows the well known Model-View-Controller (MVC) pat-tern. MVC intends that classes either have a model, a view or a controller char-acter. View classes usually provide the visual representation of model classes.These model classes only hold the data. Controller classes mediate betweenview and model and handle user interactions.
In case of this architecture, mostly any model is derived from the abstractclass SpatialiteItem. SpatialiteItem holds basic values of a SpatiaLite dataset,such as an id and arbitrary key value properties. Any element, needed forindoor and outdoor navigation, which is stored in the SpatiaLite database, isimplemented as a child of SpataliteItem. To these belong the classes Building,Level, Room, Door and WayPoint.
The loading of the data is realized by SpatialiteController. It creates the Spa-tialiteItems based on the database’s data by using the SpatiaLite library, whichis not shown in the figure.
To draw the different parts of the building, appropriate Overlays need to becreated. The efficient creation is managed by the OverlayManager. Further-more, the OverlayManager links between an Overlay and its model class.
TheNavigator manages navigation related features. It takes care of the pathfind-ing when requested, and creates the needed NavigationInstructions. The Nav-igationBar is responsible for visualizing the computed Way and the Naviga-tionInstructions.
The class OsmGmapFragment is the main entry point for the user. Besidesthe NavigationBar and Overlays, it holds the Google Maps view and otherview elements. The actual user interaction can be implemented by using lis-teners, e.g. a RoomClickedListener. Among others, they are not shown in thefigure to keep clarity. This listener concept enables other developers to use thenavigation component in their applications, with customized user interactions.Furthermore, it should be noted that the navigation component itself, has nodependencies on other MoCaInfo components, which facilitates the usage of itin other projects.
68
Part IV.
Indoor and Outdoor Positioning
69
14. Introduction to Indoor and Outdoor Positioning
14. Introduction to Indoor and OutdoorPositioning
Positioning is an essential feature of a point-to-point navigation system. Thebest-known positioning system today is the Global Positioning System (GPS)which is described in section 15.1. As GPS is based on a line of sight to satel-lites, it is not available in buildings. Therefore, alternative positioning ap-proaches are evaluated and developed in this part of the thesis, to achieveaccurate indoor and outdoor positioning.
In so doing, it is differentiated between absolute and relative positioning. Ab-solute positioning estimates an absolute position at earth or within a building.Relative positioning approaches are only able to estimate changes in posi-tion.
The following section describes well-known and often used absolute position-ing approaches. Followed by a section which deals with the topic of relativepositioning. Right after this general description, approaches which are usedfor MoCaInfo’s positioning system are explained and evaluated in detail. Thepart ends with an explanation of MoCaInfo’s dead reckoning system, whichcombines absolute and relative positioning to improve the accuracy.
70
15. Absolute Positioning
Absolute Positioning techniques try to estimate a user’s absolute position atearth. Some of the approaches deliver a three-dimensional position, e.g. forGPS this is longitude, latitude and altitude. Others do not take care of theheight above sea level. Therefore, the estimated position is just two dimen-sional. This chapter introduces various absolute positioning methods, whichare applicable for modern smart phones.
15.1. Global Positioning System
The Global Positioning System (GPS) is the most popular global navigationsatellite system (GNSS) worldwide. It was developed by the U.S. military, toprovide precise estimates of positions. Today, it is also available for free, civilusage.
GPS is based on a simple and ancient idea: an object’s position can be deter-mined by having distances to other objects whose positions are known. In caseof GPS, satellites broadcast their position, so these are the objects at knownlocations. The distance between a GPS receiver and a GPS satellite is mea-sured by using the transit time of the signal from the satellite to the receiver.The transit time can be calculated easily by having synchronized clocks at thesatellites and the receivers[27].
The accuracy of GPS increases with the number of satellites which can beseen by the receiver, whereas four is the minimum amount to determine athree-dimensional position. According to the Federal Aviation Administration’s(FAA) report from August 2013, the median position dilution of precision(PDOP) was 2.8 meters, having six satellites in sight in 99.99% of the test
71
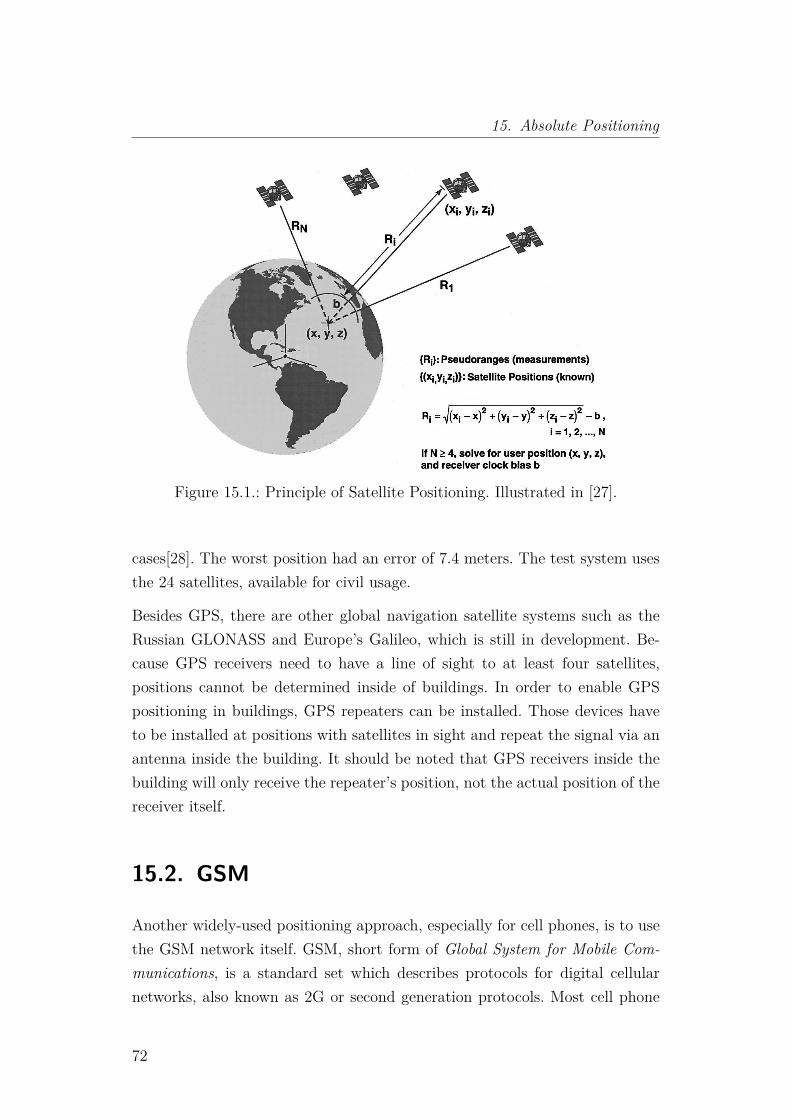
15. Absolute Positioning
Figure 15.1.: Principle of Satellite Positioning. Illustrated in [27].
cases[28]. The worst position had an error of 7.4 meters. The test system usesthe 24 satellites, available for civil usage.
Besides GPS, there are other global navigation satellite systems such as theRussian GLONASS and Europe’s Galileo, which is still in development. Be-cause GPS receivers need to have a line of sight to at least four satellites,positions cannot be determined inside of buildings. In order to enable GPSpositioning in buildings, GPS repeaters can be installed. Those devices haveto be installed at positions with satellites in sight and repeat the signal via anantenna inside the building. It should be noted that GPS receivers inside thebuilding will only receive the repeater’s position, not the actual position of thereceiver itself.
15.2. GSM
Another widely-used positioning approach, especially for cell phones, is to usethe GSM network itself. GSM, short form of Global System for Mobile Com-munications, is a standard set which describes protocols for digital cellularnetworks, also known as 2G or second generation protocols. Most cell phone
72
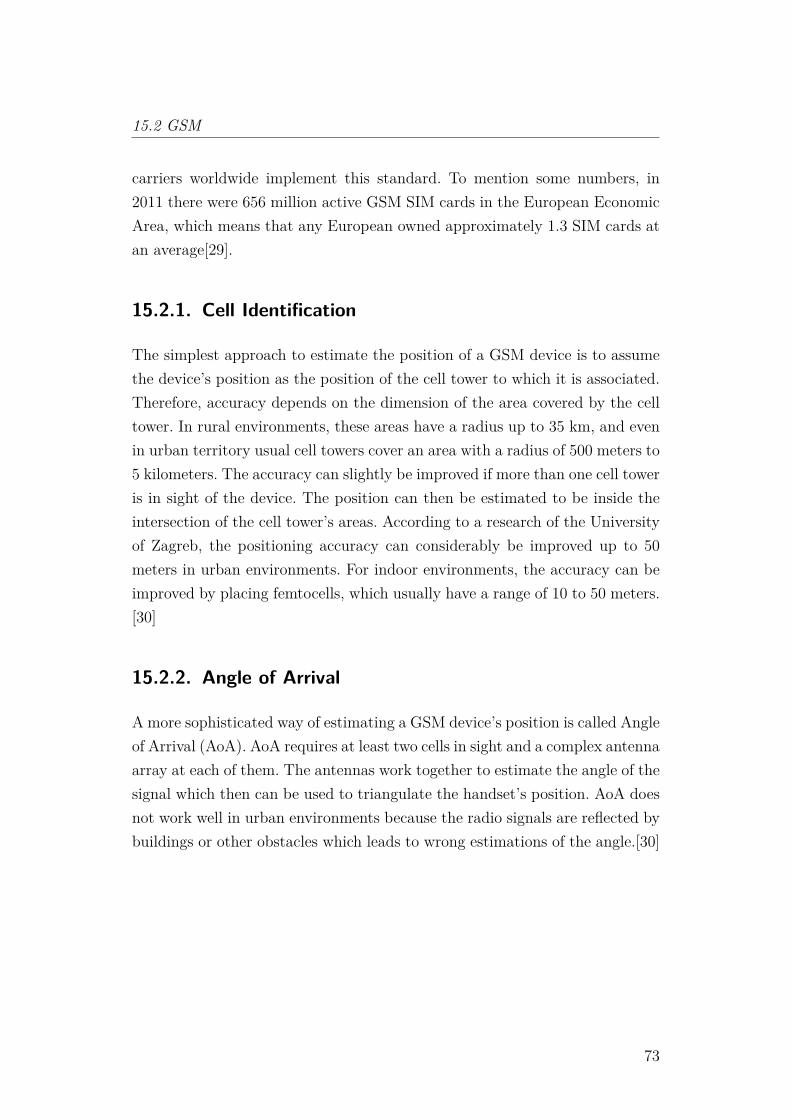
15.2 GSM
carriers worldwide implement this standard. To mention some numbers, in2011 there were 656 million active GSM SIM cards in the European EconomicArea, which means that any European owned approximately 1.3 SIM cards atan average[29].
15.2.1. Cell Identification
The simplest approach to estimate the position of a GSM device is to assumethe device’s position as the position of the cell tower to which it is associated.Therefore, accuracy depends on the dimension of the area covered by the celltower. In rural environments, these areas have a radius up to 35 km, and evenin urban territory usual cell towers cover an area with a radius of 500 meters to5 kilometers. The accuracy can slightly be improved if more than one cell toweris in sight of the device. The position can then be estimated to be inside theintersection of the cell tower’s areas. According to a research of the Universityof Zagreb, the positioning accuracy can considerably be improved up to 50meters in urban environments. For indoor environments, the accuracy can beimproved by placing femtocells, which usually have a range of 10 to 50 meters.[30]
15.2.2. Angle of Arrival
A more sophisticated way of estimating a GSM device’s position is called Angleof Arrival (AoA). AoA requires at least two cells in sight and a complex antennaarray at each of them. The antennas work together to estimate the angle of thesignal which then can be used to triangulate the handset’s position. AoA doesnot work well in urban environments because the radio signals are reflected bybuildings or other obstacles which leads to wrong estimations of the angle.[30]
73
15. Absolute Positioning
c
(x|y)
α
β
γ
Figure 15.2.: Illustration of a AoA Triangulation. α and β are Known Becauseof the Antenna Arrays
15.2.3. Time of Arrival
The Time of Arrival (ToA) approach uses the signal’s transit time from themobile device to a number of base stations to determine the position. In orderto measure the signal transit time, mobile devices and base stations need tobe synchronized in time, and the signal itself needs to be tagged with thesubmission time. In accurate synchronized networks, an average error between125 and 200 meter is achievable. The accuracy deteriorates drastically if basestations and mobile devices are non-line-of-sight. The reasons are reflections orattenuation due to objects, passed by the signal, which influence the signal’stransit time.[30]
15.2.4. RSSI-based positioning
In contrast to ToA and AoA, RSSI-based positioning takes place at the mobiledevice itself. RSSI, short form of received signal strength indication, describesthe signal quality to a base station. As the signal strength depends on lotsof factors like buildings or other obstacles laying between the handset andthe base stations, it is not possible to estimate the position directly from theRSSI.
74
15.3 Wi-Fi
To determine a position from RSSI values, fingerprints have to be created.A fingerprint associates a position to RSSIs measured at this position. Thosefingerprints are usually stored in a database. Later, these fingerprints are com-pared to the RSSIs measured by the handset, in order to estimate its position.Because the creation of fingerprints for large areas is a time consuming task,some projects like CellSense[31] compute fingerprints, based on a histogram ofsignal strengths for the base stations. In case of CellSense, they were able toachieve an accuracy of 30.05 meters in an urban environment.
15.3. Wi-Fi
Another radio-based approach is to use wireless local area networks for posi-tioning. In this work, the term Wi-Fi is used for products based on the IEEE802.11 standards, similar to the definition of the Wi-Fi Alliance[32].
15.3.1. Market Overview
Wi-Fi-assisted positioning systems are used the most in indoor positioningsystems. However, there is nothing like a standard, and most solutions are onlydeveloped for scientific research and less for daily usage. Nevertheless, moreand more well-known companies are releasing products. Many of these productsare only considered for usage in experimental environments. For example, theMozilla Foundation started their free serviceMozilla Location Service[33] in theend of October 2013. The Wi-Fi cell information is provided by users, whereasany application developer can to use a REST API to get location informationlater on. The Google Location Service is a similar project by Google, whichalso provides a free to use interface for application developers, but there is nopossibility to add own Wi-Fi information.
In addition to those companies, other device manufacturers such as Apple[34]and Cisco[35] have their own Wi-Fi-based positioning systems, as well. How-ever, none of those companies make precise statements about the functionalprinciple and accuracies.
75
15. Absolute Positioning
15.3.2. Angle of Arrival
In general, position determination approaches for Wi-Fi-based systems aresimilar to the ones for GSM. One method, also applicable for Wi-Fi is theAngle of Arrival approach, explained in section 15.2.2. Like for GSM, specialwireless access points with antenna arrays are needed to determine the positionat the access point and send it back to the client.
Based on the AoA concept, Kawauchi et al.[36] developed a system which addsdirectional information to the beacon. The beacon is a tiny data package ofthe IEEE 802.11 standard, which is send in intervals and used to determinenearby access points and their signal strength. Therefore, they mounted amotorized, rotatable directional antenna to a wireless access point and modifiedthe firmware, to add the current rotation of the antenna to the send out beacon.The location can now be estimated based on this angle and the known positionof the wireless access point by using triangulation.
15.3.3. Time Of Arrival
Time of Arrival (ToA) is a trilateration-based positioning system, whereasthe distance to at least three access points is determined based on the signalruntime. The distance can be seen like a circle around the access points, whoseposition is known. The mobile device’s location is the intersection point of thesecircles. As the currently used IEEE 802.11a,b,g,n standard does not includesignal runtimes, needed for ToA, modified hardware and drivers are needed toimplement an accurate positioning system.
However, Ciurana et al.[37] developed a software-based solution, working with-out the need of specialized hardware. The Wi-Fi clients sends a data frame tothe access point and waits for the acknowledgement. The time between send-ing and receiving the acknowledgement is assumed to be the round-trip time(RTT). As those RTT might be influenced by various external factors, such aswalls or other radio frequency devices, 1000 RTTs are measured and filteredbased on statistical information before the position is estimated. They testedthe distance determination indoor and outdoor and got an average absoluteerror of 1.7 meters indoor, respectively 1.84 meters outdoor.
76
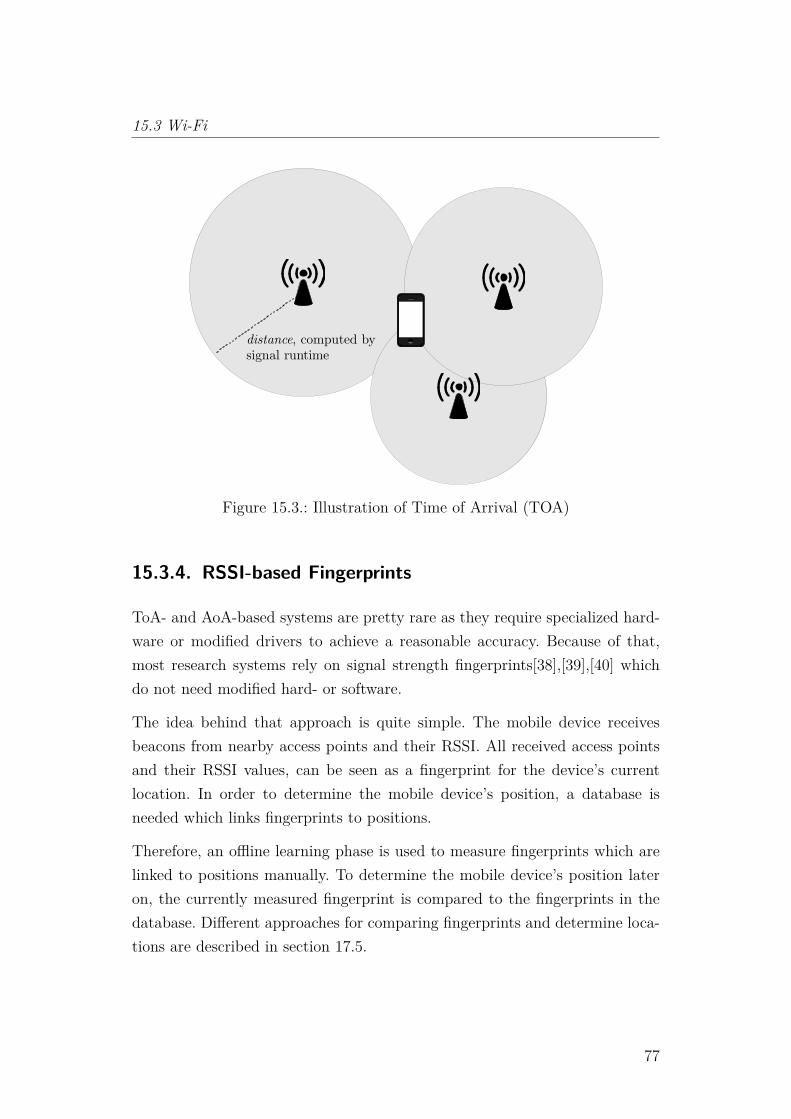
15.3 Wi-Fi
distance, computed bysignal runtime
Figure 15.3.: Illustration of Time of Arrival (TOA)
15.3.4. RSSI-based Fingerprints
ToA- and AoA-based systems are pretty rare as they require specialized hard-ware or modified drivers to achieve a reasonable accuracy. Because of that,most research systems rely on signal strength fingerprints[38],[39],[40] whichdo not need modified hard- or software.
The idea behind that approach is quite simple. The mobile device receivesbeacons from nearby access points and their RSSI. All received access pointsand their RSSI values, can be seen as a fingerprint for the device’s currentlocation. In order to determine the mobile device’s position, a database isneeded which links fingerprints to positions.
Therefore, an offline learning phase is used to measure fingerprints which arelinked to positions manually. To determine the mobile device’s position lateron, the currently measured fingerprint is compared to the fingerprints in thedatabase. Different approaches for comparing fingerprints and determine loca-tions are described in section 17.5.
77
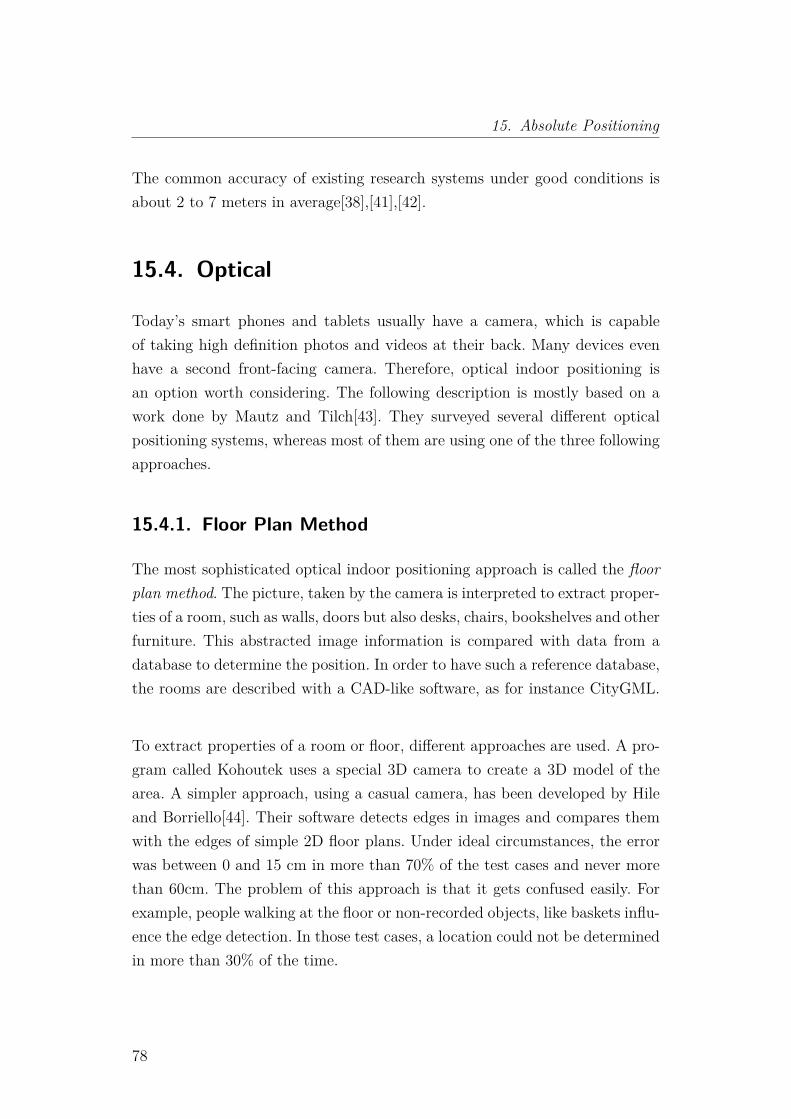
15. Absolute Positioning
The common accuracy of existing research systems under good conditions isabout 2 to 7 meters in average[38],[41],[42].
15.4. Optical
Today’s smart phones and tablets usually have a camera, which is capableof taking high definition photos and videos at their back. Many devices evenhave a second front-facing camera. Therefore, optical indoor positioning isan option worth considering. The following description is mostly based on awork done by Mautz and Tilch[43]. They surveyed several different opticalpositioning systems, whereas most of them are using one of the three followingapproaches.
15.4.1. Floor Plan Method
The most sophisticated optical indoor positioning approach is called the floorplan method. The picture, taken by the camera is interpreted to extract proper-ties of a room, such as walls, doors but also desks, chairs, bookshelves and otherfurniture. This abstracted image information is compared with data from adatabase to determine the position. In order to have such a reference database,the rooms are described with a CAD-like software, as for instance CityGML.
To extract properties of a room or floor, different approaches are used. A pro-gram called Kohoutek uses a special 3D camera to create a 3D model of thearea. A simpler approach, using a casual camera, has been developed by Hileand Borriello[44]. Their software detects edges in images and compares themwith the edges of simple 2D floor plans. Under ideal circumstances, the errorwas between 0 and 15 cm in more than 70% of the test cases and never morethan 60cm. The problem of this approach is that it gets confused easily. Forexample, people walking at the floor or non-recorded objects, like baskets influ-ence the edge detection. In those test cases, a location could not be determinedin more than 30% of the time.
78
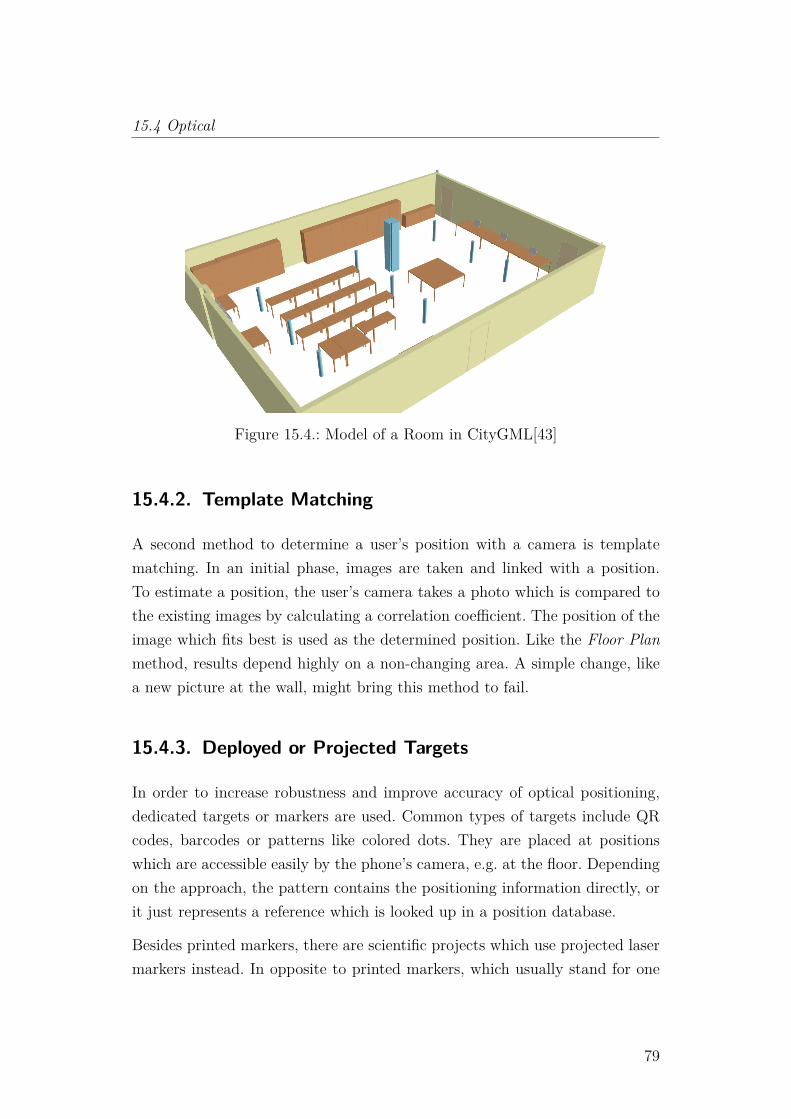
15.4 Optical
Figure 15.4.: Model of a Room in CityGML[43]
15.4.2. Template Matching
A second method to determine a user’s position with a camera is templatematching. In an initial phase, images are taken and linked with a position.To estimate a position, the user’s camera takes a photo which is compared tothe existing images by calculating a correlation coefficient. The position of theimage which fits best is used as the determined position. Like the Floor Planmethod, results depend highly on a non-changing area. A simple change, likea new picture at the wall, might bring this method to fail.
15.4.3. Deployed or Projected Targets
In order to increase robustness and improve accuracy of optical positioning,dedicated targets or markers are used. Common types of targets include QRcodes, barcodes or patterns like colored dots. They are placed at positionswhich are accessible easily by the phone’s camera, e.g. at the floor. Dependingon the approach, the pattern contains the positioning information directly, orit just represents a reference which is looked up in a position database.
Besides printed markers, there are scientific projects which use projected lasermarkers instead. In opposite to printed markers, which usually stand for one
79
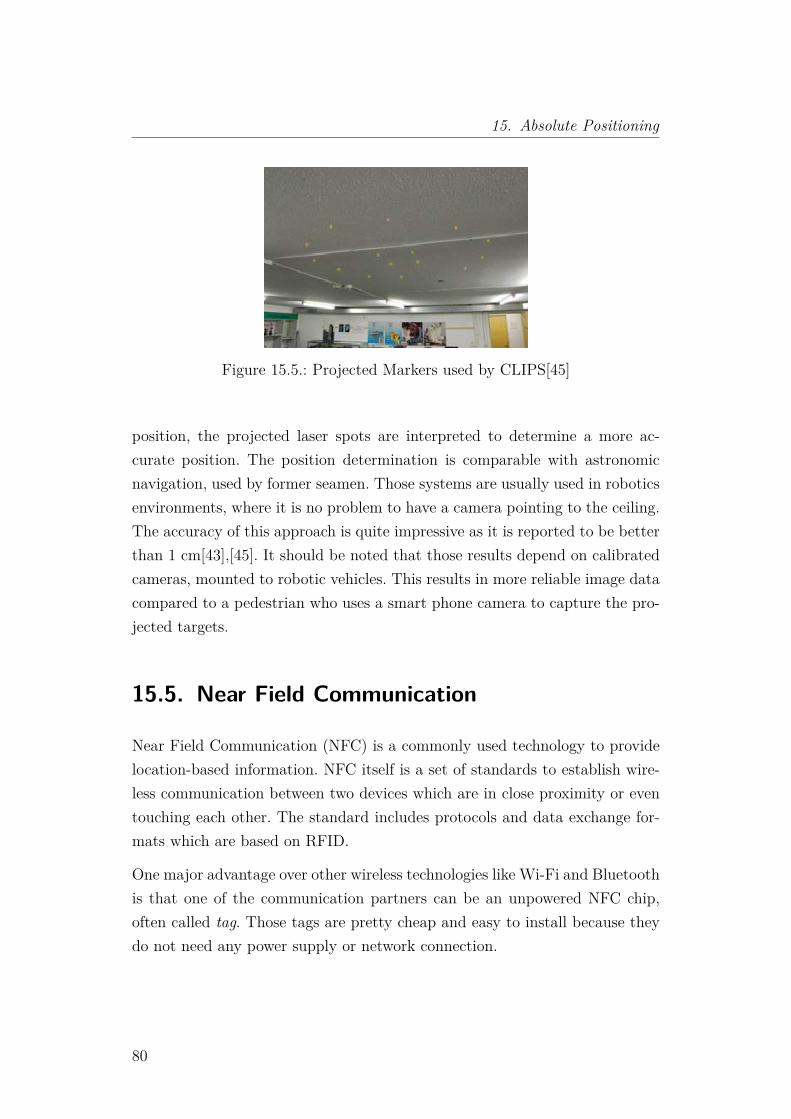
15. Absolute Positioning
Figure 15.5.: Projected Markers used by CLIPS[45]
position, the projected laser spots are interpreted to determine a more ac-curate position. The position determination is comparable with astronomicnavigation, used by former seamen. Those systems are usually used in roboticsenvironments, where it is no problem to have a camera pointing to the ceiling.The accuracy of this approach is quite impressive as it is reported to be betterthan 1 cm[43],[45]. It should be noted that those results depend on calibratedcameras, mounted to robotic vehicles. This results in more reliable image datacompared to a pedestrian who uses a smart phone camera to capture the pro-jected targets.
15.5. Near Field Communication
Near Field Communication (NFC) is a commonly used technology to providelocation-based information. NFC itself is a set of standards to establish wire-less communication between two devices which are in close proximity or eventouching each other. The standard includes protocols and data exchange for-mats which are based on RFID.
One major advantage over other wireless technologies like Wi-Fi and Bluetoothis that one of the communication partners can be an unpowered NFC chip,often called tag. Those tags are pretty cheap and easy to install because theydo not need any power supply or network connection.
80
15.5 Near Field Communication
The used data format for data exchange is the NFC Data Exchange Format(NDEF). The message structure is specified by the NFC Forum™citeNDEFSpecification. The maximum payload size of an NDEF message is232 − 1 bytes.
This specified maximum is not even nearly reached by commonly used NFCtags. Typically they are designed to hold less than 1 kilo byte of data. For thisreason, the payload often only has an identifying or referencing role.
As the NFC reading device, e.g. an NFC capable smart phone, needs to touchan NFC tag in order to read it, NFC cannot be used for continuous positiondetermination.
81
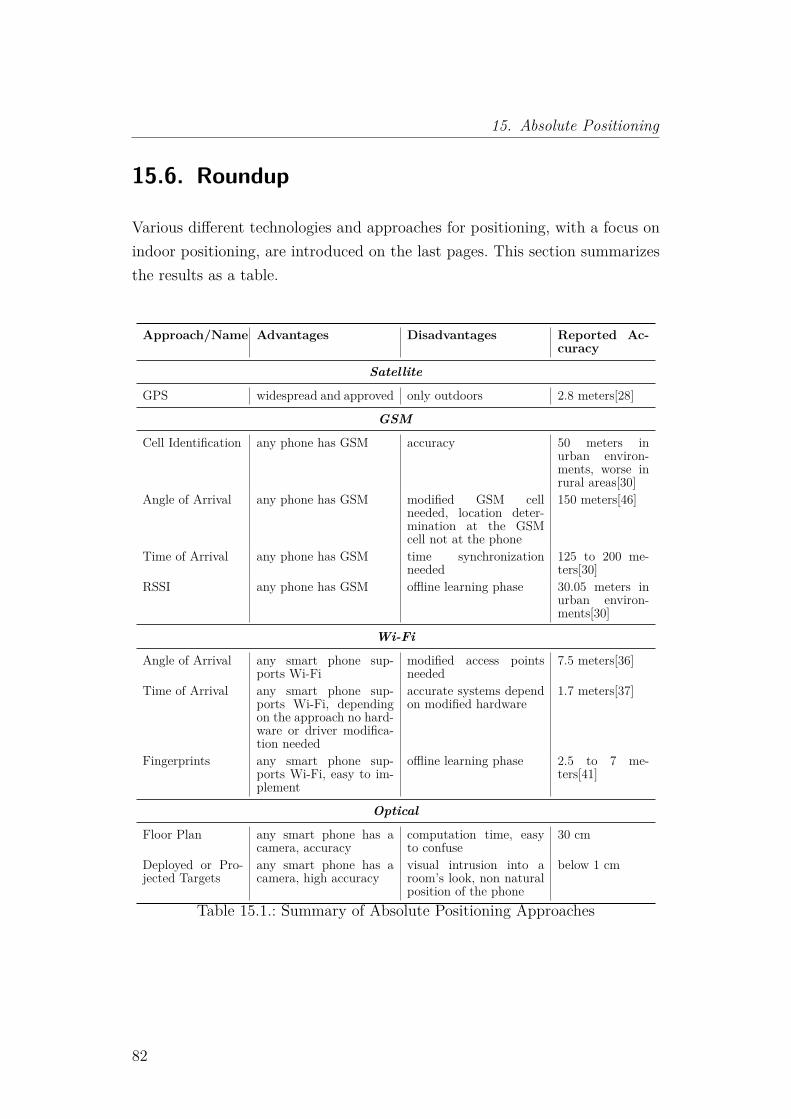
15. Absolute Positioning
15.6. Roundup
Various different technologies and approaches for positioning, with a focus onindoor positioning, are introduced on the last pages. This section summarizesthe results as a table.
Approach/Name Advantages Disadvantages Reported Ac-curacy
Satellite
GPS widespread and approved only outdoors 2.8 meters[28]
GSM
Cell Identification any phone has GSM accuracy 50 meters inurban environ-ments, worse inrural areas[30]
Angle of Arrival any phone has GSM modified GSM cellneeded, location deter-mination at the GSMcell not at the phone
150 meters[46]
Time of Arrival any phone has GSM time synchronizationneeded
125 to 200 me-ters[30]
RSSI any phone has GSM offline learning phase 30.05 meters inurban environ-ments[30]
Wi-Fi
Angle of Arrival any smart phone sup-ports Wi-Fi
modified access pointsneeded
7.5 meters[36]
Time of Arrival any smart phone sup-ports Wi-Fi, dependingon the approach no hard-ware or driver modifica-tion needed
accurate systems dependon modified hardware
1.7 meters[37]
Fingerprints any smart phone sup-ports Wi-Fi, easy to im-plement
offline learning phase 2.5 to 7 me-ters[41]
Optical
Floor Plan any smart phone has acamera, accuracy
computation time, easyto confuse
30 cm
Deployed or Pro-jected Targets
any smart phone has acamera, high accuracy
visual intrusion into aroom’s look, non naturalposition of the phone
below 1 cm
Table 15.1.: Summary of Absolute Positioning Approaches
82
16. Relative Positioning
In opposite to absolute positioning, relative positioning is just able to deter-mine position changes. On the assumption that an absolute position is known,new positions can be reckoned from this reference position and estimated po-sition changes. This process, of calculation the current position by using apreviously determined position and advancing that position upon sensor datasuch as speed and direction, is called dead reckoning.
Most smart phones offer a lot of sensors, such as accelerometers, magnetome-ters and gyroscopes, which can be used to determine position changes. Methodsto detect steps and determine the user’s heading based on those sensors aredescribed in section 18.
The sensors used in relative positioning approaches differ a lot, dependingon the sensor availability. Probably the most intelligible approach is to havethe direction, provided by a compass and the traveling speed, provided by aspeedometer. The traveled distance can easily be calculated as speed ∗ timeand because the direction is known, the new position can be reckoned. Thisapproach is widely used in marine and air navigation[47]. However, it becomesirrelevant due to the availability of satellite-based position such as GPS.
This chapter describes existing relative positioning approaches for robots andpedestrians.
16.1. Robot’s Positioning
Besides air and marine navigation, dead reckoning is more interesting for indoorrobot positioning today. Instead of a compass or a speedometer, dead reckoningin mobile robotics often makes use of engine data because many wheeled mobilerobots are using a skid steering. Skid-steered vehicles do not have a moving
83
16. Relative Positioning
steering axle like cars. Instead, they have four or even more wheels at staticaxles, which can be moved independently from each other. Assuming thatthe rotation of the wheels is known, orientation and traveled distance canbe calculated and used to determine a new position. An advantage of thisapproach is that no additional sensors are required, as all needed data canbe tapped from the unit which controls the engines. A problem with such akinematic approach is that calculations assume that a wheel never slips orcrawls. Any slippage leads to inaccurate rotation and distance data[48].
In order to provide accurate dead reckoning, it is necessary to have kinematicindependent sensors which are used to estimate the position. A project devel-oped by Bonarini et al. is following a pretty interesting low cost approach, byusing optical computer mice to measure movements of a vehicle. There is onemouse at the left and one mouse at the right side of the vehicle. Because thedistance between the two mice is static, angles can be calculated from the mea-sured traveled distance. With an average deviation of 114mm in UMBMark, itis about as accurate as other robots which are using complicated mechanicalencoders for dead reckoning[49].
16.2. Pedestrian Positioning
As described in the sections above, dead reckoning depends on a direction andan estimation how far an object has been moved into that direction. Today’ssmart phones offer compass sensors, which can be used to estimate the movingdirection, but there is no such sensor like a speedometer in a car. Therefore,the traveling speed has to be estimated by using the existing accelerometer.
An accelerometer measures the acceleration force on all three physical axes,including the force of gravity. A common approach is to analyze those datato make assumptions whether the user made a step respectively is walk-ing[50],[51]. A detailed description about step detection and compass issueswithin buildings can be found in section 18.
84
17. Absolute Positioning in MoCaInfo
Chapter 15 describes various absolute positioning methods which are appli-cable for smart phones. This chapter starts with a short explanation, whycertain absolute positioning approaches are not used for MoCaInfo’s position-ing system. After that, the usage of NFC for positioning is described briefly.The chapter ends with an introduction and evaluation of the Wi-Fi positioningsystem, which is used for continuous indoor positioning.
17.1. GSM
Based on the results of various researches[30],[31],[52], GSM seems to be agood approach to determine a position in buildings. Even though, it is notaccurate enough for indoor navigation, it could be used to enhance the posi-tioning results of other approaches like Wi-Fi-based positioning. GSM signalsare available in most areas of buildings, and as smart phones are the targeteddevices, a GSM module and SIM card can be presupposed.
In earlier tests with various Android devices, it has been noticed that manydevices just deliver the currently associated GSM cell via the Android API[53,p. 13]. As explained in section 15.2.1, neighbor cells are needed for a reasonablelocation accuracy.
Using the angle between the mobile device and a GSM base station requiresaccess to the base station. In case of indoor positioning, this means an owninfrastructure of GSM femtocells is required. This approach became imprac-ticable with a court decision in July 2013[54], interdicting the operation ofprivate GSM cells in Germany. Because Time of Arrival also needs access tothe whole GSM infrastructure, it cannot be used for the same reason.
85
17. Absolute Positioning in MoCaInfo
17.2. Optical
The approaches described in section 15.4 are not used for positioning in Mo-CaInfo for various reasons. For a start, all optical approaches force the userto hold the smart phone or tablet in an unnatural way. This is a problem,especially for visually impaired users because they cannot know how to holdthe device to capture a photo which is usable for positioning. In addition, thefloor plan and the template matching method rely on a non-changing environ-ment. This is not applicable for a university, where black boards and posterschanging all the time and students are walking through the floor. Furthermore,an intrusion into the appearance of a building is not wanted. Therefore, themost promising approach of artificial landmarks cannot be adopted.
17.3. Global Positioning System
GPS receivers are integrated in most modern smart phones, and Android’s lo-cation API supports their usage. Therefore, GPS is used for positioning when-ever it is more accurate than other positioning approaches. This usually hap-pens outside, where the Wi-Fi positioning system, described in section 17.5,is not available. A detailed explanation about the usage of multiple absolutelocation sources can be found in section 19.3.
17.4. Near Field Communication
With Android API level 9, better known as Android 2.3, Google introducedsupport for the NFC technology. This enables Android devices with an appro-priate built-in NFC receiver to read and write NFC tags.
In API level 14, also known as Android 4.0, the Android Beam feature has beenintroduced, providing message exchange between two Android devices. Com-mon use cases are exchanging contact information or sending short multimediafiles like pictures or audio clips.
86
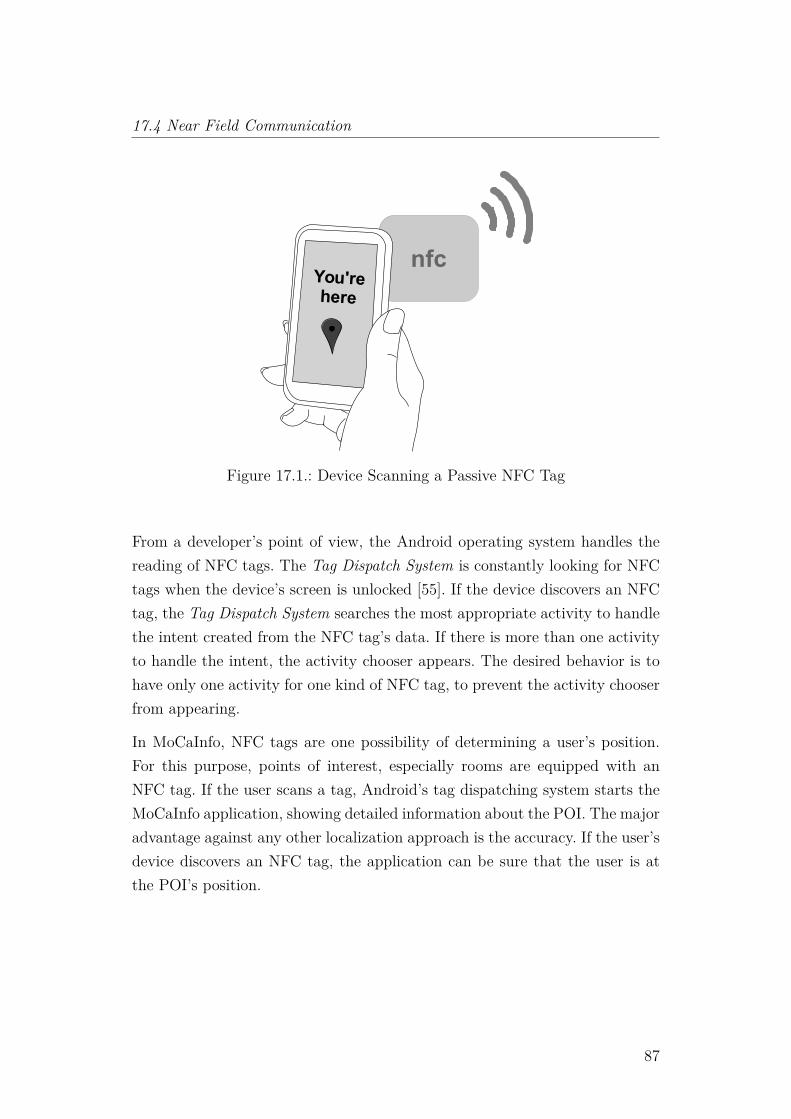
17.4 Near Field Communication
nfcYou'rehere
Figure 17.1.: Device Scanning a Passive NFC Tag
From a developer’s point of view, the Android operating system handles thereading of NFC tags. The Tag Dispatch System is constantly looking for NFCtags when the device’s screen is unlocked [55]. If the device discovers an NFCtag, the Tag Dispatch System searches the most appropriate activity to handlethe intent created from the NFC tag’s data. If there is more than one activityto handle the intent, the activity chooser appears. The desired behavior is tohave only one activity for one kind of NFC tag, to prevent the activity chooserfrom appearing.
In MoCaInfo, NFC tags are one possibility of determining a user’s position.For this purpose, points of interest, especially rooms are equipped with anNFC tag. If the user scans a tag, Android’s tag dispatching system starts theMoCaInfo application, showing detailed information about the POI. The majoradvantage against any other localization approach is the accuracy. If the user’sdevice discovers an NFC tag, the application can be sure that the user is atthe POI’s position.
87
17. Absolute Positioning in MoCaInfo
17.5. Wi-Fi
Wi-Fi is a perfect indoor positioning technology for a university campus be-cause wireless access points are widely distributed in any building, especiallythose with lecture halls.
Nevertheless, it should be noted that not any existing Wi-Fi infrastructure canbe used for positioning. In case of Technische Hochschule Mittelhessen, accesspoints are reconfiguring itself, depending on the number of connected clients,network usage and other device’s on the same Wi-Fi channel. This means thesending signal strength and Wi-Fi channel change over time. This is a no-go forthe used fingerprinting approach which relies on a non-changing configurationand environment.
For this reason, eight Wi-Fi access points for positioning have been installedat the first floor of building A20. The access points have been configured tosend with the highest power and on a static channel. They are not used totransmit any data except the Wi-Fi beacons.
This section describes the developed Wi-Fi positioning system, including fil-ters, fingerprint comparison methods and different ways to estimate the posi-tion. The section ends with an evaluation.
17.5.1. Filters
In order to achieve more accurate results, Wi-Fi measurements are filtered forcertain properties. For example, a student’s discoverable ad-hoc Wi-Fi networkshould not have an influence on fingerprint comparison because this woulddistort the results.
In MoCaInfo, there are two types of filters, Measurement Filters, which areapplied to the current Wi-Fi measurement, and Selection Filters, which areapplied to the fingerprints in the database.
88
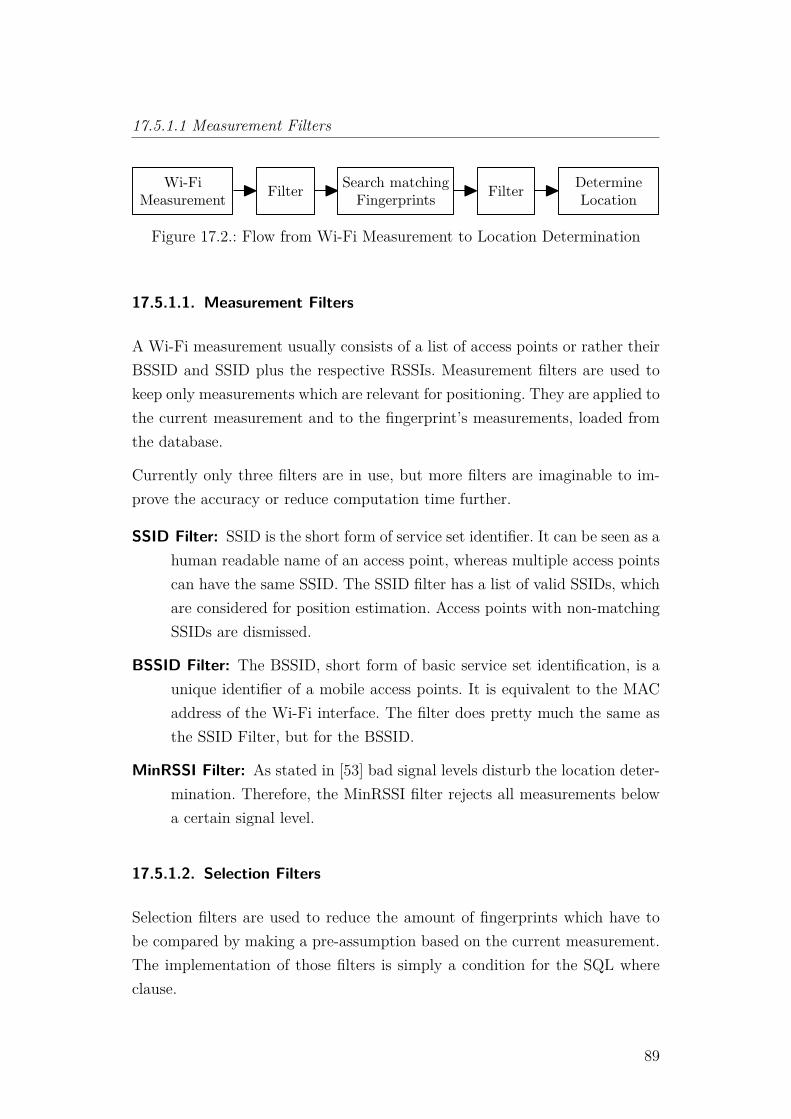
17.5.1.1 Measurement Filters
Wi-FiMeasurement Filter Search matching
Fingerprints Filter DetermineLocation
Figure 17.2.: Flow from Wi-Fi Measurement to Location Determination
17.5.1.1. Measurement Filters
A Wi-Fi measurement usually consists of a list of access points or rather theirBSSID and SSID plus the respective RSSIs. Measurement filters are used tokeep only measurements which are relevant for positioning. They are applied tothe current measurement and to the fingerprint’s measurements, loaded fromthe database.
Currently only three filters are in use, but more filters are imaginable to im-prove the accuracy or reduce computation time further.
SSID Filter: SSID is the short form of service set identifier. It can be seen as ahuman readable name of an access point, whereas multiple access pointscan have the same SSID. The SSID filter has a list of valid SSIDs, whichare considered for position estimation. Access points with non-matchingSSIDs are dismissed.
BSSID Filter: The BSSID, short form of basic service set identification, is aunique identifier of a mobile access points. It is equivalent to the MACaddress of the Wi-Fi interface. The filter does pretty much the same asthe SSID Filter, but for the BSSID.
MinRSSI Filter: As stated in [53] bad signal levels disturb the location deter-mination. Therefore, the MinRSSI filter rejects all measurements belowa certain signal level.
17.5.1.2. Selection Filters
Selection filters are used to reduce the amount of fingerprints which have tobe compared by making a pre-assumption based on the current measurement.The implementation of those filters is simply a condition for the SQL whereclause.
89
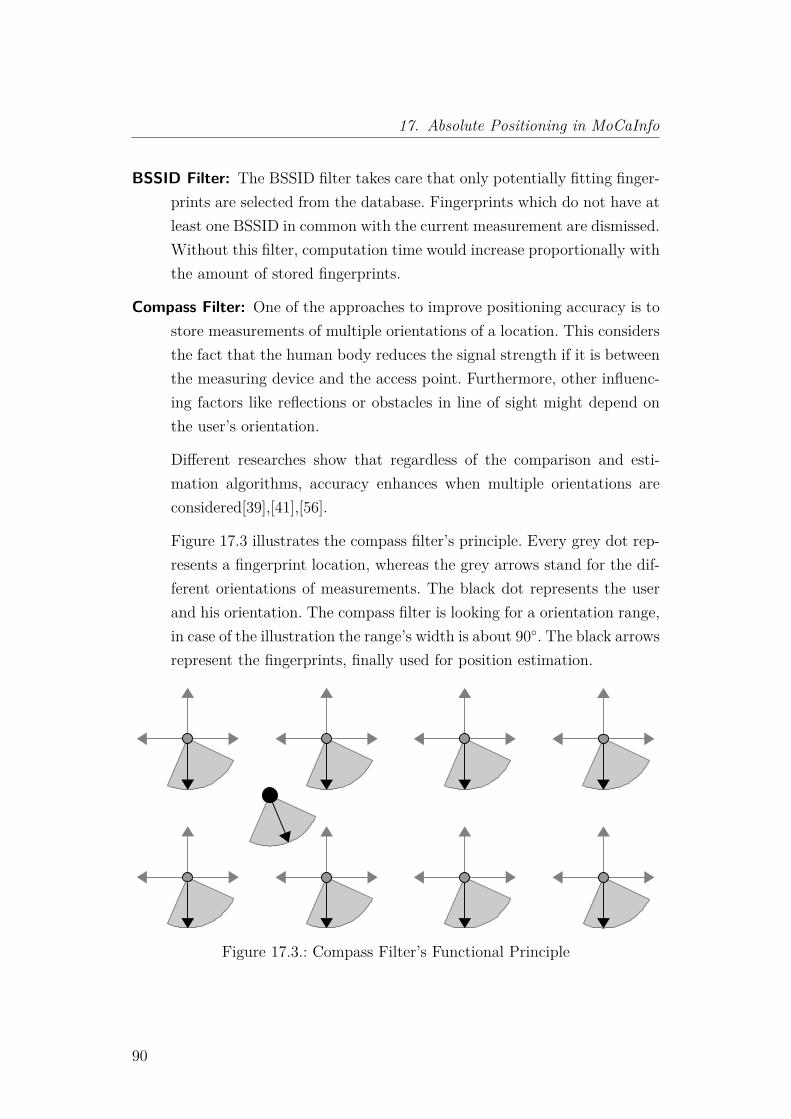
17. Absolute Positioning in MoCaInfo
BSSID Filter: The BSSID filter takes care that only potentially fitting finger-prints are selected from the database. Fingerprints which do not have atleast one BSSID in common with the current measurement are dismissed.Without this filter, computation time would increase proportionally withthe amount of stored fingerprints.
Compass Filter: One of the approaches to improve positioning accuracy is tostore measurements of multiple orientations of a location. This considersthe fact that the human body reduces the signal strength if it is betweenthe measuring device and the access point. Furthermore, other influenc-ing factors like reflections or obstacles in line of sight might depend onthe user’s orientation.
Different researches show that regardless of the comparison and esti-mation algorithms, accuracy enhances when multiple orientations areconsidered[39],[41],[56].
Figure 17.3 illustrates the compass filter’s principle. Every grey dot rep-resents a fingerprint location, whereas the grey arrows stand for the dif-ferent orientations of measurements. The black dot represents the userand his orientation. The compass filter is looking for a orientation range,in case of the illustration the range’s width is about 90◦. The black arrowsrepresent the fingerprints, finally used for position estimation.
Figure 17.3.: Compass Filter’s Functional Principle
90
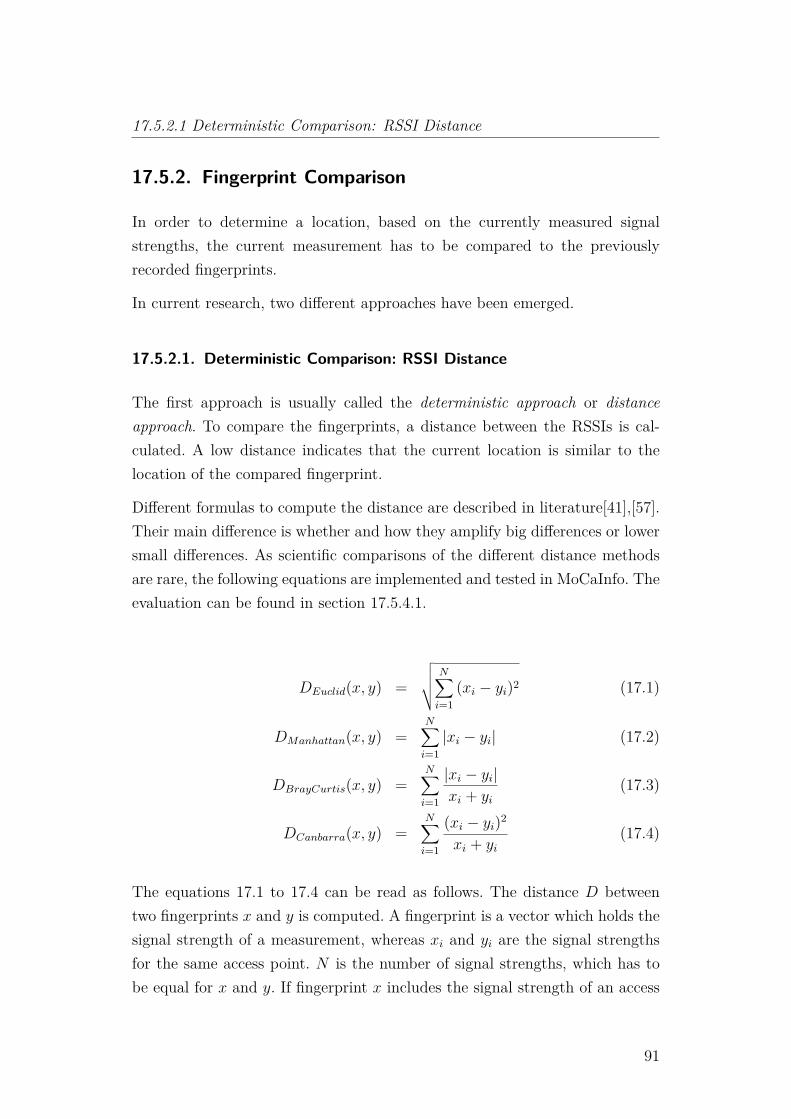
17.5.2.1 Deterministic Comparison: RSSI Distance
17.5.2. Fingerprint Comparison
In order to determine a location, based on the currently measured signalstrengths, the current measurement has to be compared to the previouslyrecorded fingerprints.
In current research, two different approaches have been emerged.
17.5.2.1. Deterministic Comparison: RSSI Distance
The first approach is usually called the deterministic approach or distanceapproach. To compare the fingerprints, a distance between the RSSIs is cal-culated. A low distance indicates that the current location is similar to thelocation of the compared fingerprint.
Different formulas to compute the distance are described in literature[41],[57].Their main difference is whether and how they amplify big differences or lowersmall differences. As scientific comparisons of the different distance methodsare rare, the following equations are implemented and tested in MoCaInfo. Theevaluation can be found in section 17.5.4.1.
DEuclid(x, y) =
√√√√ N∑i=1
(xi − yi)2 (17.1)
DManhattan(x, y) =N∑i=1|xi − yi| (17.2)
DBrayCurtis(x, y) =N∑i=1
|xi − yi|xi + yi
(17.3)
DCanbarra(x, y) =N∑i=1
(xi − yi)2
xi + yi(17.4)
The equations 17.1 to 17.4 can be read as follows. The distance D betweentwo fingerprints x and y is computed. A fingerprint is a vector which holds thesignal strength of a measurement, whereas xi and yi are the signal strengthsfor the same access point. N is the number of signal strengths, which has tobe equal for x and y. If fingerprint x includes the signal strength of an access
91
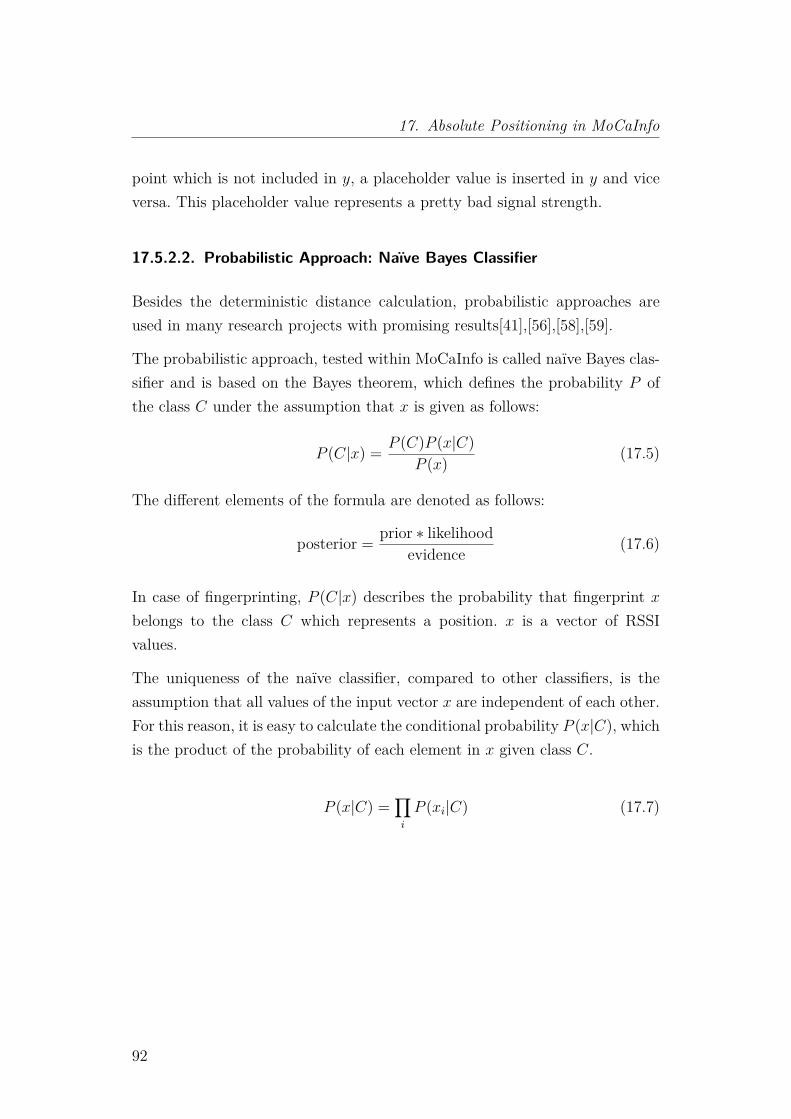
17. Absolute Positioning in MoCaInfo
point which is not included in y, a placeholder value is inserted in y and viceversa. This placeholder value represents a pretty bad signal strength.
17.5.2.2. Probabilistic Approach: Naïve Bayes Classifier
Besides the deterministic distance calculation, probabilistic approaches areused in many research projects with promising results[41],[56],[58],[59].
The probabilistic approach, tested within MoCaInfo is called naïve Bayes clas-sifier and is based on the Bayes theorem, which defines the probability P ofthe class C under the assumption that x is given as follows:
P (C|x) = P (C)P (x|C)P (x) (17.5)
The different elements of the formula are denoted as follows:
posterior = prior ∗ likelihoodevidence (17.6)
In case of fingerprinting, P (C|x) describes the probability that fingerprint xbelongs to the class C which represents a position. x is a vector of RSSIvalues.
The uniqueness of the naïve classifier, compared to other classifiers, is theassumption that all values of the input vector x are independent of each other.For this reason, it is easy to calculate the conditional probability P (x|C), whichis the product of the probability of each element in x given class C.
P (x|C) =∏i
P (xi|C) (17.7)
92
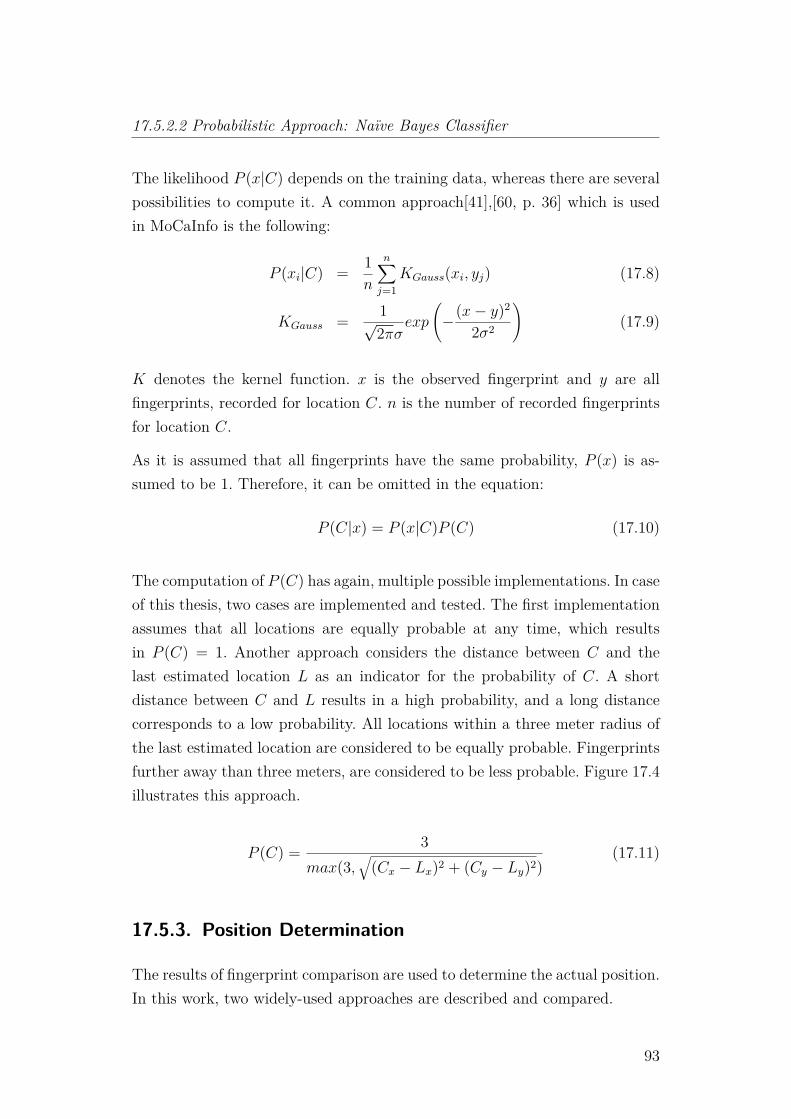
17.5.2.2 Probabilistic Approach: Naïve Bayes Classifier
The likelihood P (x|C) depends on the training data, whereas there are severalpossibilities to compute it. A common approach[41],[60, p. 36] which is usedin MoCaInfo is the following:
P (xi|C) = 1n
n∑j=1
KGauss(xi, yj) (17.8)
KGauss = 1√2πσ
exp
(−(x− y)2
2σ2
)(17.9)
K denotes the kernel function. x is the observed fingerprint and y are allfingerprints, recorded for location C. n is the number of recorded fingerprintsfor location C.
As it is assumed that all fingerprints have the same probability, P (x) is as-sumed to be 1. Therefore, it can be omitted in the equation:
P (C|x) = P (x|C)P (C) (17.10)
The computation of P (C) has again, multiple possible implementations. In caseof this thesis, two cases are implemented and tested. The first implementationassumes that all locations are equally probable at any time, which resultsin P (C) = 1. Another approach considers the distance between C and thelast estimated location L as an indicator for the probability of C. A shortdistance between C and L results in a high probability, and a long distancecorresponds to a low probability. All locations within a three meter radius ofthe last estimated location are considered to be equally probable. Fingerprintsfurther away than three meters, are considered to be less probable. Figure 17.4illustrates this approach.
P (C) = 3max(3,
√(Cx − Lx)2 + (Cy − Ly)2)
(17.11)
17.5.3. Position Determination
The results of fingerprint comparison are used to determine the actual position.In this work, two widely-used approaches are described and compared.
93
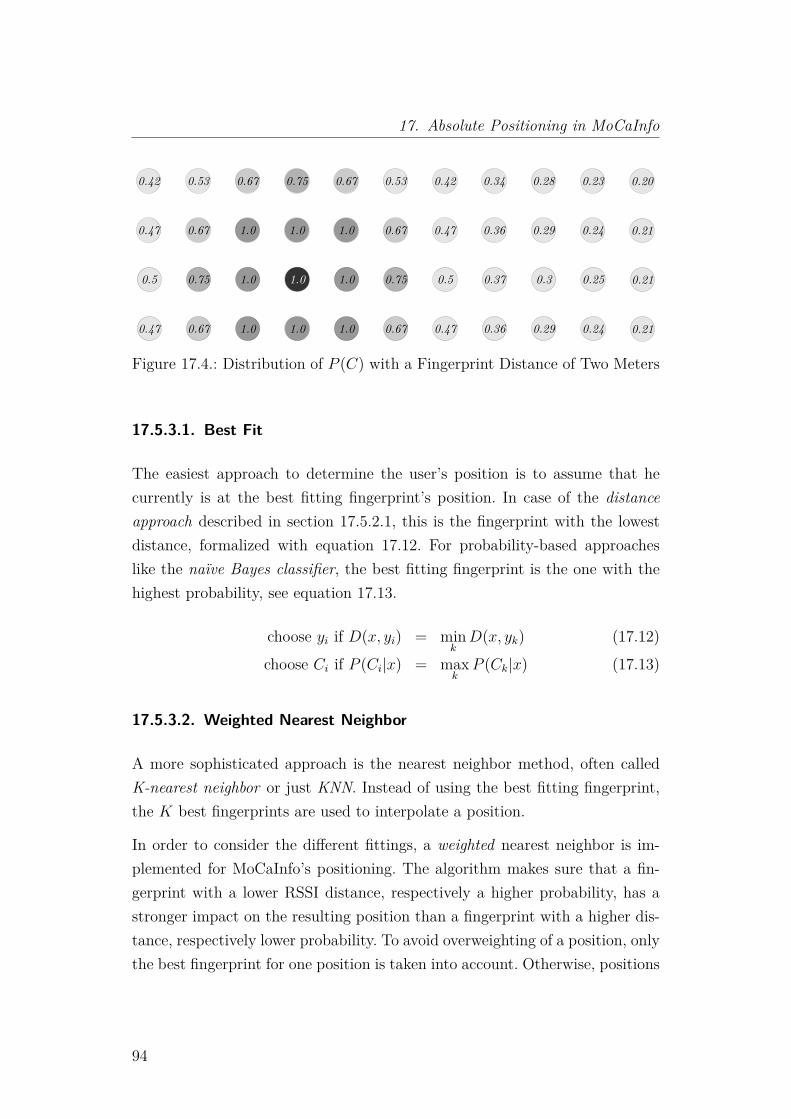
17. Absolute Positioning in MoCaInfo
0.42 0.670.53 0.75 0.67 0.53 0.340.42 0.28 0.23
0.47 1.00.67 1.0 1.0 0.67 0.360.47 0.29 0.24
0.5 1.00.75 1.0 1.0 0.75 0.370.5 0.3 0.25
0.47 1.00.67 1.0 1.0 0.67 0.360.47 0.29 0.24
0.20
0.21
0.21
0.21
Figure 17.4.: Distribution of P (C) with a Fingerprint Distance of Two Meters
17.5.3.1. Best Fit
The easiest approach to determine the user’s position is to assume that hecurrently is at the best fitting fingerprint’s position. In case of the distanceapproach described in section 17.5.2.1, this is the fingerprint with the lowestdistance, formalized with equation 17.12. For probability-based approacheslike the naïve Bayes classifier, the best fitting fingerprint is the one with thehighest probability, see equation 17.13.
choose yi if D(x, yi) = minkD(x, yk) (17.12)
choose Ci if P (Ci|x) = maxk
P (Ck|x) (17.13)
17.5.3.2. Weighted Nearest Neighbor
A more sophisticated approach is the nearest neighbor method, often calledK-nearest neighbor or just KNN. Instead of using the best fitting fingerprint,the K best fingerprints are used to interpolate a position.
In order to consider the different fittings, a weighted nearest neighbor is im-plemented for MoCaInfo’s positioning. The algorithm makes sure that a fin-gerprint with a lower RSSI distance, respectively a higher probability, has astronger impact on the resulting position than a fingerprint with a higher dis-tance, respectively lower probability. To avoid overweighting of a position, onlythe best fingerprint for one position is taken into account. Otherwise, positions
94
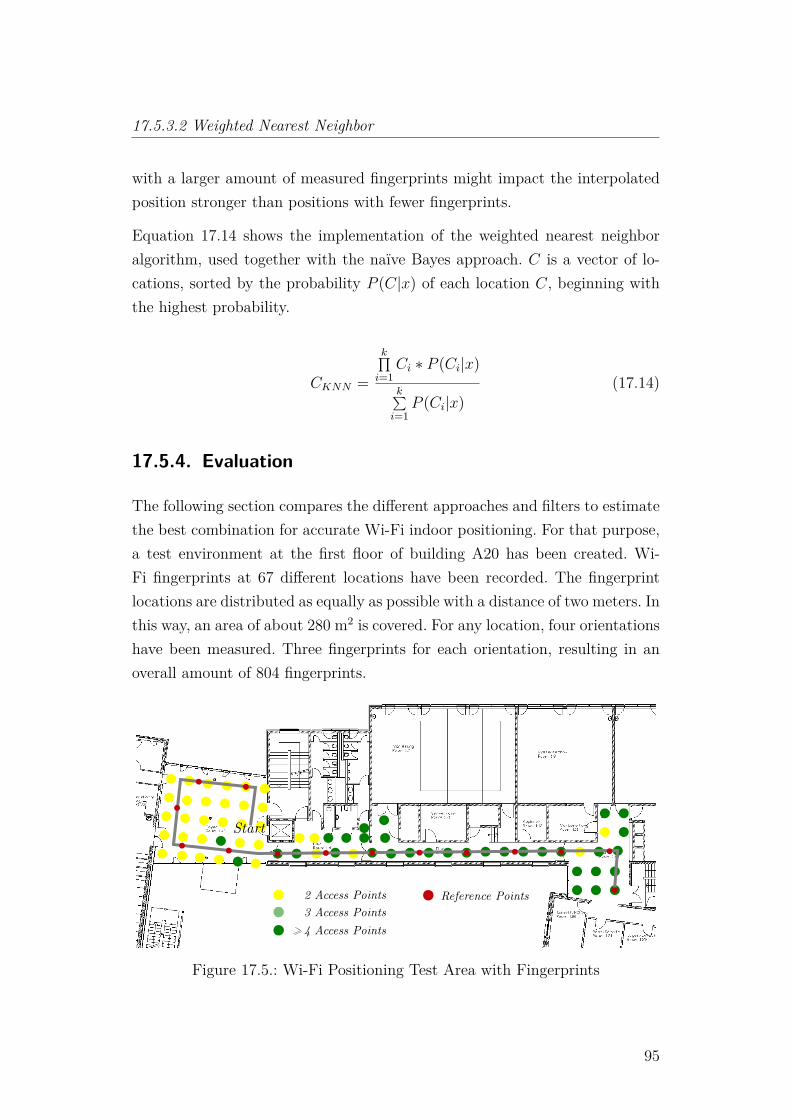
17.5.3.2 Weighted Nearest Neighbor
with a larger amount of measured fingerprints might impact the interpolatedposition stronger than positions with fewer fingerprints.
Equation 17.14 shows the implementation of the weighted nearest neighboralgorithm, used together with the naïve Bayes approach. C is a vector of lo-cations, sorted by the probability P (C|x) of each location C, beginning withthe highest probability.
CKNN =
k∏i=1
Ci ∗ P (Ci|x)k∑i=1
P (Ci|x)(17.14)
17.5.4. Evaluation
The following section compares the different approaches and filters to estimatethe best combination for accurate Wi-Fi indoor positioning. For that purpose,a test environment at the first floor of building A20 has been created. Wi-Fi fingerprints at 67 different locations have been recorded. The fingerprintlocations are distributed as equally as possible with a distance of two meters. Inthis way, an area of about 280 m2 is covered. For any location, four orientationshave been measured. Three fingerprints for each orientation, resulting in anoverall amount of 804 fingerprints.
2 Access Points3 Access Points4 Access Points>
Reference Points
Start
Figure 17.5.: Wi-Fi Positioning Test Area with Fingerprints
95
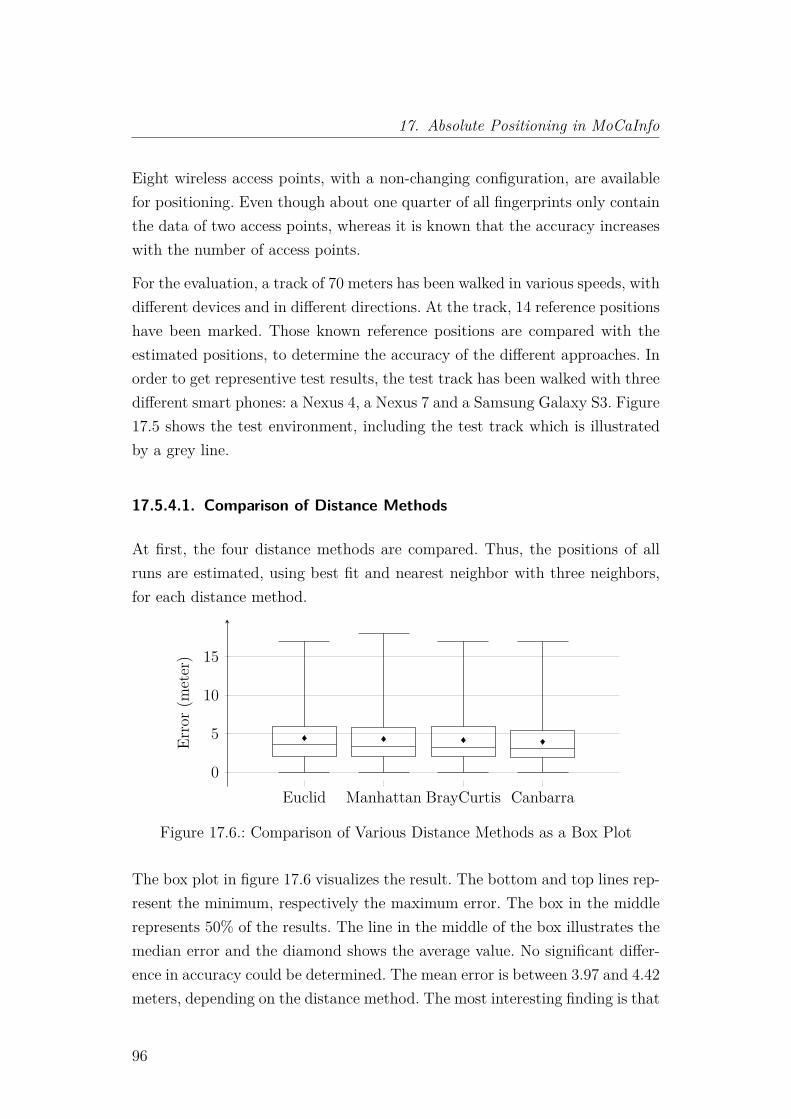
17. Absolute Positioning in MoCaInfo
Eight wireless access points, with a non-changing configuration, are availablefor positioning. Even though about one quarter of all fingerprints only containthe data of two access points, whereas it is known that the accuracy increaseswith the number of access points.
For the evaluation, a track of 70 meters has been walked in various speeds, withdifferent devices and in different directions. At the track, 14 reference positionshave been marked. Those known reference positions are compared with theestimated positions, to determine the accuracy of the different approaches. Inorder to get representive test results, the test track has been walked with threedifferent smart phones: a Nexus 4, a Nexus 7 and a Samsung Galaxy S3. Figure17.5 shows the test environment, including the test track which is illustratedby a grey line.
17.5.4.1. Comparison of Distance Methods
At first, the four distance methods are compared. Thus, the positions of allruns are estimated, using best fit and nearest neighbor with three neighbors,for each distance method.
Euclid Manhattan BrayCurtis Canbarra0
5
10
15
Error(m
eter)
Figure 17.6.: Comparison of Various Distance Methods as a Box Plot
The box plot in figure 17.6 visualizes the result. The bottom and top lines rep-resent the minimum, respectively the maximum error. The box in the middlerepresents 50% of the results. The line in the middle of the box illustrates themedian error and the diamond shows the average value. No significant differ-ence in accuracy could be determined. The mean error is between 3.97 and 4.42meters, depending on the distance method. The most interesting finding is that
96
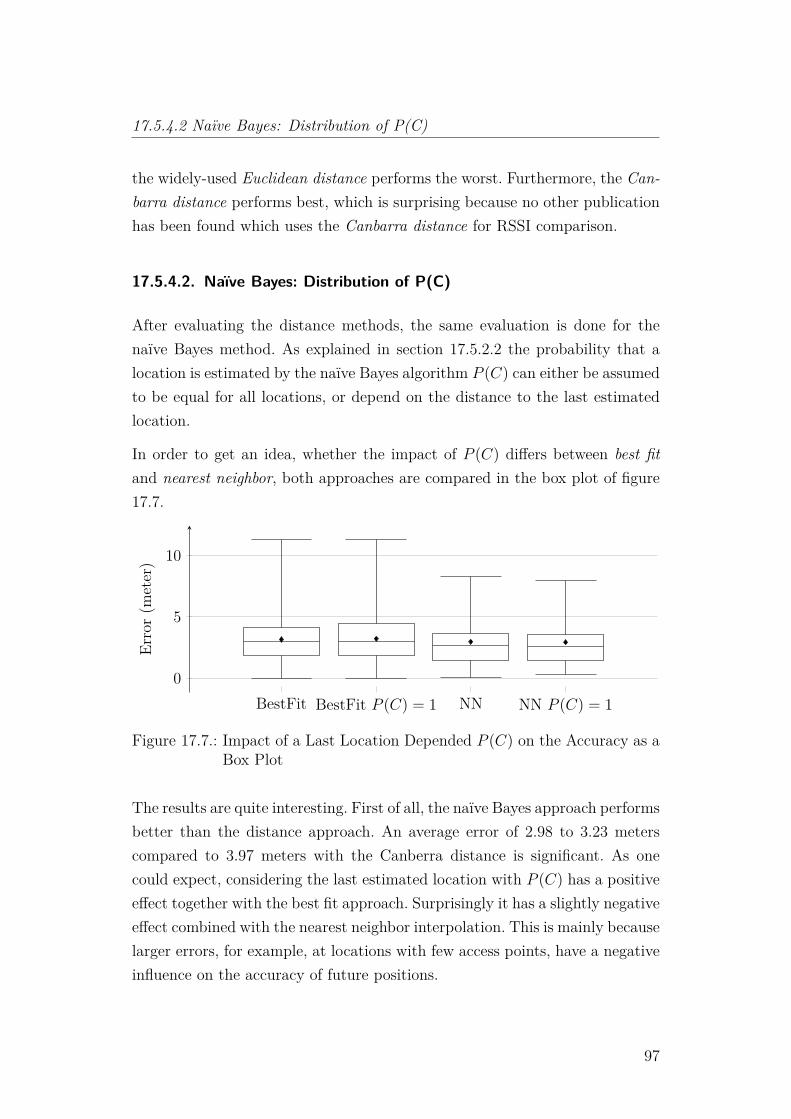
17.5.4.2 Naïve Bayes: Distribution of P(C)
the widely-used Euclidean distance performs the worst. Furthermore, the Can-barra distance performs best, which is surprising because no other publicationhas been found which uses the Canbarra distance for RSSI comparison.
17.5.4.2. Naïve Bayes: Distribution of P(C)
After evaluating the distance methods, the same evaluation is done for thenaïve Bayes method. As explained in section 17.5.2.2 the probability that alocation is estimated by the naïve Bayes algorithm P (C) can either be assumedto be equal for all locations, or depend on the distance to the last estimatedlocation.
In order to get an idea, whether the impact of P (C) differs between best fitand nearest neighbor, both approaches are compared in the box plot of figure17.7.
BestFit BestFit P (C) = 1 NN NN P (C) = 10
5
10
Error(m
eter)
Figure 17.7.: Impact of a Last Location Depended P (C) on the Accuracy as aBox Plot
The results are quite interesting. First of all, the naïve Bayes approach performsbetter than the distance approach. An average error of 2.98 to 3.23 meterscompared to 3.97 meters with the Canberra distance is significant. As onecould expect, considering the last estimated location with P (C) has a positiveeffect together with the best fit approach. Surprisingly it has a slightly negativeeffect combined with the nearest neighbor interpolation. This is mainly becauselarger errors, for example, at locations with few access points, have a negativeinfluence on the accuracy of future positions.
97
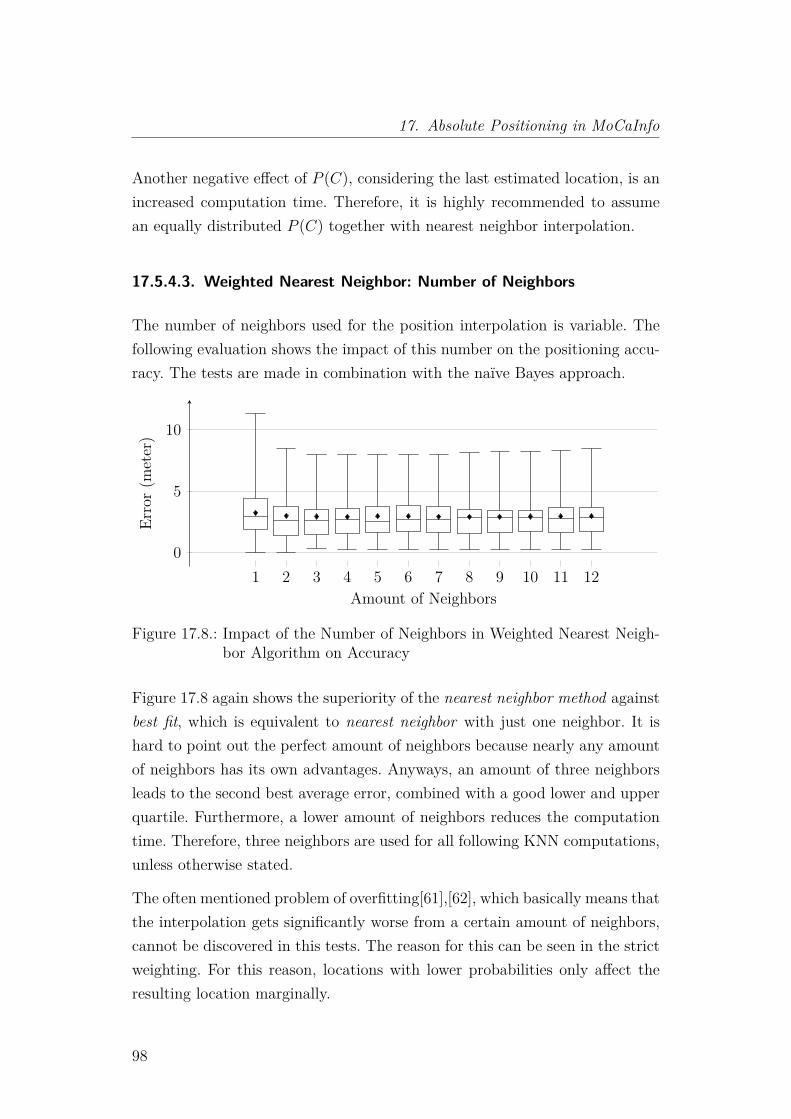
17. Absolute Positioning in MoCaInfo
Another negative effect of P (C), considering the last estimated location, is anincreased computation time. Therefore, it is highly recommended to assumean equally distributed P (C) together with nearest neighbor interpolation.
17.5.4.3. Weighted Nearest Neighbor: Number of Neighbors
The number of neighbors used for the position interpolation is variable. Thefollowing evaluation shows the impact of this number on the positioning accu-racy. The tests are made in combination with the naïve Bayes approach.
1 2 3 4 5 6 7 8 9 10 11 120
5
10
Amount of Neighbors
Error(m
eter)
Figure 17.8.: Impact of the Number of Neighbors in Weighted Nearest Neigh-bor Algorithm on Accuracy
Figure 17.8 again shows the superiority of the nearest neighbor method againstbest fit, which is equivalent to nearest neighbor with just one neighbor. It ishard to point out the perfect amount of neighbors because nearly any amountof neighbors has its own advantages. Anyways, an amount of three neighborsleads to the second best average error, combined with a good lower and upperquartile. Furthermore, a lower amount of neighbors reduces the computationtime. Therefore, three neighbors are used for all following KNN computations,unless otherwise stated.
The often mentioned problem of overfitting[61],[62], which basically means thatthe interpolation gets significantly worse from a certain amount of neighbors,cannot be discovered in this tests. The reason for this can be seen in the strictweighting. For this reason, locations with lower probabilities only affect theresulting location marginally.
98
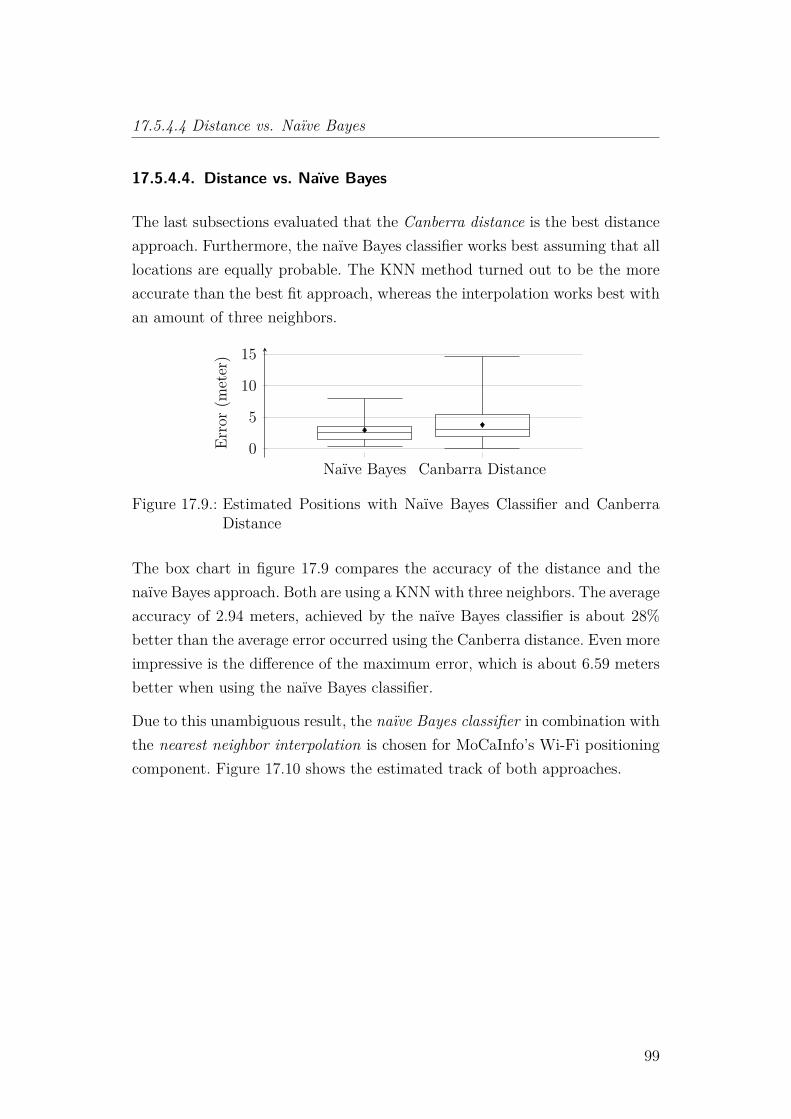
17.5.4.4 Distance vs. Naïve Bayes
17.5.4.4. Distance vs. Naïve Bayes
The last subsections evaluated that the Canberra distance is the best distanceapproach. Furthermore, the naïve Bayes classifier works best assuming that alllocations are equally probable. The KNN method turned out to be the moreaccurate than the best fit approach, whereas the interpolation works best withan amount of three neighbors.
Naïve Bayes Canbarra Distance0
5
10
15
Error(m
eter)
Figure 17.9.: Estimated Positions with Naïve Bayes Classifier and CanberraDistance
The box chart in figure 17.9 compares the accuracy of the distance and thenaïve Bayes approach. Both are using a KNN with three neighbors. The averageaccuracy of 2.94 meters, achieved by the naïve Bayes classifier is about 28%better than the average error occurred using the Canberra distance. Even moreimpressive is the difference of the maximum error, which is about 6.59 metersbetter when using the naïve Bayes classifier.
Due to this unambiguous result, the naïve Bayes classifier in combination withthe nearest neighbor interpolation is chosen for MoCaInfo’s Wi-Fi positioningcomponent. Figure 17.10 shows the estimated track of both approaches.
99
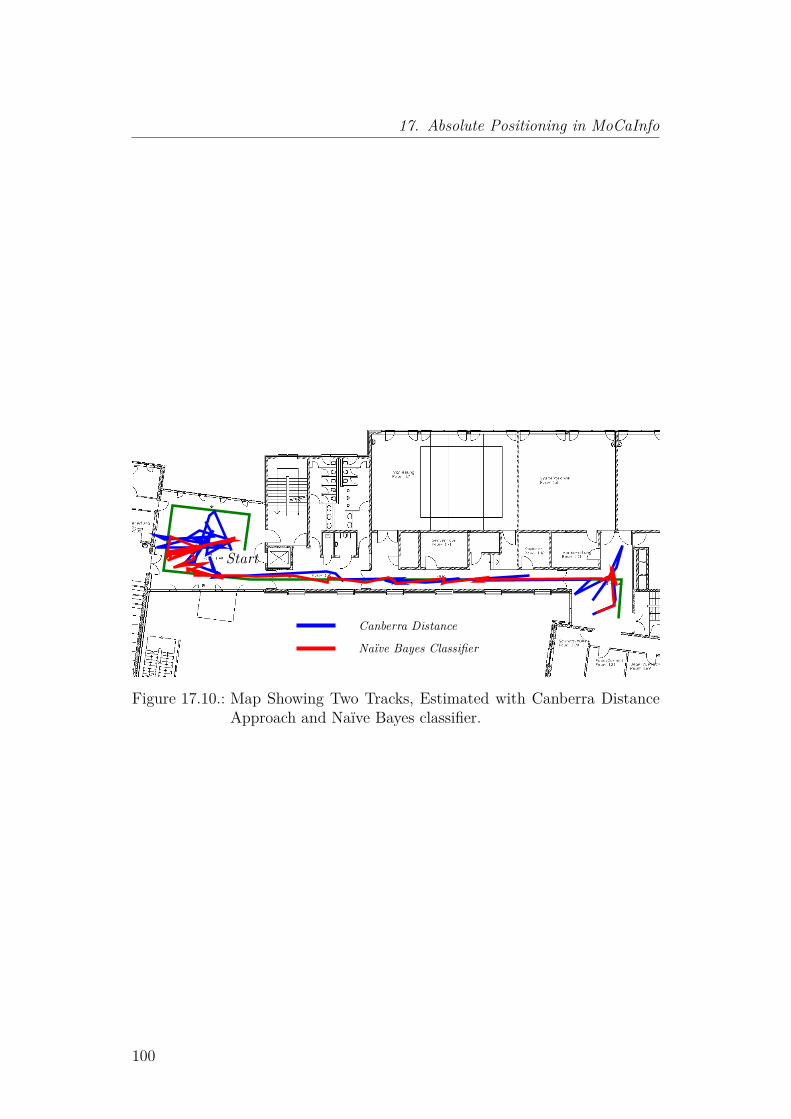
17. Absolute Positioning in MoCaInfo
Start
Naïve Bayes Classifier
Canberra Distance
Figure 17.10.: Map Showing Two Tracks, Estimated with Canberra DistanceApproach and Naïve Bayes classifier.
100
18. Relative Positioning in MoCaInfo
The following sections describe the relative positioning system developed forMoCaInfo. In order to achieve a pedestrian relative positioning system, stepshave to be detected, which is explained in the section 18.1. The subsequentsection describes different approaches to implement a compass, using a smartphone’s sensors. This is needed in order to determine the walking direction.
18.1. Step Detection
In order to achieve an accurate dead reckoning system, the location softwarehas to notice, whether a user is moving or not. For pedestrians this means,it has to be recognized whether the pedestrian is walking or not. Commonlyused accelerometer-based approaches to detect steps use sensors, placed at thepedestrian’s foot[63], [64]. With those foot-mounted sensors, it is even possibleto detect the roll of the foot while walking. Kim et al.[63] developed a precisesystem, based on this data with a 100% accuracy in step detection and anerror of less than 5% in step stride determination.
The approach of roll-over detection cannot be used in MoCaInfo’s positioningsystem because it has to be independent of any external sensors except thebuilt-in smart phone sensors. Ying et al. had a similar requirement since theyused accelerometers of medical implants to detect steps. They implementedand compared three different algorithms for step detection. The first one isthe Pan-Tompkins method, a real-time algorithm usually used for peak detec-tion in ECG signals. Secondly, they tried to recognize steps, with a templatematching approach, assuming that the signal of a step can be determined bycomparing it with sample signals of steps. The last algorithm is a simple peakdetection algorithm. They recommend peak detection because it is as accu-rate as the Pan-Tompkins method but has less computational cost. Template
101
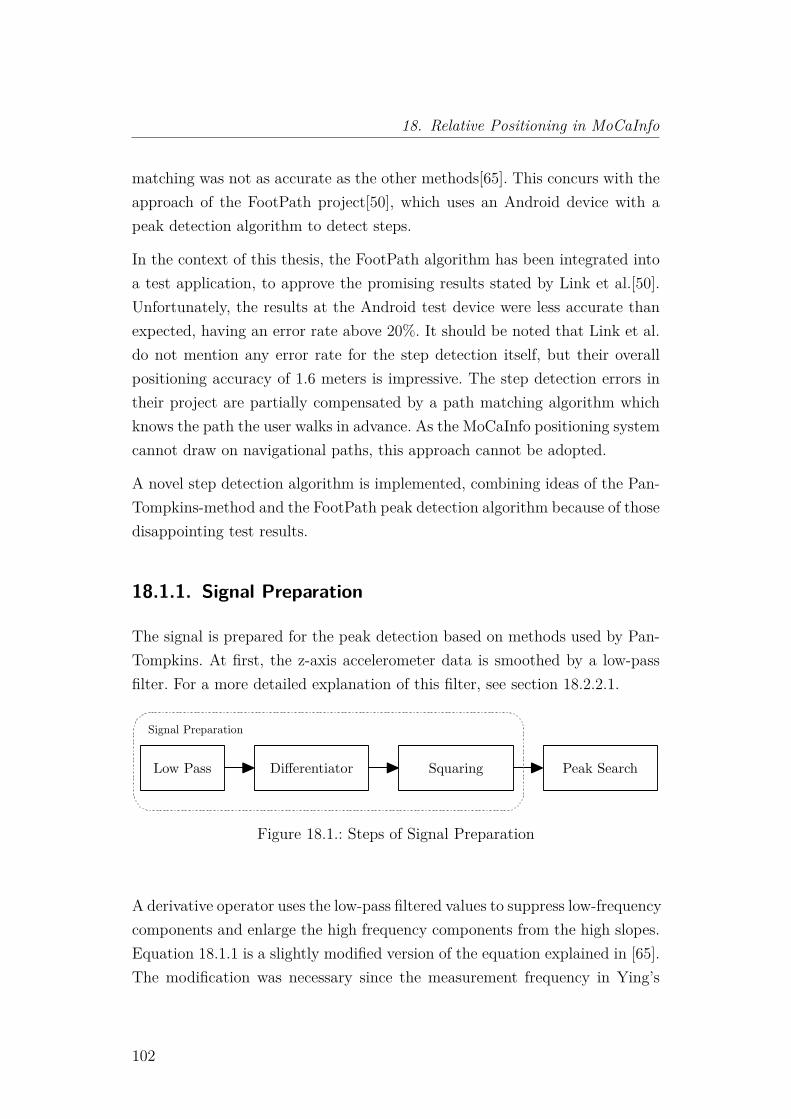
18. Relative Positioning in MoCaInfo
matching was not as accurate as the other methods[65]. This concurs with theapproach of the FootPath project[50], which uses an Android device with apeak detection algorithm to detect steps.
In the context of this thesis, the FootPath algorithm has been integrated intoa test application, to approve the promising results stated by Link et al.[50].Unfortunately, the results at the Android test device were less accurate thanexpected, having an error rate above 20%. It should be noted that Link et al.do not mention any error rate for the step detection itself, but their overallpositioning accuracy of 1.6 meters is impressive. The step detection errors intheir project are partially compensated by a path matching algorithm whichknows the path the user walks in advance. As the MoCaInfo positioning systemcannot draw on navigational paths, this approach cannot be adopted.
A novel step detection algorithm is implemented, combining ideas of the Pan-Tompkins-method and the FootPath peak detection algorithm because of thosedisappointing test results.
18.1.1. Signal Preparation
The signal is prepared for the peak detection based on methods used by Pan-Tompkins. At first, the z-axis accelerometer data is smoothed by a low-passfilter. For a more detailed explanation of this filter, see section 18.2.2.1.
Low Pass Differentiator Squaring Peak Search
Signal Preparation
Figure 18.1.: Steps of Signal Preparation
A derivative operator uses the low-pass filtered values to suppress low-frequencycomponents and enlarge the high frequency components from the high slopes.Equation 18.1.1 is a slightly modified version of the equation explained in [65].The modification was necessary since the measurement frequency in Ying’s
102
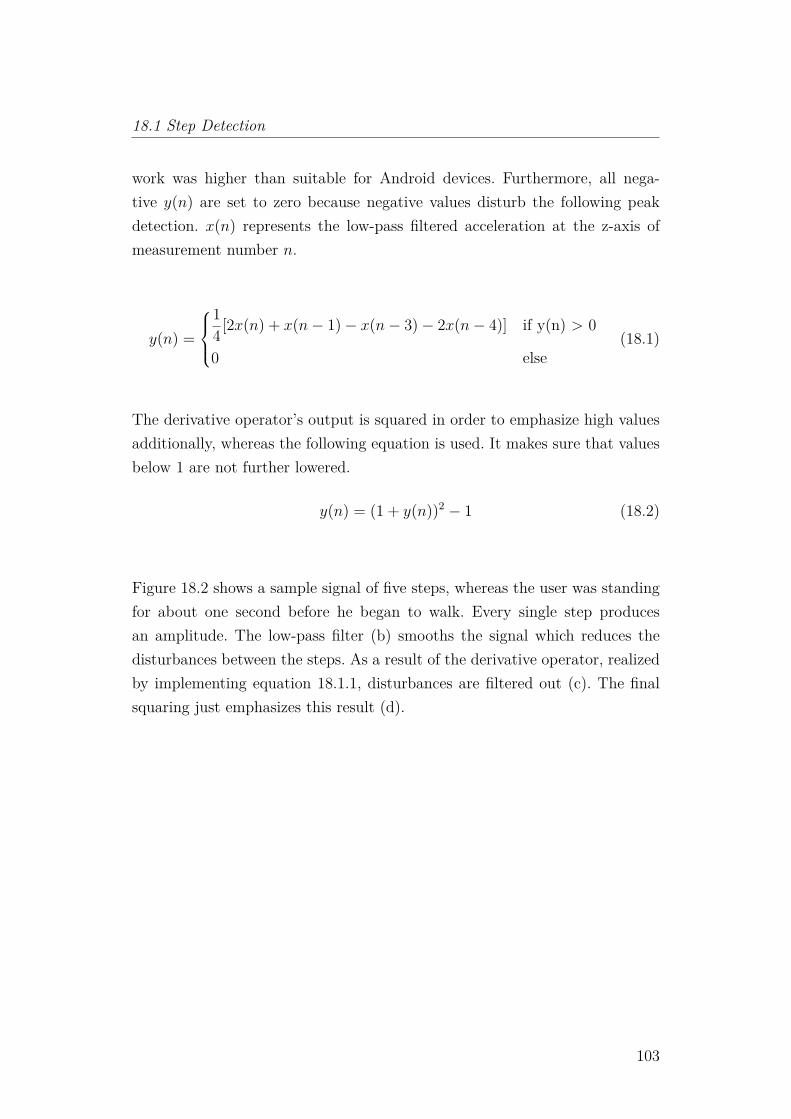
18.1 Step Detection
work was higher than suitable for Android devices. Furthermore, all nega-tive y(n) are set to zero because negative values disturb the following peakdetection. x(n) represents the low-pass filtered acceleration at the z-axis ofmeasurement number n.
y(n) =
14[2x(n) + x(n− 1)− x(n− 3)− 2x(n− 4)] if y(n) > 0
0 else(18.1)
The derivative operator’s output is squared in order to emphasize high valuesadditionally, whereas the following equation is used. It makes sure that valuesbelow 1 are not further lowered.
y(n) = (1 + y(n))2 − 1 (18.2)
Figure 18.2 shows a sample signal of five steps, whereas the user was standingfor about one second before he began to walk. Every single step producesan amplitude. The low-pass filter (b) smooths the signal which reduces thedisturbances between the steps. As a result of the derivative operator, realizedby implementing equation 18.1.1, disturbances are filtered out (c). The finalsquaring just emphasizes this result (d).
103
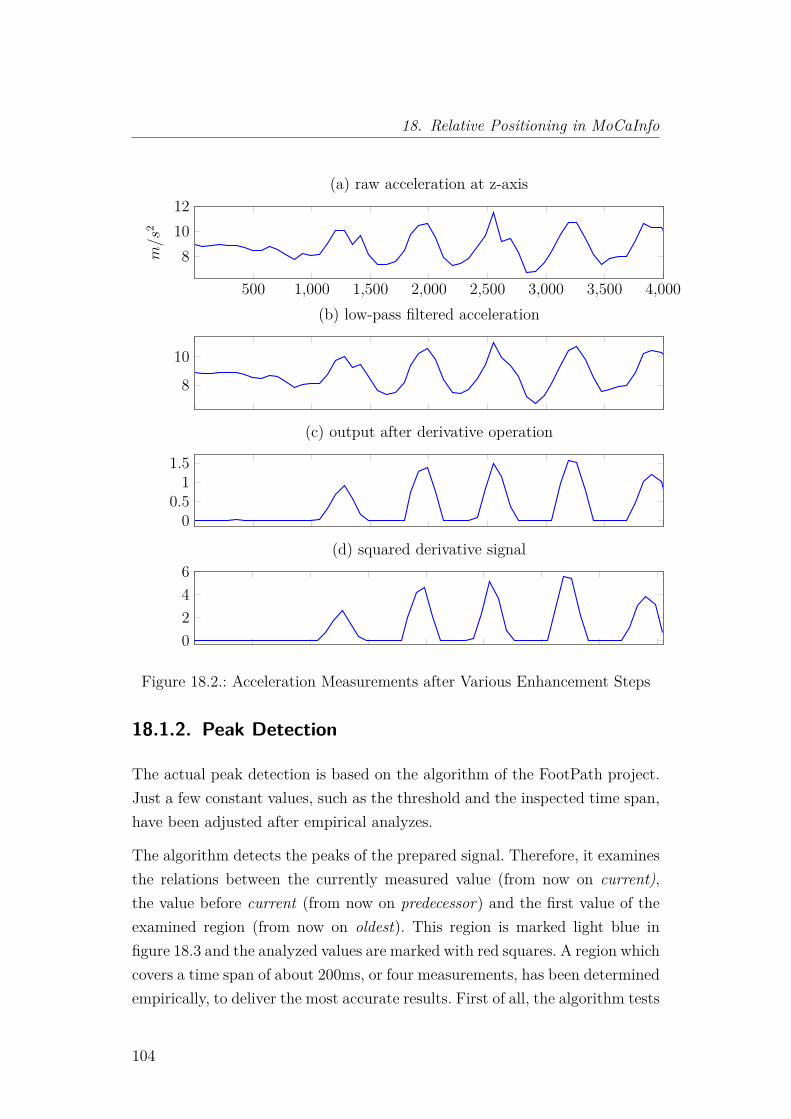
18. Relative Positioning in MoCaInfo
500 1,000 1,500 2,000 2,500 3,000 3,500 4,000
81012
m/s
2
(a) raw acceleration at z-axis
8
10
m/s
2
(b) low-pass filtered acceleration
00.5
11.5
m/s
2
(c) output after derivative operation
0246
m/s
2
(d) squared derivative signal
Figure 18.2.: Acceleration Measurements after Various Enhancement Steps
18.1.2. Peak Detection
The actual peak detection is based on the algorithm of the FootPath project.Just a few constant values, such as the threshold and the inspected time span,have been adjusted after empirical analyzes.
The algorithm detects the peaks of the prepared signal. Therefore, it examinesthe relations between the currently measured value (from now on current),the value before current (from now on predecessor) and the first value of theexamined region (from now on oldest). This region is marked light blue infigure 18.3 and the analyzed values are marked with red squares. A region whichcovers a time span of about 200ms, or four measurements, has been determinedempirically, to deliver the most accurate results. First of all, the algorithm tests
104
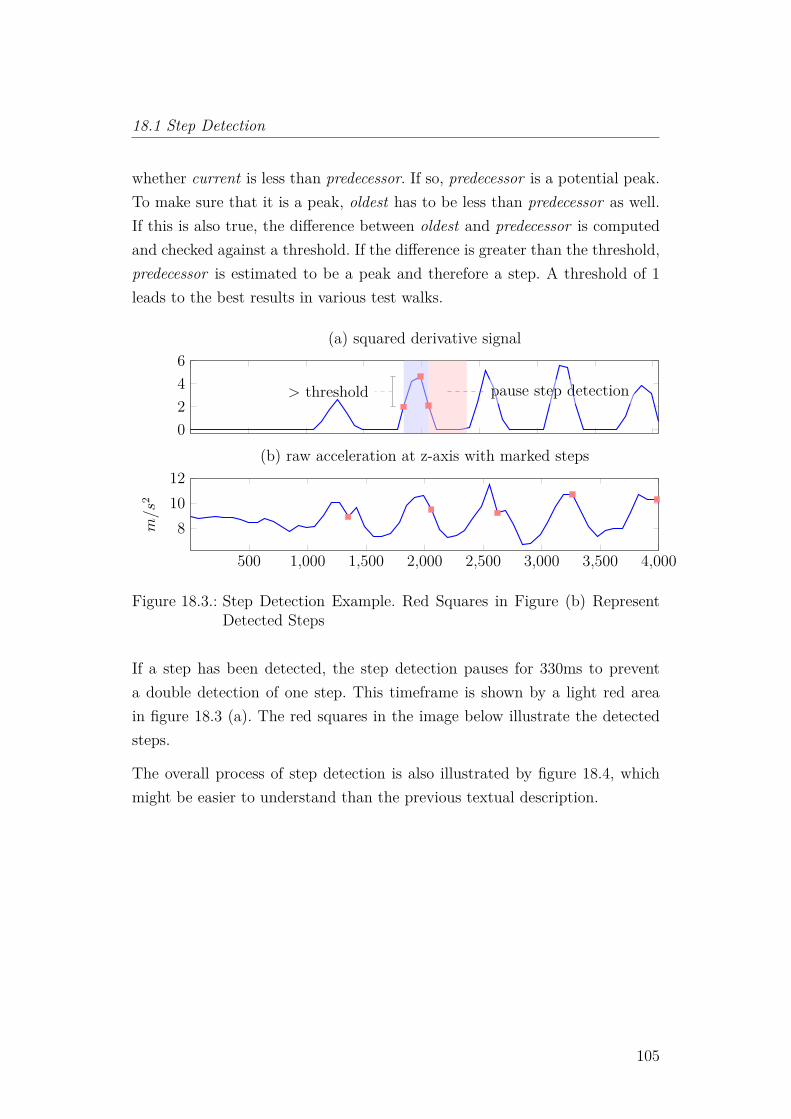
18.1 Step Detection
whether current is less than predecessor. If so, predecessor is a potential peak.To make sure that it is a peak, oldest has to be less than predecessor as well.If this is also true, the difference between oldest and predecessor is computedand checked against a threshold. If the difference is greater than the threshold,predecessor is estimated to be a peak and therefore a step. A threshold of 1leads to the best results in various test walks.
0246
> threshold pause step detectionpause step detection
m/s
2
(a) squared derivative signal
500 1,000 1,500 2,000 2,500 3,000 3,500 4,000
81012
m/s
2
(b) raw acceleration at z-axis with marked steps
Figure 18.3.: Step Detection Example. Red Squares in Figure (b) RepresentDetected Steps
If a step has been detected, the step detection pauses for 330ms to preventa double detection of one step. This timeframe is shown by a light red areain figure 18.3 (a). The red squares in the image below illustrate the detectedsteps.
The overall process of step detection is also illustrated by figure 18.4, whichmight be easier to understand than the previous textual description.
105
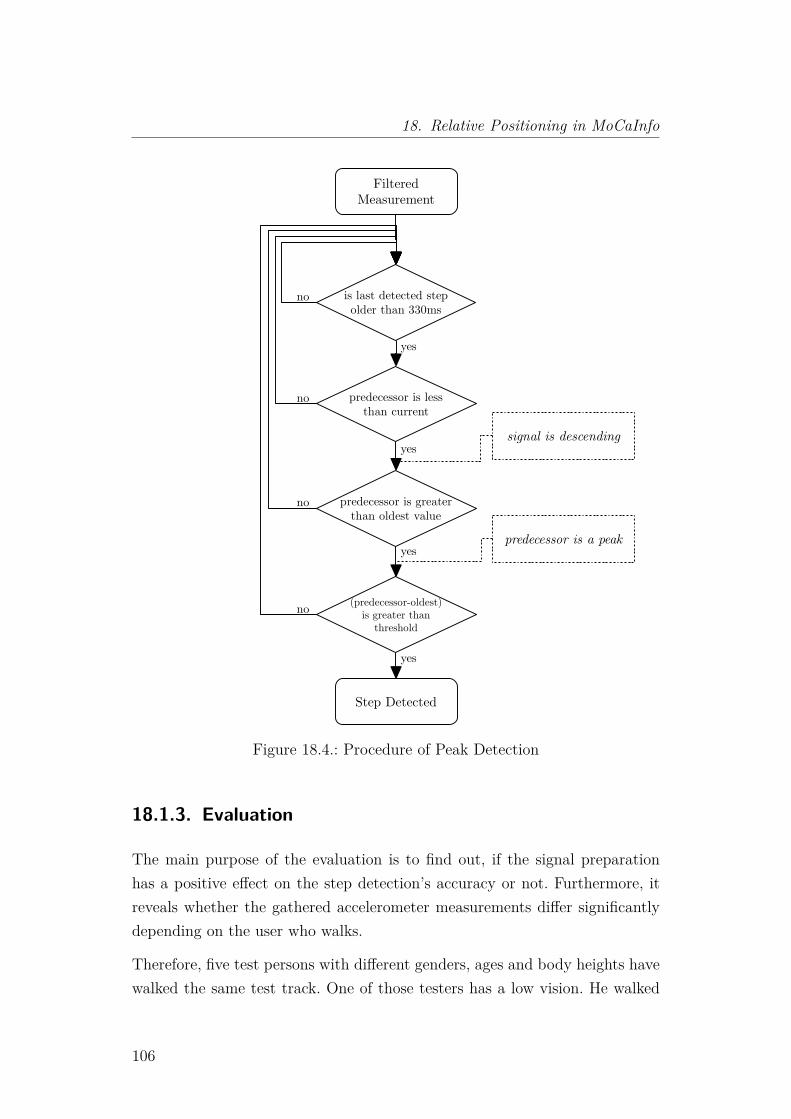
18. Relative Positioning in MoCaInfo
predecessor is lessthan current
predecessor is greaterthan oldest value
(predecessor-oldest)is greater than
threshold
yessignal is descending
predecessor is a peak
is last detected stepolder than 330ms
yes
yes
no
no
no
yes
no
Step Detected
FilteredMeasurement
Figure 18.4.: Procedure of Peak Detection
18.1.3. Evaluation
The main purpose of the evaluation is to find out, if the signal preparationhas a positive effect on the step detection’s accuracy or not. Furthermore, itreveals whether the gathered accelerometer measurements differ significantlydepending on the user who walks.
Therefore, five test persons with different genders, ages and body heights havewalked the same test track. One of those testers has a low vision. He walked
106
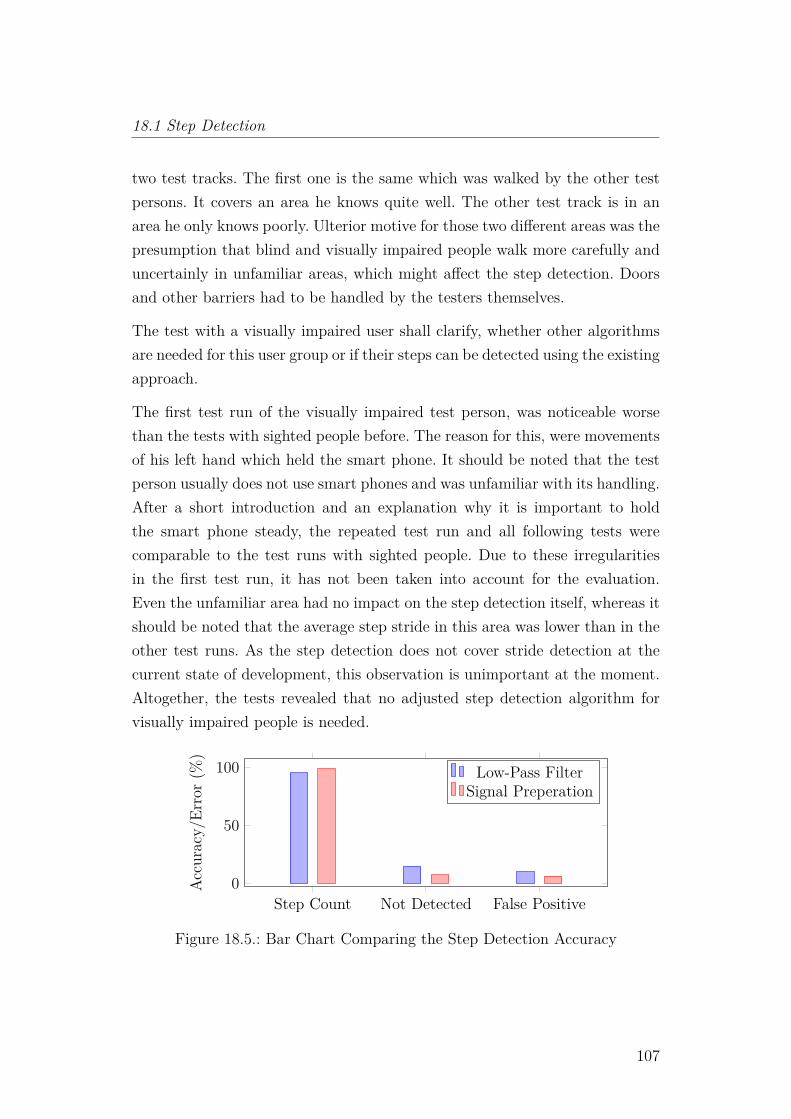
18.1 Step Detection
two test tracks. The first one is the same which was walked by the other testpersons. It covers an area he knows quite well. The other test track is in anarea he only knows poorly. Ulterior motive for those two different areas was thepresumption that blind and visually impaired people walk more carefully anduncertainly in unfamiliar areas, which might affect the step detection. Doorsand other barriers had to be handled by the testers themselves.
The test with a visually impaired user shall clarify, whether other algorithmsare needed for this user group or if their steps can be detected using the existingapproach.
The first test run of the visually impaired test person, was noticeable worsethan the tests with sighted people before. The reason for this, were movementsof his left hand which held the smart phone. It should be noted that the testperson usually does not use smart phones and was unfamiliar with its handling.After a short introduction and an explanation why it is important to holdthe smart phone steady, the repeated test run and all following tests werecomparable to the test runs with sighted people. Due to these irregularitiesin the first test run, it has not been taken into account for the evaluation.Even the unfamiliar area had no impact on the step detection itself, whereas itshould be noted that the average step stride in this area was lower than in theother test runs. As the step detection does not cover stride detection at thecurrent state of development, this observation is unimportant at the moment.Altogether, the tests revealed that no adjusted step detection algorithm forvisually impaired people is needed.
Step Count Not Detected False Positive0
50
100
Accuracy/
Error(%
)
Low-Pass FilterSignal Preperation
Figure 18.5.: Bar Chart Comparing the Step Detection Accuracy
107
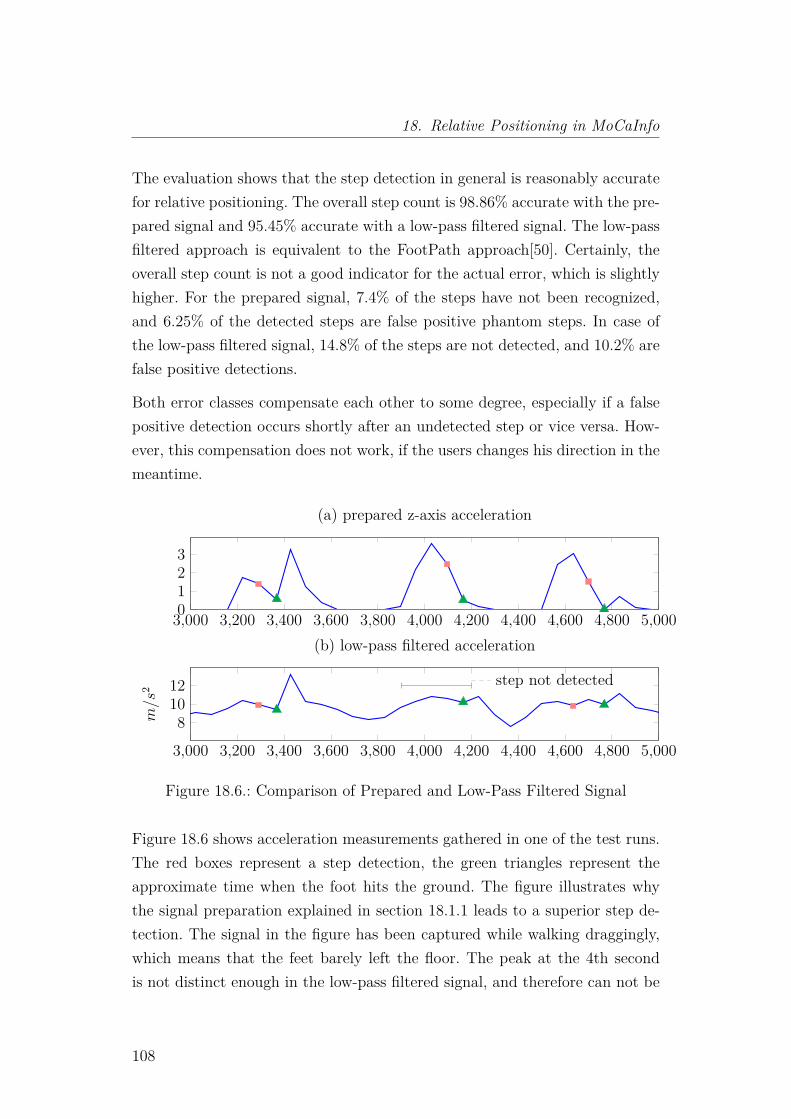
18. Relative Positioning in MoCaInfo
The evaluation shows that the step detection in general is reasonably accuratefor relative positioning. The overall step count is 98.86% accurate with the pre-pared signal and 95.45% accurate with a low-pass filtered signal. The low-passfiltered approach is equivalent to the FootPath approach[50]. Certainly, theoverall step count is not a good indicator for the actual error, which is slightlyhigher. For the prepared signal, 7.4% of the steps have not been recognized,and 6.25% of the detected steps are false positive phantom steps. In case ofthe low-pass filtered signal, 14.8% of the steps are not detected, and 10.2% arefalse positive detections.
Both error classes compensate each other to some degree, especially if a falsepositive detection occurs shortly after an undetected step or vice versa. How-ever, this compensation does not work, if the users changes his direction in themeantime.
3,000 3,200 3,400 3,600 3,800 4,000 4,200 4,400 4,600 4,800 5,0000123
(a) prepared z-axis acceleration
3,000 3,200 3,400 3,600 3,800 4,000 4,200 4,400 4,600 4,800 5,000
81012 step not detected
m/s
2
(b) low-pass filtered acceleration
Figure 18.6.: Comparison of Prepared and Low-Pass Filtered Signal
Figure 18.6 shows acceleration measurements gathered in one of the test runs.The red boxes represent a step detection, the green triangles represent theapproximate time when the foot hits the ground. The figure illustrates whythe signal preparation explained in section 18.1.1 leads to a superior step de-tection. The signal in the figure has been captured while walking draggingly,which means that the feet barely left the floor. The peak at the 4th secondis not distinct enough in the low-pass filtered signal, and therefore can not be
108
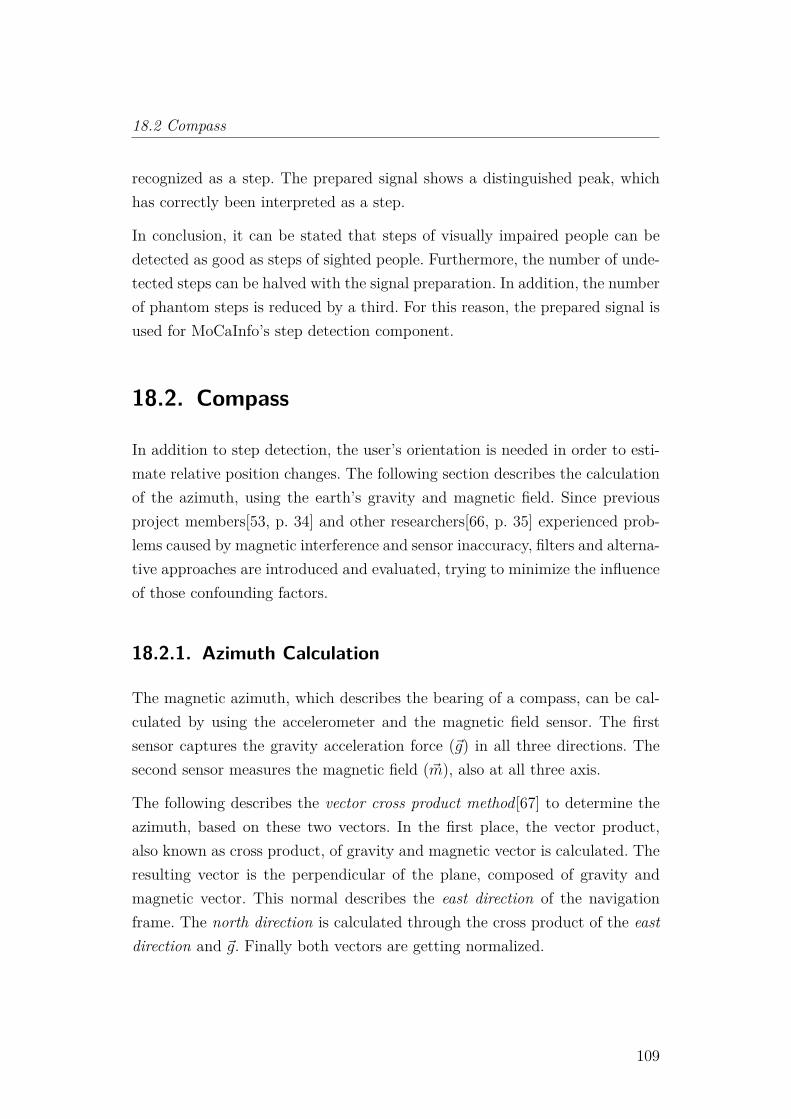
18.2 Compass
recognized as a step. The prepared signal shows a distinguished peak, whichhas correctly been interpreted as a step.
In conclusion, it can be stated that steps of visually impaired people can bedetected as good as steps of sighted people. Furthermore, the number of unde-tected steps can be halved with the signal preparation. In addition, the numberof phantom steps is reduced by a third. For this reason, the prepared signal isused for MoCaInfo’s step detection component.
18.2. Compass
In addition to step detection, the user’s orientation is needed in order to esti-mate relative position changes. The following section describes the calculationof the azimuth, using the earth’s gravity and magnetic field. Since previousproject members[53, p. 34] and other researchers[66, p. 35] experienced prob-lems caused by magnetic interference and sensor inaccuracy, filters and alterna-tive approaches are introduced and evaluated, trying to minimize the influenceof those confounding factors.
18.2.1. Azimuth Calculation
The magnetic azimuth, which describes the bearing of a compass, can be cal-culated by using the accelerometer and the magnetic field sensor. The firstsensor captures the gravity acceleration force (~g) in all three directions. Thesecond sensor measures the magnetic field (~m), also at all three axis.
The following describes the vector cross product method[67] to determine theazimuth, based on these two vectors. In the first place, the vector product,also known as cross product, of gravity and magnetic vector is calculated. Theresulting vector is the perpendicular of the plane, composed of gravity andmagnetic vector. This normal describes the east direction of the navigationframe. The north direction is calculated through the cross product of the eastdirection and ~g. Finally both vectors are getting normalized.
109
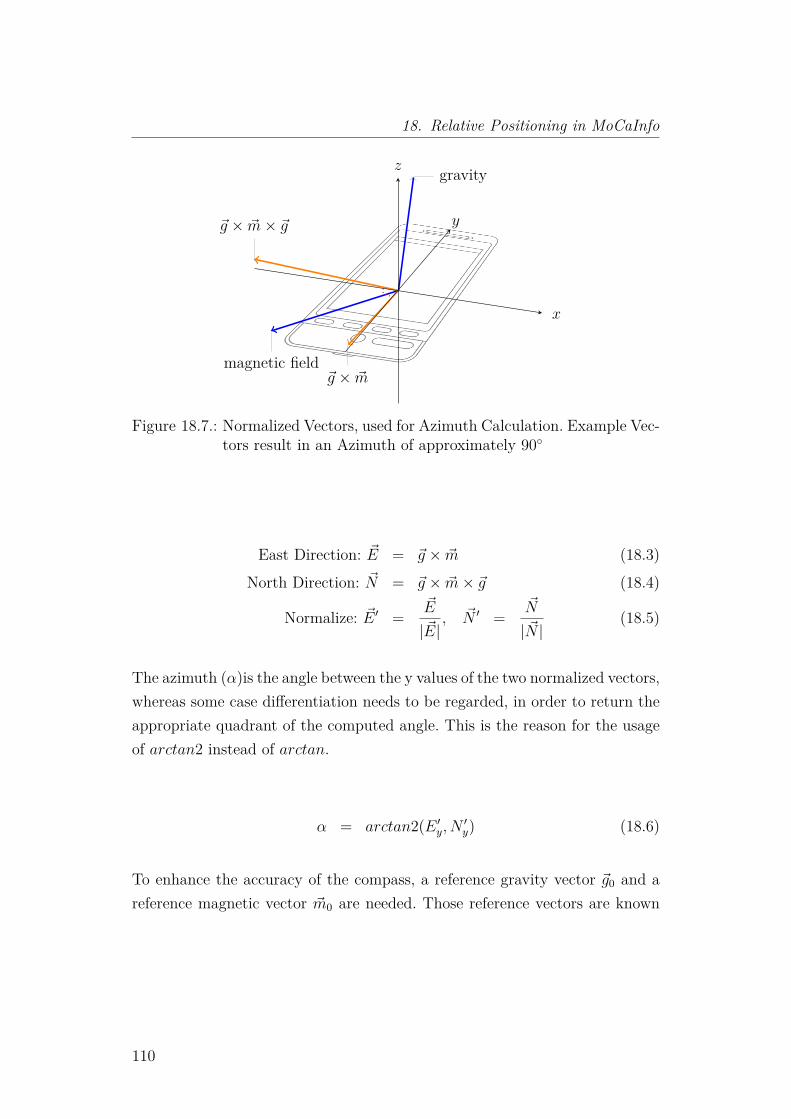
18. Relative Positioning in MoCaInfo
gravity
magnetic field~g × ~m
~g × ~m× ~g
x
y
z
Figure 18.7.: Normalized Vectors, used for Azimuth Calculation. Example Vec-tors result in an Azimuth of approximately 90◦
East Direction: ~E = ~g × ~m (18.3)North Direction: ~N = ~g × ~m× ~g (18.4)
Normalize: ~E ′ =~E
| ~E|, ~N ′ =
~N
| ~N |(18.5)
The azimuth (α)is the angle between the y values of the two normalized vectors,whereas some case differentiation needs to be regarded, in order to return theappropriate quadrant of the computed angle. This is the reason for the usageof arctan2 instead of arctan.
α = arctan2(E ′y, N ′y) (18.6)
To enhance the accuracy of the compass, a reference gravity vector ~g0 and areference magnetic vector ~m0 are needed. Those reference vectors are known
110
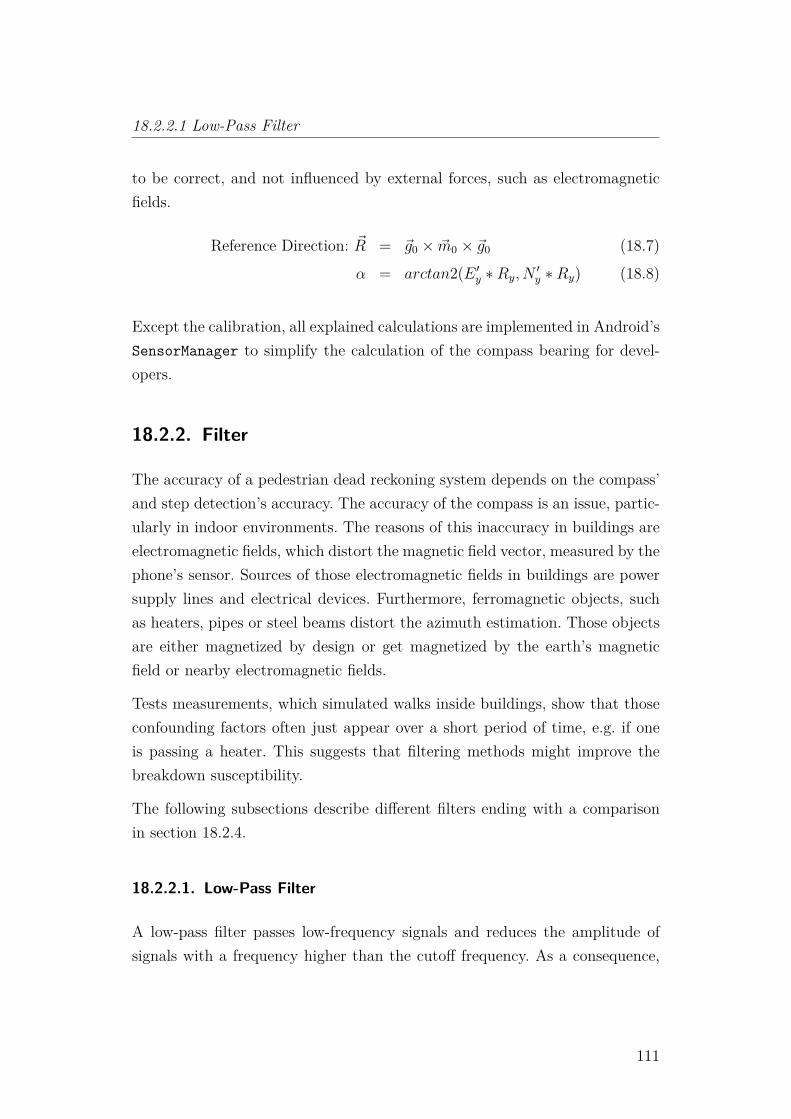
18.2.2.1 Low-Pass Filter
to be correct, and not influenced by external forces, such as electromagneticfields.
Reference Direction: ~R = ~g0 × ~m0 × ~g0 (18.7)α = arctan2(E ′y ∗Ry, N
′y ∗Ry) (18.8)
Except the calibration, all explained calculations are implemented in Android’sSensorManager to simplify the calculation of the compass bearing for devel-opers.
18.2.2. Filter
The accuracy of a pedestrian dead reckoning system depends on the compass’and step detection’s accuracy. The accuracy of the compass is an issue, partic-ularly in indoor environments. The reasons of this inaccuracy in buildings areelectromagnetic fields, which distort the magnetic field vector, measured by thephone’s sensor. Sources of those electromagnetic fields in buildings are powersupply lines and electrical devices. Furthermore, ferromagnetic objects, suchas heaters, pipes or steel beams distort the azimuth estimation. Those objectsare either magnetized by design or get magnetized by the earth’s magneticfield or nearby electromagnetic fields.
Tests measurements, which simulated walks inside buildings, show that thoseconfounding factors often just appear over a short period of time, e.g. if oneis passing a heater. This suggests that filtering methods might improve thebreakdown susceptibility.
The following subsections describe different filters ending with a comparisonin section 18.2.4.
18.2.2.1. Low-Pass Filter
A low-pass filter passes low-frequency signals and reduces the amplitude ofsignals with a frequency higher than the cutoff frequency. As a consequence,
111
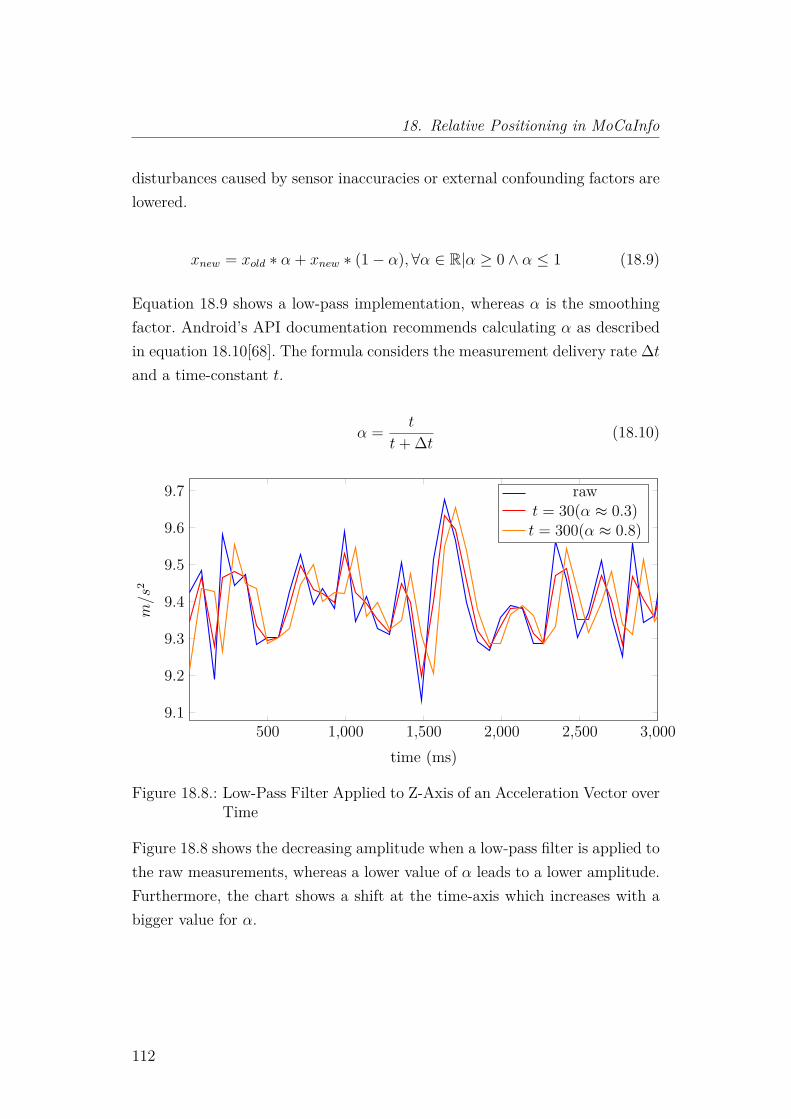
18. Relative Positioning in MoCaInfo
disturbances caused by sensor inaccuracies or external confounding factors arelowered.
xnew = xold ∗ α + xnew ∗ (1− α),∀α ∈ R|α ≥ 0 ∧ α ≤ 1 (18.9)
Equation 18.9 shows a low-pass implementation, whereas α is the smoothingfactor. Android’s API documentation recommends calculating α as describedin equation 18.10[68]. The formula considers the measurement delivery rate ∆tand a time-constant t.
α = t
t+ ∆t (18.10)
500 1,000 1,500 2,000 2,500 3,0009.1
9.2
9.3
9.4
9.5
9.6
9.7
time (ms)
m/s
2
rawt = 30(α ≈ 0.3)t = 300(α ≈ 0.8)
Figure 18.8.: Low-Pass Filter Applied to Z-Axis of an Acceleration Vector overTime
Figure 18.8 shows the decreasing amplitude when a low-pass filter is applied tothe raw measurements, whereas a lower value of α leads to a lower amplitude.Furthermore, the chart shows a shift at the time-axis which increases with abigger value for α.
112
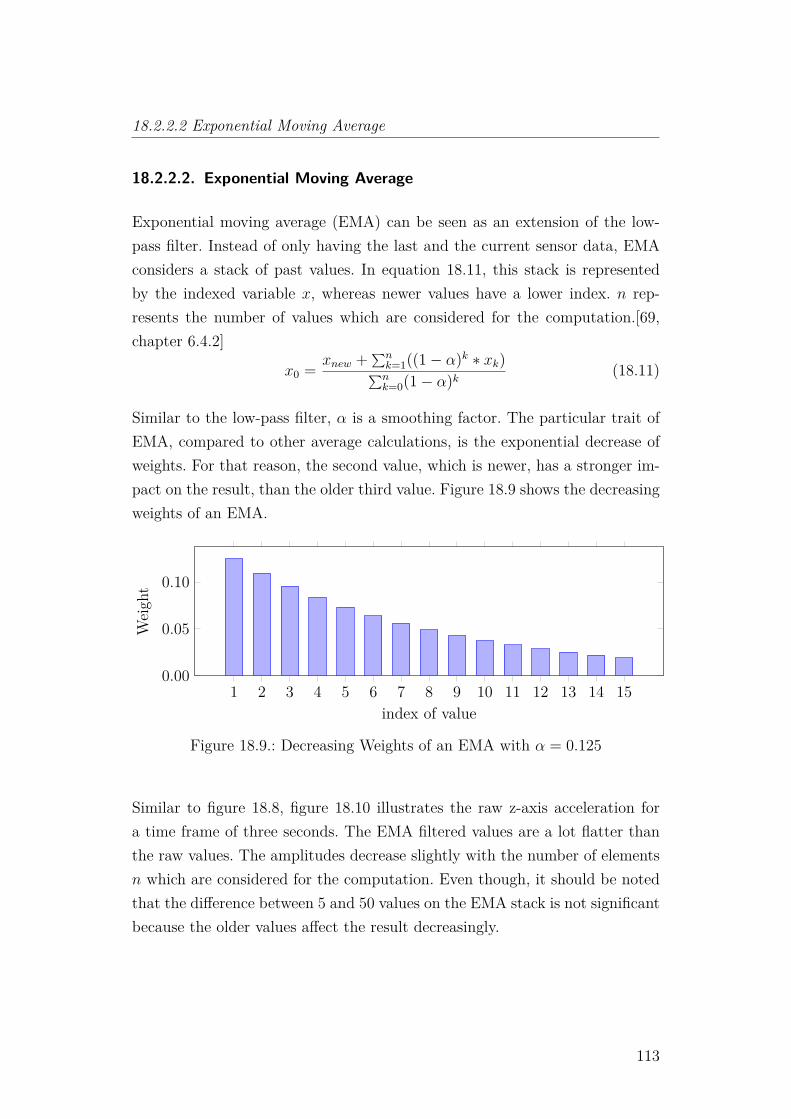
18.2.2.2 Exponential Moving Average
18.2.2.2. Exponential Moving Average
Exponential moving average (EMA) can be seen as an extension of the low-pass filter. Instead of only having the last and the current sensor data, EMAconsiders a stack of past values. In equation 18.11, this stack is representedby the indexed variable x, whereas newer values have a lower index. n rep-resents the number of values which are considered for the computation.[69,chapter 6.4.2]
x0 = xnew +∑nk=1((1− α)k ∗ xk)∑nk=0(1− α)k (18.11)
Similar to the low-pass filter, α is a smoothing factor. The particular trait ofEMA, compared to other average calculations, is the exponential decrease ofweights. For that reason, the second value, which is newer, has a stronger im-pact on the result, than the older third value. Figure 18.9 shows the decreasingweights of an EMA.
1 2 3 4 5 6 7 8 9 10 11 12 13 14 150.00
0.05
0.10
index of value
Weigh
t
Figure 18.9.: Decreasing Weights of an EMA with α = 0.125
Similar to figure 18.8, figure 18.10 illustrates the raw z-axis acceleration fora time frame of three seconds. The EMA filtered values are a lot flatter thanthe raw values. The amplitudes decrease slightly with the number of elementsn which are considered for the computation. Even though, it should be notedthat the difference between 5 and 50 values on the EMA stack is not significantbecause the older values affect the result decreasingly.
113
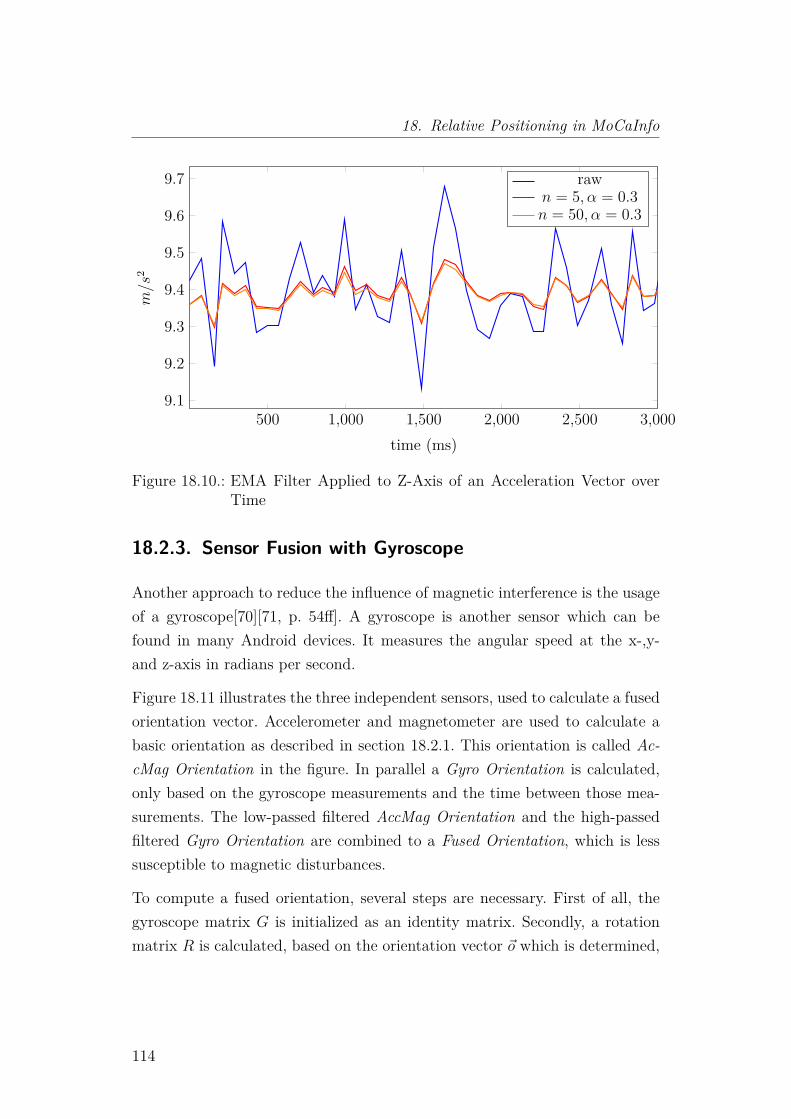
18. Relative Positioning in MoCaInfo
500 1,000 1,500 2,000 2,500 3,0009.1
9.2
9.3
9.4
9.5
9.6
9.7
time (ms)
m/s
2
rawn = 5, α = 0.3n = 50, α = 0.3
Figure 18.10.: EMA Filter Applied to Z-Axis of an Acceleration Vector overTime
18.2.3. Sensor Fusion with Gyroscope
Another approach to reduce the influence of magnetic interference is the usageof a gyroscope[70][71, p. 54ff]. A gyroscope is another sensor which can befound in many Android devices. It measures the angular speed at the x-,y-and z-axis in radians per second.
Figure 18.11 illustrates the three independent sensors, used to calculate a fusedorientation vector. Accelerometer and magnetometer are used to calculate abasic orientation as described in section 18.2.1. This orientation is called Ac-cMag Orientation in the figure. In parallel a Gyro Orientation is calculated,only based on the gyroscope measurements and the time between those mea-surements. The low-passed filtered AccMag Orientation and the high-passedfiltered Gyro Orientation are combined to a Fused Orientation, which is lesssusceptible to magnetic disturbances.
To compute a fused orientation, several steps are necessary. First of all, thegyroscope matrix G is initialized as an identity matrix. Secondly, a rotationmatrix R is calculated, based on the orientation vector ~o which is determined,
114
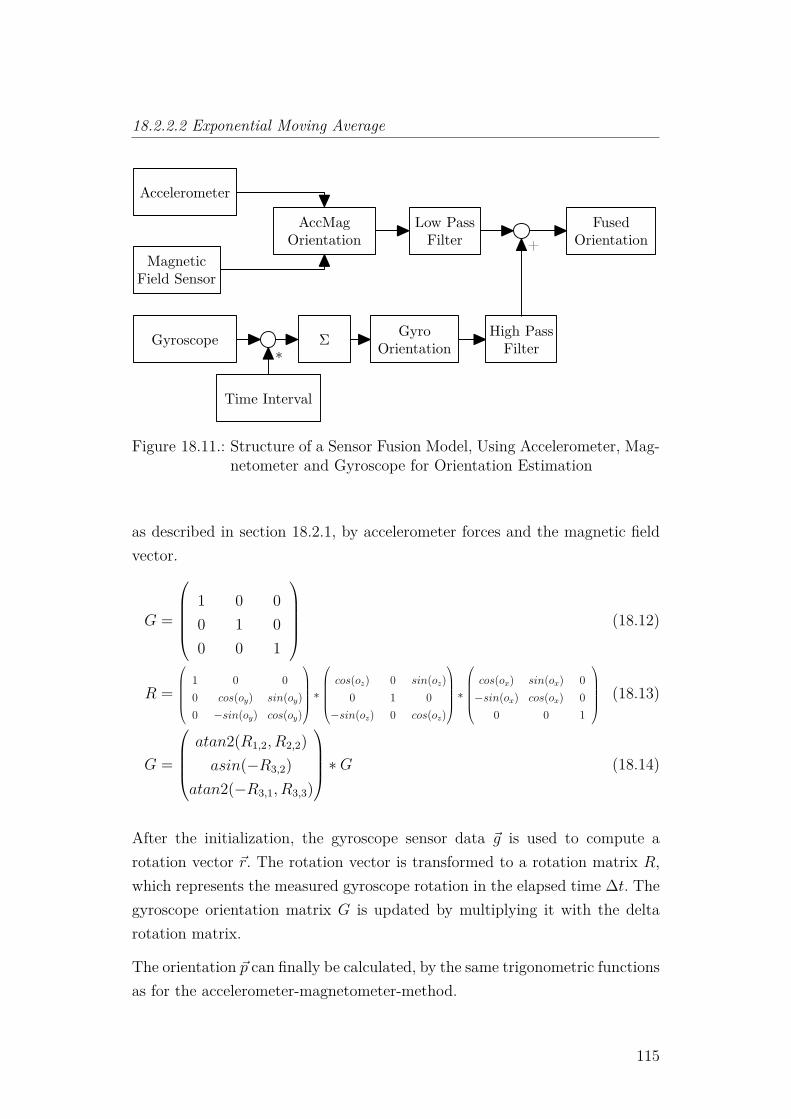
18.2.2.2 Exponential Moving Average
MagneticField Sensor
Accelerometer
AccMagOrientation
Low PassFilter
FusedOrientation
Gyroscope
Time Interval
Σ GyroOrientation
High PassFilter
+
*
Figure 18.11.: Structure of a Sensor Fusion Model, Using Accelerometer, Mag-netometer and Gyroscope for Orientation Estimation
as described in section 18.2.1, by accelerometer forces and the magnetic fieldvector.
G =
1 0 00 1 00 0 1
(18.12)
R =
1 0 00 cos(oy) sin(oy)0 −sin(oy) cos(oy)
∗cos(oz) 0 sin(oz)
0 1 0−sin(oz) 0 cos(oz)
∗cos(ox) sin(ox) 0−sin(ox) cos(ox) 0
0 0 1
(18.13)
G =
atan2(R1,2, R2,2)asin(−R3,2)
atan2(−R3,1, R3,3)
∗G (18.14)
After the initialization, the gyroscope sensor data ~g is used to compute arotation vector ~r. The rotation vector is transformed to a rotation matrix R,which represents the measured gyroscope rotation in the elapsed time ∆t. Thegyroscope orientation matrix G is updated by multiplying it with the deltarotation matrix.
The orientation ~p can finally be calculated, by the same trigonometric functionsas for the accelerometer-magnetometer-method.
115
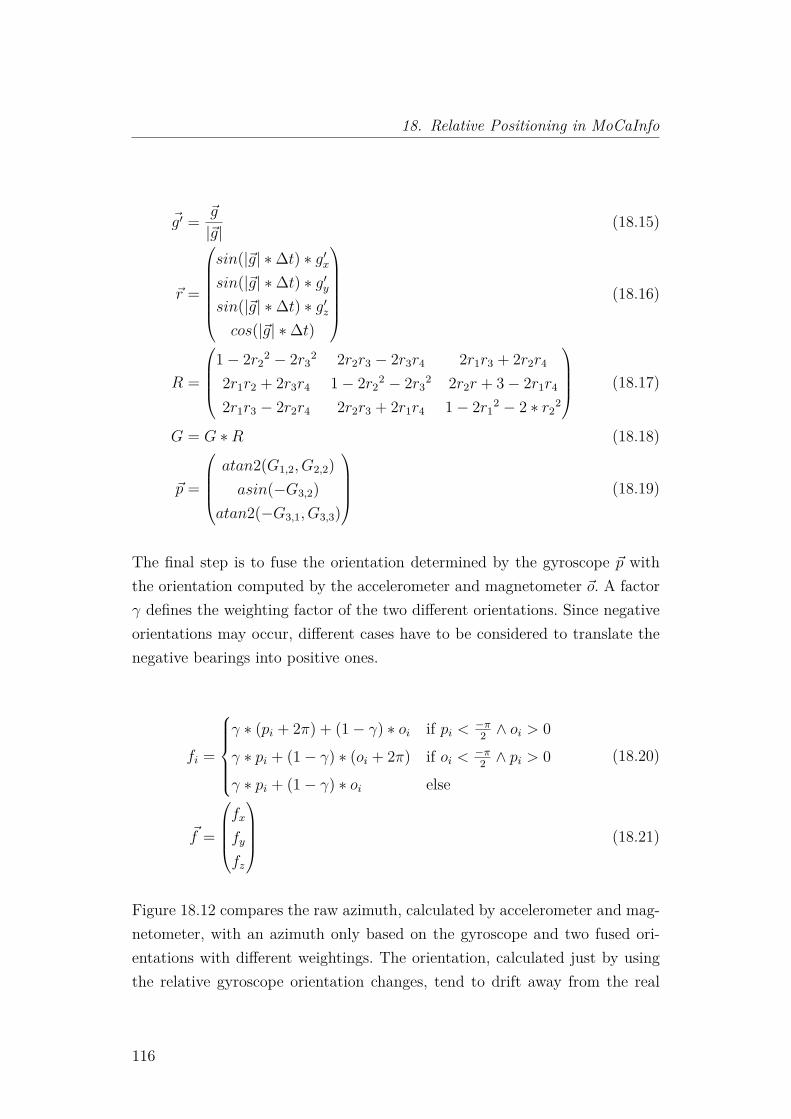
18. Relative Positioning in MoCaInfo
~g′ = ~g
|~g|(18.15)
~r =
sin(|~g| ∗∆t) ∗ g′xsin(|~g| ∗∆t) ∗ g′ysin(|~g| ∗∆t) ∗ g′zcos(|~g| ∗∆t)
(18.16)
R =
1− 2r2
2 − 2r32 2r2r3 − 2r3r4 2r1r3 + 2r2r4
2r1r2 + 2r3r4 1− 2r22 − 2r3
2 2r2r + 3− 2r1r4
2r1r3 − 2r2r4 2r2r3 + 2r1r4 1− 2r12 − 2 ∗ r2
2
(18.17)
G = G ∗R (18.18)
~p =
atan2(G1,2, G2,2)asin(−G3,2)
atan2(−G3,1, G3,3)
(18.19)
The final step is to fuse the orientation determined by the gyroscope ~p withthe orientation computed by the accelerometer and magnetometer ~o. A factorγ defines the weighting factor of the two different orientations. Since negativeorientations may occur, different cases have to be considered to translate thenegative bearings into positive ones.
fi =
γ ∗ (pi + 2π) + (1− γ) ∗ oi if pi < −π
2 ∧ oi > 0γ ∗ pi + (1− γ) ∗ (oi + 2π) if oi < −π
2 ∧ pi > 0γ ∗ pi + (1− γ) ∗ oi else
(18.20)
~f =
fx
fy
fz
(18.21)
Figure 18.12 compares the raw azimuth, calculated by accelerometer and mag-netometer, with an azimuth only based on the gyroscope and two fused ori-entations with different weightings. The orientation, calculated just by usingthe relative gyroscope orientation changes, tend to drift away from the real
116
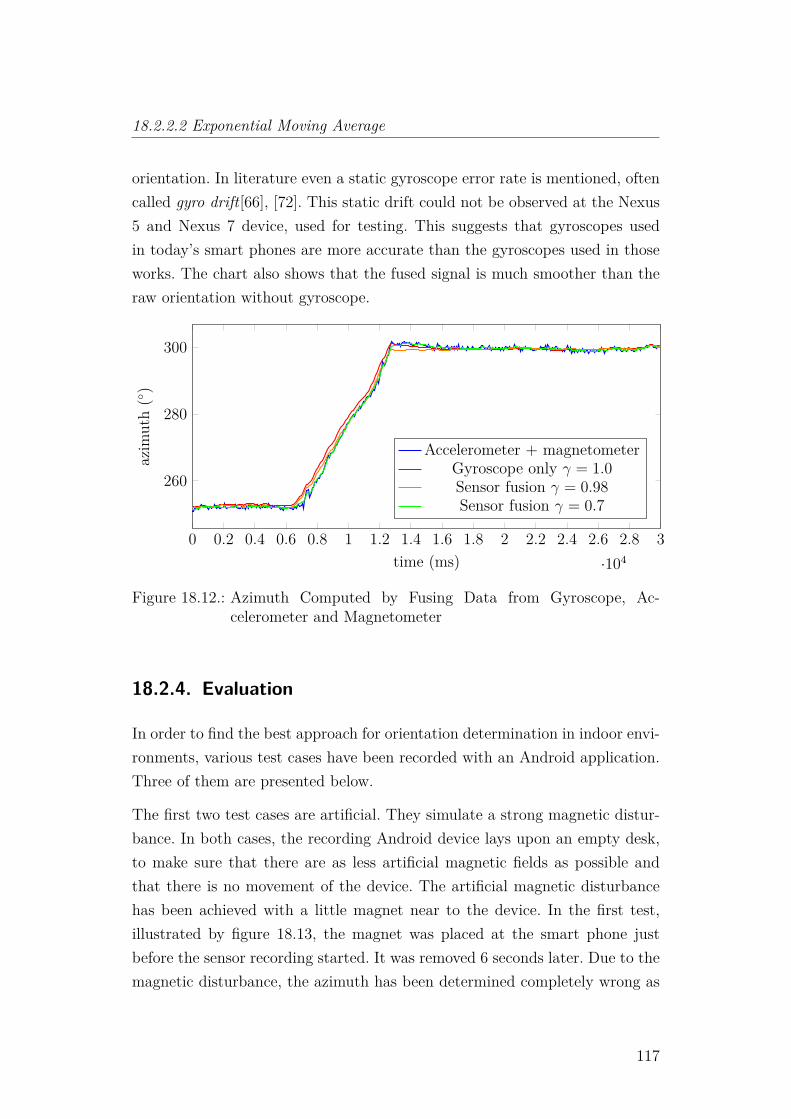
18.2.2.2 Exponential Moving Average
orientation. In literature even a static gyroscope error rate is mentioned, oftencalled gyro drift[66], [72]. This static drift could not be observed at the Nexus5 and Nexus 7 device, used for testing. This suggests that gyroscopes usedin today’s smart phones are more accurate than the gyroscopes used in thoseworks. The chart also shows that the fused signal is much smoother than theraw orientation without gyroscope.
0 0.2 0.4 0.6 0.8 1 1.2 1.4 1.6 1.8 2 2.2 2.4 2.6 2.8 3·104
260
280
300
time (ms)
azim
uth(◦)
Accelerometer + magnetometerGyroscope only γ = 1.0Sensor fusion γ = 0.98Sensor fusion γ = 0.7
Figure 18.12.: Azimuth Computed by Fusing Data from Gyroscope, Ac-celerometer and Magnetometer
18.2.4. Evaluation
In order to find the best approach for orientation determination in indoor envi-ronments, various test cases have been recorded with an Android application.Three of them are presented below.
The first two test cases are artificial. They simulate a strong magnetic distur-bance. In both cases, the recording Android device lays upon an empty desk,to make sure that there are as less artificial magnetic fields as possible andthat there is no movement of the device. The artificial magnetic disturbancehas been achieved with a little magnet near to the device. In the first test,illustrated by figure 18.13, the magnet was placed at the smart phone justbefore the sensor recording started. It was removed 6 seconds later. Due to themagnetic disturbance, the azimuth has been determined completely wrong as
117
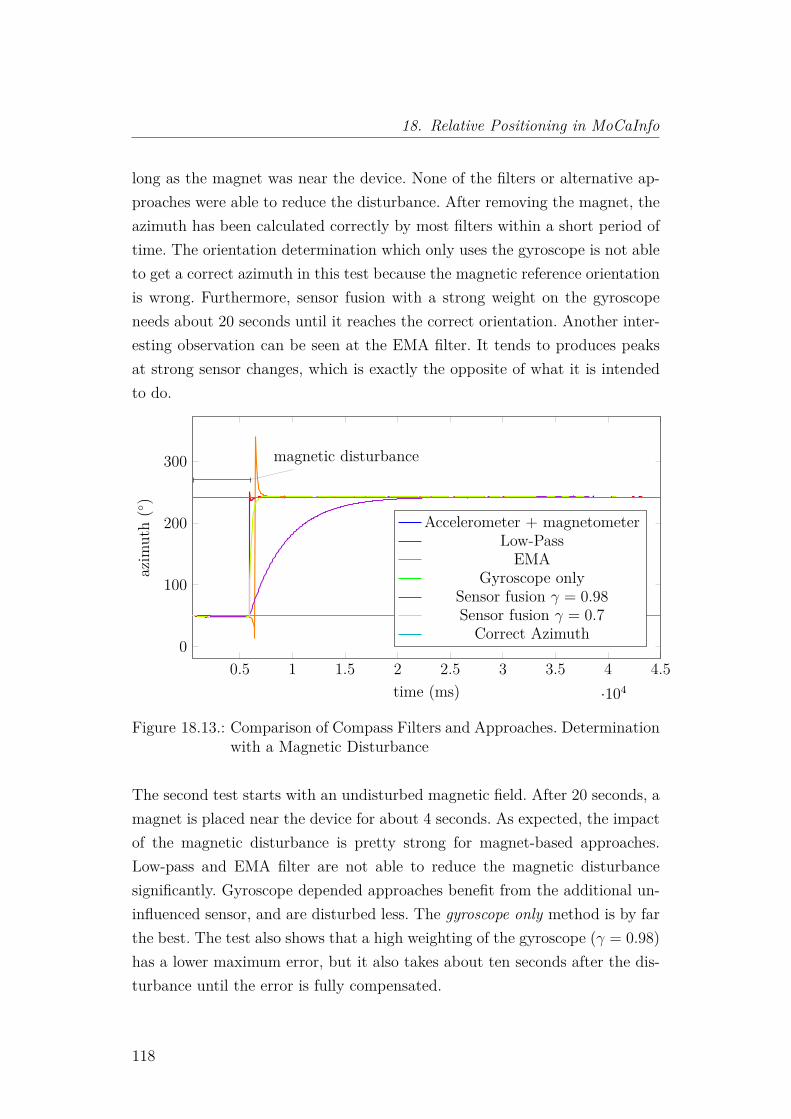
18. Relative Positioning in MoCaInfo
long as the magnet was near the device. None of the filters or alternative ap-proaches were able to reduce the disturbance. After removing the magnet, theazimuth has been calculated correctly by most filters within a short period oftime. The orientation determination which only uses the gyroscope is not ableto get a correct azimuth in this test because the magnetic reference orientationis wrong. Furthermore, sensor fusion with a strong weight on the gyroscopeneeds about 20 seconds until it reaches the correct orientation. Another inter-esting observation can be seen at the EMA filter. It tends to produces peaksat strong sensor changes, which is exactly the opposite of what it is intendedto do.
0.5 1 1.5 2 2.5 3 3.5 4 4.5·104
0
100
200
300 magnetic disturbance
time (ms)
azim
uth(◦)
Accelerometer + magnetometerLow-PassEMA
Gyroscope onlySensor fusion γ = 0.98Sensor fusion γ = 0.7Correct Azimuth
Figure 18.13.: Comparison of Compass Filters and Approaches. Determinationwith a Magnetic Disturbance
The second test starts with an undisturbed magnetic field. After 20 seconds, amagnet is placed near the device for about 4 seconds. As expected, the impactof the magnetic disturbance is pretty strong for magnet-based approaches.Low-pass and EMA filter are not able to reduce the magnetic disturbancesignificantly. Gyroscope depended approaches benefit from the additional un-influenced sensor, and are disturbed less. The gyroscope only method is by farthe best. The test also shows that a high weighting of the gyroscope (γ = 0.98)has a lower maximum error, but it also takes about ten seconds after the dis-turbance until the error is fully compensated.
118
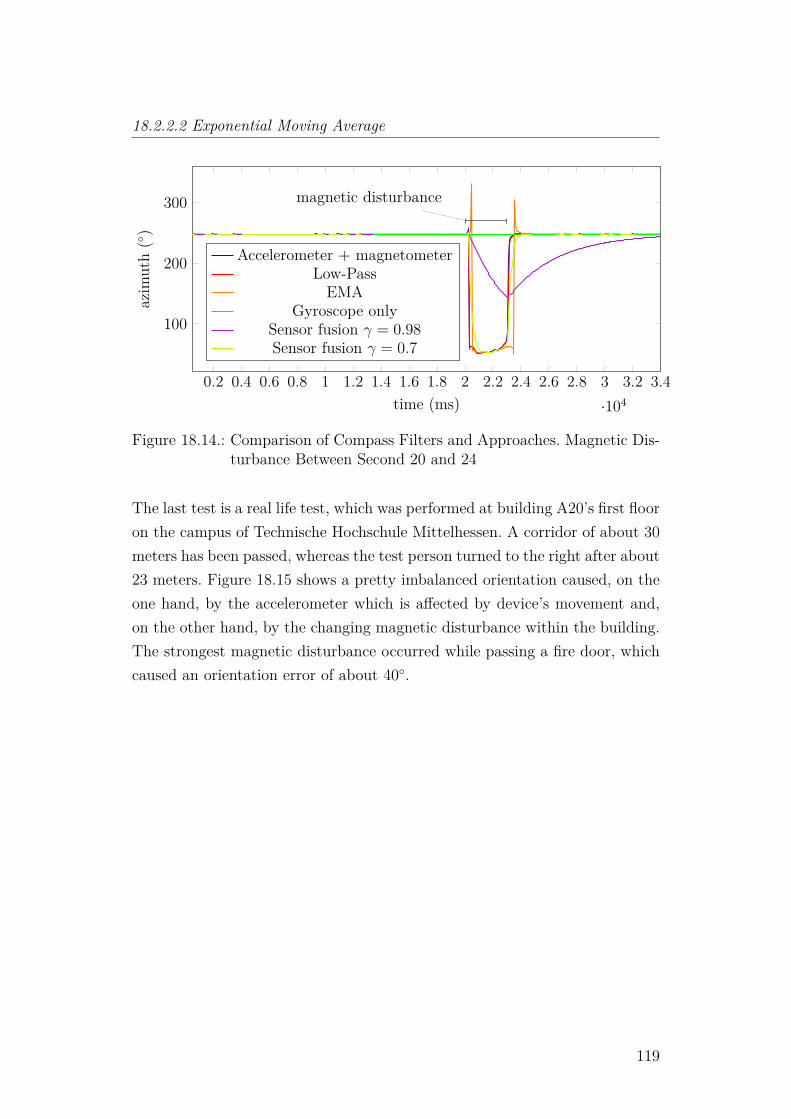
18.2.2.2 Exponential Moving Average
0.2 0.4 0.6 0.8 1 1.2 1.4 1.6 1.8 2 2.2 2.4 2.6 2.8 3 3.2 3.4·104
100
200
300 magnetic disturbance
time (ms)
azim
uth(◦)
Accelerometer + magnetometerLow-PassEMA
Gyroscope onlySensor fusion γ = 0.98Sensor fusion γ = 0.7
Figure 18.14.: Comparison of Compass Filters and Approaches. Magnetic Dis-turbance Between Second 20 and 24
The last test is a real life test, which was performed at building A20’s first flooron the campus of Technische Hochschule Mittelhessen. A corridor of about 30meters has been passed, whereas the test person turned to the right after about23 meters. Figure 18.15 shows a pretty imbalanced orientation caused, on theone hand, by the accelerometer which is affected by device’s movement and,on the other hand, by the changing magnetic disturbance within the building.The strongest magnetic disturbance occurred while passing a fire door, whichcaused an orientation error of about 40◦.
119
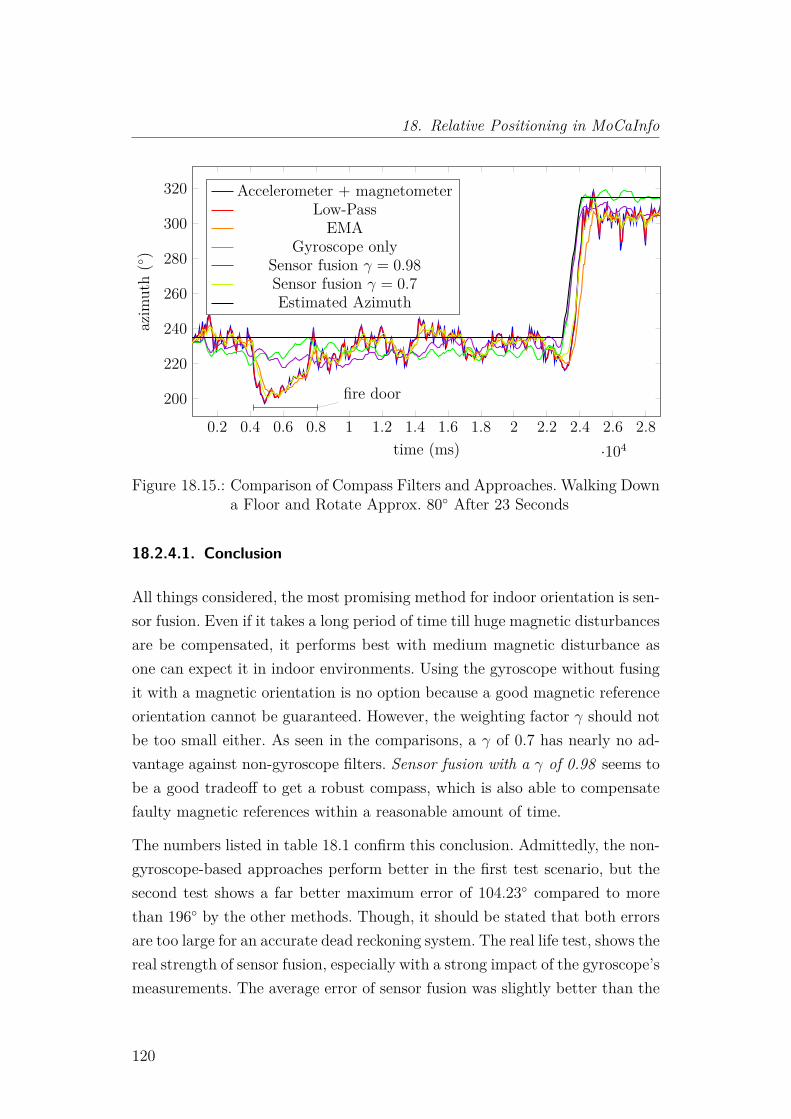
18. Relative Positioning in MoCaInfo
0.2 0.4 0.6 0.8 1 1.2 1.4 1.6 1.8 2 2.2 2.4 2.6 2.8·104
200
220
240
260
280
300
320
fire door
time (ms)
azim
uth(◦)
Accelerometer + magnetometerLow-PassEMA
Gyroscope onlySensor fusion γ = 0.98Sensor fusion γ = 0.7Estimated Azimuth
Figure 18.15.: Comparison of Compass Filters and Approaches. Walking Downa Floor and Rotate Approx. 80◦ After 23 Seconds
18.2.4.1. Conclusion
All things considered, the most promising method for indoor orientation is sen-sor fusion. Even if it takes a long period of time till huge magnetic disturbancesare be compensated, it performs best with medium magnetic disturbance asone can expect it in indoor environments. Using the gyroscope without fusingit with a magnetic orientation is no option because a good magnetic referenceorientation cannot be guaranteed. However, the weighting factor γ should notbe too small either. As seen in the comparisons, a γ of 0.7 has nearly no ad-vantage against non-gyroscope filters. Sensor fusion with a γ of 0.98 seems tobe a good tradeoff to get a robust compass, which is also able to compensatefaulty magnetic references within a reasonable amount of time.
The numbers listed in table 18.1 confirm this conclusion. Admittedly, the non-gyroscope-based approaches perform better in the first test scenario, but thesecond test shows a far better maximum error of 104.23◦ compared to morethan 196◦ by the other methods. Though, it should be stated that both errorsare too large for an accurate dead reckoning system. The real life test, shows thereal strength of sensor fusion, especially with a strong impact of the gyroscope’smeasurements. The average error of sensor fusion was slightly better than the
120
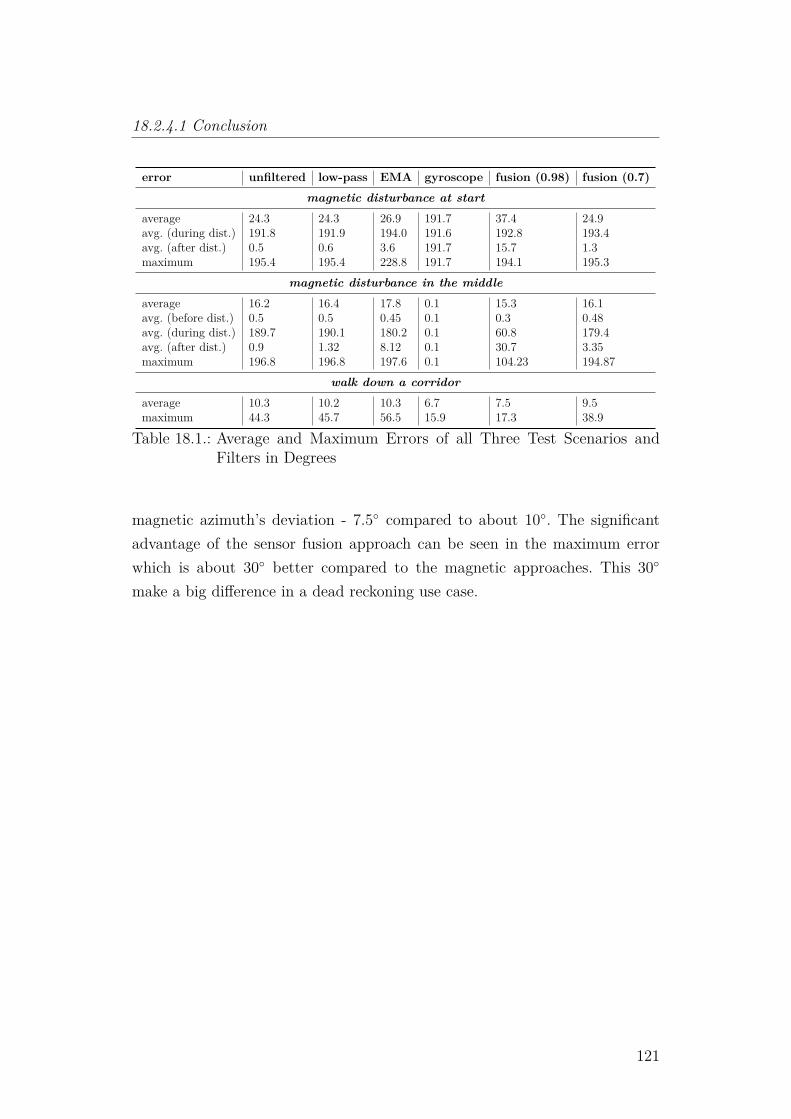
18.2.4.1 Conclusion
error unfiltered low-pass EMA gyroscope fusion (0.98) fusion (0.7)magnetic disturbance at start
average 24.3 24.3 26.9 191.7 37.4 24.9avg. (during dist.) 191.8 191.9 194.0 191.6 192.8 193.4avg. (after dist.) 0.5 0.6 3.6 191.7 15.7 1.3maximum 195.4 195.4 228.8 191.7 194.1 195.3
magnetic disturbance in the middleaverage 16.2 16.4 17.8 0.1 15.3 16.1avg. (before dist.) 0.5 0.5 0.45 0.1 0.3 0.48avg. (during dist.) 189.7 190.1 180.2 0.1 60.8 179.4avg. (after dist.) 0.9 1.32 8.12 0.1 30.7 3.35maximum 196.8 196.8 197.6 0.1 104.23 194.87
walk down a corridoraverage 10.3 10.2 10.3 6.7 7.5 9.5maximum 44.3 45.7 56.5 15.9 17.3 38.9
Table 18.1.: Average and Maximum Errors of all Three Test Scenarios andFilters in Degrees
magnetic azimuth’s deviation - 7.5◦ compared to about 10◦. The significantadvantage of the sensor fusion approach can be seen in the maximum errorwhich is about 30◦ better compared to the magnetic approaches. This 30◦
make a big difference in a dead reckoning use case.
121
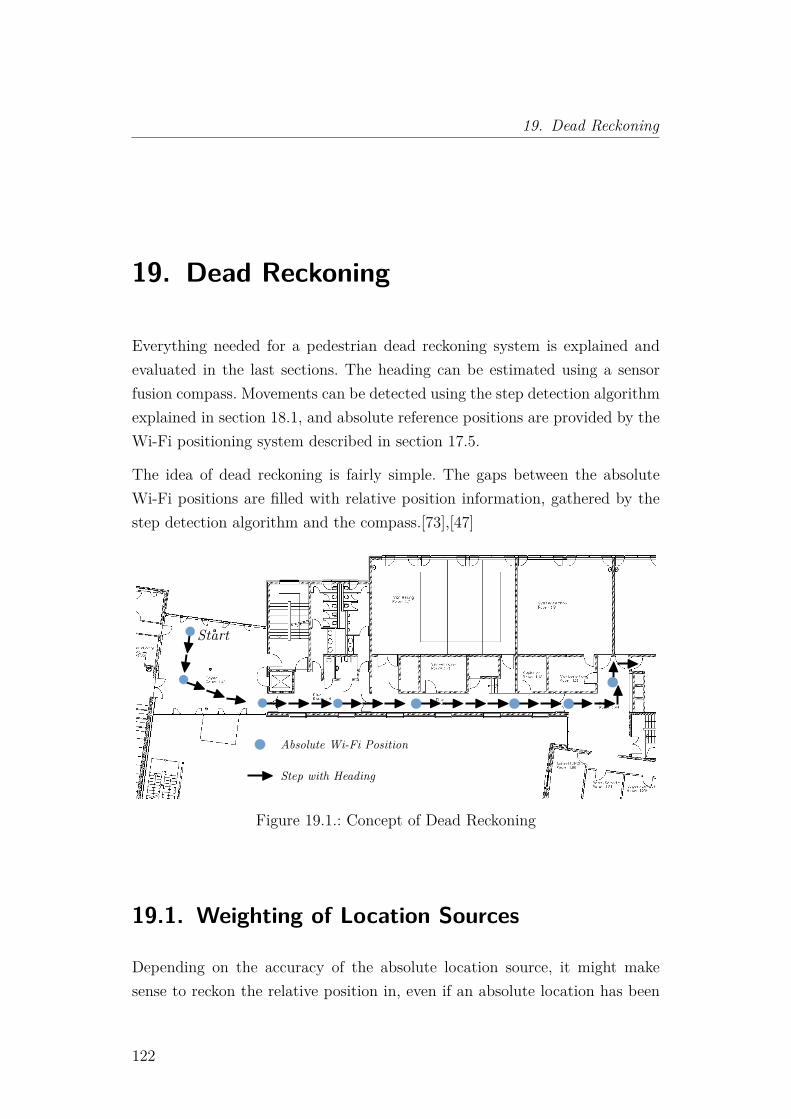
19. Dead Reckoning
19. Dead Reckoning
Everything needed for a pedestrian dead reckoning system is explained andevaluated in the last sections. The heading can be estimated using a sensorfusion compass. Movements can be detected using the step detection algorithmexplained in section 18.1, and absolute reference positions are provided by theWi-Fi positioning system described in section 17.5.
The idea of dead reckoning is fairly simple. The gaps between the absoluteWi-Fi positions are filled with relative position information, gathered by thestep detection algorithm and the compass.[73],[47]
Start
Absolute Wi-Fi Position
Step with Heading
Figure 19.1.: Concept of Dead Reckoning
19.1. Weighting of Location Sources
Depending on the accuracy of the absolute location source, it might makesense to reckon the relative position in, even if an absolute location has been
122
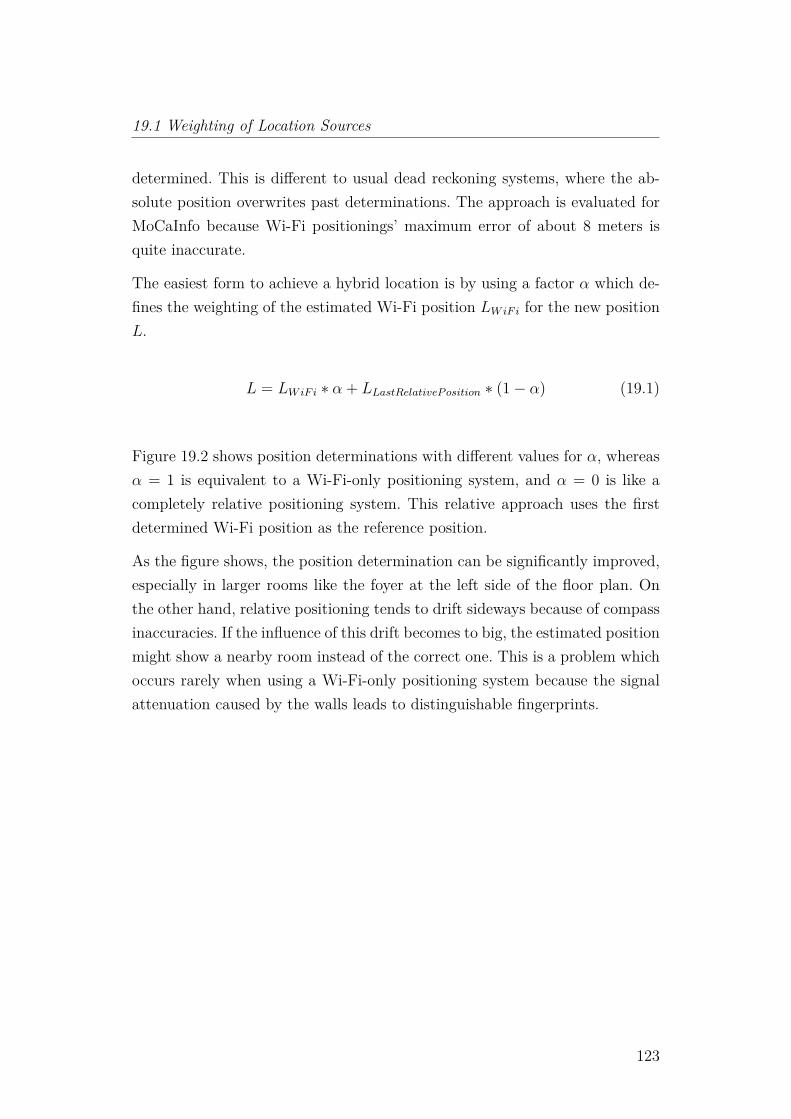
19.1 Weighting of Location Sources
determined. This is different to usual dead reckoning systems, where the ab-solute position overwrites past determinations. The approach is evaluated forMoCaInfo because Wi-Fi positionings’ maximum error of about 8 meters isquite inaccurate.
The easiest form to achieve a hybrid location is by using a factor α which de-fines the weighting of the estimated Wi-Fi position LWiFi for the new positionL.
L = LWiFi ∗ α + LLastRelativePosition ∗ (1− α) (19.1)
Figure 19.2 shows position determinations with different values for α, whereasα = 1 is equivalent to a Wi-Fi-only positioning system, and α = 0 is like acompletely relative positioning system. This relative approach uses the firstdetermined Wi-Fi position as the reference position.
As the figure shows, the position determination can be significantly improved,especially in larger rooms like the foyer at the left side of the floor plan. Onthe other hand, relative positioning tends to drift sideways because of compassinaccuracies. If the influence of this drift becomes to big, the estimated positionmight show a nearby room instead of the correct one. This is a problem whichoccurs rarely when using a Wi-Fi-only positioning system because the signalattenuation caused by the walls leads to distinguishable fingerprints.
123
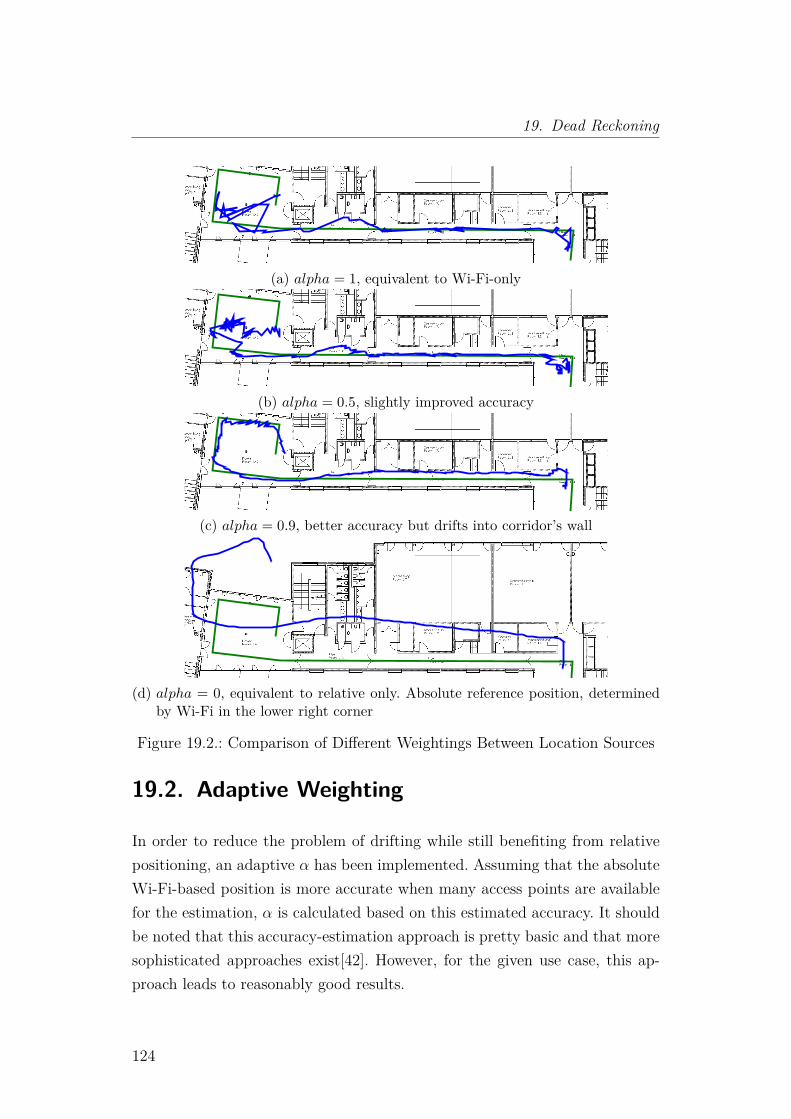
19. Dead Reckoning
(a) alpha = 1, equivalent to Wi-Fi-only
(b) alpha = 0.5, slightly improved accuracy
(c) alpha = 0.9, better accuracy but drifts into corridor’s wall
(d) alpha = 0, equivalent to relative only. Absolute reference position, determinedby Wi-Fi in the lower right corner
Figure 19.2.: Comparison of Different Weightings Between Location Sources
19.2. Adaptive Weighting
In order to reduce the problem of drifting while still benefiting from relativepositioning, an adaptive α has been implemented. Assuming that the absoluteWi-Fi-based position is more accurate when many access points are availablefor the estimation, α is calculated based on this estimated accuracy. It shouldbe noted that this accuracy-estimation approach is pretty basic and that moresophisticated approaches exist[42]. However, for the given use case, this ap-proach leads to reasonably good results.
124
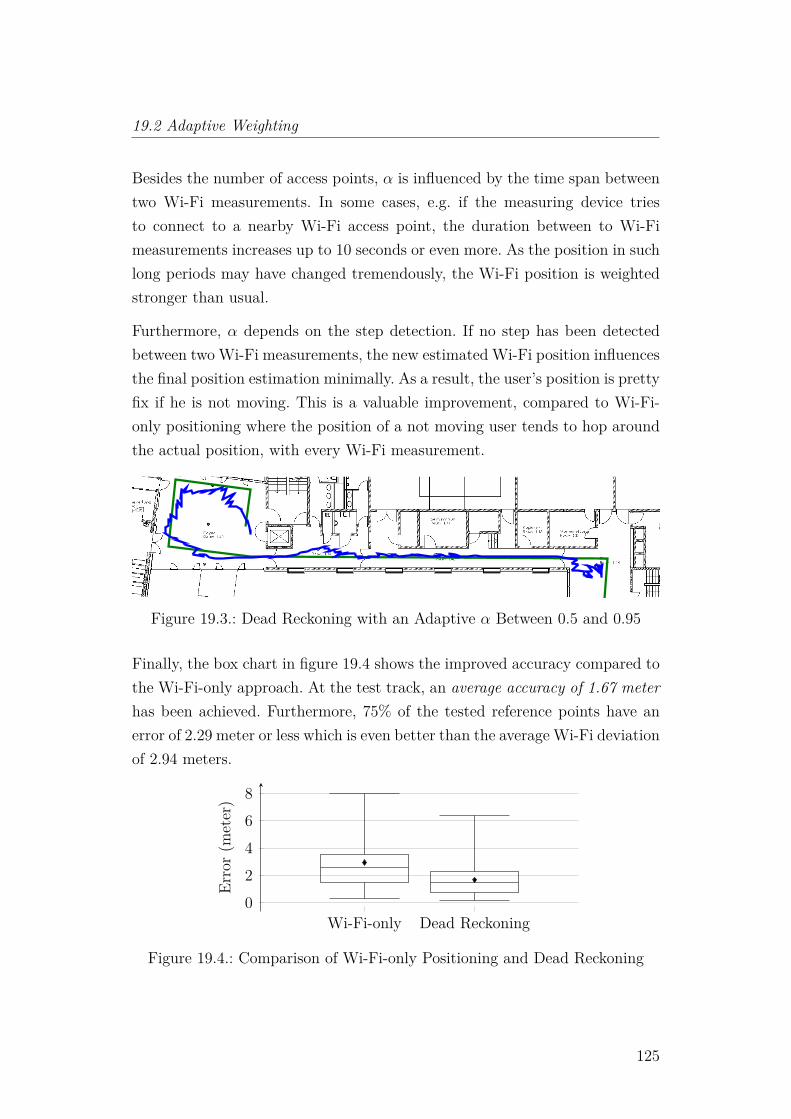
19.2 Adaptive Weighting
Besides the number of access points, α is influenced by the time span betweentwo Wi-Fi measurements. In some cases, e.g. if the measuring device triesto connect to a nearby Wi-Fi access point, the duration between to Wi-Fimeasurements increases up to 10 seconds or even more. As the position in suchlong periods may have changed tremendously, the Wi-Fi position is weightedstronger than usual.
Furthermore, α depends on the step detection. If no step has been detectedbetween two Wi-Fi measurements, the new estimated Wi-Fi position influencesthe final position estimation minimally. As a result, the user’s position is prettyfix if he is not moving. This is a valuable improvement, compared to Wi-Fi-only positioning where the position of a not moving user tends to hop aroundthe actual position, with every Wi-Fi measurement.
Figure 19.3.: Dead Reckoning with an Adaptive α Between 0.5 and 0.95
Finally, the box chart in figure 19.4 shows the improved accuracy compared tothe Wi-Fi-only approach. At the test track, an average accuracy of 1.67 meterhas been achieved. Furthermore, 75% of the tested reference points have anerror of 2.29 meter or less which is even better than the average Wi-Fi deviationof 2.94 meters.
Wi-Fi-only Dead Reckoning02468
Error(m
eter)
Figure 19.4.: Comparison of Wi-Fi-only Positioning and Dead Reckoning
125
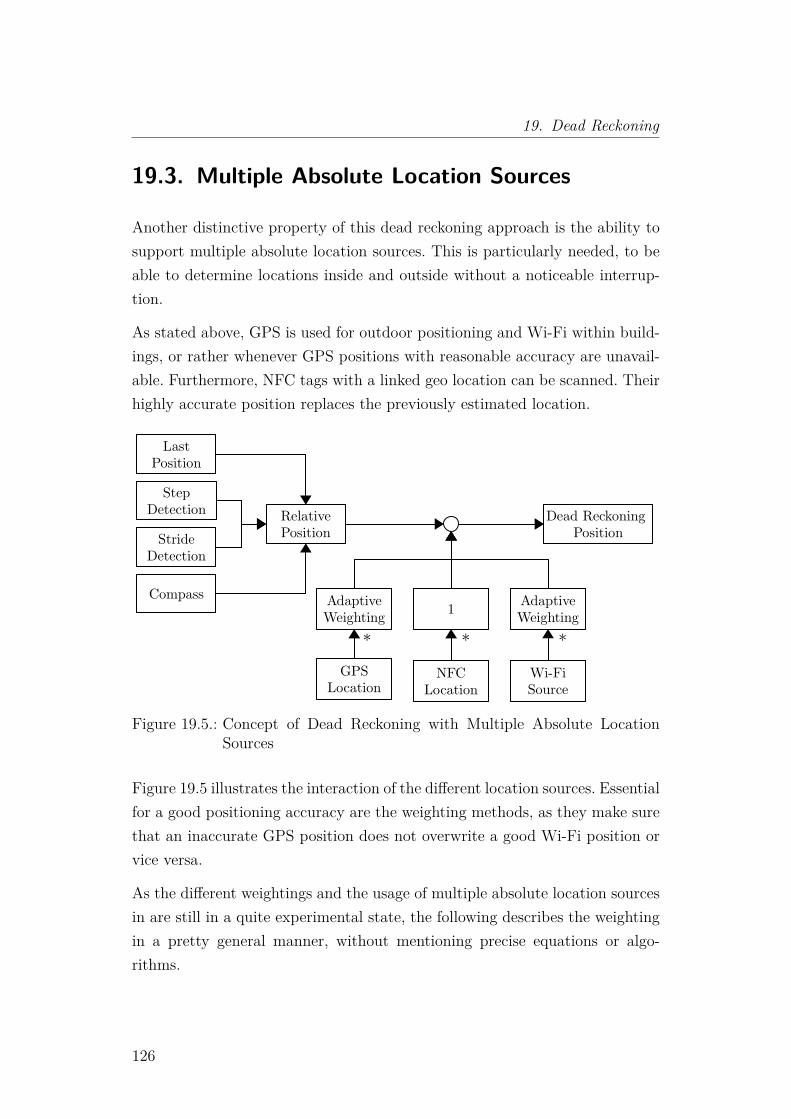
19. Dead Reckoning
19.3. Multiple Absolute Location Sources
Another distinctive property of this dead reckoning approach is the ability tosupport multiple absolute location sources. This is particularly needed, to beable to determine locations inside and outside without a noticeable interrup-tion.
As stated above, GPS is used for outdoor positioning and Wi-Fi within build-ings, or rather whenever GPS positions with reasonable accuracy are unavail-able. Furthermore, NFC tags with a linked geo location can be scanned. Theirhighly accurate position replaces the previously estimated location.
Wi-FiSource
Dead Reckoning Position
NFCLocation
StepDetection
StrideDetection
LastPosition
GPSLocation
RelativePosition
1 AdaptiveWeighting
AdaptiveWeighting
Compass
* * *
Figure 19.5.: Concept of Dead Reckoning with Multiple Absolute LocationSources
Figure 19.5 illustrates the interaction of the different location sources. Essentialfor a good positioning accuracy are the weighting methods, as they make surethat an inaccurate GPS position does not overwrite a good Wi-Fi position orvice versa.
As the different weightings and the usage of multiple absolute location sourcesin are still in a quite experimental state, the following describes the weightingin a pretty general manner, without mentioning precise equations or algo-rithms.
126
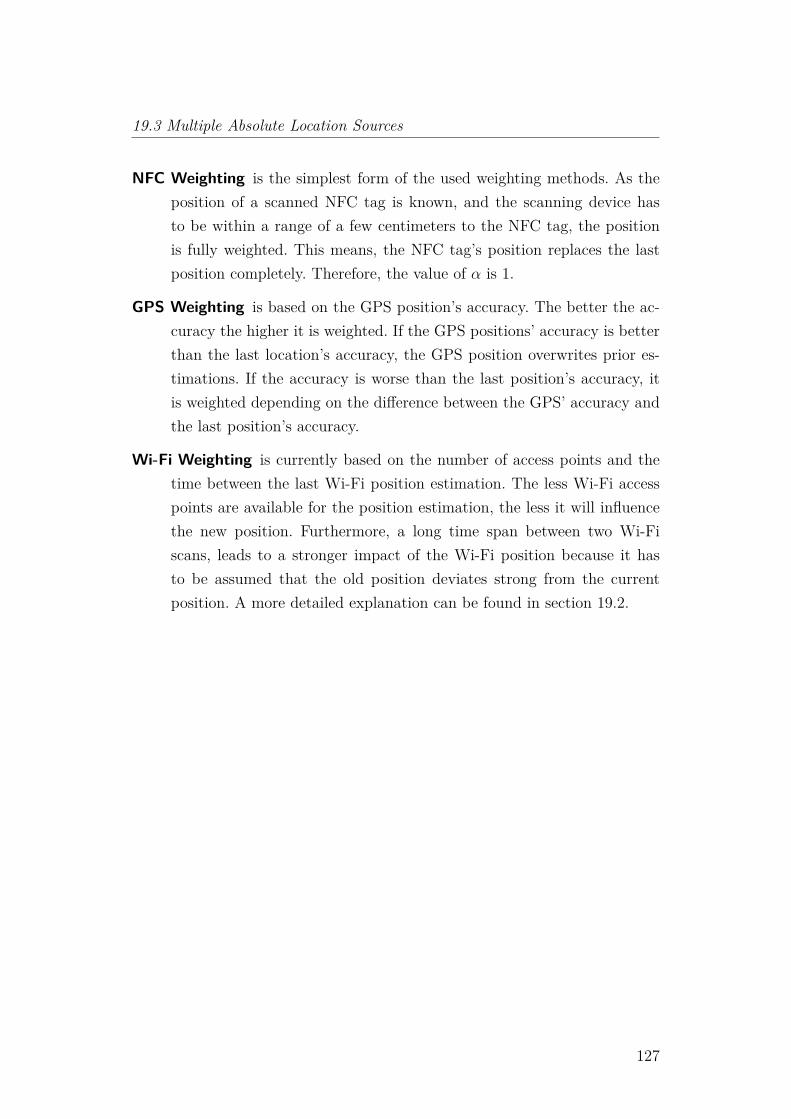
19.3 Multiple Absolute Location Sources
NFC Weighting is the simplest form of the used weighting methods. As theposition of a scanned NFC tag is known, and the scanning device hasto be within a range of a few centimeters to the NFC tag, the positionis fully weighted. This means, the NFC tag’s position replaces the lastposition completely. Therefore, the value of α is 1.
GPS Weighting is based on the GPS position’s accuracy. The better the ac-curacy the higher it is weighted. If the GPS positions’ accuracy is betterthan the last location’s accuracy, the GPS position overwrites prior es-timations. If the accuracy is worse than the last position’s accuracy, itis weighted depending on the difference between the GPS’ accuracy andthe last position’s accuracy.
Wi-Fi Weighting is currently based on the number of access points and thetime between the last Wi-Fi position estimation. The less Wi-Fi accesspoints are available for the position estimation, the less it will influencethe new position. Furthermore, a long time span between two Wi-Fiscans, leads to a stronger impact of the Wi-Fi position because it hasto be assumed that the old position deviates strong from the currentposition. A more detailed explanation can be found in section 19.2.
127

Part V.
Conclusions and Future Work
129
20. Conclusions
20. Conclusions
This thesis contains an introduction into location-based information systems,focusing on the difficulties which appear when visually impaired users, as wellas sighted users, are targeted. It shows that even if more and more helpingutilities for visually impaired users exist, it still is a challenging task to providea good user experience with a mobile application for both, blind and sightedusers.
Furthermore, the thesis demonstrates that indoor and outdoor positioning withsmart phones is possible on condition that the infrastructure meets certainrequirements. In this context, existing approaches are evaluated and combinedwith new ideas for further improvements.
The following sections, discuss the different topics more deeply.
20.1. Mobile Application
The mobile application’s distinctiveness is the user interface. The app offers ausual graphical user interface, following well known UI design patterns and aseparate low-vision user interface. It is still hardly discussed, whether dedicatedlow-vision user interfaces are worth the effort. According to Google, applica-tions are accessible for everyone if certain things are considered by graphicaluser interface. The various accessibility tools, provided by Android shall enablevisually impaired users to use those applications.[10]
According to researches, which are described more detailed in section 7.5, low-vision user interfaces are still superior to graphical user interfaces which followuniversal design principles. Those finding is supported by Niehaus[13], a formerproject member, who is visually impaired himself. For his final paper, he inter-viewed several other visually impaired people and concludes that customizable
130
20.2 Navigation
low-vision user interfaces offer a better user experience than graphical userinterfaces[13, p. 69ff]. The author of this thesis therefore recommends sepa-rate low-vision user interfaces for mobile applications, in particular if visuallyimpaired people belong to the target user group.
By a strict obedience to the MVC pattern, the additional code needed for alow-vision user interface only affects the view component. Admittedly, changesin the model or the controller often affect two view classes, which results in ahigher effort for maintenance.
20.2. Navigation
This thesis shows that the current indoor navigation situation is not entirelysatisfying. Google Indoor Maps just support public floor plans, which is notwanted by many institutions. Furthermore, indoor navigation is only avail-able to a few indoor maps. The OpenStreetMap community has proposed adata structure for floor plans, but there are no libraries or applications whichactually support their usage.
A combination of OpenStreetMap, its toolchain and the great rendering perfor-mance of Google Maps actually leads to a usable indoor and outdoor navigationcomponent, with a reasonable implementation effort.
The open data structure of OpenStreetMap allows to add arbitrary informa-tion to maps. This is used to store information like the condition of the floor, inorder to assist visually impaired users during navigation additionally. In so do-ing, MoCaInfo’s navigation system explores new avenues, as such informationis not considered by any other available indoor navigation system.
20.3. Indoor and Outdoor Positioning
The research in this thesis examines that indoor positioning with accuracies,reasonable for the usage in a point-to-point navigation system, is possible ifthe infrastructure meets certain requirements. This requirements are basically
131
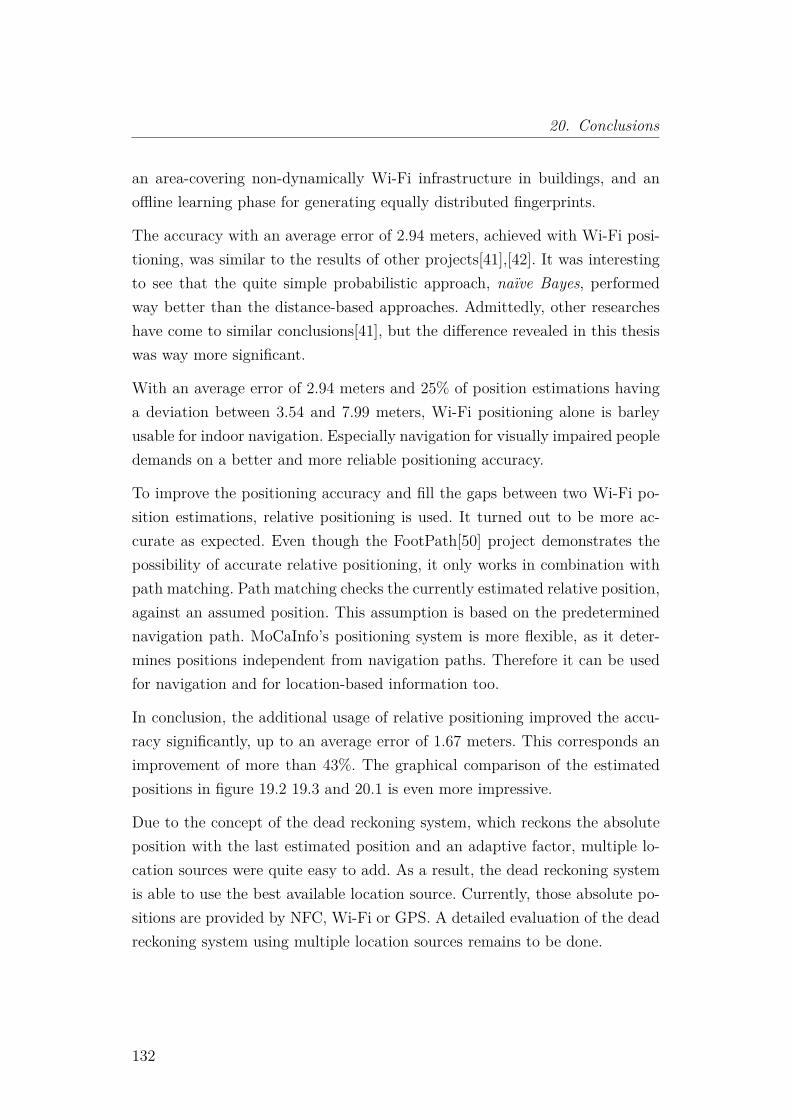
20. Conclusions
an area-covering non-dynamically Wi-Fi infrastructure in buildings, and anoffline learning phase for generating equally distributed fingerprints.
The accuracy with an average error of 2.94 meters, achieved with Wi-Fi posi-tioning, was similar to the results of other projects[41],[42]. It was interestingto see that the quite simple probabilistic approach, naïve Bayes, performedway better than the distance-based approaches. Admittedly, other researcheshave come to similar conclusions[41], but the difference revealed in this thesiswas way more significant.
With an average error of 2.94 meters and 25% of position estimations havinga deviation between 3.54 and 7.99 meters, Wi-Fi positioning alone is barleyusable for indoor navigation. Especially navigation for visually impaired peopledemands on a better and more reliable positioning accuracy.
To improve the positioning accuracy and fill the gaps between two Wi-Fi po-sition estimations, relative positioning is used. It turned out to be more ac-curate as expected. Even though the FootPath[50] project demonstrates thepossibility of accurate relative positioning, it only works in combination withpath matching. Path matching checks the currently estimated relative position,against an assumed position. This assumption is based on the predeterminednavigation path. MoCaInfo’s positioning system is more flexible, as it deter-mines positions independent from navigation paths. Therefore it can be usedfor navigation and for location-based information too.
In conclusion, the additional usage of relative positioning improved the accu-racy significantly, up to an average error of 1.67 meters. This corresponds animprovement of more than 43%. The graphical comparison of the estimatedpositions in figure 19.2 19.3 and 20.1 is even more impressive.
Due to the concept of the dead reckoning system, which reckons the absoluteposition with the last estimated position and an adaptive factor, multiple lo-cation sources were quite easy to add. As a result, the dead reckoning systemis able to use the best available location source. Currently, those absolute po-sitions are provided by NFC, Wi-Fi or GPS. A detailed evaluation of the deadreckoning system using multiple location sources remains to be done.
132
20.3 Indoor and Outdoor Positioning
Figure 20.1.: Position Estimation with Dead Reckoning (Red) and Wi-Fi-Only(Blue). Green Line Shows the Actual Walked Track
20.3.1. Step Detection
The first examined step detection approach revealed an error of 25%. About10% of those errors were caused by phantom steps. Phantom steps are falsepositive step detections, which means that a step has been detected by thealgorithm but the user wasn’t walking at all. Furthermore, about 15% of thesteps have not been detected.
To reduce these errors, a signal preparation algorithm, which is executed be-fore the actual step detection, has been implemented. This signal preparationis adapted from the Pan-Tompkins[65] method. By means of this algorithm,phantom steps could be reduced by one third. Furthermore, the amount ofundetected steps has been improved from 14.5% to 7.4%.
Nevertheless, it should be mentioned that the current step detection stronglydepends on the user, who has to hold the smart phone steadily. If the usermoves the hand that holds the smart phone, steps will be detected, even if theuser is not walking at all. This is a general problem when working with smartphone’s acceleration measurements.
20.3.2. Compass
The thesis shows that a reliable compass, which does not get confused bymagnetic interference, is not easy to achieve. The first approach, to filter theincoming magnetic and gravity data, did not yield good results. Magneticinterference still had a strong impact on the calculated azimuth.
133
20. Conclusions
The approach to fuse the detected rotational movements, gathered by thegyroscope, with the magnetic azimuth was way better. Magnetic interferencestill impacts the azimuth estimation, but the maximum deviation between theactual and the estimated azimuth is significantly lower. As a disadvantage themagnetic interference influences the azimuth estimation for a longer period oftime.
134
21. Future Work
The following chapter describes ideas and possible approaches to further im-prove the different components. It starts with some thoughts about improve-ments of the mobile application. The following section deals with refinementsfor the navigation component. The chapter ends with possibilities to enhanceindoor and outdoor positioning, followed by some final words.
21.1. Mobile Application
The current mobile application offers any necessary feature for a basic location-based information system, but there are still some features which might im-prove the user experience.
21.1.1. Global User Profiles
The first thing, which is actually less of a mobile application feature but afeature which affects multiple components, are global user profiles. Currently,the user can bookmark certain POIs or channels, but those settings are onlystored at the mobile device. If the user has multiple devices or buys a new one,settings are not synchronized.
21.1.2. Notifications
Another currently missing feature is an active notification system. Such a sys-tem notifies the user when certain information is changed or added, e.g. ifa lecture has been canceled. An implementation for this could be based onGoogle’s Cloud Messaging for Android, also known as GCM[74]. GCM is a
135
21. Future Work
push message service, which enables developers to send tiny messages to anAndroid application, whereas the message itself only contains a payload ofmaximum 4kb. Therefore, those GCM messages could be used to trigger theapplication to synchronize its data and notify the user if important eventsoccur.
21.1.3. Machine Manuals
Niehaus[13, p. 44] proposed an interesting feature to assist visually impairedpeople in using the different types of automates disposed throughout the cam-pus. This includes beverage vending machines, copying machines, automaticteller machines, etc. Most of them are barely accessible for visually impairedusers. Therefore, a digital user manual for those machines would remarkablyincrease the independence of visually impaired users.
21.2. Navigation
The current navigation component has two major parts which remain roomfor further improvement. The first part is the visualization of floor plans. Cur-rently, only shapes of the rooms are drawn. Doors are visualized as gaps inthe wall. A more detailed visualization would be desirable. For instance, doorsshould be drawn including the opening direction and stairways should be rec-ognizable as such. This changes are relatively easy to implement, as they canbe realized by using Google Maps’ polylines.
21.2.1. Navigation Instructions
The second part which could be improved are navigation instructions. Thecurrent navigation instructions are really basic and only a few navigation in-structions, which might ease the orientation for visually impaired people, areimplemented. The still missing instructions are those which are not directlyconnected to the way the user currently walks. This includes obstacles whichare near the way but not directly at it, such as chairs, desks or plants. But
136
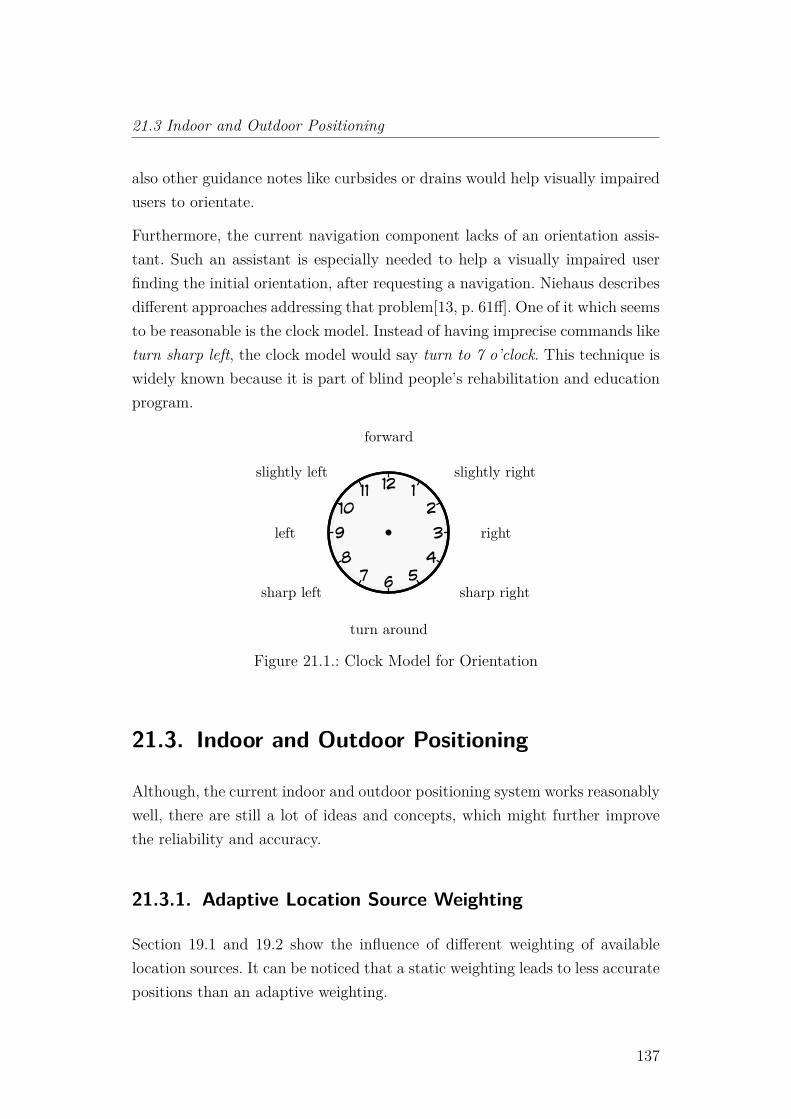
21.3 Indoor and Outdoor Positioning
also other guidance notes like curbsides or drains would help visually impairedusers to orientate.
Furthermore, the current navigation component lacks of an orientation assis-tant. Such an assistant is especially needed to help a visually impaired userfinding the initial orientation, after requesting a navigation. Niehaus describesdifferent approaches addressing that problem[13, p. 61ff]. One of it which seemsto be reasonable is the clock model. Instead of having imprecise commands liketurn sharp left, the clock model would say turn to 7 o’clock. This technique iswidely known because it is part of blind people’s rehabilitation and educationprogram.
right
forward
left
turn around
sharp rightsharp left
slightly rightslightly left
Figure 21.1.: Clock Model for Orientation
21.3. Indoor and Outdoor Positioning
Although, the current indoor and outdoor positioning system works reasonablywell, there are still a lot of ideas and concepts, which might further improvethe reliability and accuracy.
21.3.1. Adaptive Location Source Weighting
Section 19.1 and 19.2 show the influence of different weighting of availablelocation sources. It can be noticed that a static weighting leads to less accuratepositions than an adaptive weighting.
137
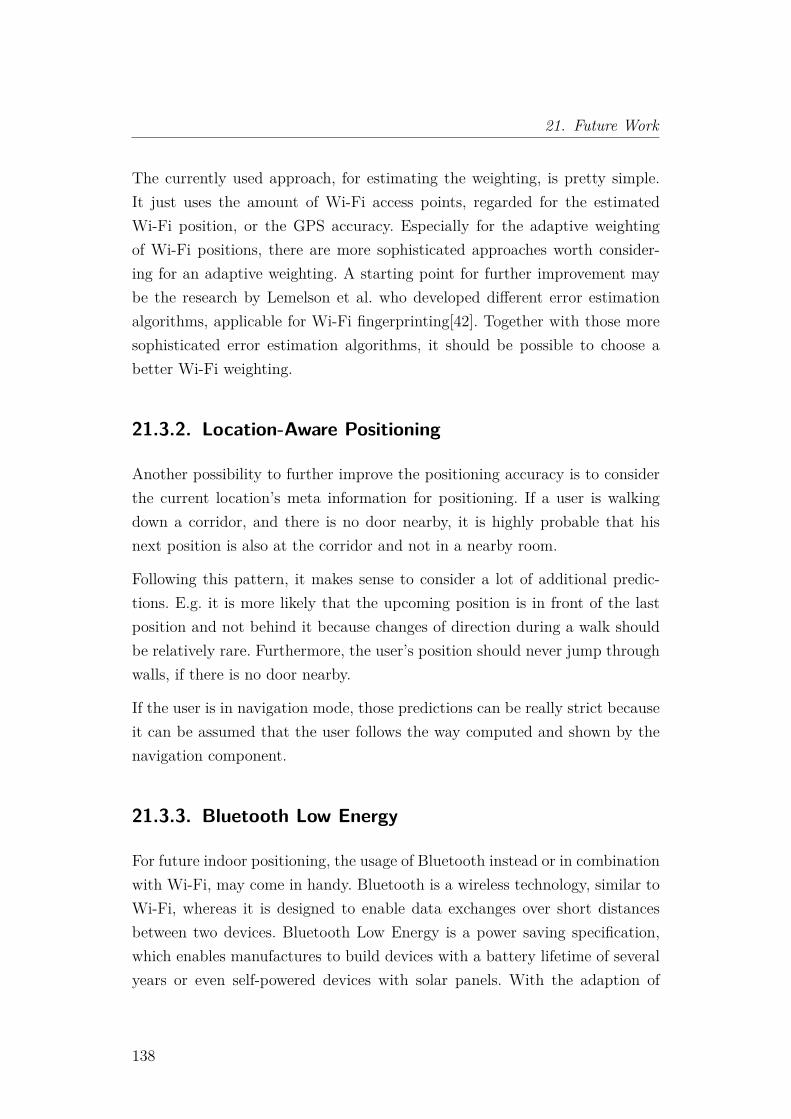
21. Future Work
The currently used approach, for estimating the weighting, is pretty simple.It just uses the amount of Wi-Fi access points, regarded for the estimatedWi-Fi position, or the GPS accuracy. Especially for the adaptive weightingof Wi-Fi positions, there are more sophisticated approaches worth consider-ing for an adaptive weighting. A starting point for further improvement maybe the research by Lemelson et al. who developed different error estimationalgorithms, applicable for Wi-Fi fingerprinting[42]. Together with those moresophisticated error estimation algorithms, it should be possible to choose abetter Wi-Fi weighting.
21.3.2. Location-Aware Positioning
Another possibility to further improve the positioning accuracy is to considerthe current location’s meta information for positioning. If a user is walkingdown a corridor, and there is no door nearby, it is highly probable that hisnext position is also at the corridor and not in a nearby room.
Following this pattern, it makes sense to consider a lot of additional predic-tions. E.g. it is more likely that the upcoming position is in front of the lastposition and not behind it because changes of direction during a walk shouldbe relatively rare. Furthermore, the user’s position should never jump throughwalls, if there is no door nearby.
If the user is in navigation mode, those predictions can be really strict becauseit can be assumed that the user follows the way computed and shown by thenavigation component.
21.3.3. Bluetooth Low Energy
For future indoor positioning, the usage of Bluetooth instead or in combinationwith Wi-Fi, may come in handy. Bluetooth is a wireless technology, similar toWi-Fi, whereas it is designed to enable data exchanges over short distancesbetween two devices. Bluetooth Low Energy is a power saving specification,which enables manufactures to build devices with a battery lifetime of severalyears or even self-powered devices with solar panels. With the adaption of
138
21.3 Indoor and Outdoor Positioning
Bluetooth Low Energy into the Bluetooth 4.0 standard, more and more devicessupport Bluetooth Low Energy[75]. Thanks to this development, RSSI-basedpositioning with Bluetooth is a promising option for future indoor positioningsystems.
Figure 21.2.: Gimbal Proximity Beacon Series 10 (left) and Series 20 by Qual-comm[76]
Apple Inc. even proposed an indoor positioning specification based on Blue-tooth 4.0 recently. It is called iBeacon[34]. Besides Apple’s mobile operatingsystem iOS, Android is also supported by iBeacon. Products implementingiBeacon are currently pretty rare, but many companies have announced prod-ucts for the near future. Many of those companies are startups, who have beenfounded to develop and sell iBeacon hardware, but also old-established firmslike Qualcomm announced products. Their Gimbal Proximity Beacon - Series20 achieves a battery life of one to three years with four standard AA alkalinebatteries. Depending on the purchasing volume, series 20 beacons are availablefor as little as $10 each[76],[77].
An advantage of many iBeacon devices against Wi-Fi access points is that theyare battery-powered. This facilitates the equal distribution of iBeacon sendersinside a building. Furthermore, the price of $10 is just a fraction of the cost ofa Wi-Fi access point. As a consequence, iBeacon devices can be placed closerto each other which should result in a better positioning accuracy.
139
21. Future Work
21.3.4. Step Detection
The current step detection algorithm works pretty reliable if the user holdsthe device steady. Movements of the smart phone which are not related to astep, lead ineluctably to false positive step detections.
It might be possible to reduce those false positive detections if the algorithmalso observes the shape of the accelerometer signal, instead of just lookingfor changes in the signal. Thus, at least smart phone movements which differsignificantly from a step movement could be detected and ignored for stepdetection.
21.3.4.1. Stride Detection
Another topic, which is completely ignored in this thesis is stride detection.The current implementation just uses a static stride of 70 cm, which has beenestimated empirically. This solution produces large errors, especially for peoplesignificantly taller or smaller than the average.
Furthermore, test walks with a visually impaired person revealed that he makespretty tiny steps when he is expecting an obstacle or is unfamiliar with thearea. Even though a walk with one tester with low vision is not representative,it can be assumed that this is a general behavior of most visually impairedpeople.
Kim et al. are describing an accelerometer-based stride detection algorithmwith a pretty impressive accuracy of about 96%[63]. Unfortunately, this al-gorithm cannot be adapted because Kim et al. are using a foot-mounted ac-celerometer. This sensor enables them to measure the time when the footswings back and forth. But they also noticed a relation between the absolutegravity force and the stride length. Maybe this is an approach which can befollowed for stride detection with an Android device.
Another possibility to improve stride detection could be a self-adjusting sys-tem. The system could try to adjust the stride detection, by using the distancebetween absolute locations and divide them by the steps walked in between.
140
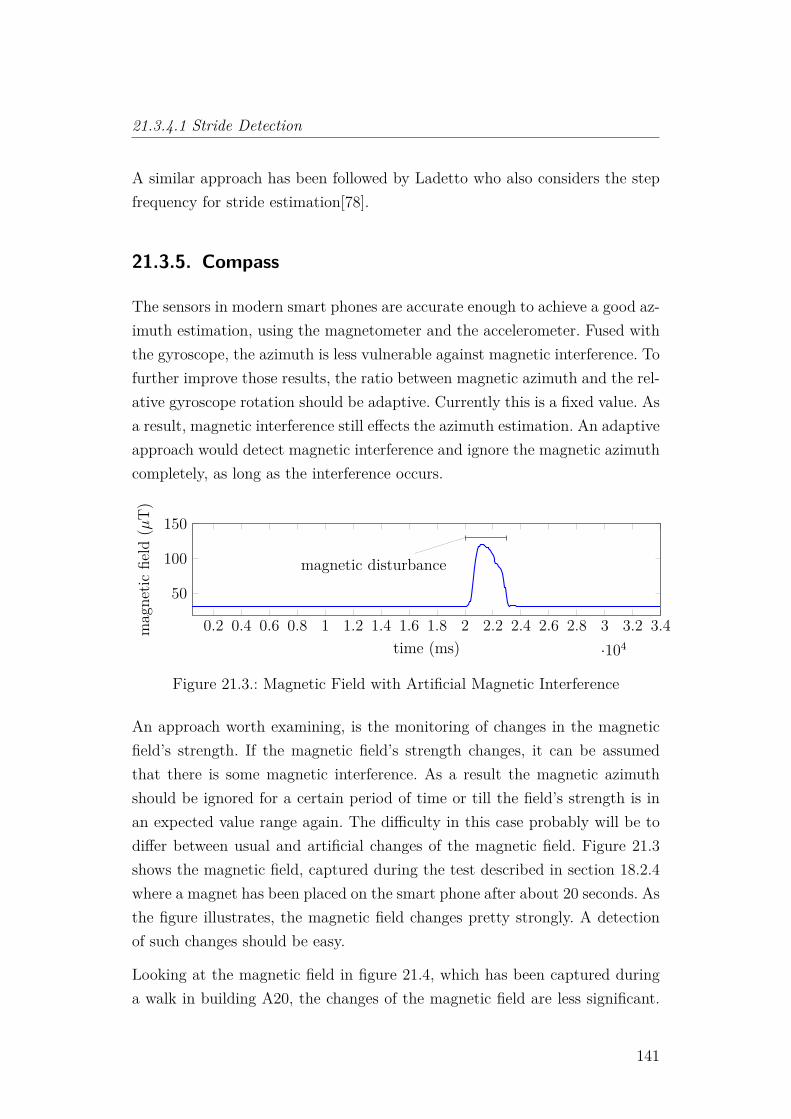
21.3.4.1 Stride Detection
A similar approach has been followed by Ladetto who also considers the stepfrequency for stride estimation[78].
21.3.5. Compass
The sensors in modern smart phones are accurate enough to achieve a good az-imuth estimation, using the magnetometer and the accelerometer. Fused withthe gyroscope, the azimuth is less vulnerable against magnetic interference. Tofurther improve those results, the ratio between magnetic azimuth and the rel-ative gyroscope rotation should be adaptive. Currently this is a fixed value. Asa result, magnetic interference still effects the azimuth estimation. An adaptiveapproach would detect magnetic interference and ignore the magnetic azimuthcompletely, as long as the interference occurs.
0.2 0.4 0.6 0.8 1 1.2 1.4 1.6 1.8 2 2.2 2.4 2.6 2.8 3 3.2 3.4·104
50
100
150
magnetic disturbance
time (ms)
magnetic
field
(µT)
Figure 21.3.: Magnetic Field with Artificial Magnetic Interference
An approach worth examining, is the monitoring of changes in the magneticfield’s strength. If the magnetic field’s strength changes, it can be assumedthat there is some magnetic interference. As a result the magnetic azimuthshould be ignored for a certain period of time or till the field’s strength is inan expected value range again. The difficulty in this case probably will be todiffer between usual and artificial changes of the magnetic field. Figure 21.3shows the magnetic field, captured during the test described in section 18.2.4where a magnet has been placed on the smart phone after about 20 seconds. Asthe figure illustrates, the magnetic field changes pretty strongly. A detectionof such changes should be easy.
Looking at the magnetic field in figure 21.4, which has been captured duringa walk in building A20, the changes of the magnetic field are less significant.
141
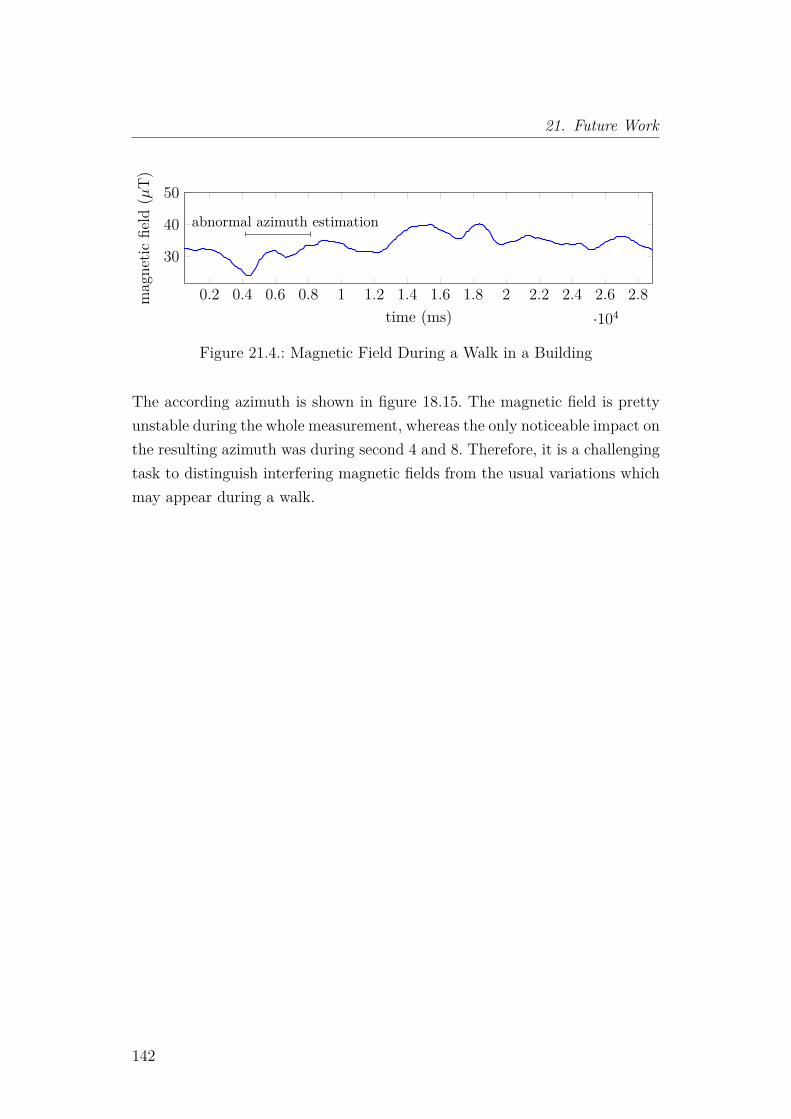
21. Future Work
0.2 0.4 0.6 0.8 1 1.2 1.4 1.6 1.8 2 2.2 2.4 2.6 2.8·104
30
40
50
abnormal azimuth estimation
time (ms)
magnetic
field
(µT)
Figure 21.4.: Magnetic Field During a Walk in a Building
The according azimuth is shown in figure 18.15. The magnetic field is prettyunstable during the whole measurement, whereas the only noticeable impact onthe resulting azimuth was during second 4 and 8. Therefore, it is a challengingtask to distinguish interfering magnetic fields from the usual variations whichmay appear during a walk.
142
22. Final Words
This thesis, as well as other researches, shows that indoor and outdoor naviga-tion and positioning is still a challenging topic. Even though, the capabilitiesof smart phones have been improved dramatically over the past few years, theapproaches used for indoor positioning are still based on thoughts made 14years ago[39], a time were smart phones did not even exist.
Also interesting is the fact that there seems to be little effort in developing areliable smart phone compass for indoor purposes. An approach, which weightsgyroscope and magnetic compass, based on assumed magnetic interference,seems to be obvious. Nevertheless, no research paper or product has beenfound which claims to use such a method.
In the near future, advancements in indoor positioning are expectable. Thanksto Apple’s iBeacon specification, accurate indoor positioning will probably findits way out of the university environment into real-world applications. On thebasis of cheap, standardized, battery-powered iBeacon senders, accurate indoorpositioning systems are possible for the masses. Sooner or later, iBeacon islikely to be used in many public places such as shopping centers, train stationsor airports. The main usage will probably be location-aware advertising, butthis infrastructure also enables more useful usages, like indoor navigation.
With spread of an indoor positioning system like iBeacon, existing indoor mapsand navigation will likely be improved too. Nevertheless, the project describedin this thesis will still have eligibility as it examines a perspective which isusually ignored: The perspective of visually impaired users.
143
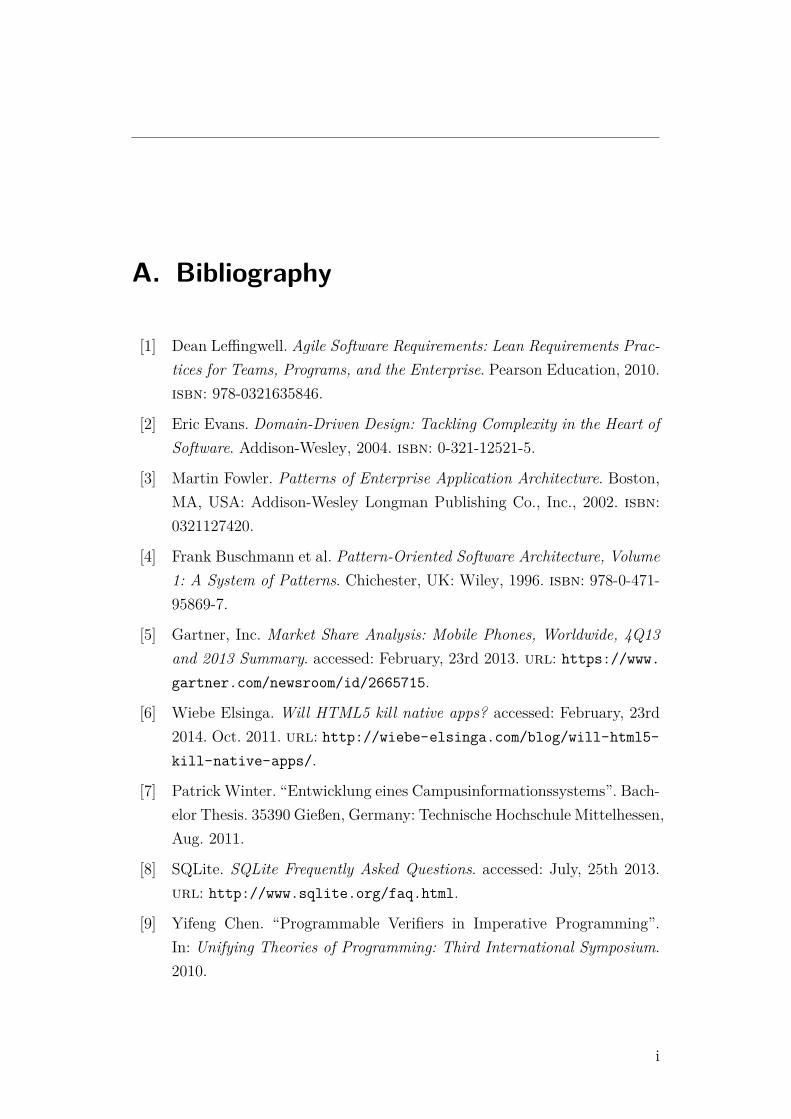
A. Bibliography
[1] Dean Leffingwell. Agile Software Requirements: Lean Requirements Prac-tices for Teams, Programs, and the Enterprise. Pearson Education, 2010.isbn: 978-0321635846.
[2] Eric Evans. Domain-Driven Design: Tackling Complexity in the Heart ofSoftware. Addison-Wesley, 2004. isbn: 0-321-12521-5.
[3] Martin Fowler. Patterns of Enterprise Application Architecture. Boston,MA, USA: Addison-Wesley Longman Publishing Co., Inc., 2002. isbn:0321127420.
[4] Frank Buschmann et al. Pattern-Oriented Software Architecture, Volume1: A System of Patterns. Chichester, UK: Wiley, 1996. isbn: 978-0-471-95869-7.
[5] Gartner, Inc. Market Share Analysis: Mobile Phones, Worldwide, 4Q13and 2013 Summary. accessed: February, 23rd 2013. url: https://www.gartner.com/newsroom/id/2665715.
[6] Wiebe Elsinga. Will HTML5 kill native apps? accessed: February, 23rd2014. Oct. 2011. url: http://wiebe-elsinga.com/blog/will-html5-kill-native-apps/.
[7] Patrick Winter. “Entwicklung eines Campusinformationssystems”. Bach-elor Thesis. 35390 Gießen, Germany: Technische Hochschule Mittelhessen,Aug. 2011.
[8] SQLite. SQLite Frequently Asked Questions. accessed: July, 25th 2013.url: http://www.sqlite.org/faq.html.
[9] Yifeng Chen. “Programmable Verifiers in Imperative Programming”.In: Unifying Theories of Programming: Third International Symposium.2010.
i
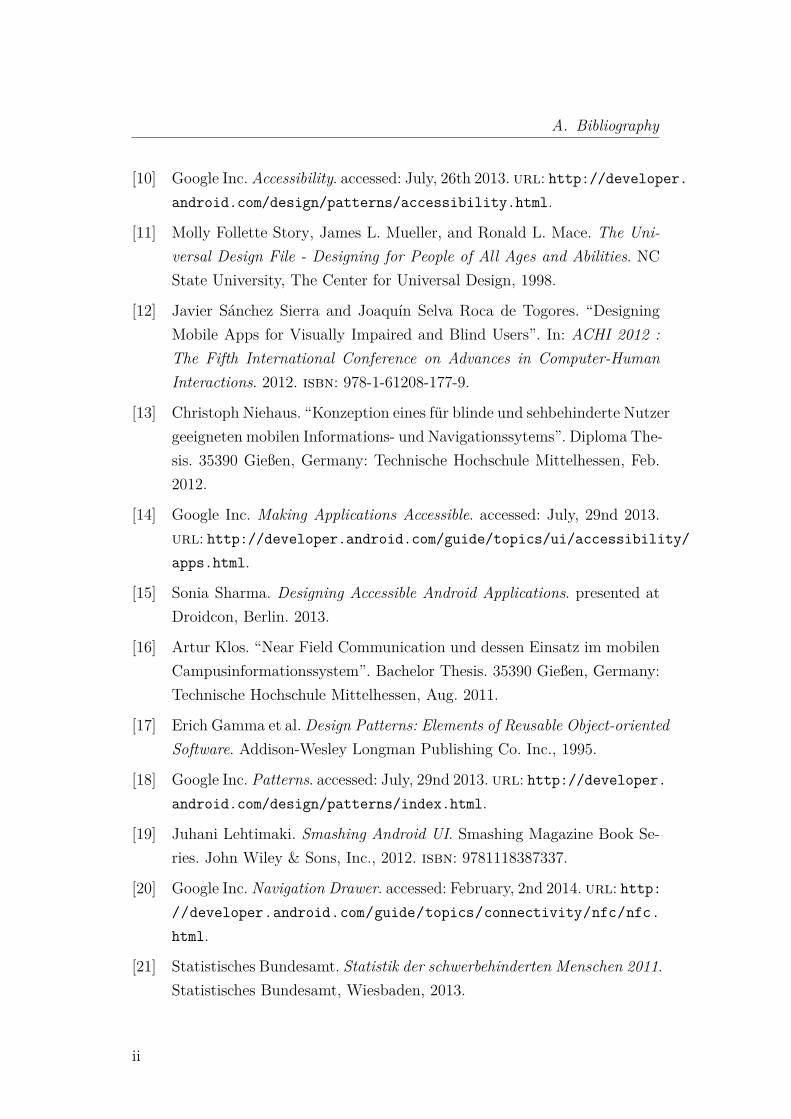
A. Bibliography
[10] Google Inc. Accessibility. accessed: July, 26th 2013. url: http://developer.android.com/design/patterns/accessibility.html.
[11] Molly Follette Story, James L. Mueller, and Ronald L. Mace. The Uni-versal Design File - Designing for People of All Ages and Abilities. NCState University, The Center for Universal Design, 1998.
[12] Javier Sánchez Sierra and Joaquín Selva Roca de Togores. “DesigningMobile Apps for Visually Impaired and Blind Users”. In: ACHI 2012 :The Fifth International Conference on Advances in Computer-HumanInteractions. 2012. isbn: 978-1-61208-177-9.
[13] Christoph Niehaus. “Konzeption eines für blinde und sehbehinderte Nutzergeeigneten mobilen Informations- und Navigationssytems”. Diploma The-sis. 35390 Gießen, Germany: Technische Hochschule Mittelhessen, Feb.2012.
[14] Google Inc. Making Applications Accessible. accessed: July, 29nd 2013.url: http://developer.android.com/guide/topics/ui/accessibility/apps.html.
[15] Sonia Sharma. Designing Accessible Android Applications. presented atDroidcon, Berlin. 2013.
[16] Artur Klos. “Near Field Communication und dessen Einsatz im mobilenCampusinformationssystem”. Bachelor Thesis. 35390 Gießen, Germany:Technische Hochschule Mittelhessen, Aug. 2011.
[17] Erich Gamma et al.Design Patterns: Elements of Reusable Object-orientedSoftware. Addison-Wesley Longman Publishing Co. Inc., 1995.
[18] Google Inc. Patterns. accessed: July, 29nd 2013. url: http://developer.android.com/design/patterns/index.html.
[19] Juhani Lehtimaki. Smashing Android UI. Smashing Magazine Book Se-ries. John Wiley & Sons, Inc., 2012. isbn: 9781118387337.
[20] Google Inc. Navigation Drawer. accessed: February, 2nd 2014. url: http://developer.android.com/guide/topics/connectivity/nfc/nfc.html.
[21] Statistisches Bundesamt. Statistik der schwerbehinderten Menschen 2011.Statistisches Bundesamt, Wiesbaden, 2013.
ii
[22] Google Inc. What is indoor Google Maps? accessed: November, 26th2013. 2013. url: https://maps.google.com/help/maps/indoormaps/.
[23] OpenStreetMap Foundation. OpenStreetMap stats report. accessed: Jan-uary, 28th 2013. url: http://www.openstreetmap.org/stats/data_stats.html.
[24] OpenStreetMap Foundation. IndoorOSM. accessed: January, 28th 2013.url: http://wiki.openstreetmap.org/wiki/IndoorOSM.
[25] OpenStreetMap Foundation. Elements. accessed: January, 28th 2013.url: http://wiki.openstreetmap.org/wiki/Elements.
[26] OpenStreetMap Foundation. JOSM. accessed: January, 28th 2013. url:http://josm.openstreetmap.de/.
[27] Per Enge and Pratap Misra. “Special Issue on Global Positioning Sys-tem”. In: Proceedings of the IEEE, Vol. 87. 1999.
[28] Federal Aviation Administration. Civil Report Card On GPS Perfor-mance August 2013. Aug. 2013.
[29] GSM Association and A.T. Kearney. European Mobile Industry Obser-vatory 2011. Nov. 2011.
[30] Tomislav Kos, Mislav Grgic, and Gordan Sisul. “Mobile User Positioningin GSM/UMTS Cellular Networks”. In: 48th International SymposiumELMAR-2006, Zadar, Croatia. June 2006.
[31] Mohamed Ibrahim and Moustafa Youssef. “CellSense: A ProbabilisticRSSI-based GSM Positioning System”. In: Proceedings of the GlobalCommunications Conference. 2010.
[32] Wi-Fi Alliance. The Wi-Fi Brand. accessed: December, 23rd 2013. url:http://www.wi-fi.org/about/wi-fi-brand.
[33] Mozilla Foundation. Mozilla Location Service - Overview. accessed: De-cember, 23rd 2013. url: https://location.services.mozilla.com/.
[34] Apple Inc. iOS 7: Understanding Location Services. accessed: December,23rd 2013. 2013. url: http://support.apple.com/kb/HT5594.
[35] Cisco Systems, Inc. Wi-Fi Location-Based Services 4.1 Design Guide.May 2008.
iii
A. Bibliography
[36] Kensaku Kawauchi, Takashi Miyaki, and Jun Rekimoto. “DirectionalBeaconing: A Robust WiFi Positioning Method Using Angle-of-EmissionInformation”. In: Location and Context Awareness, 4th InternationalSymposium, LoCA 2009. 2009.
[37] Marc Ciurana, David López, and Francisco Barceló-Arroyo. “SofTOA:Software Ranging for TOA-Based Positioning of WLAN Terminals”. In:Location and Context Awareness, 4th International Symposium, LoCA2009. 2009.
[38] Moustafa Youssef and Ashok Agrawala. “The Horus WLAN LocationDetermination System”. In: Proceedings of the 3rd International Confer-ence on Mobile Systems, Applications, and Services. MobiSys ’05. 2005,pp. 205–218.
[39] Paramvir Bahl and Venkata N. Padmanabhan. RADAR: An In-BuildingRF-based User Location and Tracking System. Tech. rep. Microsoft Re-search, 2000.
[40] Yongguang Chen and Hisashi Kobayashi. Signal Strength Based IndoorGeolocation. Tech. rep. Princeton University, 2002.
[41] Ville Honkavirta, Tommi Peraläand Robert Ali-Löytty, and Robert Piché.“A Comparative Survey of WLAN Location Fingerprinting Methods”.In: Processdings of the 6th Workgroup on Positioning, Navigation andCommunication 2009. 2009.
[42] Hendrik Lemelson et al. “Error Estimation for Indoor 802.11 LocationFingerprinting”. In: Location and Context Awareness. 2009.
[43] Rainer Mautz and Sebastian Tilch. “Survey of Optical Indoor PositioningSystems”. MA thesis. ETH Zürich, 2011.
[44] Harlan Hile and Gaetano Borriello. “Positioning and Orientation in In-door Environments Using Camera Phones”. In: 28.4 (Aug. 2008), pp. 32–39.
[45] Sebastian Tilch. “CLIPS - Development of a Novel Camera and Laser-Based Indoor Positioning System”. PhD thesis. ETH Zürich, 2012.
[46] Peter Brída. “Location Technologies For GSM”. In: TRANSCOM. 2003,pp. 119–122.
iv
[47] Winfried Böhm. Handbuch der Navigation. Begriffe, Formeln, Verfahren,Schemata. Busse-Seewald Verlag, 1978, p. 246.
[48] Anthony Mandow et al. “Experimental kinematics for wheeled skid-steermobile robots”. In: Proceedings of the 2007 IEEE/RSJ InternationalConference on Intelligent Robots and Systems San Diego, CA, USA, Oct29 - Nov 2, 2007. 2007.
[49] Andrea Bonarini, Matteo Matteucci, and Marcello Restelli. “A Kinematic-independent Dead-reckoning Sensor for Indoor Mobile Robotics”. In:Proceedings of 2004 IEEElRSJ International Conference on IntelligentRobots and Systems. Politecnico di Milano. 2004.
[50] Jó Ágila Bitsch Link et al. “FootPath: Accurate map-based indoor navi-gation using smartphones”. In: Indoor Positioning and Indoor Navigation(IPIN), 2011 International Conference on. 2011.
[51] Stéphane Beauregard and Harald Haas. “Pedestrian Dead Reckoning: ABasis for Personal Positioning”. In: Proceedings of the 3rd Workshop onPositioning, Navigation and Communication (WPNC’06). 2006.
[52] Christopher Drane, Malcolm Macnaughtan, and Craig Scott. “Position-ing GSM Telephones”. In: IEEE Communications Magazine. Apr. 1998.
[53] Maximilian von Piechowski. “Evaluation von Technologien und Verfahrenzur hybriden Indoor-Lokalisierung für Android basierte mobile Geräte”.Bachelor Thesis. 35390 Gießen, Germany: Technische Hochschule Mit-telhessen, Mar. 2012.
[54] Verwaltungsgericht Köln. Urteil vom 17. Juli 2013 - Az. 21 K 2589/12.July 2013.
[55] Google Inc. NFC Basics. accessed: July, 22nd 2013. url: http : / /developer.android.com/guide/topics/connectivity/nfc/nfc.html.
[56] Thomas King et al. “COMPASS: A Probabilistic Indoor Positioning Sys-tem Based on 802.11 and Digital Compasses”. In: Proc. of the FirstACM International Workshop on Wireless Network Testbeds, Experimen-tal Evaluation and Characterization (WiNTECH). 2006.
v
A. Bibliography
[57] Antonio del Corte-Valiente, Jose Manuel Gómez-Pulido, and Oscar Gutiérrez-Blanco. “Efficient Techniques and Algorithms for Improving Indoor Lo-calization Precision on WLAN Networks Applications”. In: Int. J. Com-munications, Network and System Sciences. 2009.
[58] Julia Letchner, Dieter Fox, and Anthony LaMarca. “Large-Scale Local-ization from Wireless Signal Strength”. In: American Association forArtificial Intelligence. 2005.
[59] Anja Bekkelien. “Bluetooth Indoor Positioning”. MA thesis. Universityof Geneva, 2012.
[60] Moustafa Amin Abdel Azim Yousief Abdel Rehim. “HORUS: A WLAN-BASED INDOOR LOCATION DETERMINATION SYSTEM”. PhDthesis. University of Maryland, 2004.
[61] Douglas M. Hawkins. “The Problem of Overfitting”. In: J. Chem. Inf.Comput. Sci. 44 (2004), pp. 1–12.
[62] Daniel T. Larose. Discovering Knowledge in Data: An Introduction toData Mining. John Wiley & Sons, 2005, pp. 96–106.
[63] Jeong Won Kim et al. “A Step, Stride and Heading Determination forthe Pedestrian Navigation System”. In: Journal of Global PositioningSystems 3 (2004), pp. 273–279.
[64] Oliver J. Woodman. “Pedestrian localisation for indoor environments”.PhD thesis. University of Cambridge, 2010.
[65] H. Ying et al. “Automatic Step Detection in the Accelerometer Signal”.In: 4th International Workshop on Wearable and Implantable Body Sen-sor Networks (BSN 2007). 2007.
[66] Ubejd Shala and Angel Rodriguez. Indoor Positioning using Sensor-fusion in Android Devices. Sept. 2011.
[67] Y Sun, M P Wu, and X P Hu. “A NewSolution Algorithm of MagneticAzimuth”. In: Journal of Physics: Conference Series 48 (2006), pp. 111–116.
[68] Google Inc. SensorEvent. accessed: July, 29nd 2013. url: https : / /developer.android.com/reference/android/hardware/SensorEvent.html.
vi
[69] Mary Natrella. NIST/SEMATECH e-Handbook of Statistical Methods.Ed. by Charline Cleraux et al. NIST/SEMATECH, Oct. 2013. url:http://www.itl.nist.gov/div898/handbook/index.htm.
[70] Shahid Ayub, Alireza Bahraminisaab, and Bahram Honary. “A SensorFusion Method for Smart phone Orientation Estimation”. In: 13th An-nual Post Graduate Symposium on the Convergence of Telecommunica-tions, Networking and Broadcasting. 2012.
[71] Paul Lawitzki. “Application of Dynamic Binaural Signals in AcousticGames”. MA thesis. Stuttgart Media University, Mar. 2012.
[72] Jeffrey R. Blum, Daniel G. Greencorn, and Jeremy R. Cooperstock.“Smartphone sensor reliability for augmented reality applications”. MAthesis. McGill University, Montréal, Québec, Canada, 2011.
[73] Yasutaka Fuke and Eric Krotkov. “Dead Reckoning for a Lunar Rover onUneven Terrain”. In: Proceedings of the 1996 IEEE International Con-ference on Robotics and Automation Minneapolis, Minnesota. Apr. 1996,pp. 411–413.
[74] Google Inc. Google Cloud Messaging for Android. accessed: January, 29th2013. url: https://developer.android.com/google/gcm/index.html.
[75] Bluetooth SIG, Inc. Bluetooth Smart Technology: Powering the Inter-net of Things. accessed: January, 31st 2014. 2013. url: http://www.bluetooth.com/Pages/Bluetooth-Smart.aspx.
[76] Qualcomm Inc. Gimbal: Context Awareness and Proximity for HighlyRelevant Consumer Engagements. accessed: January, 31st 2014. 2013.url: http://www.qualcomm.com/solutions/gimbal.
[77] Qualcomm Inc. Qualcomm Announces Availability of its Gimbal Proxim-ity Beacons to Enable Customer Engagement Based on Micro Location.accessed: January, 31st 2014. Dec. 2013. url: http://www.qualcomm.com/solutions/gimbal.
[78] Quentin Ladetto. “On foot navigation: continuous step calibration usingboth complementary recursive prediction and adaptive Kalman filter-ing”. In: Proceedings of the 13th International Technical Meeting of the
vii

A. Bibliography
Satellite Division of The Institute of Navigation. ION GPS 2000. 2000,pp. 1735–1740.
viii
B. Glossary
Activity (Android Term) is a single, focused thing that the user in an Androidapplication can do. Usually Activity classes take care of creating a win-dow which holds the user interface. Therefore, the term Activity is oftenused equivalent to graphical user interface . . . . . . . . . . . . . . . . . . . . . . . . . . . . .
Activity Chooser Android Term enables the user to choose an Activity whichprocess a given Intent. Will be launched if the description of an Intentfits to multiple Activities . . . . . . . . . . . . . . . . . . . . . . . . . . . . . . . . . . . . . . . . . . . . . .
Android is an operating system based on Linux, targeting mobile, touchscreendevices like smart phones or tablet computers. Initially developed by theAndroid, Inc. and bought by Google Inc. in 2005 . . . . . . . . . . . . . . . . . . . . . .
Android Support Library is a set of code libraries that provide features fromnewer Android API Levels to older API Levels. Due to the library, devel-opers are able to use features like ActionBar which have been introducedin Android 3.0 on devices running Android 2.1 . . . . . . . . . . . . . . . . . . . . . . . .
API level Android Term describes the version of Android’s official applicationprogramming interface. Current API level of Android is 19, as of March11th, 2014. API Level 19 is provided by Android 4.4 . . . . . . . . . . . . . . . . . . .
Beacon is a management frame in the IEEE 802.11 Wi-Fi specification. Itis sent periodically to announce the presence of a Wi-Fi access point.It contains information about the SSID, BSSID and other connectivityinformation. It is also used to determine the received signal strengthindication (RSSI). . . . . . . . . . . . . . . . . . . . . . . . . . . . . . . . . . . . . . . . . . . . . . . . . . . . . .
BSSID short form of basic service set identification. It is a unique identifierof a wireless access point, equivalent to its MAC address. . . . . . . . . . . . . . .
ix
Glossary
dp Android Term density-based pixel. A unit to describe UI elements in An-droid. It is density-based which means that it scales with the density ofthe screen. . . . . . . . . . . . . . . . . . . . . . . . . . . . . . . . . . . . . . . . . . . . . . . . . . . . . . . . . . . . .
hybrid application a web-based mobile application which has been packagedto a native application by using the native plattform’s SDK. The actualapplication is written with web technologies, usually HTML5, JavaScriptand CSS. Third party frameworks like PhoneGap allow a hybrid appli-cation to access native SDK features via JavaScript. . . . . . . . . . . . . . . . . . . .
Intent Android Term an abstract description of an operation to be performedin Android. Often used to start an Activity or communicate betweendifferent components of an Android application or even between differentAndroid applications . . . . . . . . . . . . . . . . . . . . . . . . . . . . . . . . . . . . . . . . . . . . . . . . . .
MySQL is a widely used open-source relational database management system.Today it is owned by Oracle Corporation . . . . . . . . . . . . . . . . . . . . . . . . . . . . . .
Push Message describes messages which are pushed to a device. This meansthat the publisher of the message initiates the communication to theclient. It is the opposite to pull messages, where the request for trans-mission of information is initiated by the receiver. . . . . . . . . . . . . . . . . . . . . .
REST API REST is the short form for representational state transfer. It wasinitially described in the context of HTTP. The main principle of RESTare stateless messages between client and server. Therefore, any messagehas to send a representation of the current state to enable the receiver toprocess the message correctly. Today’s REST APIs are usually adressablevia HTTP and use JSON or XML for data exchange. . . . . . . . . . . . . . . . . . .
RFID short form of radio-frequency identification. Describes the wireless non-contact use of radio-frequency electromagnetic fields to transfer data.The data usually is used to automatically identify or track objects whichhave been marked with an RFID tag . . . . . . . . . . . . . . . . . . . . . . . . . . . . . . . . . .
x
Glossary
self-voicing applications provide an aural interface without the need of ascreen reader application. . . . . . . . . . . . . . . . . . . . . . . . . . . . . . . . . . . . . . . . . . . . . .
SQLite is a relational database management system. In contrast to otherdatabase management systems, it does not run in a separate process.Therefore, it is used embedded in applications. . . . . . . . . . . . . . . . . . . . . . . . .
SSID shortform of service set identifier. It is a 1 to 32 byte string to describea wireless access point in a human-readable form.. . . . . . . . . . . . . . . . . . . . . .
UMBmark is the short form for University of Michigan Benchmark. It is amethod to measure and compare robot positioning approaches. . . . . . . . .
xi
Copyright © 2022 FDOKUMEN

