


Bahasa
Halaman
Hukum

Development and implementation of a high-performance, cardiac-gated dual-energy imaging system
N. A. Shkumat,a J. H. Siewerdsen,*a,b A. C. Dhanantwari,b D. B. Williams,bS. Richard,a D. J. Tward,a N. S. Paul,c J. Yorkston,d and R. Van Metterd
aDepartment of Medical Biophysics, University of Toronto, Toronto, ON, Canada M5G 2M9 bOntario Cancer Institute, Princess Margaret Hospital, Toronto, ON, Canada M5G 2M9
cDepartment of Medical Imaging, Princess Margaret Hospital, Toronto, ON, Canada M5G 2M9 dEastman Kodak Company, Rochester, NY, USA 14650
ABSTRACT
Mounting evidence suggests that the superposition of anatomical clutter in a projection radiograph poses a major impediment to the detectability of subtle lung nodules. Through decomposition of projections acquired at multiple kVp, dual-energy (DE) imaging offers to dramatically improve lung nodule detectability and, in part through quantitation of nodule calcification, increase specificity in nodule characterization. The development of a high-performance DE chest imaging system is reported, with design and implementation guided by fundamental imaging performance metrics. A diagnostic chest stand (Kodak RVG 5100 digital radiography system) provided the basic platform, modified to include: (i) a filter wheel, (ii) a flat-panel detector (Trixell Pixium 4600), (iii) a computer control and monitoring system for cardiac-gated acquisition, and (iv) DE image decomposition and display. Computational and experimental studies of imaging performance guided optimization of key acquisition technique parameters, including: x-ray filtration, allocation of dose between low- and high-energy projections, and kVp selection. A system for cardiac-gated acquisition was developed, directing x-ray exposures to within the quiescent period of the heart cycle, thereby minimizing anatomical misregistration. A research protocol including 200 patients imaged following lung nodule biopsy is underway, allowing preclinical evaluation of DE imaging performance relative to conventional radiography and low-dose CT.
Keywords: dual-energy imaging, flat-panel detector, imaging performance, image quality, imaging dose, optimization, image acquisition technique, cardiac gating, thoracic imaging, lung cancer
1. INTRODUCTION Dual-energy (DE) imaging offers a potentially sensitive, specific, and cost-effective modality for a host of diagnostic and interventional imaging applications. This work describes the development and optimization of a DE chest imaging platform focused on the detection and characterization of lung nodules. Improvements in both sensitivity and specificity can be achieved by selectively decomposing “bone” and “soft-tissue” components from projections taken at low- and high-kVp.2-4 Such decomposition enhances the detectability of subtle pulmonary nodules through a reduction of anatomical noise and improves nodule characterization through visualization of calcified structures, an indicator of benignancy.5,6 While the potential advantages offered by DE imaging have been recognized for decades, clinical implementation has been limited in part by the lack of a high-performance detector. The advent of large-area, flat-panel detectors (FPDs) offering rapid readout and high detective quantum efficiency (DQE) presents an opportunity to realize the full potential of DE imaging and implement high-performance DE imaging systems consistent with the demands of thoracic imaging. In this paper, we discuss: (i) the design of an FPD-based, cardiac-gated DE imaging system, (ii) the optimization of imaging techniques for lung nodule detection at total imaging dose equal to or less than that of a conventional radiograph, and (iii) the implementation of a clinical prototype in patient imaging trials designed to characterize the sensitivity and specificity of DE imaging relative to conventional radiography and low-dose CT.
*Corresponding author: J. H. Siewerdsen, Ph.D., [email protected]; Phone: 416-946-4501 x5516; Fax: 416-946-6529; Ontario Cancer Institute (Rm 7-502), Princess Margaret Hospital, University Health Network, 610 University Ave., Toronto, ON, Canada M5G 2M9
Medical Imaging 2007: Physics of Medical Imaging, edited by Jiang Hsieh, Michael J. Flynn, Proc. of SPIE Vol. 6510, 651006, (2007) · 1605-7422/07/$18 · doi: 10.1117/12.713680
Proc. of SPIE Vol. 6510 651006-1
2. DEVELOPMENT OF A HIGH-PERFORMANCE, CARDIAC-GATED DUAL-ENERGY IMAGING SYSTEM
2.1 System design and implementation
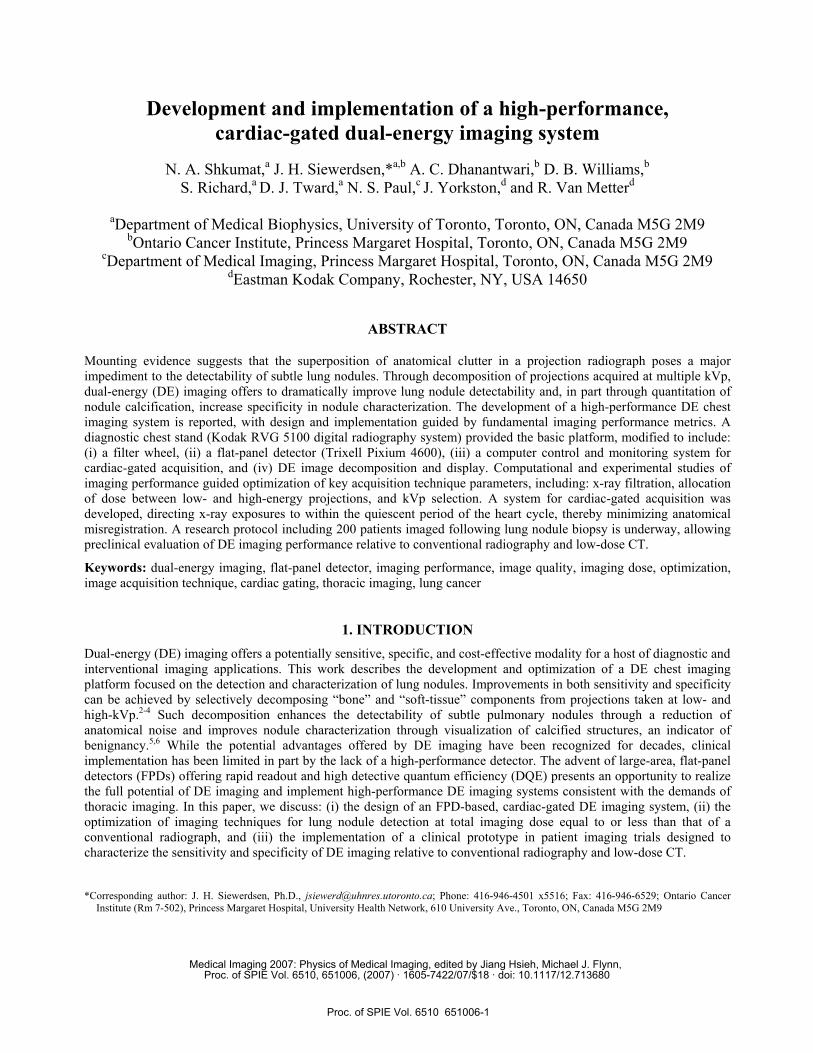
The DE imaging system is shown in Fig. 1, illustrating the patient setup as in a conventional PA chest exam. The basic platform for development was a RVG 5100 digital radiography chest stand (Eastman Kodak Company, Rochester, NY), with several modifications implemented for DE image acquisition, including: (i) a computer-controlled filter wheel allowing differential low- and high-kVp filter selection, (ii) a large-area FPD (Trixell Pixium 4600; 250 mg/cm2 CsI:Tl scintillator, 3121 3121 pixel format, 143 m pixel pitch), (iii) a system for cardiac-gated image acquisition, and (iv) advanced pre- and post-processing algorithms for image decomposition, registration, noise-reduction, pixel value normalization, and display.
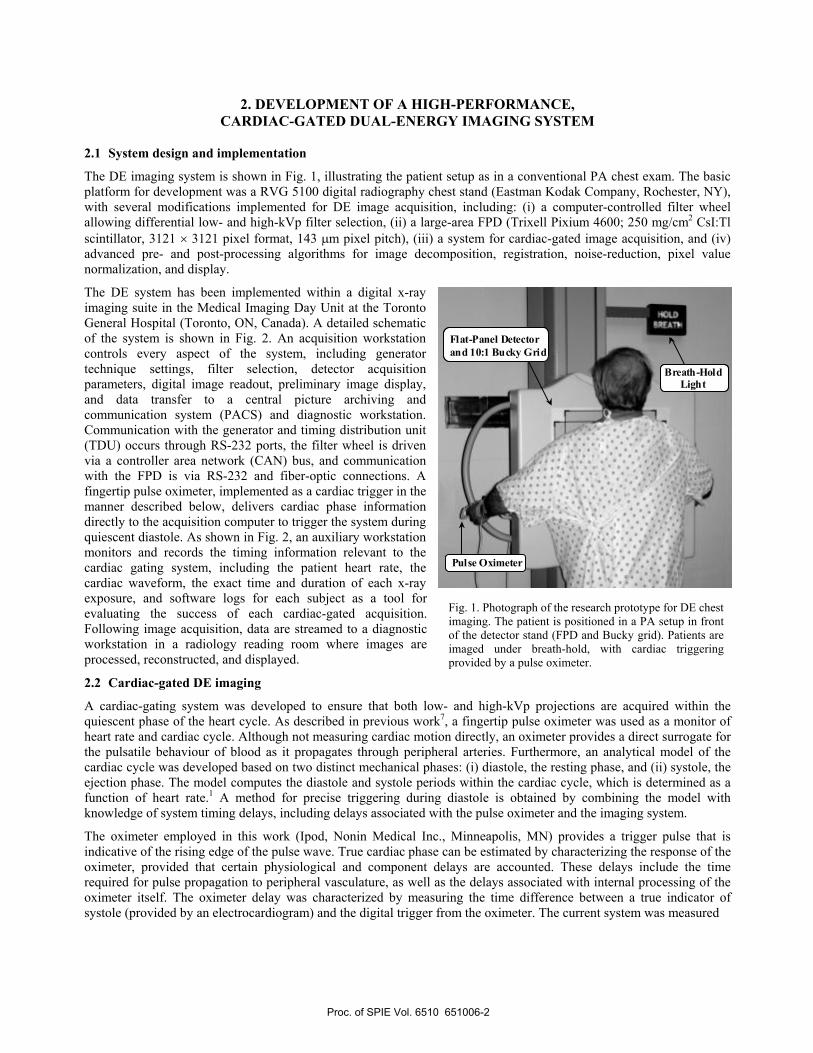
The DE system has been implemented within a digital x-ray imaging suite in the Medical Imaging Day Unit at the Toronto General Hospital (Toronto, ON, Canada). A detailed schematic of the system is shown in Fig. 2. An acquisition workstation controls every aspect of the system, including generator technique settings, filter selection, detector acquisition parameters, digital image readout, preliminary image display, and data transfer to a central picture archiving and communication system (PACS) and diagnostic workstation. Communication with the generator and timing distribution unit (TDU) occurs through RS-232 ports, the filter wheel is driven via a controller area network (CAN) bus, and communication with the FPD is via RS-232 and fiber-optic connections. A fingertip pulse oximeter, implemented as a cardiac trigger in the manner described below, delivers cardiac phase information directly to the acquisition computer to trigger the system during quiescent diastole. As shown in Fig. 2, an auxiliary workstation monitors and records the timing information relevant to the cardiac gating system, including the patient heart rate, the cardiac waveform, the exact time and duration of each x-ray exposure, and software logs for each subject as a tool for evaluating the success of each cardiac-gated acquisition. Following image acquisition, data are streamed to a diagnostic workstation in a radiology reading room where images are processed, reconstructed, and displayed.
2.2 Cardiac-gated DE imaging
A cardiac-gating system was developed to ensure that both low- and high-kVp projections are acquired within the quiescent phase of the heart cycle. As described in previous work7, a fingertip pulse oximeter was used as a monitor of heart rate and cardiac cycle. Although not measuring cardiac motion directly, an oximeter provides a direct surrogate for the pulsatile behaviour of blood as it propagates through peripheral arteries. Furthermore, an analytical model of the cardiac cycle was developed based on two distinct mechanical phases: (i) diastole, the resting phase, and (ii) systole, the ejection phase. The model computes the diastole and systole periods within the cardiac cycle, which is determined as a function of heart rate.1 A method for precise triggering during diastole is obtained by combining the model with knowledge of system timing delays, including delays associated with the pulse oximeter and the imaging system.
The oximeter employed in this work (Ipod, Nonin Medical Inc., Minneapolis, MN) provides a trigger pulse that is indicative of the rising edge of the pulse wave. True cardiac phase can be estimated by characterizing the response of the oximeter, provided that certain physiological and component delays are accounted. These delays include the time required for pulse propagation to peripheral vasculature, as well as the delays associated with internal processing of the oximeter itself. The oximeter delay was characterized by measuring the time difference between a true indicator of systole (provided by an electrocardiogram) and the digital trigger from the oximeter. The current system was measured
Fig. 1. Photograph of the research prototype for DE chest imaging. The patient is positioned in a PA setup in front of the detector stand (FPD and Bucky grid). Patients are imaged under breath-hold, with cardiac triggering provided by a pulse oximeter.
Breath-HoldLight
Pulse Oximeter
Flat-Panel Detectorand 10:1 Bucky Grid
Breath-HoldLight
Breath-HoldLight
Pulse Oximeter
Flat-Panel Detectorand 10:1 Bucky GridFlat-Panel Detectorand 10:1 Bucky Grid
Proc. of SPIE Vol. 6510 651006-2
0 5 10 15 20 25 30 35 40 450
20
40
60
80
100
120
Time (s)
HR(bpm)
Pat041: Monitored HR, (time between exposures = 7.453 s)
Pleth HRInstantaneous HRX-ray ON
6.5 7 7.5 8 8.5 90
0.5
1
1.5
2
2.5
3
3.5
4
4.5Exposure 1: kVp = 60, mA = 400.0, ms = 13.0
Time (s)
Signal(Arb.Units)
HR (bpm) = 81PPD (ms) = 383TD (ms) = 719
Green PerfusionDiastole RegionX-ray ON
14 14.5 15 15.5 16 16.50
0.5
1
1.5
2
2.5
3
3.5
4
4.5Exposure 2: kVp = 120, mA = 630.0, ms = 40.0
Time (s)
Signal(Arb.Units)
HR (bpm) = 74PPD (ms) = 466TD (ms) = 797
Green PerfusionDiastole RegionX-ray ON
Timing Distribution
Unit Generator
X-RayTube
Acquisition Workstation
Collimator with Filter Wheel
TTLRS-232
Fibre Optic
CAN BUS RS-232
TTL
RS-232
High Voltage
Pulse Oximeter
Trigger Monitoring
Ethernet
Diagnostic Workstation
Flat Panel Detector
10:1 Bucky Grid
Fig. 2. Schematic layout of the DE imaging system. The system is controlled by the acquisition workstation, which initiates x-ray exposure via the TDU/generator coincident with the diastolic period of the cardiac cycle. The TDU synchronizes x-ray exposure, detector readout, and requests from the acquisition station. An auxiliary trigger monitor records the cardiac cycle, heart rate, x-ray exposure, etc. for retrospective analysis. The low- and high-energy images are transferred to a diagnostic workstation for image decomposition and display.
to have a delay, ttrigger = (407 24) ms from the true start of systole.7 This delay is larger than the ~275 ms associated with physical pulse propagation to the fingertip and is likely due to additional processing time within the oximeter.
The imaging system also introduces a variety of delays that must be considered in the triggering of each x-ray exposure. The foremost of these is associated with the FPD, which requires a variable amount of time to initialize for x-ray exposure. Additional delays include those associated with the generator, tube, anti-scatter grid, and software. In this work, the total system delay was characterized according to two components: the minimum delay (tmin) and the delay range (trange). For the current system, tmin = 250 ms, and trange = 150 ms, resulting in a total system delay of (250–400) ms.
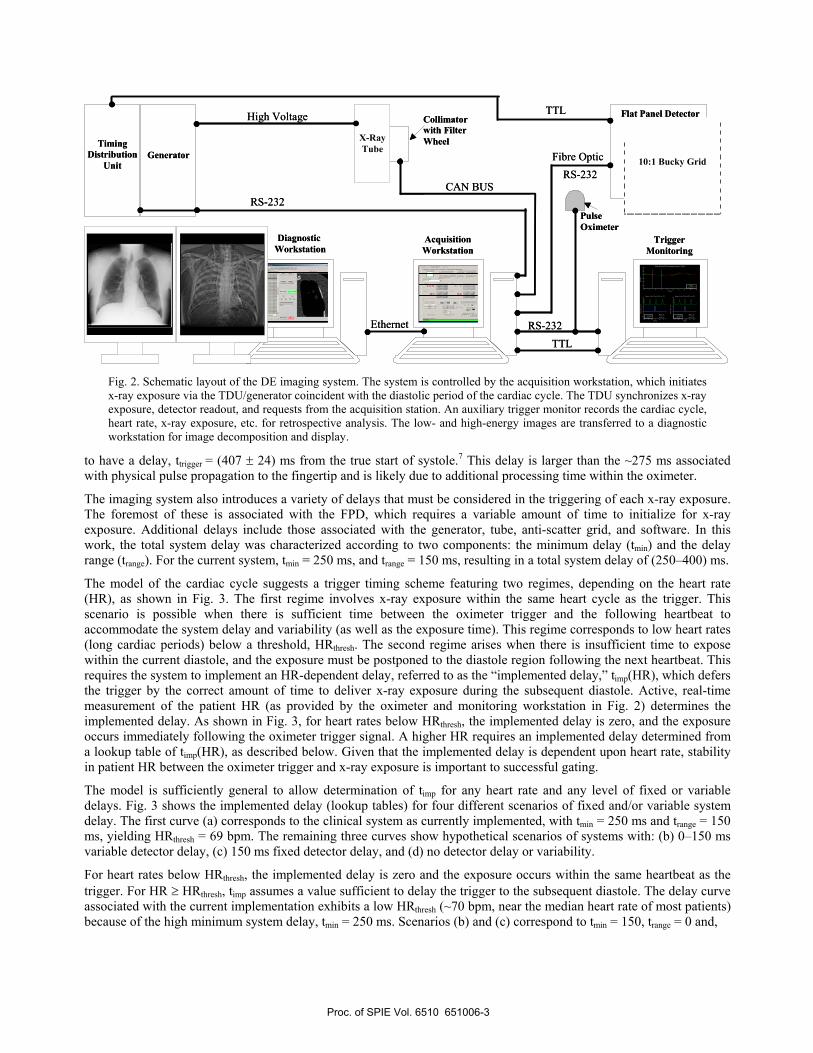
The model of the cardiac cycle suggests a trigger timing scheme featuring two regimes, depending on the heart rate (HR), as shown in Fig. 3. The first regime involves x-ray exposure within the same heart cycle as the trigger. This scenario is possible when there is sufficient time between the oximeter trigger and the following heartbeat to accommodate the system delay and variability (as well as the exposure time). This regime corresponds to low heart rates (long cardiac periods) below a threshold, HRthresh. The second regime arises when there is insufficient time to expose within the current diastole, and the exposure must be postponed to the diastole region following the next heartbeat. This requires the system to implement an HR-dependent delay, referred to as the “implemented delay,” timp(HR), which defers the trigger by the correct amount of time to deliver x-ray exposure during the subsequent diastole. Active, real-time measurement of the patient HR (as provided by the oximeter and monitoring workstation in Fig. 2) determines the implemented delay. As shown in Fig. 3, for heart rates below HRthresh, the implemented delay is zero, and the exposure occurs immediately following the oximeter trigger signal. A higher HR requires an implemented delay determined from a lookup table of timp(HR), as described below. Given that the implemented delay is dependent upon heart rate, stability in patient HR between the oximeter trigger and x-ray exposure is important to successful gating.
The model is sufficiently general to allow determination of timp for any heart rate and any level of fixed or variable delays. Fig. 3 shows the implemented delay (lookup tables) for four different scenarios of fixed and/or variable system delay. The first curve (a) corresponds to the clinical system as currently implemented, with tmin = 250 ms and trange = 150 ms, yielding HRthresh = 69 bpm. The remaining three curves show hypothetical scenarios of systems with: (b) 0–150 ms variable detector delay, (c) 150 ms fixed detector delay, and (d) no detector delay or variability.
For heart rates below HRthresh, the implemented delay is zero and the exposure occurs within the same heartbeat as the trigger. For HR HRthresh, timp assumes a value sufficient to delay the trigger to the subsequent diastole. The delay curve associated with the current implementation exhibits a low HRthresh (~70 bpm, near the median heart rate of most patients) because of the high minimum system delay, tmin = 250 ms. Scenarios (b) and (c) correspond to tmin = 150, trange = 0 and,
Proc. of SPIE Vol. 6510 651006-3
0
200
400
600
800
1000
60 80 100 120 1400
200
400
600
800
1000
Dia
stol
e Le
ngth
(ms)
Heart Rate (bpm)
(a)
Impl
emen
ted
Del
ay (m
s)
(b)(c)
(d)
0
200
400
600
800
1000
60 80 100 120 1400
200
400
600
800
1000
Dia
stol
e Le
ngth
(ms)
Heart Rate (bpm)
(a)
Impl
emen
ted
Del
ay (m
s)
(b)(c)
(d)
tmin = 0, trange = 150 ms, respectively, and exhibit an equivalent threshold since they have the same maximum delay (tmin + trange = 150 ms); however, the variability in the latter requires a slightly longer timp to account for a zero delay. The ideal system configuration (tmin = trange = 0) would allow for x-ray exposures on the same cardiac cycle as the trigger (timp = 0 ms) for heart rates up to ~125 bpm.
2.3 Image processing, decomposition, and display
A streamlined image-processing pipeline is an important foundation for the various processes required to produce display–ready DE image decompositions in a manner consistent with the demands of diagnostic imaging workflow. Such processes include: offset-gain calibration and defect pixel correction, image registration, dual-energy decomposition, noise reduction, and normalization of pixel values in display-ready images.
2.3.1 Offset–gain correction for DE imaging
Image preprocessing applied to the low- and high-kVp projection images include offset, gain, and defect correction. Periodic calibration of the system includes the collection of monthly gain calibrations (e.g., the average of 25 flood-field images) with an associated mean offset calibration (e.g., the average of 25 dark-field images). Gain calibrations are acquired at both low- and high-kVp, because evidence suggests a significant loss in DQE associated with structure noise as well as degradation and image non-uniformity associated with the use of a single kVp gain calibration in DE decomposition.8 At the time of low- and high-kVp projection acquisition, another offset calibration (e.g., the average of 25 dark-field images) is collected. Finally, a map of defective pixels is also computed and updated periodically. The defect map categorizes various types of pixel defects: single isolated defects, line defects, double-line defects, etc. Pixel defects are corrected in the low- and high-kVp projections using a variety of median filters, with the size of the median filter (3 3, 5 1, etc.) depending on the categorization.
2.3.2 Image registration
The time between acquisition of the low- and high-energy images (~5–8 seconds in the current system implementation) makes the image acquisition process susceptible to patient motion. Anatomical misregistration between the projections can result in motion artifacts in the DE decomposition. Although the current implementation involves image acquisition under breath-hold, there is still potential for significant motion between projections, including patient drift, diaphragm motion, and cardiac motion. There is therefore the need for robust, accurate registration of the low- and high-kVp projections. Simple rigid-body registration is insufficient to correct for these sources of motion. Rather, automated and semi-automated methods for deformable 2D registration are being pursued. Approaches include correlation or mutual information-based deformable registration methods that are applied iteratively at finer and finer resolutions to achieve accurate registration while minimizing the search space. In the results shown below, we employ a piece-wise rigid body registration scheme, where conspicuous anatomical landmarks in addition to a small collection of lead BBs placed on the patient provide local control points for the registration process.
Fig. 3. (Left-axis) Duration of diastole as a function of heart-rate (bold black line).1 (Right-axis) Implemented delay computed for: (a) the current system implementation (tmin = 250 ms, trange = 150 ms), (b) a system with fast but variable response (tmin = 0 ms, trange = 150 ms), (c) a system with a delayed but nonvarying response (tmin = 150, trange = 0 ms), and (d) and ideal system (tmin = 0, trange = 0 ms).
Proc. of SPIE Vol. 6510 651006-4
2.3.3 DE image decomposition
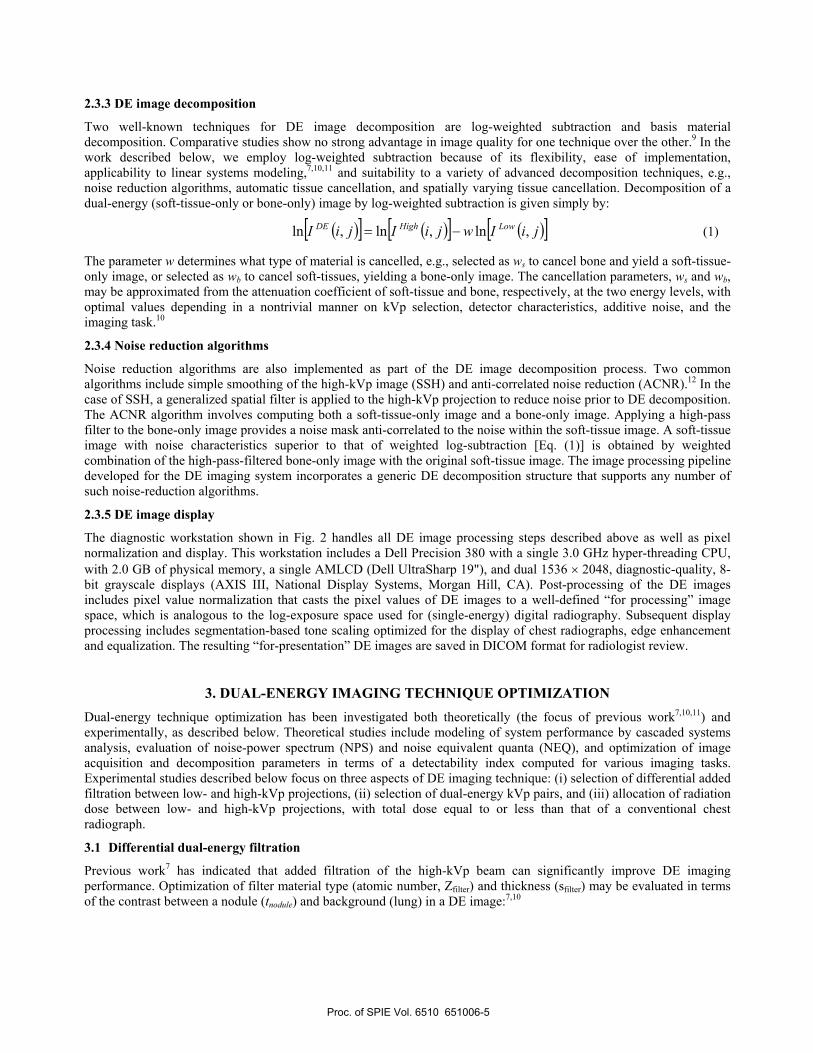
Two well-known techniques for DE image decomposition are log-weighted subtraction and basis material decomposition. Comparative studies show no strong advantage in image quality for one technique over the other.9 In the work described below, we employ log-weighted subtraction because of its flexibility, ease of implementation, applicability to linear systems modeling,7,10,11 and suitability to a variety of advanced decomposition techniques, e.g., noise reduction algorithms, automatic tissue cancellation, and spatially varying tissue cancellation. Decomposition of a dual-energy (soft-tissue-only or bone-only) image by log-weighted subtraction is given simply by:
jiIwjiIjiI LowHighDE ,ln,ln,ln (1)
The parameter w determines what type of material is cancelled, e.g., selected as ws to cancel bone and yield a soft-tissue-only image, or selected as wb to cancel soft-tissues, yielding a bone-only image. The cancellation parameters, ws and wb,may be approximated from the attenuation coefficient of soft-tissue and bone, respectively, at the two energy levels, with optimal values depending in a nontrivial manner on kVp selection, detector characteristics, additive noise, and the imaging task.10
2.3.4 Noise reduction algorithms
Noise reduction algorithms are also implemented as part of the DE image decomposition process. Two common algorithms include simple smoothing of the high-kVp image (SSH) and anti-correlated noise reduction (ACNR).12 In the case of SSH, a generalized spatial filter is applied to the high-kVp projection to reduce noise prior to DE decomposition. The ACNR algorithm involves computing both a soft-tissue-only image and a bone-only image. Applying a high-pass filter to the bone-only image provides a noise mask anti-correlated to the noise within the soft-tissue image. A soft-tissue image with noise characteristics superior to that of weighted log-subtraction [Eq. (1)] is obtained by weighted combination of the high-pass-filtered bone-only image with the original soft-tissue image. The image processing pipeline developed for the DE imaging system incorporates a generic DE decomposition structure that supports any number of such noise-reduction algorithms.
2.3.5 DE image display
The diagnostic workstation shown in Fig. 2 handles all DE image processing steps described above as well as pixel normalization and display. This workstation includes a Dell Precision 380 with a single 3.0 GHz hyper-threading CPU, with 2.0 GB of physical memory, a single AMLCD (Dell UltraSharp 19"), and dual 1536 2048, diagnostic-quality, 8-bit grayscale displays (AXIS III, National Display Systems, Morgan Hill, CA). Post-processing of the DE images includes pixel value normalization that casts the pixel values of DE images to a well-defined “for processing” image space, which is analogous to the log-exposure space used for (single-energy) digital radiography. Subsequent display processing includes segmentation-based tone scaling optimized for the display of chest radiographs, edge enhancement and equalization. The resulting “for-presentation” DE images are saved in DICOM format for radiologist review.
3. DUAL-ENERGY IMAGING TECHNIQUE OPTIMIZATION Dual-energy technique optimization has been investigated both theoretically (the focus of previous work7,10,11) and experimentally, as described below. Theoretical studies include modeling of system performance by cascaded systems analysis, evaluation of noise-power spectrum (NPS) and noise equivalent quanta (NEQ), and optimization of image acquisition and decomposition parameters in terms of a detectability index computed for various imaging tasks. Experimental studies described below focus on three aspects of DE imaging technique: (i) selection of differential added filtration between low- and high-kVp projections, (ii) selection of dual-energy kVp pairs, and (iii) allocation of radiation dose between low- and high-kVp projections, with total dose equal to or less than that of a conventional chest radiograph.
3.1 Differential dual-energy filtration
Previous work7 has indicated that added filtration of the high-kVp beam can significantly improve DE imaging performance. Optimization of filter material type (atomic number, Zfilter) and thickness (sfilter) may be evaluated in terms of the contrast between a nodule (tnodule) and background (lung) in a DE image:7,10
Proc. of SPIE Vol. 6510 651006-5
noduleLlung
LnoduleL
bone
HboneH
lungHnodule
DE tC (2)
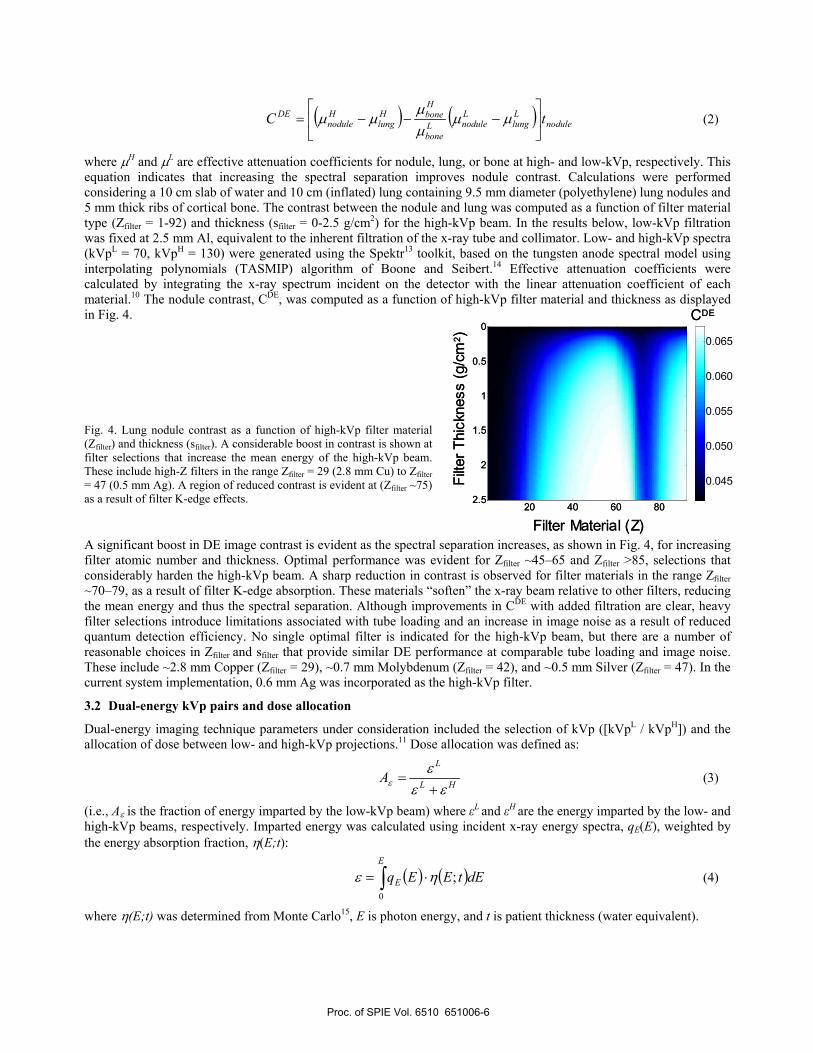
where H and L are effective attenuation coefficients for nodule, lung, or bone at high- and low-kVp, respectively. This equation indicates that increasing the spectral separation improves nodule contrast. Calculations were performed considering a 10 cm slab of water and 10 cm (inflated) lung containing 9.5 mm diameter (polyethylene) lung nodules and 5 mm thick ribs of cortical bone. The contrast between the nodule and lung was computed as a function of filter material type (Zfilter = 1-92) and thickness (sfilter = 0-2.5 g/cm2) for the high-kVp beam. In the results below, low-kVp filtration was fixed at 2.5 mm Al, equivalent to the inherent filtration of the x-ray tube and collimator. Low- and high-kVp spectra (kVpL = 70, kVpH = 130) were generated using the Spektr13 toolkit, based on the tungsten anode spectral model using interpolating polynomials (TASMIP) algorithm of Boone and Seibert.14 Effective attenuation coefficients were calculated by integrating the x-ray spectrum incident on the detector with the linear attenuation coefficient of each material.10 The nodule contrast, CDE, was computed as a function of high-kVp filter material and thickness as displayed in Fig. 4.
Fig. 4. Lung nodule contrast as a function of high-kVp filter material (Zfilter) and thickness (sfilter). A considerable boost in contrast is shown at filter selections that increase the mean energy of the high-kVp beam. These include high-Z filters in the range Zfilter = 29 (2.8 mm Cu) to Zfilter= 47 (0.5 mm Ag). A region of reduced contrast is evident at (Zfilter ~75) as a result of filter K-edge effects.
A significant boost in DE image contrast is evident as the spectral separation increases, as shown in Fig. 4, for increasing filter atomic number and thickness. Optimal performance was evident for Zfilter ~45–65 and Zfilter >85, selections that considerably harden the high-kVp beam. A sharp reduction in contrast is observed for filter materials in the range Zfilter~70–79, as a result of filter K-edge absorption. These materials “soften” the x-ray beam relative to other filters, reducing the mean energy and thus the spectral separation. Although improvements in CDE with added filtration are clear, heavy filter selections introduce limitations associated with tube loading and an increase in image noise as a result of reduced quantum detection efficiency. No single optimal filter is indicated for the high-kVp beam, but there are a number of reasonable choices in Zfilter and sfilter that provide similar DE performance at comparable tube loading and image noise. These include ~2.8 mm Copper (Zfilter = 29), ~0.7 mm Molybdenum (Zfilter = 42), and ~0.5 mm Silver (Zfilter = 47). In the current system implementation, 0.6 mm Ag was incorporated as the high-kVp filter.
3.2 Dual-energy kVp pairs and dose allocation
Dual-energy imaging technique parameters under consideration included the selection of kVp ([kVpL / kVpH]) and the allocation of dose between low- and high-kVp projections.11 Dose allocation was defined as:
HL
L
A (3)
(i.e., A is the fraction of energy imparted by the low-kVp beam) where L and H are the energy imparted by the low- and high-kVp beams, respectively. Imparted energy was calculated using incident x-ray energy spectra, qE(E), weighted by the energy absorption fraction, (E;t):
E
E dEtEEq0
; (4)
where (E;t) was determined from Monte Carlo15, E is photon energy, and t is patient thickness (water equivalent).
Filte
r Thi
ckne
ss (g
/cm
2 )
Filter Material (Z)
CDE
20 40 60 80
0
0.5
1
1.5
2
2.5
0.045
0.05
0.055
0.06
0.065
0.045
0.050
0.055
0.060
0.065
Filte
r Thi
ckne
ss (g
/cm
2 )
Filter Material (Z)
CDE
20 40 60 80
0
0.5
1
1.5
2
2.5
0.045
0.05
0.055
0.06
0.065
0.045
0.050
0.055
0.060
0.065
Proc. of SPIE Vol. 6510 651006-6
Optimal acquisition techniques were investigated using a custom DE chest phantom7 modeled after the ANSI chest equivalent phantom.16 The phantom consisted of acrylic slabs (30 30 1.25 cm) to approximate variable chest thickness, aluminum slats (3 and 6 mm thick) to simulate ribs, and cylinders of fixed diameter and thickness (~9.5 mm) and varying contrast (approximately -500 to 75 HU) to represent lung nodules. In each experiment, the total imparted energy for the DE image ( Total = L + H) was fixed and equal to the dose of a single chest radiograph. The imparted energy for a conventional radiograph was computed using standard techniques used at our institution, with corresponding values of entrance surface dose (ESD) consistent with those reported in literature.17
Dose allocation (A ) was investigated under conditions of fixed-kVp pair and total dose. By varying generator mAs settings, combinations of L + H that gave a total dose within ±5% of a conventional radiograph were identified. These combinations provided dual-energy acquisitions at fixed total dose, with varying dose allocation. A total of 16 kVp pairs ([kVpL = 60–90 / kVpH = 120–150]) and three phantom thicknesses were investigated in this manner.
0.0 0.2 0.4 0.6 0.8 1.00
1
2
3
4
5
0.0 0.2 0.4 0.6 0.8 1.00
1
2
3
4
5
SDNR
DE
60708090
0.0 0.2 0.4 0.6 0.8 1.00
1
2
3
4
5
0.0 0.2 0.4 0.6 0.8 1.00
1
2
3
4
5
Dose Allocation, A
kVpH = 140 kVpH = 150
SDNR
DE
kVpH = 120 kVpH = 130
60708090
60708090
60708090
Dose Allocation, A
Dose Allocation, A Dose Allocation, A0.0 0.2 0.4 0.6 0.8 1.00
1
2
3
4
5
0.0 0.2 0.4 0.6 0.8 1.00
1
2
3
4
5
SDNR
DE
60708090
0.0 0.2 0.4 0.6 0.8 1.00
1
2
3
4
5
0.0 0.2 0.4 0.6 0.8 1.00
1
2
3
4
5
Dose Allocation, A
kVpH = 140 kVpH = 150
SDNR
DE
kVpH = 120 kVpH = 130
60708090
60708090
60708090
Dose Allocation, A
Dose Allocation, A Dose Allocation, A
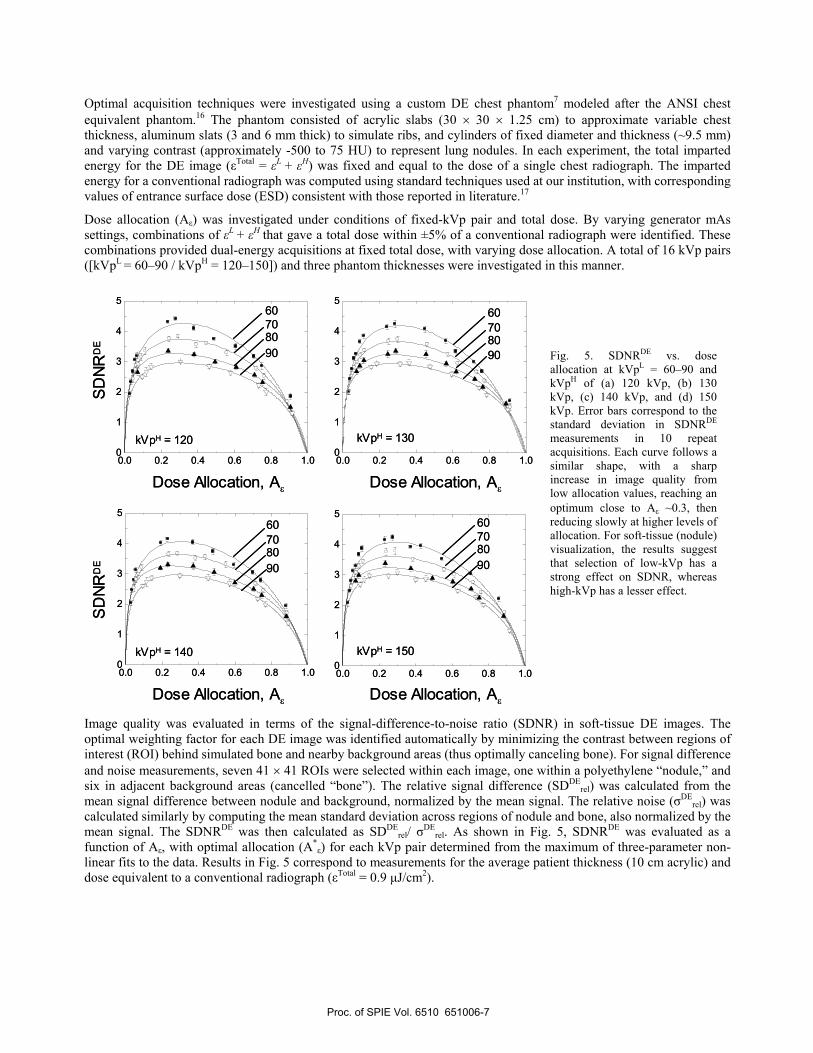
Image quality was evaluated in terms of the signal-difference-to-noise ratio (SDNR) in soft-tissue DE images. The optimal weighting factor for each DE image was identified automatically by minimizing the contrast between regions of interest (ROI) behind simulated bone and nearby background areas (thus optimally canceling bone). For signal difference and noise measurements, seven 41 41 ROIs were selected within each image, one within a polyethylene “nodule,” and six in adjacent background areas (cancelled “bone”). The relative signal difference (SDDE
rel) was calculated from the mean signal difference between nodule and background, normalized by the mean signal. The relative noise ( DE
rel) was calculated similarly by computing the mean standard deviation across regions of nodule and bone, also normalized by the mean signal. The SDNRDE was then calculated as SDDE
rel/ DErel. As shown in Fig. 5, SDNRDE was evaluated as a
function of A , with optimal allocation (A* ) for each kVp pair determined from the maximum of three-parameter non-linear fits to the data. Results in Fig. 5 correspond to measurements for the average patient thickness (10 cm acrylic) and dose equivalent to a conventional radiograph ( Total = 0.9 µJ/cm2).
Fig. 5. SDNRDE vs. dose allocation at kVpL = 60–90 and kVpH of (a) 120 kVp, (b) 130 kVp, (c) 140 kVp, and (d) 150 kVp. Error bars correspond to the standard deviation in SDNRDE
measurements in 10 repeat acquisitions. Each curve follows a similar shape, with a sharp increase in image quality from low allocation values, reaching an optimum close to A ~0.3, then reducing slowly at higher levels of allocation. For soft-tissue (nodule) visualization, the results suggest that selection of low-kVp has a strong effect on SDNR, whereas high-kVp has a lesser effect.
Proc. of SPIE Vol. 6510 651006-7
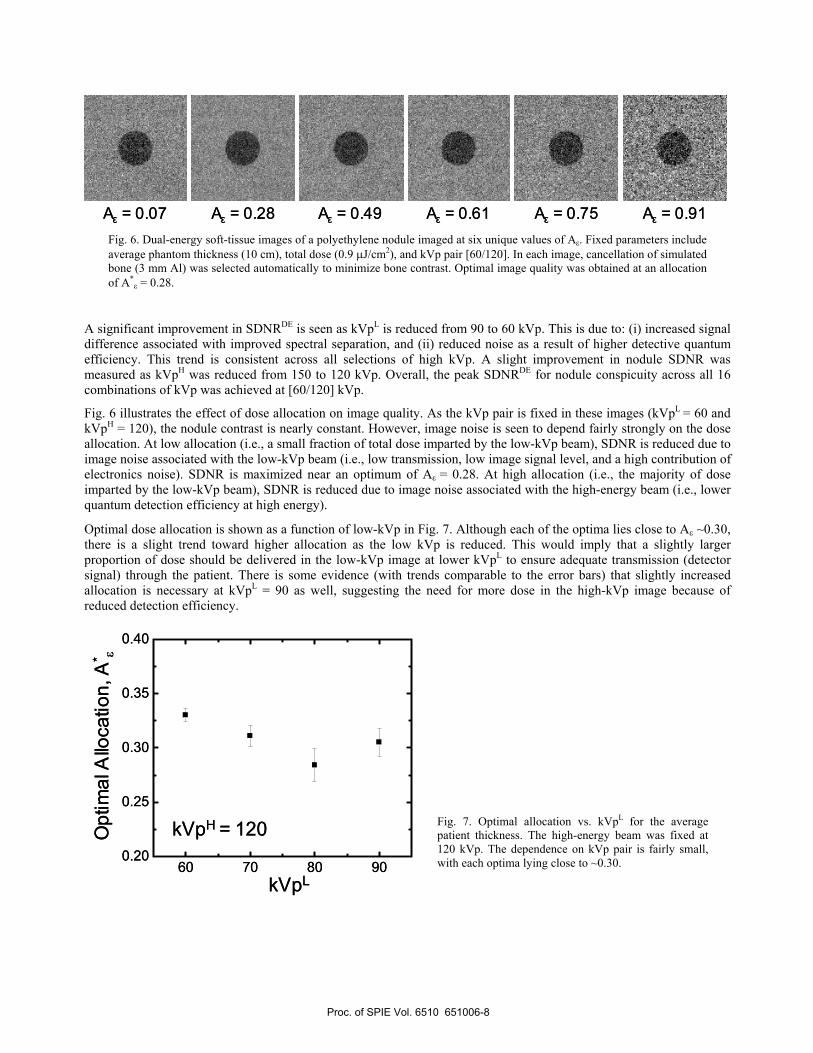
0A = 0.07 A = 0.49 A = 0.61 A = 0.75 A = 0.91A = 0.28A = 0.07 A = 0.49 A = 0.61 A = 0.75 A = 0.91A = 0.28Fig. 6. Dual-energy soft-tissue images of a polyethylene nodule imaged at six unique values of A . Fixed parameters include average phantom thickness (10 cm), total dose (0.9 J/cm2), and kVp pair [60/120]. In each image, cancellation of simulated bone (3 mm Al) was selected automatically to minimize bone contrast. Optimal image quality was obtained at an allocation of A* = 0.28.
A significant improvement in SDNRDE is seen as kVpL is reduced from 90 to 60 kVp. This is due to: (i) increased signal difference associated with improved spectral separation, and (ii) reduced noise as a result of higher detective quantum efficiency. This trend is consistent across all selections of high kVp. A slight improvement in nodule SDNR was measured as kVpH was reduced from 150 to 120 kVp. Overall, the peak SDNRDE for nodule conspicuity across all 16 combinations of kVp was achieved at [60/120] kVp.
Fig. 6 illustrates the effect of dose allocation on image quality. As the kVp pair is fixed in these images (kVpL = 60 and kVpH = 120), the nodule contrast is nearly constant. However, image noise is seen to depend fairly strongly on the dose allocation. At low allocation (i.e., a small fraction of total dose imparted by the low-kVp beam), SDNR is reduced due to image noise associated with the low-kVp beam (i.e., low transmission, low image signal level, and a high contribution of electronics noise). SDNR is maximized near an optimum of A = 0.28. At high allocation (i.e., the majority of dose imparted by the low-kVp beam), SDNR is reduced due to image noise associated with the high-energy beam (i.e., lower quantum detection efficiency at high energy).
Optimal dose allocation is shown as a function of low-kVp in Fig. 7. Although each of the optima lies close to A ~0.30, there is a slight trend toward higher allocation as the low kVp is reduced. This would imply that a slightly larger proportion of dose should be delivered in the low-kVp image at lower kVpL to ensure adequate transmission (detector signal) through the patient. There is some evidence (with trends comparable to the error bars) that slightly increased allocation is necessary at kVpL = 90 as well, suggesting the need for more dose in the high-kVp image because of reduced detection efficiency.
60 70 80 900.20
0.25
0.30
0.35
0.40
kVpL
Opt
imal
Allo
catio
n, A
*
kVpH = 120
60 70 80 900.20
0.25
0.30
0.35
0.40
kVpL
Opt
imal
Allo
catio
n, A
*
kVpH = 120 Fig. 7. Optimal allocation vs. kVpL for the average patient thickness. The high-energy beam was fixed at 120 kVp. The dependence on kVp pair is fairly small, with each optima lying close to ~0.30.
Proc. of SPIE Vol. 6510 651006-8
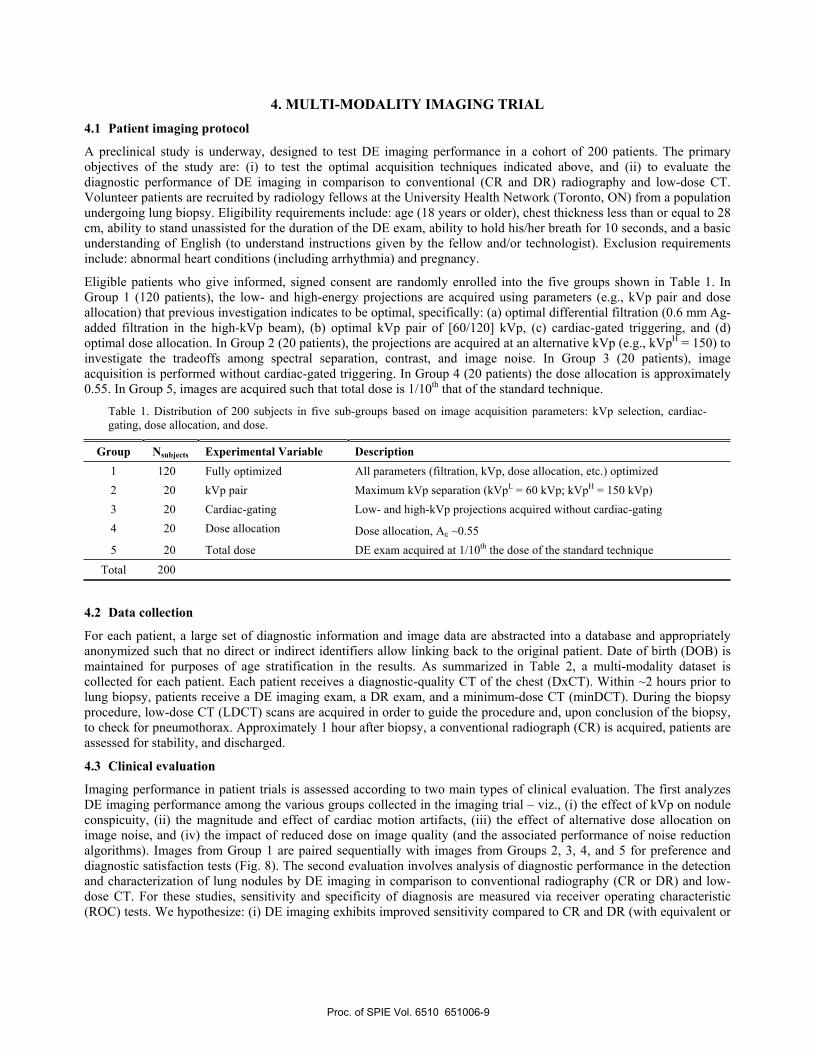
4. MULTI-MODALITY IMAGING TRIAL 4.1 Patient imaging protocol
A preclinical study is underway, designed to test DE imaging performance in a cohort of 200 patients. The primary objectives of the study are: (i) to test the optimal acquisition techniques indicated above, and (ii) to evaluate the diagnostic performance of DE imaging in comparison to conventional (CR and DR) radiography and low-dose CT.Volunteer patients are recruited by radiology fellows at the University Health Network (Toronto, ON) from a population undergoing lung biopsy. Eligibility requirements include: age (18 years or older), chest thickness less than or equal to 28 cm, ability to stand unassisted for the duration of the DE exam, ability to hold his/her breath for 10 seconds, and a basic understanding of English (to understand instructions given by the fellow and/or technologist). Exclusion requirements include: abnormal heart conditions (including arrhythmia) and pregnancy.
Eligible patients who give informed, signed consent are randomly enrolled into the five groups shown in Table 1. In Group 1 (120 patients), the low- and high-energy projections are acquired using parameters (e.g., kVp pair and dose allocation) that previous investigation indicates to be optimal, specifically: (a) optimal differential filtration (0.6 mm Ag-added filtration in the high-kVp beam), (b) optimal kVp pair of [60/120] kVp, (c) cardiac-gated triggering, and (d) optimal dose allocation. In Group 2 (20 patients), the projections are acquired at an alternative kVp (e.g., kVpH = 150) to investigate the tradeoffs among spectral separation, contrast, and image noise. In Group 3 (20 patients), image acquisition is performed without cardiac-gated triggering. In Group 4 (20 patients) the dose allocation is approximately 0.55. In Group 5, images are acquired such that total dose is 1/10th that of the standard technique.
Table 1. Distribution of 200 subjects in five sub-groups based on image acquisition parameters: kVp selection, cardiac-gating, dose allocation, and dose.
Group Nsubjects Experimental Variable Description 1 120 Fully optimized All parameters (filtration, kVp, dose allocation, etc.) optimized 2 20 kVp pair Maximum kVp separation (kVpL = 60 kVp; kVpH = 150 kVp) 3 20 Cardiac-gating Low- and high-kVp projections acquired without cardiac-gating 4 20 Dose allocation Dose allocation, A ~0.55 5 20 Total dose DE exam acquired at 1/10th the dose of the standard technique
Total 200
4.2 Data collection
For each patient, a large set of diagnostic information and image data are abstracted into a database and appropriately anonymized such that no direct or indirect identifiers allow linking back to the original patient. Date of birth (DOB) is maintained for purposes of age stratification in the results. As summarized in Table 2, a multi-modality dataset is collected for each patient. Each patient receives a diagnostic-quality CT of the chest (DxCT). Within ~2 hours prior to lung biopsy, patients receive a DE imaging exam, a DR exam, and a minimum-dose CT (minDCT). During the biopsy procedure, low-dose CT (LDCT) scans are acquired in order to guide the procedure and, upon conclusion of the biopsy, to check for pneumothorax. Approximately 1 hour after biopsy, a conventional radiograph (CR) is acquired, patients are assessed for stability, and discharged.
4.3 Clinical evaluation
Imaging performance in patient trials is assessed according to two main types of clinical evaluation. The first analyzes DE imaging performance among the various groups collected in the imaging trial – viz., (i) the effect of kVp on nodule conspicuity, (ii) the magnitude and effect of cardiac motion artifacts, (iii) the effect of alternative dose allocation on image noise, and (iv) the impact of reduced dose on image quality (and the associated performance of noise reduction algorithms). Images from Group 1 are paired sequentially with images from Groups 2, 3, 4, and 5 for preference and diagnostic satisfaction tests (Fig. 8). The second evaluation involves analysis of diagnostic performance in the detection and characterization of lung nodules by DE imaging in comparison to conventional radiography (CR or DR) and low-dose CT. For these studies, sensitivity and specificity of diagnosis are measured via receiver operating characteristic (ROC) tests. We hypothesize: (i) DE imaging exhibits improved sensitivity compared to CR and DR (with equivalent or
Proc. of SPIE Vol. 6510 651006-9
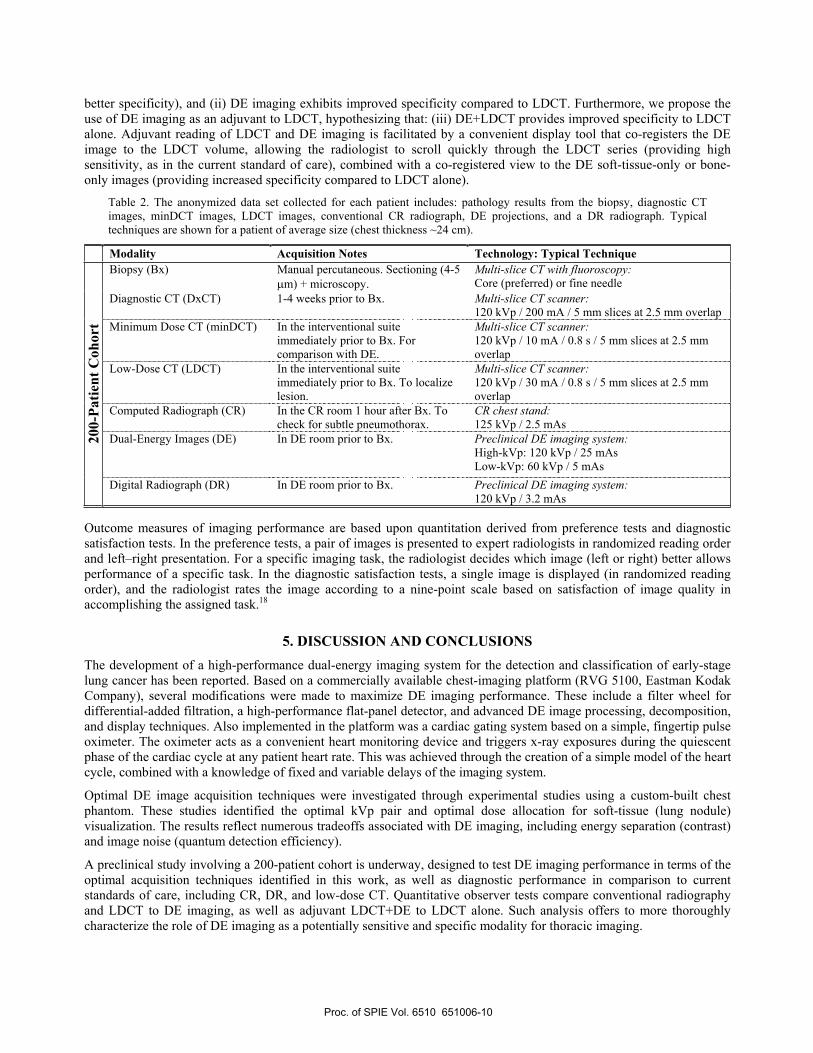
better specificity), and (ii) DE imaging exhibits improved specificity compared to LDCT. Furthermore, we propose the use of DE imaging as an adjuvant to LDCT, hypothesizing that: (iii) DE+LDCT provides improved specificity to LDCT alone. Adjuvant reading of LDCT and DE imaging is facilitated by a convenient display tool that co-registers the DE image to the LDCT volume, allowing the radiologist to scroll quickly through the LDCT series (providing high sensitivity, as in the current standard of care), combined with a co-registered view to the DE soft-tissue-only or bone-only images (providing increased specificity compared to LDCT alone).
Table 2. The anonymized data set collected for each patient includes: pathology results from the biopsy, diagnostic CT images, minDCT images, LDCT images, conventional CR radiograph, DE projections, and a DR radiograph. Typical techniques are shown for a patient of average size (chest thickness ~24 cm).
Modality Acquisition Notes Technology: Typical Technique Biopsy (Bx) Manual percutaneous. Sectioning (4-5
m) + microscopy. Multi-slice CT with fluoroscopy:Core (preferred) or fine needle
Diagnostic CT (DxCT) 1-4 weeks prior to Bx. Multi-slice CT scanner: 120 kVp / 200 mA / 5 mm slices at 2.5 mm overlap
Minimum Dose CT (minDCT) In the interventional suite immediately prior to Bx. For comparison with DE.
Multi-slice CT scanner: 120 kVp / 10 mA / 0.8 s / 5 mm slices at 2.5 mm overlap
Low-Dose CT (LDCT) In the interventional suite immediately prior to Bx. To localize lesion.
Multi-slice CT scanner: 120 kVp / 30 mA / 0.8 s / 5 mm slices at 2.5 mm overlap
Computed Radiograph (CR) In the CR room 1 hour after Bx. To check for subtle pneumothorax.
CR chest stand: 125 kVp / 2.5 mAs
Dual-Energy Images (DE) In DE room prior to Bx. Preclinical DE imaging system: High-kVp: 120 kVp / 25 mAs Low-kVp: 60 kVp / 5 mAs
200-
Patie
nt C
ohor
t
Digital Radiograph (DR) In DE room prior to Bx. Preclinical DE imaging system: 120 kVp / 3.2 mAs
Outcome measures of imaging performance are based upon quantitation derived from preference tests and diagnostic satisfaction tests. In the preference tests, a pair of images is presented to expert radiologists in randomized reading order and left–right presentation. For a specific imaging task, the radiologist decides which image (left or right) better allows performance of a specific task. In the diagnostic satisfaction tests, a single image is displayed (in randomized reading order), and the radiologist rates the image according to a nine-point scale based on satisfaction of image quality in accomplishing the assigned task.18
5. DISCUSSION AND CONCLUSIONS The development of a high-performance dual-energy imaging system for the detection and classification of early-stage lung cancer has been reported. Based on a commercially available chest-imaging platform (RVG 5100, Eastman Kodak Company), several modifications were made to maximize DE imaging performance. These include a filter wheel for differential-added filtration, a high-performance flat-panel detector, and advanced DE image processing, decomposition, and display techniques. Also implemented in the platform was a cardiac gating system based on a simple, fingertip pulse oximeter. The oximeter acts as a convenient heart monitoring device and triggers x-ray exposures during the quiescent phase of the cardiac cycle at any patient heart rate. This was achieved through the creation of a simple model of the heart cycle, combined with a knowledge of fixed and variable delays of the imaging system.
Optimal DE image acquisition techniques were investigated through experimental studies using a custom-built chest phantom. These studies identified the optimal kVp pair and optimal dose allocation for soft-tissue (lung nodule) visualization. The results reflect numerous tradeoffs associated with DE imaging, including energy separation (contrast) and image noise (quantum detection efficiency).
A preclinical study involving a 200-patient cohort is underway, designed to test DE imaging performance in terms of the optimal acquisition techniques identified in this work, as well as diagnostic performance in comparison to current standards of care, including CR, DR, and low-dose CT. Quantitative observer tests compare conventional radiography and LDCT to DE imaging, as well as adjuvant LDCT+DE to LDCT alone. Such analysis offers to more thoroughly characterize the role of DE imaging as a potentially sensitive and specific modality for thoracic imaging.
Proc. of SPIE Vol. 6510 651006-10
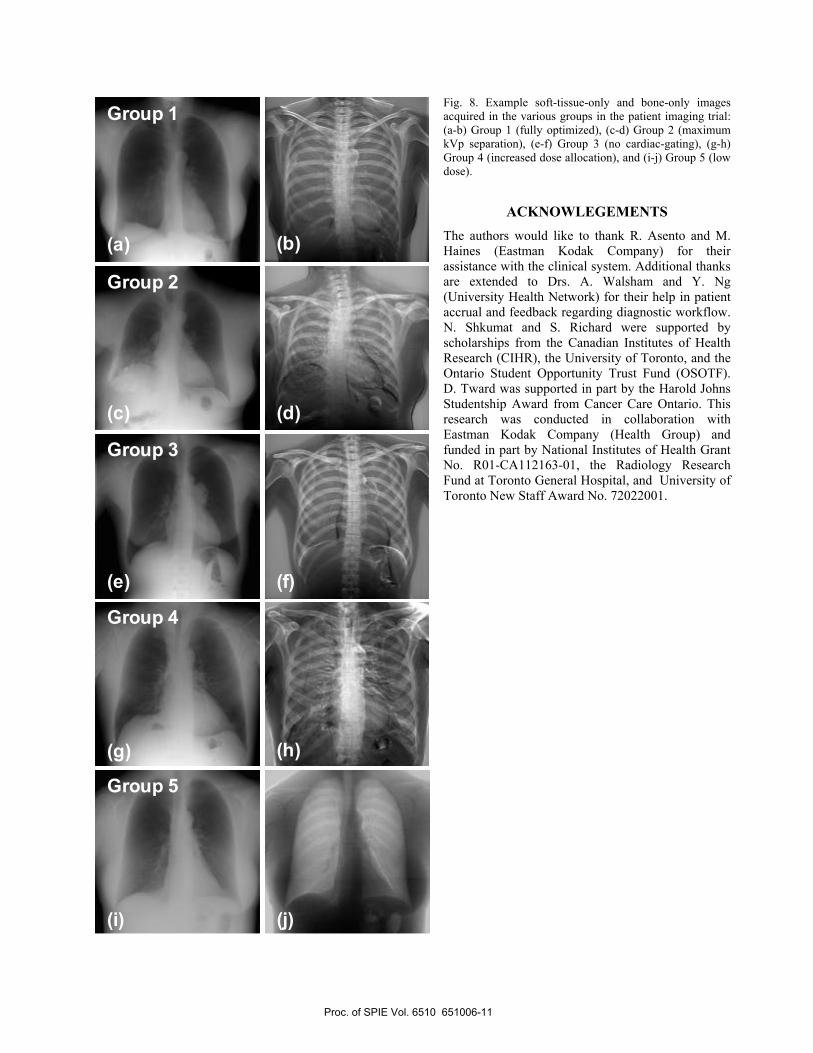
Fig. 8. Example soft-tissue-only and bone-only images acquired in the various groups in the patient imaging trial: (a-b) Group 1 (fully optimized), (c-d) Group 2 (maximum kVp separation), (e-f) Group 3 (no cardiac-gating), (g-h) Group 4 (increased dose allocation), and (i-j) Group 5 (low dose).
ACKNOWLEGEMENTSThe authors would like to thank R. Asento and M. Haines (Eastman Kodak Company) for their assistance with the clinical system. Additional thanks are extended to Drs. A. Walsham and Y. Ng (University Health Network) for their help in patient accrual and feedback regarding diagnostic workflow. N. Shkumat and S. Richard were supported by scholarships from the Canadian Institutes of Health Research (CIHR), the University of Toronto, and the Ontario Student Opportunity Trust Fund (OSOTF). D. Tward was supported in part by the Harold Johns Studentship Award from Cancer Care Ontario. This research was conducted in collaboration with Eastman Kodak Company (Health Group) and funded in part by National Institutes of Health Grant No. R01-CA112163-01, the Radiology Research Fund at Toronto General Hospital, and University of Toronto New Staff Award No. 72022001.
Group 1
Group 2
Group 3
Group 4
Group 5
(a)
(c)
(e)
(g)
(b)
(d)
(f)
(h)
(i) (j)
Group 1
Group 2
Group 3
Group 4
Group 5
(a)
(c)
(e)
(g)
(b)
(d)
(f)
(h)
(i) (j)
Proc. of SPIE Vol. 6510 651006-11
REFERENCES 1. J. R. Levick. An Introduction to Cardiovascular Physiology, (New York, Oxford University Press). (2000).
2. A. Macovski, R. E. Alvarez, J. L. Chan, J. P. Stonestrom, and L. M. Zatz. "Energy dependent reconstruction in X-ray computerizedtomography," Computers in Biology & Medicine 6[4]: 325-336 (1976).
3. L. A. Lehmann, R. E. Alvarez, A. Macovski, W. R. Brody, N. J. Pelc, S. J. Riederer, and A. L. Hall. "Generalized image combinations in dual KVP digital radiography," Medical Physics 8[5]: 659-667 (1981).
4. W. R. Brody, G. Butt, A. Hall, and A. Macovski. "A method for selective tissue and bone visualization using dual energy scanned projection radiography," Medical Physics 8[3]: 353-357 (1981).
5. L. T. Niklason, N. M. Hickey, D. P. Chakraborty, E. A. Sabbagh, M. V. Yester, R. G. Fraser, and G. T. Barnes. "Simulated pulmonary nodules: detection with dual-energy digital versus conventional radiography," Radiology 160[3]: 589-593 (1986).
6. F. Kelcz, F. E. Zink, W. W. Peppler, D. G. Kruger, D. L. Ergun, and C. A. Mistretta. "Conventional chest radiography vs dual-energy computed radiography in the detection and characterization of pulmonary nodules," AJR Am.J.Roentgenol. 162[2]: 271-278 (1994).
7. J. H. Siewerdsen, N. A. Shkumat, A. C. Dhanantwari, D. B. Williams, S. Richard, M. J. Daly, N. S. Paul, D. J. Moseley, D. A. Jaffray, J. Yorkston, and R. Van Metter. "High-Performance Dual-Energy Imaging With a Flat-Panel Detector: Imaging Physics From Blackboard toBenchtop to Bedside," Proc.SPIE Physics of Medical Imaging 6142: 61421E-1-61421E-10 (2006).
8. A. C. Dhanantwari, J. H. Siewerdsen, N. A. Shkumant, D. B. Williams, S. Richard, M. J. Daly, N. S. Paul, D. J. Moseley, D. Jaffray, J. Yorkston, and R. Van Metter. "High-Performance Dual-Energy Imaging With a Flat-Panel Detector: Answering the Challenge of Dual-KVp Flood-Field Correction," Medical Physics 33[6]: 2252 (2006).
9. J. M. Sabol, G. B. Avinash, F. Nicolas, B. Claus, J. Zhao, and J. T. Dobbins. "The Development and Characterization of a Dual-Energy Subtraction Imaging System for Chest Radiography Based on CsI:Tl Amorphous Silicon Flat-Panel Technology," SPIE: Physics of MedicalImaging 4320: 399-408 (2001).
10. S. Richard, J. H. Siewerdsen, D. A. Jaffray, D. J. Moseley, and B. Bakhtiar. "Generalized DQE analysis of radiographic and dual-energy imaging using flat-panel detectors," Medical Physics 32[5]: 1397-1413 (2005).
11. S. Richard and J. H. Siewerdsen. "Optimization of dual-energy imaging systems using generalized NEQ and imaging task," Medical Physics 34[1]: 127-139 (2007).
12. R. J. Warp and J. T. Dobbins, III. "Quantitative evaluation of noise reduction strategies in dual-energy imaging," Medical Physics 30[2]: 190-198 (2003).
13. J. H. Siewerdsen, A. M. Waese, D. J. Moseley, S. Richard, and D. A. Jaffray. "Spektr: a computational tool for x-ray spectral analysis and imaging system optimization," Medical Physics 31[11]: 3057-3067 (2004).
14. J. M. Boone and J. A. Seibert. "An accurate method for computer-generating tungsten anode x-ray spectra from 30 to 140 kV," Medical Physics 24[11]: 1661-1670 (1997).
15. J. M. Boone. "Parametrized x-ray absorption in diagnostic radiology from Monte Carlo calculations: implications for x-ray detector design," Medical Physics 19[6]: 1467-1473 (1992).
16. AAPM Report No. 31, Standardized Methods for Measuring Diagnostic X-Ray Exposures," (1990). New York, American Institute of Physics.
17. Nationwide Evaluation of X-Ray Trends (NEXT): Tabulation and Graphical Summary of 2001 Survey of Adult Chest Radiography," (2005).
18. L. L. Barski, R. Van Metter, D. H. Foos, H-C. Lee, and X. Wang. "New automatic tone scale method for computed radiography," Proc.SPIE Image Display 3335: 164-178 (1998).
Proc. of SPIE Vol. 6510 651006-12
Top Related
Copyright © 2022 FDOKUMEN

