


Bahasa
Halaman
Hukum


Determinants of Bank Branch Expansion in Italy
Giorgio CalcagniniUniversità di Urbino, Facoltà di Economia
via Saffi 2, 61029 Urbino([email protected])
Riccardo De BonisBanca d’Italia, Research Department
via Nazionale 91, 00184 Roma([email protected])
and
Donald D. HesterUniversity of Wisconsin,
1180 Observatory Drive, Madison, WI 53706([email protected])
Abstract
This paper presents a model of de novo branching by Italian banks and reports estimates of itsparameters that were obtained by applying a probit-regression (or Tobit) method to cross-sectionsamples of up to 206 large banks for the years 1992-1996. The number of branches has increasedrapidly since about 1988. The model incorporates information on banking markets and economicactivity in provinces and on a bank’s own operating characteristics when attempting to describede novo branching in a province. The principal findings are: (1) variables describing existingmarket structure and recent past branch expansion by the bank and its rivals strongly influence denovo branching, (2) banks seek targets of opportunity when siting branches in provinces wherethey have a presence, where many communes in a province are unserved, and where branches percapita is low, (3) there is only a weak relation between a province’s level and change in per capitaGDP and de novo branches, (4) banks which merge are more likely to have de novo branches in aprovince than other banks, and (5) profitable banks with large number of workers per branch andlarge amounts of loans relative to deposits are likely to have more de novo branches.
This paper has been prepared for the 40th Società Italiana degli Economisti meeting to be held atthe University of Ancona on October 29-30, 1999.

1
Determinants of Bank Branch Expansion in Italy1
Giorgio Calcagnini
Riccardo De Bonis
Donald D. Hester
I INTRODUCTION
Since 1988 there has been a very large expansion in the number of bank branches in Italy
and in the number of communes served by branches. These developments are variously a
consequence of market pressures, Italy’s plan to join the European Monetary Union, and bank
regulation reforms in 1990 and subsequently. It is somewhat surprising, in a period when banks
are increasingly adopting modern data processing technology, that such large brick and mortar
investments should be occurring.
The goal of this paper is to identify determinants of bank branch expansion in Italy.
Branches are the principal interface between banks and their clients. The distribution of branches
within and across provinces defines markets for financial services, because branches are where
deposits are held and loans are arranged and where most Italian investors execute transactions for
stocks, bonds, and mutual funds. Further, Italy has large numbers of small firms relative to most
other countries in Europe. Small firms are very dependent on banks for short-term credit and for
funds which allow flexibility in responding to shocks. If banking markets were to become more
concentrated, through the process of branch expansion, Italy’s small firms could suffer. If more
branches were increasingly sited in affluent areas of the country, the distribution of income and
wealth could become more unequal.
To be able to deliver those important services to firms and individuals, recently privatized
banks must be profitable over time; their choices of locations in which to invest in new branches
1. We are indebted to Edoardo Tagliaferri at the Banca d’Italia and Maria Luisa Giachetti at A.B.I. for theirconsiderable assistance in providing data files. Calcagnini gratefully acknowledges financial support fromM.U.R.S.T. Al Schubert of the Social Science Microcomputer Laboratory at Wisconsin generously provided

2
are surely based on expected returns. The model and results reported in this paper are based on
arguments about the expected profitability of de novo branches.
The paper is divided into seven sections. After this introduction, Section II briefly reviews
trends in the number of banks, privatization, mergers, branches, measures of market competition
and concentration, bank profitability, and the changing role of banks in the Italian financial
system. Section III briefly surveys the literature on branching. Section IV provides a theoretical
discussion of decisions by banks to open branches, and a set of empirical hypotheses that are
subsequently examined. Sections V and VI discuss data resources and report empirical results,
respectively. The final section summarizes our findings.
II BANKS IN ITALY: AN OVERVIEW
a. Numbers of banks. There were 934 banks in Italy at the end of 1998, as compared to
1,154 in 1990. Between these years, the decrease occurred in all categories of Italian banks: joint
stock banks fell from 289 to 237, cooperative banks (banche popolari) from 107 to 56, and
mutual banks (formerly rural and artisan banks), from 716 to 563. By way of contrast, the number
of foreign banks in Italy increased from 37 to 59. Requirements on the specialization of banks
were weakened in the 1980s and legally eliminated in 1993 by the new Banking Code (Testo
Unico Bancario), which abolished the old categories of banks of national interest (banche di
interesse nazionale), credit institutes of public law (istituti di credito di diritto publico), and
savings banks (casse di risparmio). The number of banks decreased in the 1990s because of
mergers, not overt bank failures.
Bank restructuring is an ongoing process, far from complete. Between 1990 and 1998 the
number of Italian banks fell by 19 percent, less than the decrease in other European banking
systems. In the same period, the number of banks fell by 42 percent in Spain (from 696 to 406),
by 42 percent in France (from 2,105 to 1,226), and by 31 percent in Germany (from 4,720 to
3,238).
technical assistance that allowed this project to proceed expeditiously. The opinions and results presented are solelythose of the authors and do not necessarily reflect the positions and views of the Banca d’Italia.

3
b. Privatization of banks. Public sector banks became dominant institutions in Italy in the
1930s. Although public sector banks contributed to Italy’s post-war economic progress, by 1980
their deteriorating efficiency raised problems comparable to those posed by publicly-owned
industrial companies in Italy and elsewhere in Europe. A wide-ranging discussion led to reforms.
The first step was the transformation of public banks into joint stock companies that was allowed
by law 218/90, the so-called “Amato Law”. The general adoption by banks of the joint stock
company form made privatization easier. Privatization was undertaken by some very important
Italian banks, inter alia, Banca Commerciale Italiana, Credito Italiano, Istituto Bancario San
Paolo di Torino, Banca Nazionale del Lavoro, and Banca di Roma.
A distinctive feature of Italy was the considerable presence of public sector banks rather
than state banks, which are common in other EU countries. At the time the Amato Law was
passed, public sector banks were mainly controlled by foundations. The direct ownership of public
sector banks by foundations decreased sharply after 1990, but the role of foundations remains
important in the syndicate arrangements that control many Italian banks, and is reinforced by
interlocking directorates among financial intermediaries and cross-holdings of stock.
A bill on public sector banks was approved at the end of 1998. Following up on the Amato
Law, the new bill offered tax incentives to foundations for disposing of their equity in banks and
to banks for merging and restructuring.
c. Mergers. The evolution of the Italian banking structure loosely resembles the recent
experience of banks in the U.S. In the U.S. a wave of banking mergers began when a crisis in the
banking and thrift industries was first addressed with a series of mergers authorized by the Garn-
St Germain Act of 1982 and by regulatory authorities. U.S. bank mergers accelerated with the
enactments of the Financial Institutions Reform, Recovery, and Enforcement Act of 1989 and the
Riegle-Neal Interstate Banking and Branching Efficiency Act of 1994.
In Italy bank mergers and takeovers have also been occurring more frequently. Until 1989,
the annual number of mergers was around 12; they have averaged about 43 per year between
1990 and 1997. Most mergers involved relatively small mutually chartered banks. Southern banks,
that were often in financial distress, have been acquired by banks with head offices in the North

4
and Center regions. A typical merger had a large bank absorbing a smaller bank. Until recently,
mergers between banks of similar size were relatively rare.
There are several changes and conditions that explain the increase in mergers: the European
Common Market initiative of 1993 and the 1999 commencement of the European Monetary
Union; the small size of Italian banks relative to leading continental competitors; possible
economies of scale and/or scope; tax incentives introduced by the Amato Law and confirmed by
other laws; and bail-outs of banks in financial distress. These changes and conditions also partially
explain the growth in interbank stock holdings and the growing scale of banking groups,
structures that mitigate the economic, managerial and organizational stresses that otherwise
accompany mergers2.
d. Branches. The rapid increase in new branches after the 1990 liberalization interrupted
more than fifty years of severe barriers to entry in banking markets. Branches increased from
15,320 in 1989 to 26,255 in 1998. The number of new branches was very large in 1991 and 1992,
1805 and 3002 respectively. In the subsequent six years the number of new branches has been
about 1000 per year, with the exception of 1996 when it plunged to 316. In 1997 there were
2,270 inhabitants for each banking branch, as compared with 3,707 in 1989. In 1989 Italy was
certainly underbranched. International comparisons of banking structures show that in 1997 Italy
was about the median in European rankings of indicators of banking capacity (European Central
Bank, 1999, table 4.2). The South has fewer banks per capita than the Center and North. Due to
recent weakness of southern banks, the share of banks with head offices in the North and Center
in southern markets has increased from 23 percent of total branches in 1989 to 36 percent in
1998.
e. Overlap of banks and concentration. In the 1990s the Italian banking system has been
characterized by a higher degree of regional overlap than in the past3. In 1980 the average number
of banks in a province was 21. At the end of 1996 the average was 29 banks per province, even
though there had been a decrease in the number of banks in the country. The Italian banking
2. For a discussion of motives for and results from mergers, see Focarelli, Panetta, and Salleo (1999).3. Cf. De Bonis and Ferrando (1999).

5
system has historically been characterized by the prevalence of local banks. Few credit institutions
are active throughout the country. However, interprovincial banking has increased considerably
since 1980. In 1996 nine banks had branches in more than 40 provinces. An additional 32 banks
had branches in more than 10 provinces. The remaining 900 credit institutions had branches in
fewer than 10 provinces. At the end of 1998, 5,923 of Italy’s 8,000 communes (towns and
villages) had at least one bank branch, as compared with 5,018 in 1989.
Even with the considerable increase in mergers, indicators of local market concentration
decreased due to the intensification of branch openings. Herfindahl indices for branches decreased
in all but 8 of the 95 provinces between 1990 and 1996. Herfindahl indices for provincial loan
markets typically decreased from 1990 to 1994, increased in 1995 because of the absorption of
the special credit institutions by public-sector parent banks4, and then decreased further in 1996
and 1997. Herfindahl indices of provincial markets for deposits decreased monotonically between
1990 and 1997. Overall, mergers have not offset the trend toward lower local banking
concentration. Mergers have increased Herfindahl indices at the national level, but relative to most
countries in Europe, Italy’s banking market remains relatively unconcentrated. (Cf., Barth, Nolle
and Rice, 1997, Table 3 and Banca d’Italia, 1999, p. 17).
f. Profitability. Liberalization of the Italian banking system has been accompanied by
decreasing profitability. Profitability of Italian banks had been high until about 1993. However, in
the following four years average net profit as a percentage of assets has been among the lowest in
the European Union. Net interest income, the traditional source of Italian banks’ high profitability,
dropped. The causes are several. Competition has steadily increased in the Italian banking system
since about 1985. The recession that hit the economy around 1993 led to increased loan losses.
Finally, as Italy prepared to join the European Monetary Union, the convergence of economic
fundamentals led to reductions in inflation and interest rates. Because of the relatively large stock
of government debt in Italy, interest rates on deposits could not fall as rapidly as those on assets;
the drop of net interest income has been more severe than elsewhere in Europe.
4. The increase results from a statistical discontinuity that took place in 1995; consolidation of the special creditinstitutions with public sector banks occurred between 1990 and 1992, but the consequences were not incorporatedin statistical reports until January 1995.

6
g. Role of banks in the Italian financial system. Banks continue to be the heart of the
financial system, although, as in other industrialized countries, there has been some erosion in
their market share. Bank deposits have decreased from 68 percent of GDP in 1974 to 43 percent
in 1996 and from 63 percent in 1982 to 29 percent of domestic financial assets in 1998. On the
other hand, bank loans have increased from about 45 percent of GDP in 1985 to about 60 percent
in 1997, in part financed by bank-issued bonds which have been rising sharply in recent years.
Banks currently control around 60 percent of mutual fund companies and 80 percent of their
assets.
III LITERATURE ON BRANCHING
The literature on the economics of bank branching is fragmentary and diffuse. In the U.S. it
is in large part a segment of the literature on banking market structure, which has been surveyed
by Gilbert (1984), Berger, Demsetz and Strahan (1998), and Berger and Mester (1999). Gilbert
reports that studies of bank operating results in U.S. states, which had different branching laws
until quite recently, have produced a wide variety of results. He attributes this muddle to an
absence of strong theoretical specification, weak data, inappropriate estimation techniques, and a
failure to recognize the effects of regulation on performance. These studies began to appear in the
1960s when a wave of bank mergers and related anti-trust court cases occurred.
More recently, applying Fourier flexible-form techniques to data from one large U.S. bank,
Berger, Leusner and Mingo (1997) report:
“that most branches are considerably smaller than efficient scale, consistent with otherstudies. There may be roughly twice as many branches as are needed to minimize bank costs.However, the average cost curves are relatively flat. . . . Moreover, some scale inefficiency maybe optimal from a profitability standpoint, since additional offices provide convenience for thebank’s customers, that may be captured by the bank on the revenue side.” (p. 159)
Studies of branches in Italy are also relatively recent5, coinciding with the post-1987
5. An exception is Ciocca, Giussani and Lanciotti (1974). For a discussion of the increase in competition in theeighties, see Ferri and Gobbi (1992). Caruso and Pompilii (1996) reported an empirical model of branch expansionfor the province of Roma.

7
explosion in branches. De Bonis, Farabullini and Fornari (1998) have documented that branch
expansion has reduced concentration in provincial markets and that mergers have increased it at
the national level, as was noted above. We have constructed province-level Herfindahl indices for
a panel of 193 banks and report here that cross-sectional correlations among indices constructed
for branches, deposits, loans, and ATMs are very high and essentially trendless, although each of
the four indices has been falling between 1991 and 1996.
Cerasi (1996) has proposed a two-stage noncooperative game model of banking
competition to analyze branch structure. It views banks as competing in two dimensions: (1)
expanding a network of branches and (2) varying interest rates. In the first stage, a bank is
assumed to choose the size of the network and, in the second, set interest rates. In empirical
work, Cerasi, Chizzolini and Ivaldi (1998b) skip the second stage and impose a somewhat ad hoc
reduced-form equation for profits. Using very strong assumptions about the frequency distribution
of the cost of establishing branches in a static model and the elasticity of profits with respect to
branches, these authors were able to construct a log-likelihood function that allowed them to
draw the following conclusions about the Italian banking industry: (1) the industry is segmented
across regions, relative to the degree of competition that prevails in each region, (2) the marginal
profitability of a branch has increased over time, (3) Testo Unico Bancario has had the effect of
increasing competition, and (4) costs of a branch rise with the distance between a province and
the location where the bulk of a bank’s business is conducted.
They studied some of the data used in the present paper, but made no allowance for
mergers. Also, they aggregated data to the level of 20 regions rather than use data at the finer
level of 95 provinces which was possible. Their findings seem at variance with the well-established
fact that banking profits in Italy, as a percentage of assets, have been trending down since 1993
when the rapid expansion of branches was occurring. In Cerasi, Chizzolini and Ivaldi (1998a), the
same model is applied to a sample of EEC banks for the years 1989-93, where data were
aggregated up to the level of a country.
In a very creative paper, Barros (1995) employed a two-stage estimation procedure that is
similar in spirit to the present paper. In a study of Portuguese banks, he reported that privatised

8
banks were more likely to expand than other banks and that existing (incumbent) banks did not
respond to branches opened by new entrants. He also reported that banks which were involved in
mergers were more likely to open new (de novo) branches.
Finally, in a statistical cost accounting study of large cross-sectional samples of Italian
banks, Calcagnini and Hester (1997) reported that there was no relation between a bank’s profits
and number of branches, after the effects of portfolio composition have been taken into account.
While individual banks may have been in disequilibrium, shadow prices and interest rates did not
indicate systemic disequilibrium over the years 1988-92.
IV BANK BRANCHING DECISIONS AND STATEMENT OF HYPOTHESES
a. Some framing issues. When making decisions about branch expansion, we assume banks
are attempting to maximize the expected present value of future net income in a dynamic game.
This assumption requires some defense and explanation.
First, in 1990 many Italian banks were publicly controlled and, therefore, not necessarily
maximizing any function of profits. Managers of publicly controlled banks may perceive welfare in
very diverse ways that do not require maximizing the expected return to capital or present values
of stockholder net worth. Privatization of public-sector banks necessarily forced managers to
change their focus by adopting restructuring that would allow banks to be viable in an evolving
European monetary system. In this study we suppose that they were rationally acting as if they
were already privatized.
Second, some publicly controlled institutions and private banks were unsoundly managed
and not viable in the new system; they had to be recapitalized and/or combined with other
institutions. Other institutions have responded to the changing environment by seeking voluntarily
to merge. This process surely differs from a bank’s unilateral decision to open or close a branch.
In empirical work that we report, mergers are interpreted as exogenous shocks; controls for the
effects of mergers are incorporated in specifications that are studied.
Third, the solution concept in a dynamic game is unavoidably arbitrary. We view banks as

9
players who were almost randomly positioned by the public control process from which they are
emerging. Dynamic games do not necessarily have a stationary equilibrium. Players may have
adopted a variety of strategies that they believe (possibly erroneously) will achieve a desired
outcome. Our intent is to model a representative bank’s decisions to open branches. A bank is
assumed to make decisions about branches subject to a set of initial boundary conditions, its initial
branch configuration and the branch distributions of its rivals. It is assumed to be a Cournot player
who assumes rivals are responding to a bank’s past moves, but take no contemporaneous actions
in response to a bank’s current moves. This unavoidably strong modeling assumption allows us to
view contemporaneous error terms as being independently distributed.
Fourth, provinces have enough area to contain several small communal markets. A
communal representation of markets cannot be studied with available data. For the most part, we
view provinces as markets.
b. Discussion. A bank chooses how many branches to have in each of Italy’s 95 provinces
subject to a variety of constraints and incentives6. Decisions to open or close branches or to
merge are made by banks, using data about the condition of the bank and information about
conditions in a province. For the period we study, there were up to 206 players in the game,
controlling about 85% of Italian banking assets. The other approximately 750 banks are largely
banche di credito cooperativo (BCC), which can be thought of as large credit unions with one or
two offices. In the model they are viewed as passive players, but the effects of their presence in a
province can be taken into account. While the game is played nationally and increasingly
internationally, it is helpful to start by thinking about it in a single province.
When viewing a province as a market and abstracting from the possibility of mergers, there
are two distinct events which could be modeled: (1) a decision by a bank with a presence in a
province to open or close a branch and (2) a decision by a bank not serving the province to open a
branch. This dual entrant approach has not been adopted, because it misses consideration of the
tradeoff among markets and the set of potential entrants is not well defined.
6. The number of Italian provinces is 103 as of this writing, but the older classification of 95 provinces has beenuniformly employed in this paper.

10
A second more appealing approach, similar to that of Barros, views each bank as having a
two-stage decision-making process: (1) how many branches to open and (2) in which provinces to
site them. Because most banks are only serving a few provinces, there will be many provinces in
which a bank is not present and is also not likely to enter. We envision the existence of a threshold
condition, which must be satisfied before a bank would choose to have a branch in a province.
Only if enough encouraging indicators are present would a bank enter or expand the number of
branches in a province. However, this two-stage, decision-making process is difficult to analyze
formally, because of the likely presence of large unobserved set-up costs and network effects.
Branches are lumpy and largely indivisible investments. A new branch is expected to be underuti-
lized for several years and to draw clients from its own and rivals’ branches. Such complicated
capital budgeting problems are not easily represented.
We approach the problem by expressing de novo branches in a province in a year as a
function of a set of variables that summarize a bank’s data and a second set that summarizes
provincial data. The model is used to study a panel of banks for which annual observations exist
between 1991 and 1996. The panel is well defined for banks that are not in a merger. If a merger
occurs, bank data for the larger of the merging banks (in terms of total assets) is assumed to
define the prior history of the enterprise in the panel. Mergers are taken into account by adding
several annual control variables for a bank in a province that (1) measure the number of sample
bank branches acquired through mergers, (2) record whether or not a merger has occurred among
sample banks, and (3) count the number of mergers that occur between sample and nonsample
bank. This specification implies that mergers are exogenous events. The coefficients on control
variables allow tests of the hypothesis that de novo branches and branches acquired through
merger are “substitutes”.
It remains to describe the variables that are used to predict the number of branches that will
be opened and where. These hypotheses are summarized and briefly defended in the following
subsection. All hypotheses should be interpreted to be conditional - - i.e., holding constant the
values of other variables that are expected to influence branch expansion.
c. Hypotheses about de novo branches. First, a bank’s initial 1990 branch configuration is

11
expected to be a major determinant of where it sites new branches. Because a bank with a
conspicuous presence will have built a reputation as a provider of services and will be familiar to a
community, it has an advantage in establishing branches relative to an outsider. This is likely to be
especially important in Italy where provincial and local loyalties are pronounced. Further, staff
expertise and information can easily be shared among a bank’s branches in a province. By
extension, a bank’s expansion into adjacent provinces is expected to be much easier than into
provinces at further remove. By implication, interprovincial diversification is not expected to be
an important consideration in siting branches. We measure a bank’s presence by the share of
branches in a province that it had at the end of the preceding year. Specifically, the hypothesis is:
Hypothesis one: The number of de novo branches of a bank in a province in a year is anincreasing function of its share of branches in the province at the beginning of a year.
Second, De Bonis and Ferrando (1997) have reported the presence of a positive relation
between a loan Herfindahl index in banking markets and the loan interest rate. During the period
being studied in the present paper, Herfindahl indices decreased at the provincial level. This
suggests that entry is successfully occurring at the provincial level, even if dominant banks in a
province are attempting to deter entry. Higher loan interest rates in a province are expected to
encourage entry. Recalling that Herfindahl indices for branches and loans are positively correlated,
the second hypothesis is:
Hypothesis two: The number of de novo branches of a bank in a province in a year is anincreasing function of the branch Herfindahl index in the province at the beginning of the year.
Third, when a bank has increased its branches in a province in the preceding year, the
attractiveness of an additional branch increases, because of synergies associated with network
effects in a province. An example of such network effects is automated teller machines (ATMs).
Most new bank branches in Italy incorporate one or more ATMs. The value to clients of a bank of
a debit card increases when more of the bank’s ATMs are available in a province. The quality of
other services is similarly enhanced by having more branches in a province.
Hypothesis three: The number of de novo branches of a bank in a province in a year is anincreasing function of the change in a bank’s own branches in the preceding year.

12
Fourth, if competitors expand the number of branches in a province, managers and public
overseers of a bank are expected to feel threatened in terms of their salary, community image, and
ability to deliver a viable institution to stockholders. Further, a recent expansion by a rival signals
that the rival believes profits can be achieved through expansion. In a world of imperfect
information, a bank is expected to learn and draw inferences about the promise of a market from
actions taken by rivals. We predict that recent past expansion by rivals in a province increases the
probability that a bank will respond by opening a branch. The changes in branches of rival banks
that are of concern are net of any downward changes in rival sample banks due to mergers with
the bank in question.
Hypothesis four: The number of de novo branches of a bank in a province is an increasingfunction of changes in the branches of other banks in the province in the preceding year, net ofchanges in rival sample bank branches due to mergers with the bank.
Fifth, the probability that a bank will open a branch is an increasing function of the
perceived levels and rates of growth of a province’s per capita gross domestic product (GDP).
Ceteris paribus, a prosperous and expanding market is much more attractive than one that is
stagnant, both as a source for deposits and a place to lend.
Hypothesis five: The number of de novo branches of a bank in a province in a year is anincreasing function of the level of or change in per capita GDP in the province in the precedingyear.
Sixth, the probability that a bank will open a branch in a province should be higher if the
province is recognized to be “underbanked”, which could be indicated by a low ratio of branches
to adult population.
Hypothesis six: The number of de novo branches of a bank in a province in a year is adecreasing function of the ratio of all sample bank branches to adult population in the province atthe beginning of the year.
Seventh, the expansion of a bank’s services in a province is much facilitated when a bank
already has a presence in the province. This is an insight that underlies Cerasi’s model (1996),

13
where it was assumed that branches of a bank are much less costly to maintain than a bank’s
central office. A first branch in a province functions as a central office. The market potential of a
province for a bank is measured partly by the distribution of the province’s population among
communes. A rough measure of a province’s market potential for a bank with one or more
branches is the ratio of the number of a province’s communes to the number of the bank’s
branches in a province. Adding branches in a province, of course, also facilitates the realization of
benefits from network effects. Thus, partly in the spirit of Cerasi’s model we have:
Hypothesis seven: The number of de novo branches of a bank in a province in a year is anincreasing function of a synthetic variable that has a value equal to the ratio of the number of aprovince’s communes to a bank’s branches in the province, if a bank has branches in the province,and zero otherwise.
Eighth, because of the ongoing strengthening of competition among international banks,
large Italian banks are vulnerable to encroachment by other large Eurobanks. If economies of
scale exist, branch expansion and merger activity should be more frequent among large banks and
among banks in provinces where Eurobanks are likely to enter during this period of transition.
Recalling that mergers are assumed to be exogenous, we predict that when branches are acquired
through mergers a bank is also more likely to have de novo branches in a province:
Hypothesis eight: The number of de novo branches of a bank in a province is higher when abank merges with another bank having branches in the province.
Finally, a bank’s own condition, as measured by balance sheet ratios, may encourage it to
expand more or less rapidly by opening new branches, irrespective of conditions in a province.
Thus, banks with high rates of profit may be encouraged to have more de novo branches.
Similarly, banks with high ratios of overdue (sofferenze) to outstanding loans may choose to open
fewer branches. Banks with a high ratio of workers per branch may have a different willingness to
open new branches than one with few workers per branch. These and other characteristics of
banks are believed to explain bank decisions to open branches. However, they should not be
expected to affect all provinces equally (additively). Our maintained hypothesis is that bank level
variables affect province branching decisions in proportion to a bank’s beginning of period

14
number of branches in the province. These variables are included in the following portmanteau
hypothesis:
Hypothesis nine: The number of de novo branches of a bank in a province is expected to berelated to balance sheet and income statement variables of the bank multiplied by the number ofbranches it had in the province at the beginning of a year.
V DATA RESOURCES AND DESCRIPTIVE STATISTICS
We have data files about individual banks, about economic activity and banking markets in
provinces, and about an individual bank’s activities in each province. Data about individual banks
are from an unbalanced panel that spans ten years, 1988-97; they include income statements,
balance sheets, merger history and other operating statistics. Data about provinces have been
assembled for seven years, 1990-96; they include information about income (GDP), population,
and Herfindahl indices for branches.
Information about a bank’s activities in a province includes numbers of branches, ATMs,
deposit accounts, and employees, as well as the amounts of deposits and loans. The bank data set
was constructed from several independent files that recorded information on large banks. One set
contained information on numbers of branches and the amounts of deposits and loans for 268
banks (hereafter referred to as “core banks”) between 1990 and 1996. There were 87 banks in the
core of 268 that merged with other core banks between 1991 and 1996, and one core bank that
disappeared in a merger with a noncore bank. As explained above, when a merger occurs, the
history of the merged bank is assumed to be described by preceding data of the largest merging
party. Information on a bank’s employees was combined with information in the file on core
banks. Information on ATMs was less complete; it has been combined with information on core
banks and analyzed in Hester, Calcagnini, and De Bonis (1999).
In the present paper we analyze samples of up to 206 banks that are observed in the years
1991-96. Banks disappearing in mergers are not included, but the number of branches they
brought to surviving banks is taken into account7. Of the 62 core banks that have been totally
7. Banks disappearing in mergers present several problems. First, the assumption that they were maximizing thepresent value of net worth is difficult to defend. We have no way of measuring their value at the time theydisappear. Second, their branching decisions may be affected by the decision to merge, but we don’t know when

15
excluded, 54 were banks that disappeared in mergers with other core banks. Five other banks
were discarded because they were central credit and refinancing institutions that provided services
for different categories of banks, but had few dealings with the public - - i.e., they were “bankers’
banks.” Three banks were excluded because of missing branch information. In addition, a small
number of other banks were excluded from some annual samples because of incomplete
information. The number of banks appearing in statistical results are clearly indicated in tables.
Information on provincial nominal GDP and population was obtained from web site of the
Istituto Guglielmo Tagliacarne.
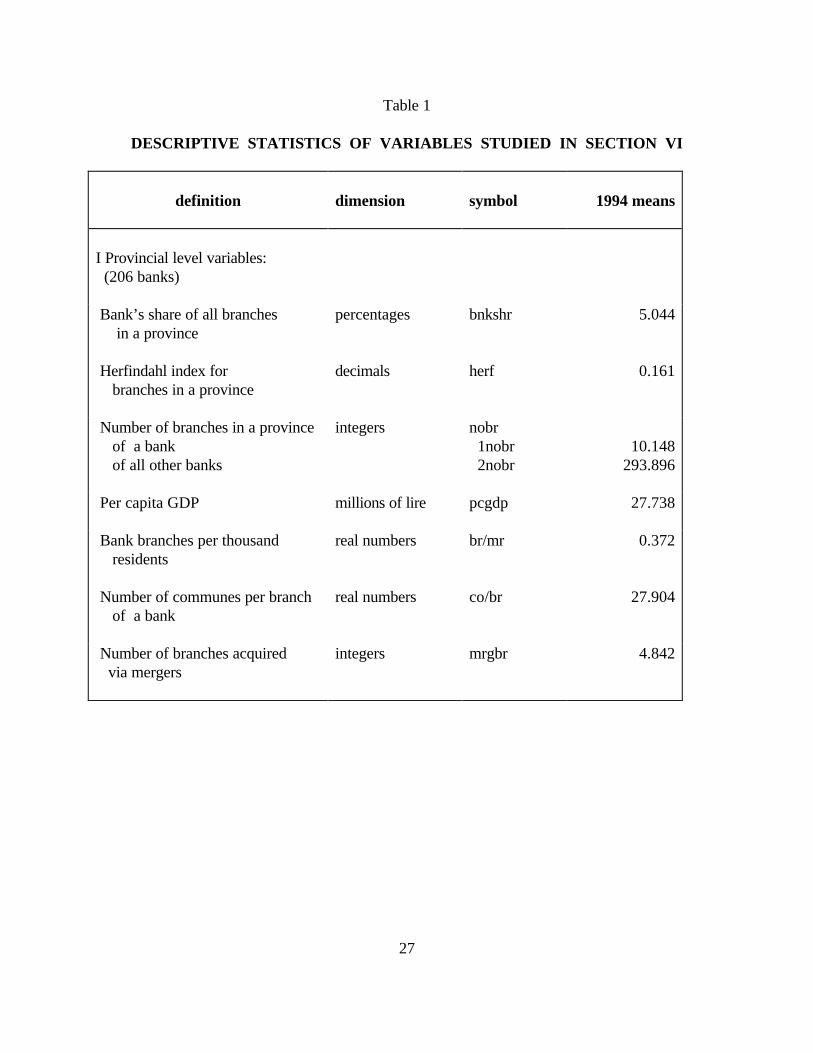
Table 1 reports mean values of variables in 1994 and the units in which they are measured.
The table requires some interpretation. The first part of the table is constructed from provincial
data; bank measures are constructed from our sample of large banks for those provinces where a
bank had at least one branch. Thus, relative to all banks operating in a province, the first three
means are overstated. The mean number of all other sample bank branches in a province reflects
the fact that the distribution of sample bank branches is highly skewed across provinces; large
banks tend to have many branches concentrated in major markets. The number of branches
acquired through mergers measures the number of branches that changed sample bank affiliation,
whether or not an acquiring bank was previously present in a province. The same interpretation
applies to other merger variables in Table 1.
The second part of Table 1 reports information about sample bank means of balance sheet
and income statement variables. Total assets overstate the amount of intermediation services
banks perform for nonfinancial clients in Italy, because there is a large interbank market. For
example, in 1993 the mean ratio of a bank’s interbank loans to total assets was about 20%; the
mean ratio of a bank’s interbank borrowing to total assets was about 10% (Calcagnini and Hester,
1997, tav.2). The difference exists because large banks are borrowers and small banks lenders. In
Table 1, net interbank borrowing vastly understates this interbank market, because only 67 large
banks were borrowers and 138 were lenders. The mean bank’s interbank lending and borrowing in
our sample were respectively 2,147 and 2,575 billion lire in 1994; the amount of its total assets
that decision was reached. Third, mergers had to be approved by the Banca d’Italia; which may have had regulatoryconcerns that affected a bank’s behavior.

16
was 10,145 billion. This market may be important for analyzing branching decisions, because
interbank transactions represent an alternative channel to branching through which banks may
transfer funds from lenders to borrowers. The large increase in bank branches must in part reflect
high agency costs that accompany interbank transactions. Deposits and loans in the table exclude
interbank transactions. Sample banks’ loan losses and write offs in 1994 exceeded net current
operating income that year. Overdue loans also exceeded net operating income.
The ratios at the end of Table 1 are simple averages of individual bank ratios in 1994. The
average ratio of overdue loans is smaller than the ratio of aggregate overdue loans to total loans,
which implies that overdue loans are relatively more concentrated in large banks. Similarly, the
average ratio of net operating income to total assets is higher than the corresponding ratio of
aggregates, which implies that smaller banks have relatively better net operating income results.
Mean deposits exceeded mean loans by 23% of assets in 1994, but this difference and the number
of employees per branch were steadily trending down over the period we study8.
To test hypothesis nine - the impact on new branches of banks’ profitability and activity -
bank variables have been constructed from annual balance sheets and income statements (Bilbank)
that were obtained from the Associazione Bancaria Italiana (ABI). Information is missing for
some banks in our sample for some years which required that banks be dropped in those years.
The bank variables are constructed from income statements in the year immediately preceding and
balance sheets at the beginning of the year for which branch changes are recorded. All bank
variables have been weighted by the fraction of a bank’s branches that appear in a province.
VI STATISTICAL METHODS AND EMPIRICAL RESULTS
a. Some methodology issues. In principle, each bank could consider having branches in any
of the 95 provinces that we study. Because only seven banks were observed to have branches in
as many as 80 provinces, there are large numbers of bank/province pairs which have no branches.
It is convenient to think of a bank constructing a weighted average of factors favorable to opening
a branch in a province. If the weighted average score exceeds some threshold value, a bank would
want more branches. Among the important factors in the weighted average is the reputation and

17
history of service that a bank has in a province, which are both unobserved variables. We assume
that these unobserved variables have a stationary distribution. For many banks in many provinces,
these variables have such large negative values that banks would not want a branch there.
However, in some provinces some banks will find enough favorable conditions to want to increase
branches - - i.e., they cross the threshold. We assume that the desired number of new branches
is a linear function of the arguments in the weighted average. Such functions can be estimated
using a probit regression (“Tobit”) technique developed by Tobin (1958). We employ this
technique to estimate the number of a bank’s de novo branches in a province.
The number of provinces where sample banks had positive changes in branches decreased
monotonically from 563 in 1992 to 470 in 1995 and then rose to 473 in 1996. The number of
provinces where sample banks had negative changes rose monotonically from 18 to 34 in 1995
and 44 in 1996. These changes suggest that the number of bank branches in Italy was very slowly
converging to an equilibrium.
A complication with applying the Tobit procedure is that the dependent variable, the
number of de novo branches, can be negative. Decisions to close branches are infrequent in our
data. The method would be inappropriate if banks were very likely to reduce branches in
provinces. The use of the method can be defended, because it is likely to be much more costly to
close branches than to open them in the Italian context, and banks are surely taking this cost into
account when setting a threshold9.
A second complication for studying changes in branches is the question of how many
degrees of freedom are available. If one views decisions about new branches as being made at a
bank’s head office, then up to 206 degrees of freedom are available. On the other hand, if one
views all banks as being described by a single decision-making rule in all provinces, then the
number of degrees of freedom equals the number of bank/province observations - - i.e., the
number of provinces times the number of sample banks, irrespective of whether a bank has a
branch in a province. It is a maintained hypothesis in the present paper that banks all are described
by a common decision-making rule.
8. Cf. Castelli, Martiny, and Marullo Reedtz (1995).

18
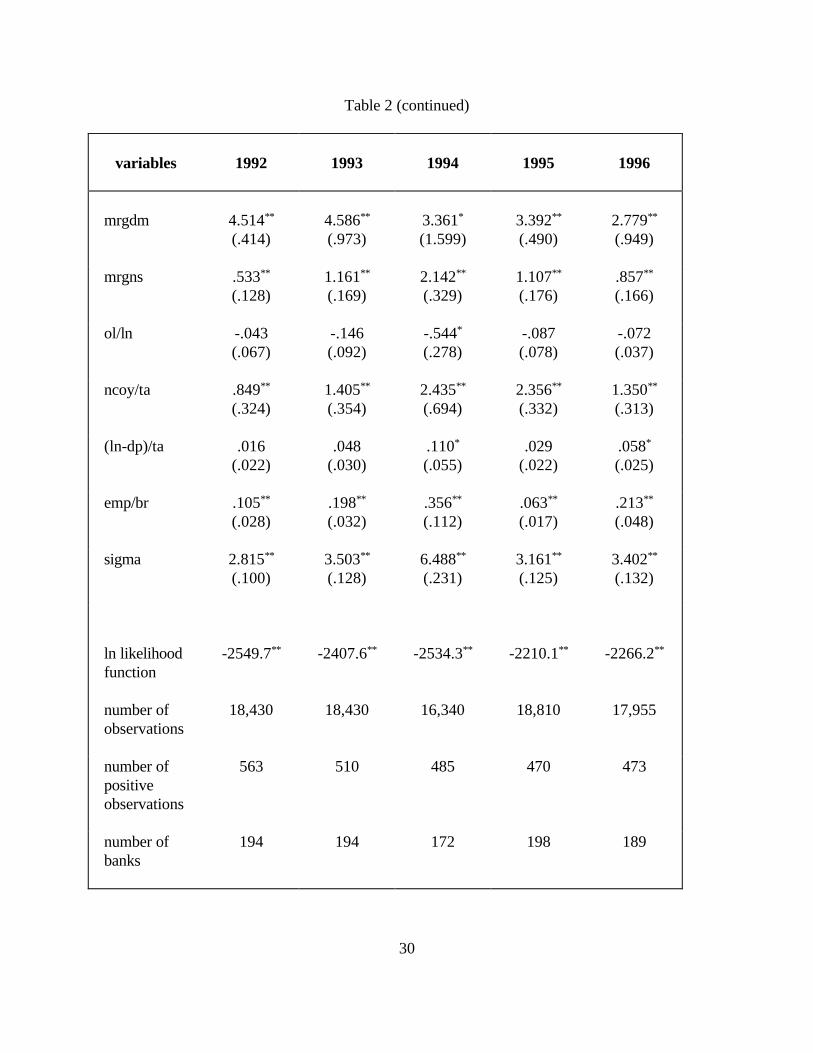
b. Empirical results and tests of hypotheses about de novo branches. Table 2 reports Tobit
results for annual cross sections of bank/province observations for the years 1992-96. Applying
the standard chi-square test to the reported logarithms of the likelihood function allows the null
hypothesis of no relation between changes in branches and the variables shown to be rejected each
year, at conventional levels of significance. With few exceptions, parameter estimates are
significantly different from zero and have the predicted signs.
Hypothesis one: As predicted, de novo branches of a bank in a province are positively
correlated with its share of the province’s branches at the beginning of a year. Evidently, network
effects, lower costs of establishing branches where a bank has a presence, and a desire to deter
entry lead banks to prefer to expand locally in a province.
Hypothesis two: Contrary to our expectation, the Herfindahl index calculated for branches
in a province at the beginning of a year is negatively related to de novo branches of a bank in the
province. Apparently banks with large market shares in a province can impose sufficient costs on
potential entrants to induce lower rates of branch expansion than in other more contested
markets. Herfindahl indices for branches and loans are, on average, decreasing over time in
provinces, but at a lower rate in provinces where they are high.
Hypothesis three: As predicted, de novo branches of a bank in a year are large when the
bank’s branch changes in the province were large in an immediately preceding year. This seems to
have an interpretation that is similar to that for a bank’s share of branches in a province
(hypothesis one). There are apparently economies of scale in the process of establishing new
branches and in promoting a bank’s expansion. Branch expansion is a continuing process that is
not confined to a single calendar year. The very large coefficient in 1992 suggests that banks
began 1992 with a continuing multi-year program to open branches in selected provinces. As
noted in Section II, a record number of 3000 new branches were opened in Italy in 1992.
Hypothesis four: As predicted, de novo branches of a bank in a province are also posi-
tively correlated with rival banks’ changes in the number of branches in the province in the
preceding year. This can be interpreted to indicate that some provinces are seen as especially
9. The observed instances may partly be a consequence of coding errors; they can awkwardly be managed by re-coding negative changes as “no change”, as is automatically done in conventional Tobit computer programs.

19
promising by many banks over several years. Alternatively, in a world of imperfect information,
some banks filter decisions by other banks for clues about where future prospects are good. This
clustering or “following the crowd” behavior may be a consequence of severe disequilibrium that
was caused by past restrictions on branching. It brings a threat of instability that comes from
overshooting, if too many branches are established in a competitive struggle as banks seek
locational rents.
Hypothesis five: Except for 1992, high per capita GDP in a preceding year induced banks
to open more branches in a province. This behavior is superficially plausible because markets were
in disequilibrium. However, it is difficult to rationalize the absence of significance in 1992 with
such an interpretation. That year it seems banks were more concerned with completing their
aforementioned expansion program than responding to interprovincial differences in GDP.
De novo branches of banks in a province were positively related to changes in per capita
GDP between the contemporaneous and the immediately preceding year in 1992 and 1996, but
negatively related to GDP changes in other years. We had expected de novo branches and per
capita GDP in provinces to be positively correlated, and have no good explanation for the pattern
that materialized. If one partitions the change and combines the lagged coefficient with that on the
lagged level of GDP, at least one of the two GDP variables is always positively related to changes
in branches.
Hypothesis six: As expected, de novo branches of a bank in a province are always
negatively related to the ratio of the total number of bank branches to population at the beginning
of a year; provinces that are overbranched should not be promising sites for expansion. However,
only three parameter estimates have absolute values of their t-ratios greater than two.
Hypothesis seven: The ratio of the number of communes in a province to the number of a
bank’s branches at the beginning of a year is significantly related to de novo branches in every
year. As noted in Section IV, we interpret this variable to indicate that banks with a presence in a
province are well positioned to serve local markets within the province. Such banks should find
expansion into unserved niches relatively inexpensive.
Hypothesis eight: The remaining three variables are technical constructs designed to
control for mergers and their effects on de novo branching. The first variable, mrgbr, is the

20
number of sample bank branches that were acquired through mergers with other sample banks in a
year. The second variable, mrgdm, takes on a value of one if a merger occurs with another
sample bank in a year, and zero otherwise. The third merger variable, mrgns, is the number of
mergers that a sample bank had with nonsample (typically small) banks in a year. In all years all
parameter estimates for these three control variables are positive and in thirteen of fifteen cases
they are significantly different from zero at the .05 level. Collectively, they imply that banks which
merge are more likely to have de novo branches in the year in which the merger occurs than other
banks in a province. An interpretation is that branches acquired through mergers and new
branches are complements. Some banks are more committed to expansion through an increase in
the number of branches than other banks. Because decisions to merge are assumed to be
exogenous in this paper, results in Table 2 indicate that measures of merger activity can be taken
as indicators that a bank is likely also to have more de novo branches in a province10.
Hypothesis nine (portmanteau hypothesis): This hypothesis consists of predictions about
how measures from a bank’s balance sheet and/or income statement affect de novo branching by a
bank in a province. All bank variables are measured at the beginning of a year (or the preceding
year’s value in the case of flows) and weighted by the fraction of a bank’s branches that are
located in the province.
The first bank variable, ol/ln, is the ratio of overdue loans to outstanding loans at a bank.
We expected that banks with high proportions of dubious loans would attempt to conserve capital
and, thus, be less likely to open new branches. Although all parameter estimates for this variable
are negative, only one has a t-ratio that is marginally significant. Therefore, this component of the
portmanteau hypothesis nine is judged to be rejected. Bank branch expansion was not deterred by
a history of loan repayment delays.
The second variable, ncoy/ta, is a measure of bank operating profitability. In every year
this variable has a positive coefficient with a large t-ratio. Banks with high net operating income
are likely to be opening new branches. This component of hypothesis nine is accepted. We also
tried profits after taxes as a percentage of total assets instead of net operating income in these
10. Focarelli , et al. (1999, p. 79) have reported that acquiring banks in mergers are likely to be large, profitable,and have a high fraction of their income from fees for providing services.

21
equations. Its coefficients were usually insignificant; this difference in the two income measures is
a likely result of accounting practices. The two income measures are not highly correlated, when
expressed as a fraction of total assets because the latter includes the effects of taxes, decisions to
write off bad loans, and other accounting anomalies.
The third variable, (ln-dp)/ta, is the difference between noninterbank loans and deposits,
expressed as a percentage of a bank’s total assets. We expected its parameter estimates to be
positive, because it is a measure of the demand for funds that a bank faces. We interpret branches
to be mostly instruments to collect funds for a bank. This variable’s coefficients are uniformly
positive, but only marginally significant in 1994 and 1996. This component of hypothesis nine is
marginally accepted. We also tried another measure of demand pressure, net interbank borrowings
by a bank expressed as a percentage of total assets, instead of loans minus deposits. Its
coefficients were never significantly different from zero. Counter to our expectation, we conclude
that the interbank market is not a substitute for bank branches as a mechanism for providing
intermediation services to clients.
Finally, the fourth variable, the number of employees per branch, was expected to be
positively related to de novo branching in a province. We have two competing rationalizations for
this prediction. First, bank labor costs are very high in Italy and, because of labor market
dynamics, employees are infrequently dismissed because of excess capacity. One mechanism to
get around this institutional restriction is to increase the number of branches and reallocate
workers to gain more output from this effectively fixed input. At the bank level, employees per
branch have been decreasing monotonically over the period we study. Second, banking markets
are believed to be most contested in large urban areas, e.g. Milano, Roma, Torino, Bologna, and
Firenze. Most new branches were created in such markets during the period we study, although
the percentage growth rates were somewhat larger in other areas. Large urban areas are the most
likely location of head offices and branches that are expected to be able to provide sophisticated
services, which require additional specialized staff. In Table 2, the number of employees per
branch is positively and significantly related to de novo branches in every year. This component of
hypothesis nine is accepted.
c. Subsidiary hypotheses about de novo branches. In addition to reporting results of tests

22
of hypotheses about province and bank variables, we examined three other questions about the
structure of the Tobit model. First, would results in Table 2 be much affected by replacing
d2nobr, the change in the number of branches of rival banks from the sample of large banks, with
the change in the number of branches of all competitor banks in a province - - i. e., including the
change in the number of branches of smaller nonsample banks? The results were not very different
from those shown in Table 2 and are not reported here. However, coefficients on the change in
the number of branches of the larger group of rivals trended up over time relative to coefficients
on d2nobr, which suggests that sample banks were increasingly responding to expansions by
smaller banks in a province.
Second, were the annual Tobit regressions invariant over the period we studied? This
question was considered by estimating an equation analogous to those in Table 2 from a sample
pooled over all five years. The estimated values of sigma reported in Table 2 and the
corresponding value from the pooled sample can be used to calculate residual sums of squares.
The difference between the sum of squared residuals of the pooled sample and the summed
squared residuals of the equations in Table 2 was 9.28% of the pooled sample sum of squared
residuals. Because the Tobit model is nonlinear, conventional analysis of covariance tests are not
valid, but the large difference in summed annual and pooled estimates of variances strongly
suggests that the structure was not stationary over the five-year period.
Finally, did banks that merged with other sample banks in a year have different Tobit
regressions from those that did not? Again, because of the nonlinear nature of the model, it is not
possible to provide a rigorous answer. Bank variables are especially difficult to interpret, because
in most years only a small number of banks merged with other sample banks. However, provincial
variables have parameter estimates that almost always have the same signs in a given year when
relations estimated for merging banks and nonmerging banks are compared (42 out of a possible
45 comparisons). We tentatively conclude that similar forces are driving de novo branching in
provinces by these two groups of banks.
VII SUMMARY
The results in Table 2 indicate that conditions in markets, defined as provinces in this paper,

23
strongly influence de novo branching in Italy over the years 1992 through 1996. These conditions
can be grouped into three broad sets of variables. First, variables that describe market structure in
a province and its recent changes strongly affect decisions by banks to open branches in the
province. If a bank’s share of branches is large or if either the bank or its rivals have recently
increased their branches in a province, the expected number of a bank’s de novo branches in a
year is higher. However, if a Herfindahl index constructed from the distribution of branches in a
province is high, the expected number of new branches is lower. An interpretation is that banks
seek to deter entry when their market share is large and exhibit a herding instinct when entering
markets, which may well lead to overshooting. They shun markets which are very concentrated.
Second, banks seek targets of opportunity where they already have a presence and the ratio
of communes to their branches in a province is large. This partially confirms the modeling
approach of Cerasi (1996), which emphasized that subsidiary branches are quite inexpensive to
establish. There is also some evidence that a high ratio of branches per capita in a province
deterred entry.
Third, there is some support for arguments that banks seek to open new branches in
provinces where per capita GDP is high or rising, but neither variable is tightly related to de novo
branching. The initial 1990 distribution of branches already reflected the distribution of GDP
across provinces. The expected marginal returns to opening a new branch in affluent provinces
apparently were not especially high.
Results in Table 2 strongly suggest that merging banks were much more likely to open de
novo branches in a province than other banks. An interpretation is that there are two distinct
populations of banks; (1) a group of highly expansion-oriented institutions that seek branches
aggressively and (2) a more passive group that desire to expand at a slower pace through de novo
branching. While it is difficult to infer motives that lead to merger and growth, we note that banks
that are the result of mergers have head offices that are concentrated in the North and Center,
where large foreign (Euro) banks are most likely to enter Italy. An interpretation is that growth by
Italian banks was necessary if they were to remain viable in the evolving European Union. Italian
banks are small and the national market is unconcentrated relative to other countries in Europe.
Finally, Table 2 suggests that some operating characteristics of banks are related to de novo

24
branching. Banks which had a high ratio of net current operating income to average total assets or
a large number of employees per branch were more likely to open new branches than other banks.
The former measure suggests that successful and well-managed banks are likely to be prone to
growth. The latter is more difficult to interpret because of our difficulty in interpreting the
dynamics of labor markets. Two explanations suggest themselves: (1) Because of the difficulty of
dismissing employees, banks with too many workers may find it expeditious to expand branches
and (2) because rapidly expanding banks tend to be located in large cities where sophisticated
staff intensive services are offered, the observed relation may be a consequence of heterogeneity
among banks. We cannot distinguish between these explanations. There is also some weak
evidence that banks with relatively large ratios of the difference between loans and deposits to
total assets are more likely and banks with high ratios of overdue to outstanding loans are less
likely to open branches. These patterns deserve further study.
Madison, Wisconsin October 12, 1999

25
SELECTED BIBLIOGRAPHY
Banca d’Italia, (1999), Relazione Annuale, Considerazioni finali.
Barros, Pedro Pita, (1995), “Post-entry expansion in banking: the case of Portugal,” International
Journal of Industrial Organization, 13, 4, pp. 593-611.
Barth, James R., Daniel E. Nolle, and Tara N. Rice, (1997), “Commercial Banking Structure,
Regulation, and Performance: An International Comparison, Economics Working Paper No.
97-6 (March), Office of the Comptroller of the Currency, U. S. Treasury Department.
Berger, Allen N., John H., Leusner, and John J., Mingo, (1997), “The Efficiency of Bank
Branches,” Journal of Monetary Economics, 40, 1, pp. 141-62.
Berger, Allen N., Rebecca S. Demsetz, and Philip E. Strahan, (1998), “The Consolidation of the
Financial Services Industry: Causes, Consequences, and Implications for the Future,”
Finance and Economics Discussion Series No. 1998 - 46, Board of Governors of the
Federal Reserve System.
Berger, Allen N. and Loretta J. Mester, (1999), “What Explains the Dramatic Changes in Cost
and Profit Performance of the U.S. Banking Industry,” Finance and Economics Discussion
Series No. 1999 - 13, Board of Governors of the Federal Reserve System.
Calcagnini, Giorgio and Donald D. Hester, (1997), “Cambiamento istituzionale e redditività delle
banche in Italia,” Rivista di Politica Economica, 87, 1, pp. 3-42.
Caruso, M. and L. Pompilii, (1996) “La dinamica degli sportelli bancari: un’analisi applicata alla
provincia di Roma”, Bancaria, 4, pp. 66-75.
Castelli, F., M. Martiny and P. Marullo Reedtz, (1995), “La redditività degli sportelli bancari
dopo la liberalizzazione,” Temi di discussione No. 259, Banca d’Italia.
Cerasi, Vittoria, (1996), “An Empirical Analysis of Banking Concentration,” Dipartimento di
Economia e Aziendale, Università degli Studi di Milano, Working Paper No. 96.04.
Cerasi, Vittoria., Barbara Chizzolini and Marc Ivaldi, (1998a), “Sunk Costs and Competitiveness
of European Banks after Deregulation,” FMG Working Paper No. 290, London School of
Economics.

26
__________, (1998b), “Branching and Competitiveness across Regions in the Italian Banking
Industry,” Dipartimento Economia Politica e Aziendale Working Paper 98.03, Università
degli Studi di Milano.
Ciocca, P., C.A. Giussani and G. Lanciotti, (1974), “Sportelli, dimensioni e costi: uno studio sulla
struttura del sistema bancario italiano”, Quaderni di ricerche No. 15, Ente Einaudi.
De Bonis, Riccardo and Annalisa Ferrando, (1997), “Da che cosa dipendono i tassi di interesse sui
prestiti nelle province?”, Temi di Discussione No. 319, Banca d’Italia.
De Bonis, R., F. Farabullini, and F. Fornari, (1998), “La localizzazione territoriale degli sportelli
bancari e le determinanti delle aperture,” Rivista economica del Mezzogiorno, 1, pp. 69-
104.
De Bonis, Riccardo and Annalisa Ferrando, (1999), “The Italian banking structure in the nineties:
testing the multimarket contact hypothesis”, mimeo.
European Central Bank, (1999), “Possible effects of EMU on the EU banking system in the
medium to long term”, February.
Ferri, Giovanni and Giorgio Gobbi, (1992), “Concorrenza e discriminazione di prezzo nel mercato
del credito in Italia”, Contributi all’analisi economica, Banca d’Italia, 7, pp. 75-123.
Focarelli Dario, Fabio Panetta, and Carmelo Salleo, (1999), “Determinanti e conseguenze delle
acquisizioni e fusioni bancarie in Italia. Un’analisi empirica,” Banca Impresa e Società, 1,
pp. 63-92..
Gilbert, R. Alton, (1984), “Bank Market Structure and Competition: A Survey,” Journal of
Money, Credit and Banking, 16, 4, Part 2, pp. 617-44.
Hester, Donald D., Giorgio Calcagnini, and Riccardo De Bonis, (1999), “Competition through
Innovation: ATMs in Italian Banks,” Social Systems Research Institute Working Paper No.
9927, University of Wisconsin - Madison.
Istituto Guglielmo Tagliacarne, (1999), http://www.tagliacarne.it/.
Tobin, J., (1958), “Estimation of Relationships for Limited Dependent Variables,” Econometrica,
26, pp. 24-36.
27
Table 1
DESCRIPTIVE STATISTICS OF VARIABLES STUDIED IN SECTION VI
definition dimension symbol 1994 means
I Provincial level variables: (206 banks)
Bank’s share of all branches in a province
percentages bnkshr 5.044
Herfindahl index for branches in a province
decimals herf 0.161
Number of branches in a province of a bank of all other banks
integers nobr 1nobr 2nobr
10.148293.896
Per capita GDP millions of lire pcgdp 27.738
Bank branches per thousand residents
real numbers br/mr 0.372
Number of communes per branch of a bank
real numbers co/br 27.904
Number of branches acquired via mergers
integers mrgbr 4.842

28
Table 1 (continued)
definition dimension symbol 1994 means
II Bank level variables: (205 banks)
Total assets billions of lire ta 10,144.567
Net interbank borrowing billions of lire nibb 441.850
Deposits billions of lire dp 5,211.035
Loans billions of lire ln 4,677.836
Profits billions of lire prof -0.472
Net operating income billions of lire ncoy 76.308
Overdue loans billions of lire ol 214.381
Bank employees integers empl 1,650.152
Branches integers br 97.505
Ratio of overdue loans to total loans at a bank
percentages ol/ln 2.617
Ratio of net current operating income to total assets
percentages ncoy/ta 1.202
Difference between loans and deposits, divided by total assets
percentages (ln-dp)/ta -23.266
Employees per branch real numbers emp/br 15.937

29
Table 2
TOBIT RESULTS FOR DE NOVO BRANCHES ON PROVINCEAND BANK VARIABLES11
variables12 1992 1993 1994 1995 1996
intercept -5.869**
(.418)-7.505**
(.534)-16.337**
(1.093)-7.694**
(.536)-7.958**
(.534)
bnkshr .181**
(.012).276**
(.016).414**
(.028).234**
(.014).240**
(.015)
herf -4.011**
(0.965)-5.783**
(1.260)-12.406**
(2.545)-8.902**
(1.343)-6.273**
(1.390)
d1nobrt-1 .555**
(.045).233**
(.034).375**
(.049).090**
(.024).118**
(.022)
d2nobrt-1 .011**
(.003).021**
(.005).015**
(.006).014**
(.004).015**
(.005)
pcgdpt-1 -.009(.022)
.059*
(.022).266**
(.045).106**
(.026).056**
(.018)
dpcgdp .344*
(.159)-.152(.153)
-1.179**
(.307)-.275*
(.139).216*
(.105)
br/mr -.283(.906)
-3.392**
(1.131)-5.208**
(2.003)-1.606(.985)
-2.136*
(.970)
co/br .029**
(.002).033**
(.003).057**
(.006).028**
(.003).033**
(.003)
mrgbr .046**
(.011).075*
(.033).091
(.098).086**
(.023).051
(.055)
11. An * (**) implies that a coefficient differs from zero at the .05 (.01) level in a one-tailed test when parameterestimates are assumed to have a normal distribution.12. If any symbol is preceded by a "d", the variable is a first difference - e.g. dx = xt - xt - 1.
30
Table 2 (continued)
variables 1992 1993 1994 1995 1996
mrgdm 4.514**
(.414)4.586**
(.973)3.361*
(1.599)3.392**
(.490)2.779**
(.949)
mrgns .533**
(.128)1.161**
(.169)2.142**
(.329)1.107**
(.176).857**
(.166)
ol/ln -.043(.067)
-.146(.092)
-.544*
(.278)-.087(.078)
-.072(.037)
ncoy/ta .849**
(.324)1.405**
(.354)2.435**
(.694)2.356**
(.332)1.350**
(.313)
(ln-dp)/ta .016(.022)
.048(.030)
.110*
(.055).029
(.022).058*
(.025)
emp/br .105**
(.028).198**
(.032).356**
(.112).063**
(.017).213**
(.048)
sigma 2.815**
(.100)3.503**
(.128)6.488**
(.231)3.161**
(.125)3.402**
(.132)
ln likelihood function
-2549.7** -2407.6** -2534.3** -2210.1** -2266.2**
number of observations
18,430 18,430 16,340 18,810 17,955
number of positive observations
563 510 485 470 473
number of banks
194 194 172 198 189
Top Related
Copyright © 2022 FDOKUMEN

