


Bahasa
Halaman
Hukum

Deficient Dopamine D2 Receptor Function Causes RenalInflammation Independently of High Blood PressureYanrong Zhang1, Santiago Cuevas1, Laureano D. Asico1, Crisanto Escano1, Yu Yang1,
Annabelle M. Pascua1, Xiaoyan Wang1, John E. Jones1, David Grandy2, Gilbert Eisner3, Pedro A. Jose1,
Ines Armando1*
1Division of Nephrology, Department of Medicine, School of Medicine, University of Maryland, Baltimore, Maryland, United States of America, 2Department of Physiology
and Pharmacology, Oregon Health and Science University, Portland, Oregon, United States of America, 3Department of Medicine, Georgetown University Medical Center,
Washington DC, United States of America
Abstract
Renal dopamine receptors participate in the regulation of blood pressure. Genetic factors, including polymorphisms of thedopamine D2 receptor gene (DRD2) are associated with essential hypertension, but the mechanisms of their contributionare incompletely understood. Mice lacking Drd2 (D22/2) have elevated blood pressure, increased renal expression ofinflammatory factors, and renal injury. We tested the hypothesis that decreased dopamine D2 receptor (D2R) functionincreases vulnerability to renal inflammation independently of blood pressure, is an immediate cause of renal injury, andcontributes to the subsequent development of hypertension. In D22/2 mice, treatment with apocynin normalized bloodpressure and decreased oxidative stress, but did not affect the expression of inflammatory factors. In mouse RPTCs Drd2silencing increased the expression of TNFa and MCP-1, while treatment with a D2R agonist abolished the angiotensin II-induced increase in TNF-a and MCP-1. In uni-nephrectomized wild-type mice, selective Drd2 silencing by subcapsularinfusion of Drd2 siRNA into the remaining kidney produced the same increase in renal cytokines/chemokines that occursafter Drd2 deletion, increased the expression of markers of renal injury, and increased blood pressure. Moreover, in micewith two intact kidneys, short-term Drd2 silencing in one kidney, leaving the other kidney undisturbed, inducedinflammatory factors and markers of renal injury in the treated kidney without increasing blood pressure. Our resultsdemonstrate that the impact of decreased D2R function on renal inflammation is a primary effect, not necessarily associatedwith enhanced oxidant activity, or blood pressure; renal damage is the cause, not the result, of hypertension. Deficient renalD2R function may be of clinical relevance since common polymorphisms of the human DRD2 gene result in decreased D2Rexpression and function.
Citation: Zhang Y, Cuevas S, Asico LD, Escano C, Yang Y, et al. (2012) Deficient Dopamine D2 Receptor Function Causes Renal Inflammation Independently ofHigh Blood Pressure. PLoS ONE 7(6): e38745. doi:10.1371/journal.pone.0038745
Editor: Jean-Claude Dussaule, INSERM, France
Received December 15, 2011; Accepted May 10, 2012; Published June 14, 2012
Copyright: � 2012 Zhang et al. This is an open-access article distributed under the terms of the Creative Commons Attribution License, which permitsunrestricted use, distribution, and reproduction in any medium, provided the original author and source are credited.
Funding: This work was supported in part by grants from the National Institutes of Health, HL068686, HL023081, HL074940, HL092196, DK039308 and DK090918(www.NIH.gov). The funders had no role in study design, data collection and analysis, decision to publish, or preparation of the manuscript.
Competing Interests: The authors have declared that no competing interests exist.
* E-mail: [email protected]
Introduction
Dopamine synthesized in the kidney is necessary for the
maintenance of normal blood pressure and renal function [1].
The disruption of any of the dopamine receptor subtype genes in
mice produces receptor subtype-specific hypertension [2]. In
particular, the hypertension in mice with disruption of the
dopamine D2 receptor (Drd2) gene (D22/2) is associated with
increased production of reactive oxygen species (ROS) [3,4].
Infiltration of inflammatory cells and oxidative stress in the
kidney are involved in the development of renal injury and the
induction and maintenance of hypertension [5]. Renal tubule cells
produce both pro- and anti-inflammatory cytokines and chemo-
kines [6], which are secreted across their apical and basolateral
membranes [7], and contribute to the development and pro-
gression of glomerular and tubular injury. However, the factors
that regulate cytokine production in these cells are incompletely
understood. Dopamine and dopaminergic drugs have been shown
to regulate the immune response and the inflammatory reaction
[8]. Dopamine inhibits the release of IFNc, IL-2, and IL-4 [9] and
the lipopolysaccharide-stimulated production of IL-12p40 [10] in
immune cells. Administration of dopamine or dopaminergic
agonists in vivo reduces the TNFa response to endotoxin [11]
and the activation of leukocytes in experimental sepsis [12].
Conversely, treatment with a dopaminergic antagonist stimulates
constitutive and inducible gene expression of IL-1b, IL-6, and
TNFa in macrophages [13]. In brain-dead rats, a condition that is
associated with profound inflammation in end-organs, dopamine
reduces renal monocyte infiltration [14], expression of IL-6, and
improves renal function after transplantation [15]. Furthermore,
mice with intrarenal dopamine deficiency have increased oxidative
stress and infiltration of inflammatory cells [16] and decreased
renal dopamine production is associated with increased detrimen-
tal effects of Ang II on renal injury [17].
The anti-inflammatory effects of dopamine and dopaminergic
agonists are mediated, at least in part, by the D2R. D2Rs are
expressed in lymphocytes, monocytes, neutrophils, macrophages,
and other immuno-competent cells [18]. The D2R/D3R agonist,
PLoS ONE | www.plosone.org 1 June 2012 | Volume 7 | Issue 6 | e38745
bromocriptine, inhibits lymphocyte proliferation [19] and de-
creases antigen-induced macrophage activation and secretion of
IL-2, IL-4, and IFNc [11]. In normal human lymphocytes, D2R
agonists increase the secretion of anti-inflammatory cytokines by
de novo gene expression [20]. GLC756, a novel mixed dopamine
D1R antagonist and D2R agonist, inhibits the release of TNFafrom activated mast cells [21].
We hypothesized that the D2R decreases renal inflammation
and prevents renal injury by regulating the inflammatory response
in renal proximal tubule cells (RPTCs). To test this hypothesis, we
studied parameters of inflammation and injury in the renal cortex
of D22/2 mice and the effect of D2 R silencing on the expression
of inflammatory factors in mouse RPTCs. Because angiotensin
(Ang) II and dopamine receptors counter-regulate each other and
Ang II, via the AT1R, promotes inflammation and renal injury
[17,18,22], we also determined if stimulation of D2R opposes the
effects of Ang II in these cells. Because D2R deficiency increases
blood pressure and oxidative stress, we studied the effects of
normalizing blood pressure and decreasing oxidative stress on the
renal expression of cytokines/chemokines in D22/2 mice.
Finally, we studied renal expression of inflammatory factors and
markers of renal injury in two mouse models of selective Drd2
silencing in the kidney.
Methods
D2 Receptor-deficient MiceThe original F2 hybrid strain (129/SvXC57BL/6J, Oregon
Health Sciences University) that contained the mutated Drd2 allele
(D22/2) was bred onto the C57BL/6J background for .20
generations [3]. All animal-related studies were approved by the
Institutional Animal Care and Use Committee. D22/2 mice and
wild-type littermates (D2+/+) were studied at 6 to 8 months of age.
Mice were housed in metabolic cages for 24 h urine collection and
then anesthetized for blood pressure measurement via the femoral
artery, as reported previously [4]. The organs were harvested and
flash-frozen. As we have reported previously [4], both systolic
(12163 (D22/2) vs. 89 (D2+/+) mm Hg; n = 9; P,0.01) and
diastolic blood pressures (8762 (D22/2) vs. 6365 (D2+/+) mm
Hg; n = 9; P,0.02), were increased in D22/2 mice, relative to
D2+/+ littermates. A group of mice was treated for 10 days with
apocynin (3 mg/kg/day, Sigma, St. Louis, MO), which inhibits
NADPH oxidase activity, or vehicle, via a subcutaneously
implanted osmotic mini-pump (AlzetH, Cupertino, CA). Urine
collection, blood pressure measurement and tissue harvesting were
performed as described above.
Acute Renal Specific Down-regulation of D2RRenal cortical Drd2 was silenced by the subcapsular infusion of
Drd2-specific siRNA via an osmotic minipump. Adult male
C57BL/6J mice were uni-nephrectomized one week prior to the
implantation of the minipump. For the implantation, the mice
were anesthetized with pentobarbital (50 mg/kg body weight,
intraperitoneally). The osmotic minipumps (100 ml; flow rate:
0.5 ml/hr for 7 days) were filled with validated Drd2-specific
siRNA (delivery rate 3 mg/day) or non-silencing siRNA as control.
The siRNAs were dissolved in an in vivo transfection reagent
(TransITH In Vivo Gene Delivery System, Mirus) under sterile
conditions. The minipumps were fitted with a polyethylene
delivery tubing (Alzet #0007701) and the tip of the tubing was
inserted within the subcapsular space of the remaining kidney.
Surgical glue was applied at the puncture site to hold the tubing in
place and prevent extra-renal leakage. The osmotic pump was
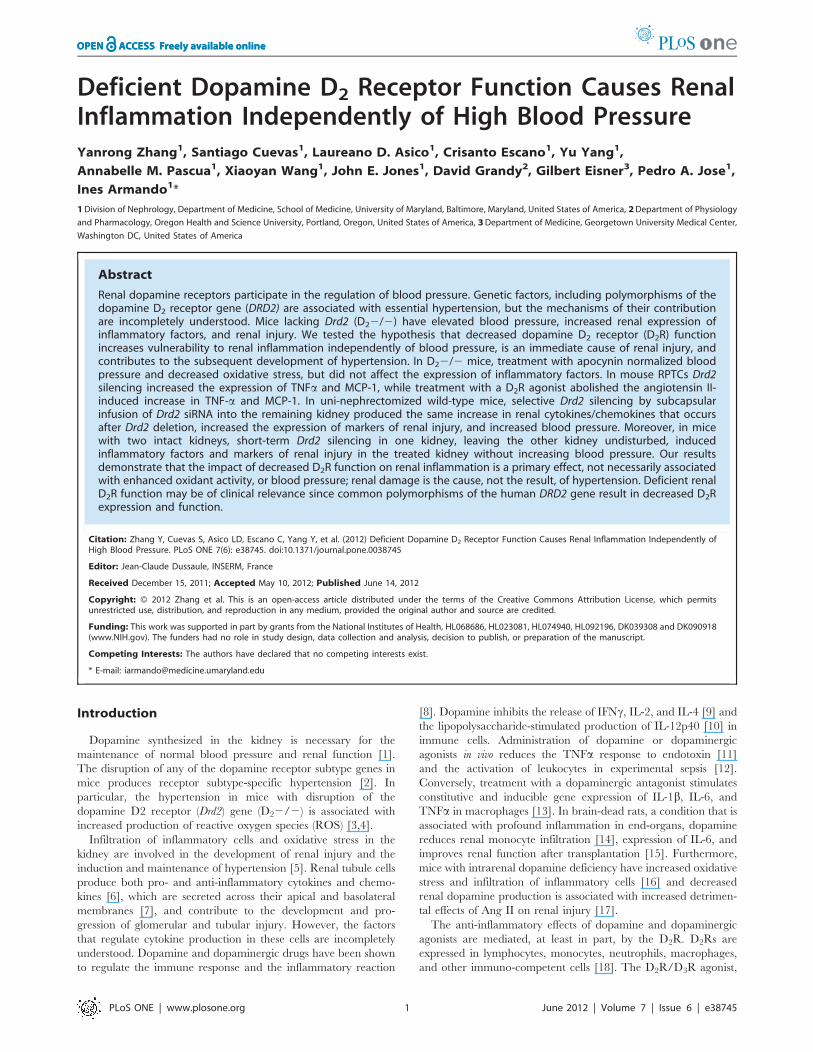
Figure 1. Renal inflammation and injury in D22/2 mice. Massonstained sections of D2+/+ mouse kidney (A and B) and D22/2 mousekidney (C and D). H-E stained sections of D2+/+ mouse kidney (E) andD22/2 mouse kidney (F). G: glomerulus. PCT: proximal convolutedtubule. Proteinaceous casts are marked with arrows (F). Sections from 3mouse kidneys per group were studied. G and H: Inflammatory cellinfiltration. Kidney sections from D2+/+ (G) and D22/2 (H) mice wereimmunostained for the presence of macrophages and monocytes(arrows). The number of positive cells in 10 randomly selected fields wasgreater in D22/2 (6863) than in D2+/+ (1561, P,0.01) mice. Sectionsfrom 3 mouse kidneys per group were studied. I. Renal corticalexpression of Col 1a1 mRNA determined by qRT-PCR. Results werecorrected for expression of GAPDH mRNA and expressed as fold changein comparison to their expression in D2+/+ mice. *P,0.05 vs D2+/+;n = 5/group. J. Urinary microalbuminuria. Urine samples were collectedfor 24 h from mice in metabolic cages. Albumin was measured byELISA. *P,0.04 vs. D2+/+; n = 5/group. Magnification: A and C: 100X; B,D, G and H: 400X; E-F: 200X.doi:10.1371/journal.pone.0038745.g001
Dopamine and Inflammation
PLoS ONE | www.plosone.org 2 June 2012 | Volume 7 | Issue 6 | e38745
sutured to the abdominal wall to prevent excessive movement of
the pump for the duration of the study.
Silencing of Drd2 was also performed in mice that did not
undergo unilateral nephrectomy. Drd2-specific siRNA was infused,
as described above, under the capsule of the left kidney of C57BL/
6J mice while the right kidney was left undisturbed. In both
groups, blood pressure was measured, as above, before and after
the 7-day siRNA infusion. Tissues were harvested after the last
blood pressure determination.
Urine MeasurementsUrinary levels of IL-6 and IL-10 (SABiosciences-Qiagen,
Frederick, MD) and albumin (Albuwell M, Exocell, Philadelphia,
PA) were determined by ELISA, the latter using an antibody
specific for murine albumin. Values were corrected for urinary
creatinine.
Table 1. Gene expression profiling of cytokines, chemokinesand receptors in the kidney of D2+/+ and D22/2 mice.
GenesFoldchange
Up-regulated
Ccl2 Chemokine (C-C motiv) ligand 2 (MCP-1) 1.87
Ccl8 Chemokine (C-C motiv) ligand 8 (MCP-2) 1.95
Ccl7 Chemokine (C-C motiv) ligand 7 (MCP-3) 2.19
Ccl12 Chemokine (C-C motiv) ligand 12 (MCP-4) 2.78
Tnfa Tumor necrosis factor alpha 1.65
Lta Lymphotoxin a (Lta/TNF b) 1.41
Ltb Lymphotoxin b (Ltb/TNF C) 2.02
Cxcr5 Chemokine (C-X-C motif) receptor 5 2.19
Ccl11 Chemokine (C-C motif) ligand 11 (eotaxin-1) 2.68
Ccl17 Chemokine (C-C motif) ligand 17 2.37
Ccl20 Chemokine (C-C motif) ligand 20 3.09
Ccl25 Chemokine (C-C motif) ligand 25 2.75
Ccr7 Chemokine (C-C motif) receptor 7 2.61
Cxcl9 Chemokine (C-X-C motif) ligand 9 (MIG) 2.16
Ccl5 Chemokine (C-C motif) ligand 5 (RANTES) 1.59
Ccl4 Chemokine (C-C motif) ligand 4 (MIP-a) 1.64
Cxcl10 Chemokine (C-X-C motif) ligand 10 1.72
Cxcl11 Chemokine (C-X-C motif) ligand 11 1.71
Il-10 Interleukin 10 1.78
Il-18 Interleukin 18 2.07
Il-5 ra Interleukin 5 receptor, a 3.13
Down-regulated
Ccl1 Chemokine (C-C motif) ligand 1 22.46
Ccl24 Chemokine (C-C motif) ligand 24 22.00
Ccr1 Chemokine (C-C motif) receptor 1 22.27
Crp C-reactive protein, pentraxin-related 22.49
Pf4 Platelet factor 4 22.03
Cxcl12 Chemokine (C-X-C motif) ligand 12 21.75
Il-11 Interleukin 11 22.02
Il-13 Interleukin 13 23.20
Il-17B Interleukin 17B 23.57
Il-20 Interleukin 20 25.70
Il-3 Interleukin 3 22.36
Il-4 Interleukin 4 21.71
Il-1f6 Interleukin 1 family, member 6 22.43
Il-8rb Interleukin 8 receptor, 23.72
Cd40lg CD40 ligand 22.90
Fold-change was calculated by the D Ct method. n = 3/group.doi:10.1371/journal.pone.0038745.t001
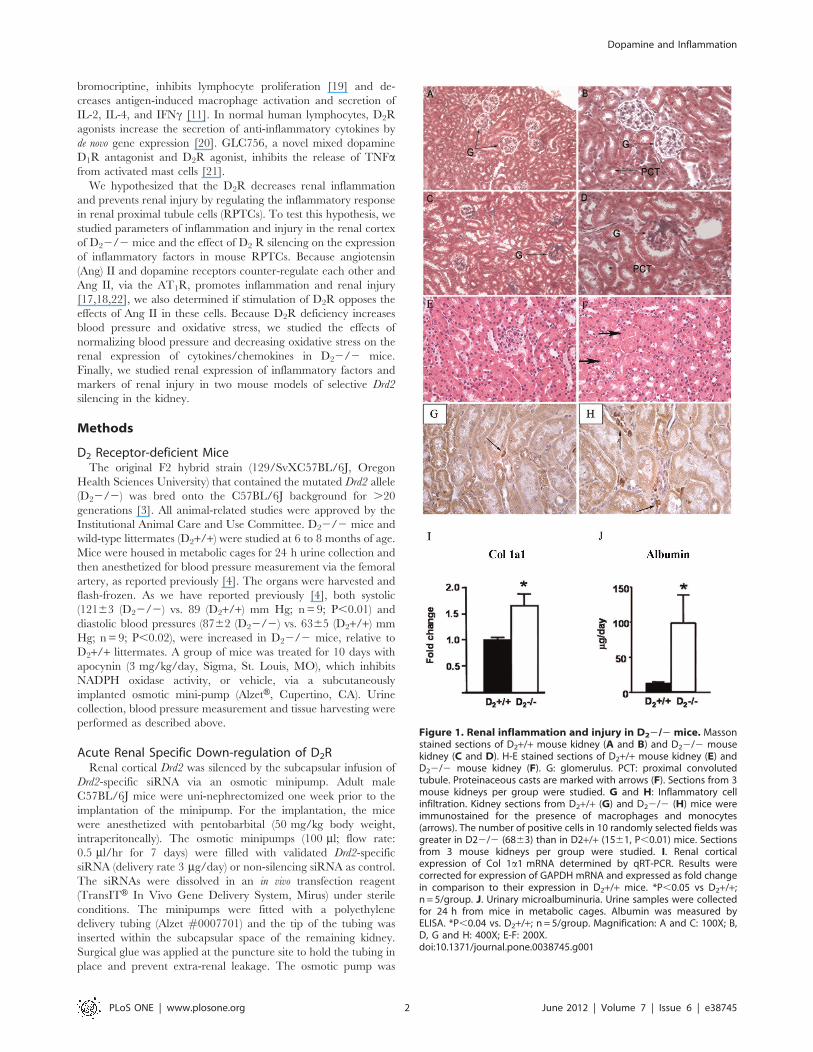
Figure 2. Expression of chemokines/cytokines in renal cortexand urine of D22/2 mice. A. Expression of Lta, MCP-2, and NFkB1mRNA was quantified by qRT-PCR; results were corrected for expressionof GAPDH mRNA and expressed as fold change in comparison to theirexpression in D2+/+mice. *P,0.03 vs. D2+/+mice. B. Protein expressionof MCP-1 (17 kDa) and TNFa protein (25 kDa) was semi-quantified byimmunoblotting. Inset shows one set of immunoblots. Results werecorrected for expression of actin and expressed as percentage of theexpression in D2+/+ mice, *P,0.02 vs. D2+/+ mice, n = 5/group. C.Protein expression of IL-6 (25 kDa) and IL-10 (20 kDa) protein semi-quantified by immunoblotting. Results were corrected for expression ofactin and expressed as percentage of the expression in D2+/+, * P,0.05vs. D2+/+ mice, n = 5/group Urinary excretion of IL-6 and IL-10 wasquantified by ELISA. *P,0.02 vs. D2+/+ mice, n = 5/group.doi:10.1371/journal.pone.0038745.g002
Dopamine and Inflammation
PLoS ONE | www.plosone.org 3 June 2012 | Volume 7 | Issue 6 | e38745
Cell CultureUndifferentiated mouse cells were cultured from progenitor
kidney cells, kindly supplied by Dr. Ulrich Hopfer (Case
Western Reserve University, School of Medicine), isolated from
mouse embryo kidneys following the procedure described by
Woost et al. [23]. Differentiated mouse RPTCs were cultured to
60–70% confluence and transfected (Hyperfect, Qiagen, Valen-
cia, CA) with vehicle, non-silencing siRNA (30 nmol/l; All stars,
Qiagen) or Drd2 siRNA (30 nmol/l, Qiagen). Cells were studied
after 72 h. For other experiments cells were cultured to 90–95%
confluence, serum starved for 2 h and treated for 24 h in
serum-free medium with vehicle (PBS) or 100 nmol/l Ang II in
the presence or absence of 1 mmol/l quinpirole (D2R/D3R
agonist), or 1 mmol/l quinpirole plus 1 mmol/l L-741,262 (D2R
antagonist) [24].
RNA Extraction and cDNA PreparationKidney samples were homogenized, and total RNA was
extracted with Trizol (Invitrogen, Carlsbad, CA) and further
purified using the RNeasy RNA Extraction Mini kit (Qiagen).
RNA samples were converted into first strand cDNA using an RT2
First Strand kit, following the manufacturer’s protocol (SABios-
ciences-Qiagen).
Gene Expression Profiling of Inflammatory Cytokines andReceptors
Gene expression analysis was carried out in groups of four mice
using an RT2 Profiler PCR array system (SABiosciences-Qiagen)
that contained a panel of 84 genes. Real-time PCR was performed
following the manufacturer’s protocol. Quality controls were all
within the recommended range. Data were analyzed by the D Ct
method [25].
Quantitative Real-time PCRQuantitative gene expression was analyzed by real-time PCR,
performed on an ABI Prism 7900 HT (Applied Biosystems,
Foster City, CA). The assay used gene specific primers
(SABiosciences-Qiagen) and SYBR Green real-time PCR de-
tection method and was performed as described in the
manufacturer’s manual. Primers used were as follows: MCP-1:
PPM03151F; MCP-2: PPM03165A; TNFa: PPM03113F; Lta:
PPM03114A; IL-4: PPM03013E; IL-5ar: PPM03026E; IL-11:
PPM03018E; IL-13: PPM03021A; collagen, type 1, a1 (Col 1a1):
PPM-3845F; NFkB1: PPM02930E; osteopontin: PPM03648C;
Actin: PPM0294A; GAPDH: PPM02946E. Data were analyzed
using the D D Ct method [25].
ImmunoblottingMouse kidney homogenates and cell lysates were subjected to
immunoblotting, as reported previously [3,4]. The primary
antibodies used were rat anti-mouse TNFa (BioLegend, San
Diego, CA), rabbit polyclonal MCP-1 (Millipore, Billerica, CA),
rabbit polyclonal IL-6 (Abcam, Cambridge, MA); rabbit poly-
clonal D2R (Millipore), and polyclonal anti-actin (Sigma). The
densitometry values were corrected by the expression of GAPDH
and are shown as percentage of the mean density of the control
group.
Reporter AssayNFkB activation was analyzed via the transient expression of an
NFkB luciferase reporter system by reverse transfection (Cignal
Reporter Assay, SABiosciences-Qiagen). Cells were treated with
Drd2-specific siRNA or non-silencing siRNA, as described above.
After 48 h, the cells were trypsinized and seeded for reverse
transfection. The assay was performed following the manufac-
turer’s procedures.
Histochemistry and ImmunohistochemistryFormalin-fixed, paraffin-embedded tissues of D2+/+ and D22/
2 mice were stained with Masson trichrome to evaluate glomerular
fibrosis and with hematoxylin eosin (H–E) to evaluate tubular
damage. The pathological abnormalities were graded in a blinded
manner. Sclerosis was defined as collapse or obliteration of the
glomerular capillary tuft associated with increased hyaline matrix
[26]. Glomerular sclerosis was expressed as the percentage of
glomeruli showing more than 25% sclerosis.
Tissue sections were immunostained for the presence of
macrophages and monocytes using a specific rat anti-mouse
macrophage/monocyte monoclonal antibody (Millipore) and an
avidin–biotin immunoperoxidase kit (Vectastain Elite, Vector
Laboratories, Burlingame, CA). The kidneys were lightly counter-
stained with hematoxylin. The total number of positive cells in 10
randomly selected fields was counted.
Statistical AnalysisData are mean 6 SEM. Comparisons between 2 groups used
the Student’s t test. One-way ANOVA followed by post-hoc
analysis using the Newman–Keuls multiple comparison test was
used to assess significant differences among three or more groups.
P,0.05 was considered statistically significant.
Results
Renal Injury and Inflammation Occurs in D22/2 MiceMasson staining of D22/2 mouse kidney sections showed
glomerulosclerosis and dilation of renal tubules (Fig 1C–D). H-E
staining showed the presence of tubular proteinaceous casts
(Figure 1F). These lesions were not observed in D2+/+ mice
(Figure 1A, B,E). The percentage of glomeruli showing more
than 25% sclerosis was greater in D22/2 than D2+/+ mice
(3569% vs. 566%, P,0.01). There were more infiltrating
macrophages/monocytes in kidney sections from D22/2 mice
(Figure 1H) than D2+/+ mice (Figure 1G (6863 vs.1561
positive cells/10 fields, P,0.01). The level of mRNA expression of
Col 1a1 was about 60% higher in renal cortex of D22/2 than
D2+/+ mice (Figure 1I). Microalbuminuria, a functional param-
eter of renal damage, was 9-fold higher in D22/2 mice than in
D2+/+ littermates (Figure 1J).
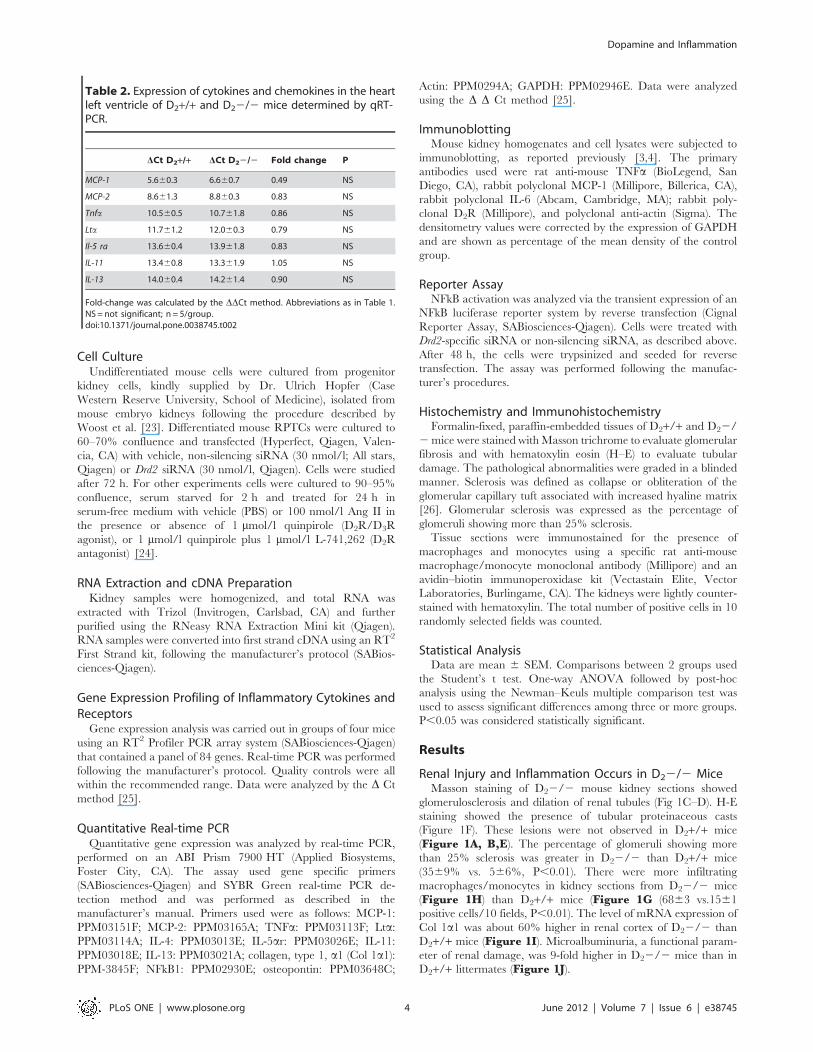
Table 2. Expression of cytokines and chemokines in the heartleft ventricle of D2+/+ and D22/2 mice determined by qRT-PCR.
DCt D2+/+ DCt D22/2 Fold change P
MCP-1 5.660.3 6.660.7 0.49 NS
MCP-2 8.661.3 8.860.3 0.83 NS
Tnfa 10.560.5 10.761.8 0.86 NS
Lta 11.761.2 12.060.3 0.79 NS
Il-5 ra 13.660.4 13.961.8 0.83 NS
IL-11 13.460.8 13.361.9 1.05 NS
IL-13 14.060.4 14.261.4 0.90 NS
Fold-change was calculated by the DDCt method. Abbreviations as in Table 1.NS = not significant; n = 5/group.doi:10.1371/journal.pone.0038745.t002
Dopamine and Inflammation
PLoS ONE | www.plosone.org 4 June 2012 | Volume 7 | Issue 6 | e38745
The Expression of Chemokines and Cytokines Involved inMacrophage Recruitment and Inflammation is Increasedin the Renal Cortex but not in the Left Ventricle of theHeart of D22/2 Mice
Expression of 84 cytokines and chemokines was analyzed in the
renal cortex of D22/2 and D2+/+ mice using a quantitative RT-
PCR (qRT-PCR) array. Twenty one genes were up-regulated and
15 were down-regulated in D22/2 mice (Table 1). Of the genes
that were up-regulated, 10 belong to the C-C subfamily of
chemokines, including four of the macrophage chemoattractant
group and three of the TNF superfamily. IL-10 and IL-18 genes
were also up-regulated. Seven of the 15 down-regulated genes
were interleukins (Table 1). Most of the up-regulated chemokines
are inflammatory and belong to the CCL subfamily, involved in
macrophage (MCP-1, MIP-1a, RANTES, MCP-2, MCP-5) and/
or T cell (Eotaxin-1, TARC, MIP-3a, CCL-25) recruitment, as
opposed to homeostatic [27]. Some of the chemokines, belonging
to the CXCL superfamily that attract neutrophils, were also up-
regulated (MIG, IP-10, I-TAC) [28]. Three of the four members of
the TNF superfamily of inflammatory cytokines were up-
regulated, namely TNFa, lymphotoxin-a (Lta), and lympho-
toxin-b (TNFb). CD40L, the other member of the superfamily
included in the array, was decreased. In contrast to the increased
expression of pro-inflammatory chemokines, several anti-inflam-
matory interleukins (IL-4, IL-11, IL13, and IL-17B which
stimulates IL-11) were decreased, except for IL-10 which was
increased (Table 1).
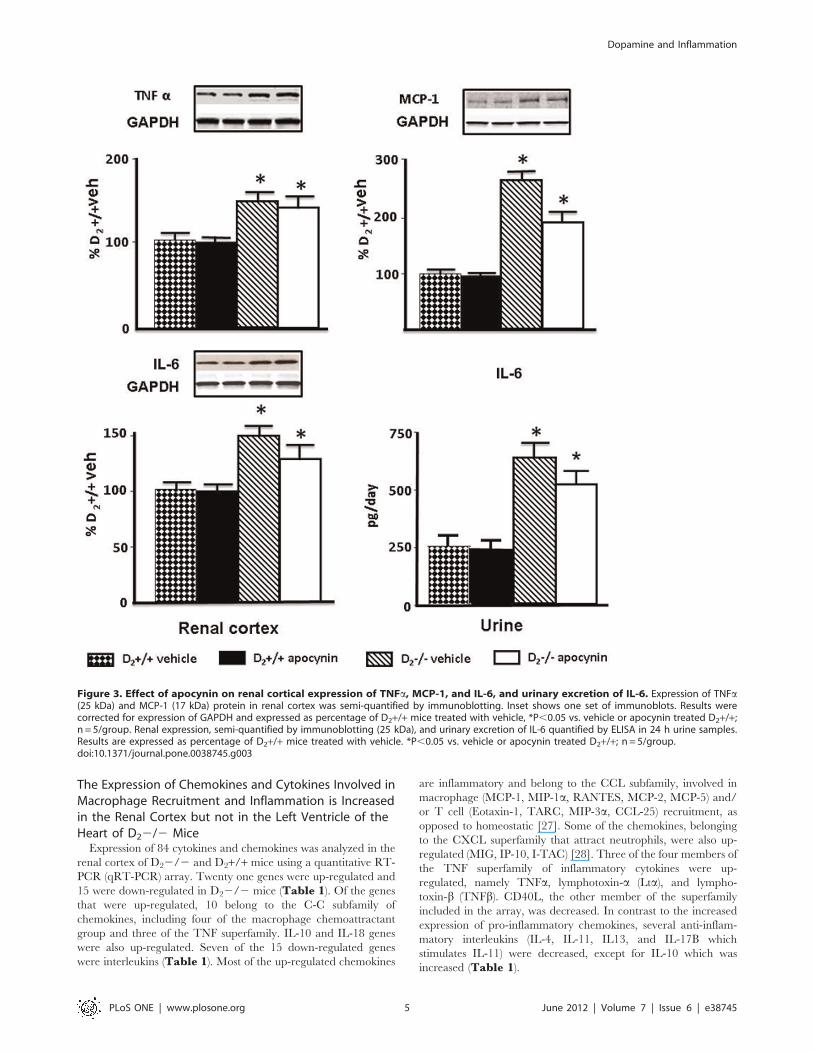
Figure 3. Effect of apocynin on renal cortical expression of TNFa, MCP-1, and IL-6, and urinary excretion of IL-6. Expression of TNFa(25 kDa) and MCP-1 (17 kDa) protein in renal cortex was semi-quantified by immunoblotting. Inset shows one set of immunoblots. Results werecorrected for expression of GAPDH and expressed as percentage of D2+/+ mice treated with vehicle, *P,0.05 vs. vehicle or apocynin treated D2+/+;n = 5/group. Renal expression, semi-quantified by immunoblotting (25 kDa), and urinary excretion of IL-6 quantified by ELISA in 24 h urine samples.Results are expressed as percentage of D2+/+ mice treated with vehicle. *P,0.05 vs. vehicle or apocynin treated D2+/+; n = 5/group.doi:10.1371/journal.pone.0038745.g003
Dopamine and Inflammation
PLoS ONE | www.plosone.org 5 June 2012 | Volume 7 | Issue 6 | e38745
Further experiments were focused on the TNF and MCP
families and on IL-6 and IL-10, both of which are downstream
TNFa, and on NFkB, which is activated and increased by
TNFa transcription [29,30]. IL-6 is involved in the development
of renal inflammation and injury [31], and IL-10 has potent
anti-inflammatory properties, repressing the expression of
TNFa, IL-6, and IL-1 [32]. We also quantified the expression
of p50, the DNA binding subunit of NFkB protein complex,
a parameter of NFkB activation [33]. Increased renal cortex
expression of Lta, MCP-2, and NFkB1 (p50) in D22/2 mice
was confirmed by qRT-PCR and found to be four-, five-, and
two -fold higher, respectively, than in D2+/+ (Figure 2A).
Increased protein expression of MCP-1 (270630 vs 100615%)
and TNFa (16367 vs 10063%) was confirmed by western blot
(Figure 2B). Protein expressions of IL-6 and IL-10 in renal
cortex were also increased by about 30% and 60% respectively,
and urinary excretion of IL-6 was about three-fold higher while
that of IL-10 was about five-fold higher in D22/2 than in
D2+/+ mice (Figure 2C). Decreased renal cortical mRNA
expression of IL-4, IL-11, and IL-13 was also confirmed by
qRT-PCR (data not shown).
The gene expression of chemokines/cytokines in the heart left
ventricle was also determined by qRT-PCR. The expressions of
MCP-1, MCP-2, TNFa, and Lta, as well as IL-11, IL-13, and IL-5
receptor a, were similar in D22/2 and D2+/+ mice (Table 2).
This indicated that renal alterations in pro- and anti-inflammatory
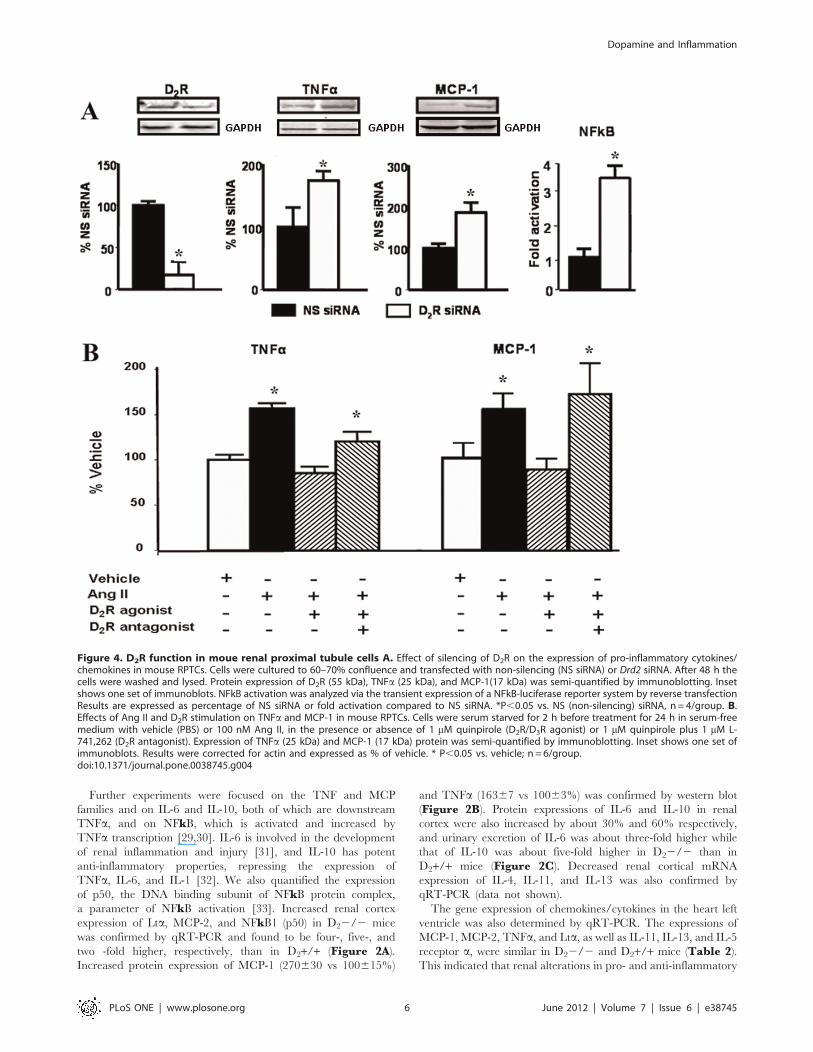
Figure 4. D2R function in moue renal proximal tubule cells A. Effect of silencing of D2R on the expression of pro-inflammatory cytokines/chemokines in mouse RPTCs. Cells were cultured to 60–70% confluence and transfected with non-silencing (NS siRNA) or Drd2 siRNA. After 48 h thecells were washed and lysed. Protein expression of D2R (55 kDa), TNFa (25 kDa), and MCP-1(17 kDa) was semi-quantified by immunoblotting. Insetshows one set of immunoblots. NFkB activation was analyzed via the transient expression of a NFkB-luciferase reporter system by reverse transfectionResults are expressed as percentage of NS siRNA or fold activation compared to NS siRNA. *P,0.05 vs. NS (non-silencing) siRNA, n= 4/group. B.Effects of Ang II and D2R stimulation on TNFa and MCP-1 in mouse RPTCs. Cells were serum starved for 2 h before treatment for 24 h in serum-freemedium with vehicle (PBS) or 100 nM Ang II, in the presence or absence of 1 mM quinpirole (D2R/D3R agonist) or 1 mM quinpirole plus 1 mM L-741,262 (D2R antagonist). Expression of TNFa (25 kDa) and MCP-1 (17 kDa) protein was semi-quantified by immunoblotting. Inset shows one set ofimmunoblots. Results were corrected for actin and expressed as % of vehicle. * P,0.05 vs. vehicle; n = 6/group.doi:10.1371/journal.pone.0038745.g004
Dopamine and Inflammation
PLoS ONE | www.plosone.org 6 June 2012 | Volume 7 | Issue 6 | e38745
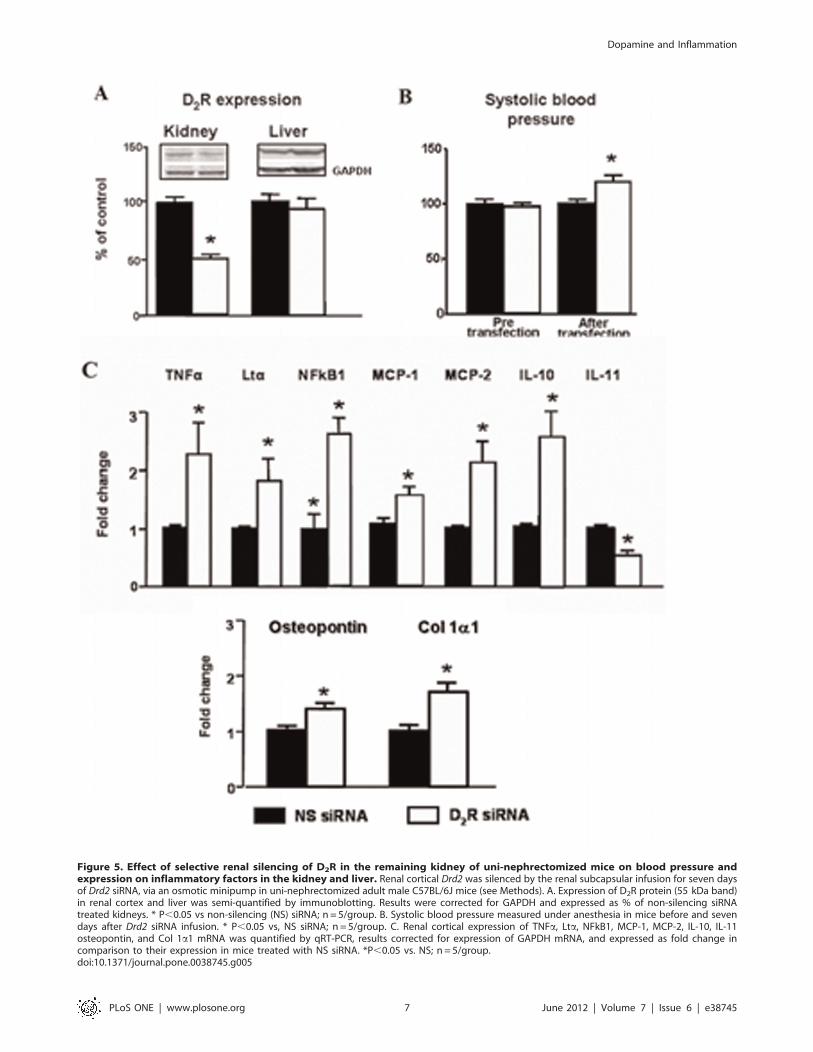
Figure 5. Effect of selective renal silencing of D2R in the remaining kidney of uni-nephrectomized mice on blood pressure andexpression on inflammatory factors in the kidney and liver. Renal cortical Drd2 was silenced by the renal subcapsular infusion for seven daysof Drd2 siRNA, via an osmotic minipump in uni-nephrectomized adult male C57BL/6J mice (see Methods). A. Expression of D2R protein (55 kDa band)in renal cortex and liver was semi-quantified by immunoblotting. Results were corrected for GAPDH and expressed as % of non-silencing siRNAtreated kidneys. * P,0.05 vs non-silencing (NS) siRNA; n = 5/group. B. Systolic blood pressure measured under anesthesia in mice before and sevendays after Drd2 siRNA infusion. * P,0.05 vs, NS siRNA; n = 5/group. C. Renal cortical expression of TNFa, Lta, NFkB1, MCP-1, MCP-2, IL-10, IL-11osteopontin, and Col 1a1 mRNA was quantified by qRT-PCR, results corrected for expression of GAPDH mRNA, and expressed as fold change incomparison to their expression in mice treated with NS siRNA. *P,0.05 vs. NS; n = 5/group.doi:10.1371/journal.pone.0038745.g005
Dopamine and Inflammation
PLoS ONE | www.plosone.org 7 June 2012 | Volume 7 | Issue 6 | e38745
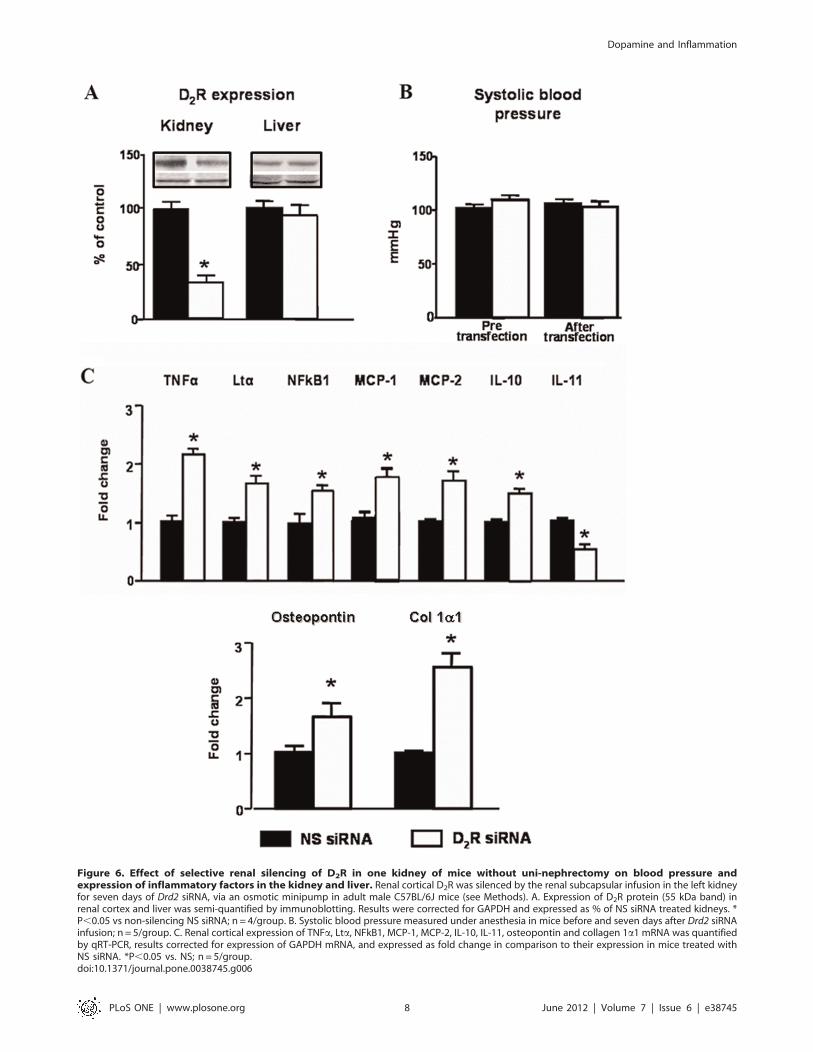
Figure 6. Effect of selective renal silencing of D2R in one kidney of mice without uni-nephrectomy on blood pressure andexpression of inflammatory factors in the kidney and liver. Renal cortical D2R was silenced by the renal subcapsular infusion in the left kidneyfor seven days of Drd2 siRNA, via an osmotic minipump in adult male C57BL/6J mice (see Methods). A. Expression of D2R protein (55 kDa band) inrenal cortex and liver was semi-quantified by immunoblotting. Results were corrected for GAPDH and expressed as % of NS siRNA treated kidneys. *P,0.05 vs non-silencing NS siRNA; n = 4/group. B. Systolic blood pressure measured under anesthesia in mice before and seven days after Drd2 siRNAinfusion; n = 5/group. C. Renal cortical expression of TNFa, Lta, NFkB1, MCP-1, MCP-2, IL-10, IL-11, osteopontin and collagen 1a1 mRNA was quantifiedby qRT-PCR, results corrected for expression of GAPDH mRNA, and expressed as fold change in comparison to their expression in mice treated withNS siRNA. *P,0.05 vs. NS; n = 5/group.doi:10.1371/journal.pone.0038745.g006
Dopamine and Inflammation
PLoS ONE | www.plosone.org 8 June 2012 | Volume 7 | Issue 6 | e38745
factors in D22/2 mice were organ specific and not caused by
systemic perturbations.
Decreasing Blood Pressure and ROS does not Normalizethe Expression of Inflammatory Factors in Renal Cortex ofD22/2 Mice
Treatment with apocynin decreased systolic blood pressure in
D22/2 mice (vehicle: 12165; apocynin: 9662 mm Hg; n = 5;
P,0.05) but not in D2+/+ mice (vehicle: 9863; apocynin
9565 mmHg; n = 5). Apocynin also decreased the urinary
excretion of the oxidative stress marker 8-isoprostane in D22/2
mice (vehicle: 31666456; apocynin: 18746553 pg/mg creatinine;
n = 5, P,0.04) to levels similar to those in wild-type mice (vehicle:
13446365; apocynin: 15426280 pg/mg creatinine; n = 5). Treat-
ment with apocynin, however, did not normalize the expression of
TNFa, MCP-1, or IL-6 in D22/2 mice. TNFa expression in
renal cortex was higher in vehicle-treated D22/2 than vehicle-
treated D2+/+ mice; apocynin had no effect on TNFa expression
in D2+/+ or D22/2 mice. MCP-1 protein expression was also
higher in vehicle-treated D22/2 than in vehicle-treated D2+/+mice; apocynin had no effect on MCP-1 expression in D2+/+ mice
but decreased it in D22/2 mice although not to the level
observed in D2+/+ mice (Figure 3). Renal cortical IL-6 protein
expression and urinary excretion of IL-6 were also higher in
vehicle-treated D22/2 than in vehicle-treated D2+/+ mice;
apocynin had no effect on IL-6 in D2+/+ mice but modestly
decreased its levels in D22/2 mice although they remained
higher than D2+/+ mice (Figure 3).
Drd2 Silencing in Mouse RPTCs Results in Increased NFkBTranscriptional Activity and TNFa and MCP-1 Expression
Mouse RPTCs in culture endogenously express D2R, TNFa,
and MCP-1. Forty-eight hour-treatment with Drd2 siRNA de-
creased D2R protein expression by about 85%. The treatment
increased NFkB transcriptional activity (3.5-fold) and about two-
fold the expression of both TNFa, and MCP-1 which are
downstream of NFkB (Figure 4A).
Stimulation of D2R Counteracts the Effects of Ang II inMouse RPTCs
Treatment with Ang II (100 nmol/l) increased the expression of
TNFa by about 50% and that of MCP-1 about 60% in mouse
RPTCs. Treatment with quinpirole (1 mmol/l), a D2R/D3R
agonist, prevented the stimulatory effect of Ang II on the
expression of TNFa and MCP-1. The effect of quinpirole was
blocked by the addition of L-741,262, a selective D2R antagonist
(Figure 4B).
Renal Specific Drd2 Down-regulation Recapitulates theEffects of Germline Drd2 Knockout on InflammatoryFactors Independently of Changes in Blood Pressure
To determine further the role of D2R in the renal inflammatory
reaction, we acutely and selectively silenced renal Drd2s in mice in
order to avoid the confounding effects of systemic D2R deletion.
Infusion of Drd2 siRNA for seven days in uni-nephrectomized
mice decreased renal cortical expression of D2R by 50% but did
not affect the expression of the receptor in the liver, indicating
renal selectivity of the down-regulation (Figure 5A). As with
systemic Drd2 deletion, treatment with Drd2 siRNA increased
systolic blood pressure by about 20 mmHg (Figure 5B), an
increase of the same magnitude of that observed in mice with
systemic Drd2 deletion [3,4]. This highlights the role of D2R in the
regulation of blood pressure via the kidney. Subcapsular renal
Drd2 silencing in uni-nephrectomized mice increased renal cortical
mRNA expression of TNFa, Lta, NFkB1, MCP-2 and IL-10, and
simultaneously decreased the expression of IL-11. These results
are similar to those found in mice with systemic Drd2 deletion,
confirming the role of renal D2R in the regulation of the
expression of inflammatory factors. Furthermore, the expression of
osteopontin and Col 1a1, markers of tissue damage [34], was also
increased in the kidneys with silenced D2Rs (Figure 5C).
In order to eliminate the confounding effect of uni-nephrectomy
and the increase in blood pressure in the above experiments, we
also studied the effect of chronic unilateral renal subcapsular
infusion of Drd2 siRNA in mice with two intact kidneys. Selective
down-regulation of Drd2 in one kidney (Figure 6A) had no effect
on systolic blood pressure (Figure 6B), suggesting that the intact
kidney, in the short-term, is able to compensate for the effects of
decreased Drd2 expression in the treated kidney. The mRNA
expression of TNFa, Lta, NFkB1, MCP-1 and MCP-2 was
increased in the treated kidney to the same extent as in treated uni-
nephrectomized mice; NFkB1 and IL-10 were increased but to
a lesser extent than in uni-nephrectomized mice. The mRNA
expression of IL-11 was similarly decreased. In contrast the
expression of the injury markers osteopontin and Col 1a1 was
increased to a greater extent than in infused remnant kidney of
uni-nephrectomized mice (Figure 6C).
Discussion
Our results show increased renal expression of pro-inflamma-
tory and decreased expression of anti-inflammatory cytokines/
chemokines, as well as histological and functional evidence of renal
inflammation and injury in mice lacking D2Rs. These alterations
are renal-specific and are mimicked in mouse RPTCs in which the
Drd2 is silenced. Moreover, selective unilateral renal D2R down-
regulation in mice with two kidneys, in the absence of elevated
blood pressure, reproduced the alterations in inflammatory factors
and renal injury observed in D22/2 mice. Thus, our findings
indicate that D2Rs in the kidney have a direct and significant role
in regulating the mechanisms involved in the development of renal
inflammation and injury, as well as in blood pressure control.
Chemokines that play an essential role in the direct migration of
various types of immune cells were up-regulated in kidneys of
D22/2 mice, Drd2-silenced kidneys and RPTCs. In several
models of renal injury, MCP-1 and RANTES are expressed in
damaged renal tissues and precede the recruitment of inflamma-
tory cells that is a characteristic of many kidney diseases [7]. The
infiltrating cells mediate the initiation and progression of injury by
direct cytotoxicity, secretion of pro-inflammatory cytokines, and
the induction of other pro-inflammatory mediators in renal tubule
cells.
The increased gene transcription/protein expression of in-
flammatory factors with Drd2 silencing may be caused by
decreased D2R-dependent inhibition leading to increased pro-
duction of TNFa, a major regulator of cytokine/chemokine
expression. Experimental and clinical studies have demonstrated
the role of TNFa as a mediator of inflammatory tissue damage in
the pathogenesis of acute and chronic renal disease. TNFa is
released from renal cells in response to injury and induces
glomerular fibrin deposition, cellular infiltration, and vasocon-
striction [35] but causes marked natriuresis [36]. TNFa stimula-
tion increases the expression of IL-6, IL-10, and MCP-1 [22]. In
immune cells, TNFa production is decreased by dopamine and
D2R agonists [21] and in adrenal cortical cells, dopamine, through
the D2R, inhibits basal and secretagogue-stimulated TNFa. Our
results in mouse RPTCs showing increased basal TNFa expression
Dopamine and Inflammation
PLoS ONE | www.plosone.org 9 June 2012 | Volume 7 | Issue 6 | e38745
in response to Drd2 silencing and inhibition of Ang II-induced
TNFa stimulation by D2R activation, indicate that in RPTCs the
D2R negatively regulates both basal and Ang II-stimulated TNFaproduction.
TNFa and other members of the TNF superfamily regulate the
expression of a large number of cytokines and chemokines by
several mechanisms [37], one of which is the activation and
nuclear translocation of NFkB [38]. NFkB, which is activated by
TNFa, mediates the inflammatory response to TNFa, IL-1b, and
other inflammatory factors in renal cells [33]. In turn, the
transcription of TNFa and TNF superfamily members is increased
by NFkB activation, generating a positive-feedback loop of
activation [39]. Our data show that deficient D2R expression
results in NFkB activation, as indicated by the increased renal
expression of NFkB1 (p50) and NFkB transcriptional activity in
mouse RPTCs. NFkB has been implicated as a factor in diabetic
nephropathy [40]. Because the D2R has been shown to positively
regulate NFkB activation in neural-derived cell lines [41,42] it is
likely that the negative regulation observed in the current studies is
mediated by its direct effects on TNFa expression and function.
Most of the down-regulated cytokines in the renal cortex of D22/
2 mice are Th2-type cytokines (e.g., IL-4 and IL-13); the
transcription of these cytokines is mainly dependent on factors
other than TNFa or NFkB [43] and is negatively regulated by
Th1-type cytokines [44].
The hypertension noted in D22/2 mice is at least partially
related to increased renal production of ROS [4]. To evaluate the
potentially confounding effect of high blood pressure and ROS on
renal inflammation, we treated D22/2 mice with apocynin,
which normalized both blood pressure and ROS production [4] as
it does in several experimental models of hypertension [45].
Apocynin had no significant effect on the expression of TNFa, and
IL-6, although it decreased MCP-1 expression. These results
suggest that, in D22/2 mice, high blood pressure or increased
ROS may contribute but neither is the major cause of the
increased expression of pro-inflammatory factors. However, an
effect of persistent inflammation due to preexisting hypertension
cannot be ruled out.
The selective unilateral renal silencing of D2R for seven days, in
mice with two kidneys, did not increase blood pressure but
nonetheless increased renal expression of pro-inflammatory
chemokines/cytokines and decreased expression of the anti-
inflammatory, IL-11. This indicates that hypertension, per se, is
not necessary for the development of renal inflammation but may
be a contributing factor. Moreover, the expression of the anti-
inflammatory, IL-10, was increased, indicating some compensa-
tory feed-back mechanism. Nevertheless, our results show that
impaired D2R function (due to decreased D2R expression) results
in a defective balance of pro-inflammatory and anti-inflammatory
factors that contribute to renal inflammation and injury.
As mentioned above, intrarenal dopamine buffers the deleteri-
ous effects of Ang II on renal inflammation and injury [16,17].
Our results suggest that these effects are mediated by the D2R.
Infusion of Ang II in rats increases TNFa production in renal
glomerular endothelial cells, tubules, and vessels, and enhances
expression of MCP-1 [22]. Stimulation of the D2R reversed the
increased expression of TNFa and MCP-1 elicited by Ang II in
mouse RPTCs, indicating that D2R may counterbalance the
damaging effect of Ang II in the kidney.
The current studies contribute to the understanding of the
mechanisms that cause the development of renal inflammation, as
well as the development and maintenance of hypertension [5] and
suggest that decreased D2R function may play a significant role in
these processes. Deficient renal D2R function may be of clinical
relevance since polymorphisms of the Drd2 gene, that are
commonly observed in humans, result in decreased D2R
expression and function as a consequence of decreased D2R
mRNA stability and decreased synthesis of the receptor or
decreased receptor affinity [46–50]. Some of the D2R polymorph-
isms are associated with elevated blood pressure and essential
hypertension [51–53]. Moreover, a recent study in an Asian
Indian population with type 2 diabetes found that a D2R
polymorphism, resulting in decreased expression of the receptor,
confers susceptibility to chronic diabetic nephropathy [54].
Further studies are needed to establish the role of D2R
polymorphisms in conferring susceptibility to chronic renal disease
and to determine whether or not modulation of renal D2R
function may be an option in the treatment of hypertension and
renal injury.
Author Contributions
Conceived and designed the experiments: IA LDA CE AMP JEJ.
Performed the experiments: YZ SC LDA CE YY AMP XW JEJ IA.
Analyzed the data: YZ SC LDA YY XW PAJ IA. Contributed reagents/
materials/analysis tools: DG JEJ. Wrote the paper: YZ SC LDA CE YY
AMP XW JEJ DG GE PAJ IA.
References
1. Jose PA, Soares-da-Silva P, Eisner GM, Felder RA (2010) Dopamine and G
protein-coupled receptor kinase 4 in the kidney: Role in blood pressure
regulation. Biochim Biophys Acta 802: 1259–1267.
2. Zeng C, Armando I, Luo Y, Eisner GM, Felder RA, et al. (2008) Dysregulation
of dopamine-dependent mechanisms as a determinant of hypertension: studies in
dopamine receptor knockout mice. Am J Physiol Heart Circ Physiol 294: H551–
H569.
3. Li XX, Bek M, Asico LD, Yang Z, Grandy DK, et al. (2001) Adrenergic and
endothelin B receptor-dependent hypertension in dopamine receptor type-2
knockout mice. Hypertension 38: 303–308.
4. Armando I, Wang X, Villar VA, Jones JE, Asico LD, et al. (2007) Reactive
oxygen species-dependent hypertension in dopamine D2 receptor-deficient
mice. Hypertension 49: 672–678.
5. Harrison DG, Guzik TJ, Lob HE, Madhur MS, Marvar PJ, et al. (2011)
Inflammation, immunity, and hypertension. Hypertension 57: 132–140.
6. Segerer S, Schlondorff D (2007) Role of Chemokines for the Localization of
Leukocyte Subsets in the Kidney. Semin Nephrol 27: 260–274.
7. Wang Y, Tay YC, Harris DC (2004) Proximal tubule cells stimulated by
lipopolysaccharide inhibit macrophage activation. Kidney Int 66: 655–662.
8. Bendele AM, Spaethe SM, Benslay DN, Bryant HU (1991) Anti-inflammatory
activity of pergolide, a dopamine receptor agonist. J Pharmacol Exp Ther 259:
169–175.
9. Ghosh MC, Mondal AC, Basu S, Banerjee S, Majumder J, et al. (2003)
Dopamine inhibits cytokine release and expression of tyrosine kinases, Lck and
Fyn in activated T cells. Int Immunopharmacol 3: 1019–1026.
10. Hasko G, Szabo C, Nemeth ZH, Deitch EA (2002) Dopamine suppresses IL-12
p40 production by lipopolysaccharide-stimulated macrophages via a b-adreno-
ceptor-mediated mechanism. J Neuroimmunol 122: 34–39.
11. Bach F, Grundmann U, Bauer M, Buchinger H, Soltesz S, et al. (2002)
Modulation of the inflammatory response to cardiopulmonary bypass by
dopexamine and epidural anesthesia. Acta Anesthesiol Scand 46: 1227–1235.
12. Birnbaum J, Klotz E, Spies CD, Lorenz B, Stuebs P, et al. (2006) Effects of
dopexamine on the intestinal microvascular blood flow and leukocyte activation
in a sepsis model in rats. Crit Care 10: R117–124.
13. Zhu XH, Zellweger R, Wichmann MW, Ayala A, Chaudry IH (2007) Effects of
prolactin and metoclopramide on macrophage cytokine gene expression in late
sepsis. Cytokine 9: 437–446.
14. Hoeger S, Gottmann U, Liu Z, Schnuelle P, Birck R, et al. (2007) Dopamine
treatment in brain-dead rats mediates anti-inflammatory effects: the role of
hemodynamic stabilization and D-receptor stimulation. Transpl Int 20: 790–
799.
15. Hoeger S, Reisenbuechler A, Gottmann U, Doyon F, Braun C, et al. (2008)
Donor dopamine treatment in brain dead rats is associated with an improvement
in renal function early after transplantation and a reduction in renal
inflammation. Transpl Int 21: 1072–1080.
Dopamine and Inflammation
PLoS ONE | www.plosone.org 10 June 2012 | Volume 7 | Issue 6 | e38745
16. Zhang MZ, Yao B, Wang S, Fan X, Wu G, et al. (2011). Intrarenal dopamine
deficiency leads to hypertension and decreased longevity in mice. J Clin Invest121: 2845–2854.
17. Yang S, Yao B, Zhou Y, Yin H, Zhang MZ, et al. (2012). Intrarenal dopamine
modulates progressive angiotensin II-mediated renal injury. Am J Physiol RenalPhysiol 302: F742–F749.
18. Levite M (2008) Neurotransmitters activate T-cells and elicit crucial functionsvia neurotransmitter receptors. Curr Opin Pharmacol l8: 460–471.
19. Morikawa K, Oseko F, Morikawa S (1994) Immunosuppressive activity of
bromocriptine on human T lymphocyte function in vitro. Clin Exp Immunol 95:514–518.
20. Besser MJ, Ganor Y, Levite M (2005) Dopamine by itself activates either D2, D3or D1/D5 dopaminergic receptors in normal human t-cells and triggers the
selective secretion of either IL-10, TNFa or both. J Neuroimmunol 169: 161–171.
21. Laengle UW, Markstein R, Pralet D, Seewald W, Roman D (2006) Effect of
GLC756, a novel mixed dopamine D1 receptor antagonist and dopamine D2receptor agonist, on TNF-a release in vitro from activated rat mast cells. Exp
Eye Res 83: 1335–1339.22. Ruiz-Ortega M, Ruperez M, Lorenzo O, Esteban V, Blanco J, et al. (2002)
Angiotensin II regulates the synthesis of proinflammatory cytokines and
chemokines in the kidney. Kidney Int 82: S12–22.23. Woost PG, Kolb RJ, Finesilver M, Mackraj I, Imboden H, et al. (2006) Strategy
for the development of a matched set of transport-competent, angiotensinreceptor-deficient proximal tubule cell lines. In Vitro Cell Dev Biol Anim 42:
189–200.24. Ferguson SM, Norton CS, Watson SJ, Akil H, Robinson TE (2003)
Amphetamine-evoked c-fos mRNA expression in the caudate-putamen: the
effects of DA and NMDA receptor antagonists vary as a function of neuronalphenotype and environmental context. J Neurochem 86: 33–44.
25. Livak KJ, Schmittgen TD (2001) Analysis of relative gene expression data usingreal-time quantitative PCR and the 22DD
CT method. Methods 25: 402–408.
26. Yoneda M, Sanada H, Yatabe J, Midorikawa S, Hashimoto S, et al. (2005)
Differential effects of angiotensin II type-1 receptor antisense oligonucleotides onrenal function in spontaneously hypertensive rats. Hypertension 48: 58–65.
27. Bonecchi R, Galliera E, Borroni EM, Corsi M, Locati M, et al. (2009)Chemokines and chemokine receptors: an overview. Front Biosci 14: 540–551.
28. Romagnani P, Beltrame C, Annunziato F, Lasagni L, Luconi M, et al. (1999)Role for interactions between IP-10/Mig and CXCR3 in proliferative
glomerulonephritis. J Am Soc Nephrol 10: 2518–2526.
29. Zheng L, Sinniah R, I-Hong Hsu S (2008). Pathogenic Role of NFkB activationin tubulointerstitial inflammatory lesions in human lupus nephritis. J Histochem
Cytochem 56: 517–529.30. Aggarwal BB (2003) Signalling pathways of the TNF superfamily: A double-
edged sword. Nat Rev Immunol 3: 745–756.
31. Patel NS, Chatterjee PK, Di Paola R, Mazzon E, Britti D, et al. (2005)Endogenous interleukin-6 enhances the renal injury, dysfunction, and in-
flammation caused by ischemia/reperfusion. J Pharmacol Exp Ther 312: 1170–1178.
32. Mosser DM, Zhang X (2008) Interleukin-10: new perspectives on an oldcytokine. Immunol Rev 226: 205–218.
33. Sanz AB, Sanchez-Nino MD, Ramos AM, Moreno JA, Santamaria B, et al.
(2010) NFkB in renal inflammation. J Am Soc Nephrol 21: 1254–1262.34. Lea WB, Kwak ES, Luther JM, Fowler SM, Wang Z, et al. (2009) Aldosterone
antagonism or synthase inhibition reduces end-organ damage induced bytreatment with angiotensin and high salt. Kidney Int. 75: 936–944.
35. Donnahoo KK, Shames BD, Harken AH, Meldrum DR (1999) Review article:
the role of tumor necrosis factor in renal ischemia-reperfusion injury. J Urol 162:196–203.
36. Shahid M, Francis J, Matrougui K, Majid DS (2010) Involvement of tumor
necrosis factor-a in natriuretic response to systemic infusion of nitric oxidesynthase inhibitor in anesthetized mice. Am J Physiol Renal Physiol 299: F217–
F224.
37. Dempsey PW, Doyle SE, He JQ, Cheng G (2003) The signaling adaptors and
pathways activated by TNF superfamily. Cytokine Growth Factor Rev 14: 193–
209.
38. Li Q, Verma IM (2002) NFkB regulation in the immune system. Nat Rev
Immunol 2: 725–734.
39. Covert MW, Leung TH, Gaston JE, Baltimore D (2005) Achieving stability of
lipopolycacharide-induced NFkB activation. Science 309: 1954–1857.
40. Pergola PE, Raskin P, Toto RD, Meyer CJ, Huff JW, et al. (2011) Bardoxolone
methyl and kidney function in CKD with type 2 diabetes. N Engl J Med 365:
327–336.
41. Yang M, Zhang H, Voyno-Yasenetskaya T, Ye RD (2003) Requirement of Gbcand c-Src in D2 dopamine receptor-mediated nuclear factor-kB activation. Mol
Pharmacol 64: 447–455.
42. Takeuchi Y, Fukunaga K (2003) Differential regulation of NF-kB, SRE and
CRE by dopamine D1 and D2 receptors in transfected NG108-15 cells.
J Neurochem 85: 729–739.
43. Lavender P, Cousins D, Lee T (2000) Regulation of Th2 cytokine gene
transcription. Chem Immunol 78: 16–29.
44. Zhu J (2010) Transcriptional regulation of Th2 cell differentiation. Immunol
Cell Biol 88: 244–249.
45. Tian N, Moore RS, Phillips WE, Lin L, Braddy S, et al. (2008) NADPH oxidase
contributes to renal damage and dysfunction in Dahl salt-sensitive hypertension.
Am J Physiol Regul Integr Comp Physiol 295: R1858–R1865.
46. Duan J, Wainwright MS, Comeron JM, Saitou N, Sanders AR, et al. (2003)
Synonymous mutations in the human dopamine receptor D2 (DRD2) affect
mRNA stability and synthesis of the receptor. Hum Mol Genet 12: 205–216.
47. Thompson J, Thomas N, Singleton A, Piggott M, Lloyd S, et al. (1997) D2
dopamine receptor gene (DRD2) Taq1A polymorphism: reduced dopamine D2receptor binding in the human striatum associated with the A1 allele.
Pharmacogenetics 7: 479–484.
48. Pohjalainen T, Rinne JO, Nagren K, Lehikoinen P, Anttila K, et al. (1998) The
A1 allele of the human D2 dopamine receptor gene predicts low D2 receptor
availability in healthy volunteers. Mol Psychiatry 3: 256–260.
49. Jonsson EG, Nothen MM, Grunhage F, Farde L, Nakashima Y, et al. (1999)
Polymorphisms in the dopamine D2 receptor gene and their relationships to
striatal dopamine receptor density of healthy volunteers. Mol Psychiatry 4: 290–
296.
50. Ritchie T, Noble EP (2003) Association of seven polymorphisms of the D2
dopamine receptor gene with brain receptor-binding characteristics. Neurochem
Res 28: 73–82.
51. Fang YJ, Thomas GN, Xu ZL, Fang JQ, Critchley JA, et al. (2005) An affected
pedigree member analysis of linkage between the dopamine D2 receptor geneTaqI polymorphism and obesity and hypertension. Int J Cardiol 102: 111–116.
52. Rosmond R, Rankinen T, Chagnon M, Perusse L, Chagnon YC, et al. (2001)
Polymorphism in exon 6 of the dopamine D(2) receptor gene (DRD2) is
associated with elevated blood pressure and personality disorders in men. J Hum
Hypertens 15: 553–558.
53. Thomas GN, Critchley JA, Tomlinson B, Cockram CS, Chan JC (2001)
Relationships between the taqI polymorphism of the dopamine D2 receptor and
blood pressure in hyperglycaemic and normoglycaemic Chinese subjects. Clin
Endocrinol (Oxf) 55: 605–611.
54. Prasad P, Kumar KM, Ammini AC, Gupta A, Gupta R, et al. (2008)Association
of dopaminergic pathway gene polymorphisms with chronic renal insufficiency
among Asian Indians with type-2 diabetes. BMC Genet 9: 26.
Dopamine and Inflammation
PLoS ONE | www.plosone.org 11 June 2012 | Volume 7 | Issue 6 | e38745
Top Related
Copyright © 2022 FDOKUMEN

