


Bahasa
Halaman
Hukum

This article was downloaded by: [University of Gent], [Jan Van Looy]On: 26 June 2014, At: 08:20Publisher: RoutledgeInforma Ltd Registered in England and Wales Registered Number: 1072954 Registeredoffice: Mortimer House, 37-41 Mortimer Street, London W1T 3JH, UK
Media PsychologyPublication details, including instructions for authors andsubscription information:http://www.tandfonline.com/loi/hmep20
Development and Validation of anInstrument for Measuring IndividualMotives for Playing Digital GamesFrederik De Grovea, Verolien Caubergheb & Jan Van Looya
a Department of Communication Sciences, Ghent University,Research Group for Media and ICT (iMinds-MICT), Ghent, Belgiumb Department of Communication Sciences, Ghent University, Centerfor Persuasive Communication (CEPEC), Ghent, BelgiumPublished online: 25 Jun 2014.
To cite this article: Frederik De Grove, Verolien Cauberghe & Jan Van Looy (2014): Developmentand Validation of an Instrument for Measuring Individual Motives for Playing Digital Games, MediaPsychology, DOI: 10.1080/15213269.2014.902318
To link to this article: http://dx.doi.org/10.1080/15213269.2014.902318
PLEASE SCROLL DOWN FOR ARTICLE
Taylor & Francis makes every effort to ensure the accuracy of all the information (the“Content”) contained in the publications on our platform. However, Taylor & Francis,our agents, and our licensors make no representations or warranties whatsoever as tothe accuracy, completeness, or suitability for any purpose of the Content. Any opinionsand views expressed in this publication are the opinions and views of the authors,and are not the views of or endorsed by Taylor & Francis. The accuracy of the Contentshould not be relied upon and should be independently verified with primary sourcesof information. Taylor and Francis shall not be liable for any losses, actions, claims,proceedings, demands, costs, expenses, damages, and other liabilities whatsoever orhowsoever caused arising directly or indirectly in connection with, in relation to or arisingout of the use of the Content.
This article may be used for research, teaching, and private study purposes. Anysubstantial or systematic reproduction, redistribution, reselling, loan, sub-licensing,systematic supply, or distribution in any form to anyone is expressly forbidden. Terms &Conditions of access and use can be found at http://www.tandfonline.com/page/terms-and-conditions
Media Psychology, 00:1–25, 2014
Copyright © Taylor & Francis Group, LLC
ISSN: 1521-3269 print/1532-785X online
DOI: 10.1080/15213269.2014.902318
Development and Validation of anInstrument for Measuring Individual Motives
for Playing Digital Games
FREDERIK DE GROVEDepartment of Communication Sciences, Ghent University, Research Group for Media and
ICT (iMinds-MICT), Ghent, Belgium
VEROLIEN CAUBERGHEDepartment of Communication Sciences, Ghent University, Center for Persuasive
Communication (CEPEC), Ghent, Belgium
JAN VAN LOOYDepartment of Communication Sciences, Ghent University, Research Group for Media and
ICT (iMinds-MICT), Ghent, Belgium
Individual motives for playing digital games have been studied
from a variety of theoretical perspectives using different measure-
ment instruments. However, an instrument that roots the social,
rule-based narrative essence of digital games in a theory on hu-
man behavior acknowledging that not all behavior is consciously
motivated has hitherto been lacking. A framework based on so-
cial cognitive theory that integrates these dimensions is proposed.
After comparing the advantages of this framework to existing ap-
proaches, the development of a measurement instrument is dis-
cussed. This development concerns the generation and evaluation
of an item pool and also testing the instrument for reliability
and validity on different samples and different populations. Re-
sults suggest psychometric as well as theoretical soundness of the
instrument.
Playing digital games has become a widespread phenomenon in everydayleisure (Entertainment Software Association, 2013; Interactive Software Fed-eration of Europe, 2012). Understanding why millions of people engagein this activity is important for several reasons. In the first place, it allows
Address correspondence to Frederik De Grove, Department of Communication Sciences,Ghent University, Research Group for Media and ICT (iMinds-MICT), Korte Meer 7-9-11, Ghent
9000, Belgium. E-mail: [email protected]
1
Dow
nloa
ded
by [
Uni
vers
ity o
f G
ent]
, [Ja
n V
an L
ooy]
at 0
8:20
26
June
201
4
2 F. De Grove et al.
for explaining and understanding the growing popularity of the mediumin question while it additionally fosters further inquiry into motivationalprocesses regarding mediated human action. Furthermore, understandingmotives for play provides a necessary starting point for related researchquestions such as those concerning positive or negative effects of playingdigital games (Ferguson & Olson, 2013). Academic research on the topic hasbeen approached from different perspectives. Drawing on self-determinationtheory (Deci & Ryan, 1985), scholars have regarded motives for playingdigital games as an intrinsically enjoyable experience explained by the needfor competence, relatedness, and autonomy (Przybylski, Rigby, & Ryan, 2010;Tamborini, Bowman, Eden, Grizzard, & Organ, 2010). From a uses andgratifications perspective, digital play has been explained by constructs suchas arousal, challenge, competition, diversion, fantasy, and social interaction(Jansz & Tanis, 2007; Sherry, Lucas, Greenberg, & Lachlan, 2006). In a similarvein, Lee and LaRose (2007) used social cognitive theory (SCT) and flowto explain play behavior in terms of concentration, merging of action andawareness, enjoyment, optimal balance, habit, self-reactive outcomes, andself-regulation. On a theoretical level, these theories have proven to presentdistinct yet fruitful starting points to approach motives for playing digitalgames. On a conceptual level, they all result in motivational dimensions thatare more often similar than not. It has been remarked, however, that theseapproaches do not fully account for the specificity of the medium underscrutiny. In order to overcome this obstacle, De Grove, Cauberghe, andVan Looy (2014) have conceptualized games as social, rule-based narrativesystems and have linked this to social cognitive theory, a broad theory onhuman behavior.
A SOCIAL COGNITIVE THEORY OF DIGITAL GAMES
According to SCT, people are motivated to perform certain actions by cogni-tively processing consequences of behavior (Bandura, 1986). Indeed, actionis partly determined by anticipating consequences of behavior through thecapability of forethought. These consequences can be based on experientialor vicarious learning. In the latter case, people form beliefs about conse-quences observed from others. Outcomes can be classified based on theirmain source of production. First, self-produced outcomes result from evaluat-ing the outcome of actions according to personal or environmental standards,which results in self-produced tangible or affective self-reactions. A secondoutcomes type stems from factors external to the person, such as material,sensory, token, and social outcomes. In practice, behavior emerges fromcombining these different types of outcome expectations. Moreover, bothtypes are interconnected. Indeed, external outcomes also depend on self-regulatory influences when it comes to their impact (Bandura, 1986). Guiding
Dow
nloa
ded
by [
Uni
vers
ity o
f G
ent]
, [Ja
n V
an L
ooy]
at 0
8:20
26
June
201
4
Development and Validation of the DGMS 3
the functioning of these outcome expectations is the belief of self-efficacy,which concerns the belief in one’s capabilities to perform certain behavior.The belief in one’s capabilities will influence which goals to set and howsubsequent behavior is observed and evaluated. While research on media usehas shown that outcome expectations serve as predictors of behavior, it hasalso been pointed out that not all behavior is consciously motivated (LaRose& Eastin, 2004). Indeed, repeated behavior in stable contexts leads to habitformation in order to reduce the cognitive load related to decision making(LaRose, 2010). Hence, over time, outcome expectations are transformed intohabits, which guide behavior that was previously consciously motivated.
From a digital games perspective, three relevant types of expectedoutcomes have been defined: game-internal, game-external, and normativeoutcomes (De Grove et al., 2014). Game-internal outcomes are outcomes thatstem from digital games being conceptualized as social rule-based narrativesystems and are formed based on direct consequences when playing digitalgames, be they firsthand or vicarious. They are internal in that the mainsource of the outcomes lies in the characteristics of the activity. In fact, theseoutcomes can be mainly considered as those that make gaming intrinsicallyenjoyable. It should be noted that these game-internal outcome expectationsare initially produced by the game, yet they also tend to become self-produced due to their susceptibility to the self-regulation process (De Groveet al., 2014). Similarly, game-external outcomes can also be considered asdirect outcomes. The underlying goal is not enjoyment however. Instead,play serves as a mediator between individual and context. In this sense,playing digital games becomes a means and not an end in itself. Normativeoutcomes, finally, are self-produced outcomes based on moral standards. Incontrast to game-internal and game-external outcomes, normative outcomesdo not directly stem from the behavior in question but are related to thestatus of digital games as cultural artifacts in contemporary society. In fact,normative outcomes refer to the idea that the activity of playing digital gamesis not a neutral one. As a consequence, the morality of the behavior canplay a role in the judgmental process of self-regulation, which can, in turn,lead to affective self-reactive outcomes. Indeed, even if one expects theoutcome of an activity to be pleasurable, this does not ensure the behaviorwill be executed. When the behavior in question is negatively evaluated ina normative way, it might prevent performing the relevant activity.
Using SCT as a framework for understanding individual motives for playis advantageous for at least two reasons (De Grove et al., 2014). First, it hasproven its value in providing a flexible framework in which to place and de-fine different determinants of digital play (Lee & LaRose, 2007). Second, out-come expectations can be based on first-hand experiences and on vicariouslearning. As a consequence, people can hold expectations about outcomesof actions they did not perform themselves. Hence, outcome expectationsallow for understanding why people do not play certain game genres or
Dow
nloa
ded
by [
Uni
vers
ity o
f G
ent]
, [Ja
n V
an L
ooy]
at 0
8:20
26
June
201
4

4 F. De Grove et al.
why people do not play digital games altogether. This reasoning is alsouseful in accounting for the variation in the rule-based, social, and narrativedimensions. Indeed, if one never plays a digital game with a story, it doesnot mean that expectations concerning the narrative dimension are absent.These advantages become apparent when comparing the SCT frameworkwith that of self-determination theory (SDT). Indeed, the needs proposedby SDT do not fully account for gaming as a social rule-based narrativepractice. This is especially true for the content dimension which is absentin SDT. Furthermore, since SDT is limited to three universal needs, thereseems to be little flexibility in accounting for other relevant or culture-specific motives such as normative evaluations of the behavior in question.In addition, research on digital games and SDT typically restricts itself tointrinsic motivation (see Przybylski et al., 2010; Tamborini et al., 2010).While it is true that digital games are generally played for pleasure, this isseldom exclusively the case (Kallio, Mäyrä, & Kaipainen, 2011). What is more,the conceptualization of SDT does not account for habitual behavior whichhas proven to significantly mediate outcome expectations and predict gameattendance (Lee & LaRose, 2007). In other words, SCT allows for taking intoaccount the interplay between consciously and less consciously motivatedbehavior. Finally, SDT is concerned with understanding past behavior. Incontrast to SCT, it does not allow for understanding why people would startplaying games in the first place, nor why people would refrain from playingdigital games or certain game genres.
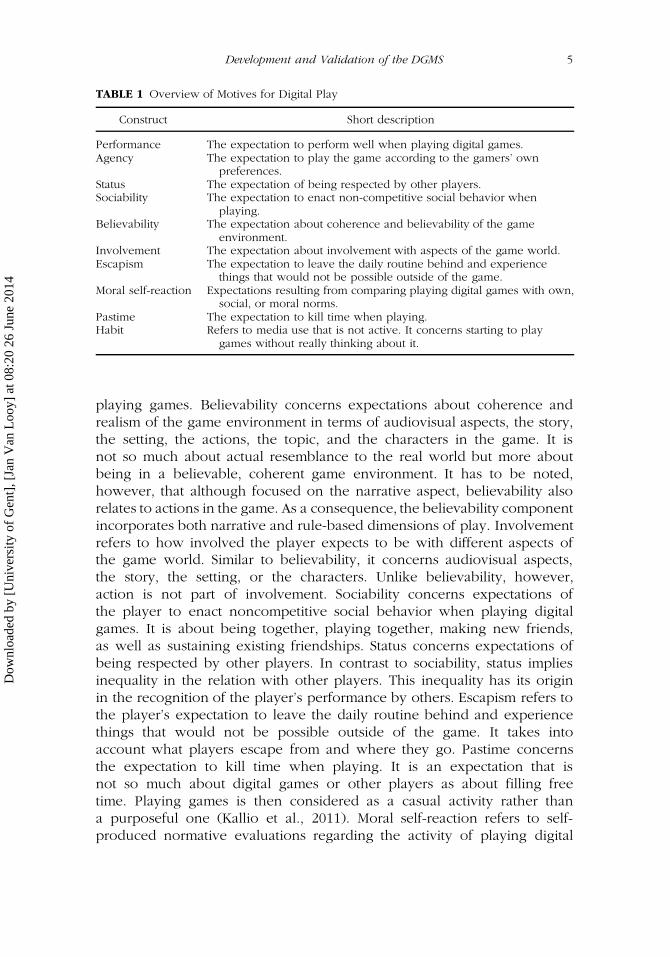
Drawing on SCT, literature on motivations for gaming, and in-depthinterviews, De Grove and colleagues (2014) have proposed nine expectedoutcomes for play: performance, agency, believability, involvement, socia-bility, status, moral self-reaction, escapism, and pastime. In addition to theseoutcomes, the concept of habit has been proposed to account for less con-scious behavior. Pastime and escapism can be considered as game-externaloutcomes, moral self-reaction as a normative outcome, and all other out-comes as game-internal outcomes. A short discussion of those constructsfollows. For a more elaborate overview, we refer to De Grove et al. (2014),and for a schematic overview, we refer to Table 1.
Performance refers to the player’s expectation to perform well whenplaying digital games. Performance happens when a goal is reached. Goals,however, can have different origins. First, they can be set by the game,such as beating a boss or completing a level. Second, players can set theirown goals. Third, some goals are set by other people involved in thegame, for instance, when trying to beat each other’s scores in a racinggame. These goals should not be seen as necessarily independent fromeach other. Agency refers to the expectations of the player regarding hisor her ability to play the game according to his or her own preferences.It concerns having the feeling of playing a game instead of being playedby the game. This can refer to narrative as well as ludological aspects of
Dow
nloa
ded
by [
Uni
vers
ity o
f G
ent]
, [Ja
n V
an L
ooy]
at 0
8:20
26
June
201
4
Development and Validation of the DGMS 5
TABLE 1 Overview of Motives for Digital Play
Construct Short description
Performance The expectation to perform well when playing digital games.Agency The expectation to play the game according to the gamers’ own
preferences.Status The expectation of being respected by other players.Sociability The expectation to enact non-competitive social behavior when
playing.Believability The expectation about coherence and believability of the game
environment.Involvement The expectation about involvement with aspects of the game world.Escapism The expectation to leave the daily routine behind and experience
things that would not be possible outside of the game.Moral self-reaction Expectations resulting from comparing playing digital games with own,
social, or moral norms.Pastime The expectation to kill time when playing.Habit Refers to media use that is not active. It concerns starting to play
games without really thinking about it.
playing games. Believability concerns expectations about coherence andrealism of the game environment in terms of audiovisual aspects, the story,the setting, the actions, the topic, and the characters in the game. It isnot so much about actual resemblance to the real world but more aboutbeing in a believable, coherent game environment. It has to be noted,however, that although focused on the narrative aspect, believability alsorelates to actions in the game. As a consequence, the believability componentincorporates both narrative and rule-based dimensions of play. Involvementrefers to how involved the player expects to be with different aspects ofthe game world. Similar to believability, it concerns audiovisual aspects,the story, the setting, or the characters. Unlike believability, however,action is not part of involvement. Sociability concerns expectations ofthe player to enact noncompetitive social behavior when playing digitalgames. It is about being together, playing together, making new friends,as well as sustaining existing friendships. Status concerns expectations ofbeing respected by other players. In contrast to sociability, status impliesinequality in the relation with other players. This inequality has its originin the recognition of the player’s performance by others. Escapism refers tothe player’s expectation to leave the daily routine behind and experiencethings that would not be possible outside of the game. It takes intoaccount what players escape from and where they go. Pastime concernsthe expectation to kill time when playing. It is an expectation that isnot so much about digital games or other players as about filling freetime. Playing games is then considered as a casual activity rather thana purposeful one (Kallio et al., 2011). Moral self-reaction refers to self-produced normative evaluations regarding the activity of playing digital
Dow
nloa
ded
by [
Uni
vers
ity o
f G
ent]
, [Ja
n V
an L
ooy]
at 0
8:20
26
June
201
4
6 F. De Grove et al.
games. Habit, finally, takes into account that repeated behavior becomesmore automatic and less self-directed over time in order to make functioningmore efficient and to lessen the cognitive load of active decision making(LaRose, 2010).
This theoretical and conceptual framework is the foundation on whichthe Digital Games Motivation Scale (DGMS) is operationalized. When con-structing a measurement instrument, an important step is to assess its criterion-related validity. If the measurement instrument behaves as could be expectedbased on its theoretical assumptions, it is an indication that it is measuringwhat it was intended to measure. In this case, the behavior of interest isplaying digital games. Such behavior can be conceptualized in differentways. A first possibility is to look at the frequency of digital play. Severalstudies have operationalized this as the time someone plays during a typicalweek, measured in hours and minutes (LaRose & Eastin, 2004; Sherry et al.,2006). Hence, it is expected that differences in frequency will be relatedto differences in motives for digital play. Research has shown, however,that measuring behavior in hours and minutes raises problems regardingreliability (Blake & Klimmt, 2012). To avoid such problems, we argue thatusing categorical instead of ratio variables is a solution. As such, we expecta positive relation between the motives for play and the frequency of play.Similar to frequency, duration of an average gaming session is a measurethat has been used as a dependent variable in relation with motives for play(Hou, 2011). Therefore, we expect differences in the average play sessionduration to be related positively with all motives for play except for pastime,where we expect a negative relation. The rationale for expecting this negativerelation is that playing just to pass time suggests less investment in the gamingsituation.
Behavior related to playing digital games, however, is more than fre-quency or duration alone. People differ on account of the games and genresthat they play. Furthermore, most people play a variety of digital gamesand multiple games interchangeably (Williams, Yee, & Caplan, 2008). Toconceptualize this kind of behavior, we draw on the field of media studiesin which the concept of media repertoires is used to refer to the exposureto a variety of different media (Hasebrink & Popp, 2006). Similar to the ideaof media repertoires, we advance the concept of game repertoires. In thiscase, it refers to the exposure of a player to different game genres. Previousstudies on gaming motives have either focused on single games (Ryan, Rigby,& Przybylski, 2006), single game genres (Jansz & Tanis, 2007), or digitalgames in general (Lee & LaRose, 2007) when assessing motives for play. Byfocusing on single games or genres, it is not taken into account that mostpeople play more than only one game or genre. Looking at digital gamesin general, however, makes an abstraction of the differences in content aplayer is exposed to. Hence, the idea of game repertoires allows for takinginto account the diversity of exposures between people.
Dow
nloa
ded
by [
Uni
vers
ity o
f G
ent]
, [Ja
n V
an L
ooy]
at 0
8:20
26
June
201
4
Development and Validation of the DGMS 7
CURRENT MEASUREMENT INSTRUMENTS
The past decade has seen several studies that have looked into measuringmotivations for play. In what follows, some of these instruments are evalu-ated based on five criteria. First, we consider to what extent they take thesocial, rule-based, and narrative dimensions of digital games into account.Second, as digital games are also played for reasons outside of the game, weexamine to what extent such external motivators are present. Third, we assesswhether habitual behavior is taken into account. Fourth, we consider howbehavior itself is conceptualized. This is important in that motives are alwaysrelated to certain behavior. It goes without saying that different motivationsunderlie different behavior. It is, for instance, not unreasonable to expectthat motivations for playing a game genre, such as multiplayer massiveonline games differ from motivations for playing sports or fighting games(De Grove et al., 2014). Fifth, we evaluate to what extent the motivationmeasures are rooted in a theory on human behavior. This is important forat least two reasons. First, building an instrument from a theoretical andconceptual framework allows for formulating expectations concerning therelationship of the measure with other variables and, thus, for testing itsvalidity. Second, it serves as the basis for generating and evaluating an itempool in a theoretically informed way and is, thus, a prerequisite for qualitativescale construction (Clark & Watson, 1995).
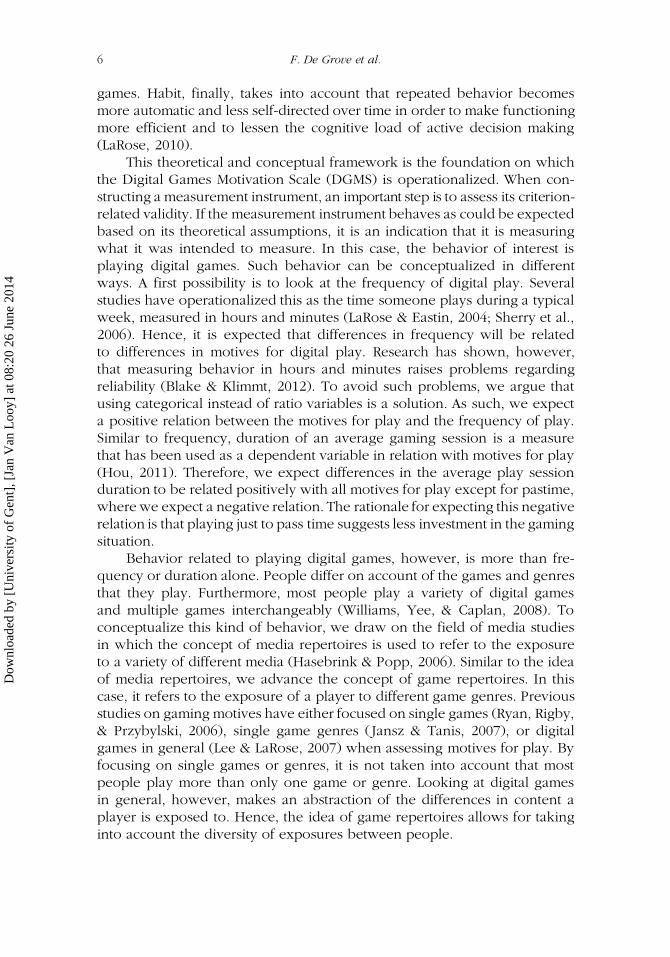
Table 2 gives an overview of 14 studies that have used or developed aninstrument to measure motivations for digital play. A first thing that catchesthe eye is that all studies acknowledge the rule-based character of digitalgames, and that all but two studies take the social dimension into account.Only three studies, however, explicitly acknowledge that people might play
TABLE 2 Comparison of Studies on Motivations and Digital Games
SocialRulebased Narrative External Normative Habit Behavior Theory
Hilgard et al. (2013) X X X X — — Single games —Lafrenière et al. (2012) — X — X — — Video games SDTLee & LaRose (2007) — X — — — X Video games SCTLi et al. (2012) X X — — — — MMOs —Nacke et al. (2013) X X X X — — Game players —Przybylski et al. (2009) X X — — — — Single games SDTRyan et al. (2006) X X — — — — Single games SDTSherry et al. (2006) X X — X — — Video games U>amborini et al. (2010) X X — — — — Single games SDTWallenius et al. (2009) X X — X — — Video games U&GWestwood & Griffiths
(2010)X X X X — — Game players —
Wu et al. (2010) X X — X — — Online games —Yee (2007) X X — — — — Online games —Ferguson et al. (2013) X X — X — — Video games —
Note. SDT D self-determination theory; SCT D social cognitive theory; MMOs D massively multiplayer online games;U&G D uses and gratifications.
Dow
nloa
ded
by [
Uni
vers
ity o
f G
ent]
, [Ja
n V
an L
ooy]
at 0
8:20
26
June
201
4
8 F. De Grove et al.
games for their narrative component. What is more, none of the studiesconsider normative outcomes, while only one study accounts for habitualbehavior. When it comes to the conceptualization of behavior itself, we seefour different approaches. A first one looks into motivations to play specificgames. For instance, the study by Hilgard, Engelhardt, and Bartholow (2013)asks about the three most-played games of players. Consequentially, thisstudy does not account for the multitude of games that people play nextto their top games and, thus, does not look into motivations for playingany other games. Another approach lies in focusing on a single genre. Asdiscussed previously, looking into a single genre or type of game (e.g.,online games) yields a measurement instrument that is useful for that kindof game. At the same time, it prevents measuring motivations that go beyondthe genre for which the instrument was constructed. A third approach usesmotivations to construct or explain different gamer profiles. In this case, itcan be questioned to what extent motivations are used to understand specificbehavior instead of using motivations to define other complex constructs.The study of Westwood and Griffiths (2010) is a case in point. Based on56 statements regarding motivations for play, six gamer types are extracted.Studies such as these use motivations as a means to construct profiles basedon the distribution of scores on motivational constructs. This way of workingpresupposes, however, that the motivational constructs are meaningful andcorrect. In terms of scale construction, they are ad hoc measures withoutcriteria to assess their validity. A final approach is that of conceptualizingbehavior in terms of playing digital games in general. As argued before, thiscollapses the diversity in the content that games are offering, which leads toa loss of information. Therefore, it is proposed that conceptualizing playingdigital games through the concept of game repertoires allows for taking intoaccount that people tend to play a variety of games on the one hand, whileon the other hand, it acknowledges that games vary in the content they offer.
From a theoretical and conceptual perspective, none of the currentapproaches is sufficient to measure motives for playing digital games in termsof the full range of outcome expectations and habitual behavior while alsoaccounting for the variety in content that digital games offer. Consideringthese limitations, the aim of the current study is to build a general, reliableand validated instrument that takes into account the specific characteristicsof digital games from a social cognitive perspective.
METHOD
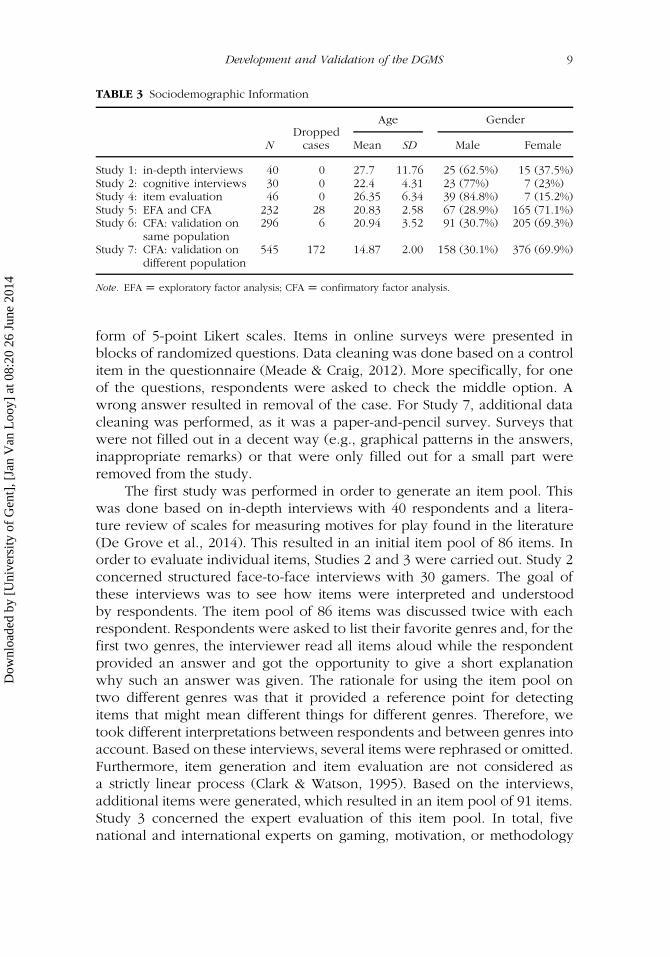
In total, seven studies were carried out to cover the full-scale constructionprocess. Table 3 gives an overview of the sociodemographic information ofthe participants in all studies except for Study 2, which was a study usingexperts. For Studies 4–6, the measurement instrument was presented in the
Dow
nloa
ded
by [
Uni
vers
ity o
f G
ent]
, [Ja
n V
an L
ooy]
at 0
8:20
26
June
201
4
Development and Validation of the DGMS 9
TABLE 3 Sociodemographic Information
Age Gender
NDropped
cases Mean SD Male Female
Study 1: in-depth interviews 40 0 27.7 11.76 25 (62.5%) 15 (37.5%)Study 2: cognitive interviews 30 0 22.4 4.31 23 (77%) 7 (23%)Study 4: item evaluation 46 0 26.35 6.34 39 (84.8%) 7 (15.2%)Study 5: EFA and CFA 232 28 20.83 2.58 67 (28.9%) 165 (71.1%)Study 6: CFA: validation on
same population296 6 20.94 3.52 91 (30.7%) 205 (69.3%)
Study 7: CFA: validation ondifferent population
545 172 14.87 2.00 158 (30.1%) 376 (69.9%)
Note. EFA D exploratory factor analysis; CFA D confirmatory factor analysis.
form of 5-point Likert scales. Items in online surveys were presented inblocks of randomized questions. Data cleaning was done based on a controlitem in the questionnaire (Meade & Craig, 2012). More specifically, for oneof the questions, respondents were asked to check the middle option. Awrong answer resulted in removal of the case. For Study 7, additional datacleaning was performed, as it was a paper-and-pencil survey. Surveys thatwere not filled out in a decent way (e.g., graphical patterns in the answers,inappropriate remarks) or that were only filled out for a small part wereremoved from the study.
The first study was performed in order to generate an item pool. Thiswas done based on in-depth interviews with 40 respondents and a litera-ture review of scales for measuring motives for play found in the literature(De Grove et al., 2014). This resulted in an initial item pool of 86 items. Inorder to evaluate individual items, Studies 2 and 3 were carried out. Study 2concerned structured face-to-face interviews with 30 gamers. The goal ofthese interviews was to see how items were interpreted and understoodby respondents. The item pool of 86 items was discussed twice with eachrespondent. Respondents were asked to list their favorite genres and, for thefirst two genres, the interviewer read all items aloud while the respondentprovided an answer and got the opportunity to give a short explanationwhy such an answer was given. The rationale for using the item pool ontwo different genres was that it provided a reference point for detectingitems that might mean different things for different genres. Therefore, wetook different interpretations between respondents and between genres intoaccount. Based on these interviews, several items were rephrased or omitted.Furthermore, item generation and item evaluation are not considered asa strictly linear process (Clark & Watson, 1995). Based on the interviews,additional items were generated, which resulted in an item pool of 91 items.Study 3 concerned the expert evaluation of this item pool. In total, fivenational and international experts on gaming, motivation, or methodology
Dow
nloa
ded
by [
Uni
vers
ity o
f G
ent]
, [Ja
n V
an L
ooy]
at 0
8:20
26
June
201
4
10 F. De Grove et al.
agreed to evaluate the items. In contrast to Study 2, items were not providedat random. Instead, the theoretical and conceptual framework was explainedand items were placed under their corresponding constructs. Experts wereasked to score each item on a 10-point scale in terms of uniformity andrelevance for the underlying construct. If a score of less than 5 was given,they were asked to elaborate on their decision. Additionally, for each con-struct, two open-ended questions were asked. The first question was toprobe to what extent the expert thinks that all items cover the underlyingconstruct. The second question was an invitation to provide criticism. Fromthe initial 91 items, 69 items were retained for the first reliability test. Itemswere omitted based on the scores given by the experts in combination withtheoretical and conceptual relevance.
A preliminary reliability test of individual constructs (Study 4) was per-formed on a small convenience sample of gamers (N D 46) to exploreindividual item behavior and the reliability for separate constructs. Itemmeans and variances were explored for individual items. Reliability statisticswere examined to look at the reliability of the constructs individually. Itemswith extreme means, little variation, or little contribution to the varianceexplained of the corresponding construct were candidates for removal. Thisresulted in 60 items that were retained. Study 5 was performed to assessthe reliability of the constructs and to determine the factor structure ofthe instrument. The questions were presented online, and undergraduatestudents following the course Communication Scientific Research II wereasked to fill out the questionnaire. Of the 300 students enrolled in this class,260 filled out the survey. After data cleaning, 232 remained. Studies 6 and7 were used to confirm the factor structure and stability of the instrumentthat was built based on data in Study 5. For Study 6, an invitation to fill outa questionnaire was posted on several forums of different faculty websitesof the university. Students were told they would be participating in researchon why people play or do not play digital games. As an incentive, 30 eurowas given away to 10 random participants. In total, 296 students filled outthe survey. Where Study 6 looked at a different sample from the same pop-ulation (undergraduate students), Study 7 looked at a different population:high school students. This allowed us to assess whether the factor structureremained constant over different populations. More concretely, 1,000 paper-and-pencil surveys were distributed among eight different schools. To avoidan abundance of invalid responses, participants were told they could wina gift card of 10 euro. In total, 727 pupils filled out the survey. After datacleaning, 555 remained.
In order to assess criterion-related validity, Studies 5–7 were used. Tothis end, several criterion variables were included: the game repertoire ofthe player, the average duration of a play session, and the expected playfrequency. The game repertoire was assessed by means of latent clusteranalysis and resulted in identifying group membership for each case. Averageduration of a play session was a ratio variable measured by asking how long
Dow
nloa
ded
by [
Uni
vers
ity o
f G
ent]
, [Ja
n V
an L
ooy]
at 0
8:20
26
June
201
4
Development and Validation of the DGMS 11
an average play session takes in hours and minutes. Expected play frequencyasked to what extent a player expects to play games in the coming year, withvariable as daily, 2–3 days a week, at least weekly, at least monthly, less thanmonthly, and never.
RESULTS
Preliminary Reliability Testing
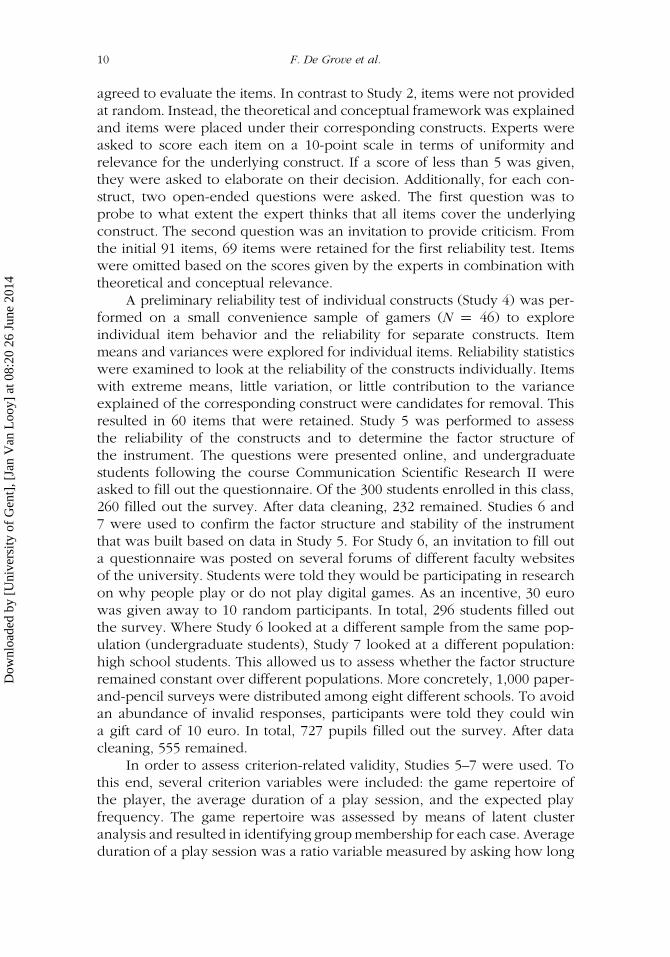
In Study 4, item means and standard deviations were inspected to identifyitems with little variation or skewed means. Reliability was checked byinspecting Cronbach’s alpha, item-whole correlations, and squared multiplecorrelations (Table 4). To attain a parsimonious scale, items performingsuboptimally on item or construct level were removed. Removal of an item
TABLE 4 Construct Reliabilities (Item Level Exploration Studies 4 and 5)
Nitems Ncases Cronbach’s ˛
Meanitem total SMC
PerformanceStudy 4 6 46 0.823 0.594 0.455Study 5 6 232 0.875 0.682 0.521
AgencyStudy 4 10 46 0.869 0.594 0.586Study 5 8 232 0.791 0.503 0.332
HabitStudy 4 5 46 0.238 0.147 0.401Study 5 5 232 0.930 0.553 0.420
EscapismStudy 4 8 46 0.874 0.446 0.598Study 5 8 232 0.881 0.647 0.480
PastimeStudy 4 4 46 0.707 0.588 0.532Study 5 4 232 0.886 0.753 0.581
SocialStudy 4 8 46 0.944 0.700 0.738Study 5 6 232 0.891 0.725 0.575
StatusStudy 4 7 46 0.950 0.815 0.785Study 5 5 232 0.941 0.842 0.729
BelievabilityStudy 4 7 46 0.910 0.781 0.636Study 5 6 232 0.914 0.759 0.593
InvolvementStudy 4 6 46 0.853 0.691 0.554Study 5 5 232 0.918 0.790 0.679
Moral self-reactionStudy 4 8 46 0.805 0.573 0.566Study 5 7 232 0.793 0.521 0.383
Note. SMC D squared multiple correlations.
Dow
nloa
ded
by [
Uni
vers
ity o
f G
ent]
, [Ja
n V
an L
ooy]
at 0
8:20
26
June
201
4
12 F. De Grove et al.
was considered when a combination of several factors was present: extrememeans (<2 or >4), limited item variance (<.9), a low squared multiplecorrelation (<.4), a low item-whole correlation (<.4), and when removingan item would prove a significant increase in a Cronbach’s alpha alreadybelow .7 (DeVellis, 2003; Spector, 1992). In total, 60 out of 69 items wereretained.
Assessing Construct Validity
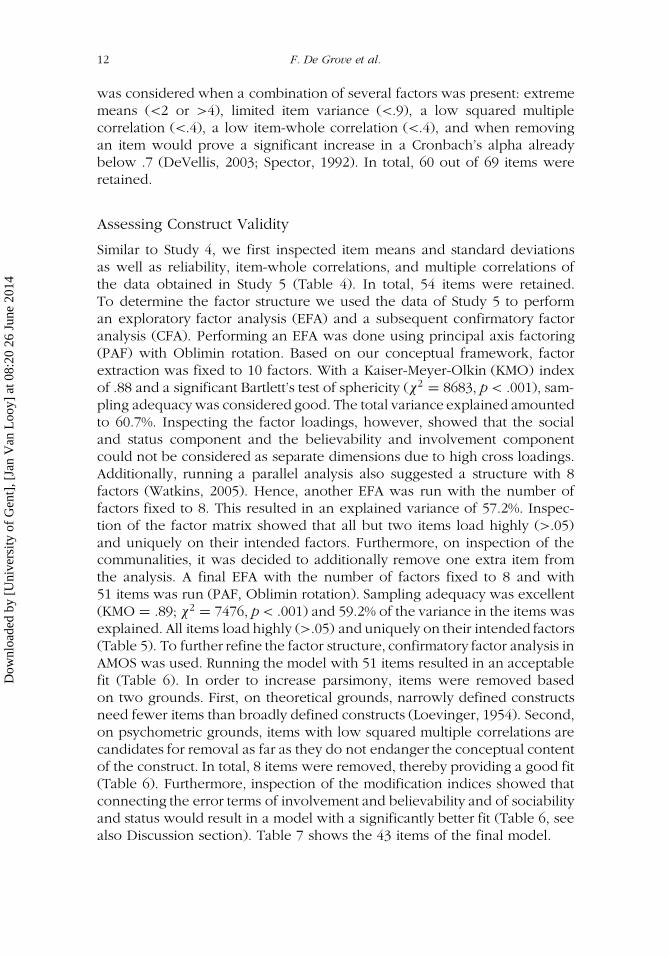
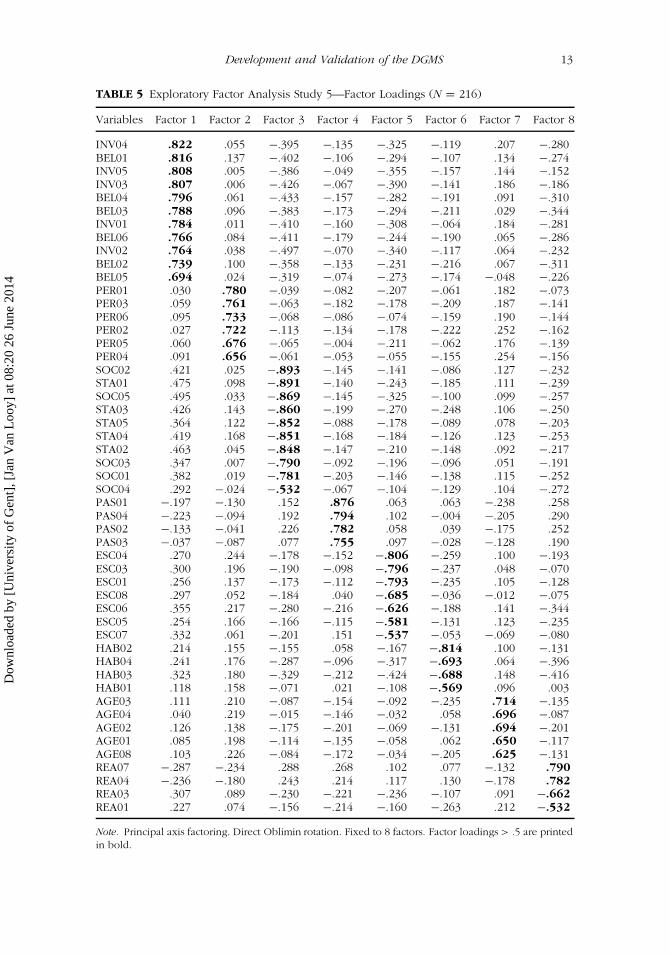
Similar to Study 4, we first inspected item means and standard deviationsas well as reliability, item-whole correlations, and multiple correlations ofthe data obtained in Study 5 (Table 4). In total, 54 items were retained.To determine the factor structure we used the data of Study 5 to performan exploratory factor analysis (EFA) and a subsequent confirmatory factoranalysis (CFA). Performing an EFA was done using principal axis factoring(PAF) with Oblimin rotation. Based on our conceptual framework, factorextraction was fixed to 10 factors. With a Kaiser-Meyer-Olkin (KMO) indexof .88 and a significant Bartlett’s test of sphericity (�2
D 8683, p < .001), sam-pling adequacy was considered good. The total variance explained amountedto 60.7%. Inspecting the factor loadings, however, showed that the socialand status component and the believability and involvement componentcould not be considered as separate dimensions due to high cross loadings.Additionally, running a parallel analysis also suggested a structure with 8factors (Watkins, 2005). Hence, another EFA was run with the number offactors fixed to 8. This resulted in an explained variance of 57.2%. Inspec-tion of the factor matrix showed that all but two items load highly (>.05)and uniquely on their intended factors. Furthermore, on inspection of thecommunalities, it was decided to additionally remove one extra item fromthe analysis. A final EFA with the number of factors fixed to 8 and with51 items was run (PAF, Oblimin rotation). Sampling adequacy was excellent(KMO D .89; �2
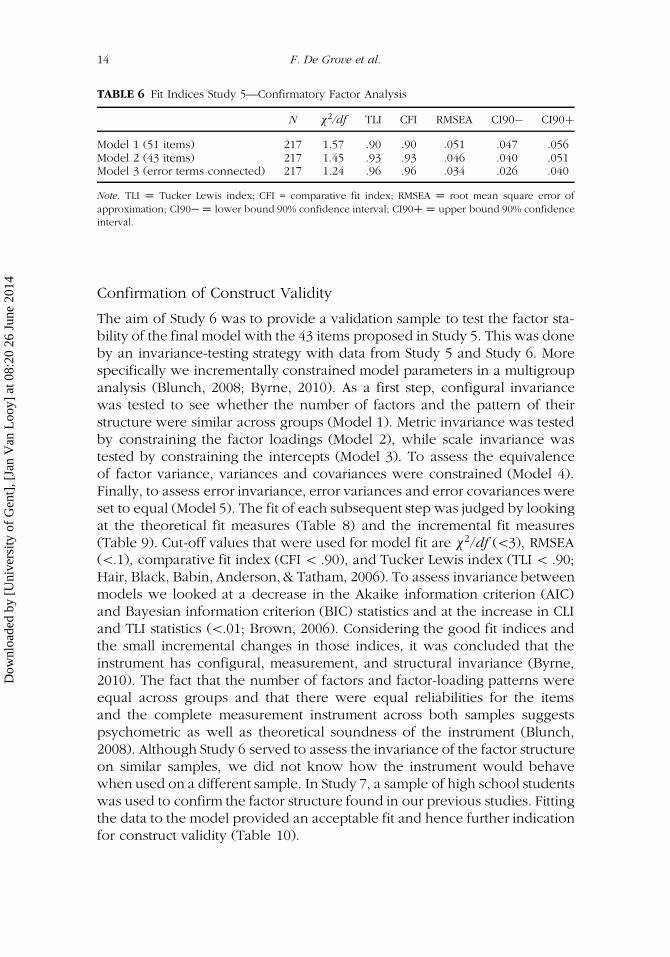
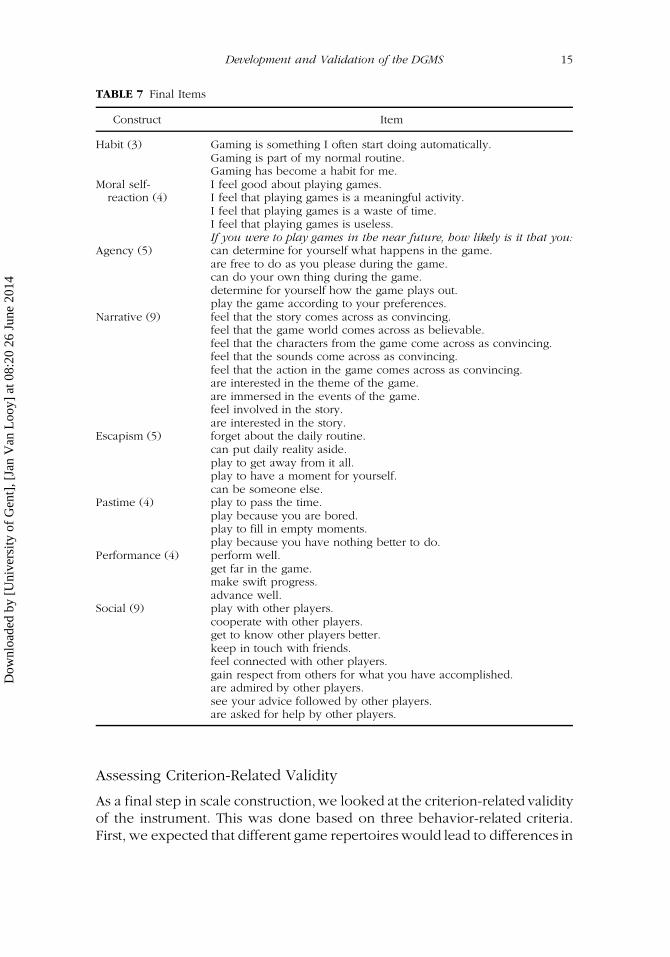
D 7476, p < .001) and 59.2% of the variance in the items wasexplained. All items load highly (>.05) and uniquely on their intended factors(Table 5). To further refine the factor structure, confirmatory factor analysis inAMOS was used. Running the model with 51 items resulted in an acceptablefit (Table 6). In order to increase parsimony, items were removed basedon two grounds. First, on theoretical grounds, narrowly defined constructsneed fewer items than broadly defined constructs (Loevinger, 1954). Second,on psychometric grounds, items with low squared multiple correlations arecandidates for removal as far as they do not endanger the conceptual contentof the construct. In total, 8 items were removed, thereby providing a good fit(Table 6). Furthermore, inspection of the modification indices showed thatconnecting the error terms of involvement and believability and of sociabilityand status would result in a model with a significantly better fit (Table 6, seealso Discussion section). Table 7 shows the 43 items of the final model.
Dow
nloa
ded
by [
Uni
vers
ity o
f G
ent]
, [Ja
n V
an L
ooy]
at 0
8:20
26
June
201
4
Development and Validation of the DGMS 13
TABLE 5 Exploratory Factor Analysis Study 5—Factor Loadings (N D 216)
Variables Factor 1 Factor 2 Factor 3 Factor 4 Factor 5 Factor 6 Factor 7 Factor 8
INV04 .822 .055 �.395 �.135 �.325 �.119 .207 �.280BEL01 .816 .137 �.402 �.106 �.294 �.107 .134 �.274INV05 .808 .005 �.386 �.049 �.355 �.157 .144 �.152INV03 .807 .006 �.426 �.067 �.390 �.141 .186 �.186BEL04 .796 .061 �.433 �.157 �.282 �.191 .091 �.310BEL03 .788 .096 �.383 �.173 �.294 �.211 .029 �.344INV01 .784 .011 �.410 �.160 �.308 �.064 .184 �.281BEL06 .766 .084 �.411 �.179 �.244 �.190 .065 �.286INV02 .764 .038 �.497 �.070 �.340 �.117 .064 �.232BEL02 .739 .100 �.358 �.133 �.231 �.216 .067 �.311BEL05 .694 .024 �.319 �.074 �.273 �.174 �.048 �.226PER01 .030 .780 �.039 �.082 �.207 �.061 .182 �.073PER03 .059 .761 �.063 �.182 �.178 �.209 .187 �.141PER06 .095 .733 �.068 �.086 �.074 �.159 .190 �.144PER02 .027 .722 �.113 �.134 �.178 �.222 .252 �.162PER05 .060 .676 �.065 �.004 �.211 �.062 .176 �.139PER04 .091 .656 �.061 �.053 �.055 �.155 .254 �.156SOC02 .421 .025 �.893 �.145 �.141 �.086 .127 �.232STA01 .475 .098 �.891 �.140 �.243 �.185 .111 �.239SOC05 .495 .033 �.869 �.145 �.325 �.100 .099 �.257STA03 .426 .143 �.860 �.199 �.270 �.248 .106 �.250STA05 .364 .122 �.852 �.088 �.178 �.089 .078 �.203STA04 .419 .168 �.851 �.168 �.184 �.126 .123 �.253STA02 .463 .045 �.848 �.147 �.210 �.148 .092 �.217SOC03 .347 .007 �.790 �.092 �.196 �.096 .051 �.191SOC01 .382 .019 �.781 �.203 �.146 �.138 .115 �.252SOC04 .292 �.024 �.532 �.067 �.104 �.129 .104 �.272PAS01 �.197 �.130 .152 .876 .063 .063 �.238 .258PAS04 �.223 �.094 .192 .794 .102 �.004 �.205 .290PAS02 �.133 �.041 .226 .782 .058 .039 �.175 .252PAS03 �.037 �.087 .077 .755 .097 �.028 �.128 .190ESC04 .270 .244 �.178 �.152 �.806 �.259 .100 �.193ESC03 .300 .196 �.190 �.098 �.796 �.237 .048 �.070ESC01 .256 .137 �.173 �.112 �.793 �.235 .105 �.128ESC08 .297 .052 �.184 .040 �.685 �.036 �.012 �.075ESC06 .355 .217 �.280 �.216 �.626 �.188 .141 �.344ESC05 .254 .166 �.166 �.115 �.581 �.131 .123 �.235ESC07 .332 .061 �.201 .151 �.537 �.053 �.069 �.080HAB02 .214 .155 �.155 .058 �.167 �.814 .100 �.131HAB04 .241 .176 �.287 �.096 �.317 �.693 .064 �.396HAB03 .323 .180 �.329 �.212 �.424 �.688 .148 �.416HAB01 .118 .158 �.071 .021 �.108 �.569 .096 .003AGE03 .111 .210 �.087 �.154 �.092 �.235 .714 �.135AGE04 .040 .219 �.015 �.146 �.032 .058 .696 �.087AGE02 .126 .138 �.175 �.201 �.069 �.131 .694 �.201AGE01 .085 .198 �.114 �.135 �.058 .062 .650 �.117AGE08 .103 .226 �.084 �.172 �.034 �.205 .625 �.131REA07 �.287 �.234 .288 .268 .102 .077 �.132 .790
REA04 �.236 �.180 .243 .214 .117 .130 �.178 .782
REA03 .307 .089 �.230 �.221 �.236 �.107 .091 �.662
REA01 .227 .074 �.156 �.214 �.160 �.263 .212 �.532
Note. Principal axis factoring. Direct Oblimin rotation. Fixed to 8 factors. Factor loadings > .5 are printed
in bold.
Dow
nloa
ded
by [
Uni
vers
ity o
f G
ent]
, [Ja
n V
an L
ooy]
at 0
8:20
26
June
201
4
14 F. De Grove et al.
TABLE 6 Fit Indices Study 5—Confirmatory Factor Analysis
N �2/df TLI CFI RMSEA CI90� CI90C
Model 1 (51 items) 217 1.57 .90 .90 .051 .047 .056Model 2 (43 items) 217 1.45 .93 .93 .046 .040 .051Model 3 (error terms connected) 217 1.24 .96 .96 .034 .026 .040
Note. TLI D Tucker Lewis index; CFI = comparative fit index; RMSEA D root mean square error of
approximation; CI90� D lower bound 90% confidence interval; CI90C D upper bound 90% confidence
interval.
Confirmation of Construct Validity
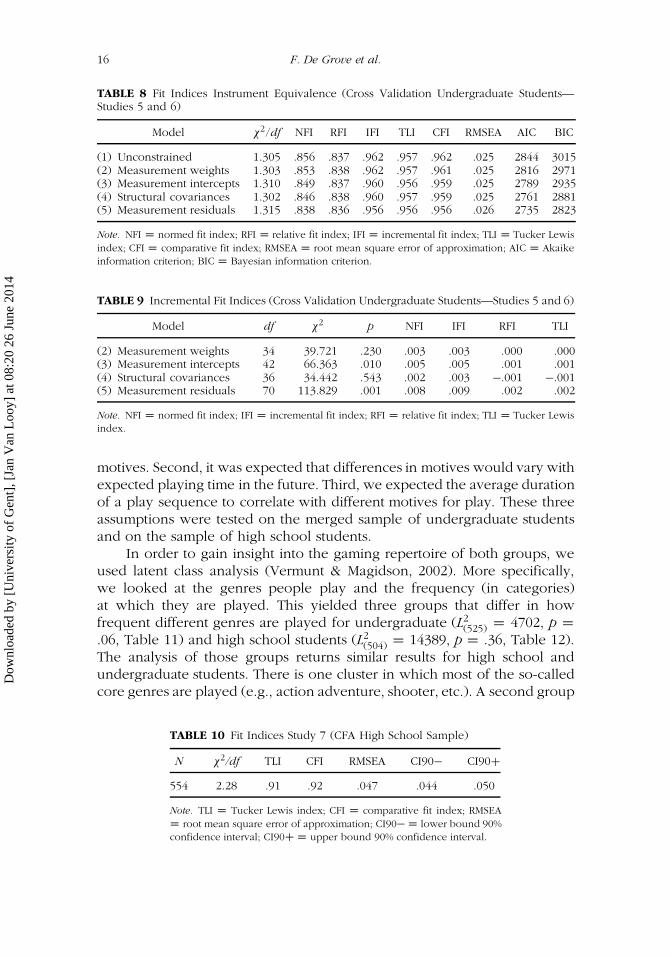
The aim of Study 6 was to provide a validation sample to test the factor sta-bility of the final model with the 43 items proposed in Study 5. This was doneby an invariance-testing strategy with data from Study 5 and Study 6. Morespecifically we incrementally constrained model parameters in a multigroupanalysis (Blunch, 2008; Byrne, 2010). As a first step, configural invariancewas tested to see whether the number of factors and the pattern of theirstructure were similar across groups (Model 1). Metric invariance was testedby constraining the factor loadings (Model 2), while scale invariance wastested by constraining the intercepts (Model 3). To assess the equivalenceof factor variance, variances and covariances were constrained (Model 4).Finally, to assess error invariance, error variances and error covariances wereset to equal (Model 5). The fit of each subsequent step was judged by lookingat the theoretical fit measures (Table 8) and the incremental fit measures(Table 9). Cut-off values that were used for model fit are �
2/df (<3), RMSEA(<.1), comparative fit index (CFI < .90), and Tucker Lewis index (TLI < .90;Hair, Black, Babin, Anderson, & Tatham, 2006). To assess invariance betweenmodels we looked at a decrease in the Akaike information criterion (AIC)and Bayesian information criterion (BIC) statistics and at the increase in CLIand TLI statistics (<.01; Brown, 2006). Considering the good fit indices andthe small incremental changes in those indices, it was concluded that theinstrument has configural, measurement, and structural invariance (Byrne,2010). The fact that the number of factors and factor-loading patterns wereequal across groups and that there were equal reliabilities for the itemsand the complete measurement instrument across both samples suggestspsychometric as well as theoretical soundness of the instrument (Blunch,2008). Although Study 6 served to assess the invariance of the factor structureon similar samples, we did not know how the instrument would behavewhen used on a different sample. In Study 7, a sample of high school studentswas used to confirm the factor structure found in our previous studies. Fittingthe data to the model provided an acceptable fit and hence further indicationfor construct validity (Table 10).
Dow
nloa
ded
by [
Uni
vers
ity o
f G
ent]
, [Ja
n V
an L
ooy]
at 0
8:20
26
June
201
4
Development and Validation of the DGMS 15
TABLE 7 Final Items
Construct Item
Habit (3) Gaming is something I often start doing automatically.Gaming is part of my normal routine.Gaming has become a habit for me.
Moral self-reaction (4)
I feel good about playing games.I feel that playing games is a meaningful activity.I feel that playing games is a waste of time.I feel that playing games is useless.If you were to play games in the near future, how likely is it that you:
Agency (5) can determine for yourself what happens in the game.are free to do as you please during the game.can do your own thing during the game.determine for yourself how the game plays out.play the game according to your preferences.
Narrative (9) feel that the story comes across as convincing.feel that the game world comes across as believable.feel that the characters from the game come across as convincing.feel that the sounds come across as convincing.feel that the action in the game comes across as convincing.are interested in the theme of the game.are immersed in the events of the game.feel involved in the story.are interested in the story.
Escapism (5) forget about the daily routine.can put daily reality aside.play to get away from it all.play to have a moment for yourself.can be someone else.
Pastime (4) play to pass the time.play because you are bored.play to fill in empty moments.play because you have nothing better to do.
Performance (4) perform well.get far in the game.make swift progress.advance well.
Social (9) play with other players.cooperate with other players.get to know other players better.keep in touch with friends.feel connected with other players.gain respect from others for what you have accomplished.are admired by other players.see your advice followed by other players.are asked for help by other players.
Assessing Criterion-Related Validity
As a final step in scale construction, we looked at the criterion-related validityof the instrument. This was done based on three behavior-related criteria.First, we expected that different game repertoires would lead to differences in
Dow
nloa
ded
by [
Uni
vers
ity o
f G
ent]
, [Ja
n V
an L
ooy]
at 0
8:20
26
June
201
4
16 F. De Grove et al.
TABLE 8 Fit Indices Instrument Equivalence (Cross Validation Undergraduate Students—Studies 5 and 6)
Model �2/df NFI RFI IFI TLI CFI RMSEA AIC BIC
(1) Unconstrained 1.305 .856 .837 .962 .957 .962 .025 2844 3015(2) Measurement weights 1.303 .853 .838 .962 .957 .961 .025 2816 2971(3) Measurement intercepts 1.310 .849 .837 .960 .956 .959 .025 2789 2935(4) Structural covariances 1.302 .846 .838 .960 .957 .959 .025 2761 2881(5) Measurement residuals 1.315 .838 .836 .956 .956 .956 .026 2735 2823
Note. NFI D normed fit index; RFI D relative fit index; IFI D incremental fit index; TLI D Tucker Lewis
index; CFI D comparative fit index; RMSEA D root mean square error of approximation; AIC D Akaike
information criterion; BIC D Bayesian information criterion.
TABLE 9 Incremental Fit Indices (Cross Validation Undergraduate Students—Studies 5 and 6)
Model df �2 p NFI IFI RFI TLI
(2) Measurement weights 34 39.721 .230 .003 .003 .000 .000(3) Measurement intercepts 42 66.363 .010 .005 .005 .001 .001(4) Structural covariances 36 34.442 .543 .002 .003 �.001 �.001(5) Measurement residuals 70 113.829 .001 .008 .009 .002 .002
Note. NFI D normed fit index; IFI D incremental fit index; RFI D relative fit index; TLI D Tucker Lewis
index.
motives. Second, it was expected that differences in motives would vary withexpected playing time in the future. Third, we expected the average durationof a play sequence to correlate with different motives for play. These threeassumptions were tested on the merged sample of undergraduate studentsand on the sample of high school students.
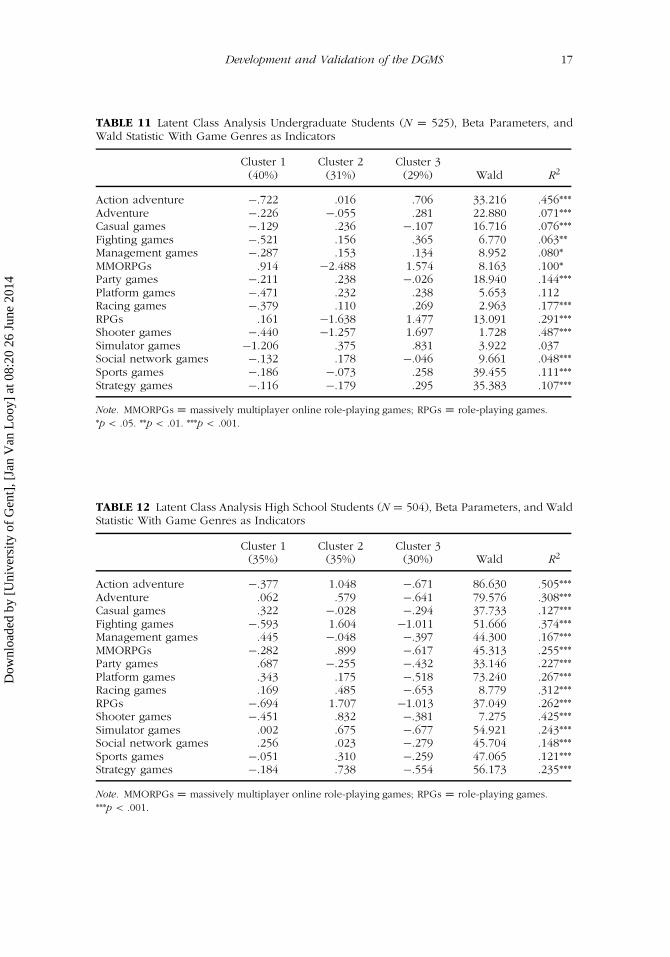
In order to gain insight into the gaming repertoire of both groups, weused latent class analysis (Vermunt & Magidson, 2002). More specifically,we looked at the genres people play and the frequency (in categories)at which they are played. This yielded three groups that differ in howfrequent different genres are played for undergraduate (L2
(525) D 4702, p D
.06, Table 11) and high school students (L2(504) D 14389, p D .36, Table 12).
The analysis of those groups returns similar results for high school andundergraduate students. There is one cluster in which most of the so-calledcore genres are played (e.g., action adventure, shooter, etc.). A second group
TABLE 10 Fit Indices Study 7 (CFA High School Sample)
N �2/df TLI CFI RMSEA CI90� CI90C
554 2.28 .91 .92 .047 .044 .050
Note. TLI D Tucker Lewis index; CFI D comparative fit index; RMSEA
D root mean square error of approximation; CI90� D lower bound 90%
confidence interval; CI90C D upper bound 90% confidence interval.
Dow
nloa
ded
by [
Uni
vers
ity o
f G
ent]
, [Ja
n V
an L
ooy]
at 0
8:20
26
June
201
4
Development and Validation of the DGMS 17
TABLE 11 Latent Class Analysis Undergraduate Students (N D 525), Beta Parameters, andWald Statistic With Game Genres as Indicators
Cluster 1(40%)
Cluster 2(31%)
Cluster 3(29%) Wald R2
Action adventure �.722 .016 .706 33.216 .456***Adventure �.226 �.055 .281 22.880 .071***Casual games �.129 .236 �.107 16.716 .076***Fighting games �.521 .156 .365 6.770 .063**Management games �.287 .153 .134 8.952 .080*MMORPGs .914 �2.488 1.574 8.163 .100*Party games �.211 .238 �.026 18.940 .144***Platform games �.471 .232 .238 5.653 .112Racing games �.379 .110 .269 2.963 .177***RPGs .161 �1.638 1.477 13.091 .291***Shooter games �.440 �1.257 1.697 1.728 .487***Simulator games �1.206 .375 .831 3.922 .037Social network games �.132 .178 �.046 9.661 .048***Sports games �.186 �.073 .258 39.455 .111***Strategy games �.116 �.179 .295 35.383 .107***
Note. MMORPGs D massively multiplayer online role-playing games; RPGs D role-playing games.
*p < .05. **p < .01. ***p < .001.
TABLE 12 Latent Class Analysis High School Students (N D 504), Beta Parameters, and WaldStatistic With Game Genres as Indicators
Cluster 1(35%)
Cluster 2(35%)
Cluster 3(30%) Wald R2
Action adventure �.377 1.048 �.671 86.630 .505***Adventure .062 .579 �.641 79.576 .308***Casual games .322 �.028 �.294 37.733 .127***Fighting games �.593 1.604 �1.011 51.666 .374***Management games .445 �.048 �.397 44.300 .167***MMORPGs �.282 .899 �.617 45.313 .255***Party games .687 �.255 �.432 33.146 .227***Platform games .343 .175 �.518 73.240 .267***Racing games .169 .485 �.653 8.779 .312***RPGs �.694 1.707 �1.013 37.049 .262***Shooter games �.451 .832 �.381 7.275 .425***Simulator games .002 .675 �.677 54.921 .243***Social network games .256 .023 �.279 45.704 .148***Sports games �.051 .310 �.259 47.065 .121***Strategy games �.184 .738 �.554 56.173 .235***
Note. MMORPGs D massively multiplayer online role-playing games; RPGs D role-playing games.
***p < .001.
Dow
nloa
ded
by [
Uni
vers
ity o
f G
ent]
, [Ja
n V
an L
ooy]
at 0
8:20
26
June
201
4
18 F. De Grove et al.
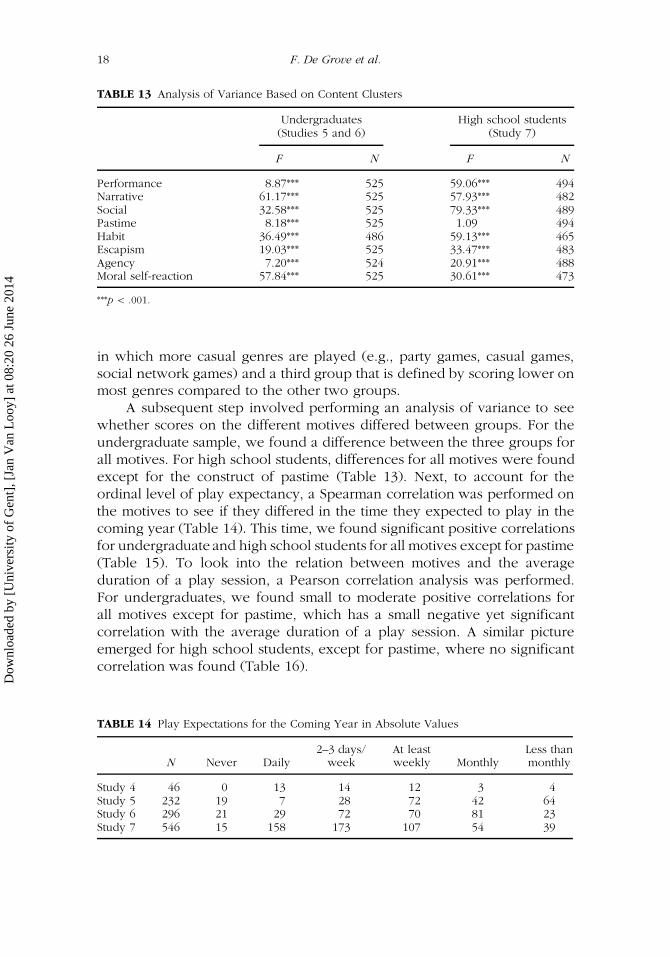
TABLE 13 Analysis of Variance Based on Content Clusters
Undergraduates(Studies 5 and 6)
High school students(Study 7)
F N F N
Performance 8.87*** 525 59.06*** 494Narrative 61.17*** 525 57.93*** 482Social 32.58*** 525 79.33*** 489Pastime 8.18*** 525 1.09 494Habit 36.49*** 486 59.13*** 465Escapism 19.03*** 525 33.47*** 483Agency 7.20*** 524 20.91*** 488Moral self-reaction 57.84*** 525 30.61*** 473
***p < .001.
in which more casual genres are played (e.g., party games, casual games,social network games) and a third group that is defined by scoring lower onmost genres compared to the other two groups.
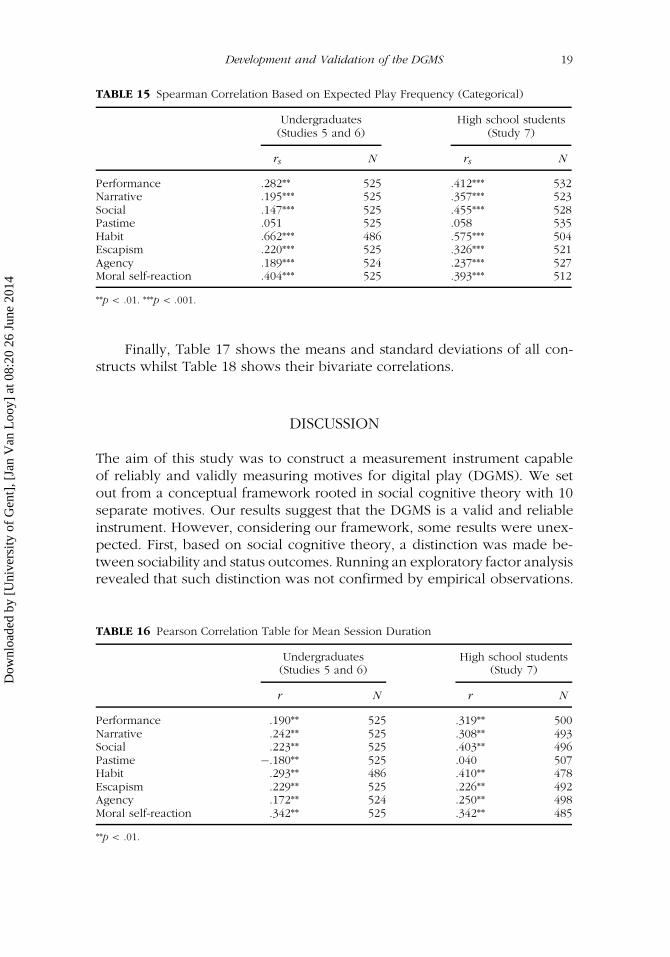
A subsequent step involved performing an analysis of variance to seewhether scores on the different motives differed between groups. For theundergraduate sample, we found a difference between the three groups forall motives. For high school students, differences for all motives were foundexcept for the construct of pastime (Table 13). Next, to account for theordinal level of play expectancy, a Spearman correlation was performed onthe motives to see if they differed in the time they expected to play in thecoming year (Table 14). This time, we found significant positive correlationsfor undergraduate and high school students for all motives except for pastime(Table 15). To look into the relation between motives and the averageduration of a play session, a Pearson correlation analysis was performed.For undergraduates, we found small to moderate positive correlations forall motives except for pastime, which has a small negative yet significantcorrelation with the average duration of a play session. A similar pictureemerged for high school students, except for pastime, where no significantcorrelation was found (Table 16).
TABLE 14 Play Expectations for the Coming Year in Absolute Values
N Never Daily2–3 days/
weekAt leastweekly Monthly
Less thanmonthly
Study 4 46 0 13 14 12 3 4Study 5 232 19 7 28 72 42 64Study 6 296 21 29 72 70 81 23Study 7 546 15 158 173 107 54 39
Dow
nloa
ded
by [
Uni
vers
ity o
f G
ent]
, [Ja
n V
an L
ooy]
at 0
8:20
26
June
201
4
Development and Validation of the DGMS 19
TABLE 15 Spearman Correlation Based on Expected Play Frequency (Categorical)
Undergraduates(Studies 5 and 6)
High school students(Study 7)
rs N rs N
Performance .282** 525 .412*** 532Narrative .195*** 525 .357*** 523Social .147*** 525 .455*** 528Pastime .051 525 .058 535Habit .662*** 486 .575*** 504Escapism .220*** 525 .326*** 521Agency .189*** 524 .237*** 527Moral self-reaction .404*** 525 .393*** 512
**p < .01. ***p < .001.
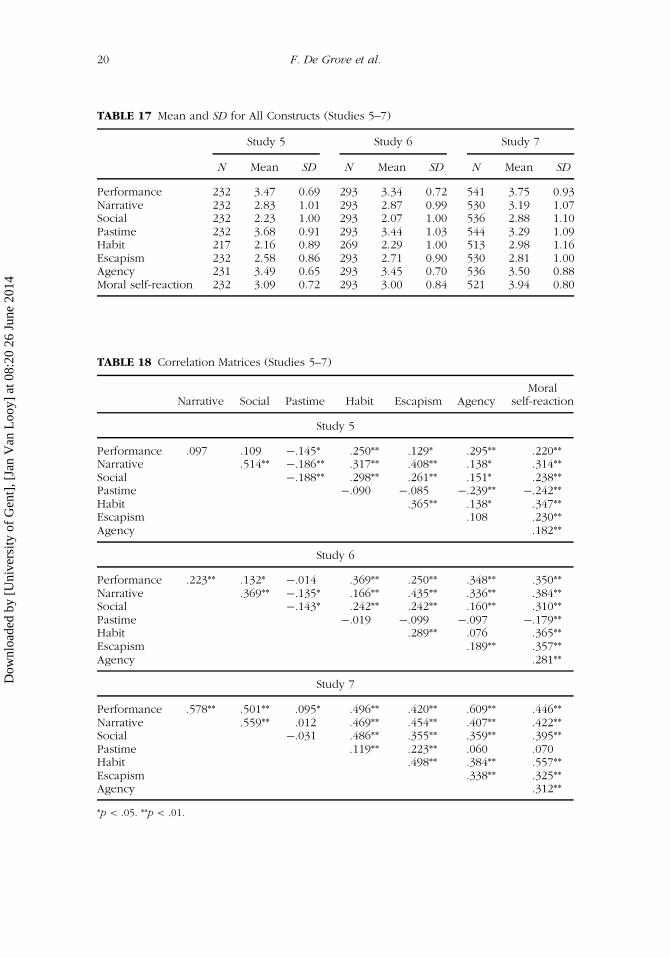
Finally, Table 17 shows the means and standard deviations of all con-structs whilst Table 18 shows their bivariate correlations.
DISCUSSION
The aim of this study was to construct a measurement instrument capableof reliably and validly measuring motives for digital play (DGMS). We setout from a conceptual framework rooted in social cognitive theory with 10separate motives. Our results suggest that the DGMS is a valid and reliableinstrument. However, considering our framework, some results were unex-pected. First, based on social cognitive theory, a distinction was made be-tween sociability and status outcomes. Running an exploratory factor analysisrevealed that such distinction was not confirmed by empirical observations.
TABLE 16 Pearson Correlation Table for Mean Session Duration
Undergraduates(Studies 5 and 6)
High school students(Study 7)
r N r N
Performance .190** 525 .319** 500Narrative .242** 525 .308** 493Social .223** 525 .403** 496Pastime �.180** 525 .040 507Habit .293** 486 .410** 478Escapism .229** 525 .226** 492Agency .172** 524 .250** 498Moral self-reaction .342** 525 .342** 485
**p < .01.
Dow
nloa
ded
by [
Uni
vers
ity o
f G
ent]
, [Ja
n V
an L
ooy]
at 0
8:20
26
June
201
4
20 F. De Grove et al.
TABLE 17 Mean and SD for All Constructs (Studies 5–7)
Study 5 Study 6 Study 7
N Mean SD N Mean SD N Mean SD
Performance 232 3.47 0.69 293 3.34 0.72 541 3.75 0.93Narrative 232 2.83 1.01 293 2.87 0.99 530 3.19 1.07Social 232 2.23 1.00 293 2.07 1.00 536 2.88 1.10Pastime 232 3.68 0.91 293 3.44 1.03 544 3.29 1.09Habit 217 2.16 0.89 269 2.29 1.00 513 2.98 1.16Escapism 232 2.58 0.86 293 2.71 0.90 530 2.81 1.00Agency 231 3.49 0.65 293 3.45 0.70 536 3.50 0.88Moral self-reaction 232 3.09 0.72 293 3.00 0.84 521 3.94 0.80
TABLE 18 Correlation Matrices (Studies 5–7)
Narrative Social Pastime Habit Escapism AgencyMoral
self-reaction
Study 5
Performance .097 .109 �.145* .250** .129* .295** .220**Narrative .514** �.186** .317** .408** .138* .314**Social �.188** .298** .261** .151* .238**Pastime �.090 �.085 �.239** �.242**Habit .365** .138* .347**Escapism .108 .230**Agency .182**
Study 6
Performance .223** .132* �.014 .369** .250** .348** .350**Narrative .369** �.135* .166** .435** .336** .384**Social �.143* .242** .242** .160** .310**Pastime �.019 �.099 �.097 �.179**Habit .289** .076 .365**Escapism .189** .357**Agency .281**
Study 7
Performance .578** .501** .095* .496** .420** .609** .446**Narrative .559** .012 .469** .454** .407** .422**Social �.031 .486** .355** .359** .395**Pastime .119** .223** .060 .070Habit .498** .384** .557**Escapism .338** .325**Agency .312**
*p < .05. **p < .01.
Dow
nloa
ded
by [
Uni
vers
ity o
f G
ent]
, [Ja
n V
an L
ooy]
at 0
8:20
26
June
201
4
Development and Validation of the DGMS 21
Running a subsequent confirmatory factor analysis, however, showed thatconnecting the error terms of the sociability and status constructs yieldeda significantly better fit. In short: by connecting these error terms, it wasacknowledged that the items from status and sociability stem from differentconceptual grounds but that they can empirically be measured by meansof a single one-dimensional construct, which we name social outcomes. Asimilar logic holds for the believability and involvement construct. On aconceptual basis, both can be differentiated. Yet, on empirical grounds, theycan be measured as a one-dimensional construct, which we name narrative.The conceptual breadth of both social and narrative is reflected by theirlarger number of items compared to the more narrowly defined constructs.More important, however, is that the content dimension of digital games(i.e., the narrative construct) clearly showed to be a relevant motive forplaying digital games. Regarding performance, the instrument acknowledgedthat not all performance is inherently challenge based or skill based perse (Przybylski et al., 2010). It shows that expectations of progress are anintegral part of performance expectations. The same is true for escapism,which takes into account that one can play to get away from the dailyreality and allows one to play in order to be someone else. In this way,it is broader than the fantasy concept proposed by Sherry et al. (2006).Moral self-reaction concerns a moral evaluation. It asks to what extent peo-ple think that playing digital games is a worthwhile activity. In none ofthe previous studies has this concept been taken into account. However,considering how popular entertainment media such as digital games cancarry negative connotations, moral self-reaction is deemed important whentrying to understand what motivates people to play or to refrain from play-ing digital games (Berker, Hartmann, & Punie, 2006). Habit, pastime, andagency are relatively narrowly defined and straightforward constructs. Thiswas reflected in their number of items. As could be expected based onthe literature, habitual behavior showed a clear relation with all criterion-related variables (LaRose, 2010). The same holds true for agency. Pastime,however, showed different behavior between populations in relation tocriterion-related variables. Moreover, no significant relation was found foreither population when it came to expected play frequency. Our results,however, indicated the construct validity of pastime. Furthermore, previousresearch and our own in-depth interviews have shown that pastime is amotive for play. Hence, ignoring pastime as a motive for play would bethrowing away the baby with the bathwater. It might be more fruitful toinvestigate to what specific behavior pastime is actually related and forwhich populations. In our conceptual framework, we already pointed out thespecial role of pastime by conceptualizing it as a game-external outcome.Therefore, pastime might play a significant role when it comes to behav-ior with a more casual nature. This should be further explored in futureresearch.
Dow
nloa
ded
by [
Uni
vers
ity o
f G
ent]
, [Ja
n V
an L
ooy]
at 0
8:20
26
June
201
4
22 F. De Grove et al.
Conclusion
In building the DGMS, we aimed to adhere to rigorous scientific standardsfound in the literature on scale construction (Clark & Watson, 1995; DeVellis,2003; Nunnally & Bernstein, 1978; Spector, 1992). This involved several steps:a clear conceptualization of the constructs, building and refining an itempool, and testing the reliability and validity of these items and constructs. Ourresults suggest that a parsimonious model is built that reliably and validlymeasures eight motives for digital play. Furthermore, the operationalisationof these dimensions showed to be psychometrically and theoretically sound.In conclusion, we see that individual motives to play are comprised of ahabit component and seven outcome expectations: performance, agency,moral self-reaction, social, narrative, pastime, and escapism. All constructsbut pastime showed a consistent relation with different behavior-related mea-sures over different samples and populations. The role of pastime might needfurther exploration from a theoretical point of view. It is not unreasonableto assume that all genre content can be played to pass time and that pastimeis a motive that is present at some point for everyone playing games. Assuch, it might not be the best discriminating factor to look into the types ofbehavior this study examined.
Limitations and Future Research
Although several empirical studies have been performed to assess the reli-ability and validity of the DGMS, there are several more steps that can betaken. Indeed, instrument validation entails an ongoing process in whichthe validity of a scale is tested by each new study making use of the in-strument. Such research could involve testing the instrument on differentkinds of behavior or on different populations. Regarding the former, weconceptualized behavior mainly as playing digital games in general. Futureresearch could examine whether the DGMS is also useful for specific gamegenres or specific games. On account of different populations, we do notclaim to have tested the full range of the population that plays digital games.It would be interesting to see how the instrument behaves when used foran older population or when used in different cultural settings (i.e., cross-cultural validation) or to look at how these motivation dimensions correlatewith other relevant variables related to digital play.
REFERENCES
Bandura, A. (1986). Social foundations of thought and action: A social cognitive
theory. Englewood Cliffs, NJ: Prentice-Hall.Berker, T., Hartmann, M., & Punie, Y. (2006). Domestication of media and technol-
ogy. Berkshire, UK: Open University Press.
Dow
nloa
ded
by [
Uni
vers
ity o
f G
ent]
, [Ja
n V
an L
ooy]
at 0
8:20
26
June
201
4
Development and Validation of the DGMS 23
Blake, C., & Klimmt, C. (2012). The challenge of measuring the use of computergames. In J. Fromme & A. Unger (Eds.), Computer games and new media
cultures (pp. 357–369). Dordrecht, The Netherlands: Springer.Blunch, N. J. (2008). Introduction to structural equation modelling using SPSS and
AMOS. London, UK: Sage.Brown, T. A. (2006). Confirmatory factor analysis for applied research. New York,
NY: Guilford Press.Byrne, B. (2010). Structural equation modeling with AMOS: Basic concepts, appli-
cations, and programming (2nd ed.). New York, NY: Routledge.Clark, L. A., & Watson, D. (1995). Constructing validity: Basic issues in objective
scale development. Psychological Assessment, 7(3), 309–319. doi:10.1037/1040-3590.7.3.309
Deci, E. L., & Ryan, R. M. (1985). Intrinsic motivation and self-determination in
human behavior. New York, NY: Plenum Press.De Grove, F., Cauberghe, V., & Van Looy, J. (2014). In pursuit of play: Toward a
social cognitive understanding of determinants of digital play. Communication
Theory, 24, 205–223. doi:10.1111/comt.12030DeVellis, R. F. (2003). Scale development: Theory and applications. London, UK:
Sage.Entertainment Software Association. (2013). Essential facts about the computer and
video games industry. Retrieved from http://www.theesa.com/facts/pdfs/esa_ef_2013.pdf
Ferguson, C. J., & Olson, C. K. (2013). Friends, fun, frustration and fantasy: Childmotivations for video game play. Motivation and Emotion, 37(1), 154–164.doi:10.1007/s11031-012-9284-7
Hair, J. F., Black, W. C., Babin, B., Anderson, R. E., & Tatham, R. L. (2006). Multi-
variate data analysis. Upper Saddle River, NJ: Prentice Hall.Hasebrink, U., & Popp, J. (2006). Media repertoires as a result of selective media
use. A conceptual approach to the analysis of patterns of exposure. Communi-
cations, 31(3), 369–387. doi:10.1515/COMMUN.2006.023Hilgard, J., Engelhardt, C. R., & Bartholow, B. D. (2013). Individual differences in
motives, preferences, and pathology in video games: The gaming attitudes,motives, and experiences scales (GAMES). Frontiers in Psychology, 4, 1–13.doi:10.3389/fpsyg.2013.00608
Hou, J. (2011). Uses and gratifications of social games: Blending social networkingand game play. First Monday, 16(7). Retrieved from http://firstmonday.org/article/view/3517/3020
Interactive Software Federation of Europe. (2012). Videogames in Europe: Consumer
study. Retrieved from http://www.isfe.eu/videogames-europe-2012-consumer-study
Jansz, J., & Tanis, M. (2007). Appeal of playing online first person shooter games.CyberPsychology & Behavior, 10(1), 133–136. doi:10.1089/cpb.2006.9981
Kallio, K. P., Mäyrä, F., & Kaipainen, K. (2011). At least nine ways to play: Approach-ing gamer mentalities. Games and Culture, 6(4), 327–353. doi:10.1177/1555412010391089
Lafrenière, M. A. K., Verner-Filion, J., & Vallerand, R. J. (2012). Development andvalidation of the gaming motivation scale (GAMS). Personality and Individual
Differences, 53(7), 827–831. doi:10.1016/j.paid.2012.06.013
Dow
nloa
ded
by [
Uni
vers
ity o
f G
ent]
, [Ja
n V
an L
ooy]
at 0
8:20
26
June
201
4
24 F. De Grove et al.
LaRose, R. (2010). The problem of media habits. Communication Theory, 20(2),194–222. doi:10.1111/j.1468-2885.2010.01360.x
LaRose, R., & Eastin, M. S. (2004). Social cognitive theory of internet uses and grat-ifications: Toward a new model of media attendance. Journal of Broadcasting
& Electronic Media, 48(3), 358–377. doi:10.1207/s15506878jobem4803_2Lee, D., & LaRose, R. (2007). A socio-cognitive model of video game usage. Journal
of Broadcasting & Electronic Media, 51(4), 632–650. doi:10.1080/08838150701626511
Li, D. D., Liau, A. K., Gentile, D. A., Khoo, A., & Cheong, W. D. (2012). Construct andpredictive validity of a brief MMO player motivation scale: Cross-sectional andlongitudinal evidence based on Singaporean young gamers. Journal of Children
and Media, 7(3), 287–306. doi:10.1080/17482798.2012.712918Loevinger, J. (1954). The attenuation paradox in test theory. Psychological Bulletin,
51(5), 493–504. doi:10.1037/h0058543Meade, A. W., & Craig, S. B. (2012). Identifying careless responses in survey data.
Psychological Methods, 17(3), 437–455. doi:10.1037/a0028085Nacke, L. E., Bateman, C., & Mandryk, R. L. (2013). BrainHex: A neurobiological
gamer typology survey. In J. C. Anacleto, S. Fels, N. Graham, B. Kapralos,M. S. El-Nasr, & K. Stanley (Eds.), Entertainment computing (pp. 288–293).New York, NY: Springer.
Nunnally, J. C., & Bernstein, I. (1978). Psychometry theory. Columbus, OH: McGraw-Hill.
Przybylski, A. K., Rigby, C. S., & Ryan, R. M. (2010). A motivational model of videogame engagement. Review of General Psychology, 14(2), 154–166. doi:10.1037/a0019440
Przybylski, A. K., Weinstein, N., Ryan, R. M., & Rigby, C. S. (2009). Having toversus wanting to play: Background and consequences of harmonious versusobsessive engagement in video games. CyberPsychology & Behavior, 12(5), 485–492. doi:10.1089/cpb.2009.0083
Ryan, R. M., Rigby, C. S., & Przybylski, A. (2006). The motivational pull of videogames: A self-determination theory approach. Motivation and Emotion, 30(4),344–360. doi:10.1007/s11031-006-9051-8
Sherry, J. L., Lucas, K., Greenberg, B. S., & Lachlan, K. (2006). Video game usesand gratifications as predictors of use and game preference. In P. Vorderer &J. Bryant (Eds.), Playing video games: Motives, responses, and consequences
(pp. 213–224). London, UK: Routledge.Spector, P. E. (1992). Summated rating scale construction: An introduction. London,
UK: Sage.Tamborini, R., Bowman, N. D., Eden, A., Grizzard, M., & Organ, A. (2010). Defining
media enjoyment as the satisfaction of intrinsic needs. Journal of Communica-
tion, 60(4), 758–777. doi:10.1111/j.1460-2466.2010.01513.xVermunt, J., & Magidson, J. (2002). Latent class cluster analysis. In J. A. Hagenaars &
A. L. McCutcheon (Eds.), Applied latent class analysis (pp. 89–106). New York,NY: Cambridge University Press.
Wallenius, M., Rimpelä, A., Punamäki, R. L., & Lintonen, T. (2009). Digital gameplaying motives among adolescents: Relations to parent–child communication,school performance, sleeping habits, and perceived health. Journal of Applied
Developmental Psychology, 30(4), 463–474. doi:10.1016/j.appdev.2008.12.021
Dow
nloa
ded
by [
Uni
vers
ity o
f G
ent]
, [Ja
n V
an L
ooy]
at 0
8:20
26
June
201
4
Development and Validation of the DGMS 25
Watkins, M. W. (2005). Determining parallel analysis criteria. Journal of Modern Ap-
plied Statistical Methods, 5(2), 344–346. Retrieved from http://digitalcommons.wayne.edu/jmasm/vol5/iss2/8
Westwood, D., & Griffiths, M. D. (2010). The role of structural characteristics invideo-game play motivation: A Q-methodology study. Cyberpsychology, Behav-
ior, and Social Networking, 13(5), 581–585. doi:10.1089/cyber.2009.0361Williams, D., Yee, N., & Caplan, S. E. (2008). Who plays, how much, and why?
Debunking the stereotypical gamer profile. Journal of Computer-Mediated Com-
munication, 13(4), 993–1018. doi:10.1111/j.1083-6101.2008.00428.xWu, J. H., Wang, S. C., & Tsai, H. H. (2010). Falling in love with online games:
The uses and gratifications perspective. Computers in Human Behavior, 26(6),1862–1871. doi:10.1016/j.im.2009.08.002
Yee, N. (2007). Motivations for play in online games. CyberPsychology & Behavior,
9(6), 772–775. doi:10.1089/cpb.2006.9.772
Dow
nloa
ded
by [
Uni
vers
ity o
f G
ent]
, [Ja
n V
an L
ooy]
at 0
8:20
26
June
201
4
Top Related
Copyright © 2022 FDOKUMEN

