


Bahasa
Halaman
Hukum


Thomas Gottstein, Chief Executive Officer
David Mathers, Chief Financial Officer
February 10, 2022
Credit SuisseFourth Quarter and Full Year 2021 ResultsAnalyst and Investor Call

Disclaimer (1/2)
2February 10, 2022
Credit Suisse has not finalized its 2021 Annual Report and Credit Suisse’s independent registered public accounting firm has not completed its audit of the consolidated financial statements for the period. Accordingly, the financial information contained in this presentation is subject to completion of year-end procedures, which may result in changes to that information.
This material does not purport to contain all of the information that you may wish to consider. This material is not to be relied upon as such or used in substitution for the exercise of independent judgment.
Please also refer to the Fourth Quarter and Full Year 2021 Supplemental Information and our 4Q21 Earnings Release for additional information.
Cautionary statement regarding forward-looking statements
This presentation contains forward-looking statements that involve inherent risks and uncertainties, and we might not be able to achieve the predictions, forecasts, projections and other outcomes we describe or imply in forward-looking statements. A number of important factors could cause results to differ materially from the plans, targets, goals, expectations, estimates and intentions we express in these forward-looking statements, including those we identify in "Risk factors” in our Annual Report on Form 20-F for the fiscal year ended December 31, 2020, in “Credit Suisse – Risk factor” in our 1Q21 Financial Report published on May 6, 2021 and in the “Cautionary statement regarding forward-looking information" in our 4Q21 Earnings Release published on February 10, 2022 and filed with the US Securities and Exchange Commission, and in other public filings and press releases. We do not intend to update these forward-looking statements.
In particular, the terms “Estimate”, “Illustrative”, “Ambition”, “Objective”, “Outlook”, “Goal”, “Commitment” and “Aspiration” are not intended to be viewed as targets or projections, nor are they considered to be Key Performance Indicators. All such estimates, illustrations, ambitions, objectives, outlooks, goals, commitments and aspirations are subject to a large number of inherent risks, assumptions and uncertainties, many of which are completely outside of our control. These risks, assumptions and uncertainties include, but are not limited to, general market conditions, market volatility, increased inflation, interest rate volatility and levels, global and regional economic conditions, challenges and uncertainties resulting from the COVID-19 pandemic, political uncertainty, changes in tax policies, regulatory changes, changes in levels of client activity as a result of any of the foregoing and other factors. Accordingly, this information should not be relied on for any purpose. We do not intend to update these estimates, illustrations, ambitions, objectives, outlooks, goals, commitments or aspirations.
We may not achieve the benefits of our strategic initiatives
We may not achieve all of the expected benefits of our strategic initiatives. Factors beyond our control, including but not limited to the market and economic conditions (including macroeconomic and other challenges and uncertainties, for example, resulting from the COVID-19 pandemic), changes in laws, rules or regulations and other challenges discussed in our public filings, could limit our ability to achieve some or all of the expected benefits of these initiatives.
Estimates and assumptions
In preparing this presentation, management has made estimates and assumptions that affect the numbers presented. Actual results may differ. Annualized numbers do not take into account variations in operating results, seasonality and other factors and may not be indicative of actual, full-year results. Figures throughout this presentation may also be subject to rounding adjustments. All opinions and views constitute judgments as of the date of writing without regard to the date on which the reader may receive or access the information. This information is subject to change at any time without notice and we do not intend to update this information.
Cautionary statements relating to interim financial information
This document contains certain unaudited interim financial information for the first quarter of 2022. This information has been derived from management accounts, is preliminary in nature, does not reflect the complete results of the first quarter of 2022 and is subject to change, including as a result of any normal quarterly adjustments in relation to the financial statements for the first quarter of 2022. This information has not been subject to any review by our independent registered public accounting firm. There can be no assurance that the final results for these periods will not differ from these preliminary results, and any such differences could be material. Quarterly financial results for the first quarter of 2022 will be included in our 1Q22 Financial Report. These interim results of operations are not necessarily indicative of the results to be achieved for the remainder of the full first quarter of 2022.

Statement regarding non-GAAP financial measures
This presentation contains non-GAAP financial measures, including results excluding certain items included in our reported results as well as return on regulatory capital and return on tangible equity (which is based on tangible shareholders’ equity). Further details and information needed to reconcile such non-GAAP financial measures to the most directly comparable measures under US GAAP can be found in the Fourth Quarter and Full Year 2021 Supplemental Information, which is available on our website at www.credit-suisse.com.
Our estimates, ambitions, objectives and targets often include metrics that are non-GAAP financial measures and are unaudited. A reconciliation of the estimates, ambitions, objectives and targets to the nearest GAAP measures is unavailable without unreasonable efforts. Results excluding certain items included in our reported results do not include items such as goodwill impairment, major litigation provisions, real estate gains, impacts from foreign exchange and other revenue and expense items included in our reported results, all of which are unavailable on a prospective basis. Return on regulatory capital (a non-GAAP financial measure) is calculated using income/(loss) after tax and assumes a tax rate of 25% and capital allocated based on the average of 13.5% of risk-weighted assets and 4.25% of leverage exposure; the essential components of this calculation are unavailable on a prospective basis. Such estimates, ambitions, objectives and targets are calculated in a manner that is consistent with the accounting policies applied by us in preparing our financial statements.
Statement regarding capital, liquidity and leverage
Credit Suisse is subject to the Basel framework, as implemented in Switzerland, as well as Swiss legislation and regulations for systemically important banks, which include capital, liquidity, leverage and large exposure requirements and rules for emergency plans designed to maintain systemically relevant functions in the event of threatened insolvency. Credit Suisse has adopted the Bank for International Settlements (BIS) leverage ratio framework, as issued by the Basel Committee on Banking Supervision (BCBS) and implemented in Switzerland by the Swiss Financial Market Supervisory Authority FINMA.
Unless otherwise noted, leverage exposure is based on the BIS leverage ratio framework and consists of period-end balance sheet assets and prescribed regulatory adjustments. The tier 1 leverage ratio and CET1 leverage ratio are calculated as BIS tier 1 capital and CET1 capital, respectively, divided by period-end leverage exposure. Unless otherwise noted, for periods in 2020, leverage exposure excludes cash held at central banks, after adjusting for the dividend paid in 2020.
Sources
Certain material in this presentation has been prepared by Credit Suisse on the basis of publicly available information, internally developed data and other third-party sources believed to be reliable. Credit Suisse has not sought to independently verify information obtained from public and third-party sources and makes no representations or warranties as to accuracy, completeness or reliability of such information.
Disclaimer (2/2)
3February 10, 2022
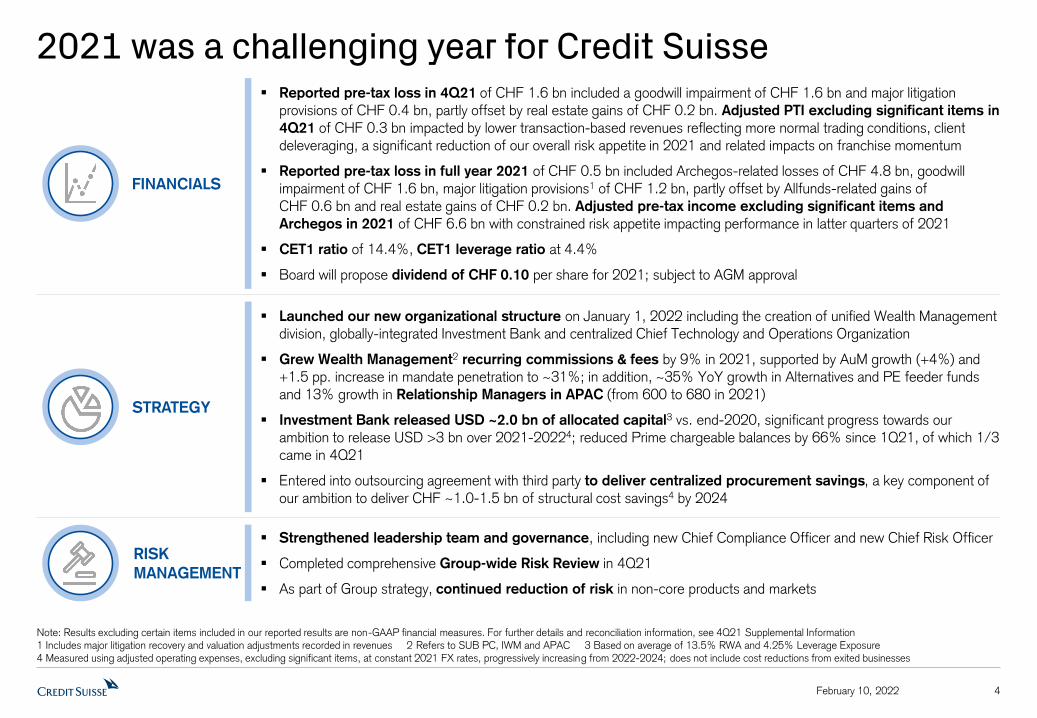
2021 was a challenging year for Credit Suisse
4February 10, 2022
Note: Results excluding certain items included in our reported results are non-GAAP financial measures. For further details and reconciliation information, see 4Q21 Supplemental Information 1 Includes major litigation recovery and valuation adjustments recorded in revenues 2 Refers to SUB PC, IWM and APAC 3 Based on average of 13.5% RWA and 4.25% Leverage Exposure 4 Measured using adjusted operating expenses, excluding significant items, at constant 2021 FX rates, progressively increasing from 2022-2024; does not include cost reductions from exited businesses
RISK
MANAGEMENT
Strengthened leadership team and governance, including new Chief Compliance Officer and new Chief Risk Officer
Completed comprehensive Group-wide Risk Review in 4Q21
As part of Group strategy, continued reduction of risk in non-core products and markets
FINANCIALS
Reported pre-tax loss in 4Q21 of CHF 1.6 bn included a goodwill impairment of CHF 1.6 bn and major litigation provisions of CHF 0.4 bn, partly offset by real estate gains of CHF 0.2 bn. Adjusted PTI excluding significant items in
4Q21 of CHF 0.3 bn impacted by lower transaction-based revenues reflecting more normal trading conditions, client deleveraging, a significant reduction of our overall risk appetite in 2021 and related impacts on franchise momentum
Reported pre-tax loss in full year 2021 of CHF 0.5 bn included Archegos-related losses of CHF 4.8 bn, goodwill impairment of CHF 1.6 bn, major litigation provisions1 of CHF 1.2 bn, partly offset by Allfunds-related gains of CHF 0.6 bn and real estate gains of CHF 0.2 bn. Adjusted pre-tax income excluding significant items and
Archegos in 2021 of CHF 6.6 bn with constrained risk appetite impacting performance in latter quarters of 2021
CET1 ratio of 14.4%, CET1 leverage ratio at 4.4%
Board will propose dividend of CHF 0.10 per share for 2021; subject to AGM approval
STRATEGY
Launched our new organizational structure on January 1, 2022 including the creation of unified Wealth Management division, globally-integrated Investment Bank and centralized Chief Technology and Operations Organization
Grew Wealth Management2 recurring commissions & fees by 9% in 2021, supported by AuM growth (+4%) and +1.5 pp. increase in mandate penetration to ~31%; in addition, ~35% YoY growth in Alternatives and PE feeder funds and 13% growth in Relationship Managers in APAC (from 600 to 680 in 2021)
Investment Bank released USD ~2.0 bn of allocated capital3 vs. end-2020, significant progress towards our ambition to release USD >3 bn over 2021-20224; reduced Prime chargeable balances by 66% since 1Q21, of which 1/3 came in 4Q21
Entered into outsourcing agreement with third party to deliver centralized procurement savings, a key component of our ambition to deliver CHF ~1.0-1.5 bn of structural cost savings4 by 2024

5.2
(2.2)
5.2
0.1
4.8
0.6
6.2
1.2
5.2
(0.1)
4.6
(1.6)
Reported pre-tax income included a goodwill impairment of CHF 1.6 bn and major litigation provisions of CHF 0.4 bn
4Q21 impacted by reduced risk appetite and lower client activity
5February 10, 2022
Note: Results excluding certain items included in our reported results are non-GAAP financial measures. For further details and reconciliation information, see 4Q21 Supplemental Information
5.1
0.2
5.2
0.6
4.8
0.8
5.5
1.0
5.3
0.9
4.4
0.3
Group fourth quarter net revenues and pre-tax incomein CHF bn
Net revenues Pre-tax income
4Q16 4Q17 4Q18 4Q204Q19 4Q21
Reported
Adjustedexcl. sign. items and Archegos
Adjusted results excluding significant items and Archegos were negatively impacted by more normal trading conditions, client deleveraging,
a significant reduction of our overall risk appetite in 2021 and related impacts on
franchise momentum
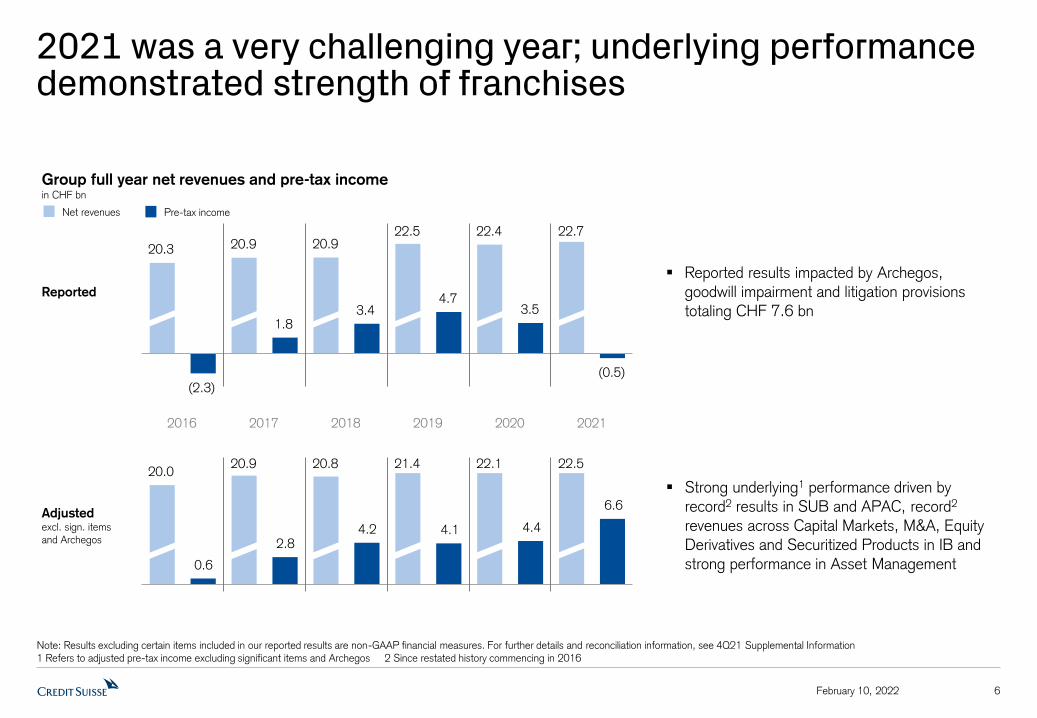
20.3
(2.3)
20.9
1.8
20.9
3.4
22.5
4.7
22.4
3.5
22.7
(0.5)
2021 was a very challenging year; underlying performance demonstrated strength of franchises
6February 10, 2022
Note: Results excluding certain items included in our reported results are non-GAAP financial measures. For further details and reconciliation information, see 4Q21 Supplemental Information1 Refers to adjusted pre-tax income excluding significant items and Archegos 2 Since restated history commencing in 2016
20.0
0.6
20.9
2.8
20.8
4.2
21.4
4.1
22.1
4.4
22.5
6.6
Group full year net revenues and pre-tax incomein CHF bn
Net revenues Pre-tax income
2016 2020 2021
Reported
Adjustedexcl. sign. items and Archegos
2017 2018 2019
Reported results impacted by Archegos, goodwill impairment and litigation provisions totaling CHF 7.6 bn
Strong underlying1 performance driven by record2 results in SUB and APAC, record2
revenues across Capital Markets, M&A, Equity Derivatives and Securitized Products in IB and strong performance in Asset Management
7February 10, 2022
Update on supply chain finance funds
Note: Data as of December 31, 2021; Data Source: CS AM Portfolio Management for all information pertaining to Fund Notional Value after cash payout. The NAV is published through the Fund Administrator. Differences (e.g. different data sources, cut-off times, FX rates, etc.) may occur 1 Exposure as of February 25, 2021 2 Includes FX effects and recovery costs accrual 3 USD / AUD exchange rate of 1.357
Selected highlights
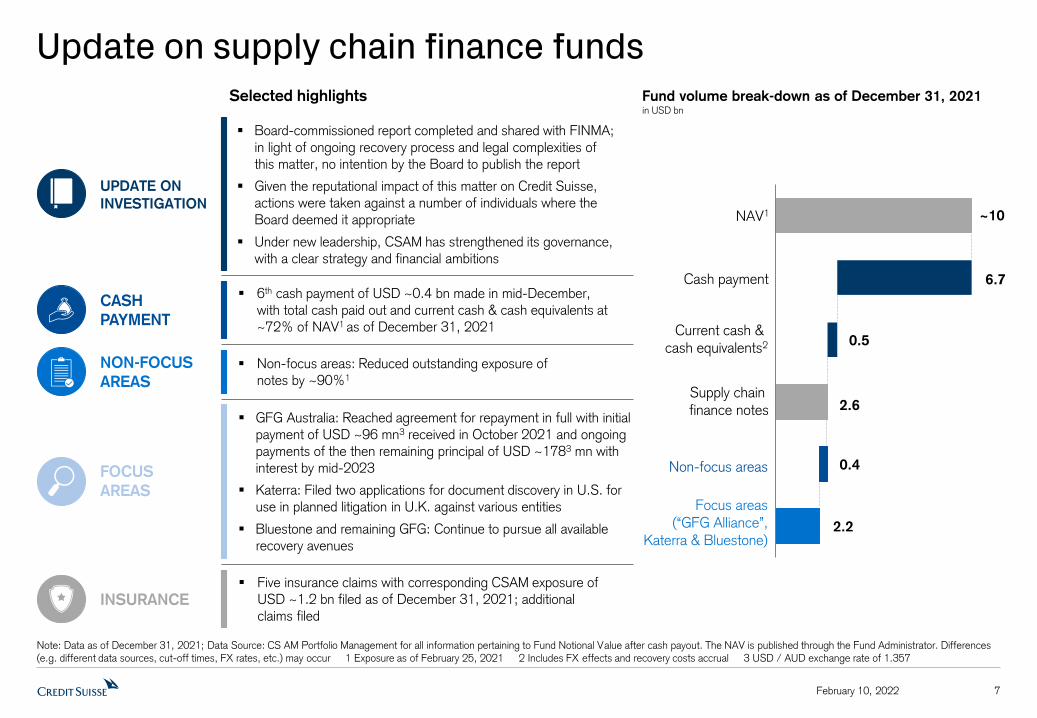
6th cash payment of USD ~0.4 bn made in mid-December, with total cash paid out and current cash & cash equivalents at ~72% of NAV1 as of December 31, 2021
CASH
PAYMENT
Non-focus areas: Reduced outstanding exposure of notes by ~90%1
NON-FOCUS
AREAS
Five insurance claims with corresponding CSAM exposure of USD ~1.2 bn filed as of December 31, 2021; additional claims filed
INSURANCE
Fund volume break-down as of December 31, 2021in USD bn
0.5
0.4
NAV1
Non-focus areas
Supply chain finance notes
Cash payment
Current cash & cash equivalents2
Focus areas(“GFG Alliance”,
Katerra & Bluestone)
~10
6.7
2.6
2.2
Board-commissioned report completed and shared with FINMA; in light of ongoing recovery process and legal complexities of this matter, no intention by the Board to publish the report
Given the reputational impact of this matter on Credit Suisse, actions were taken against a number of individuals where the Board deemed it appropriate
Under new leadership, CSAM has strengthened its governance, with a clear strategy and financial ambitions
UPDATE ON
INVESTIGATION
GFG Australia: Reached agreement for repayment in full with initial payment of USD ~96 mn3 received in October 2021 and ongoing payments of the then remaining principal of USD ~1783 mn with interest by mid-2023
Katerra: Filed two applications for document discovery in U.S. for use in planned litigation in U.K. against various entities
Bluestone and remaining GFG: Continue to pursue all available recovery avenues
FOCUS
AREAS

8February 10, 2022
Decisive actions taken to strengthen risk and compliance will support execution of our strategy and growth agenda
Strengthened
leadership team and governance
New Chief Compliance Officer appointed
October 1, 2021
New Chief Risk Officer appointed
January 1, 2022
Senior appointments across business risk
management, Risk and Compliance teams
Completed review of Compliance organization
Review of Risk organization ongoing
Further strengthen
our risk culture
Disciplined remediation post 2021 events
Significant investments across Risk and
Compliance, reflected in Group operating expense guidance
Started implementation of ‘Everyone is a risk
manager’ and ‘four-eyes’ principles
Risk and Control metrics for performance and
compensation in place for ~600 senior managers across the bank
Further strengthening of first line of defense in
Risk and Compliance through hiring and shifting personnel from second to first line of defense
Recalibration and alignment
of risk appetite in 2021
Completed Group-wide Risk Review in 4Q21
As part of new Group strategy, ongoing risk
reduction across non-core products and markets
Reduced risk appetite during Risk Review, albeit
with cumulative impact on 4Q21 results
Continued de-risking of GTS Emerging Markets
franchise with 20% YoY reduction in allocated capital1 in non-core Sub-Saharan Africa
Reduced Oil & Gas exposure by 38% YoY
Overall reduction of RWA and LE by 12% and
10%, respectively, since 1Q21
1 Based on average of 13.5% RWA and 4.25% Leverage Exposure 2 By 2024
Overall strengthening of first and second lines of defense on track
Executing our strategy consistent with approved risk appetite and our ambition to increase capital1 allocation to WM, SB & AM to ~2x IB2
Enhancing of culture of personal accountability and responsibility driven by ‘tone from the top’
9February 10, 2022
Significant risk reduction since 1Q21
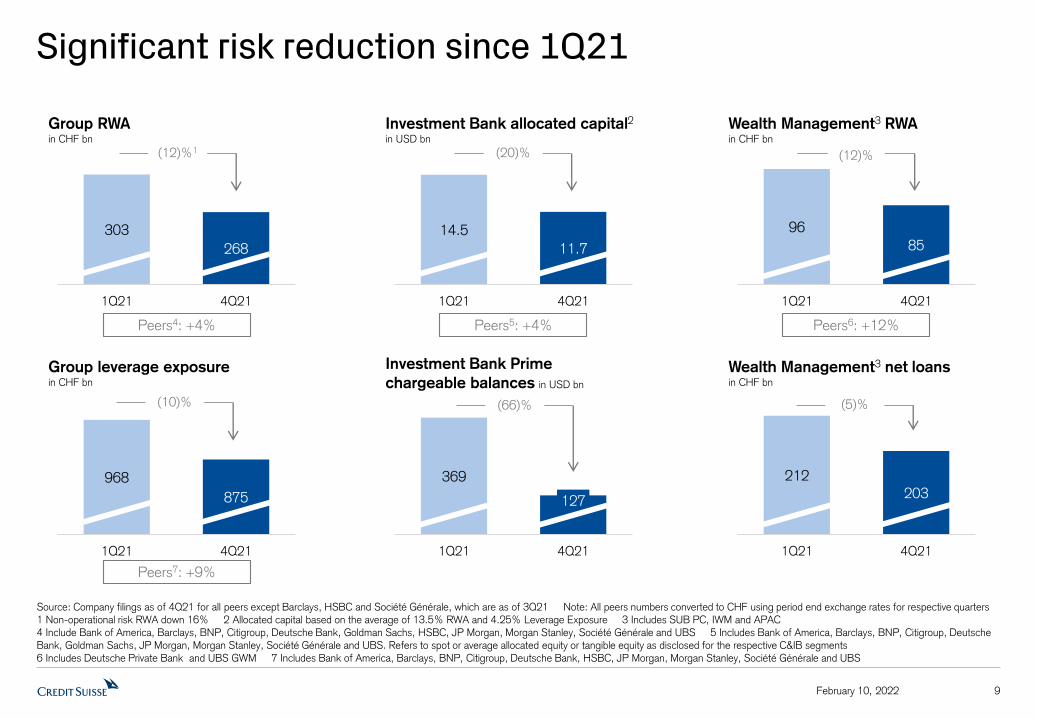
Source: Company filings as of 4Q21 for all peers except Barclays, HSBC and Société Générale, which are as of 3Q21 Note: All peers numbers converted to CHF using period end exchange rates for respective quarters 1 Non-operational risk RWA down 16% 2 Allocated capital based on the average of 13.5% RWA and 4.25% Leverage Exposure 3 Includes SUB PC, IWM and APAC 4 Include Bank of America, Barclays, BNP, Citigroup, Deutsche Bank, Goldman Sachs, HSBC, JP Morgan, Morgan Stanley, Société Générale and UBS 5 Includes Bank of America, Barclays, BNP, Citigroup, Deutsche Bank, Goldman Sachs, JP Morgan, Morgan Stanley, Société Générale and UBS. Refers to spot or average allocated equity or tangible equity as disclosed for the respective C&IB segments 6 Includes Deutsche Private Bank and UBS GWM 7 Includes Bank of America, Barclays, BNP, Citigroup, Deutsche Bank, HSBC, JP Morgan, Morgan Stanley, Société Générale and UBS
303
268
1Q21 4Q21
Group RWAin CHF bn
(12)%1
968
875
1Q21 4Q21
Group leverage exposurein CHF bn
(10)%
14.5
11.7
1Q21 4Q21
Investment Bank allocated capital2
in USD bn
(20)%
369
127
1Q21 4Q21
Investment Bank Prime
chargeable balances in USD bn
(66)%
212
203
1Q21 4Q21
Wealth Management3 net loansin CHF bn
(5)%
96
85
1Q21 4Q21
Wealth Management3 RWAin CHF bn
(12)%
Peers4: +4% Peers5: +4%
Peers7: +9%
Peers6: +12%

10February 10, 2022
We have significantly strengthened our capital ratios
Source: Company filings as of 4Q21 for all peers except Barclays, HSBC and Société Générale, which are as of 3Q21 Note: Peers include Bank of America, Barclays, BNP, Citigroup, Deutsche Bank, Goldman Sachs, HSBC, JP Morgan, Morgan Stanley, Société Générale and UBS 1 US peers reflect lower of standardized or advanced CET1 ratio 2 Tier 1 Leverage Ratio without the temporary exclusion of central bank reserves permitted by FINMA in 2020 3 Supplementary Leverage Ratio for US peers
CET1 ratio – Credit Suisse CET1 ratio – Peers1
Tier 1 leverage ratio – Credit Suisse Tier 1 leverage ratio – Peers3
16.0%15.8%15.0%15.0%14.4%14.2%
13.4%13.2%13.0%12.9%12.2%10.6%
6.2%5.7% 5.7% 5.6% 5.6% 5.5% 5.4% 5.2%
4.9%4.5%
4.2% 4.1%
12.9% 12.2%13.7% 14.4% 14.4%
4Q20 1Q21 2Q21 3Q21 4Q21
5.6% 5.5%6.0% 6.1% 6.2%
4Q20 1Q21 2Q21 3Q21 4Q21
2
Credit
Suisse
Credit
Suisse

We are executing on our strategic vision
11February 10, 2022
Place risk management at the core of the Bank
Foster a diverse and inclusive culture that reinforces the importance of personal accountability and responsibility with our entrepreneurial spirit
Deliver on our strategy with disciplined execution
Simplify Invest for growth
Lead the Bank and our clients into a sustainable future
1 Aspiration based on average of 13.5% RWA and 4.25% Leverage Exposure 2 Over 2021-2024 3 Pre Basel III Reform 4 Aspiration measured using adjusted operating expenses, excluding significant items, at constant 2021 FX rates, progressively increasing from 2022-2024; does not include cost reductions from exited businesses 5 At constant 2021 FX rates, in 2024 vs. 2018-2020 average
Shift capital to value-creating
businesses and strengthen our
balance sheet and organization
Strengthen
Redeploy CHF ~3 bn of capital1
into Wealth Management, +~25%1,2
CET1 ratio >14%3 and
CET1 Leverage ratio ~4.5%
Key aspirations
Drive structural cost discipline
to fund strategic investments and
generate operational leverage
CHF ~1.0-1.5 bn ofannual structural cost savings4
by 2024 to invest for growth
Key aspirations
Invest in clients, businesses, talent
and technology where we have
sustainable competitive advantage
~500 increase in RMs, +~15%2
over next three years
Increase capital expenditure by 35%
to CHF ~3.0 bn5
Key aspirations

Our Executive Board
12
Corporate Functions
Divisions and Regions
Thomas Gottstein
Chief Executive Officer
Romeo Cerutti
General CounselChristine Graeff
Global Head ofHuman Resources
David Wildermuth
Chief Risk Officer
Francesco De Ferrari
CEO Wealth ManagementCEO Region EMEA (a.i.)
Ulrich Körner
CEO Asset ManagementChristian Meissner
CEO Investment BankCEO Region Americas
Helman Sitohang
CEO Region Asia PacificAndré Helfenstein
CEO Swiss BankCEO Region Switzerland
CEO
David Mathers
Chief Financial OfficerJoanne Hannaford
Chief Technology & Operations Officer
Rafael Lopez Lorenzo
Chief Compliance Officer
February 10, 2022

13February 10, 2022
We are executing our strategy with discipline and pace
Asset ManagementWealth Management Swiss BankInvestment Bank
Source: Bloomberg 1 In 2021 2 Based on new organizational structure as of January 1, 2022 3 Includes institutional-style solutions for Wealth Management clients 4 Includes future contracted hires 5 With MoneyPark (Swiss mortgage and real estate brokerage fintech company) and PriceHubble (Swiss B2B proptech company leveraging big data and analytics)
Progressively deploy capital for disciplined lending growth
Aim for 200,000 CSX clients in 2022; launch digital partnership in mortgages5
Enhance coverage model for Wealth Management and Institutional clientsN
ext
steps Build out of IB Advisory, including
bespoke offering to Wealth Management clients (Family Offices, entrepreneurs)
CHF 10 bn client referral volume1
driven by Bank for Entrepreneur-focused collaboration between Corporate, Private and Institutional businesses
Gained further market share in
Institutional Banking building on our #1 franchise and continued NNA momentum1
Rolled out mortgage tools and
select workflow automation
Str
ength
en a
nd s
implif
y
Established as a separate division,
strengthened leadership and divisional governance
Continued to exit non-core
Investment & Partnership portfolio; achieved 35% RWA reduction1
Accelerating shift towards
operating businesses
Strengthening of distribution
organization
Unified Wealth Management to
leverage globally integrated model and generate efficiencies
Exit of Sub-Saharan African
markets (excluding South Africa)
Established a separate Platform
function to streamline division-wide platforms
Launched Client Segment
function; grow UHNW and accelerate Upper HNW; expand dedicated HNW service models
Globally-integrated Investment
Bank division
Reduced allocated capital by
USD ~2.0 bn1, achieving ~2/3of the capital release aspiration2
Strong momentum across focus
areas, including Securitized Products, M&A, Capital Markets and Equity Derivatives1
Wealth Management revenues in
collaboration with GTS3 increased 9% vs. 2018-20 average
Enhanced joint coverage of Swiss
institutional clients and prioritized target market coverageIn
vest
for
gro
wth +50% YoY increase in revenues
driven by data analytics vs. 2020
Invested CHF >600 mn1,
stepping up investments in digitalization and automation; hired 80 RMs (+13%) in APAC1
Hired 30+ IBCM Managing
Directors4 (+150% YoY), reflecting our ability to rebuild following attrition earlier in 2021

Leading the bank and our clients into a sustainable future
14February 10, 2022
Emma Crystal will become Chief Sustainability Officer for the Group effective April 1, 2022, reporting directly into the Group CEO
Continue to expand our sustainable investment and financing offering
Drive further product innovation via strategic partnerships
Deliver towards our CHF 300 bn sustainable finance commitment by 2030
Deliver on our transition to net zero emissions by end of 2050 commitment
1 Refers to Credit Suisse’s assets managed according to the Credit Suisse Sustainable Investment Framework (Sustainable AuM), reflecting a combination of further product classifications, onboarding of new sustainable funds, net sales and market as well as FX movements
65
156
4Q20 4Q21Wealth
Management
ESG funds# of funds
Sustainable
AuM1
in CHF bn
108
150
9%of
AuM
7%of
AuM
Broadened ESG product shelf and fund offering
Launched distinctive products via collaborations
Deliver sustainable solutions
Implemented Sustainability Activities Framework
Partnered with Corporates to drive client transition
Enable client transitions
Executed inaugural Sustainability Week
Drove ESG thought-leadership and key publications
Engage with thought leadership
Initiated net zero program
Published inaugural CS Sustainability Report
Drive our own transition
Established Board Sustainability Advisory Committee
Received Terra Carta Seal from HRH The Prince of Wales
Adapt our culture & engagement
4Q20 4Q21
Sustainability strategy in execution Financial progress
Next steps

15February 10, 2022
We aim to deliver CHF ~1.0-1.5 bn of efficiency savings by 2024 to fund growth initiatives
Synergies from unified WM division, globally-integrated IB division and
centralization of Technology and Operations
CHF ~0.4 bn
Improved automation and
digitalization of our businesses
and operating model
CHF ~0.3 bn
Simplification of booking model, reduction of legal entities and optimization
of organizational structure
CHF ~0.3 bn
Centralization of Procurement including outsourcing agreement
with third party
CHF ~0.3 bn
Illustrative structural cost savingsin CHF bn
Annualized savings of CHF ~1.0-1.5 bn by 2024
~0.3
~0.8
~1.3
2022 2023 2024

Ensure secure, resilient infrastructure and reinforce cybersecurity
Focus on core capabilities that have enterprise-wide utility
Drive engineering culture; become the destination of choice
for engineering talent
Automate across client journey to enhance client experience and
leverage RM interactions
Simplify business platforms and enable ecosystem plays
Drive organizational agility for faster value delivery and efficiency
Invest into digitally-enabled client experience to sharpen focus on ‘high-touch’ versus ‘high-tech’ client segments
Value based prioritization to grow share of wallet
Design for the long term, deliver for the short term
Strengthen Simplify
Invest for growth
February 10, 2022 16
We aim to accelerate the digital transformation of our business
50%
Change
the Bank
50%
Run
the Bank
Current technology expenses
Best-known Swiss brand for
digital banking in Switzerland
Hired Global Chief Technology & Operations Officer as member of the Executive Board
Committed, dedicated staff with average tenure of 7 years
Best Private Bank
for Use of RegTech
Best Digital Networking Bank
for Entrepreneurs in Asia
2021 WatersTechnology Asia Awards
– Best AI Initiative
Best Structured Product
Technological Solution, Americas
#1 E-Trading platform
in APAC for AES
HK Technology – Innovative or
Emerging Technology Adoption
Best Private Bank
– Client Experience

17February 10, 2022
Our financial aspirations as outlined in Investor Day 2021

Detailed Financials
18February 10, 2022

19February 10, 2022
Comprehensive restatement to be published in April 2022
Expected key dates:
January 1, 2022: Launched new organizational structure
March 10, 2022: Publication of Annual Report 2021 including update on new organizational structure
April 7, 2022: Restatement of time series to new divisional and regional structures
April 27, 2022: Publication of first quarter 2022 results under new organizational structure
April 29, 2022: Annual General Meeting
4Q21/2021
From 1Q22 onwards
Swiss
Universal Bank
International
Wealth
Management
Asia
Pacific
Investment
Bank
Asset
Management
Corporate
Center
Asset
Management
Corporate
Center
Wealth
Management
Swiss BankInvestment Bank
Reporting
structure

Group Overview
20
Note: Results excluding certain items included in our reported results are non-GAAP financial measures. For further details and reconciliation information, see 4Q21 Supplemental Information. 2021 reported results include a gain related to the equity investment in Allfunds Group, losses related to the equity investment in SIX, loss related to Archegos and impairments related to York and goodwill. 2020 reported results include gains related to the InvestLab transfer, equity investments in Allfunds Group, SIX and Pfandbriefbank and an impairment related to York ‡ RoTE is a non-GAAP financial measure, see 4Q21 Supplemental Information 1 Includes SUB, IWM, APAC and AM
February 10, 2022
Credit Suisse Group in CHF mn unless otherwise specified
4Q21 3Q21 4Q20 Δ 4Q20 2021 2020 Δ 2020
Net revenues 4,582 5,437 5,221 (12)% 22,696 22,389 1%
o/w Wealth Management-related1 3,200 3,270 3,129 2% 13,961 13,607 3%
o/w Investment Bank in USD mn 1,605 2,465 2,337 (31)% 9,719 9,718 -
Provision for credit losses (20) (144) 138 4,205 1,096
o/w Archegos (5) (188) - 4,307 -
o/w Non-specific provisions (28) 20 32 (235) 412
Total operating expenses 6,188 4,573 5,171 20% 19,013 17,826 7%
o/w Goodwill impairment 1,623 - - 1,623 -
Pre-tax income (1,586) 1,008 (88) n/m (522) 3,467 n/m
Income tax expense 416 570 262 1,026 801
Effective tax rate n/m 57% n/m n/m 23%
Net income attributable to shareholders (2,007) 434 (353) n/m (1,572) 2,669 n/m
Return on tangible equity‡ (20.1)% 4.5% (3.5)% (4.0)% 6.6%
Cost/income ratio 135% 84% 99% 84% 80%
Diluted earnings per share in CHF (0.80) 0.16 (0.15) n/m (0.64) 1.06 n/m
Adjusted excluding significant items and Archegos in CHF mn
Net revenues 4,384 5,504 5,335 (18)% 22,544 22,101 2%
o/w Wealth Management-related1 2,998 3,290 3,243 (8)% 13,265 13,319 -
Pre-tax income 328 1,362 861 (62)% 6,599 4,375 51%

(1,586)
328
(224) (31)
57 9 33
436
1,623 11
4Q21
Reported
Real estate
gains
Gain on
Allfunds
Other
revenue
adjustments
Archegos Restructuring Major
litigation
Goodwill
impairment
Expenses
related to
real estatedisposals
4Q21
Adj. excl.
sign. items& Archegos
2021 pre-tax income impacted by Archegos, goodwill impairment, major litigation and other items
21February 10, 2022
Group pre-tax incomein CHF mn
Note: Results excluding certain items included in our reported results are non-GAAP financial measures. For further details and reconciliation information, see 4Q21 Supplemental Information1 Includes gains on business sales of CHF 13 mn and revaluation losses related to our investment in SIX of CHF 70 mn 2 Includes losses on business sales of CHF 29 mn, revaluation losses related to our investment in SIX of CHF 70 mn and an impairment related to the valuation of our non-controlling interest in York Capital Management of CHF 113 mn
(522)
6,599
(232)(602)
212
4,798 103
1,163
1,623 56
2021Reported
Real estategains
Gain onAllfunds
Otherrevenue
adjustments
Archegos Restructuring Majorlitigation
Goodwillimpairment
Expensesrelated toreal estate
disposals
2021Adj. excl.
sign. items
& Archegos
Key messages
Reduced goodwill in the Investment Bank to zero
Expect CHF ~400 mn of restructuring expenses
between 4Q21-2022
2
1

923
875
(27) (4)(17)
3Q21 Business
reductions
HQLA FX impact 4Q21
22February 10, 2022
CET1 capital ratio stable at 14.4%; CET1 leverage ratio up ~10 bps to 4.4%
Key messages
Lower risk appetite with Investment Bank RWA and leverage exposure reductions of CHF 1 bn3 and CHF 18 bn4 QoQ,
respectively
Wealth Management-related1 RWA and leverage exposure decreased by CHF 5 bn5 and CHF 7 bn6 QoQ, respectively, with client deleveraging reflecting adverse market conditions particularly
in Asia
CET1 ratio of 14.4%, flat QoQ, and CET1 leverage ratio of 4.4%, up ~10 bps QoQ, benefitting from lower RWA and leverage exposure
We achieved a capital7 reduction in the Investment Bank of
USD 2.0 bn in 2021, representing significant progress towards our ambition to release USD >3 bn of capital by the end of 20228
Parent CET1 ratio of 11.7%9, reflecting specific capital guidance issued by FINMA on the valuation of subsidiaries; dividends and
capital repatriations expected to increase the CET1 ratio to above 12%9 by year-end 2022
Leverage exposure in CHF bn
1 Includes SUB, IWM, APAC and AM 2 FX impact from September to December FX rates 3 RWA excluding internal & external model and parameter updates of CHF 1 bn and FX impact of CHF (2) bn4 Leverage exposure excluding FX impact of CHF (8) bn 5 RWA excluding FX impact of CHF (2) bn 6 Leverage exposure excluding FX impact of CHF (6) bn 7 Allocated capital based on the average of 13.5% RWA and 4.25% Leverage Exposure 8 Ambition based on new organizational structure as of January 1, 2022 9 Transitional CET1 capital ratio
Risk-weighted assets in CHF bn
278
268(6)
1
(5)
3Q21 Business
reductionsModel &
parameter
updates
FX impact 4Q21
14.4%CET1 capital ratio14.4%
4.4%CET1 leverage ratio4.3%
6.2%Tier 1 leverage ratio6.1%
o/w IB (1)
o/w WM-related1 (5)
o/w IB (18)o/w WM-related1 (7)
2
2

795 827
717787
4Q20 Marketmovements
& other effects
FX NNA 4Q21
220 241
23February 10, 2022
AuM grew by 7% YoY with a 9% increase in mandate volumes, benefitting recurring commissions and fees
1 Includes SUB C&IC, Asset Management and adjustment for assets managed by Asset Management for the other businesses 2 Refers to SUB PC, IWM and APAC 3 Refers to 2024 aspiration, based on new organizational structure as of January 1, 2022 4 Performance of discretionary mandates versus non-discretionary client portfolios (3 years to December 2021) of PB clients in SUB, IWM and APAC that are booked in Switzerland
1,5121,614
+7%
YoY
3112
+9%
Mandates Mandates
Group Assets under Managementin CHF bn
59
Mandate penetration at 31%, up from 29% in 2020, on track to achieve medium-term ambition of 33-35%3
supported by House View
Discretionary mandates have
outperformed >80% of advisory client
portfolios4
Institutional1 20
WM2 11
Wealth
Management2
Institutional
(AM, C&IC)1
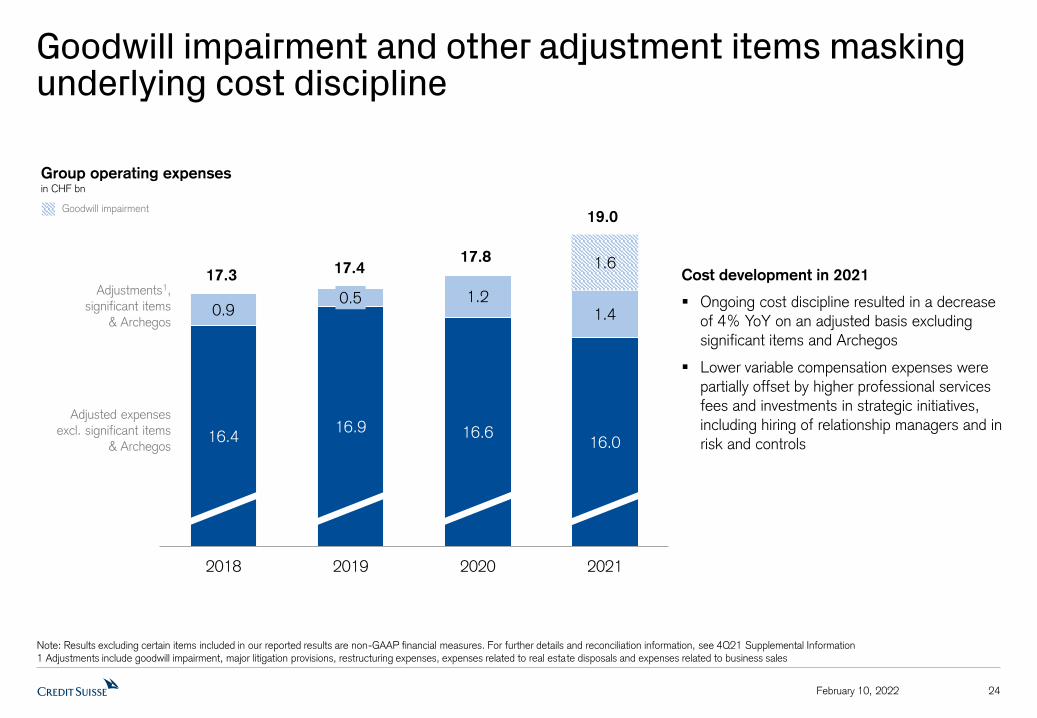
16.4 16.9 16.6
16.0
0.9 0.5 1.2
1.4
1.6
2018 2019 2020 2021
Goodwill impairment and other adjustment items masking underlying cost discipline
24February 10, 2022
Group operating expensesin CHF bn
Note: Results excluding certain items included in our reported results are non-GAAP financial measures. For further details and reconciliation information, see 4Q21 Supplemental Information 1 Adjustments include goodwill impairment, major litigation provisions, restructuring expenses, expenses related to real estate disposals and expenses related to business sales
17.3Adjustments1,
significant items
& Archegos
17.417.8
19.0
Adjusted expenses
excl. significant items
& Archegos
Cost development in 2021
Ongoing cost discipline resulted in a decrease
of 4% YoY on an adjusted basis excluding significant items and Archegos
Lower variable compensation expenses were partially offset by higher professional services
fees and investments in strategic initiatives,
including hiring of relationship managers and in risk and controls
Goodwill impairment

Variable incentive compensationin CHF mn
1,552 1,438
507
146 59
799
1,470
1,452
694
2019 2020 2021
25February 10, 2022
Variable compensation reflects the adverse events of 2021
1 Subject to repayment (clawback) by the employee in the event of voluntary resignation, termination for cause or in connection with other specified events or conditions within three years of the award grant
3,168
2,949
2,000
Cash
Upfront Cash Awards1
Regular Deferred Awards
Most Managing Directors and
Directors will receive an additional award totaling CHF 497 mn in respect of the delivery of strategic
plan over 2022-2024

2021 Business exits Structuralcost savings
Additionalinvestments
Variablecompensation
normalization
2022Aspiration
26February 10, 2022
We expect adjusted operating expenses to be CHF ~17.0 bn in 2022
Illustrative development of adjusted operating expenses excl. significant items1
in CHF bn, FXC
1 At constant 2021 FX rates 2 Includes expenses for prior years’ deferrals
We expect adjusted operating expenses excluding significant items to be CHF ~17 bn in 20221
In addition, we expect CHF ~400 mn of restructuring expenses in 2022
16.0
~1.0 ~17.0
~(0.3)~(0.4)
~0.7
2
2021 Investor Dayguidance
Estimate
~16.2-16.52021
~(0.4)Increasing to
~1.0-1.5by 2024
Aspiration
16.5-17.02022-2024
Increasing to
~(1.0)-(1.5)by 2024
~0.5
27
Note: Unless otherwise stated, all financial numbers presented and discussed are adjusted and exclude significant items. Results excluding certain items included in our reported results are non-GAAP financial measures. For further details and reconciliation information, see 4Q21 Supplemental Information. All percentage changes and comparative descriptions refer to YoY measurements unless otherwise specified † RoRC is a non-GAAP financial measure and was updated in 3Q21 to align with Group capital and leverage ratios, see 4Q21 Supplemental Information 1 Since restated history commencing in 20162 2021 figures include declines from the transfer of volumes from Private Clients to Corporate & Institutional Clients following the integration of NAB (net loans CHF 6 bn, AuM CHF 4 bn, custody assets CHF 3 bn)
February 10, 2022
Key metrics
in CHF bn 4Q21 3Q21 4Q20 2021 2020
Net margin in bps 44 50 38 49 45
Client Business Volume2 402 400 381 402 381
Net loans2 114 114 118 114 118
Net new assets (1.8) 1.9 (2.1) 1.4 (5.9)
Risk-weighted assets 80 82 81 80 81
Leverage exposure 301 305 296 301 296
Adjusted key financials excl. significant items
in CHF mn 4Q21 3Q21 4Q20 2021 2020
Net revenues 1,313 1,354 1,243 5,402 5,306
Provision for credit losses (3) 4 66 6 270
o/w non-specific provisions (18) (6) 15 (65) 75
Total operating expenses 770 764 790 3,041 3,149
Adj. PTI excl. sign. items 546 586 387 2,355 1,887
Reported pre-tax income 716 623 487 2,729 2,104
Adj. C/I ratio excl. sign. items 59% 56% 64% 56% 59%
Adj. RoRC† excl. sign. items 14% 15% 10% 15% 12%
Reported return on regulatory capital† 18% 16% 12% 17% 13%
PC
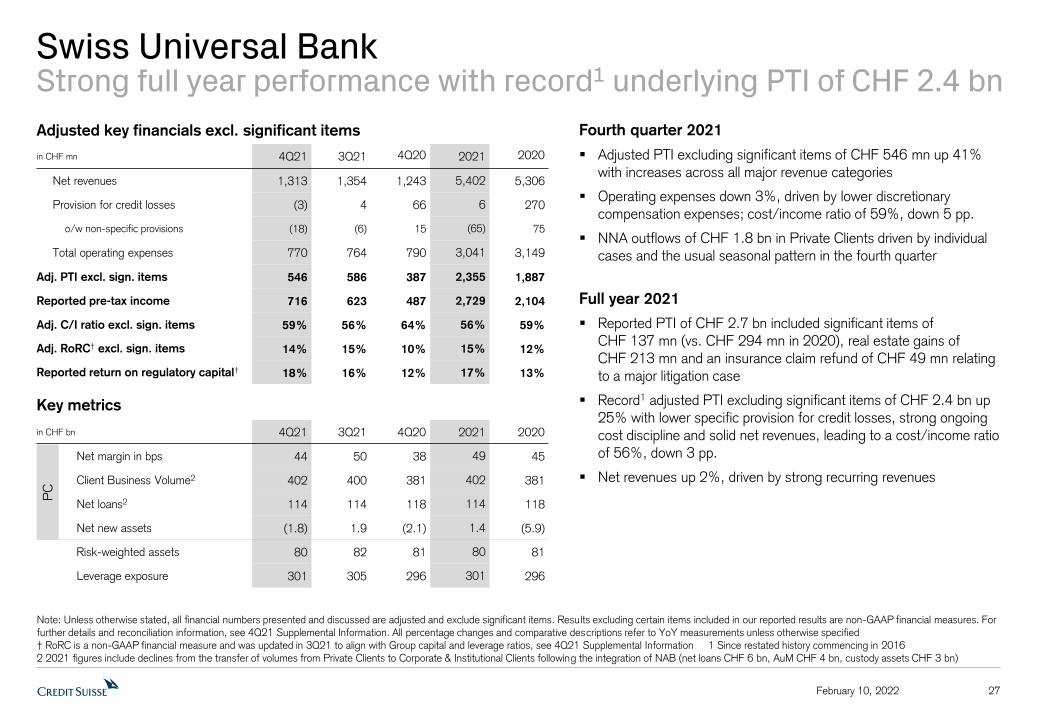
Swiss Universal BankStrong full year performance with record1 underlying PTI of CHF 2.4 bn
Fourth quarter 2021
Adjusted PTI excluding significant items of CHF 546 mn up 41% with increases across all major revenue categories
Operating expenses down 3%, driven by lower discretionary compensation expenses; cost/income ratio of 59%, down 5 pp.
NNA outflows of CHF 1.8 bn in Private Clients driven by individual cases and the usual seasonal pattern in the fourth quarter
Full year 2021
Reported PTI of CHF 2.7 bn included significant items of CHF 137 mn (vs. CHF 294 mn in 2020), real estate gains of CHF 213 mn and an insurance claim refund of CHF 49 mn relating to a major litigation case
Record1 adjusted PTI excluding significant items of CHF 2.4 bn up 25% with lower specific provision for credit losses, strong ongoing cost discipline and solid net revenues, leading to a cost/income ratio of 56%, down 3 pp.
Net revenues up 2%, driven by strong recurring revenues

International Wealth ManagementWeaker transactional activity; continued NNA growth
28February 10, 2022
Note: Unless otherwise stated, all financial numbers presented and discussed are adjusted and exclude significant items. Results excluding certain items included in our reported results are non-GAAP financial measures. For further details and reconciliation information, see 4Q21 Supplemental Information. All percentage changes and comparative descriptions refer to YoY measurements unless otherwise specified † RoRC is a non-GAAP financial measure and was updated in 3Q21 to align with Group capital and leverage ratios, see 4Q21 Supplemental Information 1 Includes other revenues of CHF (2) mn in 4Q21, CHF 1 mn in 3Q21, CHF (5) mn in 2021 and CHF (2) mn in 2020
Adjusted key financials excl. significant items
in CHF mn 4Q21 3Q21 4Q20 2021 2020
Net interest income 264 264 304 1,082 1,265
Recurring commissions & fees 277 306 297 1,197 1,136
Transaction-based 156 241 261 964 1,221
Net revenues1 695 812 862 3,239 3,620
Provision for credit losses (1) 12 31 (14) 110
o/w non-specific provisions (2) 10 14 (47) 17
Total operating expenses 671 624 625 2,483 2,515
Adj. PTI excl. sign. items 25 176 206 770 995
Reported pre-tax income 35 193 293 976 1,091
Adj. C/I ratio excl. sign. items 97% 77% 73% 77% 69%
Adj. RoRC† excl. sign. items 2% 11% 14% 13% 17%
Reported return on regulatory capital† 2% 13% 20% 16% 18%
Key metrics
in CHF bn 4Q21 3Q21 4Q20 2021 2020
Net margin in bps 3 18 23 20 28
Client Business Volume 555 558 518 555 518
Net loans 53 55 52 53 52
Net new assets 2.7 1.4 4.3 11.0 16.7
Risk-weighted assets 31 34 34 31 34
Leverage exposure 104 109 101 104 101
Fourth quarter 2021
Lower adjusted PTI excluding significant items due to weaker revenues and higher expenses; expenses include higher investments and year-end compensation accruals
Net interest income stabilizing since 2Q21, but down vs. 4Q20 due to cumulative interest rate moves
Lower transaction-based revenues in part reflecting more normalized client activity; mark-to-market loss on an investment of CHF 19 mn in 4Q21 vs. a gain of CHF 31 mn in 4Q20
Recurring commissions and fees include higher mandate revenues at a stable margin, offset by lower fees from lending activities
Operating expenses increased, including investments into IWM infrastructure, risk and sustainability initiatives
NNA of CHF 2.7 bn at 3% annualized growth rate
Full year 2021
Reported PTI of CHF 1.0 bn included a total gain of CHF 242 mn related to the equity investment in Allfunds Group and a loss of CHF 27 mnrelated to the revaluation of our investment in SIX
Adjusted PTI excluding significant items of CHF 0.8 bn down YoY from lower revenues, partly offset by lower credit provisions
Higher recurring commissions and fees with higher mandate and investment product revenues at a stable margin; transaction-based revenues decline primarily due to lower GTS and structured product revenues and lower FX commissions in less volatile markets
Continued NNA growth with CHF 11.0 bn (3% growth rate)

Asia PacificSubstantial slowdown in 4Q offsets progress during the year
29February 10, 2022
Adjusted key financials excl. significant items
in USD mn 4Q21 3Q21 4Q20 2021 2020
Net interest income 235 242 269 1,038 1,145
Recurring commissions & fees 118 111 99 453 373
Transaction-based 308 443 460 1,854 1,788
Net revenues1 661 795 828 3,345 3,309
Provision for credit losses (14) 7 7 29 248
o/w non-specific provisions (10) - 3 (13) 35
Total operating expenses 581 582 599 2,307 2,237
Adj. PTI excl. sign. items 94 206 222 1,009 824
Goodwill impairment (113) - - (113) -
Other adjustments 10 41 42 192 65
Reported pre-tax income (9) 247 264 1,088 889
Adj. C/I ratio excl. sign. items 88% 73% 72% 69% 68%
Adj. RoRC† excl. sign. items 8% 16% 18% 20% 16%
Reported return on regulatory capital† n/m 19% 21% 21% 17%
Key metrics
in USD bn 4Q21 3Q21 4Q20 2021 2020
Net margin in bps 15 33 36 40 36
Client Business Volume 372 380 402 372 402
Net loans 39 41 44 39 44
Net new assets (3.2) 3.2 (1.3) (1.3) 8.9
Risk-weighted assets 27 29 30 27 30
Leverage exposure 81 85 84 81 84
Note: Unless otherwise stated, all financial numbers presented and discussed are adjusted and exclude significant items. Results excluding certain items included in our reported results are non-GAAP financial measures. For further details and reconciliation information, see 4Q21 Supplemental Information. All percentage changes and comparative descriptions refer to YoY measurements unless otherwise specified † RoRC is a non-GAAP financial measure and was updated in 3Q21 to align with Group capital and leverage ratios, see 4Q21 Supplemental Information 1 Includes other revenues of USD (1) mn in 3Q21 and USD 3 mn in 2020 2 4Q21 includes mark-to-market losses of USD (4) mn (net of USD 19 mn of hedges). 4Q20 included mark-to-market gains of USD 50 mn (net of hedges of USD (24) mn)
Fourth quarter 2021
Adjusted PTI excluding significant items of USD 94 mn
Net interest income declined 13% primarily reflecting lower loan volumes from reduction in risk appetite and client deleveraging amid volatile markets particularly in Greater China; net loans decreased 11% YoY and 5% sequentially
Continued growth in recurring commission & fees driven by higher mandate and fund volumes; mandates penetration rate at 15.9% up 3 pp.
Transaction-based revenues down 33%, reflecting lower financing revenues2, lower IBCM fees, subdued client activity and weaker GTS revenues
Operating expenses decreased 3% reflecting lower compensation expenses, partially offset by RM growth and other investments including China, risk and controls initiatives; 4Q21 RMs at 680, up 80 from the beginning of the year
NNA outflows of USD 3.2 bn, including USD 2.9 bn from client deleveraging and de-risking
Full year 2021
Reported PTI of USD 1.1 bn included a gain of USD 196 mn related to the equity investment in the Allfunds Group (vs. USD 69 mn in 2020) and a charge of USD 113 mn from Asia Pacific’s share of goodwill impairment
Adjusted PTI excluding significant items of USD 1.0 bn reflecting stable revenues, lower credit provisions and higher operating expenses; RoRC† up 4 pp. to 20%

Investment BankWeak close to the year offsets strong underlying performance in 2021
30February 10, 2022
Note: Unless otherwise stated, all financial numbers presented and discussed are adjusted and exclude the loss related to Archegos. Results excluding certain items included in our reported results are non-GAAP financial measures. For further details and reconciliation information, see 4Q21 Supplemental Information. All percentage changes and comparative descriptions refer to YoY measurements unless otherwise specified † RoRC is a non-GAAP financial measure and was updated in 3Q21 to align with Group capital and leverage ratios, see 4Q21 Supplemental Information 1 Other revenues include treasury funding costs and changes in the carrying value of certain investments 2 4Q21 includes USD 5 mn release of provisions and USD 21 mn in expenses. 3Q21 includes USD 24 mn in revenues, USD 202 mn release of provisions and USD 26 mn in expense recovery. 2021 includes USD 518 mn in revenues losses, USD 4,577 mn in provisions and USD 29 mn in expenses 3 Includes restructuring, real estate disposals and major litigation of USD 163 mn4 With the exception of Index Access and APAC Delta One 5 Allocated capital based on the average of 13.5% of risk-weighted assets and 4.25% of leverage exposure 6 Since restated history commencing in 2016
Key metrics
in USD bn 4Q21 3Q21 4Q20 2021 2020
Risk-weighted assets 77 78 88 77 88
Leverage exposure 305 327 363 305 363
Adjusted key financials excl. Archegos
in USD mn 4Q21 3Q21 4Q20 2021 2020
Fixed income S&T 491 801 788 3,751 4,266
Equity S&T 412 533 555 2,447 2,571
Capital markets 436 807 843 3,306 2,539
Advisory and other fees 300 330 199 967 645
Other1 (35) (30) (48) (235) (303)
Net revenues 1,604 2,441 2,337 10,236 9,718
Provision for credit losses 4 20 42 (126) 489
o/w non-specific provisions 2 15 3 (114) 289
Total operating expenses 1,833 1,839 1,938 7,213 7,347
Adj. pre-tax income excl. Archegos (233) 582 357 3,149 1,882
Archegos2 16 (252) - 5,124 -
Goodwill impairment 1,662 - - 1,662 -
Other adjustments3 199 2 (39) 287 (122)
Reported pre-tax income (2,110) 832 318 (3,924) 1,760
Adj. cost/income ratio excl. Archegos 114% 75% 83% 70% 76%
Adj. RoRC† excl. Archegos n/m 14% 8% 18% 10%
Reported return on regulatory capital† n/m 20% 7% n/m 10%
Fourth quarter 2021
Net revenues decreased 31% vs. a strong 4Q20 driven by our strategy to reduce capital and risk across our businesses:
– Continued momentum in Advisory revenues, up 51% driven by share gains
– Capital markets revenues decreased 48% reflecting a slowdown in SPAC activity and lower risk appetite in our Leveraged Finance business
– Fixed Income revenues declined 38% reflecting challenging trading conditions in Credit partly offset by continued growth in our fee-based Asset Finance franchise
– Equities revenues declined 26% primarily driven by our announced exit4 of Prime Services
– GTS revenues declined as strength in Equity Derivatives and Macro was offset by reduced risk in Emerging Markets franchise and fewer episodic transactions
Adjusted operating expenses excluding Archegos decreased 5%, primarily due to reduced compensation
RWA declined 13% in line with our reduced risk appetite and leverage exposure declined 16% primarily due to reductions in Prime Services
Full year 2021
Reported pre-tax loss of USD 3.9 bn included losses related to Archegos of USD 5.1 bn and goodwill impairment of USD 1.7 bn
Strong adjusted PTI excluding Archegos of USD 3.1 bn underscoring the resilience of our client franchise despite a 15% or USD ~2.0 bn reduction in allocated capital5; on track to achieve our aspiration of USD >3 bn capital5 release over 2021-2022
Net revenues excluding Archegos increased 5% vs. 2020, and 25% vs. 2019, driven by record6 performances across Capital Markets, M&A, Equity Derivatives and Securitized Products

Asset ManagementSteady growth in management fees
31February 10, 2022
Note: Unless otherwise stated, all financial numbers presented and discussed are adjusted and exclude significant items. Results excluding certain items included in our reported results are non-GAAP financial measures. For further details and reconciliation information, see 4Q21 Supplemental Information. All percentage changes and comparative descriptions refer to YoY measurements unless otherwise specified † RoRC is a non-GAAP financial measure and was updated in 3Q21 to align with Group capital and leverage ratios, see 4Q21 Supplemental Information 1 Management fees excluding transaction fees in bps of average assets under management excluding assets under management associated with investment and partnerships
Fourth quarter 2021
Adjusted PTI excluding significant items of CHF 79 mn, down CHF 36 mn YoY; adjusted RoRC† excluding significant items of 39%
Strong growth in management fees up 9% on higher AuM
Performance and placement revenue fees down 36% compared to exceptional 4Q20 performance fee levels
Operating expenses up 10% reflecting higher variable compensation and expenses related to the SCFF matter
Solid NNA of CHF 4.7 bn driven by Index and our emerging markets joint venture, partly offset by outflows from Fixed Income
Full year 2021
Reported PTI of CHF 300 mn included an impairment of CHF 113 mnrelated to our non-controlling interest in York Capital Management
Adjusted PTI excluding significant items of CHF 417 mn, up 117% YoY; adjusted RoRC† excluding significant items of 47%
Net revenues up CHF 268 mn or 21% YoY, reflecting good momentum across all revenue lines; management fee margin1 stable at 26 bps
Solid NNA of CHF 14.6 bn driven by our emerging markets joint venture, Index, Credit and Equities, partly offset by outflows from Insurance-Linked Strategies and Fixed Income
Continued progress in deleveraging the non-core portfolio in investment and partnership
Adjusted key financials excl. significant items
in CHF mn 4Q21 3Q21 4Q20 2021 2020
Management fees 293 290 269 1,152 1,050
Performance & placement rev. 74 59 115 272 170
Investment & partnership income 20 43 8 145 81
Net revenues 387 392 392 1,569 1,301
Provision for credit losses (2) 1 (6) - -
Total operating expenses 310 276 283 1,152 1,109
Adj. pre-tax income excl. sign. items 79 115 115 417 192
Reported pre-tax income 79 2 (305) 300 (39)
Adj. cost/income ratio excl. sign. items 80% 70% 72% 73% 85%
Adj. RoRC† excl. sign. items 39% 52% 47% 47% 19%
Reported return on regulatory capital† 39% 1% n/m 34% n/m
Key metrics
in CHF bn 4Q21 3Q21 4Q20 2021 2020
Assets under management 477 475 440 477 440
Net new assets 4.7 (1.7) 6.3 14.6 15.5
Risk-weighted assets 8 8 9 8 9
Leverage exposure 3 3 3 3 3

32February 10, 2022
2022 will be a transition year
1Q22 results to reflect normalization of the market environment from the exceptional levels of 1Q21
Improving franchise momentum after weak start to January, including positive YTD NNA in our WM business
Higher compensation and restructuring costs to increase 2022 expenses
2022 will be a year of tightening monetary policy
Note: Estimates and assumptions are based on currently available information and beliefs, expectations and opinions of management and include all known facts and decisions as of February 10, 2022.Actual results may differ

Concluding Remarks
33February 10, 2022

34February 10, 2022
Concluding Remarks: priorities for 2022
Further strengthen risk culture
Accelerate client and revenue momentum
Execute strategic plan

February 10, 2022 35
Top Related
Copyright © 2022 FDOKUMEN

