


Bahasa
Halaman
Hukum

Dynamic Article LinksC<Analyst
Cite this: Analyst, 2012, 137, 2706
www.rsc.org/analyst PAPER
Dow
nloa
ded
by E
CO
LE
PO
LY
TE
CH
NIC
FE
D D
E L
AU
SAN
NE
on
20 J
uly
2012
Publ
ishe
d on
27
Mar
ch 2
012
on h
ttp://
pubs
.rsc
.org
| do
i:10.
1039
/C2A
N35
182J
View Online / Journal Homepage / Table of Contents for this issue
Construction of an electrochemical sensor based on the electrodeposition ofAu–Pt nanoparticles mixtures on multi-walled carbon nanotubes film forvoltammetric determination of cefotaxime†
Saeed Shahrokhian*ab and Shokoufeh Rastgara
Received 8th February 2012, Accepted 26th March 2012
DOI: 10.1039/c2an35182j
Mixtures of gold–platinum nanoparticles (Au–PtNPs) are fabricated consecutively on a multi-walled
carbon nanotubes (MWNT) coated glassy carbon electrode (GCE) by the electrodeposition method.
The surface morphology and nature of the hybrid film (Au–PtNPs/MWCNT) deposited on glassy
carbon electrodes is characterized by scanning electron microscopy (SEM), energy dispersive X-ray
spectroscopy (EDS), X-ray diffraction (XRD), electrochemical impedance spectroscopy (EIS) and
cyclic voltammetry (CV) techniques. The modified electrode is used as a new and sensitive
electrochemical sensor for the voltammetric determination of cefotaxime (CFX). The electrochemical
behavior of CFX is investigated on the surface of the modified electrode using linear sweep
voltammetry (LSV). The results of voltammetric studies exhibited a considerable improvement in the
oxidation peak current of CFX compared to glassy carbon electrodes individually coated with
MWCNT or Au–PtNPs. Under the optimized conditions, the modified electrode showed a wide linear
dynamic range of 0.004–10.0 mMwith a detection limit of 1.0 nM for the voltammetric determination of
CFX. The modified electrode was successfully applied for the accurate determination of trace amounts
of CFX in pharmaceutical and clinical preparations.
1 Introduction
In recent years, metal nanoparticles have drawn great interest in
electrochemical studies because of their roles and favorable
features in the fields of catalysis and sensor technology.1–5
Bimetallic nanoparticles, in particular, show many favorable
properties for researchers in comparison with the corresponding
monometallic counterparts, which include high catalytic activity,
catalytic selectivity, and better resistance to the deactivation
difficulties. These bimetallic nanostructures have received much
attention because of the modification characteristics observed
not only due to the effects of nanoparticles size, but also as
a result of the combination of different metals.6–11 Carbon
nanotubes (CNTs) as a catalyst-support material have drawn
greater interest over the other carbon based supporting materials
because of their large accessible surface areas, high stability, and
high electron conductivity.12–14 In principle, MWNTs are seam-
less cylinders, but they often have defect sites, where the
attachment of metallic nanoparticles most likely occurs.15 Several
aDepartment of Chemistry, Sharif University of Technology, Tehran11155-9516, Iran. E-mail: [email protected]; Fax: +98-21-66002983; Tel: +98-21-66005718bInstitute for Nanoscience and Technology, Sharif University ofTechnology, Tehran, Iran
† Electronic supplementary information (ESI) available. See DOI:10.1039/c2an35182j
2706 | Analyst, 2012, 137, 2706–2715
reports have demonstrated that uniform adsorption of metallic
(or bimetallic) nanoparticles on CNT surfaces can offer new
opportunities for the development of new sensors with high
analytical performances.16–18 It is well-known that the
morphology and response characteristics of metal NPs greatly
depend on their size, distribution and composition of nano-
particles. Therefore, it is important to develop effective methods
for the preparation of nanoparticles with well-controlled
composition, shape and size. Several methods have been
proposed for the deposition of metal (or bi-metal) NPs on carbon
nanotubes.19–23 Electrochemical techniques are particularly
attractive for the electrodeposition of metallic nanostructures on
the surface of the electrode not for mass preparation in the bulk
solution. In this method, various experimental parameters
including solution composition, potential and time of deposition
can be manipulated to control the nucleation and growth rate of
the metal NPs.24–26 Finally, electrochemical deposition is a clean,
rapid and facile synthesis that facilitates control over the size and
distribution of NPs, we can then use these nanoparticles with
different morphologies and features in sensor applications.
Among the various bimetallic nanoparticles based carbon
nanotubes, Au–PtNPs have more potential applications in the
area of the electrocatalysts,27–30 electrochemical sensors31–34 and
biosensors.35–38 Due to these advantages of bimetallic nano-
particles, it becomes significant to develop Au–Pt nanoparticles
for application in electrochemical sensors with appropriate
This journal is ª The Royal Society of Chemistry 2012
Dow
nloa
ded
by E
CO
LE
PO
LY
TE
CH
NIC
FE
D D
E L
AU
SAN
NE
on
20 J
uly
2012
Publ
ishe
d on
27
Mar
ch 2
012
on h
ttp://
pubs
.rsc
.org
| do
i:10.
1039
/C2A
N35
182J
View Online
characteristics such as high sensitivity, fast response time, wide
linear range, better repeatability and reproducibility.
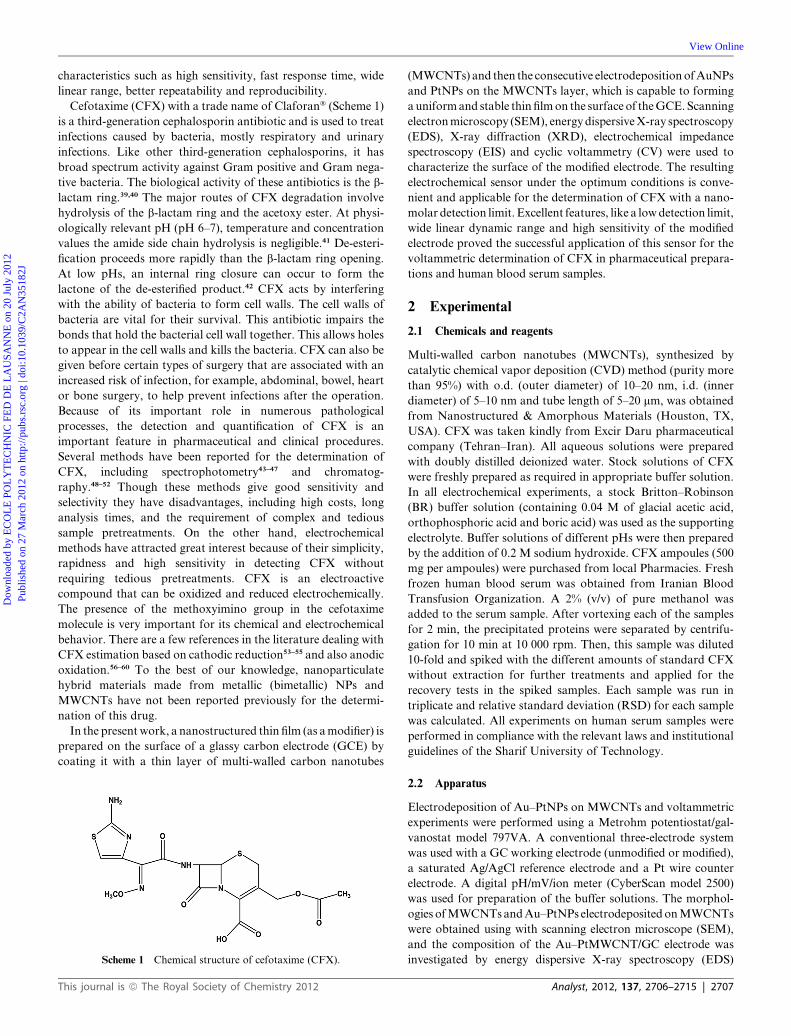
Cefotaxime (CFX) with a trade name of Claforan� (Scheme 1)
is a third-generation cephalosporin antibiotic and is used to treat
infections caused by bacteria, mostly respiratory and urinary
infections. Like other third-generation cephalosporins, it has
broad spectrum activity against Gram positive and Gram nega-
tive bacteria. The biological activity of these antibiotics is the b-
lactam ring.39,40 The major routes of CFX degradation involve
hydrolysis of the b-lactam ring and the acetoxy ester. At physi-
ologically relevant pH (pH 6–7), temperature and concentration
values the amide side chain hydrolysis is negligible.41 De-esteri-
fication proceeds more rapidly than the b-lactam ring opening.
At low pHs, an internal ring closure can occur to form the
lactone of the de-esterified product.42 CFX acts by interfering
with the ability of bacteria to form cell walls. The cell walls of
bacteria are vital for their survival. This antibiotic impairs the
bonds that hold the bacterial cell wall together. This allows holes
to appear in the cell walls and kills the bacteria. CFX can also be
given before certain types of surgery that are associated with an
increased risk of infection, for example, abdominal, bowel, heart
or bone surgery, to help prevent infections after the operation.
Because of its important role in numerous pathological
processes, the detection and quantification of CFX is an
important feature in pharmaceutical and clinical procedures.
Several methods have been reported for the determination of
CFX, including spectrophotometry43–47 and chromatog-
raphy.48–52 Though these methods give good sensitivity and
selectivity they have disadvantages, including high costs, long
analysis times, and the requirement of complex and tedious
sample pretreatments. On the other hand, electrochemical
methods have attracted great interest because of their simplicity,
rapidness and high sensitivity in detecting CFX without
requiring tedious pretreatments. CFX is an electroactive
compound that can be oxidized and reduced electrochemically.
The presence of the methoxyimino group in the cefotaxime
molecule is very important for its chemical and electrochemical
behavior. There are a few references in the literature dealing with
CFX estimation based on cathodic reduction53–55 and also anodic
oxidation.56–60 To the best of our knowledge, nanoparticulate
hybrid materials made from metallic (bimetallic) NPs and
MWCNTs have not been reported previously for the determi-
nation of this drug.
In the present work, a nanostructured thin film (as amodifier) is
prepared on the surface of a glassy carbon electrode (GCE) by
coating it with a thin layer of multi-walled carbon nanotubes
Scheme 1 Chemical structure of cefotaxime (CFX).
This journal is ª The Royal Society of Chemistry 2012
(MWCNTs) and then the consecutive electrodepositionofAuNPs
and PtNPs on the MWCNTs layer, which is capable to forming
auniformand stable thin filmon the surface of theGCE. Scanning
electronmicroscopy (SEM), energydispersiveX-ray spectroscopy
(EDS), X-ray diffraction (XRD), electrochemical impedance
spectroscopy (EIS) and cyclic voltammetry (CV) were used to
characterize the surface of the modified electrode. The resulting
electrochemical sensor under the optimum conditions is conve-
nient and applicable for the determination of CFX with a nano-
molar detection limit. Excellent features, like a lowdetection limit,
wide linear dynamic range and high sensitivity of the modified
electrode proved the successful application of this sensor for the
voltammetric determination of CFX in pharmaceutical prepara-
tions and human blood serum samples.
2 Experimental
2.1 Chemicals and reagents
Multi-walled carbon nanotubes (MWCNTs), synthesized by
catalytic chemical vapor deposition (CVD) method (purity more
than 95%) with o.d. (outer diameter) of 10–20 nm, i.d. (inner
diameter) of 5–10 nm and tube length of 5–20 mm, was obtained
from Nanostructured & Amorphous Materials (Houston, TX,
USA). CFX was taken kindly from Excir Daru pharmaceutical
company (Tehran–Iran). All aqueous solutions were prepared
with doubly distilled deionized water. Stock solutions of CFX
were freshly prepared as required in appropriate buffer solution.
In all electrochemical experiments, a stock Britton–Robinson
(BR) buffer solution (containing 0.04 M of glacial acetic acid,
orthophosphoric acid and boric acid) was used as the supporting
electrolyte. Buffer solutions of different pHs were then prepared
by the addition of 0.2 M sodium hydroxide. CFX ampoules (500
mg per ampoules) were purchased from local Pharmacies. Fresh
frozen human blood serum was obtained from Iranian Blood
Transfusion Organization. A 2% (v/v) of pure methanol was
added to the serum sample. After vortexing each of the samples
for 2 min, the precipitated proteins were separated by centrifu-
gation for 10 min at 10 000 rpm. Then, this sample was diluted
10-fold and spiked with the different amounts of standard CFX
without extraction for further treatments and applied for the
recovery tests in the spiked samples. Each sample was run in
triplicate and relative standard deviation (RSD) for each sample
was calculated. All experiments on human serum samples were
performed in compliance with the relevant laws and institutional
guidelines of the Sharif University of Technology.
2.2 Apparatus
Electrodeposition of Au–PtNPs on MWCNTs and voltammetric
experiments were performed using a Metrohm potentiostat/gal-
vanostat model 797VA. A conventional three-electrode system
was used with a GC working electrode (unmodified or modified),
a saturated Ag/AgCl reference electrode and a Pt wire counter
electrode. A digital pH/mV/ion meter (CyberScan model 2500)
was used for preparation of the buffer solutions. The morphol-
ogies ofMWCNTsandAu–PtNPs electrodepositedonMWCNTs
were obtained using with scanning electron microscope (SEM),
and the composition of the Au–PtMWCNT/GC electrode was
investigated by energy dispersive X-ray spectroscopy (EDS)
Analyst, 2012, 137, 2706–2715 | 2707
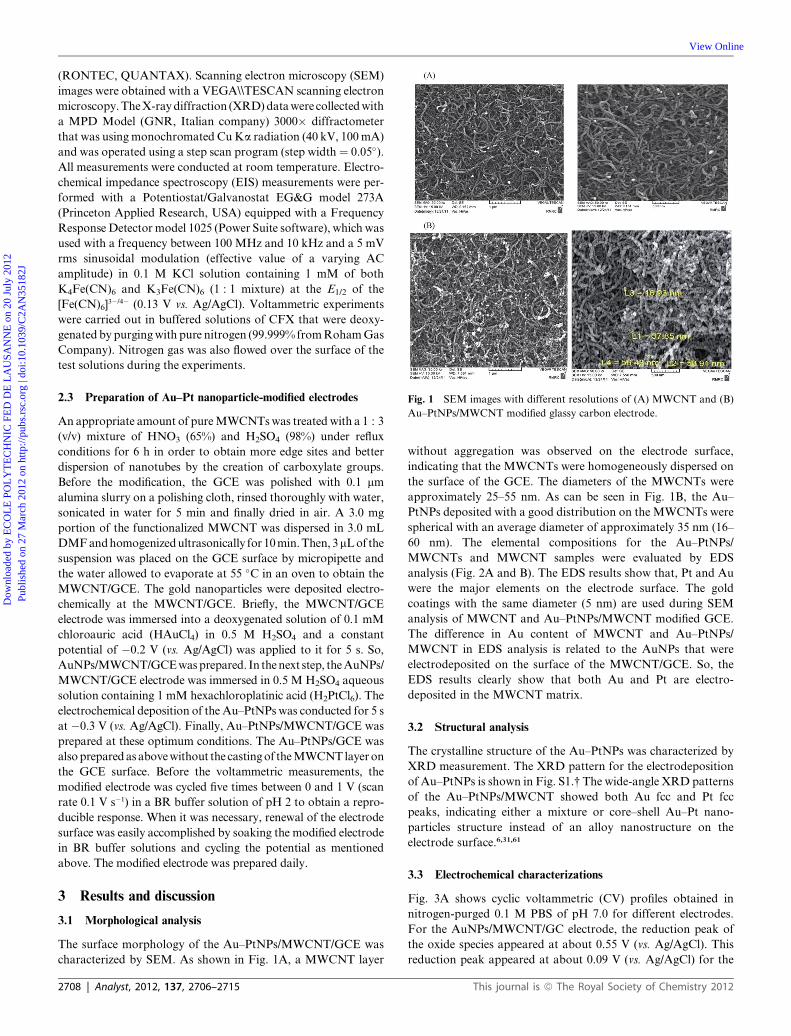
Fig. 1 SEM images with different resolutions of (A) MWCNT and (B)
Au–PtNPs/MWCNT modified glassy carbon electrode.
Dow
nloa
ded
by E
CO
LE
PO
LY
TE
CH
NIC
FE
D D
E L
AU
SAN
NE
on
20 J
uly
2012
Publ
ishe
d on
27
Mar
ch 2
012
on h
ttp://
pubs
.rsc
.org
| do
i:10.
1039
/C2A
N35
182J
View Online
(RONTEC, QUANTAX). Scanning electron microscopy (SEM)
images were obtained with a VEGA\\TESCAN scanning electron
microscopy.TheX-raydiffraction (XRD)datawere collectedwith
a MPD Model (GNR, Italian company) 3000� diffractometer
that was usingmonochromated CuKa radiation (40 kV, 100mA)
and was operated using a step scan program (step width¼ 0.05�).All measurements were conducted at room temperature. Electro-
chemical impedance spectroscopy (EIS) measurements were per-
formed with a Potentiostat/Galvanostat EG&G model 273A
(Princeton Applied Research, USA) equipped with a Frequency
ResponseDetector model 1025 (Power Suite software), which was
used with a frequency between 100 MHz and 10 kHz and a 5 mV
rms sinusoidal modulation (effective value of a varying AC
amplitude) in 0.1 M KCl solution containing 1 mM of both
K4Fe(CN)6 and K3Fe(CN)6 (1 : 1 mixture) at the E1/2 of the
[Fe(CN)6]3�/4� (0.13 V vs. Ag/AgCl). Voltammetric experiments
were carried out in buffered solutions of CFX that were deoxy-
genated by purgingwith pure nitrogen (99.999% fromRohamGas
Company). Nitrogen gas was also flowed over the surface of the
test solutions during the experiments.
2.3 Preparation of Au–Pt nanoparticle-modified electrodes
An appropriate amount of pureMWCNTswas treated with a 1 : 3
(v/v) mixture of HNO3 (65%) and H2SO4 (98%) under reflux
conditions for 6 h in order to obtain more edge sites and better
dispersion of nanotubes by the creation of carboxylate groups.
Before the modification, the GCE was polished with 0.1 mm
alumina slurry on a polishing cloth, rinsed thoroughly with water,
sonicated in water for 5 min and finally dried in air. A 3.0 mg
portion of the functionalized MWCNT was dispersed in 3.0 mL
DMFandhomogenizedultrasonically for 10min.Then, 3mLof the
suspension was placed on the GCE surface by micropipette and
the water allowed to evaporate at 55 �C in an oven to obtain the
MWCNT/GCE. The gold nanoparticles were deposited electro-
chemically at the MWCNT/GCE. Briefly, the MWCNT/GCE
electrode was immersed into a deoxygenated solution of 0.1 mM
chloroauric acid (HAuCl4) in 0.5 M H2SO4 and a constant
potential of �0.2 V (vs. Ag/AgCl) was applied to it for 5 s. So,
AuNPs/MWCNT/GCEwasprepared. In thenext step, theAuNPs/
MWCNT/GCE electrode was immersed in 0.5 M H2SO4 aqueous
solution containing 1 mM hexachloroplatinic acid (H2PtCl6). The
electrochemical deposition of the Au–PtNPs was conducted for 5 s
at �0.3 V (vs. Ag/AgCl). Finally, Au–PtNPs/MWCNT/GCE was
prepared at these optimum conditions. The Au–PtNPs/GCE was
alsopreparedas abovewithout the castingof theMWCNTlayeron
the GCE surface. Before the voltammetric measurements, the
modified electrode was cycled five times between 0 and 1 V (scan
rate 0.1 V s�1) in a BR buffer solution of pH 2 to obtain a repro-
ducible response. When it was necessary, renewal of the electrode
surface was easily accomplished by soaking the modified electrode
in BR buffer solutions and cycling the potential as mentioned
above. The modified electrode was prepared daily.
3 Results and discussion
3.1 Morphological analysis
The surface morphology of the Au–PtNPs/MWCNT/GCE was
characterized by SEM. As shown in Fig. 1A, a MWCNT layer
2708 | Analyst, 2012, 137, 2706–2715
without aggregation was observed on the electrode surface,
indicating that the MWCNTs were homogeneously dispersed on
the surface of the GCE. The diameters of the MWCNTs were
approximately 25–55 nm. As can be seen in Fig. 1B, the Au–
PtNPs deposited with a good distribution on the MWCNTs were
spherical with an average diameter of approximately 35 nm (16–
60 nm). The elemental compositions for the Au–PtNPs/
MWCNTs and MWCNT samples were evaluated by EDS
analysis (Fig. 2A and B). The EDS results show that, Pt and Au
were the major elements on the electrode surface. The gold
coatings with the same diameter (5 nm) are used during SEM
analysis of MWCNT and Au–PtNPs/MWCNT modified GCE.
The difference in Au content of MWCNT and Au–PtNPs/
MWCNT in EDS analysis is related to the AuNPs that were
electrodeposited on the surface of the MWCNT/GCE. So, the
EDS results clearly show that both Au and Pt are electro-
deposited in the MWCNT matrix.
3.2 Structural analysis
The crystalline structure of the Au–PtNPs was characterized by
XRD measurement. The XRD pattern for the electrodeposition
of Au–PtNPs is shown in Fig. S1.† The wide-angle XRD patterns
of the Au–PtNPs/MWCNT showed both Au fcc and Pt fcc
peaks, indicating either a mixture or core–shell Au–Pt nano-
particles structure instead of an alloy nanostructure on the
electrode surface.6,31,61
3.3 Electrochemical characterizations
Fig. 3A shows cyclic voltammetric (CV) profiles obtained in
nitrogen-purged 0.1 M PBS of pH 7.0 for different electrodes.
For the AuNPs/MWCNT/GC electrode, the reduction peak of
the oxide species appeared at about 0.55 V (vs. Ag/AgCl). This
reduction peak appeared at about 0.09 V (vs. Ag/AgCl) for the
This journal is ª The Royal Society of Chemistry 2012
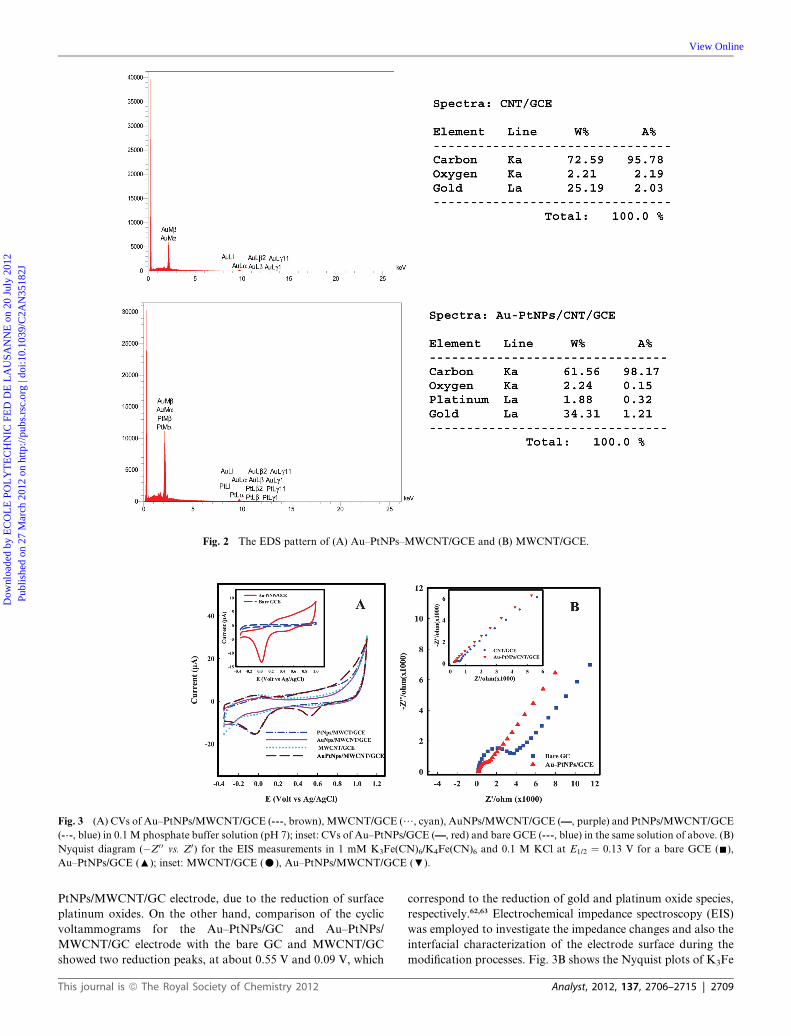
Fig. 2 The EDS pattern of (A) Au–PtNPs–MWCNT/GCE and (B) MWCNT/GCE.
Fig. 3 (A) CVs of Au–PtNPs/MWCNT/GCE (----, brown), MWCNT/GCE (/, cyan), AuNPs/MWCNT/GCE (——, purple) and PtNPs/MWCNT/GCE
(--.-, blue) in 0.1 M phosphate buffer solution (pH 7); inset: CVs of Au–PtNPs/GCE (——, red) and bare GCE (----, blue) in the same solution of above. (B)
Nyquist diagram (�Z0 0 vs. Z0) for the EIS measurements in 1 mM K3Fe(CN)6/K4Fe(CN)6 and 0.1 M KCl at E1/2 ¼ 0.13 V for a bare GCE (-),
Au–PtNPs/GCE (:); inset: MWCNT/GCE (C), Au–PtNPs/MWCNT/GCE (;).
Dow
nloa
ded
by E
CO
LE
PO
LY
TE
CH
NIC
FE
D D
E L
AU
SAN
NE
on
20 J
uly
2012
Publ
ishe
d on
27
Mar
ch 2
012
on h
ttp://
pubs
.rsc
.org
| do
i:10.
1039
/C2A
N35
182J
View Online
PtNPs/MWCNT/GC electrode, due to the reduction of surface
platinum oxides. On the other hand, comparison of the cyclic
voltammograms for the Au–PtNPs/GC and Au–PtNPs/
MWCNT/GC electrode with the bare GC and MWCNT/GC
showed two reduction peaks, at about 0.55 V and 0.09 V, which
This journal is ª The Royal Society of Chemistry 2012
correspond to the reduction of gold and platinum oxide species,
respectively.62,63 Electrochemical impedance spectroscopy (EIS)
was employed to investigate the impedance changes and also the
interfacial characterization of the electrode surface during the
modification processes. Fig. 3B shows the Nyquist plots of K3Fe
Analyst, 2012, 137, 2706–2715 | 2709
Dow
nloa
ded
by E
CO
LE
PO
LY
TE
CH
NIC
FE
D D
E L
AU
SAN
NE
on
20 J
uly
2012
Publ
ishe
d on
27
Mar
ch 2
012
on h
ttp://
pubs
.rsc
.org
| do
i:10.
1039
/C2A
N35
182J
View Online
(CN)6/K4Fe(CN)6 at the bare GC, Au–PtNPs/GC, MWCNT/
GC and the Au–PtNPs/MWCNT/GC. A semicircle with a large
diameter is observed at the surface of the bare GC. The diameter
of this semicircle is reduced at the Au–PtNPs/GC and Au–
PtNPs/MWCNT/GC compared to the bare GC and MWCNT/
GC, respectively. These results suggest that the surface of the
Au–PtNPs/MWCNT modified electrode exhibits lower electron-
transfer resistance and greatly increases the electron-transfer
rate. The observed improvements are attributed to a synergistic
enhancement rather than merely the combination of bimetallic
Au–Pt nanoparticles and carbon nanotube layers. The EIS
changes during the modification process also indicated that the
Au–PtNPs/MWCNT layer was firmly immobilized on the
surface of the GC electrode.
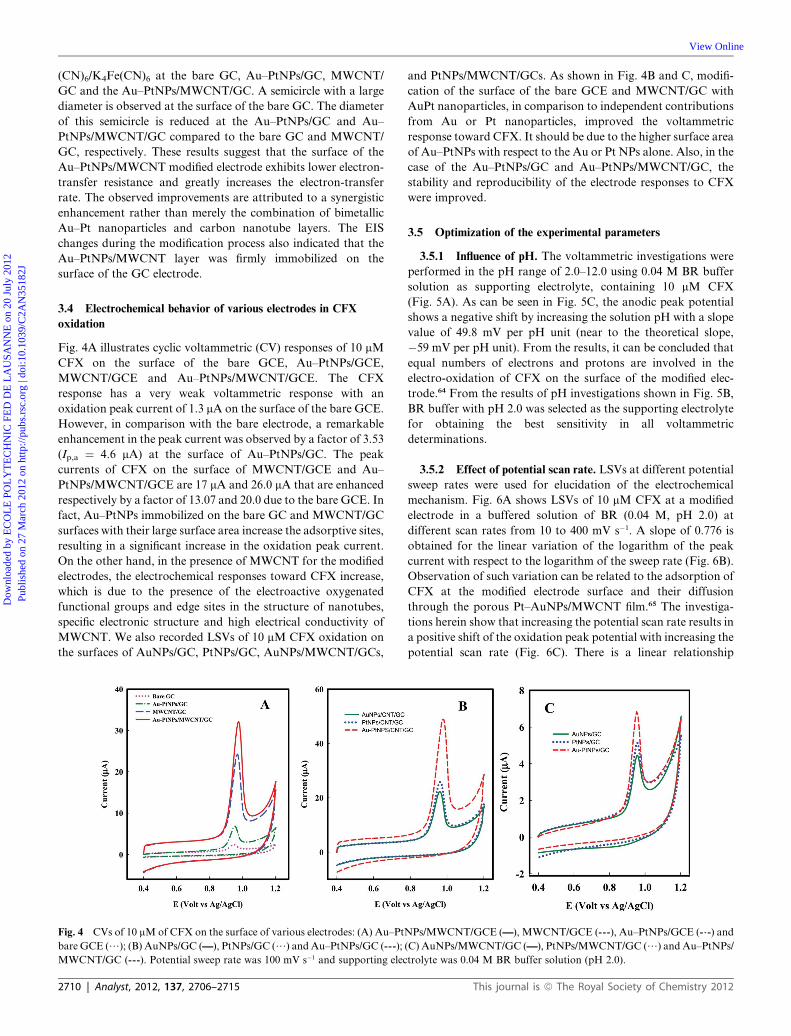
3.4 Electrochemical behavior of various electrodes in CFX
oxidation
Fig. 4A illustrates cyclic voltammetric (CV) responses of 10 mM
CFX on the surface of the bare GCE, Au–PtNPs/GCE,
MWCNT/GCE and Au–PtNPs/MWCNT/GCE. The CFX
response has a very weak voltammetric response with an
oxidation peak current of 1.3 mA on the surface of the bare GCE.
However, in comparison with the bare electrode, a remarkable
enhancement in the peak current was observed by a factor of 3.53
(Ip,a ¼ 4.6 mA) at the surface of Au–PtNPs/GC. The peak
currents of CFX on the surface of MWCNT/GCE and Au–
PtNPs/MWCNT/GCE are 17 mA and 26.0 mA that are enhanced
respectively by a factor of 13.07 and 20.0 due to the bare GCE. In
fact, Au–PtNPs immobilized on the bare GC and MWCNT/GC
surfaces with their large surface area increase the adsorptive sites,
resulting in a significant increase in the oxidation peak current.
On the other hand, in the presence of MWCNT for the modified
electrodes, the electrochemical responses toward CFX increase,
which is due to the presence of the electroactive oxygenated
functional groups and edge sites in the structure of nanotubes,
specific electronic structure and high electrical conductivity of
MWCNT. We also recorded LSVs of 10 mM CFX oxidation on
the surfaces of AuNPs/GC, PtNPs/GC, AuNPs/MWCNT/GCs,
Fig. 4 CVs of 10 mMof CFX on the surface of various electrodes: (A) Au–PtN
bare GCE (/); (B) AuNPs/GC (——), PtNPs/GC (/) and Au–PtNPs/GC (----);
MWCNT/GC (----). Potential sweep rate was 100 mV s�1 and supporting elec
2710 | Analyst, 2012, 137, 2706–2715
and PtNPs/MWCNT/GCs. As shown in Fig. 4B and C, modifi-
cation of the surface of the bare GCE and MWCNT/GC with
AuPt nanoparticles, in comparison to independent contributions
from Au or Pt nanoparticles, improved the voltammetric
response toward CFX. It should be due to the higher surface area
of Au–PtNPs with respect to the Au or Pt NPs alone. Also, in the
case of the Au–PtNPs/GC and Au–PtNPs/MWCNT/GC, the
stability and reproducibility of the electrode responses to CFX
were improved.
3.5 Optimization of the experimental parameters
3.5.1 Influence of pH. The voltammetric investigations were
performed in the pH range of 2.0–12.0 using 0.04 M BR buffer
solution as supporting electrolyte, containing 10 mM CFX
(Fig. 5A). As can be seen in Fig. 5C, the anodic peak potential
shows a negative shift by increasing the solution pH with a slope
value of 49.8 mV per pH unit (near to the theoretical slope,
�59 mV per pH unit). From the results, it can be concluded that
equal numbers of electrons and protons are involved in the
electro-oxidation of CFX on the surface of the modified elec-
trode.64 From the results of pH investigations shown in Fig. 5B,
BR buffer with pH 2.0 was selected as the supporting electrolyte
for obtaining the best sensitivity in all voltammetric
determinations.
3.5.2 Effect of potential scan rate. LSVs at different potential
sweep rates were used for elucidation of the electrochemical
mechanism. Fig. 6A shows LSVs of 10 mM CFX at a modified
electrode in a buffered solution of BR (0.04 M, pH 2.0) at
different scan rates from 10 to 400 mV s�1. A slope of 0.776 is
obtained for the linear variation of the logarithm of the peak
current with respect to the logarithm of the sweep rate (Fig. 6B).
Observation of such variation can be related to the adsorption of
CFX at the modified electrode surface and their diffusion
through the porous Pt–AuNPs/MWCNT film.65 The investiga-
tions herein show that increasing the potential scan rate results in
a positive shift of the oxidation peak potential with increasing the
potential scan rate (Fig. 6C). There is a linear relationship
Ps/MWCNT/GCE (——), MWCNT/GCE (----), Au–PtNPs/GCE (--.-) and
(C) AuNPs/MWCNT/GC (——), PtNPs/MWCNT/GC (/) and Au–PtNPs/
trolyte was 0.04 M BR buffer solution (pH 2.0).
This journal is ª The Royal Society of Chemistry 2012
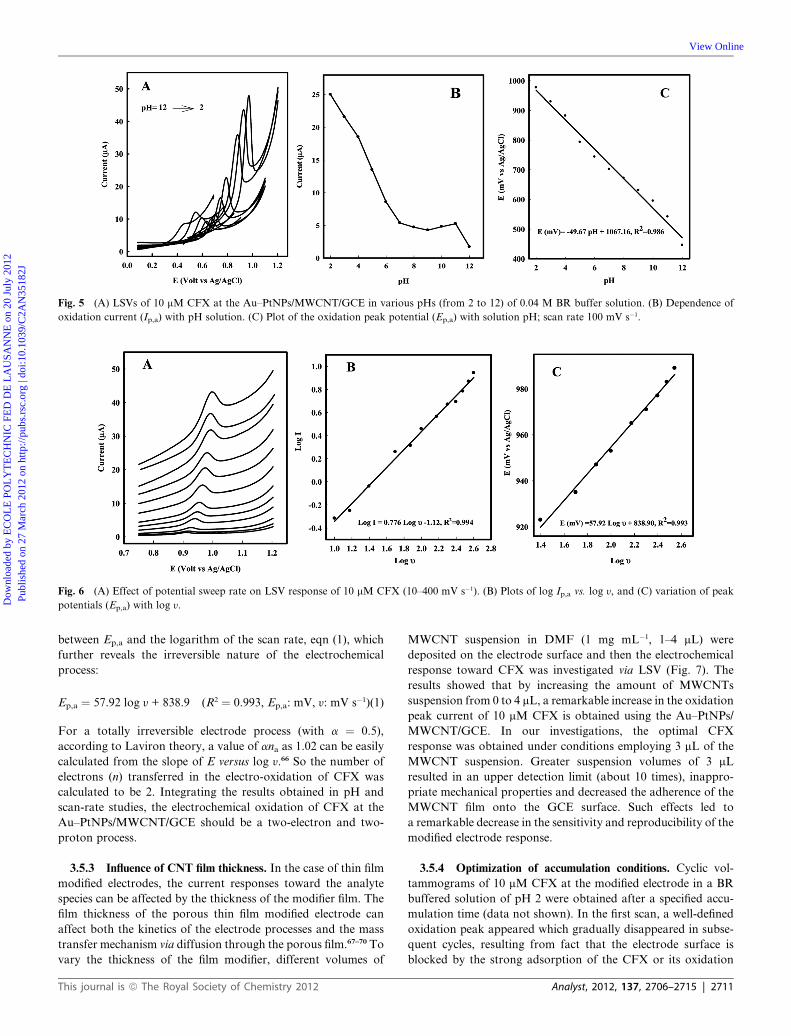
Fig. 5 (A) LSVs of 10 mM CFX at the Au–PtNPs/MWCNT/GCE in various pHs (from 2 to 12) of 0.04 M BR buffer solution. (B) Dependence of
oxidation current (Ip,a) with pH solution. (C) Plot of the oxidation peak potential (Ep,a) with solution pH; scan rate 100 mV s�1.
Fig. 6 (A) Effect of potential sweep rate on LSV response of 10 mM CFX (10–400 mV s�1). (B) Plots of log Ip,a vs. log y, and (C) variation of peak
potentials (Ep,a) with log y.Dow
nloa
ded
by E
CO
LE
PO
LY
TE
CH
NIC
FE
D D
E L
AU
SAN
NE
on
20 J
uly
2012
Publ
ishe
d on
27
Mar
ch 2
012
on h
ttp://
pubs
.rsc
.org
| do
i:10.
1039
/C2A
N35
182J
View Online
between Ep,a and the logarithm of the scan rate, eqn (1), which
further reveals the irreversible nature of the electrochemical
process:
Ep,a ¼ 57.92 log y + 838.9 (R2 ¼ 0.993, Ep,a: mV, y: mV s�1)(1)
For a totally irreversible electrode process (with a ¼ 0.5),
according to Laviron theory, a value of ana as 1.02 can be easily
calculated from the slope of E versus log y.66 So the number of
electrons (n) transferred in the electro-oxidation of CFX was
calculated to be 2. Integrating the results obtained in pH and
scan-rate studies, the electrochemical oxidation of CFX at the
Au–PtNPs/MWCNT/GCE should be a two-electron and two-
proton process.
3.5.3 Influence of CNT film thickness. In the case of thin film
modified electrodes, the current responses toward the analyte
species can be affected by the thickness of the modifier film. The
film thickness of the porous thin film modified electrode can
affect both the kinetics of the electrode processes and the mass
transfer mechanism via diffusion through the porous film.67–70 To
vary the thickness of the film modifier, different volumes of
This journal is ª The Royal Society of Chemistry 2012
MWCNT suspension in DMF (1 mg mL�1, 1–4 mL) were
deposited on the electrode surface and then the electrochemical
response toward CFX was investigated via LSV (Fig. 7). The
results showed that by increasing the amount of MWCNTs
suspension from 0 to 4 mL, a remarkable increase in the oxidation
peak current of 10 mM CFX is obtained using the Au–PtNPs/
MWCNT/GCE. In our investigations, the optimal CFX
response was obtained under conditions employing 3 mL of the
MWCNT suspension. Greater suspension volumes of 3 mL
resulted in an upper detection limit (about 10 times), inappro-
priate mechanical properties and decreased the adherence of the
MWCNT film onto the GCE surface. Such effects led to
a remarkable decrease in the sensitivity and reproducibility of the
modified electrode response.
3.5.4 Optimization of accumulation conditions. Cyclic vol-
tammograms of 10 mM CFX at the modified electrode in a BR
buffered solution of pH 2 were obtained after a specified accu-
mulation time (data not shown). In the first scan, a well-defined
oxidation peak appeared which gradually disappeared in subse-
quent cycles, resulting from fact that the electrode surface is
blocked by the strong adsorption of the CFX or its oxidation
Analyst, 2012, 137, 2706–2715 | 2711
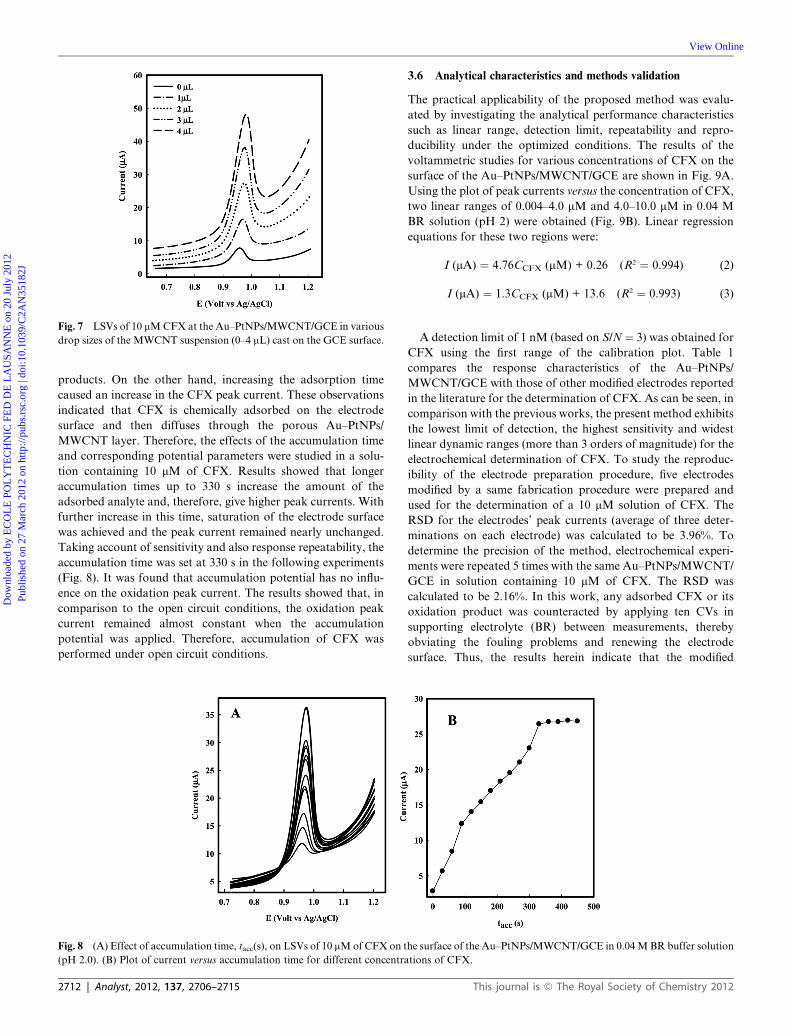
Fig. 7 LSVs of 10 mMCFX at the Au–PtNPs/MWCNT/GCE in various
drop sizes of the MWCNT suspension (0–4 mL) cast on the GCE surface.
Dow
nloa
ded
by E
CO
LE
PO
LY
TE
CH
NIC
FE
D D
E L
AU
SAN
NE
on
20 J
uly
2012
Publ
ishe
d on
27
Mar
ch 2
012
on h
ttp://
pubs
.rsc
.org
| do
i:10.
1039
/C2A
N35
182J
View Online
products. On the other hand, increasing the adsorption time
caused an increase in the CFX peak current. These observations
indicated that CFX is chemically adsorbed on the electrode
surface and then diffuses through the porous Au–PtNPs/
MWCNT layer. Therefore, the effects of the accumulation time
and corresponding potential parameters were studied in a solu-
tion containing 10 mM of CFX. Results showed that longer
accumulation times up to 330 s increase the amount of the
adsorbed analyte and, therefore, give higher peak currents. With
further increase in this time, saturation of the electrode surface
was achieved and the peak current remained nearly unchanged.
Taking account of sensitivity and also response repeatability, the
accumulation time was set at 330 s in the following experiments
(Fig. 8). It was found that accumulation potential has no influ-
ence on the oxidation peak current. The results showed that, in
comparison to the open circuit conditions, the oxidation peak
current remained almost constant when the accumulation
potential was applied. Therefore, accumulation of CFX was
performed under open circuit conditions.
Fig. 8 (A) Effect of accumulation time, tacc(s), on LSVs of 10 mMof CFX on t
(pH 2.0). (B) Plot of current versus accumulation time for different concentra
2712 | Analyst, 2012, 137, 2706–2715
3.6 Analytical characteristics and methods validation
The practical applicability of the proposed method was evalu-
ated by investigating the analytical performance characteristics
such as linear range, detection limit, repeatability and repro-
ducibility under the optimized conditions. The results of the
voltammetric studies for various concentrations of CFX on the
surface of the Au–PtNPs/MWCNT/GCE are shown in Fig. 9A.
Using the plot of peak currents versus the concentration of CFX,
two linear ranges of 0.004–4.0 mM and 4.0–10.0 mM in 0.04 M
BR solution (pH 2) were obtained (Fig. 9B). Linear regression
equations for these two regions were:
I (mA) ¼ 4.76CCFX (mM) + 0.26 (R2 ¼ 0.994) (2)
I (mA) ¼ 1.3CCFX (mM) + 13.6 (R2 ¼ 0.993) (3)
A detection limit of 1 nM (based on S/N¼ 3) was obtained for
CFX using the first range of the calibration plot. Table 1
compares the response characteristics of the Au–PtNPs/
MWCNT/GCE with those of other modified electrodes reported
in the literature for the determination of CFX. As can be seen, in
comparison with the previous works, the present method exhibits
the lowest limit of detection, the highest sensitivity and widest
linear dynamic ranges (more than 3 orders of magnitude) for the
electrochemical determination of CFX. To study the reproduc-
ibility of the electrode preparation procedure, five electrodes
modified by a same fabrication procedure were prepared and
used for the determination of a 10 mM solution of CFX. The
RSD for the electrodes’ peak currents (average of three deter-
minations on each electrode) was calculated to be 3.96%. To
determine the precision of the method, electrochemical experi-
ments were repeated 5 times with the same Au–PtNPs/MWCNT/
GCE in solution containing 10 mM of CFX. The RSD was
calculated to be 2.16%. In this work, any adsorbed CFX or its
oxidation product was counteracted by applying ten CVs in
supporting electrolyte (BR) between measurements, thereby
obviating the fouling problems and renewing the electrode
surface. Thus, the results herein indicate that the modified
he surface of the Au–PtNPs/MWCNT/GCE in 0.04MBR buffer solution
tions of CFX.
This journal is ª The Royal Society of Chemistry 2012
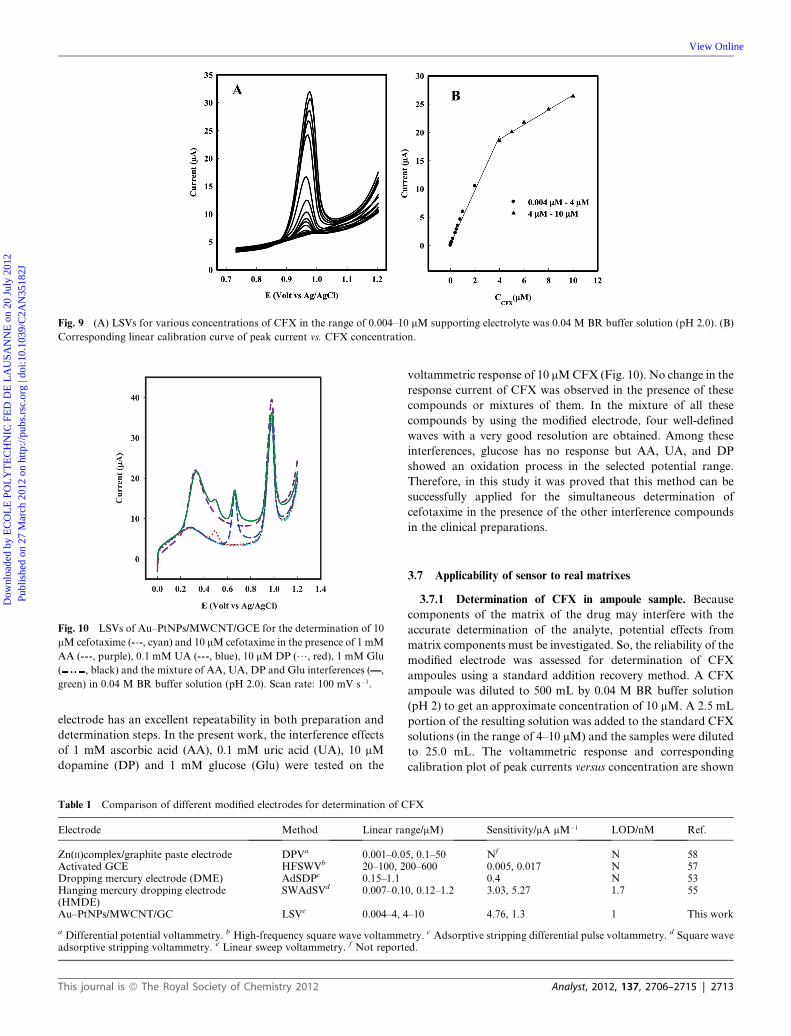
Fig. 9 (A) LSVs for various concentrations of CFX in the range of 0.004–10 mM supporting electrolyte was 0.04 M BR buffer solution (pH 2.0). (B)
Corresponding linear calibration curve of peak current vs. CFX concentration.
Fig. 10 LSVs of Au–PtNPs/MWCNT/GCE for the determination of 10
mM cefotaxime (--.-, cyan) and 10 mM cefotaxime in the presence of 1 mM
AA (----, purple), 0.1 mM UA (----, blue), 10 mM DP (/, red), 1 mM Glu
( , black) and the mixture of AA, UA, DP and Glu interferences (——,
green) in 0.04 M BR buffer solution (pH 2.0). Scan rate: 100 mV s�1.
Dow
nloa
ded
by E
CO
LE
PO
LY
TE
CH
NIC
FE
D D
E L
AU
SAN
NE
on
20 J
uly
2012
Publ
ishe
d on
27
Mar
ch 2
012
on h
ttp://
pubs
.rsc
.org
| do
i:10.
1039
/C2A
N35
182J
View Online
electrode has an excellent repeatability in both preparation and
determination steps. In the present work, the interference effects
of 1 mM ascorbic acid (AA), 0.1 mM uric acid (UA), 10 mM
dopamine (DP) and 1 mM glucose (Glu) were tested on the
Table 1 Comparison of different modified electrodes for determination of C
Electrode Method Linear ra
Zn(II)complex/graphite paste electrode DPVa 0.001–0.0Activated GCE HFSWVb 20–100, 2Dropping mercury electrode (DME) AdSDPc 0.15–1.1Hanging mercury dropping electrode(HMDE)
SWAdSVd 0.007–0.1
Au–PtNPs/MWCNT/GC LSVe 0.004–4, 4
a Differential potential voltammetry. b High-frequency square wave voltammeadsorptive stripping voltammetry. e Linear sweep voltammetry. f Not report
This journal is ª The Royal Society of Chemistry 2012
voltammetric response of 10 mMCFX (Fig. 10). No change in the
response current of CFX was observed in the presence of these
compounds or mixtures of them. In the mixture of all these
compounds by using the modified electrode, four well-defined
waves with a very good resolution are obtained. Among these
interferences, glucose has no response but AA, UA, and DP
showed an oxidation process in the selected potential range.
Therefore, in this study it was proved that this method can be
successfully applied for the simultaneous determination of
cefotaxime in the presence of the other interference compounds
in the clinical preparations.
3.7 Applicability of sensor to real matrixes
3.7.1 Determination of CFX in ampoule sample. Because
components of the matrix of the drug may interfere with the
accurate determination of the analyte, potential effects from
matrix components must be investigated. So, the reliability of the
modified electrode was assessed for determination of CFX
ampoules using a standard addition recovery method. A CFX
ampoule was diluted to 500 mL by 0.04 M BR buffer solution
(pH 2) to get an approximate concentration of 10 mM. A 2.5 mL
portion of the resulting solution was added to the standard CFX
solutions (in the range of 4–10 mM) and the samples were diluted
to 25.0 mL. The voltammetric response and corresponding
calibration plot of peak currents versus concentration are shown
FX
nge/mM) Sensitivity/mA mM�1 LOD/nM Ref.
5, 0.1–50 Nf N 5800–600 0.005, 0.017 N 57
0.4 N 530, 0.12–1.2 3.03, 5.27 1.7 55
–10 4.76, 1.3 1 This work
try. c Adsorptive stripping differential pulse voltammetry. d Square waveed.
Analyst, 2012, 137, 2706–2715 | 2713
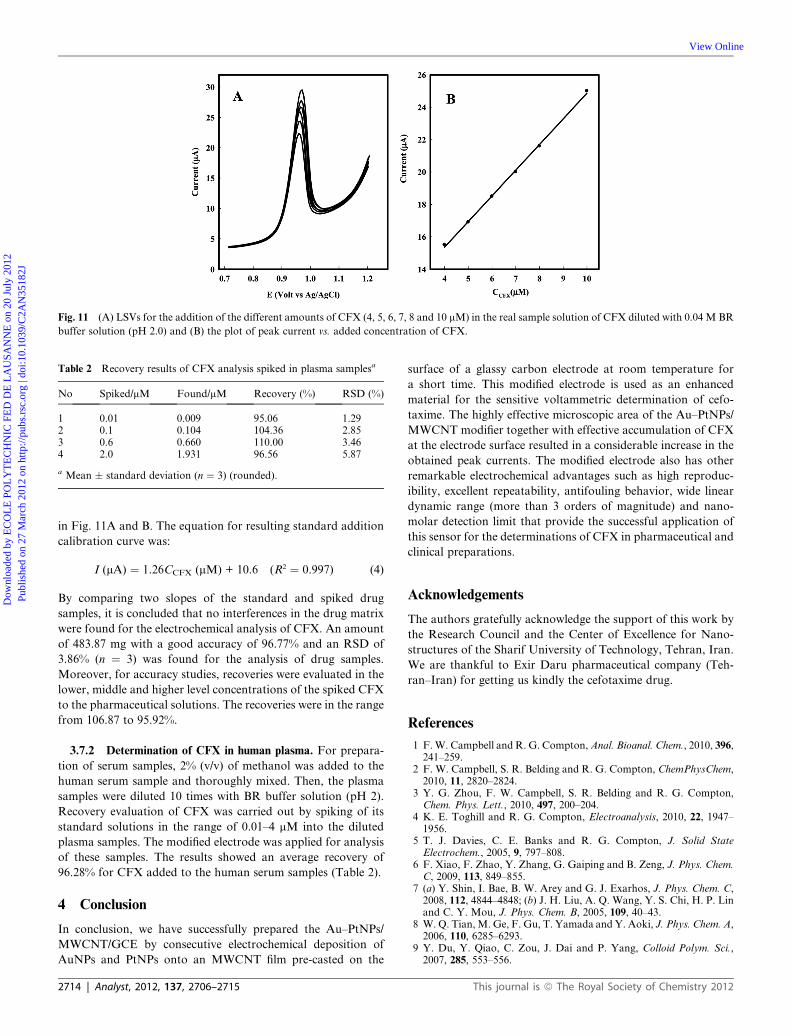
Fig. 11 (A) LSVs for the addition of the different amounts of CFX (4, 5, 6, 7, 8 and 10 mM) in the real sample solution of CFX diluted with 0.04 M BR
buffer solution (pH 2.0) and (B) the plot of peak current vs. added concentration of CFX.
Table 2 Recovery results of CFX analysis spiked in plasma samplesa
No Spiked/mM Found/mM Recovery (%) RSD (%)
1 0.01 0.009 95.06 1.292 0.1 0.104 104.36 2.853 0.6 0.660 110.00 3.464 2.0 1.931 96.56 5.87
a Mean � standard deviation (n ¼ 3) (rounded).
Dow
nloa
ded
by E
CO
LE
PO
LY
TE
CH
NIC
FE
D D
E L
AU
SAN
NE
on
20 J
uly
2012
Publ
ishe
d on
27
Mar
ch 2
012
on h
ttp://
pubs
.rsc
.org
| do
i:10.
1039
/C2A
N35
182J
View Online
in Fig. 11A and B. The equation for resulting standard addition
calibration curve was:
I (mA) ¼ 1.26CCFX (mM) + 10.6 (R2 ¼ 0.997) (4)
By comparing two slopes of the standard and spiked drug
samples, it is concluded that no interferences in the drug matrix
were found for the electrochemical analysis of CFX. An amount
of 483.87 mg with a good accuracy of 96.77% and an RSD of
3.86% (n ¼ 3) was found for the analysis of drug samples.
Moreover, for accuracy studies, recoveries were evaluated in the
lower, middle and higher level concentrations of the spiked CFX
to the pharmaceutical solutions. The recoveries were in the range
from 106.87 to 95.92%.
3.7.2 Determination of CFX in human plasma. For prepara-
tion of serum samples, 2% (v/v) of methanol was added to the
human serum sample and thoroughly mixed. Then, the plasma
samples were diluted 10 times with BR buffer solution (pH 2).
Recovery evaluation of CFX was carried out by spiking of its
standard solutions in the range of 0.01–4 mM into the diluted
plasma samples. The modified electrode was applied for analysis
of these samples. The results showed an average recovery of
96.28% for CFX added to the human serum samples (Table 2).
4 Conclusion
In conclusion, we have successfully prepared the Au–PtNPs/
MWCNT/GCE by consecutive electrochemical deposition of
AuNPs and PtNPs onto an MWCNT film pre-casted on the
2714 | Analyst, 2012, 137, 2706–2715
surface of a glassy carbon electrode at room temperature for
a short time. This modified electrode is used as an enhanced
material for the sensitive voltammetric determination of cefo-
taxime. The highly effective microscopic area of the Au–PtNPs/
MWCNT modifier together with effective accumulation of CFX
at the electrode surface resulted in a considerable increase in the
obtained peak currents. The modified electrode also has other
remarkable electrochemical advantages such as high reproduc-
ibility, excellent repeatability, antifouling behavior, wide linear
dynamic range (more than 3 orders of magnitude) and nano-
molar detection limit that provide the successful application of
this sensor for the determinations of CFX in pharmaceutical and
clinical preparations.
Acknowledgements
The authors gratefully acknowledge the support of this work by
the Research Council and the Center of Excellence for Nano-
structures of the Sharif University of Technology, Tehran, Iran.
We are thankful to Exir Daru pharmaceutical company (Teh-
ran–Iran) for getting us kindly the cefotaxime drug.
References
1 F.W. Campbell and R. G. Compton,Anal. Bioanal. Chem., 2010, 396,241–259.
2 F. W. Campbell, S. R. Belding and R. G. Compton, ChemPhysChem,2010, 11, 2820–2824.
3 Y. G. Zhou, F. W. Campbell, S. R. Belding and R. G. Compton,Chem. Phys. Lett., 2010, 497, 200–204.
4 K. E. Toghill and R. G. Compton, Electroanalysis, 2010, 22, 1947–1956.
5 T. J. Davies, C. E. Banks and R. G. Compton, J. Solid StateElectrochem., 2005, 9, 797–808.
6 F. Xiao, F. Zhao, Y. Zhang, G. Gaiping and B. Zeng, J. Phys. Chem.C, 2009, 113, 849–855.
7 (a) Y. Shin, I. Bae, B. W. Arey and G. J. Exarhos, J. Phys. Chem. C,2008, 112, 4844–4848; (b) J. H. Liu, A. Q. Wang, Y. S. Chi, H. P. Linand C. Y. Mou, J. Phys. Chem. B, 2005, 109, 40–43.
8 W. Q. Tian,M. Ge, F. Gu, T. Yamada andY. Aoki, J. Phys. Chem. A,2006, 110, 6285–6293.
9 Y. Du, Y. Qiao, C. Zou, J. Dai and P. Yang, Colloid Polym. Sci.,2007, 285, 553–556.
This journal is ª The Royal Society of Chemistry 2012
Dow
nloa
ded
by E
CO
LE
PO
LY
TE
CH
NIC
FE
D D
E L
AU
SAN
NE
on
20 J
uly
2012
Publ
ishe
d on
27
Mar
ch 2
012
on h
ttp://
pubs
.rsc
.org
| do
i:10.
1039
/C2A
N35
182J
View Online
10 B. E. Roustom, G. Sin�e, G. F�oti and Ch. Comninellis, J. Appl.Electrochem., 2007, 37, 1227–1236.
11 Y. Song, Y. Ma, Y. Wang, J. Di and Y. Tu, Electrochim. Acta, 2010,55, 4909–4914.
12 D. Vairavapandian, P. Vichchulada andM.D. Lay,Anal. Chim. Acta,2008, 626, 119–129.
13 P. Yanez-Sedeno, J. Riu, J. M. Pingarron and F. X. Rius, TrAC,Trends Anal. Chem., 2010, 29, 939–953.
14 C. B. Jacobs, M. J. Peairs and B. J. Venton, Anal. Chim. Acta, 2010,662, 105–127.
15 N.Y.Hsu,C.C.ChienandK.T. Jeng,Appl.Catal.,B, 2008,84, 196–203.16 S. Shahrokhian, M. Ghalkhani, M. Adeli and M. K. Amini, Biosens.
Bioelectron., 2009, 24, 3235–3241.17 M. Ghalkhani, S. Shahrokhian and F. Ghorbani-Bidkorbeh, Talanta,
2009, 80, 31–38.18 S. Shahrokhian and S. Rastgar, Electrochim. Acta, 2011, 58, 125–133.19 S. Arai, M. Endo and N. Kaneko, Carbon, 2004, 42, 641–644.20 B. Rohland, M. Pietrzak, S. Moeller, M.-C. Bunescu, M. Wienecke,
T. Barfels and M. C. Bunescu, Fullerenes, Nanotubes, CarbonNanostruct., 2005, 13, 511–522.
21 W.-X. Chen, J. Y. Lee and Z. Liu, Mater. Lett., 2004, 58, 3166–3169.22 M. Carmo, V. A. Paganin, J. M. Rosolen and E. R. Gonzalez, J.
Power Sources, 2005, 142, 169–176.23 L. Han, W. Wu, F. L. Kirk, J. Luo, M. M. Maye, N. N. Kariuki,
Y. Lin, C. Wang and C.-J. Zhong, Langmuir, 2004, 20, 6019–6025.24 G. G. Wildgoose, C. E. Banks and R. G. Compton, Small, 2006, 2,
182–193.25 T. M. Day, P. R. Unwin and J. V. Macpherson, Nano Lett., 2007, 7,
51–57.26 C. B. Hwang, Y. S. Fu and S. J. Yu, J. Catal., 2000, 195, 336–341.27 L. Yang, J. Chen, X. Zhong, K. Cui, Y. Xu and Y. Kuang, Colloids
Surf., A, 2007, 295, 21–26.28 F. Terzi, C. Zanardi, S. Daolio, M. Fabrizio and R. Seeber,
Electrochim. Acta, 2011, 56, 3673–3678.29 J. Wang, G. Yin, H. Liu, R. Li, R. L. Fleming and X. Sun, J. Power
Sources, 2009, 194, 668–673.30 J. Luo, P. N. Njoki, Y. Lin, D. Mott, L. Wang and C. J. Zhong,
Langmuir, 2006, 22, 2892–2898.31 F. Xiao, Z. Mo, F. Zhao and B. Zeng, Electrochem. Commun., 2008,
10, 1740–1743.32 J. Zhai, M. Huang and S. Dong, Electroanalysis, 2007, 19, 506–509.33 Y. C. Bai, W. D. Zhang, C. H. Chen and J. Q. Zhang, J. Alloys
Compd., 2011, 509, 1029–1033.34 Y. C. Bai and W. D. Zhang, Electroanalysis, 2010, 22, 237–243.35 F. Xiao, F. Zhao, D. Mei, Z. Mo and B. Zeng, Biosens. Bioelectron.,
2009, 24, 3481–3486.36 Y. Zhang, G. Guo, F. Zhao, Z. Mo, F. Xiao and B. Zeng,
Electroanalysis, 2010, 22, 223–228.37 X. Kang, Z. Mai, X. Zou, P. Cai and J. Mo, Anal. Biochem., 2007,
369, 71–79.38 A. Safavi and F. Farjami, Biosens. Bioelectron., 2011, 26, 2547–2552.39 A. Gringauz, Introduction to Medicinal Chemistry, Wiley-VCH, New
York, 1997, p. 216.40 L. P. Morrelli, Analytical Profile of Drug Substances, Academic Press,
1975, vol. 4, p. 21.
This journal is ª The Royal Society of Chemistry 2012
41 S. M. Berge, N. L. Henderson and M. J. Frank, J. Pharm. Sci., 1983,72, 59–63.
42 K. A. Connors, Chemical Stability of Pharmaceuticals, Wiley-Interscience Publication, JohnWiley & Sons, NewYork, 1986, p. 302.
43 D. Chen, H.Wang, Z. Zhang, L. Ci and X. Zhang, Spectrochim. Acta,Part A, 2011, 78, 553–557.
44 Z. Wang, Z. Song and D. Chen, Talanta, 2010, 83, 312–319.45 M. A. Omar, O. H. Abdelmageed and T. Z. Attia, Talanta, 2009, 77,
1394–1404.46 A. S. Amin and G. H. Ragab, Spectrochim. Acta, Part A, 2004, 60,
2831–2835.47 H. Salem and H. Askal, J. Pharm. Biomed. Anal., 2002, 29, 347–354.48 T. Ohmori, A. Suzuki, T. Niwa, H. Ushikoshi, K. Shirai, S. Yoshida,
S. Ogura and Y. Ito, J. Chromatogr., B: Anal. Technol. Biomed. LifeSci., 2011, 879, 1038–1042.
49 Q. Liu, L. Xu, Y. Ke, Y. Jin, F. Zhang and X. Liang, J. Pharm.Biomed. Anal., 2011, 54, 623–628.
50 M. T. Rosseel and K. H. Vandewoude, J. Chromatogr., B: Anal.Technol. Biomed. Life Sci., 2004, 811, 159–163.
51 V. F. Samanidou, A. S. Ioannou and I. N. Papadoyannis, J.Chromatogr., B: Anal. Technol. Biomed. Life Sci., 2004, 809, 175–182.
52 S. S. N. Ling, K. H. Yuen and S. A. Barker, J. Chromatogr., B: Anal.Technol. Biomed. Life Sci., 2003, 783, 297–301.
53 M. M. Aleksic, V. Kapetanovic, J. Atanackovic, B. Jocic andM. Zecevic, Talanta, 2008, 77, 131–137.
54 N. A. El-Maali, A. H. Osman, A. A. M. Aly and G. A. A. Al-Hazmi,Bioelectrochemistry, 2005, 65, 95–104.
55 M. M. Aleksic and V. Kapetanovic, J. Electroanal. Chem., 2006, 593,258–266.
56 E. Munoz, J. L. Avila, J. P. Doctor and L. Camacho, Electroanalysis,1993, 5, 325–331.
57 N. Yılmaz and I. Biryol, J. Pharm. Biomed. Anal., 1998, 17, 1335–1344.
58 P. Nigam, S. Mohan, S. Kundu and R. Prakash, Talanta, 2009, 77,1426–1431.
59 H. Fabre, M. D. Blanchin and U. Tjaden, Analyst, 1986, 111, 1281–1284.
60 N. Abo El-Maali, M. A. Ghandour and J. M. Kauffmann,Bioelectrochem. Bioenerg., 1995, 38, 91–97.
61 H. A. Esfahani, L. Wang, Y. Nemoto and Y. Yamauchi, Chem.Mater., 2010, 22, 6310–6318.
62 Y. Ma, H. Zhang, H. Zhong, T. Xu, H. Jin and X. Geng, Catal.Commun., 2010, 11, 434–437.
63 Y. Song, Y. Ma, Y. Wang, J. Di and Y. Tu, Electrochim. Acta, 2010,55, 4909–4914.
64 E. Laviron, J. Electroanal. Chem., 1974, 52, 355–365.65 R. S. Nicholson and I. Shain, Anal. Chem., 1964, 36, 706–723.66 E. Laviron, J. Electroanal. Chem., 1979, 101, 19–28.67 I. Streeter, G. G. Wildgoose, L. Shao and R. G. Compton, Sens.
Actuators, B, 2008, 133, 462–466.68 L. Xiao, L. Wi, G. G. Wildgoose and R. G. Compton, Sens.
Actuators, B, 2009, 138, 524–531.69 M. C. Henstridge, Sens. Actuators, B, 2010, 145, 417–427.70 G. P. Keeley and M. E. G. Lyons, Int. J. Electrochem. Sci., 2009, 4,
794–809.
Analyst, 2012, 137, 2706–2715 | 2715
Top Related
Copyright © 2022 FDOKUMEN

