


Bahasa
Halaman
Hukum


Pollution 2021, 7(2): 469-479 DOI: 10.22059/poll.2021.318623.1017
RESEARCH PAPER
Concentrations and Sources of Aliphatic and Aromatic
Hydrocarbons in Babolsar Coastal Sediments in the Caspian Sea
Nasim Taghavi1, Nasser Hadjizadeh Zaker
1 and Pardis Biglarbeigi
2
1. School of Environment, College of Engineering, University of Tehran, Tehran, Iran
2. School of Engineering, Ulster University, Shore road, Newtownabbey, UK
Received: 03 January 2021, Revised: 09 March 2021, Accepted: 15 March 2021
© University of Tehran
ABSTRACT
This paper presents concentrations and sources of Aliphatic and Aromatic Hydrocarbons in the
sediments from Babolsar coastal area and the inlet of Babolrood River in the southern side of the
Caspian Sea. The concentration of hydrocarbons in 13 sediment samples from the study area were
measured by gas chromatography (GC). Total Petroleum Hydrocarbon (TPH) concentrations in
sediment samples in the coastal area ranged from 115 to 201 μg/g. In the inlet samples, TPH
concentrations were close to each other and ranged from 294 to 367 μg/g. The TPH results showed
moderate level of oil pollution in the study area. Total Polycyclic Aromatic Hydrocarbons (∑PAHs)
concentrations in sediment samples inside the inlet ranged from 498 to 702 ng/g, indicating moderate
level of pollution. Concentrations of ∑PAHs in sediment samples in the coastal area ranged from 341
to 1703 ng/g, indicating moderate to less than significant level of pollution. Developed indices for
pollutant origins showed that hydrocarbons in all sediment samples collected in the study area had
petrogenic origin. The results also showed the Babolrood River as the main source of oil pollution in
the sediments in the study area.
KEYWORDS: Caspian Sea, Babolrood River, Sediment, Oil pollution, TPH, PAH, Petroleum
Hydrocarbon
INTRODUCTION
The Caspian Sea is the largest inland body of water on Earth. Its unique marine environment
is the most important sturgeon habitat in the world and its fishery resources and huge oil and
natural gas reserves have made it a major source of income for its littoral countries (USGS,
2010; Koutsouradi et al., 2018; Ruban and Khodorevskaya, 2011; Korshenko and Gul, 2005).
However, the marine environment of the Caspian Sea due to extensive human exploitation
and discharge of large magnitudes of urban, industrial and agricultural waste is under
extensive pressure (Lattuada et al., 2019; Ranjbar and Zaker, 2016; Kaplin, 1995, Kosarev
and Yablonskaya, 1994). In general, for all kind of pollution studies in the Caspian Sea, there
were marked small-scale patches in time and space of very high concentration (Korshenko
and Gul, 2005). The Caspian Sea is exposed to significant petroleum pollution mainly caused
by offshore oil production and tanker traffic and accidents (Lattuada et al., 2019; Abilov et al.,
1999; Tolosa et al., 2004; Korshenko and Gul, 2005).
The occurrence of any oil spill in the coastal area is associated with damage to the marine
environment. Depending on the time, place, toxicity, and concentration of the oil spill,
Corresponding Author, Email: [email protected]

470 Taghavi et al.
exposure to oil spill can lead to the death of various organisms and could cause harmful
effects such as reduced reproduction, inappropriate growth, difficulty in feeding mechanisms,
and diminished defense capacity against diseases (Clark, 2001; Law and Klungsoyr, 2000).
The study of concentration and source of hydrocarbons in sediments is a common and
effective way for understanding the level of oil pollution in coastal environment (Tolosa et al.,
2004, 2005, 2009, Mirvakili and Zaker, 2014, Melé et al., 2018).
Aliphatic and aromatic hydrocarbons in coastal sediments could have petrogenic origin or
could be the result of natural inputs from terrestrial plant waxes, marine phytoplankton,
volcanic eruptions, biomass combustion and natural oil seeps (Tolosa et al., 2004; Meyers,
2003). Aliphatic hydrocarbons include straight chain alkanes, branched chain alkanes, cyclo
alkanes and isoprenoids compounds, including biomarkers (Clark, 2001; Tolosa et al., 2004).
Biomarkers can be used to provide information on the source of hydrocarbons and the extent
of weathering of the oil spill in coastal sediments (Pu et al., 2017; Wang et al., 2014; Peng et
al., 2016; Tarasov et al., 2013). Some polycyclic aromatic hydrocarbons (PAHs) are known to
be highly pollutant and potent carcinogens with destructive effects on human health (Clark
and Finley, 1973; Abdel-Shafy and Mansour, 2016). PAHs in coastal sediments could have
several origins including incomplete combustion of fossil fuels, dishcharge of petroleum and
its products, and biological processes. (Tolosa et al., 2004; Lourenço et al., 2013). Tolosa et
al. (2004) conducted the first extensive study on the spatial distribution and sources of
aliphatic and PAHs in coastal sediments from the Caspian Sea. Their results showed moderate
to high petrogenic contamination in sediments from South Caspian Sea; high levels in
particular were found in the offshore oil fields near Baku, Azerbaijan. Contaminant patterns
indicated PAHs were mainly from fossil sources. Natural PAHs from in situ biological
activity were found only important at a few sites influenced by the Iranian river discharges.
Zaker et al. (2012) studied the concentration and source of petroleum hydrocarbons in the
coastal sediments of Bandar Anzali in south-western coast of the Caspian Sea. TPH
concentrations in the surface sediments indicated low to medium level of petroleum pollution.
The Concentrations of ∑PAHs in the sediments indicated absence of contamination in the
sediment samples.
Azimi et al. (2014) studied the PAH levels in surface sediments of the Anzali Wetland and
Caspian Sea. Their results showed PAH concentrations were higher in the coastal area of
Caspian Sea. In both Anzali Wetland and the Caspian Sea coast, PAHs had petrogenic
sources. The study indicated the toxicity for benthic organisms was low to medium.
Nemati et al. (2015), studies the origin and level of PAHs contamination in the sediments
from the coasts of the Guilan Province in southwest Caspian Sea. The results showed
petrogenic source for PAHs and indicated that total PAH concentrations at all sites were
below the effects range-low.
Eghtesadi et al. (2014) studies the level and source of PAHs in the surface sediments from
the Gorgan Bay, in the southeast coast of the Caspian Sea. Their results showed PAHs came
from mixed and pyrogenic origin.
In this paper, using lab analysis, source of hydrocarbons and oil pollution level in sediment
samples from Babolsar coastal area in the southern coast of the Caspian Sea are studied (Figs.
1 and 2). The study area is located at 36o 43.25'N and 52
o, 39.50' E in Iran. It covered a
1100m-long part of the end of the Babolrood River and a band of coastal waters in the east of
the river mouth which extended 1300m along-shore and 1700m cross-shore (Figs. 1 and 2).
The inlet of Babolrood River, during the past 30 years, has been used as a fishery port for a
large number of Kilka fishing vessels. The waste oil from the vessels together with the

Pollution 2021, 7(2): 469-467 471
discharge of runoff and wastewater from cities of Babol and Babolsar into the river are main
sources of oil pollution in the study area.
Figure 1. Study area
MATERIALS AND METHODS
Surface seabed sediment samples were collected at 13 stations in Babolrood River inlet and
Babolsar coastal waters in the southern coast of the Caspian Sea in the summer of 2014 (Figs.
1 and 2). In the southern coastal waters of the Caspian Sea, the prevailing currents are mainly
from west to east (Zaker et al., 2011), and consequently, the river plume transports mainly
towards eastern side of the river mouth. Therefore, considering the river plume as the main
source of pollution in the study area, the location of sediment sampling stations 1 to 9 were
selected in the eastern side of the river mouth in the area most affected by the plume. Stations
10, 12 and 13 were located inside the river inlet. Station 11, as a control point, was located on
the western side of the river mouth where sediments were least affected by the river plume
(Fig. 2). Geographical coordinates and water depth of the sampling stations are presented in
Table 1.
The UNEP/IOC/IAEA standard method (No. 20) (UNEP, 1992) was employed for
sediment sampling. The sediments were sampled using a standard Van Veen Grab Sampler
with 25x25 cm cross section. About 200 to 300 grams of wet sediment was taken from the top
5 centimeter of surface seabed sediment. The collected samples were packed and transferred
to laboratory using the USEPA-sw-846 standard method. The standard method of American
Association of Environmental Protection (USEPA-SW-846#3540C) named SOXHLET was
used for the preparation of samples and extraction of petroleum hydrocarbons from them. The
samples were passed through a 63 microns sieve (<63) before the lab analysis. A Gas
chromatography device (GC-FID) Model VARRIAN was used for determining the
concentration of Total Petroleum Hydrocarbons (TPHs) and Aliphatic and Aromatic
compounds in the sediment samples. In addition, the concentration of normal alkanes (n-C12
- n-C30) and abundance of PAH compounds were measured. Quality assurance and quality
control (QA/QC) for PAHs analysis were conducted according to the method of Tolosa et al.,
(2005).

472 Taghavi et al.
Figure 2. Location of sediment sampling stations
Table 1. Location and depth of sediment sampling stations Sediment Type Longitude Latitude Depth (m) Station
fine sand 52° 40.17’ E 36° 43.58’ N 4.5 1
fine sand 52° 39.83’ E 36° 43.58’ N 4.5 2
fine sand 52° 39.83’ E 36° 43.31’ N 3.5 3
fine sand 52° 40.17’ E 36° 43.31’ N 3.5 4
fine sand 52° 40.17’ E 36° 43.04’ N 1.5 5
fine sand 52° 39.83’ E 36° 43.04’ N 2.5 6
fine sand 52° 39.52.’ E 36° 43.04’ N 3.0 7
fine sand 52° 39.53’ E 36° 43.32’ N 4.0 8
fine sand 52° 39.53’ E 36° 43.59’ N 4.5 9
fine silty sand 52° 39.30’ E 36° 42.91’ N 2.0 10
fine sand 52° 38.26’ E 36° 43.32’ N 3.5 11
fine silty sand 52° 38.99’ E 36° 42.40’ N 1.5 12
fine silty sand 52° 39.14’ E 36° 42.65’ N 2.5 13
RESULTS AND DISCUSSIONS
Grain size distribution results, using standard techniques, showed fine sand and fine silty sand
types sediments for coastal and river sampling stations, respectively (Table 1).
TPH concentrations in the sediment samples ranged from 53 µg/g to 367 µg/g (Fig. 3). The
highest amounts were found in the river inlet at stations 10, 12 and 13 (Fig. 2), with values
294, 367 and 360 µg/g, respectively (Fig. 3). The lowest amount was observed at coastal
station 11 where exposure to the river plume was minimum. TPH concentrations at coastal
stations 1 to 9 (Fig. 2) ranged from 115 to 201 µg/g (Fig. 3).
TPH concentrations decreased towards offshore and had amounts close to each other in the
samples with similar distances from the coastline. Satellite images (not shown here) showed

Pollution 2021, 7(2): 469-467 473
stations 5, 6 and 7 were most affected by the river plume. In these stations, from the river
mouth towards east, TPH concentration decreased significantly. The above results showed
that the Babolrood River was the main source for petroleum hydrocarbons in the sediments
from the study area.
Figure 3. TPH concentration in sediment samples.
Commendatore and Esteves (2007) considered three TPH concentration levels for oil
pollution in coastal sediments: low (< 10 µg/g), low to moderate (10-100 µg/g) and moderate
to high (100-1000 µg/g). Readman et al. (2002) considered the sediments with TPH
concentrations above 100 µg/g as polluted. Tolosa et al. (2004) considered TPH
concentrations higher than 500 µg/g indicative of significant pollution and values below 10
µg/g as unpolluted sediments. Considering the above criteria, the level of oil pollution at
station 11 was low and in all other stations were moderate to high.
Among the 100 polycyclic aromatic compounds identified so far, the US Environmental
Protection Agency (EPA) has introduced 16 PAH compounds with carcinogenic and
mutagenic effects on humans and animals as the leading pollutants (Tolosa et al., 2005;
Benger et al., 2010; Gao et al., 2018). These PAHs are Naphthalene, Acenaphthylene,
Acenaphthene, Fluorene, Phenanthrene, Anthracene, Fluoranthene, Pyrene,
Benzo[a]anthracene, Chrysene, Benzo[b]fluoranthene, Benzo[k]fluoranthene,
Benzo[a]pyrene, Dibenzo[ah]anthracene, Indeno[123-cd]pyrene and Benzo[ghi]perylene. In
this study, the concentrations of the above PAH compounds in the sediment samples were
measured and the results are presented in Table 2.
The concentrations of the PAH compounds ranged from <10 to 579 ng/g. Fossil PAHs of
Naphthalene, Acenaphthylene, Fluorene, Phenanthrene and Fluoranthene were observed at all
stations and had higher concentrations than other compounds, indicating oil as the main
source of PAHs in the study area (Tolosa et al., 2004). Indeno[123-cd]pyrene,
Benzo[ghi]perylene and Dibenzo[ah]anthracene concentrations were very small at all station.
Benzo[a]pyrene was observed at only two stations.
474 Taghavi et al.
Table 2. Concentration of the main PAH compounds in the sediment samples (ng/g) Stations
PAH (ng/g) 13 12 11 10 9 8 7 6 5 4 3 2 1
259 342 48 323 148 156 270 190 333 247 160 181 180 Naphthalene
32 34 12 44 24 25 237 24 34 24 31 107 119 Acenaphthylene
81 112 23 130 57 76 95 56 159 80 284 291 190 Fluorene
71 138 * 111 53 108 191 67 543 108 579 457 125 Phenanthrene
* 14 * 11 12 98 199 17 181 32 129 196 231 Fluoranthene
29 42 * 24 31 125 170 40 210 65 368 69 72 Pyrene
16 20 15 11 16 19 100 15 14 20 * 17 34 Acenaphthene
* * * * * * 327 * 39 * 26 90 51 Anthracene
* * * * * * 31 * 53 * 34 79 76 Benzo[b]fluoranthene
* * * * * * * * 54 * 35 81 78 Benzo[k]fluoranthene
* * * * * * 42 * 18 * 14 14 11 Chrysene
* * * * * * 41 * 18 * * 26 31 Benzo[a]anthracene
* * * * * * * * * * * 12 21 Benzo[a]pyrene
* * * * * * * * * * * * * Indeno[123-cd]pyrene
* * * * * * * * * * * * * Benzo[ghi]perylene
* * * * * * * * * * * * * Dibenzo[ah]anthracene
498 702 98 654 341 607 1703 409 1656 576 1660 1620 1219 ∑PAHs (ng/g)
* <10 ng/g
∑PAHs concentrations ranged from 98 to 1703 ng/g. Inside the river at stations 10, 12 and
13, ∑PAHs concentrations were 654, 702 and 498 ng/g, respectively and close to each other.
In the coastal area, the minimum concentration of ∑PAHs with the amount of 98 ng/g was
observed at station 11 where the river plume effect was insignificant. At the other coastal
stations, the ∑PAHs concentrations ranged from a minimum of 341 ng/g at station 9, located
further offshore, to a maximum of 1703 ng/g at station 7 near the river mouth. No specific
trend was observed in the distribution of ∑PAHs concentrations in the coastal area.
PAHs concentrations were all less than the NOAA (1999) Sediment Quality Guideline
value for the effects range low of 4000 ng/g dry weight, representing a "Minimal-effects"
range with condition in which effects rarely be observed (Long et al., 1995). Baumard et al.
(1998) considered 2 levels for PAHs concentration in the sediments: low to moderately
polluted (100-1000 ng/g) and highly polluted (>5000 ng/g). Considering these levels,
sediment samples at all station, except at station 11 with no pollution, were moderately
polluted.
The origin of PAHs in the sediments was investigated using Phen/An and Chr/BaA
indexes. The Phen/An index uses the ratio of the amount of Phenanthrene compounds to the
amount of Anthracene compounds for distinguishing the source of PAHs in marine sediments
(Neff et al., 2005). The amount of Phen/An index for petroleum is high and has been reported
to be about 60 (Yim et al., 2007). Chr/BaA index uses the ratio of the amount of Chrysene
compound to the amount of Benzo(a)anthracene compound for investigating the source of the
PAHs concentrations (Notar et al., 2001; Tolosa et al., 2009). A magnitude less than 1
(Chr/BaA<1) indicates a source of fossil fuel combustion for PAHs and a magnitude bigger
than 1 (CHr/BaA>1) indicates a fossil oil source for the PAHs (Notar et al., 2001). Based on
the above criteria the source of PAHs concentrations in sediments at stations 1 and 2 were
fossil fuel combustion and all other samples had petrogenic source (Table 2).
Sources of aliphatic hydrocarbons in the sediments from the study area were investigated
using a set of indexes. Aliphatic hydrocarbons in the coastal sediments could be resulted from
human activities or biological sources such as algae, bacteria, marine animals and terrestrial
vascular plants (Tolosa et al., 2004; Meyers, 2003(.
Pollution 2021, 7(2): 469-467 475
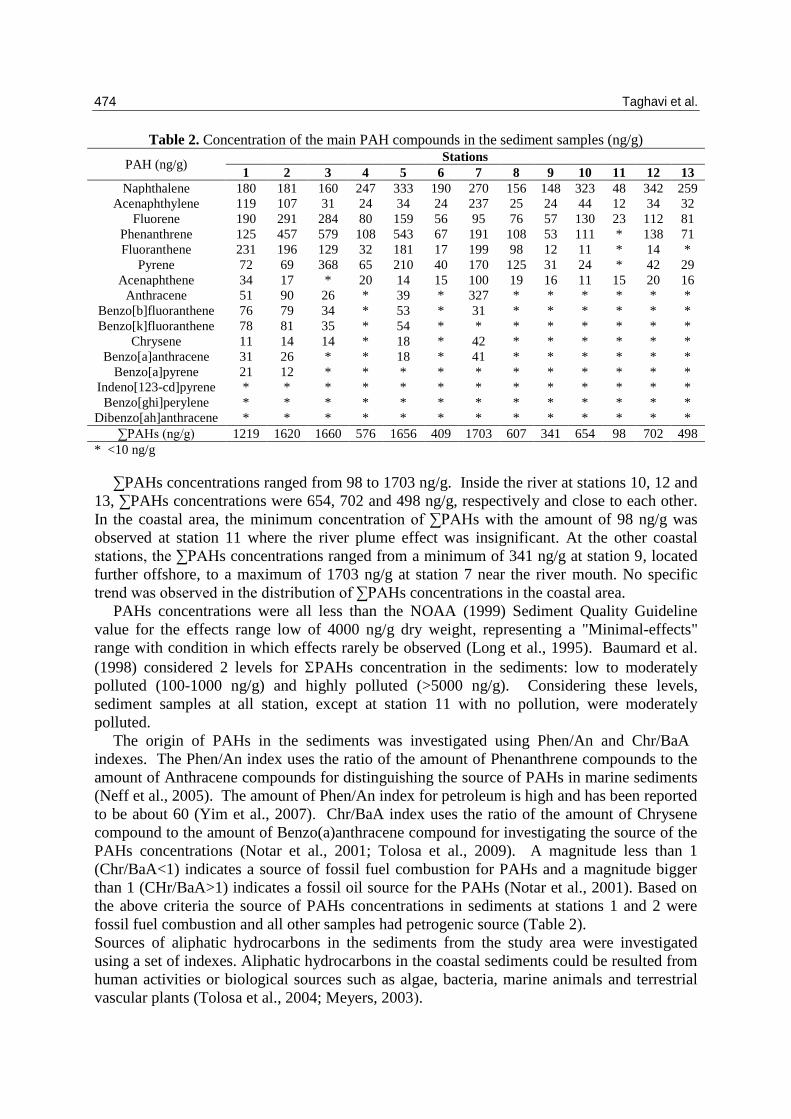
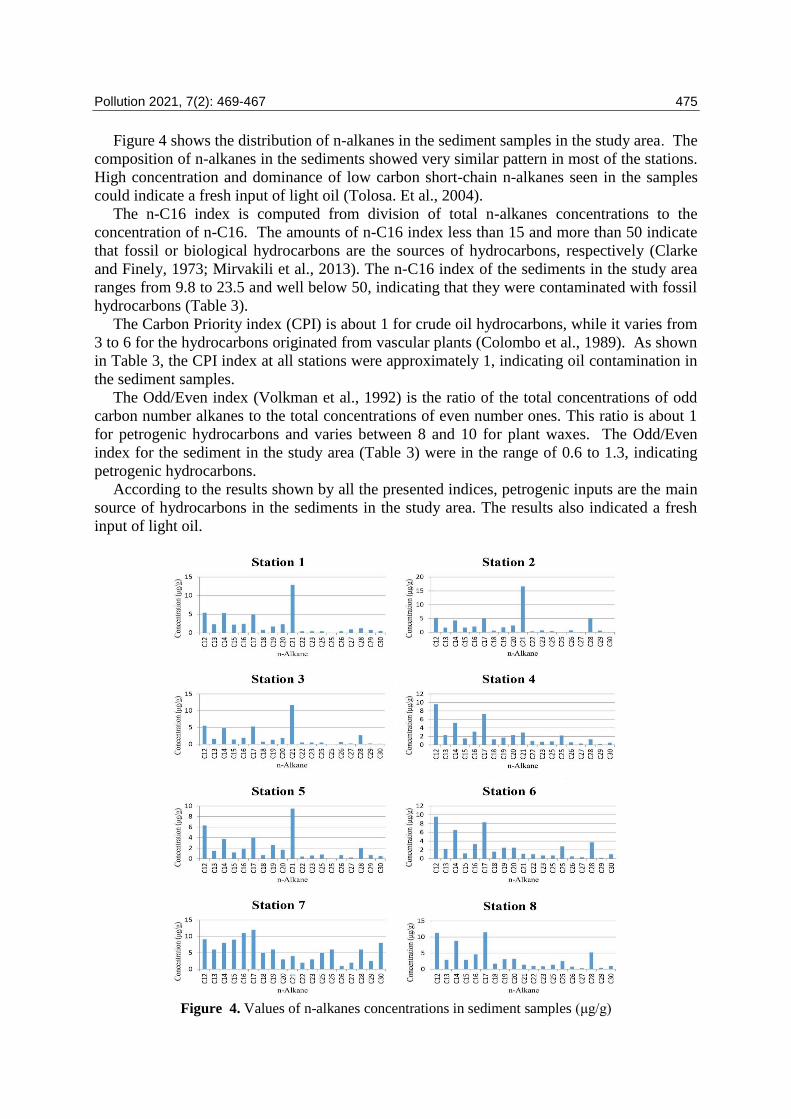
Figure 4 shows the distribution of n-alkanes in the sediment samples in the study area. The
composition of n-alkanes in the sediments showed very similar pattern in most of the stations.
High concentration and dominance of low carbon short-chain n-alkanes seen in the samples
could indicate a fresh input of light oil (Tolosa. Et al., 2004).
The n-C16 index is computed from division of total n-alkanes concentrations to the
concentration of n-C16. The amounts of n-C16 index less than 15 and more than 50 indicate
that fossil or biological hydrocarbons are the sources of hydrocarbons, respectively (Clarke
and Finely, 1973; Mirvakili et al., 2013). The n-C16 index of the sediments in the study area
ranges from 9.8 to 23.5 and well below 50, indicating that they were contaminated with fossil
hydrocarbons (Table 3).
The Carbon Priority index (CPI) is about 1 for crude oil hydrocarbons, while it varies from
3 to 6 for the hydrocarbons originated from vascular plants (Colombo et al., 1989). As shown
in Table 3, the CPI index at all stations were approximately 1, indicating oil contamination in
the sediment samples.
The Odd/Even index (Volkman et al., 1992) is the ratio of the total concentrations of odd
carbon number alkanes to the total concentrations of even number ones. This ratio is about 1
for petrogenic hydrocarbons and varies between 8 and 10 for plant waxes. The Odd/Even
index for the sediment in the study area (Table 3) were in the range of 0.6 to 1.3, indicating
petrogenic hydrocarbons.
According to the results shown by all the presented indices, petrogenic inputs are the main
source of hydrocarbons in the sediments in the study area. The results also indicated a fresh
input of light oil.
Figure 4. Values of n-alkanes concentrations in sediment samples (μg/g)
476 Taghavi et al.
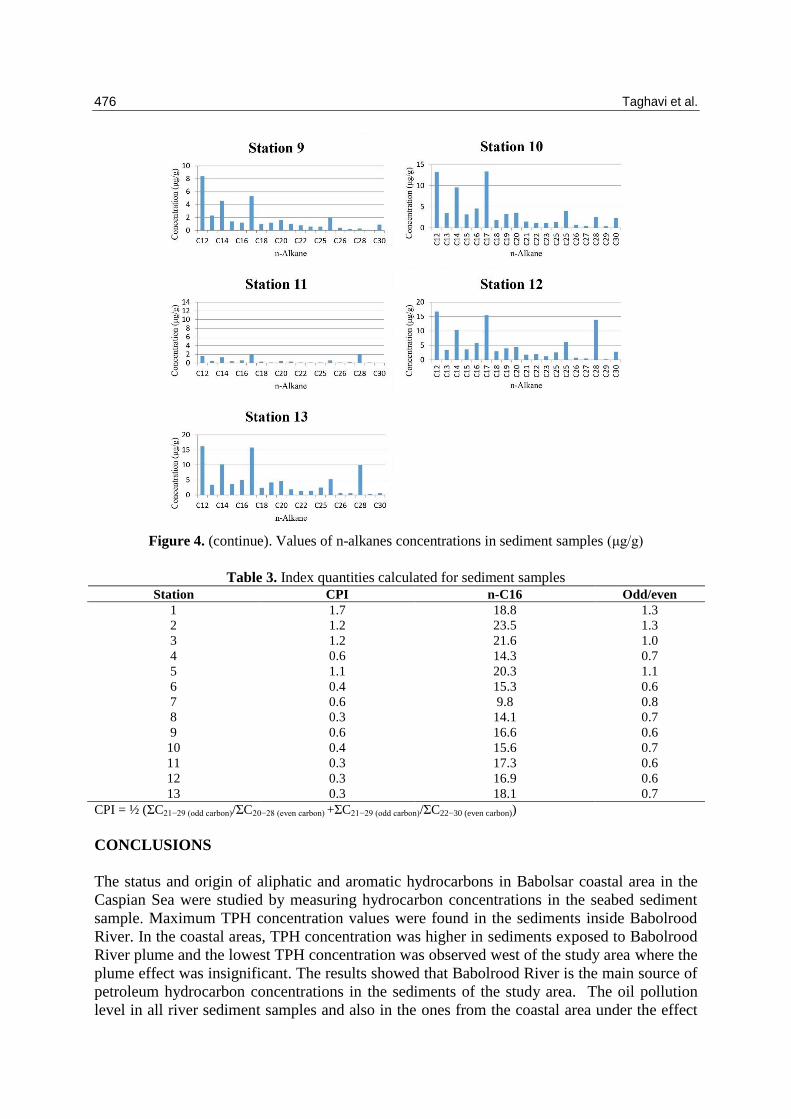
Figure 4. (continue). Values of n-alkanes concentrations in sediment samples (μg/g)
Table 3. Index quantities calculated for sediment samples Odd/even n-C16 CPI Station
1.3 18.8 1.7 1
1.3 23.5 1.2 2
1.0 21.6 1.2 3
0.7 14.3 0.6 4
1.1 20.3 1.1 5
0.6 15.3 0.4 6
0.8 9.8 0.6 7
0.7 14.1 0.3 8
0.6 16.6 0.6 9
0.7 15.6 0.4 10
0.6 17.3 0.3 11
0.6 16.9 0.3 12
0.7 18.1 0.3 13
CPI = ½ (ΣC21−29 (odd carbon)/ΣC20−28 (even carbon) +ΣC21−29 (odd carbon)/ΣC22−30 (even carbon))
CONCLUSIONS
The status and origin of aliphatic and aromatic hydrocarbons in Babolsar coastal area in the
Caspian Sea were studied by measuring hydrocarbon concentrations in the seabed sediment
sample. Maximum TPH concentration values were found in the sediments inside Babolrood
River. In the coastal areas, TPH concentration was higher in sediments exposed to Babolrood
River plume and the lowest TPH concentration was observed west of the study area where the
plume effect was insignificant. The results showed that Babolrood River is the main source of
petroleum hydrocarbon concentrations in the sediments of the study area. The oil pollution
level in all river sediment samples and also in the ones from the coastal area under the effect

Pollution 2021, 7(2): 469-467 477
of the river plume, were moderate to high. In the sample from the western side of the river
mouth, where the effect of the river plume was minimum, the oil pollution level was low. The
results showed that the highest concentrations of 16 PAH compounds in the seabed sediment
samples belonged to Naphthalene, Acenaphthylene, Fluorene, Phenanthrene, Fluoranthene
and Pyrene. These compounds were observed at all stations. The results showed that pollution
level with respect to ∑PAH concentration in all samples, except the one from control station
in the west of the study area with no pollution, were moderate to significant. The results also
showed petrogenic source for hydrocarbons in the sediments from the study area.
GRANT SUPPORT DETAILS
The present research did not receive any financial support.
CONFLICT OF INTEREST
The authors declare that there is not any conflict of interests regarding the publication of this
manuscript.
LIFE SCIENCE REPORTING
No life science threat was practiced in this research
REFERENCES
Abdel-Shafy, H.I. and Mansour, M.S.M. (2016). A review on polycyclic aromatic hydrocarbons:
Source, environmental impact, effect on human health and remediation. Egypt. J. Pet,
25(1), 107-123.
Abilov, F.A., Orudjev, A.G. and Lange, R. (1999). Optimization of oil containing wastewater
treatment processes. Desalination 124, 225–229.
Azimi, R., Riyahi, A., Mortazavi, S. and Savabieasfahani, M. (2014). Sediment PAH:
Contrasting levels in the Caspian Sea and Anzali Wetland. Mar. Pollut. Bull., 84(1–2),
391-400
Banger, K., Toor, G.S., Chirenje, T. and Ma, L. (2010). Polycyclic Aromatic Hydrocarbons in
Urban Soils of Different Land Uses in Miami, Florida. Soil Sediment Contam., 19(2),
231-243.
Baumard, P., Budzinski, H. and Garrigues, P. (1998). Polycyclic aromatic hydrocarbons in
sediments and mussels of the Western Mediterranean Sea. Environ. Toxicol. Chem.,17,
765–776.
Clark, R.B. (2001). Marine Pollution, 5th edition. (Oxford University Press, Oxford, UK)
Clark, R.C. and Finley, J.S. (1973). Techniques for analysis of paraffin hydrocarbons and for
interpretation of data to assess oil spill effects in aquatic organisms (Paper presented at
the Joint Conference on Prevention and Control of Oil Spills, American Petroleum
Institute, Washington, DC.)
Commendatore, M.G. and Esteves, J.L. (2007). An Assessment of Oil Pollution in the Coastal
Zone of Patagonia, Argentina. Environ Manage, 40, 814-821.
Gao, P., da Silva, E., Hou, L., Denslow, N.D., Xiang, P. and Ma, L.Q. (2018). Human exposure
to polycyclic aromatic hydrocarbons: metabolomics perspective. Environ. Int., 119, 466-
477.
Kaplin, P. (1995). Caspian Sea environmental situation in the condition of water level rises. J.
Water Dev., 3(1), 123-150.

478 Taghavi et al.
Korshenko, A. N. and GUL A. G. (2005). Pollution of the Caspian Sea. (In A. G. Kostianov and
A. N. Kosarev (Eds.), The Caspian Sea Environment (Handbook of Environmental
Chemistry) (pp. 109-142). Springer)
Kosarev, A.N. and Yablonskaya, E.A. (1994). The Caspian Sea. (The Hague, SPB Academic
Publishing)
Koutsouradi, M., Karkazis, J., Siousiouras, P. and Chondrogianni, D. (2018). The Complexity
of the Caspian Basin. Eur. Sci. J., 14(26), 159-172
Lattuada M., Albrecht, A. and Wilke, T. (2019). Differential impact of anthropogenic pressures
on Caspian Sea ecoregions. Mar. Pollut. Bull., 142, 274-281
Law, R.J. and Klungsoyr, J. (2000). The analysis of polycyclic aromatic hydrocarbons in marine
samples. Int J Environ Pollut, 13, 262–283.
Long, E.R., Macdonald, D.D., Smith, S.L. and Calder, F.D. (1995). Incidence of adverse
biological effects within ranges of chemical concentrations in marine and estuarine
sediments. Environ Manage, 19, 81–97
Melé, A.R., Cibrián, N.M., Sabaté, M.C., Ventura, F.C., Mayor, P. and Martínez, M.O. (2018).
Oil pollution in soils and sediments from the Northern Peruvian Amazon. Sci. Total
Environ., 610–611,1010-1019
Meyers P.A. (2003). Applications of organic geochemistry to paleolimnological reconstructions:
a summary of examples from the Laurentian Great Lakes. Org Geochem, 34(2), 261–289
Mirvakili, H., Zaker, N.H. and Imani, F. (2013). Evaluation of oil pollution and origin in
surface coastal sediments of Kharg Island in the Persian Gulf. J. Coast. Res. , 65, 93–98.
Mirvakili, H. and Zaker, N.H. (2014). Evaluation of PAHs in Hydrocarbons Pollution,
Biodegradation and Weathering Extent in Surface Sediments of the Kharg Island in the
Persian Gulf. Int. J. Environ. Res., 8(2), 387-394.
Lourenço, R.A., Araujo Júnior, M.A.G., Meireles Júnior, R.O and Macena, L.F. (2013).
Aliphatic and polycyclic aromatic hydrocarbons and trace elements as indicators of
contamination status near oil and gas platforms in the Sergipe–Alagoas Basin (Southwest
Atlantic Ocean). Cont. Shelf Res., 71, 37–44
Neff, J.M., Stout, S.A. and Gunster, D.G. (2005). Ecological risk assessment of polycyclic
aromatic hydrocarbons in sediments: Identifying sources and ecological hazards. Integr.
Environ. Assess. Manag. 1, 22–33.
NOAA, US (1999). Sediment quality guidelines developed for the National Status and Trends
Program.
Notar M., Leskov-Sek, H. and Faganel, J. (2001). Composition, Distribution and Sources of
Polycyclic Aromatic Hydrocarbons in Sediments of the Gulf of Trieste, Northern Adriatic
Sea. Mar. Pollut. Bull., 42 (1), 36-44.
Peng, T., Li, J., Song, C., Guo, B., Liu, J., Zhao, Z. and Zhang, J. (2016). An integrated
biomarker perspective on Neogene–Quaternary climatic evolution in NE Tibetan Plateau:
implications for the Asian aridification. Quat. Int., 399, 174–182
Pu, Y., Wang, C. and Meyers, P.A. (2017). Origins of biomarker aliphatic hydrocarbons in
sediments of alpine Lake Ximencuo, China. Palaeogeogr. Palaeoclimatol. Palaeoecol.,
475, 106–114
Ranjbar, M.H. and Zaker, N.H. (2016). Estimation of environmental capacity of phosphorus in
Gorgan Bay, Iran, via a 3D ecological-hydrodynamic model. Environ. Monit. Assess.,
188(11), 1-12
Readman J.W., Fillmann, G., Tolosa I., Bartocci, J., Villeneuve, J.P., Catinni, C. and Mee, L.D.
(2002). Petroleum and PAH contamination of the Black Sea. Mar. Pollut. Bull., 44(1), 48–
62
Ruban, G. I. and Khodorevskaya, R. P. (2011). Caspian Sea sturgeon fishery: a historic
overview. J. Appl. Ichthyol. 27, 199–208
Tarasov, P.E., Müller, S., Zech, M., Andreeva D., Diekmann B. and Leipe C. (2013). Last
glacial vegetation reconstructions in the extreme continental eastern Asia: potentials of
pollen and n-alkane biomarker analyses. Quat. Int., 290–291, 253–263

Pollution 2021, 7(2): 469-467 479
Tolosa, I., de Mora, S., Sheikholeslami, M.R., Villeneuve, J.P., Bartocci, J. and Cattini, C.
(2004). Aliphatic and aromatic hydrocarbons in coastal Caspian Sea sediments. Mar.
Pollut. Bull.,48, 44–60.
Tolosa, I., de Mora, S.; Fowler, S.W.; Villeneuve, J., Bartocci, J. and Cattini, C. (2005).
Aliphatic and aromatic hydrocarbons in marine biota and coastal sediments from the Gulf
and the Gulf of Oman. Mar. Pollut. Bull., 50, 1619–1633
Tolosa, I., Mesa-Albernas, M. and Alonso-Hernandez, C.M. (2009). Inputs and Sources of
Hydrocarbons in Sediments from Cienfuegos Bay, Cuba. Mar. Pollut. Bull., 58 (11),
1624-1634
UNEP/IOC/IAEA (1992). Determination of Petroleum Hydrocarbons in Sediments. Reference
Methods for Marine Pollution Studies No. 20. UNEP.
U.S Geological Survey (2010). Assessment of Undiscovered Oil and Gas Resources of the
North Caspian Basin, Middle Caspian Basin, North Ustyurt Basin, and South Caspian
Basin Provinces, Caspian Sea Area.
Volkman, J.K., Holdsworth, D.G., Neill, P. and Bavor, J. (1992). Identification of natural,
anthropogenic and petroleum hydrocarbons in aquatic sediments. Sci. Total Environ., 112
(2-3), 203–219.
Wang, N., Zong, Y., Brodie, C.R. and Zheng, Z. (2014). An examination of the fidelity of n-
alkanes as a palaeoclimate proxy from sediments of Palaeolake Tianyang, South China.
Quat. Int., 333, 100–109
Yim, U.H., Hong, S.H. and Shim, W.J. (2007). Distribution and characteristics of PAHs in
sediments from the marine environment of Korea. Chemosphere, 68, 85–92
Zaker, N.H., Ghaffari, P., Jamshidi, S. and Nouranian, M. (2011). Currents on the southern
continental shelf of the Caspian Sea off Babolsar, Mazandaran, Iran. J. Coast. Res., 64,
1989-1997. Zaker, N.H., Rahmani, I., Moghaddam, M., Shadi, R. and Abessi. O. (2012). Concentrations and
Origin of Petroleum Hydrocarbons in the Sediments of Anzali Port in the Caspian Sea,
Iran. J. Environ. Stud., 37(60), 99-106. In Persian.
Pollution is licensed under a "Creative Commons Attribution 4.0 International (CC-BY 4.0)"
Top Related
Copyright © 2022 FDOKUMEN

