


Bahasa
Halaman
Hukum

Complementarity of atom probe, small angle scattering and differential
scanning calorimetry for the study of precipitation in aluminium alloys
Frederic De Geuser1, a*, Thomas Dorin1,2,b, Williams Lefebvre3,c,
Baptiste Gault4,d and Alexis Deschamps1,e 1SIMaP, Grenoble INP – CNRS – UJF, BP. 75, 38402 Saint Martin d’Hères Cedex, France
2Constellium, Voreppe Research Centre, BP 27, 38341 Voreppe Cedex, France
3Groupe de Physique des Matériaux, UMR CNRS 6634, Université de Rouen, BP 12, Avenue de
l’Université, 76801 Saint Etienne de Rouvray, France
4Department of Materials, University of Oxford, Parks Road, Oxford, OX1 3PH, UK
* corresponding author
Keywords: Atom probe tomography, small-angle scattering, DSC, precipitation.
Abstract. Two examples of precipitation studies (in Al-Li-Cu and Al-Li-Mg alloys) are shown to
demonstrate the complementarity of atom probe tomography, small-angle-scattering and differential
scanning calorimetry for precipitation studies. It will be used to unravel an unexpected two-step
precipitation behavior of T1 in Al-Li-Cu and to ascertain precipitates size in Al-Li-Mg. through a
model free comparison between atom probe and SAXS.
Introduction
Transmission electron microscopy (TEM) plays a central role for the study of nanometer size
precipitates in structural hardening alloys. It is due to its unique properties combining an excellent
spatial resolution for direct space imaging of small particles, together with diffraction analysis
providing information on morphology, crystallography, distribution, size… To a lesser extent,
analytical TEM can provide insights of the composition of precipitates. In many practical cases
encountered in age hardened aluminium alloys, however, the chemical information of the TEM is
too limited. Furthermore, while the field of view of TEM usually contains many precipitates, it may
not always be sufficient to gather significant average values of size density, especially when the
dispersion is relatively large. A third possible limitation of TEM as a tool for precipitation studies is
the lack (or very limited possibilities) of in situ measurements which limits the investigation of
precipitation kinetics to interrupted ageing measurements.
While TEM will most certainly remain the characterization method of choice for many
precipitation studies, this paper will give examples of studies where the combined use of small-
angle X-ray scattering (SAXS), atom probe tomography (APT) and differential scanning calorimetry
(DSC) can overcome the three considered limitations of TEM, namely limited atomic scale
analytical information, limited probed size, and lack of kinetics study capabilities. In particular, we
will show that a combination of techniques is a way to make the best use of each technique
advantages.
These aspects will be illustrated by two aluminium alloys examples. First, we will show with an
Al-Li-Cu alloy that, although DSC can be used to quantify the volume fraction of precipitates
formed during an ageing process, in situ SAXS reveals that interpreting the DSC signal may not be
as straightforward as thought at first. Then, the example of an Al-Li-Mg alloy will be used to show
the complementarity between SAXS and APT and how they can be quantitatively compared.
Materials Science Forum Vols. 794-796 (2014) pp 926-932© (2014) Trans Tech Publications, Switzerlanddoi:10.4028/www.scientific.net/MSF.794-796.926
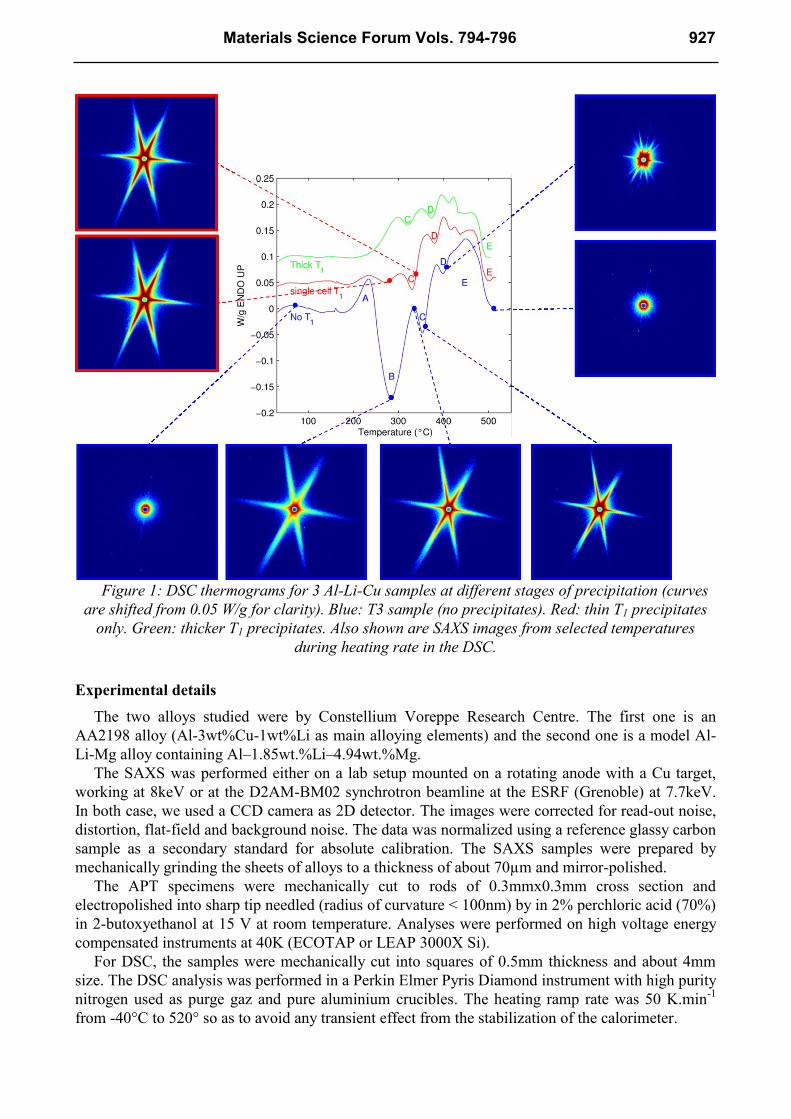
Figure 1: DSC thermograms for 3 Al-Li-Cu samples at different stages of precipitation (curves
are shifted from 0.05 W/g for clarity). Blue: T3 sample (no precipitates). Red: thin T1 precipitates
only. Green: thicker T1 precipitates. Also shown are SAXS images from selected temperatures
during heating rate in the DSC.
Experimental details
The two alloys studied were by Constellium Voreppe Research Centre. The first one is an
AA2198 alloy (Al-3wt%Cu-1wt%Li as main alloying elements) and the second one is a model Al-
Li-Mg alloy containing Al–1.85wt.%Li–4.94wt.%Mg.
The SAXS was performed either on a lab setup mounted on a rotating anode with a Cu target,
working at 8keV or at the D2AM-BM02 synchrotron beamline at the ESRF (Grenoble) at 7.7keV.
In both case, we used a CCD camera as 2D detector. The images were corrected for read-out noise,
distortion, flat-field and background noise. The data was normalized using a reference glassy carbon
sample as a secondary standard for absolute calibration. The SAXS samples were prepared by
mechanically grinding the sheets of alloys to a thickness of about 70µm and mirror-polished.
The APT specimens were mechanically cut to rods of 0.3mmx0.3mm cross section and
electropolished into sharp tip needled (radius of curvature < 100nm) by in 2% perchloric acid (70%)
in 2-butoxyethanol at 15 V at room temperature. Analyses were performed on high voltage energy
compensated instruments at 40K (ECOTAP or LEAP 3000X Si).
For DSC, the samples were mechanically cut into squares of 0.5mm thickness and about 4mm
size. The DSC analysis was performed in a Perkin Elmer Pyris Diamond instrument with high purity
nitrogen used as purge gaz and pure aluminium crucibles. The heating ramp rate was 50 K.min-1
from -40°C to 520° so as to avoid any transient effect from the stabilization of the calorimeter.
Materials Science Forum Vols. 794-796 927
Combining DSC ramp heating and in situ SAXS on an Al-Li-Cu
The 2198 Al-Li-Cu alloy is a high strength structural hardening alloys which is mainly strengthen
by the formation of the T1 phase which precipitates as thin platelets laying on the {111} planes of
the aluminium matrix. Their aspect ratio (diameter on thickness) can be as high as 100. They have
been shown [1,2] to consist of only 1 unit cell of the T1 structure in thickness (1.3nm) for an ageing
temperature of 155°C [3]. Thickening of T1 can be obtained at higher temperature. SAXS has been
shown to be able to monitor the morphology (thickness and length) of the precipitates in situ during
the precipitation process [4]. For a quantitative measure of the precipitate volume fraction, however,
another global technique is required. Integration of heat-flow exothermic precipitation peak
obtained by DSC is a typical way of quantifying the fraction of precipitates. Figure 1 shows the heat
flow obtained by ramp heating in the DSC on 3 different alloys. The first heat flow curve (blue) was
obtained on the as received T3 sample containing no T1 (although it is likely to contain some room
temperature clusters). The second curve (red) has been obtained on an alloy aged for 18h at 155°C,
containing only 1-unit cell T1 precipitates. The third one (green) has been obtained after a two-step
ageing, 18h at 155°C followed by 70h at 190°C, where the T1 precipitates have undergone
significant thickening.
Many heat flow events are present on these curves, which are difficult to interpret. The
endotherm A is likely the dissolution of room temperature clusters/GP zones. The exotherm B is
likely to concern T1, as it is very intense in the T1-free sample (so that T1 could form during the
DSC ramp. The E endotherm can be safely associated with the dissolution of the existing phase.
Events C and D are more complicated to understand. To unravel the precipitation processes
involved during the DSC run, we have reproduced the DSC ramp heating during an in situ SAXS
experiments. The result is a continuous quantitative description of the precipitates morphology.
Selected SAXS images corresponding to the different events are shown on Fig. 1. They show the
typical star pattern [4] corresponding to T1 precipitates. The length of the streaks is inversely
proportional to the thickness of the precipitates and their orientation is characteristic of their habit
planes.
The SAXS images confirm that the B exotherm corresponds to T1 precipitation. However, they
also indicate that at the end of event B the precipitates still have the same thickness (single unit cell)
since the streaks, while more intense, have the same length. Only after event C do they thicken. This
is further confirmed by the fact that the single-cell T1 containing sample do not show event B but
show event C. The thick T1 containing sample does show the C event, but it is part of a wider
globally endothermic event so that it is likely that it can be attributed to a thickening of the
precipitates during their dissolution. This demonstrates that the T1 precipitates form through a two-
step process with only lengthening in a first step, while the thermally activated thickening step
(probably associated with growth ledge nucleation and long range diffusion) occurs at higher
temperature. This is consistent with the believed precipitation scenario occurring during isothermal
ageing [5]. A detailed description of this study will be published elsewhere [6].
Combining SAXS and APT to quantify precipitates size
This second example uses two samples of the same Al-Li-Mg which undergone different heat
treatments to demonstrate the complementarity of APT and SAXS. The two alloys have been aged
for 24h at 120°C and 8h at 150°C respectively. Their microstructure have been characterized by
TEM (not shown here) and they consist only in a fine homogeneous dispersion of ’ (Al3Li but
containing Mg) spherical precipitates with a large volume fraction [7]. The radii of the precipitates
for the two samples were estimated by TEM at 3nm and 4.8nm respectively. SAXS images were
recorded for these two samples and are shown on Fig. 2. The presence of a maximum on both
curves is related to interparticles interaction and confirms the high volume fractions [8]. Classical
SAXS data processing [9] can extract the size of the precipitates and the resulting sizes are
928 Aluminium Alloys 2014 - ICAA14
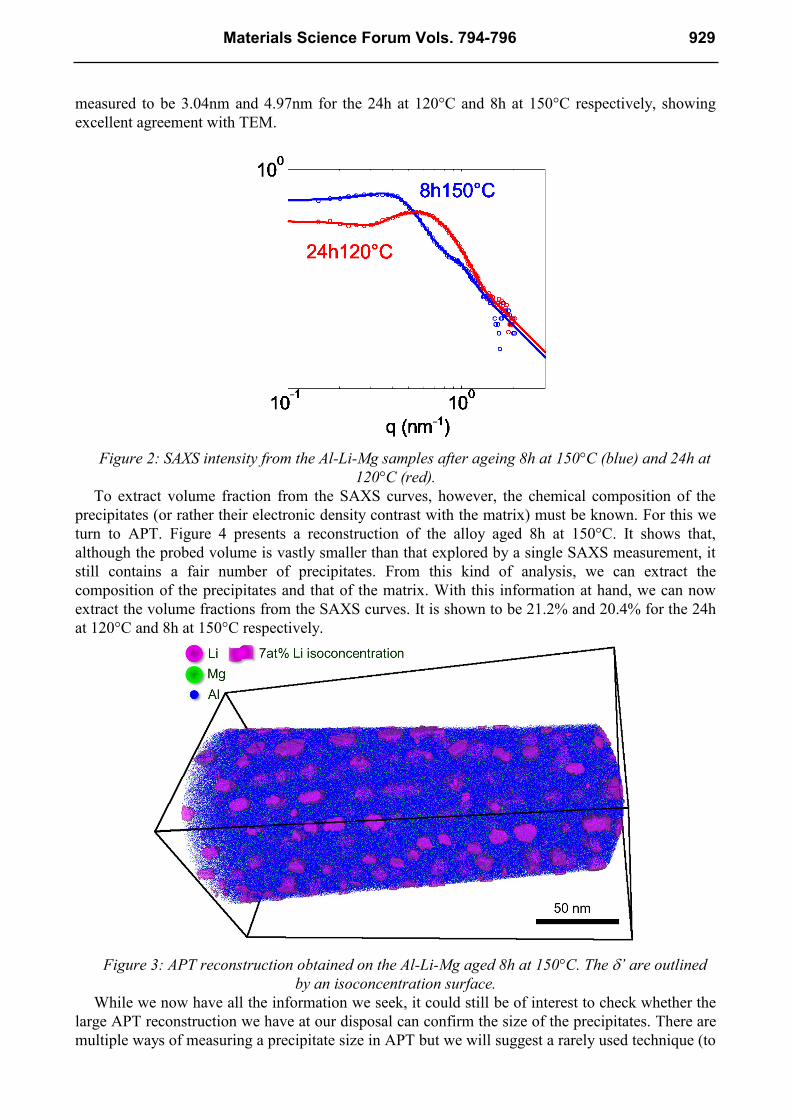
measured to be 3.04nm and 4.97nm for the 24h at 120°C and 8h at 150°C respectively, showing
excellent agreement with TEM.
Figure 2: SAXS intensity from the Al-Li-Mg samples after ageing 8h at 150°C (blue) and 24h at
120°C (red).
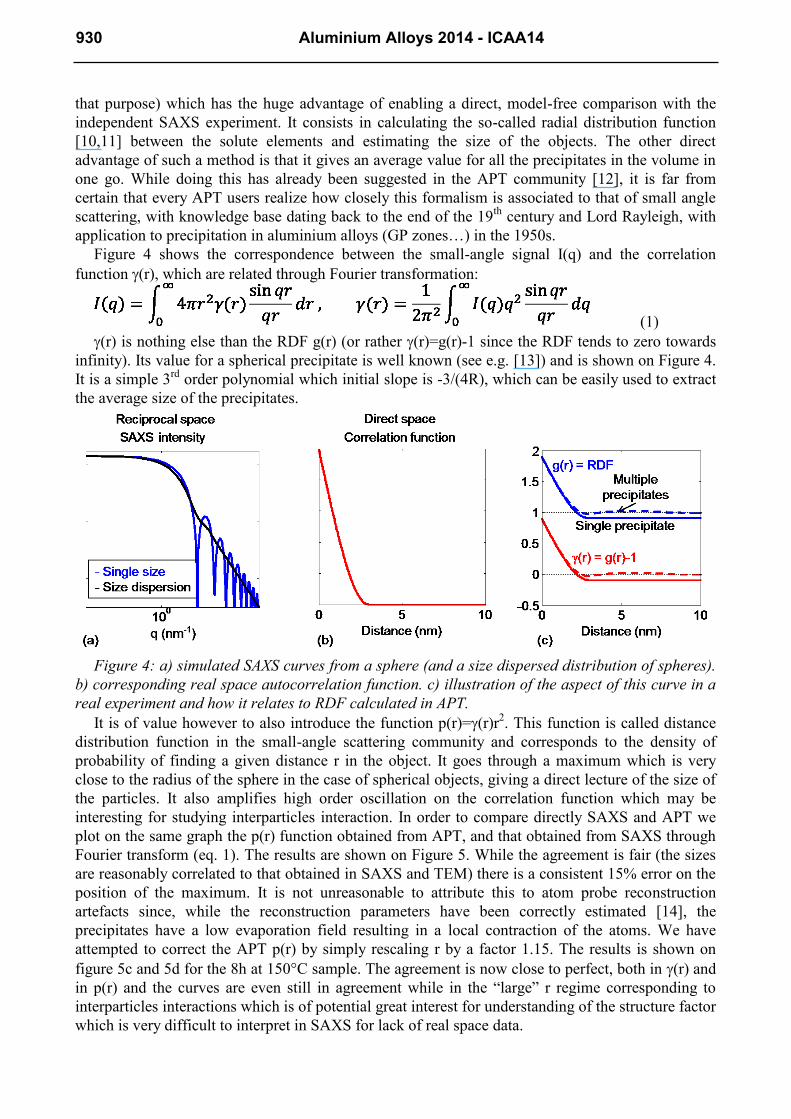
To extract volume fraction from the SAXS curves, however, the chemical composition of the
precipitates (or rather their electronic density contrast with the matrix) must be known. For this we
turn to APT. Figure 4 presents a reconstruction of the alloy aged 8h at 150°C. It shows that,
although the probed volume is vastly smaller than that explored by a single SAXS measurement, it
still contains a fair number of precipitates. From this kind of analysis, we can extract the
composition of the precipitates and that of the matrix. With this information at hand, we can now
extract the volume fractions from the SAXS curves. It is shown to be 21.2% and 20.4% for the 24h
at 120°C and 8h at 150°C respectively.
Figure 3: APT reconstruction obtained on the Al-Li-Mg aged 8h at 150°C. The ’ are outlined
by an isoconcentration surface.
While we now have all the information we seek, it could still be of interest to check whether the
large APT reconstruction we have at our disposal can confirm the size of the precipitates. There are
multiple ways of measuring a precipitate size in APT but we will suggest a rarely used technique (to
Materials Science Forum Vols. 794-796 929
that purpose) which has the huge advantage of enabling a direct, model-free comparison with the
independent SAXS experiment. It consists in calculating the so-called radial distribution function
[10,11] between the solute elements and estimating the size of the objects. The other direct
advantage of such a method is that it gives an average value for all the precipitates in the volume in
one go. While doing this has already been suggested in the APT community [12], it is far from
certain that every APT users realize how closely this formalism is associated to that of small angle
scattering, with knowledge base dating back to the end of the 19th
century and Lord Rayleigh, with
application to precipitation in aluminium alloys (GP zones…) in the 1950s.
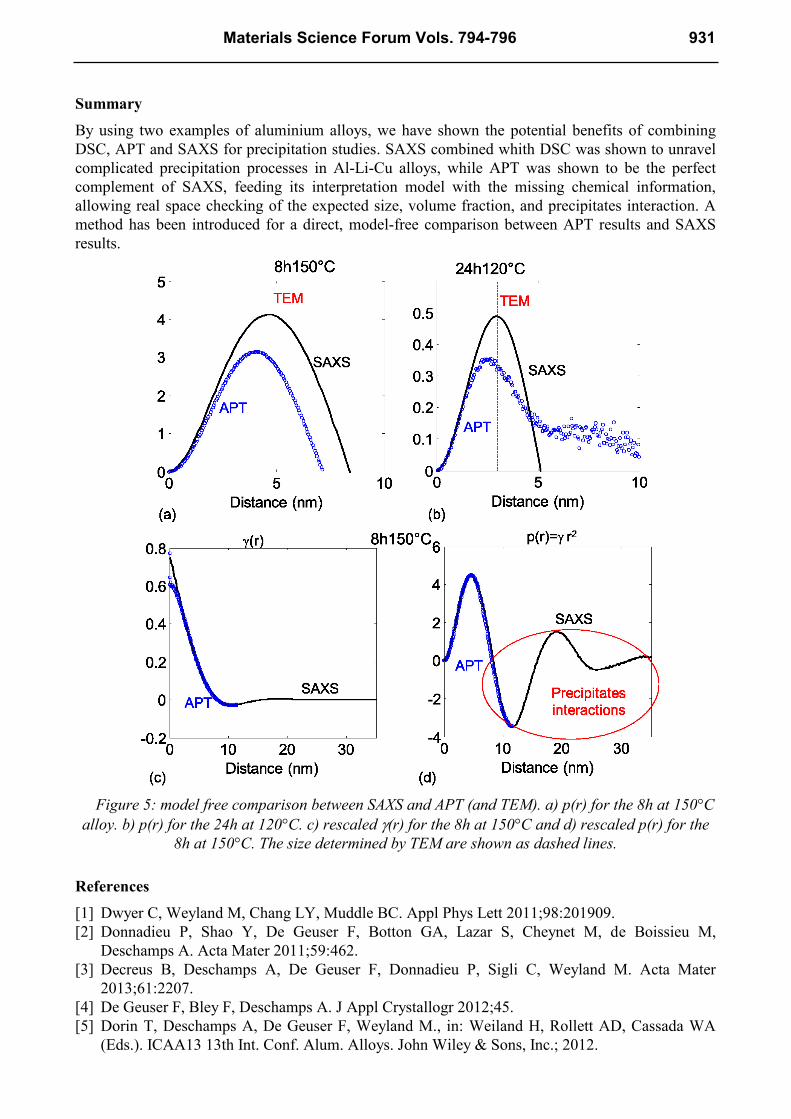
Figure 4 shows the correspondence between the small-angle signal I(q) and the correlation
function (r), which are related through Fourier transformation:
(1)
(r) is nothing else than the RDF g(r) (or rather (r)=g(r)-1 since the RDF tends to zero towards
infinity). Its value for a spherical precipitate is well known (see e.g. [13]) and is shown on Figure 4.
It is a simple 3rd
order polynomial which initial slope is -3/(4R), which can be easily used to extract
the average size of the precipitates.
Figure 4: a) simulated SAXS curves from a sphere (and a size dispersed distribution of spheres).
b) corresponding real space autocorrelation function. c) illustration of the aspect of this curve in a
real experiment and how it relates to RDF calculated in APT.
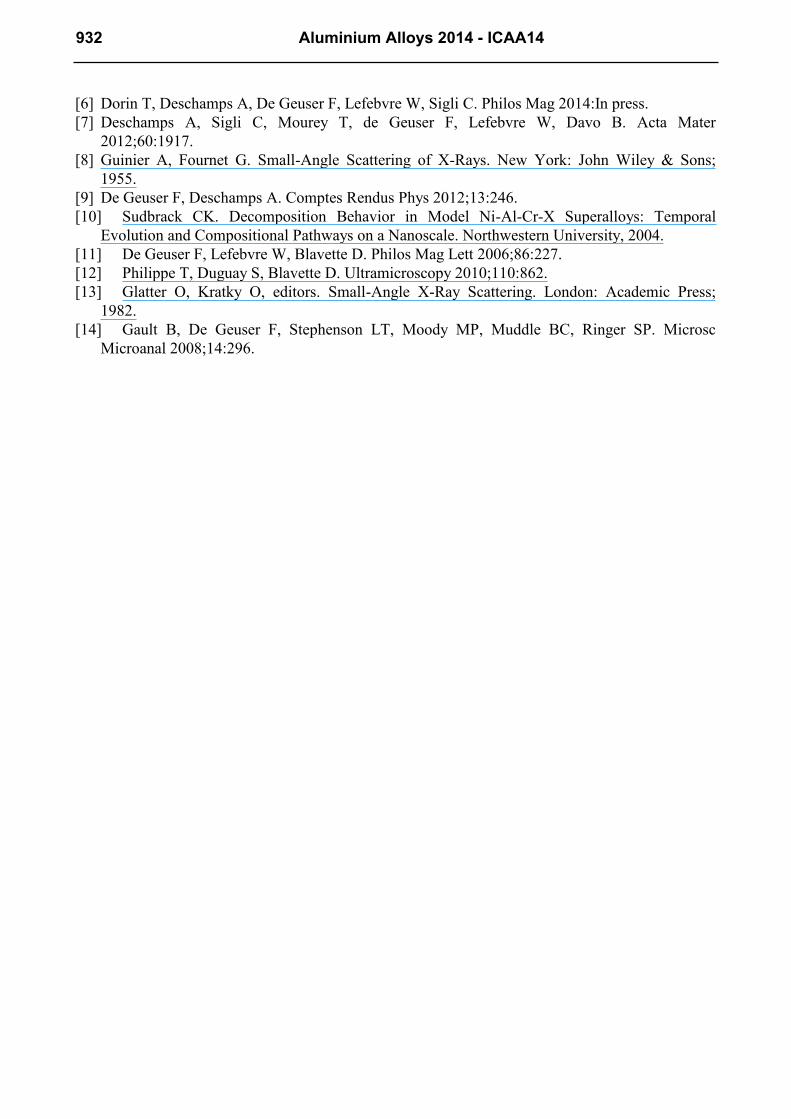
It is of value however to also introduce the function p(r)=(r)r2. This function is called distance
distribution function in the small-angle scattering community and corresponds to the density of
probability of finding a given distance r in the object. It goes through a maximum which is very
close to the radius of the sphere in the case of spherical objects, giving a direct lecture of the size of
the particles. It also amplifies high order oscillation on the correlation function which may be
interesting for studying interparticles interaction. In order to compare directly SAXS and APT we
plot on the same graph the p(r) function obtained from APT, and that obtained from SAXS through
Fourier transform (eq. 1). The results are shown on Figure 5. While the agreement is fair (the sizes
are reasonably correlated to that obtained in SAXS and TEM) there is a consistent 15% error on the
position of the maximum. It is not unreasonable to attribute this to atom probe reconstruction
artefacts since, while the reconstruction parameters have been correctly estimated [14], the
precipitates have a low evaporation field resulting in a local contraction of the atoms. We have
attempted to correct the APT p(r) by simply rescaling r by a factor 1.15. The results is shown on
figure 5c and 5d for the 8h at 150°C sample. The agreement is now close to perfect, both in (r) and
in p(r) and the curves are even still in agreement while in the “large” r regime corresponding to
interparticles interactions which is of potential great interest for understanding of the structure factor
which is very difficult to interpret in SAXS for lack of real space data.
930 Aluminium Alloys 2014 - ICAA14
Summary
By using two examples of aluminium alloys, we have shown the potential benefits of combining
DSC, APT and SAXS for precipitation studies. SAXS combined whith DSC was shown to unravel
complicated precipitation processes in Al-Li-Cu alloys, while APT was shown to be the perfect
complement of SAXS, feeding its interpretation model with the missing chemical information,
allowing real space checking of the expected size, volume fraction, and precipitates interaction. A
method has been introduced for a direct, model-free comparison between APT results and SAXS
results.
Figure 5: model free comparison between SAXS and APT (and TEM). a) p(r) for the 8h at 150°C
alloy. b) p(r) for the 24h at 120°C. c) rescaled (r) for the 8h at 150°C and d) rescaled p(r) for the
8h at 150°C. The size determined by TEM are shown as dashed lines.
References
[1] Dwyer C, Weyland M, Chang LY, Muddle BC. Appl Phys Lett 2011;98:201909.
[2] Donnadieu P, Shao Y, De Geuser F, Botton GA, Lazar S, Cheynet M, de Boissieu M,
Deschamps A. Acta Mater 2011;59:462.
[3] Decreus B, Deschamps A, De Geuser F, Donnadieu P, Sigli C, Weyland M. Acta Mater
2013;61:2207.
[4] De Geuser F, Bley F, Deschamps A. J Appl Crystallogr 2012;45.
[5] Dorin T, Deschamps A, De Geuser F, Weyland M., in: Weiland H, Rollett AD, Cassada WA
(Eds.). ICAA13 13th Int. Conf. Alum. Alloys. John Wiley & Sons, Inc.; 2012.
Materials Science Forum Vols. 794-796 931
[6] Dorin T, Deschamps A, De Geuser F, Lefebvre W, Sigli C. Philos Mag 2014:In press.
[7] Deschamps A, Sigli C, Mourey T, de Geuser F, Lefebvre W, Davo B. Acta Mater
2012;60:1917.
[8] Guinier A, Fournet G. Small-Angle Scattering of X-Rays. New York: John Wiley & Sons;
1955.
[9] De Geuser F, Deschamps A. Comptes Rendus Phys 2012;13:246.
[10] Sudbrack CK. Decomposition Behavior in Model Ni-Al-Cr-X Superalloys: Temporal
Evolution and Compositional Pathways on a Nanoscale. Northwestern University, 2004.
[11] De Geuser F, Lefebvre W, Blavette D. Philos Mag Lett 2006;86:227.
[12] Philippe T, Duguay S, Blavette D. Ultramicroscopy 2010;110:862.
[13] Glatter O, Kratky O, editors. Small-Angle X-Ray Scattering. London: Academic Press;
1982.
[14] Gault B, De Geuser F, Stephenson LT, Moody MP, Muddle BC, Ringer SP. Microsc
Microanal 2008;14:296.
932 Aluminium Alloys 2014 - ICAA14
Top Related
Copyright © 2022 FDOKUMEN

