


Bahasa
Halaman
Hukum

COACHMENINDUSTRIES, INC.
A N N U A L R E P O R T
Brought to you by Global Reports
Coachmen Industries, Inc. 1997 Annual Report
General Office:601 East Beardsley AvenueElkhart, Indiana
Transfer Agent & Registrar:First Chicago Trust Company of New YorkNew York, New York
Legal Counsel:McDermott, Will & EmeryChicago, Illinois
Independent Accountants:Coopers & Lybrand L.L.P.South Bend, Indiana
Stock Symbol:
10-K Furnished:Securities and Exchange Commission Form 10-K isavailable without charge to shareholders upon written request to the Company or via the Internet at the SEC EDGAR site: http://www.sec.gov.
Coachmen Industries, Inc.Financial DepartmentP.O. Box 3300Elkhart, Indiana 46515For more information visit our web site: http://www.coachmen.com
®
Table of Contents
Highlights ..............................................................................................1
Common Stock Data.............................................................................1
Summary of Sales .................................................................................1
Shareholders Message ...........................................................................2
Operations .............................................................................................4
Selected Financial Data ......................................................................11
Management’s Discussion and Analysis of
Financial Condition and Results of Operations.............................11
Consolidated Balance Sheets ..............................................................14
Consolidated Statements of Income and
Retained Earnings...........................................................................16
Consolidated Statements of Cash Flows .............................................17
Notes to Consolidated Financial Statements......................................18
Report of Independent Accountants ...................................................24
Board of Directors ...............................................................................24
Corporate Officers................................................................................25
Finance Committee.............................................................................25
Divisions and Subsidiaries ..................................................................25
Corporate ProfileCoachmen Industries, Inc. is made up of three manufacturing groups. The Recreational Vehicle Group produces
a full line of recreational vehicles and van conversions through seven divisions with manufacturing facilities located in Indiana, Georgia, Michigan and Oregon. These products are marketed through a nationwide
dealer network. The Company’s Housing Group, with locations in Indiana, Iowa, North Carolina and Tennessee, supplies modular housing to builder/dealers in 18 adjoining states. The Company’s
Parts and Supply Group concentrates primarily on providing parts and supplies to the recreational vehicle and van conversion industries, and also has an important interest in the office furniture market.
Brought to you by Global Reports
1997 1996 1995 1994 1993% % % % %
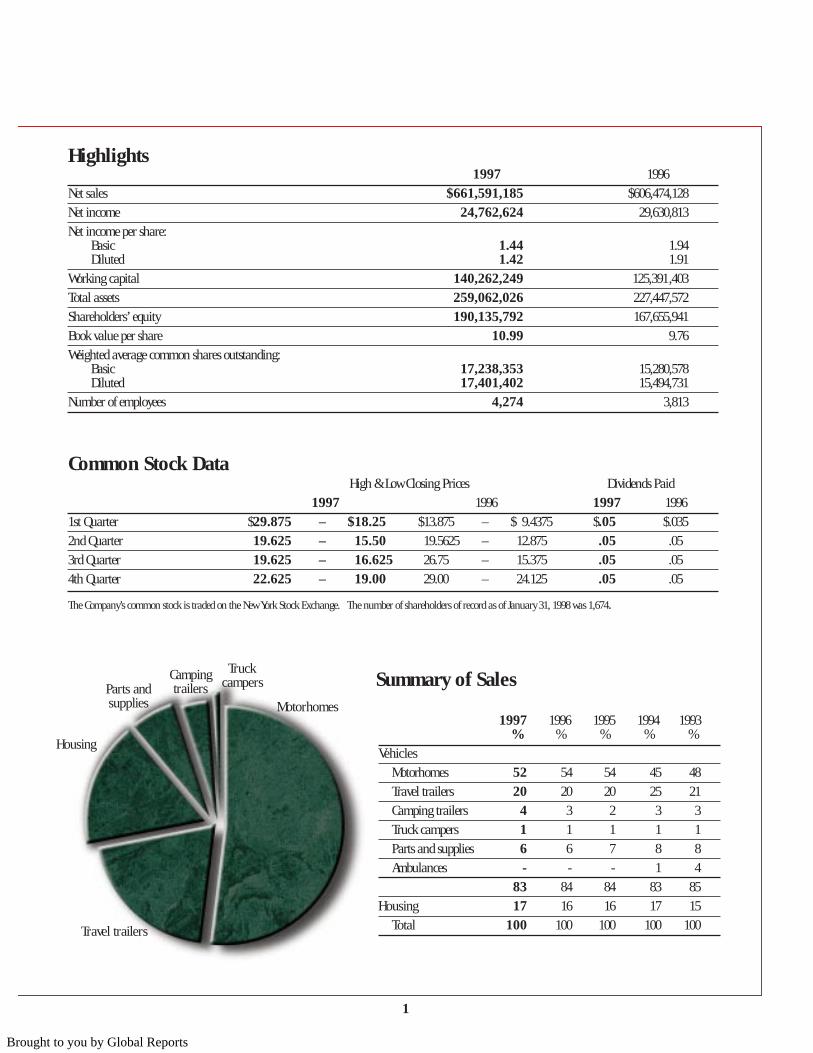
VehiclesMotorhomes 52 54 54 45 48
Travel trailers 20 20 20 25 21
Camping trailers 4 3 2 3 3
Truck campers 1 1 1 1 1
Parts and supplies 6 6 7 8 8
Ambulances - - - 1 4
83 84 84 83 85
Housing 17 16 16 17 15
Total 100 100 100 100 100
Summary of SalesMotorhomes
Campingtrailers
Truck campersParts and
supplies
Housing
Travel trailers
Highlights1997 1996
Net sales $661,591,185 $606,474,128
Net income 24,762,624 29,630,813
Net income per share:Basic 1.44 1.94Diluted 1.42 1.91
Working capital 140,262,249 125,391,403
Total assets 259,062,026 227,447,572
Shareholders’ equity 190,135,792 167,655,941
Book value per share 10.99 9.76
Weighted average common shares outstanding:Basic 17,238,353 15,280,578Diluted 17,401,402 15,494,731
Number of employees 4,274 3,813
Common Stock DataHigh & Low Closing Prices Dividends Paid
1997 1996 1997 1996
1st Quarter $29.875 – $18.25 $13.875 – $ 9.4375 $.05 $.035
2nd Quarter 19.625 – 15.50 19.5625 – 12.875 .05 .05
3rd Quarter 19.625 – 16.625 26.75 – 15.375 .05 .05
4th Quarter 22.625 – 19.00 29.00 – 24.125 .05 .05
The Company’s common stock is traded on the New York Stock Exchange. The number of shareholders of record as of January 31, 1998 was 1,674.
1
Brought to you by Global Reports
Shareholders Message
To Our Shareholders,
Nineteen ninety-seven can best be characterized as a periodof new growth records, continued momentum, and invest-ing in our future.
It is a pleasure to again report record sales for both the yearand the fourth quarter. This sales performance is particu-larly rewarding since the recreational vehicle and housing markets we serve were essentially flat in 1997.
Sales for the year reached another all-time high of$661,591,185, a nine percent increase over 1996 record-setting sales of $606,474,128.
Fourth quarter sales also set a new record at $159,231,783.This was a 16 percent increase over sales of $136,874,816 during the same period last year.
Earnings for the year were $24,762,624, down from 1996’srecord income of $27,336,830 before the $2,293,983 cumulative effect of an accounting change. Basic earningsper share were $1.44 compared with $1.79 in 1996 beforethe accounting change, which contributed an additional 15cents per share in 1996. Diluted earnings per share beforethe accounting change were $1.42 in 1997 and $1.76 in 1996.
Comparative earnings were much improved in the fourthquarter, as net income was $6,320,709 versus $6,361,571 in1996. Fourth quarter basic earnings per share, with moreshares outstanding, were 37 cents compared with last year’s40 cents. Diluted earnings per share were 36 cents com-pared to 39 cents last year.
Sales and earnings for 1997 were impacted by sluggish,weather-related first-half sales in the RV industry, whichrepresents 77 percent of our business. However, we experi-enced a strong rebound in the second half, propelled largely by very favorable responses to our new models introduced
mid-year. To put this into perspective, the percentageincreases in quarterly RV Group sales, compared to 1996,were +1 percent, -1 percent, +18 percent and +19 percent,respectively.
Despite the slow start, the RV Group ended the year with avery respectable sales gain of eight percent, once again outpacing the industry which posted a unit gain of 2.8 percent. As a result, the group has continued its impressivegain in market share.
The RV Group has consistently out-performed the industrysince 1991, when several key marketing strategies wereimplemented. The success of these plans is best measuredin market share, and ours has increased a remarkable 56.9percent during this period of time.
Your management is very pleased with the outlook for thismajor segment of our business. As a result, in 1997 weadded capacity, absorbed the short-term costs of severalplant start-ups, and invested in new equipment andprocesses that should improve our operating efficiencies inthe future.
The second major segment of our business is modular housing, which comprises 17 percent of total revenues. We are pleased to report that the Housing Group also continues to gain market share and enjoyed a 15 percentsales gain in 1997.
To ensure continued growth in this important segment, significant investments were made this year. Earnings weremost impacted by the implementation of a seven-day work-week at our largest housing operation in Decatur, Indiana.While this increase in capacity has been costly, it has been necessary to accommodate demand, which consistently hasbeen stronger than our ability to supply.
2
Brought to you by Global Reports
Overall, the Housing Group’s sales remain strong and interest rates continue to be a favorable factor. In fact, oneof our current challenges is delivery delays caused by slowermortgage approvals, which are competing with theavalanche of refinancing applications.
The third segment of our business is the Parts and SupplyGroup, which represents six percent of the total. It recordeda small sales gain in the fourth quarter, but is largelydependent upon OEM sales in the RV and van conversionindustries. In 1997, it struggled with the downtrend in vanconversions, which have experienced intense competitionfrom sport utility vehicles. The group is making salesheadway by focusing on markets outside their traditionalcustomer base.
The outlook for the Company appears quite positive.Interest rates are low, fuel is readily available barring amajor conflict in the Persian Gulf region, and consumerconfidence is at a 30-year high. The economy is vibrantand is expected to remain positive despite the economicconcerns in Southeast Asia. Even that situation seems to behelpful for our Company, as it results in lower raw materialcosts of lumber, luan and copper.
Finally, we expect to benefit from the baby boom genera-tion, which is moving into the prime RV buying ages of 50plus. This demographic trend bodes well for both our shortand long-term future. Your management will do our bestto continue to capitalize on all of these very favorable circumstances.
We would like to thank all of our shareholders for your continued confidence, and the continued support of our customers, employees and suppliers is sincerely appreciated.
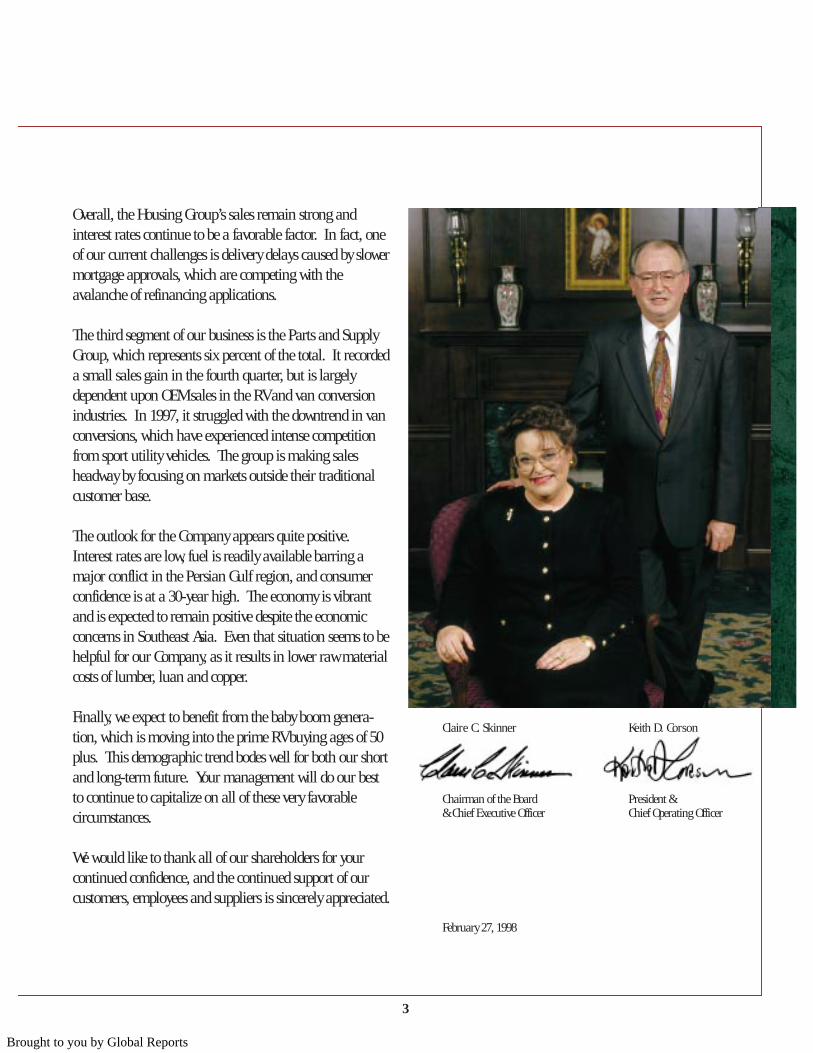
Claire C. Skinner Keith D. Corson
Chairman of the Board President && Chief Executive Officer Chief Operating Officer
February 27, 1998
3
Brought to you by Global Reports
Recreational Vehicle Group
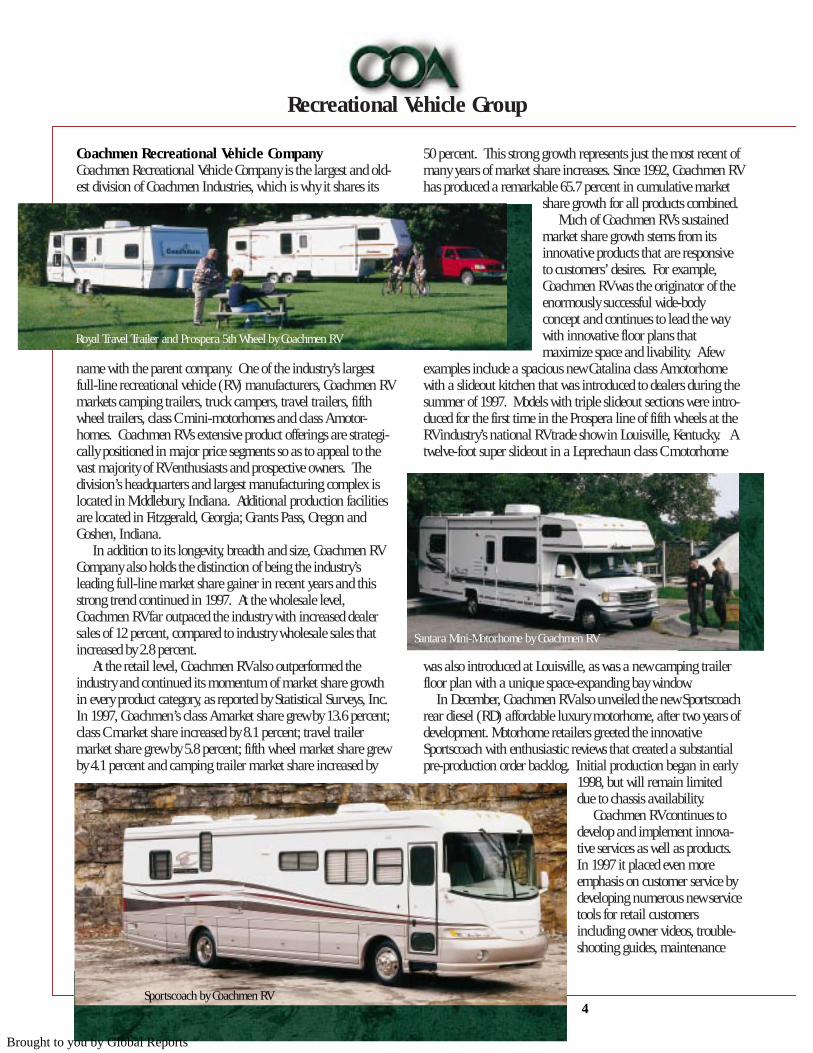
Coachmen Recreational Vehicle CompanyCoachmen Recreational Vehicle Company is the largest and old-est division of Coachmen Industries, which is why it shares its
name with the parent company. One of the industry’s largestfull-line recreational vehicle (RV) manufacturers, Coachmen RV markets camping trailers, truck campers, travel trailers, fifthwheel trailers, class C mini-motorhomes and class A motor-homes. Coachmen RV’s extensive product offerings are strategi-cally positioned in major price segments so as to appeal to thevast majority of RV enthusiasts and prospective owners. Thedivision’s headquarters and largest manufacturing complex islocated in Middlebury, Indiana. Additional production facilitiesare located in Fitzgerald, Georgia; Grants Pass, Oregon andGoshen, Indiana.
In addition to its longevity, breadth and size, Coachmen RVCompany also holds the distinction of being the industry’s leading full-line market share gainer in recent years and thisstrong trend continued in 1997. At the wholesale level,Coachmen RV far outpaced the industry with increased dealersales of 12 percent, compared to industry wholesale sales thatincreased by 2.8 percent.
At the retail level, Coachmen RV also outperformed theindustry and continued its momentum of market share growthin every product category, as reported by Statistical Surveys, Inc.In 1997, Coachmen’s class A market share grew by 13.6 percent;class C market share increased by 8.1 percent; travel trailer market share grew by 5.8 percent; fifth wheel market share grewby 4.1 percent and camping trailer market share increased by
50 percent. This strong growth represents just the most recent ofmany years of market share increases. Since 1992, Coachmen RVhas produced a remarkable 65.7 percent in cumulative market
share growth for all products combined. Much of Coachmen RV’s sustained
market share growth stems from itsinnovative products that are responsiveto customers’ desires. For example,Coachmen RV was the originator of theenormously successful wide-body concept and continues to lead the waywith innovative floor plans that maximize space and livability. A few
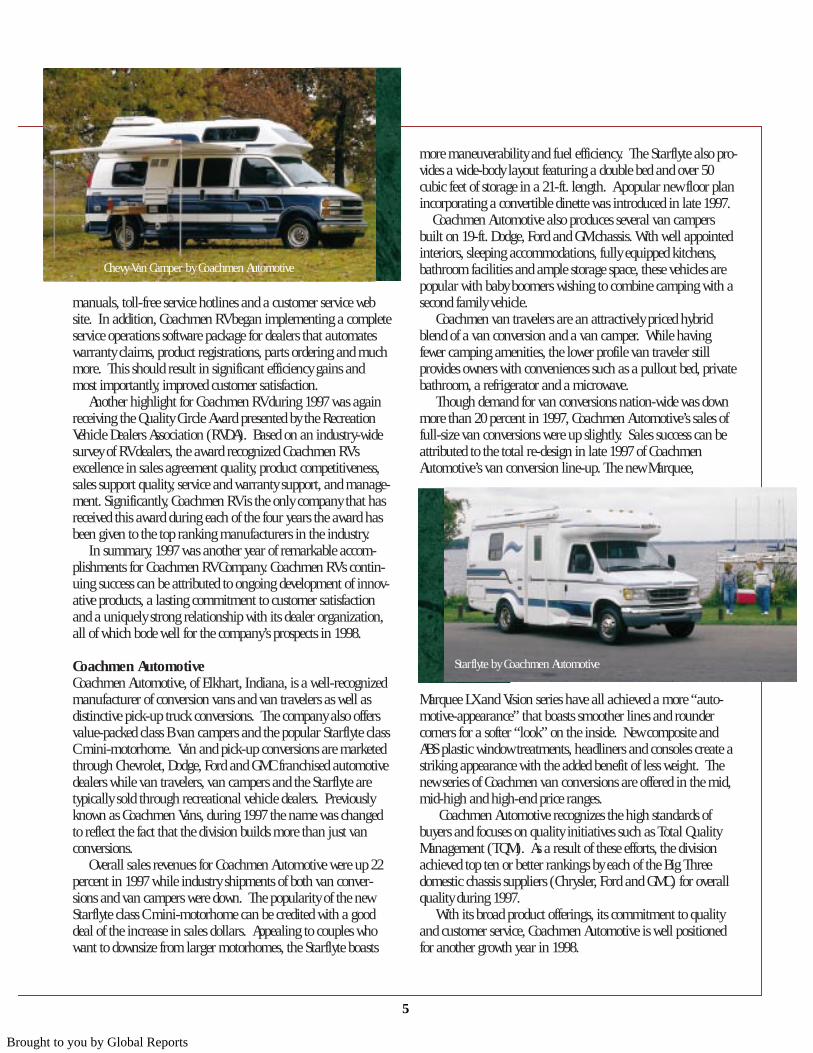
examples include a spacious new Catalina class A motorhomewith a slideout kitchen that was introduced to dealers during thesummer of 1997. Models with triple slideout sections were intro-duced for the first time in the Prospera line of fifth wheels at theRV industry’s national RV trade show in Louisville, Kentucky. Atwelve-foot super slideout in a Leprechaun class C motorhome
was also introduced at Louisville, as was a new camping trailerfloor plan with a unique space-expanding bay window.
In December, Coachmen RV also unveiled the new Sportscoachrear diesel (RD) affordable luxury motorhome, after two years ofdevelopment. Motorhome retailers greeted the innovativeSportscoach with enthusiastic reviews that created a substantialpre-production order backlog. Initial production began in early
1998, but will remain limiteddue to chassis availability.
Coachmen RV continues todevelop and implement innova-tive services as well as products.In 1997 it placed even moreemphasis on customer service bydeveloping numerous new servicetools for retail customers including owner videos, trouble-shooting guides, maintenance
Royal Travel Trailer and Prospera 5th Wheel by Coachmen RV
Santara Mini-Motorhome by Coachmen RV
Sportscoach by Coachmen RV4
Brought to you by Global Reports
manuals, toll-free service hotlines and a customer service website. In addition, Coachmen RV began implementing a completeservice operations software package for dealers that automateswarranty claims, product registrations, parts ordering and muchmore. This should result in significant efficiency gains andmost importantly, improved customer satisfaction.
Another highlight for Coachmen RV during 1997 was againreceiving the Quality Circle Award presented by the RecreationVehicle Dealers Association (RVDA). Based on an industry-widesurvey of RV dealers, the award recognized Coachmen RV’s excellence in sales agreement quality, product competitiveness,sales support quality, service and warranty support, and manage-ment. Significantly, Coachmen RV is the only company that hasreceived this award during each of the four years the award hasbeen given to the top ranking manufacturers in the industry.
In summary, 1997 was another year of remarkable accom-plishments for Coachmen RV Company. Coachmen RV’s contin-uing success can be attributed to ongoing development of innov-ative products, a lasting commitment to customer satisfactionand a uniquely strong relationship with its dealer organization,all of which bode well for the company’s prospects in 1998.
Coachmen AutomotiveCoachmen Automotive, of Elkhart, Indiana, is a well-recognizedmanufacturer of conversion vans and van travelers as well asdistinctive pick-up truck conversions. The company also offersvalue-packed class B van campers and the popular Starflyte classC mini-motorhome. Van and pick-up conversions are marketedthrough Chevrolet, Dodge, Ford and GMC franchised automotivedealers while van travelers, van campers and the Starflyte aretypically sold through recreational vehicle dealers. Previouslyknown as Coachmen Vans, during 1997 the name was changedto reflect the fact that the division builds more than just vanconversions.
Overall sales revenues for Coachmen Automotive were up 22percent in 1997 while industry shipments of both van conver-sions and van campers were down. The popularity of the newStarflyte class C mini-motorhome can be credited with a gooddeal of the increase in sales dollars. Appealing to couples whowant to downsize from larger motorhomes, the Starflyte boasts
more maneuverability and fuel efficiency. The Starflyte also pro-vides a wide-body layout featuring a double bed and over 50cubic feet of storage in a 21-ft. length. A popular new floor planincorporating a convertible dinette was introduced in late 1997.
Coachmen Automotive also produces several van campersbuilt on 19-ft. Dodge, Ford and GM chassis. With well appointedinteriors, sleeping accommodations, fully equipped kitchens,bathroom facilities and ample storage space, these vehicles arepopular with baby boomers wishing to combine camping with asecond family vehicle.
Coachmen van travelers are an attractively priced hybridblend of a van conversion and a van camper. While havingfewer camping amenities, the lower profile van traveler still provides owners with conveniences such as a pullout bed, privatebathroom, a refrigerator and a microwave.
Though demand for van conversions nation-wide was downmore than 20 percent in 1997, Coachmen Automotive’s sales offull-size van conversions were up slightly. Sales success can beattributed to the total re-design in late 1997 of CoachmenAutomotive’s van conversion line-up. The new Marquee,
Marquee LX and Vision series have all achieved a more “auto-motive-appearance” that boasts smoother lines and rounder corners for a softer “look” on the inside. New composite andABS plastic window treatments, headliners and consoles create astriking appearance with the added benefit of less weight. Thenew series of Coachmen van conversions are offered in the mid,mid-high and high-end price ranges.
Coachmen Automotive recognizes the high standards of buyers and focuses on quality initiatives such as Total QualityManagement (TQM). As a result of these efforts, the divisionachieved top ten or better rankings by each of the Big Threedomestic chassis suppliers (Chrysler, Ford and GMC) for overallquality during 1997.
With its broad product offerings, its commitment to qualityand customer service, Coachmen Automotive is well positionedfor another growth year in 1998.
Chevy Van Camper by Coachmen Automotive
Starflyte by Coachmen Automotive
5
Brought to you by Global Reports
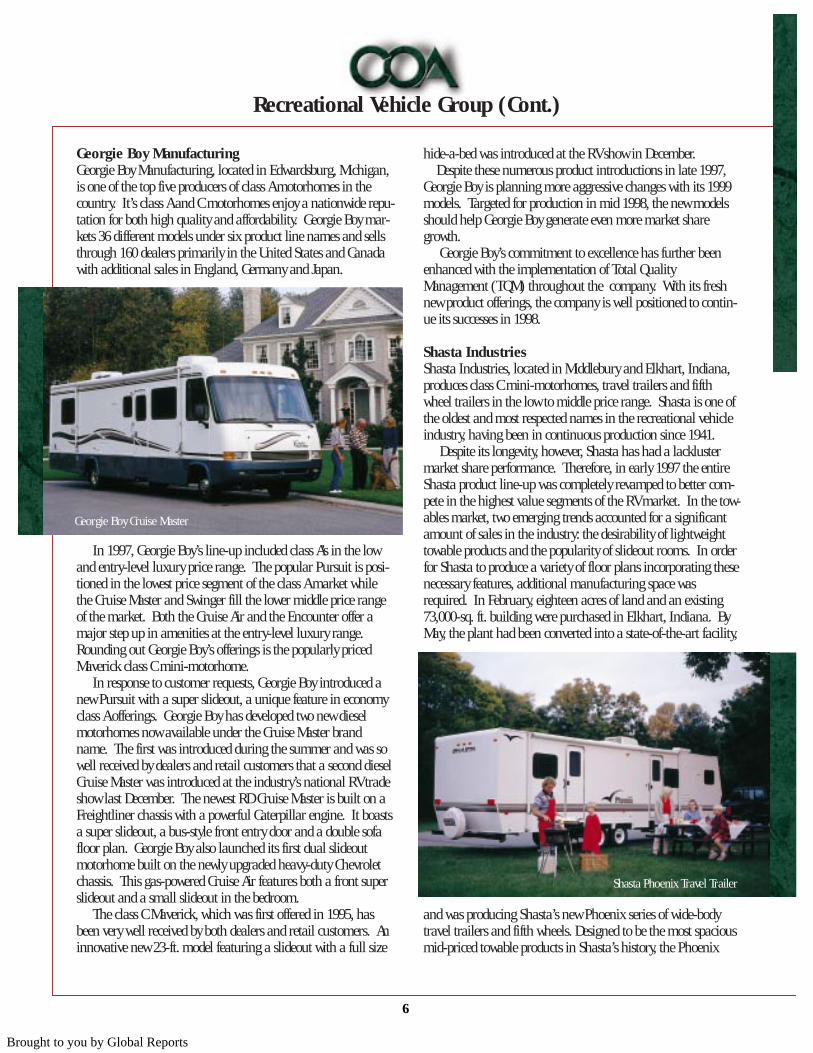
Georgie Boy ManufacturingGeorgie Boy Manufacturing, located in Edwardsburg, Michigan,is one of the top five producers of class A motorhomes in thecountry. It’s class A and C motorhomes enjoy a nationwide repu-tation for both high quality and affordability. Georgie Boy mar-kets 36 different models under six product line names and sellsthrough 160 dealers primarily in the United States and Canadawith additional sales in England, Germany and Japan.
In 1997, Georgie Boy’s line-up included class A’s in the lowand entry-level luxury price range. The popular Pursuit is posi-tioned in the lowest price segment of the class A market whilethe Cruise Master and Swinger fill the lower middle price rangeof the market. Both the Cruise Air and the Encounter offer amajor step up in amenities at the entry-level luxury range.Rounding out Georgie Boy’s offerings is the popularly pricedMaverick class C mini-motorhome.
In response to customer requests, Georgie Boy introduced anew Pursuit with a super slideout, a unique feature in economyclass A offerings. Georgie Boy has developed two new dieselmotorhomes now available under the Cruise Master brandname. The first was introduced during the summer and was sowell received by dealers and retail customers that a second dieselCruise Master was introduced at the industry’s national RV tradeshow last December. The newest RD Cruise Master is built on aFreightliner chassis with a powerful Caterpillar engine. It boastsa super slideout, a bus-style front entry door and a double sofafloor plan. Georgie Boy also launched its first dual slideoutmotorhome built on the newly upgraded heavy-duty Chevroletchassis. This gas-powered Cruise Air features both a front superslideout and a small slideout in the bedroom.
The class C Maverick, which was first offered in 1995, hasbeen very well received by both dealers and retail customers. Aninnovative new 23-ft. model featuring a slideout with a full size
hide-a-bed was introduced at the RV show in December.Despite these numerous product introductions in late 1997,
Georgie Boy is planning more aggressive changes with its 1999models. Targeted for production in mid 1998, the new modelsshould help Georgie Boy generate even more market sharegrowth.
Georgie Boy’s commitment to excellence has further beenenhanced with the implementation of Total QualityManagement (TQM) throughout the company. With its freshnew product offerings, the company is well positioned to contin-ue its successes in 1998.
Shasta IndustriesShasta Industries, located in Middlebury and Elkhart, Indiana,produces class C mini-motorhomes, travel trailers and fifthwheel trailers in the low to middle price range. Shasta is one ofthe oldest and most respected names in the recreational vehicleindustry, having been in continuous production since 1941.
Despite its longevity, however, Shasta has had a lacklustermarket share performance. Therefore, in early 1997 the entireShasta product line-up was completely revamped to better com-pete in the highest value segments of the RV market. In the tow-ables market, two emerging trends accounted for a significantamount of sales in the industry: the desirability of lightweighttowable products and the popularity of slideout rooms. In orderfor Shasta to produce a variety of floor plans incorporating thesenecessary features, additional manufacturing space wasrequired. In February, eighteen acres of land and an existing73,000-sq. ft. building were purchased in Elkhart, Indiana. ByMay, the plant had been converted into a state-of-the-art facility,
and was producing Shasta’s new Phoenix series of wide-bodytravel trailers and fifth wheels. Designed to be the most spaciousmid-priced towable products in Shasta’s history, the Phoenix
Recreational Vehicle Group (Cont.)
Georgie Boy Cruise Master
Shasta Phoenix Travel Trailer
6
Brought to you by Global Reports
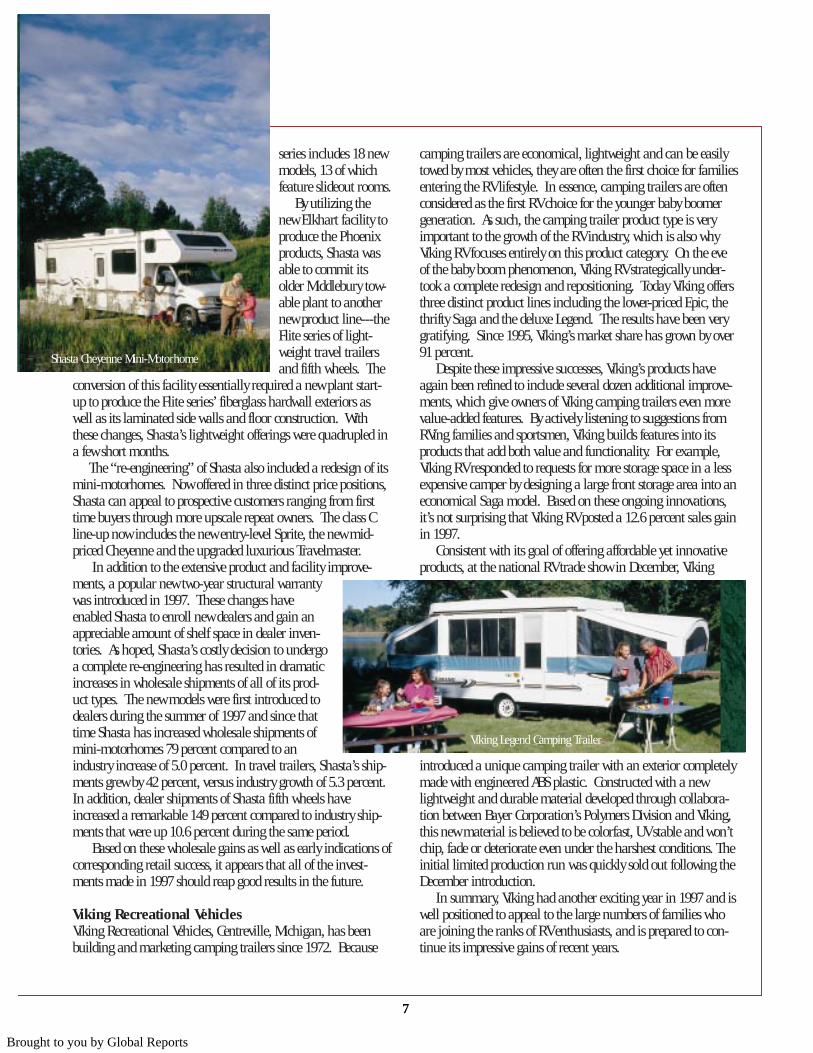
series includes 18 newmodels, 13 of whichfeature slideout rooms.
By utilizing thenew Elkhart facility toproduce the Phoenixproducts, Shasta wasable to commit itsolder Middlebury tow-able plant to anothernew product line---theFlite series of light-weight travel trailersand fifth wheels. The
conversion of this facility essentially required a new plant start-up to produce the Flite series’ fiberglass hardwall exteriors aswell as its laminated side walls and floor construction. Withthese changes, Shasta’s lightweight offerings were quadrupled ina few short months.
The “re-engineering” of Shasta also included a redesign of itsmini-motorhomes. Now offered in three distinct price positions,Shasta can appeal to prospective customers ranging from firsttime buyers through more upscale repeat owners. The class Cline-up now includes the new entry-level Sprite, the new mid-priced Cheyenne and the upgraded luxurious Travelmaster.
In addition to the extensive product and facility improve-ments, a popular new two-year structural warrantywas introduced in 1997. These changes haveenabled Shasta to enroll new dealers and gain anappreciable amount of shelf space in dealer inven-tories. As hoped, Shasta’s costly decision to undergoa complete re-engineering has resulted in dramaticincreases in wholesale shipments of all of its prod-uct types. The new models were first introduced todealers during the summer of 1997 and since thattime Shasta has increased wholesale shipments ofmini-motorhomes 79 percent compared to anindustry increase of 5.0 percent. In travel trailers, Shasta’s ship-ments grew by 42 percent, versus industry growth of 5.3 percent.In addition, dealer shipments of Shasta fifth wheels haveincreased a remarkable 149 percent compared to industry ship-ments that were up 10.6 percent during the same period.
Based on these wholesale gains as well as early indications ofcorresponding retail success, it appears that all of the invest-ments made in 1997 should reap good results in the future.
Viking Recreational VehiclesViking Recreational Vehicles, Centreville, Michigan, has beenbuilding and marketing camping trailers since 1972. Because
camping trailers are economical, lightweight and can be easilytowed by most vehicles, they are often the first choice for familiesentering the RV lifestyle. In essence, camping trailers are oftenconsidered as the first RV choice for the younger baby boomergeneration. As such, the camping trailer product type is veryimportant to the growth of the RV industry, which is also whyViking RV focuses entirely on this product category. On the eveof the baby boom phenomenon, Viking RV strategically under-took a complete redesign and repositioning. Today Viking offersthree distinct product lines including the lower-priced Epic, thethrifty Saga and the deluxe Legend. The results have been verygratifying. Since 1995, Viking’s market share has grown by over91 percent.
Despite these impressive successes, Viking’s products haveagain been refined to include several dozen additional improve-ments, which give owners of Viking camping trailers even morevalue-added features. By actively listening to suggestions fromRVing families and sportsmen, Viking builds features into itsproducts that add both value and functionality. For example,Viking RV responded to requests for more storage space in a lessexpensive camper by designing a large front storage area into aneconomical Saga model. Based on these ongoing innovations,it’s not surprising that Viking RV posted a 12.6 percent sales gainin 1997.
Consistent with its goal of offering affordable yet innovativeproducts, at the national RV trade show in December, Viking
introduced a unique camping trailer with an exterior completelymade with engineered ABS plastic. Constructed with a newlightweight and durable material developed through collabora-tion between Bayer Corporation’s Polymers Division and Viking,this new material is believed to be colorfast, UV stable and won’tchip, fade or deteriorate even under the harshest conditions. Theinitial limited production run was quickly sold out following theDecember introduction.
In summary, Viking had another exciting year in 1997 and iswell positioned to appeal to the large numbers of families whoare joining the ranks of RV enthusiasts, and is prepared to con-tinue its impressive gains of recent years.
Shasta Cheyenne Mini-Motorhome
Viking Legend Camping Trailer
7
Brought to you by Global Reports
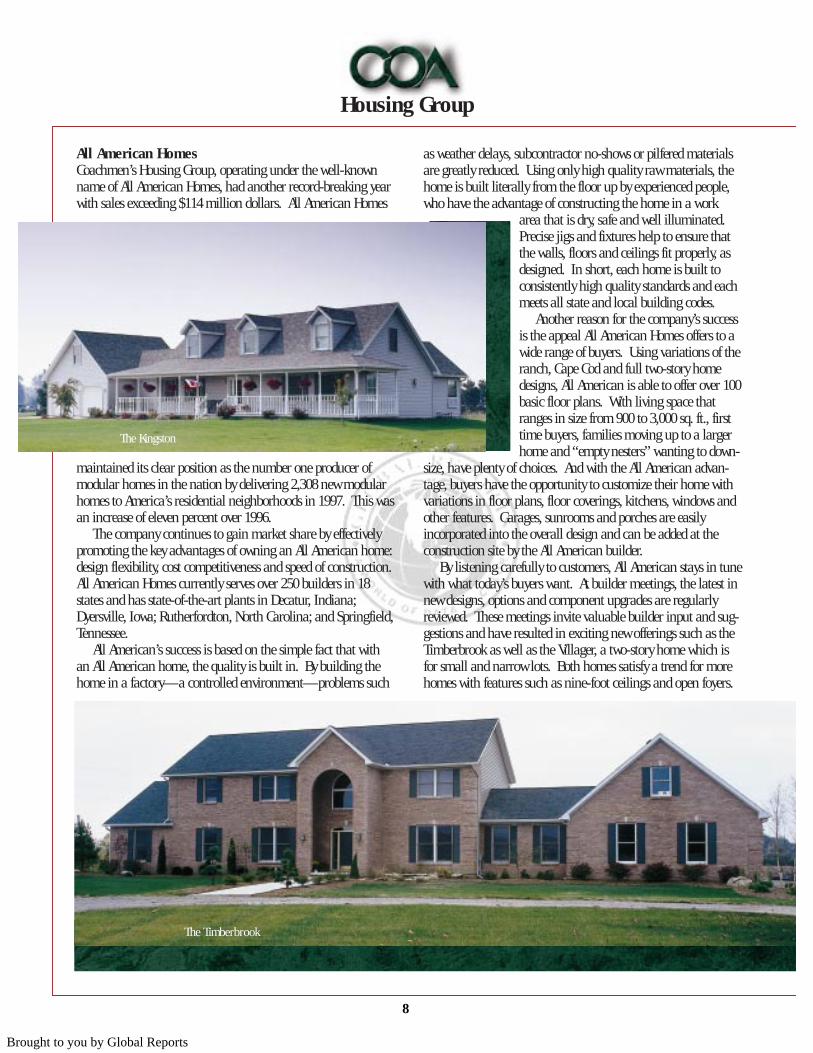
All American HomesCoachmen’s Housing Group, operating under the well-knownname of All American Homes, had another record-breaking yearwith sales exceeding $114 million dollars. All American Homes
maintained its clear position as the number one producer ofmodular homes in the nation by delivering 2,308 new modularhomes to America’s residential neighborhoods in 1997. This wasan increase of eleven percent over 1996.
The company continues to gain market share by effectivelypromoting the key advantages of owning an All American home:design flexibility, cost competitiveness and speed of construction.All American Homes currently serves over 250 builders in 18states and has state-of-the-art plants in Decatur, Indiana;Dyersville, Iowa; Rutherfordton, North Carolina; and Springfield,Tennessee.
All American’s success is based on the simple fact that withan All American home, the quality is built in. By building thehome in a factory—a controlled environment—problems such
as weather delays, subcontractor no-shows or pilfered materialsare greatly reduced. Using only high quality raw materials, thehome is built literally from the floor up by experienced people,who have the advantage of constructing the home in a work
area that is dry, safe and well illuminated.Precise jigs and fixtures help to ensure thatthe walls, floors and ceilings fit properly, asdesigned. In short, each home is built toconsistently high quality standards and eachmeets all state and local building codes.
Another reason for the company’s successis the appeal All American Homes offers to awide range of buyers. Using variations of theranch, Cape Cod and full two-story homedesigns, All American is able to offer over 100basic floor plans. With living space thatranges in size from 900 to 3,000 sq. ft., firsttime buyers, families moving up to a largerhome and “empty nesters” wanting to down-
size, have plenty of choices. And with the All American advan-tage, buyers have the opportunity to customize their home withvariations in floor plans, floor coverings, kitchens, windows andother features. Garages, sunrooms and porches are easily incorporated into the overall design and can be added at theconstruction site by the All American builder.
By listening carefully to customers, All American stays in tunewith what today’s buyers want. At builder meetings, the latest innew designs, options and component upgrades are regularlyreviewed. These meetings invite valuable builder input and sug-gestions and have resulted in exciting new offerings such as theTimberbrook as well as the Villager, a two-story home which isfor small and narrow lots. Both homes satisfy a trend for morehomes with features such as nine-foot ceilings and open foyers.
Housing Group
The Kingston
The Timberbrook
8
Brought to you by Global Reports
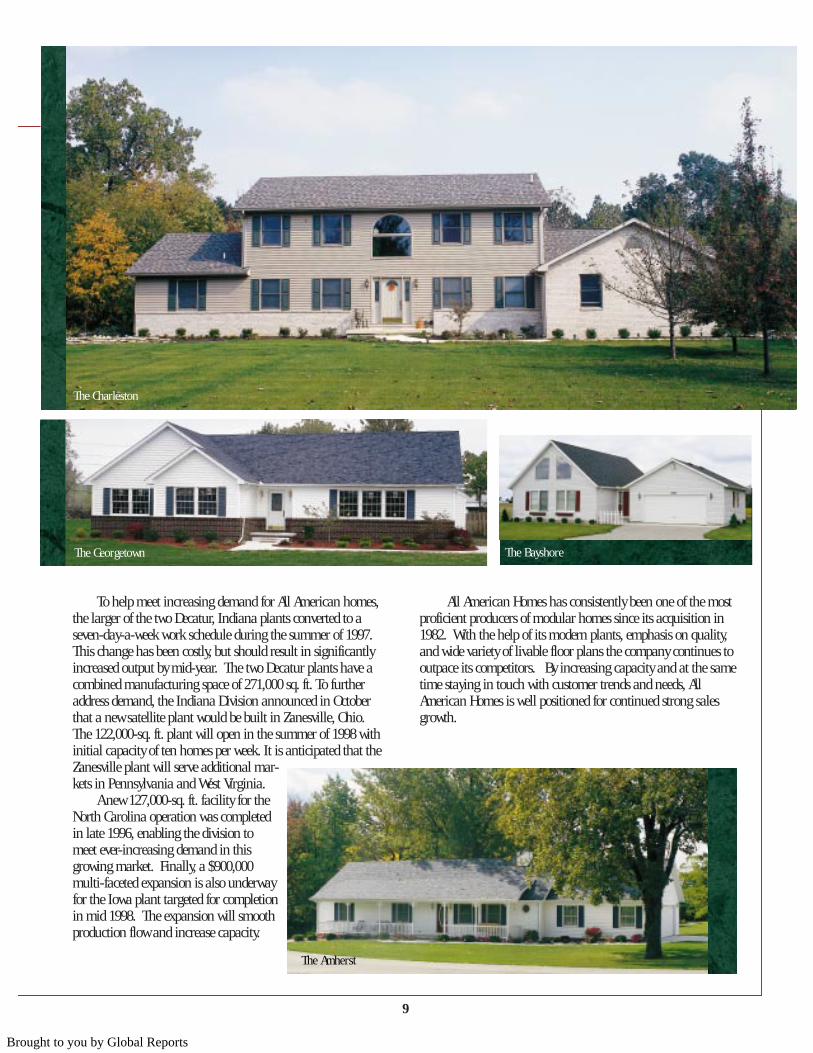
To help meet increasing demand for All American homes,the larger of the two Decatur, Indiana plants converted to aseven-day-a-week work schedule during the summer of 1997.This change has been costly, but should result in significantlyincreased output by mid-year. The two Decatur plants have acombined manufacturing space of 271,000 sq. ft. To furtheraddress demand, the Indiana Division announced in Octoberthat a new satellite plant would be built in Zanesville, Ohio.The 122,000-sq. ft. plant will open in the summer of 1998 withinitial capacity of ten homes per week. It is anticipated that theZanesville plant will serve additional mar-kets in Pennsylvania and West Virginia.
A new 127,000-sq. ft. facility for theNorth Carolina operation was completedin late 1996, enabling the division tomeet ever-increasing demand in thisgrowing market. Finally, a $900,000multi-faceted expansion is also underwayfor the Iowa plant targeted for completion in mid 1998. The expansion will smooth production flow and increase capacity.
All American Homes has consistently been one of the mostproficient producers of modular homes since its acquisition in1982. With the help of its modern plants, emphasis on quality,and wide variety of livable floor plans the company continues tooutpace its competitors. By increasing capacity and at the sametime staying in touch with customer trends and needs, AllAmerican Homes is well positioned for continued strong salesgrowth.
The Charleston
The Georgetown The Bayshore
The Amherst
9
Brought to you by Global Reports
The Lux CompanyThe Lux Company, of Elkhart,Indiana, designs and manufacturesquality seating products for theoffice, healthcare and leisure mar-kets. Lux products are primarily
distributed nationally with some international sales to the Canadian,Mexican and Saudi Arabian markets.
Office seating products are marketed under the trade name Lux Steel.These popular office chairs offer ergonomic features, adjustable lumbarsupports, suspended seating frames and individual position adjustmentmechanisms. In 1997, Lux Steel introduced the Inline Supreme, a newmid-priced managerial chair that boasts the traditional Lux seatingcomfort. The Inline series features a lifetime warranty on the steel chairframe as well as a host of adjustment mechanisms to accommodate theuser’s changing seating needs as the workday progresses. The newInline Supreme series truly exemplifies the motto, “Lux Steel…Adjusting to Meet Your Needs.”
Lux Steel also introduced the Medley seating system. This patentedseating product is perfect for meeting, conference and reception seatingsituations where style and comfort are desired. The Medley chairs willeasily stack eight high and are available with side tables.
Lux Healthcare launched a new steel frame recliner for hospitalroom use. This stylish recliner is packed with features such as a lumbaradjustment and a specially designed release that makes it particularlyconvenient for hospital use. The company also expanded its overnightproduct line by introducing a newly designed continental bed and afull-size sleeper.
Lux Leisure continues to produce quality leisure seating products,including sofas, hide-a-beds, recliners and lounge chairs for the recreational vehicle industry. Lux Leisure serves the needs of otherCoachmen Industries’ RV divisions as well as other RV customers. Thedivision continues to be a leader in the introduction of thoughtfullydesigned, feature-oriented seating products to bring “at home comfort”to today’s active family.
With its excellent reputation for quality products andservice, and with the introduction of exciting new prod-ucts in 1997, the Lux Company expects to continue topost sales gains in all segments of its business.
Viking Formed ProductsViking Formed Products is a major manufacturer offiberglass composite and plastic parts primarily for theautomotive and recreational vehicle industries. Thecompany is made up of four distinct operations.VFP Composites is a fiberglass operation based in Middlebury, Indianawith a second plant in Wildwood, Florida. Prodesign is a plastics thermoformer located in Elkhart, Indiana. Vision Product Developmentin Middlebury is the engineering and design branch of Viking FormedProducts. A new division, Viking Custom Paint in Elkhart, Indiana, wasadded during the summer of 1997.
VFP Composites is a major supplier of front and rear caps andbumpers for the recreational vehicle industry. In addition, the companyproduces stylish tops for conversion vans and other types of vehicles in
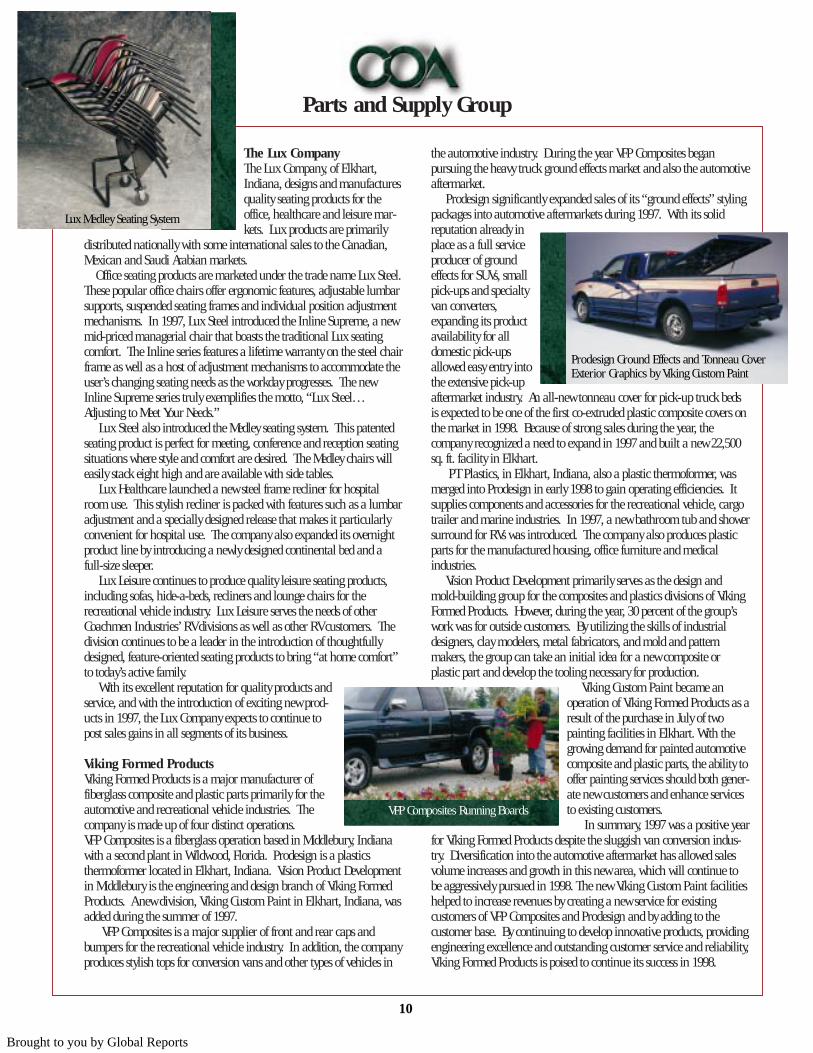
the automotive industry. During the year VFP Composites began pursuing the heavy truck ground effects market and also the automotiveaftermarket.
Prodesign significantly expanded sales of its “ground effects” stylingpackages into automotive aftermarkets during 1997. With its solid reputation already inplace as a full serviceproducer of groundeffects for SUVs, smallpick-ups and specialtyvan converters,expanding its productavailability for alldomestic pick-upsallowed easy entry intothe extensive pick-upaftermarket industry. An all-new tonneau cover for pick-up truck bedsis expected to be one of the first co-extruded plastic composite covers onthe market in 1998. Because of strong sales during the year, the company recognized a need to expand in 1997 and built a new 22,500sq. ft. facility in Elkhart.
PT Plastics, in Elkhart, Indiana, also a plastic thermoformer, wasmerged into Prodesign in early 1998 to gain operating efficiencies. Itsupplies components and accessories for the recreational vehicle, cargotrailer and marine industries. In 1997, a new bathroom tub and showersurround for RVs was introduced. The company also produces plasticparts for the manufactured housing, office furniture and medical industries.
Vision Product Development primarily serves as the design andmold-building group for the composites and plastics divisions of VikingFormed Products. However, during the year, 30 percent of the group’swork was for outside customers. By utilizing the skills of industrialdesigners, clay modelers, metal fabricators, and mold and pattern makers, the group can take an initial idea for a new composite or plastic part and develop the tooling necessary for production.
Viking Custom Paint became an operation of Viking Formed Products as aresult of the purchase in July of twopainting facilities in Elkhart. With thegrowing demand for painted automotivecomposite and plastic parts, the ability tooffer painting services should both gener-ate new customers and enhance servicesto existing customers.
In summary, 1997 was a positive yearfor Viking Formed Products despite the sluggish van conversion indus-try. Diversification into the automotive aftermarket has allowed salesvolume increases and growth in this new area, which will continue tobe aggressively pursued in 1998. The new Viking Custom Paint facilitieshelped to increase revenues by creating a new service for existing customers of VFP Composites and Prodesign and by adding to the customer base. By continuing to develop innovative products, providingengineering excellence and outstanding customer service and reliability,Viking Formed Products is poised to continue its success in 1998.
Parts and Supply Group
VFP Composites Running Boards
Prodesign Ground Effects and Tonneau CoverExterior Graphics by Viking Custom Paint
Lux Medley Seating System
10
Brought to you by Global Reports
Selected Financial Data
Management’s Discussion and Analysis of Financial Condition and Results of OperationsThe following discussion should be read in conjunction with the SelectedFinancial Data and the Consolidated Financial Statements.
OVERVIEW
The Company was founded in 1964 as a manufacturer of RVs and began manufacturing modular homes in 1982. Since that time, the Company hasevolved into a market leader in both business segments through a combinationof internal growth and strategic acquisitions. As part of its continuing effort tofocus on its core business, the Company acquired in January 1995 the thirdlargest class A motorhome producer, Georgie Boy Mfg., Inc., which more thandoubled the Company’s market share in this sector of the motorized RV market.
The Company’s new plant openings have been an important component of itsinternal growth strategy. In May 1995, the Company opened a new modularhousing plant in Tennessee. In addition, the Company further expanded itsmodular housing production capacity with the late 1996 construction of a newfacility for the North Carolina housing operation and in late 1997 started construction of a new housing plant in Ohio. The anticipated completion datefor the new facility in Ohio is June 1998. In March 1996, the Companyincreased its RV production capacity by opening a new fifth wheel and conven-tional travel trailer plant in Oregon. Additional travel trailer plants in Indianaalso became operational in December 1996 and May 1997 to capitalize on thegrowing market share of the value-priced travel trailer segment of the RV business.
The Company’s business segments are cyclical and subject to certain seasonaldemand cycles and changes in general economic and political conditions.Demand in the RV and modular housing industries generally declines duringthe winter season, while sales and profits are generally highest during the
spring and summer months. Inflation and changing prices have had minimaldirect impact on the Company in the past in that selling prices and materialcosts have generally followed the rate of inflation.
RESULTS OF OPERATIONS Comparison of 1997 to 1996
Consolidated net sales for 1997 were $661.6 million, an increase of 9.1% overthe $606.5 million reported in 1996. The Company’s vehicle segment, whichincludes the parts and supply businesses, experienced a sales increase of 7.8%,while the modular housing segment of the Company’s business increased by15.5%. Sales increases in the vehicle segment reflect continued market sharegains in all product categories. The increased capacity in the Company’s housing segment also resulted in continued sales growth, as well as, gains inmarket share. The Company’s RV and housing segments experienced increasesin both the number of units sold and the average sales price per unit.Historically, the Company’s first and fourth quarters are the slowest for sales inboth segments. See Note 13 of Notes to Consolidated Financial Statements forunaudited interim financial information.
Gross profit for the year increased to $92.8 million, or 14.0% of net sales, from$88.5 million, or 14.6% of net sales in 1996. The increase in gross profit for1997 was primarily attributable to the increase in net sales. The decrease in thegross profit percentage represents lower gross margins associated with the housing segment from the Tennessee plant opening and the North Carolinaexpansion, as well as, implementation of a seven-day workweek at our largesthousing operation in Indiana. As these plants better utilize their increasedcapacity, inefficiencies should be reduced and eventually eliminated.
Operating expenses, which include selling, delivery, general and administrativeexpenses, were $57.5 million or 8.7% of net sales in 1997 compared with $48.8
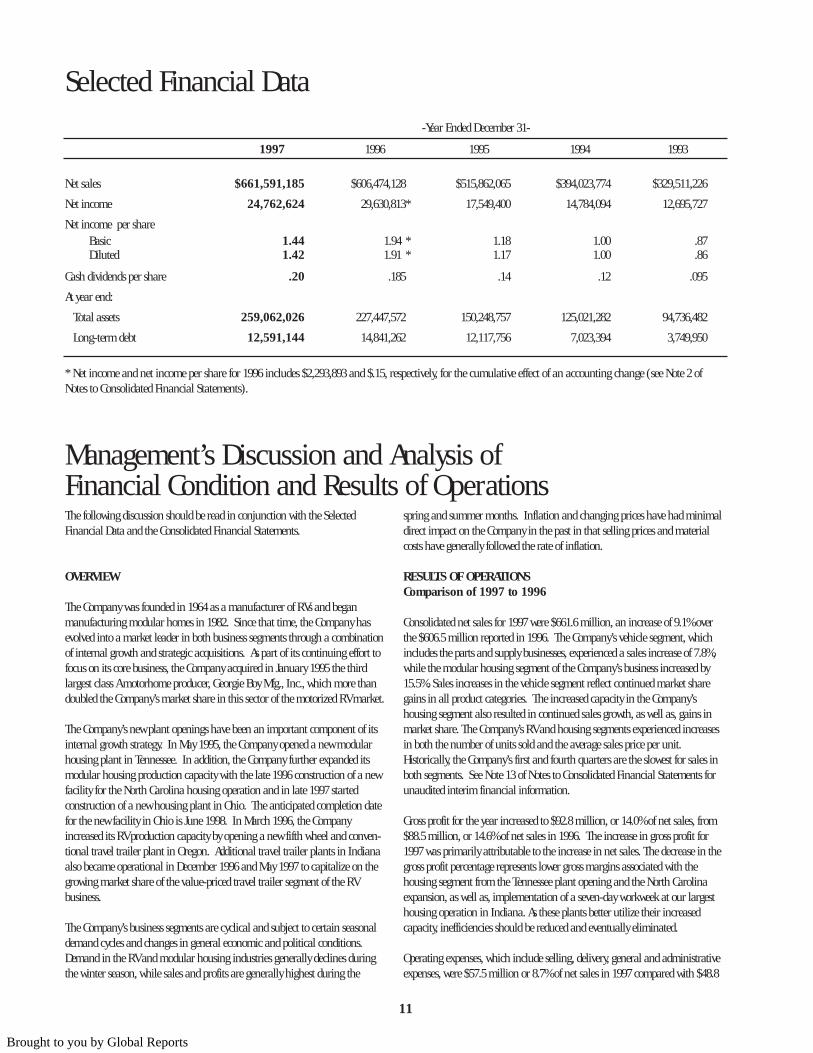
-Year Ended December 31-
1997 1996 1995 1994 1993
Net sales $661,591,185 $606,474,128 $515,862,065 $394,023,774 $329,511,226
Net income 24,762,624 29,630,813* 17,549,400 14,784,094 12,695,727
Net income per shareBasic 1.44 1.94 * 1.18 1.00 .87Diluted 1.42 1.91 * 1.17 1.00 .86
Cash dividends per share .20 .185 .14 .12 .095
At year end:
Total assets 259,062,026 227,447,572 150,248,757 125,021,282 94,736,482
Long-term debt 12,591,144 14,841,262 12,117,756 7,023,394 3,749,950
* Net income and net income per share for 1996 includes $2,293,893 and $.15, respectively, for the cumulative effect of an accounting change (see Note 2 ofNotes to Consolidated Financial Statements).
11
Brought to you by Global Reports
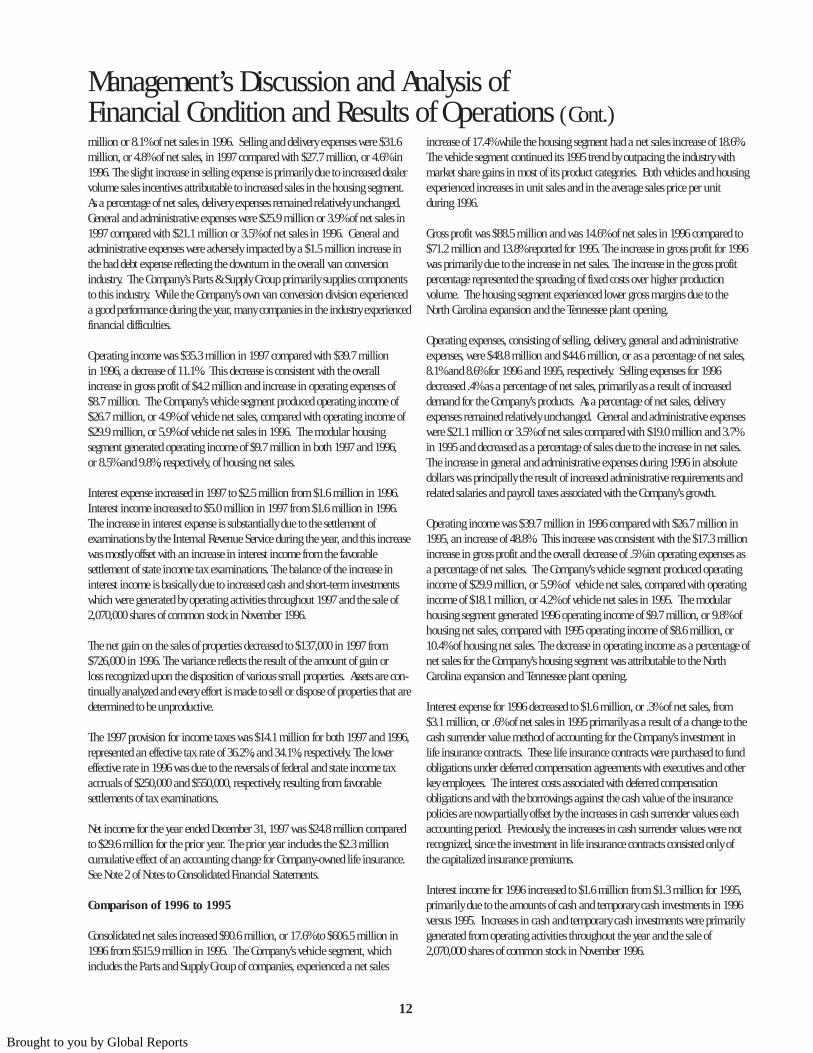
Management’s Discussion and Analysis ofFinancial Condition and Results of Operations (Cont.)million or 8.1% of net sales in 1996. Selling and delivery expenses were $31.6million, or 4.8% of net sales, in 1997 compared with $27.7 million, or 4.6% in1996. The slight increase in selling expense is primarily due to increased dealervolume sales incentives attributable to increased sales in the housing segment.As a percentage of net sales, delivery expenses remained relatively unchanged.General and administrative expenses were $25.9 million or 3.9% of net sales in1997 compared with $21.1 million or 3.5% of net sales in 1996. General andadministrative expenses were adversely impacted by a $1.5 million increase inthe bad debt expense reflecting the downturn in the overall van conversionindustry. The Company’s Parts & Supply Group primarily supplies componentsto this industry. While the Company’s own van conversion division experienceda good performance during the year, many companies in the industry experiencedfinancial difficulties.
Operating income was $35.3 million in 1997 compared with $39.7 million in 1996, a decrease of 11.1%. This decrease is consistent with the overallincrease in gross profit of $4.2 million and increase in operating expenses of$8.7 million. The Company’s vehicle segment produced operating income of$26.7 million, or 4.9% of vehicle net sales, compared with operating income of$29.9 million, or 5.9% of vehicle net sales in 1996. The modular housing segment generated operating income of $9.7 million in both 1997 and 1996, or 8.5% and 9.8%, respectively, of housing net sales.
Interest expense increased in 1997 to $2.5 million from $1.6 million in 1996.Interest income increased to $5.0 million in 1997 from $1.6 million in 1996.The increase in interest expense is substantially due to the settlement of examinations by the Internal Revenue Service during the year, and this increasewas mostly offset with an increase in interest income from the favorable settlement of state income tax examinations. The balance of the increase ininterest income is basically due to increased cash and short-term investmentswhich were generated by operating activities throughout 1997 and the sale of2,070,000 shares of common stock in November 1996.
The net gain on the sales of properties decreased to $137,000 in 1997 from$726,000 in 1996. The variance reflects the result of the amount of gain or loss recognized upon the disposition of various small properties. Assets are con-tinually analyzed and every effort is made to sell or dispose of properties that aredetermined to be unproductive.
The 1997 provision for income taxes was $14.1 million for both 1997 and 1996,represented an effective tax rate of 36.2%, and 34.1%, respectively. The lowereffective rate in 1996 was due to the reversals of federal and state income taxaccruals of $250,000 and $550,000, respectively, resulting from favorable settlements of tax examinations.
Net income for the year ended December 31, 1997 was $24.8 million comparedto $29.6 million for the prior year. The prior year includes the $2.3 millioncumulative effect of an accounting change for Company-owned life insurance.See Note 2 of Notes to Consolidated Financial Statements.
Comparison of 1996 to 1995
Consolidated net sales increased $90.6 million, or 17.6% to $606.5 million in1996 from $515.9 million in 1995. The Company’s vehicle segment, whichincludes the Parts and Supply Group of companies, experienced a net sales
increase of 17.4% while the housing segment had a net sales increase of 18.6%.The vehicle segment continued its 1995 trend by outpacing the industry withmarket share gains in most of its product categories. Both vehicles and housingexperienced increases in unit sales and in the average sales price per unit during 1996.
Gross profit was $88.5 million and was 14.6% of net sales in 1996 compared to$71.2 million and 13.8% reported for 1995. The increase in gross profit for 1996was primarily due to the increase in net sales. The increase in the gross profitpercentage represented the spreading of fixed costs over higher production volume. The housing segment experienced lower gross margins due to theNorth Carolina expansion and the Tennessee plant opening.
Operating expenses, consisting of selling, delivery, general and administrativeexpenses, were $48.8 million and $44.6 million, or as a percentage of net sales,8.1% and 8.6% for 1996 and 1995, respectively. Selling expenses for 1996decreased .4% as a percentage of net sales, primarily as a result of increaseddemand for the Company’s products. As a percentage of net sales, deliveryexpenses remained relatively unchanged. General and administrative expenseswere $21.1 million or 3.5% of net sales compared with $19.0 million and 3.7%in 1995 and decreased as a percentage of sales due to the increase in net sales.The increase in general and administrative expenses during 1996 in absolutedollars was principally the result of increased administrative requirements andrelated salaries and payroll taxes associated with the Company’s growth.
Operating income was $39.7 million in 1996 compared with $26.7 million in1995, an increase of 48.8%. This increase was consistent with the $17.3 millionincrease in gross profit and the overall decrease of .5% in operating expenses asa percentage of net sales. The Company’s vehicle segment produced operatingincome of $29.9 million, or 5.9% of vehicle net sales, compared with operatingincome of $18.1 million, or 4.2% of vehicle net sales in 1995. The modularhousing segment generated 1996 operating income of $9.7 million, or 9.8% ofhousing net sales, compared with 1995 operating income of $8.6 million, or10.4% of housing net sales. The decrease in operating income as a percentage ofnet sales for the Company’s housing segment was attributable to the NorthCarolina expansion and Tennessee plant opening.
Interest expense for 1996 decreased to $1.6 million, or .3% of net sales, from$3.1 million, or .6% of net sales in 1995 primarily as a result of a change to thecash surrender value method of accounting for the Company’s investment inlife insurance contracts. These life insurance contracts were purchased to fundobligations under deferred compensation agreements with executives and otherkey employees. The interest costs associated with deferred compensation obligations and with the borrowings against the cash value of the insurancepolicies are now partially offset by the increases in cash surrender values eachaccounting period. Previously, the increases in cash surrender values were notrecognized, since the investment in life insurance contracts consisted only of the capitalized insurance premiums.
Interest income for 1996 increased to $1.6 million from $1.3 million for 1995,primarily due to the amounts of cash and temporary cash investments in 1996versus 1995. Increases in cash and temporary cash investments were primarilygenerated from operating activities throughout the year and the sale of2,070,000 shares of common stock in November 1996.
12
Brought to you by Global Reports

The gain on sale of properties decreased to $726,000 for 1996 from $793,000 for1995. This small variance is the result of the amount of gain recognized uponthe disposition of various small properties.
Other income, net, represents income of $1.0 million for 1996 compared toincome of $2.3 million for 1995. The 1996 income was primarily from a finaldetermination of insurance proceeds from assets destroyed in a fire that consumed the Company’s Prodesign production facility in August 1995 andinterest participation in finance company transactions. The 1995 income wasprimarily from the Prodesign fire. See Note 12 of Notes to ConsolidatedFinancial Statements.
Income taxes for 1996 increased to $14.1 million, or 2.3% of net sales, from$10.4 million, or 2.0% of net sales in 1995. The effective tax rate was 34.1%compared to 37.2% in 1995. The decrease in the effective tax rate for 1996 isattributable to an increase in nontaxable income and the reversals of federaland state income tax accruals of $250,000 and $550,000, respectively, resultingfrom favorable settlements of tax examinations.
Net income for 1996 was $29.6 million compared to $17.5 million in 1995,which included $2.3 million for the cumulative effect of an accounting changefor Company-owned life insurance. See Note 2 of Notes to ConsolidatedFinancial Statements.
LIQUIDITY AND CAPITAL RESOURCES
The Company generally relies on funds from operations as its primary source ofworking capital and liquidity. In addition, the Company maintains an unsecured committed line of credit, which totaled $30 million at December 31,1997, to meet its seasonal working capital needs. There were no borrowingsagainst this line of credit during 1997, 1996 and 1995. The Company’s operat-ing activities have been a principal source of cash flows in each of the last threeyears. Operating cash flows were $36.7 million, $15.3 million and $13.2 million for 1997, 1996 and 1995, respectively. For each of these years, netincome, adjusted by certain noncash items such as depreciation, was a significant factor in generating operating cash flows. In 1997, an increase inaccounts payable and other current liabilities was basically offset by increases inreceivables. In 1996, net income was utilized to fund the increased inventorylevels associated with higher sales and production. Investing activities usedcash of $27.1 million, $15.7 million and $11.7 million in 1997, 1996 and 1995,respectively. In 1997, the acquisition of short-term investments of $52.1 millionwas partially offset by the sale of short-term investments of $36.5 million.Otherwise the principal use of cash for investing activities in each of the lastthree years has been property, plant and equipment acquisitions. Major capitalexpenditures during 1997 were acquisitions of production facilities for the RVsegment, including properties previously leased, and initiating the constructionof a new facility in Ohio for the housing segment. Major capital expenditures during 1996 included, the North Carolina expansion (financed in part by a $5.0million industrial revenue bond) and the Oregon plant opening. Significantcapital expenditures in 1995 were primarily associated with the Tennessee plantopening. During 1997, financing cash flows basically consisted of payments oflong-term debt, dividends and the purchases of common shares for the treasury.These negative cash flows were partially offset by the issuance of commonshares under stock option and stock purchase plans. Financing cash flows for1996 included $48 million of proceeds from a public sale of the Company’s
common shares and $5 million of proceeds from the industrial revenue bondmentioned above. For a more detailed analysis of the Company’s cash flows foreach of the last three years, see the Consolidated Statements of Cash Flows.The Company’s cash and temporary cash investments at December 31, 1997were $71.4 million, or an increase of $5.0 million over 1996. The Company anticipates that available funds, together with anticipated cash flows generatedfrom future operations and amounts available under its line of credit will besufficient to fund the Company’s planned capital expenditures and other operating cash requirements through the end of 1998.
In 1997, working capital increased $14.9 million, from $125.4 million to$140.3 million. The $26.0 million increase in current assets at December 31,1997 versus December 31, 1996, was primarily due to the current year’s profits,as well as, an increase in trade receivables. The $11.2 million increase in current liabilities is substantially due to increases in trade payables and otherliabilities, principally warranty and income taxes.
OTHER MATTERS
The Company has determined that certain of its computer software was originally programmed using two digits rather than four to define the applicable year. As a result, this software may be unable to process transactionsbeyond December 31, 1999. The Company has undertaken to replace the affected software and has established a timetable for completion of not laterthan December 31, 1998. The total cost of the project, including hardware, software and training costs is estimated to be $2.5 million, of which $.5 millionwas incurred during 1997. Failure to successfully implement the new systems,or delays in the implementation could cause disruptions in operations, including, among other things, a temporary inability to process transactions,send invoices or pay vendors and employees.
FORWARD LOOKING STATEMENTS
Some matters set forth herein are forward looking statements that are depen-dent on certain risks and uncertainties including such factors, among others, asthe availability of gasoline, which can impact sales of recreational vehicles;availability of chassis, which are used in the production of many of theCompany’s recreational vehicle products; interest rates, which affect the afford-ability of the Company’s products; and also on the state of the recreational vehicle and modular housing industries in the United States. Other factorsaffecting forward looking statements include competition in these industriesand the Company’s ability to maintain or increase gross margins which arecritical to profitability whether there are or are not increased sales; and theCompany’s ability to make its software compliant with the year 2000. At times,the Company’s actual performance differs materially from its projections andestimates regarding the economy, the recreational vehicle and housing industries and other key performance indicators. The Company’s actual resultscould vary significantly from the performance projected in the forward-lookingstatements.
13
Brought to you by Global Reports
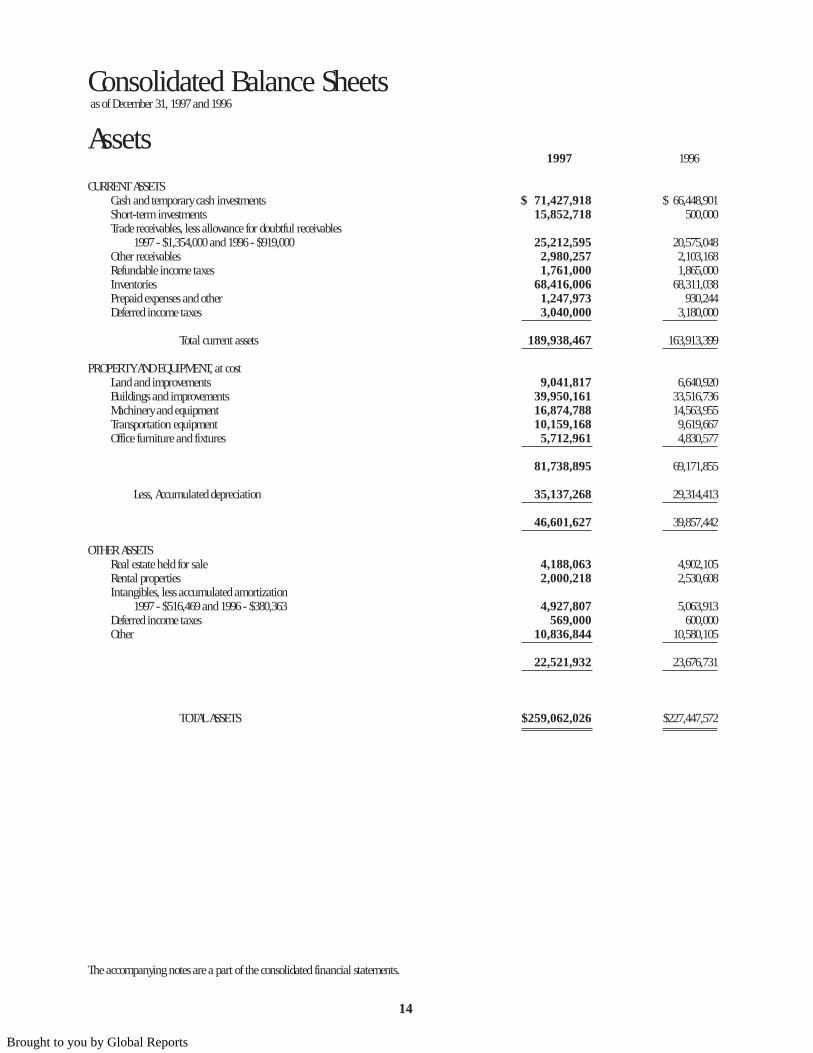
Consolidated Balance Sheetsas of December 31, 1997 and 1996
Assets1997 1996
CURRENT ASSETSCash and temporary cash investments $ 71,427,918 $ 66,448,901Short-term investments 15,852,718 500,000Trade receivables, less allowance for doubtful receivables
1997 - $1,354,000 and 1996 - $919,000 25,212,595 20,575,048Other receivables 2,980,257 2,103,168Refundable income taxes 1,761,000 1,865,000Inventories 68,416,006 68,311,038Prepaid expenses and other 1,247,973 930,244Deferred income taxes 3,040,000 3,180,000
Total current assets 189,938,467 163,913,399
PROPERTY AND EQUIPMENT, at costLand and improvements 9,041,817 6,640,920Buildings and improvements 39,950,161 33,516,736Machinery and equipment 16,874,788 14,563,955Transportation equipment 10,159,168 9,619,667Office furniture and fixtures 5,712,961 4,830,577
81,738,895 69,171,855
Less, Accumulated depreciation 35,137,268 29,314,413
46,601,627 39,857,442
OTHER ASSETSReal estate held for sale 4,188,063 4,902,105Rental properties 2,000,218 2,530,608Intangibles, less accumulated amortization
1997 - $516,469 and 1996 - $380,363 4,927,807 5,063,913Deferred income taxes 569,000 600,000Other 10,836,844 10,580,105
22,521,932 23,676,731
TOTAL ASSETS $259,062,026 $227,447,572
The accompanying notes are a part of the consolidated financial statements.
14
Brought to you by Global Reports
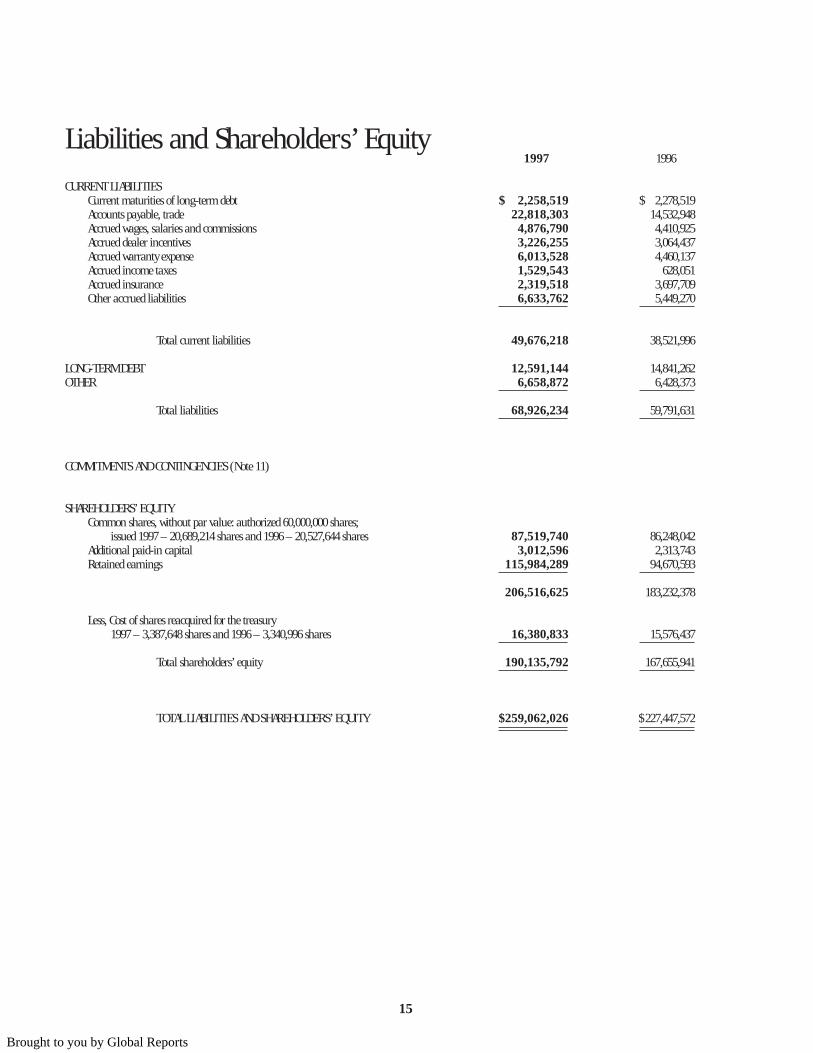
Liabilities and Shareholders’ Equity1997 1996
CURRENT LIABILITIESCurrent maturities of long-term debt $ 2,258,519 $ 2,278,519Accounts payable, trade 22,818,303 14,532,948Accrued wages, salaries and commissions 4,876,790 4,410,925Accrued dealer incentives 3,226,255 3,064,437Accrued warranty expense 6,013,528 4,460,137Accrued income taxes 1,529,543 628,051Accrued insurance 2,319,518 3,697,709Other accrued liabilities 6,633,762 5,449,270
Total current liabilities 49,676,218 38,521,996
LONG-TERM DEBT 12,591,144 14,841,262OTHER 6,658,872 6,428,373
Total liabilities 68,926,234 59,791,631
COMMITMENTS AND CONTINGENCIES (Note 11)
SHAREHOLDERS’ EQUITYCommon shares, without par value: authorized 60,000,000 shares;
issued 1997 – 20,689,214 shares and 1996 – 20,527,644 shares 87,519,740 86,248,042Additional paid-in capital 3,012,596 2,313,743Retained earnings 115,984,289 94,670,593
206,516,625 183,232,378
Less, Cost of shares reacquired for the treasury1997 – 3,387,648 shares and 1996 – 3,340,996 shares 16,380,833 15,576,437
Total shareholders’ equity 190,135,792 167,655,941
TOTAL LIABILITIES AND SHAREHOLDERS’ EQUITY $259,062,026 $ 227,447,572
15
Brought to you by Global Reports
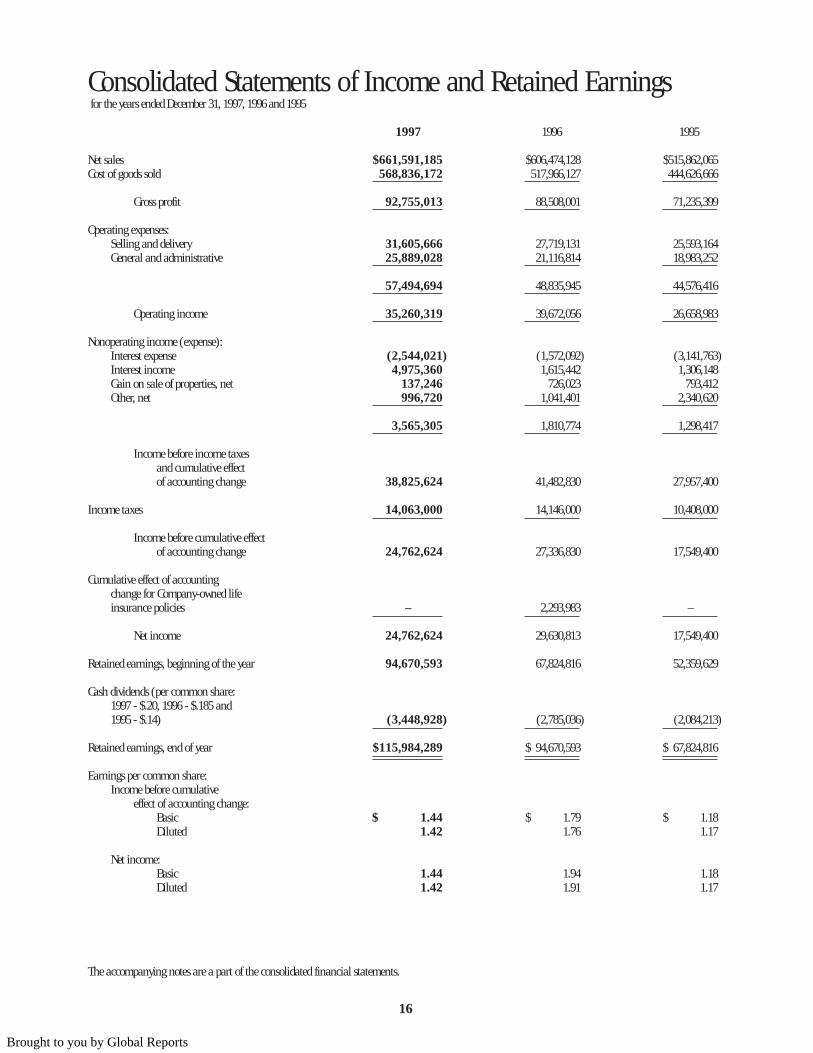
Consolidated Statements of Income and Retained Earningsfor the years ended December 31, 1997, 1996 and 1995
1997 1996 1995
Net sales $661,591,185 $606,474,128 $515,862,065Cost of goods sold 568,836,172 517,966,127 444,626,666
Gross profit 92,755,013 88,508,001 71,235,399
Operating expenses:Selling and delivery 31,605,666 27,719,131 25,593,164General and administrative 25,889,028 21,116,814 18,983,252
57,494,694 48,835,945 44,576,416
Operating income 35,260,319 39,672,056 26,658,983
Nonoperating income (expense):Interest expense (2,544,021) (1,572,092) (3,141,763)Interest income 4,975,360 1,615,442 1,306,148Gain on sale of properties, net 137,246 726,023 793,412Other, net 996,720 1,041,401 2,340,620
3,565,305 1,810,774 1,298,417
Income before income taxesand cumulative effectof accounting change 38,825,624 41,482,830 27,957,400
Income taxes 14,063,000 14,146,000 10,408,000
Income before cumulative effectof accounting change 24,762,624 27,336,830 17,549,400
Cumulative effect of accountingchange for Company-owned lifeinsurance policies – 2,293,983 –
Net income 24,762,624 29,630,813 17,549,400
Retained earnings, beginning of the year 94,670,593 67,824,816 52,359,629
Cash dividends (per common share:1997 - $.20, 1996 - $.185 and1995 - $.14) (3,448,928) (2,785,036) (2,084,213)
Retained earnings, end of year $115,984,289 $ 94,670,593 $ 67,824,816
Earnings per common share:Income before cumulative
effect of accounting change:Basic $ 1.44 $ 1.79 $ 1.18Diluted 1.42 1.76 1.17
Net income:Basic 1.44 1.94 1.18Diluted 1.42 1.91 1.17
The accompanying notes are a part of the consolidated financial statements.
16
Brought to you by Global Reports
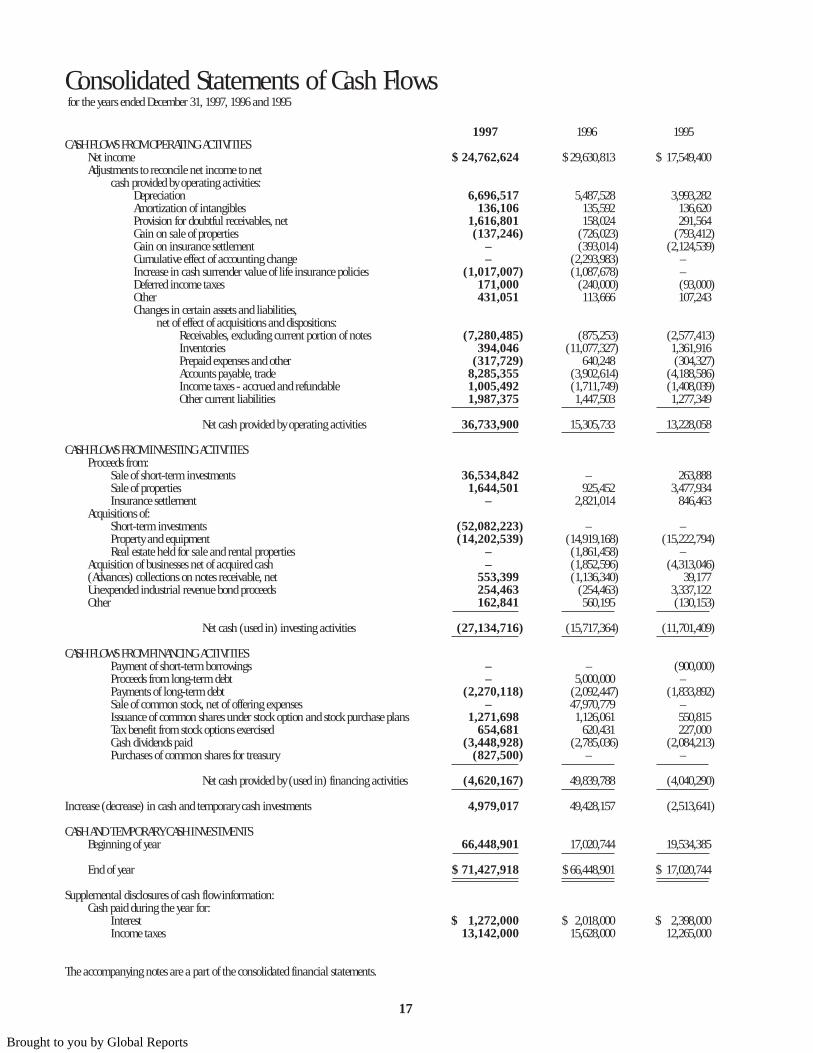
Consolidated Statements of Cash Flowsfor the years ended December 31, 1997, 1996 and 1995
1997 1996 1995CASH FLOWS FROM OPERATING ACTIVITIES
Net income $ 24,762,624 $ 29,630,813 $ 17,549,400Adjustments to reconcile net income to net
cash provided by operating activities:Depreciation 6,696,517 5,487,528 3,993,282Amortization of intangibles 136,106 135,592 136,620Provision for doubtful receivables, net 1,616,801 158,024 291,564Gain on sale of properties (137,246) (726,023) (793,412)Gain on insurance settlement – (393,014) (2,124,539)Cumulative effect of accounting change – (2,293,983) –Increase in cash surrender value of life insurance policies (1,017,007) (1,087,678) –Deferred income taxes 171,000 (240,000) (93,000)Other 431,051 113,666 107,243Changes in certain assets and liabilities,
net of effect of acquisitions and dispositions:Receivables, excluding current portion of notes (7,280,485) (875,253) (2,577,413)Inventories 394,046 (11,077,327) 1,361,916Prepaid expenses and other (317,729) 640,248 (304,327)Accounts payable, trade 8,285,355 (3,902,614) (4,188,586)Income taxes - accrued and refundable 1,005,492 (1,711,749) (1,408,039)Other current liabilities 1,987,375 1,447,503 1,277,349
Net cash provided by operating activities 36,733,900 15,305,733 13,228,058
CASH FLOWS FROM INVESTING ACTIVITIESProceeds from:
Sale of short-term investments 36,534,842 – 263,888Sale of properties 1,644,501 925,452 3,477,934Insurance settlement – 2,821,014 846,463
Acquisitions of:Short-term investments (52,082,223) – –Property and equipment (14,202,539) (14,919,168) (15,222,794)Real estate held for sale and rental properties – (1,861,458) –
Acquisition of businesses net of acquired cash – (1,852,596) (4,313,046)(Advances) collections on notes receivable, net 553,399 (1,136,340) 39,177Unexpended industrial revenue bond proceeds 254,463 (254,463) 3,337,122Other 162,841 560,195 (130,153)
Net cash (used in) investing activities (27,134,716) (15,717,364) (11,701,409)
CASH FLOWS FROM FINANCING ACTIVITIESPayment of short-term borrowings – – (900,000)Proceeds from long-term debt – 5,000,000 –Payments of long-term debt (2,270,118) (2,092,447) (1,833,892)Sale of common stock, net of offering expenses – 47,970,779 –Issuance of common shares under stock option and stock purchase plans 1,271,698 1,126,061 550,815Tax benefit from stock options exercised 654,681 620,431 227,000Cash dividends paid (3,448,928) (2,785,036) (2,084,213)Purchases of common shares for treasury (827,500) – –
Net cash provided by (used in) financing activities (4,620,167) 49,839,788 (4,040,290)
Increase (decrease) in cash and temporary cash investments 4,979,017 49,428,157 (2,513,641)
CASH AND TEMPORARY CASH INVESTMENTSBeginning of year 66,448,901 17,020,744 19,534,385
End of year $ 71,427,918 $ 66,448,901 $ 17,020,744
Supplemental disclosures of cash flow information:Cash paid during the year for:
Interest $ 1,272,000 $ 2,018,000 $ 2,398,000Income taxes 13,142,000 15,628,000 12,265,000
The accompanying notes are a part of the consolidated financial statements.
17
Brought to you by Global Reports
1. NATURE OF OPERATIONS AND ACCOUNTING POLICIES.
Nature of Operations - Coachmen Industries, Inc. and its subsidiaries(the “Company”) manufacture a full line of recreational vehicles and vanconversions through seven divisions with manufacturing facilities located inIndiana, Georgia, Michigan and Oregon. These products are marketed througha nationwide dealer network. The Company’s housing divisions, with locationsin Indiana, Iowa, North Carolina and Tennessee, supply modular housing tobuilder/dealers in eighteen adjoining states. The Company’s parts and supplydivisions concentrate primarily on providing parts and supplies to the recre-ational vehicle and van conversion industries, and also have an importantinterest in the office furniture market.
Principles of Consolidation - The accompanying consolidated financialstatements include the accounts of Coachmen Industries, Inc. and its sub-sidiaries, all of which are wholly owned.
Use of Estimates in the Preparation of Financial Statements -The preparation of financial statements in conformity with generally acceptedaccounting principles requires management to make estimates and assump-tions that affect the reported amounts of assets and liabilities and disclosure ofcontingent assets and liabilities at the date of the financial statements and thereported amounts of revenues and expenses during the reporting period. Actualresults could differ from those estimates.
Revenue Recognition, Concentrations of Credit Risk andAllowances for Credit Losses - Sales are recognized as revenue uponshipment. The Company has a concentration of credit risk in the recreationalvehicle industry, although there is no geographic concentration of credit risk.The Company performs ongoing credit evaluations of its customers’ financialcondition and sales to its recreational vehicle dealers are generally subject topreapproved dealer floor plan financing whereby the Company is paid upondelivery or shortly thereafter. The Company generally requires no collateralfrom its customers. Future credit losses are provided for currently through theallowance for doubtful receivables and actual credit losses are charged to theallowance when incurred.
At December 31, 1997 and 1996, cash and temporary cash investments includeapproximately $42.8 million and $45.2 million, respectively, invested in vari-able rate demand notes with a seven-day put option. In addition, cash andtemporary cash investments include $28.1 million and $20.8 million investedin a money market mutual fund at December 31, 1997 and 1996, respectively.
Cash Flows and Noncash Activities - For purposes of the consolidatedstatements of cash flows, cash and temporary cash investments include cash,cash investments and any highly liquid investments purchased with an originalmaturity of three months or less. The Company’s acquisitions of and disposi-tions of subsidiaries included certain noncash activities (see Note 10). For eachof the three years in the period ended December 31, 1997, the Company issuedcommon shares with a market value of $67,276, $55,665 and $38,280,respectively, in lieu of cash compensation. The Company recognizes a tax benefitin additional paid-in capital from exercise of stock options (see Note 7).
Short-Term Investments - The Company accounts for its short-terminvestments under Statement of Financial Accounting Standards (“SFAS”) No.115, “Accounting for Certain Investments in Debt and Equity Securities” whichrequires certain securities to be categorized as either trading, available-for-saleor held-to-maturity. The Company’s short-term investments at December 31,1997, which consist entirely of equity securities, are classified as available-for-saleand, accordingly, are carried at fair value with unrealized gains and lossesrecorded as a separate component of shareholders’ equity. At December 31,1997, the cost of short-term investments approximated their fair value. AtDecember 31,1996, short-term investments consisted solely of a $500,000 certificate of deposit carried at cost. Realized gains (losses) on sales of invest-ments were $(194,663) in 1997 and $13,888 in 1995. The cost of securitiessold is determined by the specific identification method.
Fair Value of Financial Instruments - The carrying amounts of cashequivalents, short-term investments, receivables and accounts payable approxi-mated fair value as of December 31, 1997 and 1996, because of the relativelyshort maturities of these instruments. The carrying amount of long-term debt,including current maturities, approximated fair value as of December 31, 1997and 1996, based upon terms and conditions currently available to theCompany in comparison to terms and conditions of the existing long-termdebt. The Company has investments in life insurance contracts to fund obliga-tions under deferred compensation agreements (see Notes 2 and 8). AtDecember 31, 1997 and 1996, the carrying amount of these policies, whichequaled their fair value, was $9.9 million and $8.9 million, respectively (cashsurrender values of $22.6 million and $20.3 million, net of $12.7 million and$11.4 million of policy loans, respectively).
Inventories - Inventories are valued at the lower of cost (first-in, first-outmethod) or market.
Property and Equipment - Depreciation is computed by the straight-linemethod on the costs of the assets, at rates based on their estimated useful livesas follows: land improvements 3-15 years; buildings and improvements 10-30years; machinery and equipment 3-10 years; transportation equipment 2-7years; and office furniture and fixtures 2-10 years.
Upon sale or retirement of property and equipment, including real estateheld for sale and rental properties, the asset cost and related accumulateddepreciation is removed from the accounts and any resulting gain or loss isincluded in income.
Real Estate Held For Sale - Real estate held for sale represents realproperties which are carried at the lower of estimated realizable value or costless accumulated depreciation. As of December 31, 1997 and 1996, the carryingvalue of real estate held for sale (and the related accumulated depreciation)aggregated $4,451,596 ($263,533) and $5,269,155 ($367,050), respectively.
Rental Properties - Rental properties represent owned facilities which arecurrently leased to others under lease agreements with expiring terms throughAugust 31, 2002. Certain of the lease agreements contain options for the lesseeto renew the lease or purchase the facilities. Lease income for the years endedDecember 31, 1997, 1996 and 1995 aggregated $302,931, $256,855 and$381,287, respectively. Future minimum annual lease income under theselease agreements is as follows: 1998 - $441,000, 1999 – $419,750, 2000 -$186,000, 2001 - $186,000 and 2002 - $124,000. The rental properties are carriedat cost less accumulated depreciation, which is not in excess of net realizablevalue. The rental properties are depreciated by the straight-line method overthe estimated useful lives of the assets (15- 20 years). At December 31, 1997 and1996, the cost of rental properties (and the related accumulated depreciation)aggregated $2,859,991 ($859,773) and $3,488,179 ($957,571), respectively.
Intangibles - Intangibles represent the excess of cost over the fair value ofnet assets of businesses acquired, and are being amortized over a 40-year periodby the straight-line method.
Income Taxes - The provision for income taxes is based on income recog-nized for financial statement purposes and includes the effects of temporarydifferences between such income and that recognized for tax return purposes.Deferred tax assets and liabilities are established for the expected future taxconsequences of events that have been included in the financial statements ortax returns using enacted tax rates in effect for the years in which the differencesare expected to reverse.
Research and Development Expenses - Research and developmentexpenses charged to operations were approximately $3,521,000, $2,721,000 and$2,240,000 for the years ended December 31, 1997, 1996 and 1995, respectively.
Notes to Consolidated Financial Statements
18
Brought to you by Global Reports
Warranty Expense - The Company accrues an estimated warranty liabilityat the time the warranted products are sold.
Stock-Based Compensation - The Company has adopted the disclosureonly provisions of SFAS No. 123, "Accounting for Stock-Based Compensation,"and, accordingly, accounts for its stock option plan under the provisions ofAccounting Principles Board Opinion No. 25, "Accounting for Stock Issuedto Employees."
New Accounting Pronouncements - In June 1997, the FinancialAccounting Standards Board issued SFAS No. 130, “Reporting ComprehensiveIncome,” and SFAS No. 131, “Disclosure about Segments of an Enterprise andRelated Information.” SFAS No. 130 establishes standards for the reporting anddisclosure of comprehensive income and its components in a full set of generalpurpose financial statements. SFAS No. 131 changes the manner in which publiccompanies report segment information in annual reports and requires companiesto report selected segment information in interim financial reports. Companieswill be required to report financial and descriptive information about theCompany’s operating segments. Both these statements are effective for fiscalyears beginning after December 15, 1997, with reclassification of the financialstatements for earlier periods required for comparative purposes. The Companyplans to adopt these statements for its year ending December 31, 1998.
2. ACCOUNTING CHANGES.
Effective January 1, 1996, the Company changed its method of accounting forits investments in life insurance contracts which were purchased to fund liabil-ities under deferred compensation agreements with executives and other keyemployees. Prior to January 1, 1996, the Company accounted for its investmentsin life insurance contracts by capitalizing premiums under the ratable chargemethod (a method of accounting which was acceptable when the insurancecontracts were originally acquired and continued to be acceptable for contractsacquired prior to November 14, 1985). Effective January 1, 1996, the Companychanged to the cash surrender value method of accounting which is thepreferred method under generally accepted accounting principles, as thismethod more accurately reflects the economic value of the contracts.
On January 1, 1996, the Company recorded a $2.3 million noncash credit forthe cumulative effect of this accounting change ($.15 per share for both basicand diluted earnings per share). This accounting method change alsoincreased income before cumulative effect of accounting change and netincome for the year ended December 31, 1996 by $1,087,678 or $.07 per sharefor both basic and diluted earnings per share. If the cash surrender valuemethod had been applied during 1995, proforma net income would have been$18,292,792 and proforma net income per share would have been $1.23 - basicand $1.22 - diluted.
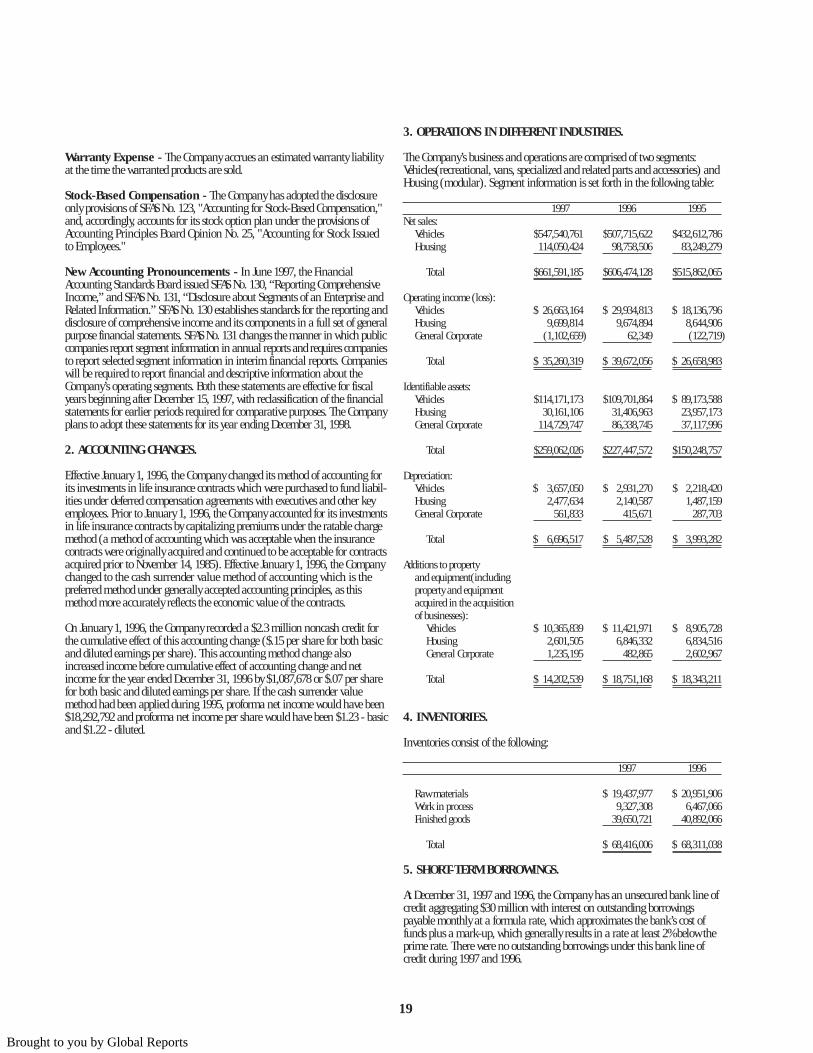
3. OPERATIONS IN DIFFERENT INDUSTRIES.
The Company’s business and operations are comprised of two segments:Vehicles(recreational, vans, specialized and related parts and accessories) andHousing (modular). Segment information is set forth in the following table:
1997 1996 1995Net sales:
Vehicles $547,540,761 $507,715,622 $432,612,786Housing 114,050,424 98,758,506 83,249,279
Total $661,591,185 $606,474,128 $515,862,065
Operating income (loss):Vehicles $ 26,663,164 $ 29,934,813 $ 18,136,796Housing 9,699,814 9,674,894 8,644,906General Corporate (1,102,659) 62,349 (122,719)
Total $ 35,260,319 $ 39,672,056 $ 26,658,983
Identifiable assets:Vehicles $114,171,173 $109,701,864 $ 89,173,588Housing 30,161,106 31,406,963 23,957,173General Corporate 114,729,747 86,338,745 37,117,996
Total $259,062,026 $227,447,572 $150,248,757
Depreciation:Vehicles $ 3,657,050 $ 2,931,270 $ 2,218,420Housing 2,477,634 2,140,587 1,487,159General Corporate 561,833 415,671 287,703
Total $ 6,696,517 $ 5,487,528 $ 3,993,282
Additions to propertyand equipment(including property and equipmentacquired in the acquisitionof businesses):
Vehicles $ 10,365,839 $ 11,421,971 $ 8,905,728Housing 2,601,505 6,846,332 6,834,516General Corporate 1,235,195 482,865 2,602,967
Total $ 14,202,539 $ 18,751,168 $ 18,343,211
4. INVENTORIES.
Inventories consist of the following:
1997 1996
Raw materials $ 19,437,977 $ 20,951,906Work in process 9,327,308 6,467,066Finished goods 39,650,721 40,892,066
Total $ 68,416,006 $ 68,311,038
5. SHORT-TERM BORROWINGS.
At December 31, 1997 and 1996, the Company has an unsecured bank line ofcredit aggregating $30 million with interest on outstanding borrowingspayable monthly at a formula rate, which approximates the bank’s cost offunds plus a mark-up, which generally results in a rate at least 2% below theprime rate. There were no outstanding borrowings under this bank line ofcredit during 1997 and 1996.
19
Brought to you by Global Reports
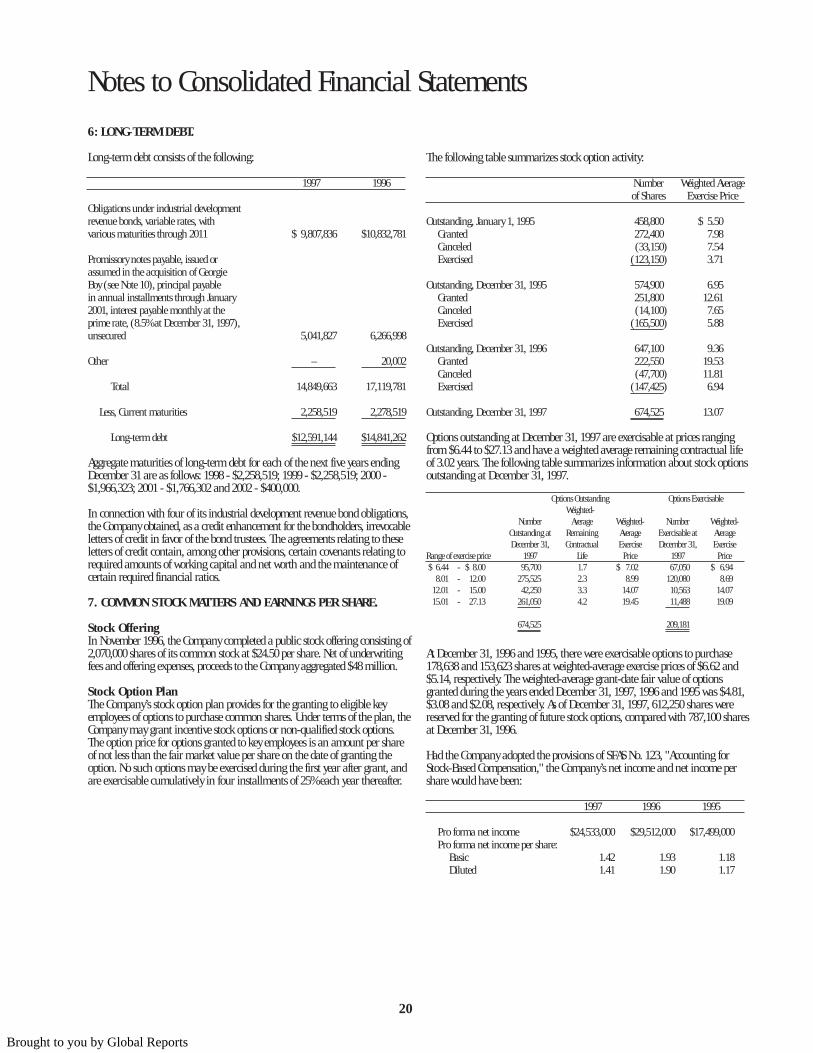
6: LONG-TERM DEBT.
Long-term debt consists of the following:
1997 1996
Obligations under industrial developmentrevenue bonds, variable rates, withvarious maturities through 2011 $ 9,807,836 $10,832,781
Promissory notes payable, issued orassumed in the acquisition of GeorgieBoy (see Note 10), principal payablein annual installments through January 2001, interest payable monthly at theprime rate, (8.5% at December 31, 1997),unsecured 5,041,827 6,266,998
Other – 20,002
Total 14,849,663 17,119,781
Less, Current maturities 2,258,519 2,278,519
Long-term debt $12,591,144 $14,841,262
Aggregate maturities of long-term debt for each of the next five years endingDecember 31 are as follows: 1998 - $2,258,519; 1999 - $2,258,519; 2000 -$1,966,323; 2001 - $1,766,302 and 2002 - $400,000.
In connection with four of its industrial development revenue bond obligations,the Company obtained, as a credit enhancement for the bondholders, irrevocableletters of credit in favor of the bond trustees. The agreements relating to theseletters of credit contain, among other provisions, certain covenants relating torequired amounts of working capital and net worth and the maintenance ofcertain required financial ratios.
7. COMMON STOCK MATTERS AND EARNINGS PER SHARE.
Stock OfferingIn November 1996, the Company completed a public stock offering consisting of2,070,000 shares of its common stock at $24.50 per share. Net of underwritingfees and offering expenses, proceeds to the Company aggregated $48 million.
Stock Option PlanThe Company’s stock option plan provides for the granting to eligible keyemployees of options to purchase common shares. Under terms of the plan, theCompany may grant incentive stock options or non-qualified stock options.The option price for options granted to key employees is an amount per shareof not less than the fair market value per share on the date of granting theoption. No such options may be exercised during the first year after grant, andare exercisable cumulatively in four installments of 25% each year thereafter.
The following table summarizes stock option activity:
Number Weighted Averageof Shares Exercise Price
Outstanding, January 1, 1995 458,800 $ 5.50Granted 272,400 7.98Canceled (33,150) 7.54Exercised (123,150) 3.71
Outstanding, December 31, 1995 574,900 6.95Granted 251,800 12.61Canceled (14,100) 7.65Exercised (165,500) 5.88
Outstanding, December 31, 1996 647,100 9.36Granted 222,550 19.53Canceled (47,700) 11.81Exercised (147,425) 6.94
Outstanding, December 31, 1997 674,525 13.07
Options outstanding at December 31, 1997 are exercisable at prices rangingfrom $6.44 to $27.13 and have a weighted average remaining contractual lifeof 3.02 years. The following table summarizes information about stock optionsoutstanding at December 31, 1997.
At December 31, 1996 and 1995, there were exercisable options to purchase178,638 and 153,623 shares at weighted-average exercise prices of $6.62 and$5.14, respectively. The weighted-average grant-date fair value of optionsgranted during the years ended December 31, 1997, 1996 and 1995 was $4.81,$3.08 and $2.08, respectively. As of December 31, 1997, 612,250 shares werereserved for the granting of future stock options, compared with 787,100 sharesat December 31, 1996.
Had the Company adopted the provisions of SFAS No. 123, "Accounting forStock-Based Compensation," the Company’s net income and net income pershare would have been:
1997 1996 1995
Pro forma net income $24,533,000 $29,512,000 $17,499,000Pro forma net income per share:
Basic 1.42 1.93 1.18Diluted 1.41 1.90 1.17
20
Options Outstanding Options ExercisableWeighted-
Number Average Weighted- Number Weighted-Outstanding at Remaining Average Exercisable at AverageDecember 31, Contractual Exercise December 31, Exercise
Range of exercise price 1997 Life Price 1997 Price$ 6.44 - $ 8.00 95,700 1.7 $ 7.02 67,050 $ 6.94
8.01 - 12.00 275,525 2.3 8.99 120,080 8.6912.01 - 15.00 42,250 3.3 14.07 10,563 14.0715.01 - 27.13 261,050 4.2 19.45 11,488 19.09
674,525 209,181
Notes to Consolidated Financial Statements
Brought to you by Global Reports
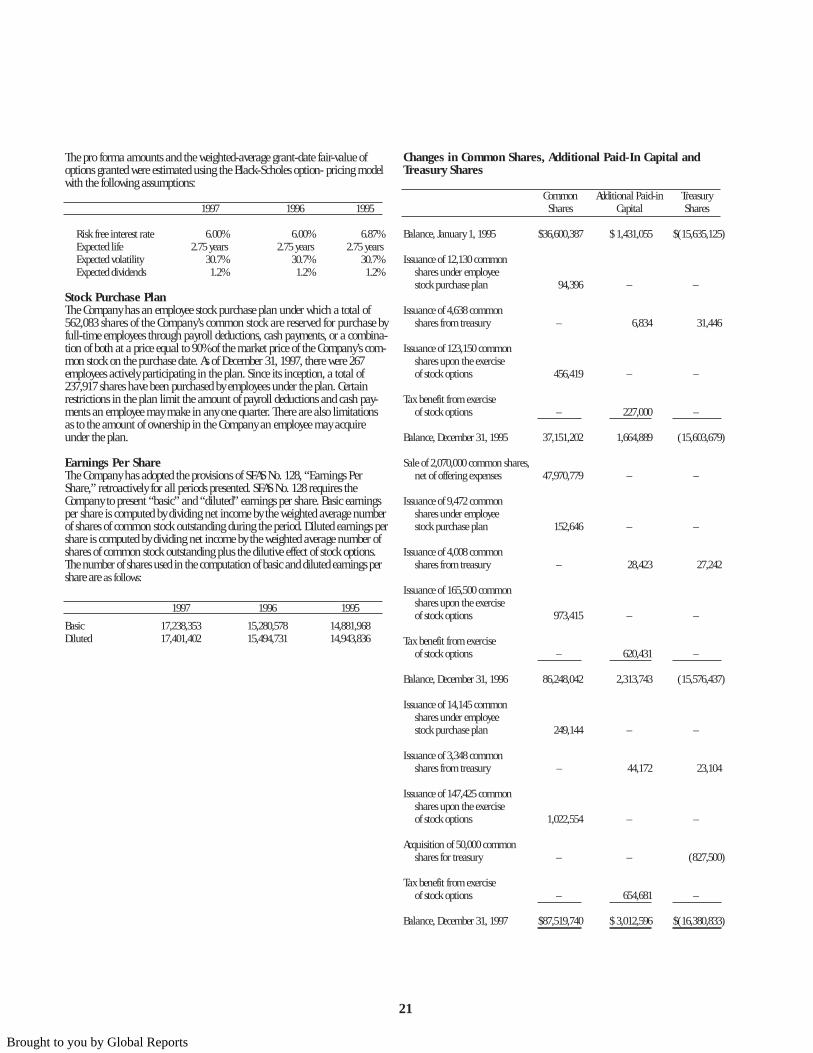
The pro forma amounts and the weighted-average grant-date fair-value ofoptions granted were estimated using the Black-Scholes option- pricing modelwith the following assumptions:
1997 1996 1995
Risk free interest rate 6.00% 6.00% 6.87%Expected life 2.75 years 2.75 years 2.75 yearsExpected volatility 30.7% 30.7% 30.7%Expected dividends 1.2% 1.2% 1.2%
Stock Purchase PlanThe Company has an employee stock purchase plan under which a total of562,083 shares of the Company’s common stock are reserved for purchase byfull-time employees through payroll deductions, cash payments, or a combina-tion of both at a price equal to 90% of the market price of the Company’s com-mon stock on the purchase date. As of December 31, 1997, there were 267employees actively participating in the plan. Since its inception, a total of237,917 shares have been purchased by employees under the plan. Certainrestrictions in the plan limit the amount of payroll deductions and cash pay-ments an employee may make in any one quarter. There are also limitationsas to the amount of ownership in the Company an employee may acquireunder the plan.
Earnings Per ShareThe Company has adopted the provisions of SFAS No. 128, “Earnings PerShare,” retroactively for all periods presented. SFAS No. 128 requires theCompany to present “basic” and “diluted” earnings per share. Basic earningsper share is computed by dividing net income by the weighted average numberof shares of common stock outstanding during the period. Diluted earnings pershare is computed by dividing net income by the weighted average number ofshares of common stock outstanding plus the dilutive effect of stock options.The number of shares used in the computation of basic and diluted earnings pershare are as follows:
1997 1996 1995
Basic 17,238,353 15,280,578 14,881,968Diluted 17,401,402 15,494,731 14,943,836
Changes in Common Shares, Additional Paid-In Capital andTreasury Shares
Common Additional Paid-in Treasury Shares Capital Shares
Balance, January 1, 1995 $36,600,387 $ 1,431,055 $(15,635,125)
Issuance of 12,130 commonshares under employeestock purchase plan 94,396 – –
Issuance of 4,638 commonshares from treasury – 6,834 31,446
Issuance of 123,150 commonshares upon the exercise of stock options 456,419 – –
Tax benefit from exerciseof stock options – 227,000 –
Balance, December 31, 1995 37,151,202 1,664,889 (15,603,679)
Sale of 2,070,000 common shares,net of offering expenses 47,970,779 – –
Issuance of 9,472 commonshares under employeestock purchase plan 152,646 – –
Issuance of 4,008 commonshares from treasury – 28,423 27,242
Issuance of 165,500 commonshares upon the exercise of stock options 973,415 – –
Tax benefit from exerciseof stock options – 620,431 –
Balance, December 31, 1996 86,248,042 2,313,743 (15,576,437)
Issuance of 14,145 commonshares under employeestock purchase plan 249,144 – –
Issuance of 3,348 commonshares from treasury – 44,172 23,104
Issuance of 147,425 commonshares upon the exerciseof stock options 1,022,554 – –
Acquisition of 50,000 commonshares for treasury – – (827,500)
Tax benefit from exerciseof stock options – 654,681 –
Balance, December 31, 1997 $87,519,740 $ 3,012,596 $(16,380,833)
21
Brought to you by Global Reports
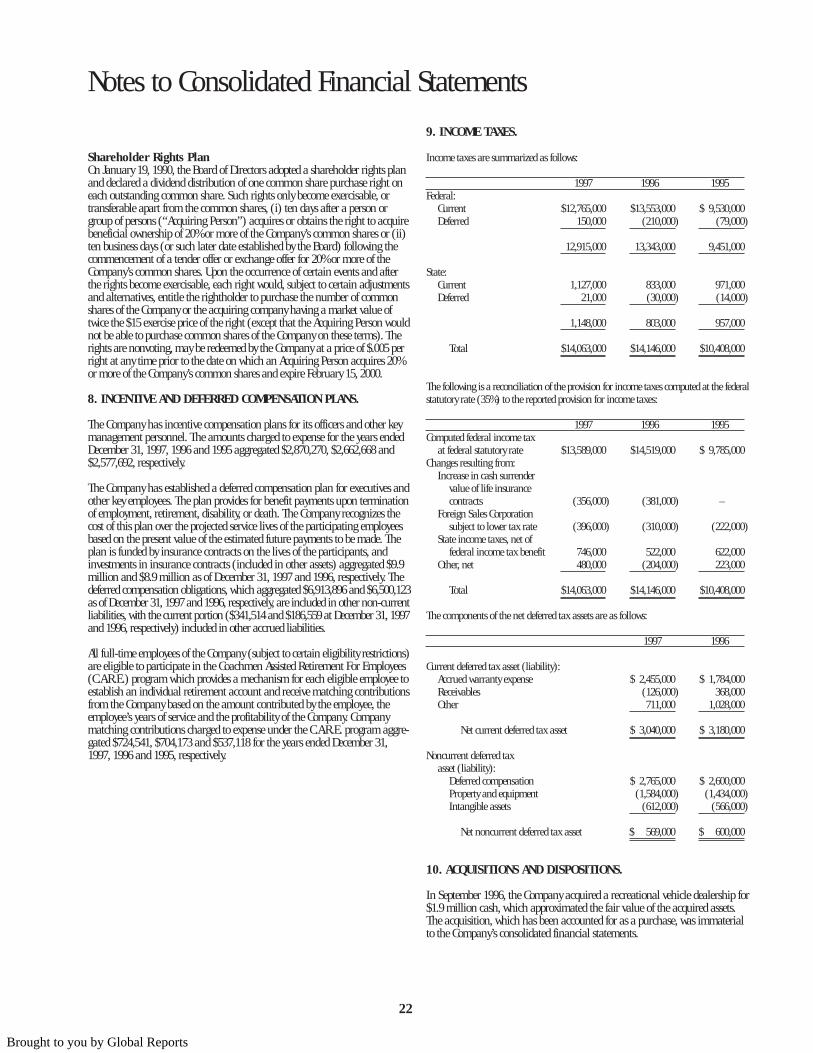
Shareholder Rights PlanOn January 19, 1990, the Board of Directors adopted a shareholder rights planand declared a dividend distribution of one common share purchase right oneach outstanding common share. Such rights only become exercisable, ortransferable apart from the common shares, (i) ten days after a person orgroup of persons (“Acquiring Person”) acquires or obtains the right to acquirebeneficial ownership of 20% or more of the Company’s common shares or (ii)ten business days (or such later date established by the Board) following thecommencement of a tender offer or exchange offer for 20% or more of theCompany’s common shares. Upon the occurrence of certain events and afterthe rights become exercisable, each right would, subject to certain adjustmentsand alternatives, entitle the rightholder to purchase the number of commonshares of the Company or the acquiring company having a market value oftwice the $15 exercise price of the right (except that the Acquiring Person wouldnot be able to purchase common shares of the Company on these terms). Therights are nonvoting, may be redeemed by the Company at a price of $.005 perright at any time prior to the date on which an Acquiring Person acquires 20%or more of the Company’s common shares and expire February 15, 2000.
8. INCENTIVE AND DEFERRED COMPENSATION PLANS.
The Company has incentive compensation plans for its officers and other keymanagement personnel. The amounts charged to expense for the years endedDecember 31, 1997, 1996 and 1995 aggregated $2,870,270, $2,662,668 and$2,577,692, respectively.
The Company has established a deferred compensation plan for executives andother key employees. The plan provides for benefit payments upon terminationof employment, retirement, disability, or death. The Company recognizes thecost of this plan over the projected service lives of the participating employeesbased on the present value of the estimated future payments to be made. Theplan is funded by insurance contracts on the lives of the participants, andinvestments in insurance contracts (included in other assets) aggregated $9.9million and $8.9 million as of December 31, 1997 and 1996, respectively. Thedeferred compensation obligations, which aggregated $6,913,896 and $6,500,123as of December 31, 1997 and 1996, respectively, are included in other non-currentliabilities, with the current portion ($341,514 and $186,559 at December 31, 1997and 1996, respectively) included in other accrued liabilities.
All full-time employees of the Company (subject to certain eligibility restrictions)are eligible to participate in the Coachmen Assisted Retirement For Employees(C.A.R.E.) program which provides a mechanism for each eligible employee toestablish an individual retirement account and receive matching contributionsfrom the Company based on the amount contributed by the employee, theemployee’s years of service and the profitability of the Company. Companymatching contributions charged to expense under the C.A.R.E. program aggre-gated $724,541, $704,173 and $537,118 for the years ended December 31,1997, 1996 and 1995, respectively.
9. INCOME TAXES.
Income taxes are summarized as follows:
1997 1996 1995Federal:
Current $12,765,000 $13,553,000 $ 9,530,000Deferred 150,000 (210,000) (79,000)
12,915,000 13,343,000 9,451,000
State:Current 1,127,000 833,000 971,000Deferred 21,000 (30,000) (14,000)
1,148,000 803,000 957,000
Total $14,063,000 $14,146,000 $10,408,000
The following is a reconciliation of the provision for income taxes computed at the federalstatutory rate (35%) to the reported provision for income taxes:
1997 1996 1995Computed federal income tax
at federal statutory rate $13,589,000 $14,519,000 $ 9,785,000Changes resulting from:
Increase in cash surrendervalue of life insurancecontracts (356,000) (381,000) –
Foreign Sales Corporationsubject to lower tax rate (396,000) (310,000) (222,000)
State income taxes, net offederal income tax benefit 746,000 522,000 622,000
Other, net 480,000 (204,000) 223,000
Total $14,063,000 $14,146,000 $10,408,000
The components of the net deferred tax assets are as follows:
1997 1996
Current deferred tax asset (liability):Accrued warranty expense $ 2,455,000 $ 1,784,000Receivables (126,000) 368,000Other 711,000 1,028,000
Net current deferred tax asset $ 3,040,000 $ 3,180,000
Noncurrent deferred taxasset (liability):
Deferred compensation $ 2,765,000 $ 2,600,000Property and equipment (1,584,000) (1,434,000)Intangible assets (612,000) (566,000)
Net noncurrent deferred tax asset $ 569,000 $ 600,000
10. ACQUISITIONS AND DISPOSITIONS.
In September 1996, the Company acquired a recreational vehicle dealership for$1.9 million cash, which approximated the fair value of the acquired assets.The acquisition, which has been accounted for as a purchase, was immaterialto the Company’s consolidated financial statements.
22
Notes to Consolidated Financial Statements
Brought to you by Global Reports
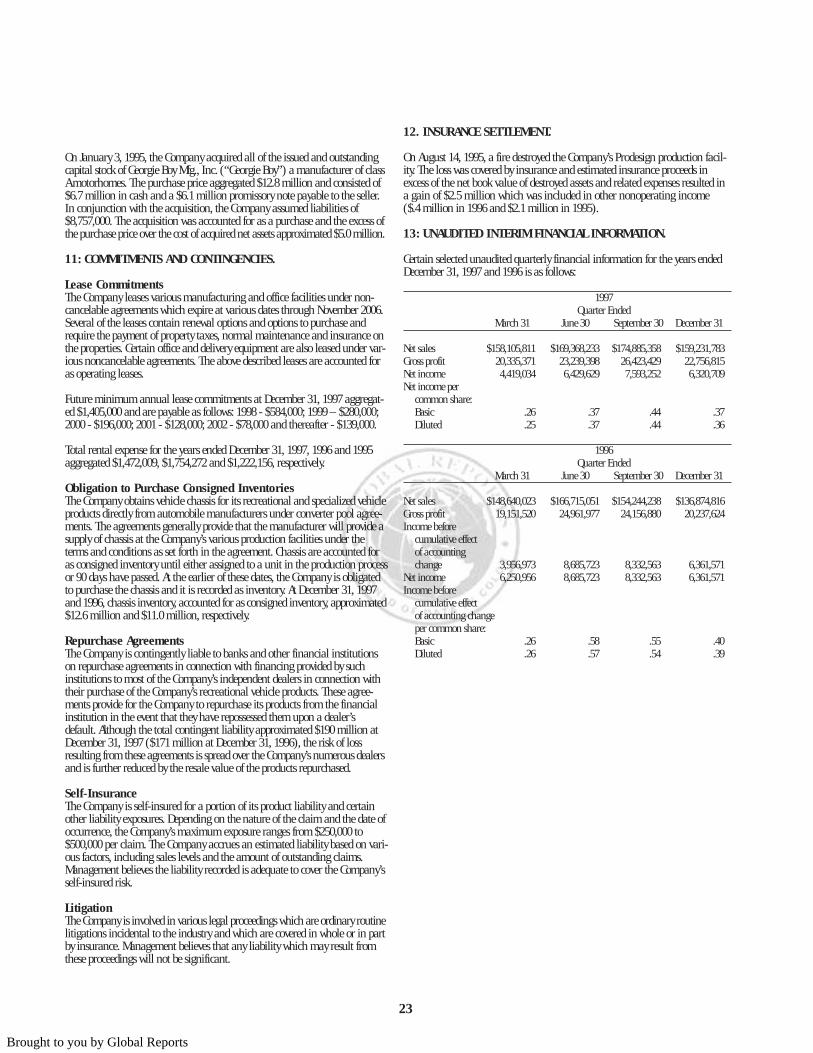
On January 3, 1995, the Company acquired all of the issued and outstandingcapital stock of Georgie Boy Mfg., Inc. (“Georgie Boy”) a manufacturer of classA motorhomes. The purchase price aggregated $12.8 million and consisted of$6.7 million in cash and a $6.1 million promissory note payable to the seller.In conjunction with the acquisition, the Company assumed liabilities of$8,757,000. The acquisition was accounted for as a purchase and the excess ofthe purchase price over the cost of acquired net assets approximated $5.0 million.
11: COMMITMENTS AND CONTINGENCIES.
Lease CommitmentsThe Company leases various manufacturing and office facilities under non-cancelable agreements which expire at various dates through November 2006.Several of the leases contain renewal options and options to purchase andrequire the payment of property taxes, normal maintenance and insurance onthe properties. Certain office and delivery equipment are also leased under var-ious noncancelable agreements. The above described leases are accounted foras operating leases.
Future minimum annual lease commitments at December 31, 1997 aggregat-ed $1,405,000 and are payable as follows: 1998 - $584,000; 1999 – $280,000;2000 - $196,000; 2001 - $128,000; 2002 - $78,000 and thereafter - $139,000.
Total rental expense for the years ended December 31, 1997, 1996 and 1995aggregated $1,472,009, $1,754,272 and $1,222,156, respectively.
Obligation to Purchase Consigned InventoriesThe Company obtains vehicle chassis for its recreational and specialized vehicleproducts directly from automobile manufacturers under converter pool agree-ments. The agreements generally provide that the manufacturer will provide asupply of chassis at the Company’s various production facilities under theterms and conditions as set forth in the agreement. Chassis are accounted foras consigned inventory until either assigned to a unit in the production processor 90 days have passed. At the earlier of these dates, the Company is obligatedto purchase the chassis and it is recorded as inventory. At December 31, 1997and 1996, chassis inventory, accounted for as consigned inventory, approximated$12.6 million and $11.0 million, respectively.
Repurchase AgreementsThe Company is contingently liable to banks and other financial institutionson repurchase agreements in connection with financing provided by suchinstitutions to most of the Company’s independent dealers in connection withtheir purchase of the Company’s recreational vehicle products. These agree-ments provide for the Company to repurchase its products from the financialinstitution in the event that they have repossessed them upon a dealer’sdefault. Although the total contingent liability approximated $190 million atDecember 31, 1997 ($171 million at December 31, 1996), the risk of lossresulting from these agreements is spread over the Company’s numerous dealersand is further reduced by the resale value of the products repurchased.
Self-InsuranceThe Company is self-insured for a portion of its product liability and certainother liability exposures. Depending on the nature of the claim and the date ofoccurrence, the Company’s maximum exposure ranges from $250,000 to$500,000 per claim. The Company accrues an estimated liability based on vari-ous factors, including sales levels and the amount of outstanding claims.Management believes the liability recorded is adequate to cover the Company’sself-insured risk.
LitigationThe Company is involved in various legal proceedings which are ordinary routinelitigations incidental to the industry and which are covered in whole or in partby insurance. Management believes that any liability which may result fromthese proceedings will not be significant.
12. INSURANCE SETTLEMENT.
On August 14, 1995, a fire destroyed the Company’s Prodesign production facil-ity. The loss was covered by insurance and estimated insurance proceeds inexcess of the net book value of destroyed assets and related expenses resulted ina gain of $2.5 million which was included in other nonoperating income($.4 million in 1996 and $2.1 million in 1995).
13: UNAUDITED INTERIM FINANCIAL INFORMATION.
Certain selected unaudited quarterly financial information for the years endedDecember 31, 1997 and 1996 is as follows:
1997Quarter Ended
March 31 June 30 September 30 December 31
Net sales $158,105,811 $169,368,233 $174,885,358 $159,231,783Gross profit 20,335,371 23,239,398 26,423,429 22,756,815Net income 4,419,034 6,429,629 7,593,252 6,320,709Net income per
common share:Basic .26 .37 .44 .37Diluted .25 .37 .44 .36
1996Quarter Ended
March 31 June 30 September 30 December 31
Net sales $148,640,023 $166,715,051 $154,244,238 $136,874,816Gross profit 19,151,520 24,961,977 24,156,880 20,237,624Income before
cumulative effectof accountingchange 3,956,973 8,685,723 8,332,563 6,361,571
Net income 6,250,956 8,685,723 8,332,563 6,361,571Income before
cumulative effectof accounting changeper common share:Basic .26 .58 .55 .40Diluted .26 .57 .54 .39
23
Brought to you by Global Reports

Report of Independent Accountants
Philip G. LuxRetired President &Chief Operating Officer of the Company
Thomas H. CorsonRetired Chairman of the Board &Chief Executive Officer of the Company
Claire C. SkinnerChairmanof the Board &Chief Executive Officer
William P. JohnsonChairmanof the Board, Goshen Rubber Company, Inc.Goshen, Indiana
R. James HarringRetired Vice President,Motorola, Inc.Schaumburg,Illinois
Philip C. BarkerAttorney, Hartzog, Barker, Hepler and SaundersGoshen, Indiana
Keith D. CorsonPresident & Chief Operating Officer
Gary L. GroomExecutiveVice President,Finance &Secretary
William G. MillikenFormer Governorof MichiganTraverse City, Michigan
Seated StandingBoard of Directors
To the Shareholders and Board of Directors ofCoachmen Industries, Inc.:
We have audited the accompanying consolidated balance sheets of Coachmen Industries, Inc. and subsidiaries as of December 31, 1997 and 1996, andthe related consolidated statements of income and retained earnings and cash flows for each of the three years in the period ended December 31, 1997.These financial statements are the responsibility of the Company’s management. Our responsibility is to express an opinion on these financial state-ments based on our audits.
We conducted our audits in accordance with generally accepted auditing standards. Those standards require that we plan and perform the audit toobtain reasonable assurance about whether the financial statements are free of material misstatement. An audit includes examining, on a test basis,evidence supporting the amounts and disclosures in the financial statements. An audit also includes assessing the accounting principles used and significant estimates made by management, as well as evaluating the overall financial statement presentation. We believe that our audits provide a reasonable basis for our opinion.
In our opinion, the financial statements referred to above present fairly, in all material respects, the consolidated financial position of CoachmenIndustries, Inc. and subsidiaries as of December 31, 1997 and 1996, and the consolidated results of their operations and their cash flows for each of thethree years in the period ended December 31, 1997, in conformity with generally accepted accounting principles.
South Bend, IndianaJanuary 30, 1998
Board of Directors
24
Brought to you by Global Reports
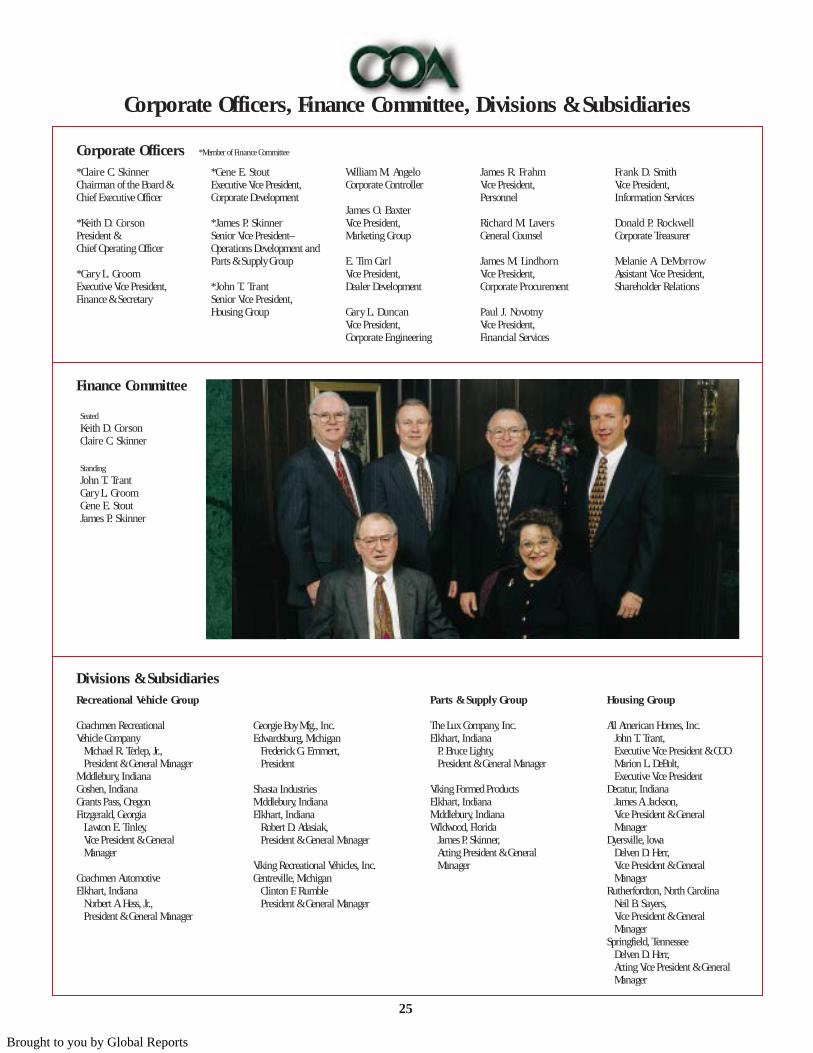
Corporate Officers, Finance Committee, Divisions & Subsidiaries
*Claire C. Skinner Chairman of the Board &Chief Executive Officer
*Keith D. CorsonPresident &Chief Operating Officer
*Gary L. GroomExecutive Vice President,Finance & Secretary
*Gene E. StoutExecutive Vice President,Corporate Development
*James P. SkinnerSenior Vice President–Operations Development andParts & Supply Group
*John T. TrantSenior Vice President,Housing Group
William M. AngeloCorporate Controller
James O. BaxterVice President,Marketing Group
E. Tim CarlVice President,Dealer Development
Gary L. DuncanVice President,Corporate Engineering
James R. FrahmVice President,Personnel
Richard M. LaversGeneral Counsel
James M. LindhornVice President,Corporate Procurement
Paul J. NovotnyVice President,Financial Services
Frank D. SmithVice President,Information Services
Donald P. RockwellCorporate Treasurer
Melanie A. DeMorrowAssistant Vice President,Shareholder Relations
Recreational Vehicle Group
Coachmen Recreational Vehicle Company
Michael R. Terlep, Jr.,President & General Manager
Middlebury, IndianaGoshen, IndianaGrants Pass, OregonFitzgerald, Georgia
Lawton E. Tinley,Vice President & General Manager
Coachmen AutomotiveElkhart, Indiana
Norbert A. Hess, Jr.,President & General Manager
Georgie Boy Mfg., Inc.Edwardsburg, Michigan
Frederick G. Emmert,President
Shasta Industries Middlebury, IndianaElkhart, Indiana
Robert D. Adasiak,President & General Manager
Viking Recreational Vehicles, Inc. Centreville, Michigan
Clinton F. RumblePresident & General Manager
Parts & Supply Group
The Lux Company, Inc. Elkhart, Indiana
P. Bruce Lighty,President & General Manager
Viking Formed ProductsElkhart, IndianaMiddlebury, Indiana Wildwood, Florida
James P. Skinner,Acting President & General Manager
Housing Group
All American Homes, Inc. John T. Trant,Executive Vice President & COOMarion L. DeBolt,Executive Vice President
Decatur, IndianaJames A. Jackson,Vice President & General Manager
Dyersville, lowaDelven D. Herr,Vice President & General Manager
Rutherfordton, North CarolinaNeil B. Sayers,Vice President & General Manager
Springfield, TennesseeDelven D. Herr,Acting Vice President & General Manager
Finance Committee
Divisions & Subsidiaries
Corporate Officers *Member of Finance Committee
Seated
Keith D. Corson Claire C. Skinner
Standing
John T. Trant Gary L. Groom Gene E. Stout James P. Skinner
25
Brought to you by Global Reports
Top Related
Copyright © 2022 FDOKUMEN

