


Bahasa
Halaman
Hukum


1
CCK2 Receptor Nullification Attenuates Lipopolysaccharide-induced Sickness Behavior
Tracey J. Weiland, Nicholas J. Voudouris, and Stephen Kent
School of Psychological Science, La Trobe University, Bundoora, VIC, 3086, AUSTRALIA
Running Head: CCK2 Receptors and LPS-induced Sickness Behavior
Address correspondence to:
Dr. Tracey WeilandEmergency Practice Innovation CentreDept. Emergency MedicineSt Vincent's Health41 Victoria Pde, Fitzroy, VIC 3065AUSTRALIA
Tel: +61 39288 2734Fax: +61 39479 1956Email: [email protected]
Page 1 of 53Articles in PresS. Am J Physiol Regul Integr Comp Physiol (July 20, 2006). doi:10.1152/ajpregu.00156.2006
Copyright © 2006 by the American Physiological Society.
2
Abstract
Systemic infection produces a highly regulated set of responses such as fever,
anorexia, adipsia, inactivity and cachexia, collectively referred to as sickness behavior.
Although the expression of sickness behavior requires immune-brain communication, the
mechanisms by which peripheral cytokines signal the brain are unclear. Several mechanisms
have been proposed for neuroimmune communication, including the interaction of cytokines
with peripheral nerves. A critical role has been ascribed to the vagus nerve in mediating
sickness behaviour following intraperitoneally-delivered immune activation, and converging
evidence suggests that this communication may involve neurochemical intermediaries afferent
and/or efferent to this nerve. Mice lacking functional CCK2/gastrin receptors (CCK2KO) and
wild-type (WT) controls were administered LPS (50, 500, or 2500 µg/kg; serotype 0111:B4;
ip). Results indicate a role for CCK2 receptor activation in the initiation and maintenance of
LPS-induced sickness behavior. In comparison to WT controls, CCK2KO mice were
significantly less affected by LPS on measures of Tb, activity, body weight, and food intake,
with the magnitude of effects increasing with increasing LPS dose. Although activation of
CCK2 receptors at the level of the vagus nerve cannot be excluded, a possible role for these
receptors in non-vagal routes of immune-brain communication is suggested.
Keywords: cholecystokinin, LPS, infection, vagus, fever
Page 2 of 53
3
The gut-brain peptide, cholecystokinin (CCK), exhibits great potential as a
neurochemical intermediary of vagus-to-brain signalling. CCK binds to CCK1 and CCK2
receptors; the former are primarily localized in peripheral organs and some discrete areas of
the brain, whereas CCK2 receptors are the predominant subtype in the brain (55). Both
subtypes are present on the vagus nerve and vagal afferent connections, including the
brainstem and hypothalamus (46, 51). Thus, the peripheral and central positioning of CCK
receptors provides an anatomical basis for CCK to play a role in vagally-mediated
neuroimmune communication.
A constellation of findings points to a role for CCK in immune regulation, including a
protective function in septic shock induced by lipopolysaccharide (LPS)(41,42), a compound
of the outer cell wall of Gram-negative bacteria (60). CCK induces monocyte chemotaxis
both in vitro and in vivo (16, 65), and stimulates production of proinflammatory cytokines,
tumor necrosis factor (TNF), interleukin (IL)-1β, IL-6, and IL-8 (16). Peripheral
administration of CCK induces a pattern of c-fos expression that is similar to that seen
following administration of the immune activators, LPS, or IL-1β (19). Increases in plasma
CCK have been reported in the rat following intraperitoneal (ip) IL-1α (18) or intravenous
(iv) IL-1β (40). However, limitations in assay sensitivity and specificity, render these findings
questionable, and contradictory evidence has recently been presented (84).
Studies examining the involvement of CCK receptor activation in sickness behavior
(anorexia, inactivity, cachexia) have focussed primarily on the role of the CCK1 receptor.
Antagonism of the CCK1 receptor blocked the decrease in feeding following ip IL-1α in rats
(18), an effect that could not be reproduced for food-motivated behavior in mice with low
doses of LPS or IL-1β administered ip (8). The role of CCK receptor activation in fever
genesis and maintenance is also equivocal. The febrile effects of LPS and IL-1β administered
to rats in low doses were not attenuated by CCK1 receptor antagonism (34,44), although
Page 3 of 53

4
naturally occurring mutant rats deficient in CCK1 receptors exhibited an exaggerated febrile
response, a result attributed to a secondary trait of the strain (34).
Although several studies have examined the role of the CCK1 receptor in sickness
behavior, relatively little attention has been paid to CCK2 receptors. Blockade of CCK2
receptors, either peripherally (subcutaneously) or centrally (icv), attenuated fever in rats
administered a low dose of LPS iv (77). The role for CCK2 receptors in fever, however, has
yet to be confirmed when immune activators are administered ip, or with other pyrogens and
species.
Since the effectiveness of vagotomy (VGX) in attenuating behavioral depression (17,
71) and fever (25, 63) induced by LPS or IL-1 is typically dose-dependent, studies of the role
of CCK in sickness behavior have employed low doses of the immune activators. However,
given the diverse peptide and receptor distribution of CCK, and its possible involvement in
thermoregulatory effector mechanisms (24,86), it is important to acknowledge that CCK may
have a role in sickness behavior that is independent of vagal activation, thus underscoring the
importance of examining a broad range of doses of immune activators.
The purpose of this study was to examine the role of CCK2 receptors in the
expression of LPS-induced sickness behavior. Changes in body temperature (Tb), locomotor
activity, body weight, and food and water intake were monitored in response to a 50-fold
range of LPS doses. The responses of mice that lack functional CCK2 receptors (CCK2KO;
53) were compared with responses of the background strain, or wild-type (WT).
Investigations of the mechanisms underlying LPS-induced fever and anorexia, are typically
restricted to observations of a few hours (e.g., 70, 79). However, recent evidence suggests that
the sickness response follows a protracted timecourse (20). Given this, and large range of
doses used in the present study, all parameters were monitored for 4 days post-injection.
Page 4 of 53

5
Materials and Methods
Animals
Thirty-two male homozygous CCK2KO mice (La Trobe University, Melbourne,
Australia), and 32 male C57BL/6J mice (mus musculus) as WT mice (La Trobe University)
were used for the present study. All CCK2KO mice were homozygous for the disrupted CCK2
receptor gene and were developed through gene targeting as described previously (53,58).
Briefly, the CCK2 gene was isolated from a 129sv genomic library and the clone inserted in a
vector. Clones exhibiting homologous recombination on the disrupted CCK2 gene were
microinjected into blastocytes of C57BL/6J females. Chimerics were bred with C57BL/6J
mice to enable germ line transmission. The first generation of heterozygous animals were then
bred for 10 generations, selecting for the mutant CCK2 gene at each generation. Fifth
generation heterozygous mice were then bred to generate CCK2KO mice. When backcrossed
with C57BL/6J for several generations, the WT strain or genetic background for such
transgenic strains becomes the C57BL/6J (54). Confirmation that the CCK2KO strain is in
fact deficient in a functional CCK2 receptor has been provided previously (53). Every effort
was made to age-match the animals. At the commencement of the recording period, CCK2KO
mice were aged between 84 and 120 days (mean=98 ± 2 SEM, median= 96) and their average
body weight was 29.5 ± 0.4 and 26.8 ± 0.2 g (median=28.2 g; range: 24.0 to 35.1 g).
Drugs
An immune response was triggered through the ip administration of LPS (serotype:
0111:B4; Sigma, Sydney) in doses of 50 µg/kg, 500 µg/kg, and 2500 µg/kg. Lyophilized LPS
was dissolved in sterile, pyrogen free, isotonic saline solution (Astra Pharmaceuticals, North
Ryde, Australia), aliquotted, and stored at -20° C in Eppendorf tubes until required. Before
injection, aliquots were thawed at 4° C and an appropriate volume of saline was added to
Page 5 of 53

6
bring the diluent to the correct concentration for injection. Solutions were then raised to room
temperature. All LPS injections were administered 1 hr following the onset of the photophase.
Procedure
Throughout experimentation mice were housed individually under a 12:12 light:dark
cycle with food and water available ad libitum, and ambient temperature set at 30 ± 1° C,
which is within the thermoneutral zone for this species. Sawdust and tissue were provided as
bedding. Following a 2-week acclimation period, a biotelemetry device (22 mm x 8 mm; 1.83
g; E-4000, Mini Mitter Co., Inc., Bend, OR) was surgically implanted into the peritoneal
cavity of each animal as described previously (83).
A 7-10 day recovery period followed surgery, after which time mice were housed singly
in polypropylene enclosures. This apparatus which enables the determination of Tb, and the
quantification of general locomotor activity, and food and water intake has been described in
detail previously (83). Data for Tb, locomotor activity and food intake were decoded by
VitalView software (Mini Mitter Co., Inc., Bend, OR) at 1min intervals and stored
electronically.
Uneaten pellets were removed from the enclosure each morning and the number
subtracted from the total number delivered each day for the final data set. Body weight and
water consumption were manually recorded each morning. Body weight was measured to 10-2
g using top-loading scales. Water was dispensed following contact with a water nipple fed
from a 25 ml vertical, polypropylene tube with 0.2 ml graduated markings.
All dependent variables (Tb, activity, body weight, food hopper entries, and water
intake) were monitored during an acclimation period of at least 1 week. Mice were considered
to be adapted to the housing environment when: (a) clear and consistent circadian rhythms in
Tb, activity, and food hopper entries were present for at least 3 consecutive days; (b) daily
water intake and body weight varied by less than 1 ml and 1.5 g, respectively, during this
Page 6 of 53

7
period; and (c) body weight was greater than pre-surgical weight. Following successful
acclimation, a 4-day baseline period commenced during which time all dependent measures
were monitored.
Following the baseline period, each animal was administered one of three treatments:
50, 500, or 2500 µg/kg LPS, or the LPS vehicle, saline, 1 hr following the onset of the
photophase. Allocation of treatments was random and treatments were administered ip in a
maximum volume of 100 µl/mouse. Dependent measures were then monitored for a further 4
days post-injection.
All procedures were conducted in accordance with the American Physiological Society's
Guiding Prinicples in the Care and Use of Animals, and were approved by the La Trobe
University Animal Ethics Committee.
Data Analyses
Data were averaged and means ± SEM were calculated for each group and all
variables for the 8-day testing period. Data for Tb were converted to 15 min, and 2- and 12-
hourly means. Activity data and food hopper entries were converted to 12-hourly means and
totals respectively, and expressed as percentage difference from the 4-day average baseline.
Raw data for body weight and water consumption were collated and daily means for these
variables were derived.
Data for each dose were analysed separately, using univariate and two-way (time by
strain or time by pretreatment) repeated measures ANOVAs or ANCOVAs. This permitted
the levels of time in the analyses performed to vary as a function of dose, an important
consideration given that the duration of the effects of LPS is dose-dependent.
Identification of potential covariates was made using partial correlation. Missing data
were replaced with the group mean when using food or water intake as covariates. To
overcome violations of sphericity in the Tb data, the Greenhouse-Geisser statistic is reported
Page 7 of 53

8
for within-subjects effects. Where required, simple main effects were analyzed using Fisher’s
Least Significant Difference. This statistic is suitable when the number of comparisons is
small (32).
Basal strain differences in Tb, activity, body weight, and water intake from this data set
have been reported previously (83). To control for pre-existing individual and group
differences, results for LPS-induced differences in Tb were analysed on change from 4-day
average baseline. LPS-induced group differences for all other dependent variables were tested
on percentage difference from average baseline and are presented as such. For Tb, activity,
and food intake, data obtained for photophase and scotophase were analysed separately.
For 15 min Tb expressed as difference from baseline, analyses were conducted on
the initial 4 hr period post injection regardless of treatment. For 2 hr Tb analyses were
conducted on the initial 24 hrs post-injection. For 12-hourly Tb, the first 24 hrs post-injection
were analysed for mice treated with saline or 50 µg/kg LPS, and the first 48 hrs were analysed
for mice administered either 500 or 2500 µg/kg LPS. For activity data (percentage difference
from baseline), the number of post-injection days analysed was 1 for mice administered
saline, 2 for mice administered 50 µg/kg LPS, and 3 for mice treated with 500 or 2500 µg/kg
LPS. Regardless of LPS dose, body weight analyses were conducted on data for the entire
post-injection period since bodyweight typically failed to return to baseline. For saline-treated
mice, however, body weight data were examined using data collected during the first day
post-injection. Food pellet consumption, expressed as percentage difference from baseline,
was analysed using separate 2-way repeated measures ANOVAs on data for the first 48 hrs
for mice administered saline or 50 µg/kg LPS, and 96 hrs for mice administered 500 or 2500
µg/kg LPS. Water consumption analyses were conducted on data obtained during the first day
post-injection, for all treatments except 2500 µg/kg LPS, which was tested for a 48 hr period.
Page 8 of 53

9
Results
Body temperature. The febrile response to 50 µg/kg LPS was less prominent in
CCK2KO mice than WT mice, with the latter exhibiting a more rapid onset. ANOVA
conducted on 15 min mean difference from average baseline Tb revealed significant effects
for time, strain, and their interaction. The strain difference became significant from 90-105
min post-injection (F(1,14)=5.26, p=0.038 η2=.19) when a change from baseline of 0.48 ± 0.18
and -0.06 ± 0.08 °C occurred for WT and CCK2KO, mice respectively (Fig 1a). For 15 min
data, this difference remained significant for the remainder of the first 4 hr period following
injection. The strain difference was greatest 2-3 hrs post-injection (difference=0.65 °C), and
for both strains fever peaked at 5 hrs post-injection when an increase from baseline of 1.32 ±0.26 and 0.65 ± 0.17 °C occurred for WT and CCK2KO, mice respectively (Fig. 1b). ANOVA
conducted on 2-hourly means indicated a significant strain difference throughout the
photophase (F(4, 56)=3.34, p=.016 η2=.19). The mean 12-hourly increase from baseline during
the initial photophase was significantly greater in WT mice (WT: 0.93 ± 0.23 °C; CCK2KO:
0.30 ± 0.28 °C; F(1, 14)=6.33, p=.025 η2=.31; Fig. 1c). In both strains, circadian patterns of Tb
were re-established by day 2 post-injection.
In response to 500 µg/kg LPS, WT mice mounted a greater febrile response compared
to CCK2KO mice; this difference began to emerge 105-120 min post-LPS (Fig 1d) and
persisted until 8 hrs following injection (Fig. 1e). For 15 min means, significant time, strain,
and interaction effects were detected. The strain difference first became significant 105m
post-injection (F(1, 14)=17.95, p<.001 η2=.58) and remained so for all 15 min periods during
the first 4 hrs. For 2hr means, ANOVA revealed significant effects for time, strain, and their
interaction. The Tb of WT mice was significantly higher than that of CCK2KO mice from 2-8
hrs post-injection (2-3: F(1, 14)=37.51, p<.001 η2=.73; 4-5: F(1, 14)=26.25, p<.001 η2=.65; 6-7:
Page 9 of 53

10
F(1, 14)=45.71, p<.001, η2=.77; 8-9: F(1, 14)=38.48, p<.001 η2=.73). The effects of 500 µg/kg
LPS on Tb persisted in both strains for 48 hrs. For both strains fever peaked during the middle
of the photophase periods, with the Tb of WT and CCK2KO mice increasing from baseline by
a maximum of 2.25 ± 0.16 and 0.82 ± 0.23 °C, respectively (Fig. 1e). The first two scotophase
periods were marked by a decrease from baseline Tb of up to 1.01 ± 0.19 (WT) and 1.57 ±0.35 °C (CCK2KO; Fig. 1e). This hypothermic response, was observed from 12-17 hrs and
35-43 hrs for WT mice, and 12-18 hrs and 36-40 hrs for CCK2KO mice. The mean difference
between strains in the first 12 hrs post-injection was 0.35 °C (Fig. 1f). ANOVA indicated
significant strain differences during the first and second photophases (F(1, 14)=30.22, p<.001
η2=.68).
The strain difference induced by 2500 µg/kg was detected throughout the first 4hrs
post injection (Fig 1d). For 15m means ANOVA indicated significant main effects for strain
(F(1, 14)=4.84, p=.047 η2=.27) and time, but not their interaction. During the first 4hrs post-
injection, the difference was greatest 60-75m post-LPS when the change from baseline for
WT and KO was -0.71 ± 0.22 and 0.20 ± 0.14 °C, respectively. Examination of hourly and
12-hourly data revealed that this strain difference was not restricted to photophase periods
(Figs. 1e & 1f); similar to lower doses, the fever observed was followed by a decrease in Tb
during the scotophases. When pre-existing strain differences are taken into account, the
strains differed in their response to LPS from 3-9 hrs and 12-25 hrs following injection, with a
maximum difference of 1.42 °C occurring 23 hrs post-injection (Fig. 1e). Between 26 and 35
hrs post-injection, the Tb of WT mice remained 0.5 °C or more greater than at baseline. The
strain differences throughout the initial photophase and scotophase were confirmed by
ANOVA on 2-hourly means (photophase: F(1, 14)=5.39, p=.036 η2=.28; scotophase: F(1,
14)=23.54, p<.001 η2=.40). Inspection of 12-hourly means indicated substantial strain
Page 10 of 53

11
differences in Tb during the first 35 hrs following injection (Fig. 1f). ANOVA on scotophase
data revealed significant effects for time, strain, and their interaction; the Tb of CCK2KO
mice was significantly higher than that of WT mice during the initial post-injection
scotophase (F(1, 14)=22.84, p<.001 η2=.62).
In response to saline, the Tb of WT mice initially decreased in the photophase by 0.39
± 0.12, °C (Fig. 1a) but increased by up to 0.55 ± 0.12°C by the end of this period (Fig. 1a &
1b). The Tb of CCK2KO mice remained similar to baseline during the start of the photophase
but increased by 0.72 ± 0.21 °C at the end of the first photophase. Although CCK2KO mice
did not differ greatly from baseline during the initial scotophase period following injection, a
decrease from baseline of up to 0.80 ± 0.17 °C was found for WT mice (Fig. 1b).
Examination of 15m mean difference from baseline data for the first 4 hrs post-injection
revealed a significant main effect for strain (F(1, 14)=6.05, p=.027 η2=.30) but not time or their
interaction. The mean Tb of saline-treated WT mice was lower than that of CCK2KO mice 5-
9 hrs post-injection (Fig. 1b). For 2 hourly photophase data, ANOVA indicated significant
effects for strain (F(1, 14)=5.89, p=.029 η2=.30) and time, but not their interaction. Analyses of
scotophase data indicated a significant interaction between time and strain. Simple main
effects analyses revealed a significantly higher mean Tb for WTs compared to CCK2KO mice
from 20-23 hrs post-saline (F(1, 14)=12.94, p=.003, η2=.48; F(1, 14)=4.95, p=.043, η2=.26).
ANOVA indicated a significant difference between strains in 12-hourly mean Tb following
saline during the first post-injection photophase (F(1, 14)=5.92, p=.029 η2=.30) and scotophase
(F(1, 14)=5.68, p=.032 η2=.29) (Fig. 1c).
Locomotor activity. Both strains exhibited a decrease in locomotor activity during
the first 2 days following 50 µg/kg LPS (Fig. 2a). These were most prominent during, but not
limited to, the scotophase periods, and were greatest during the post-injection scotophase.
Page 11 of 53
12
Compared to WT mice, the activity levels of CCK2KO mice appeared less affected by LPS
(Fig. 2a), however the difference failed to reach significance.
Following 500 µg/kg LPS, locomotor activity levels of both strains decreased
substantially (Fig. 2b). A clear strain difference occurred in response to LPS, with CCK2KO
mice being less affected than WT mice for the entire 4-day period (Fig. 2b). This difference
was most pronounced during the second scotophase when WT mice were 33 ± 11 % less
active, and CCK2KO mice were 12 ± 28 % more active, than at baseline. For scotophase data
ANOVA indicated significant effects for time, and strain (F(1, 11)=5.94, p=.033, η2=.35), but
not their interaction.
Both strains exhibited a profound reduction in activity following 2500 µg/kg LPS
(Fig. 2b). Although activity during the photophase periods remained less than baseline until
day 4 post-injection, the decrease in activity was greatest for both strains during the initial
scotophase period following LPS. During this period, WT and CCK2KO mice were 73 ± 7
and 59 ± 11 % less active than at baseline, with activity falling below photophase levels (Fig.
2b). Although slight strain differences were present for this dose, they were not as distinct as
those seen in mice treated with 500 µg/kg LPS (Fig. 2b), and they failed to reach siginficance.
Following saline, both WT and CCK2KO mice produced a slight decrease from
baseline activity during the initial photophase (Fig. 2a). In the ensuing scotophase, WT mice
approached baseline whereas the activity of CCK2KO mice decreased to 26 ± 6 % less than
baseline. A strain difference in activity was evident in the first scotophase and second
photophase post-injection. However, only the scotophase difference reached significance (F(1,
13)=9.79, p=.008, η2=.43).
Body weight. The cachexic effects of 50 µg/kg LPS were greatest for both strains on
day 1 post-injection; WT and CCK2KO mice lost 4.7 ± 0.9 and 2.0 ± 0.6 % body weight,
Page 12 of 53

13
respectively (Fig. 3a). The percentage weight loss of WT mice exceeded that of CCK2KO
mice throughout the post-injection period with the strain difference peaking on day 2 post-
injection (WT: -2.6 ± 0.9 %; CCK2KO: 0.5 ± 0.4 %, relative to baseline). ANOVA indicated
significant main effects for strain (F(1, 14)=13.08, p=.003, η2=.48) and time, but not their
interaction.
When challenged with 500 µg/kg LPS WT and CCK2KO mice lost a maximum of 9.4
± 0.2 and 3.5 ± 0.5 % respectively, with cachexia greatest on day 1 (Fig. 3b). CCK2KO mice
were less affected by LPS with the strain difference being greatest on day 2 post-injection. At
this point, WT mice had lost only 8.3 ± 0.8 %, whereas CCK2KO mice had lost 2.7 ± 0.7 % of
their baseline weights. By the end of the testing period, CCK2KO mice had returned to within
0.3 ± 0.6 % of baseline body weight. In contrast, WT mice had returned to within 3.7 ± 1.2 %
of their initial weights. ANOVA indicated that the difference between strains was significant
across the entire testing period (F(1, 14)=25.02, p<.001, η2=.64).
When treated with the largest dose of LPS, WT and CCK2KO mice lost 12.1 ± 0.6 and
6.4 ± 1.4 % of body weight, respectively. In contrast to lower doses of LPS, the cachexic
effects were greatest on day 2 post-injection, but weight loss was once again greatest in WT
mice (Fig. 3b). The strain difference was largest on day 3 post-injection when CCK2KO mice
lost 2.3 ± 1.1 % and WT mice lost 9.6 ± 0.9 % body weight (Fig. 3b). ANOVA indicated
significant main effects for strain (F(1, 14)=19.23, p<.001, η2=.58), and time, but not their
interaction.
The body weight of saline-treated mice was stable throughout testing with no
significant strain difference following injection (Fig. 3a).
Food intake. In response to 50 µg/kg LPS, both WT and CCK2KO mice exhibited a
decrease in food intake compared to baseline (Fig. 4a). In percentage terms, the anorexic
Page 13 of 53

14
effects of LPS were most profound during the initial photophase following injection, when
consumption decreased by approximately 60% for both strains. Compared to WT mice, the
food intake of CCK2KO mice was slightly less affected and by the second photophase,
CCK2KO mice they had returned to within 6 ± 7 % of baseline, whereas WT mice consumed
29 ± 6 % less than baseline. Analyses of scotophase data revealed food consumption to be
significantly less during the first post-injection scotophase regardless of strain. The main
effect for strain was significant (F(1, 14)=4.88, p=.040, η2=.26), but the time by strain
interaction was not.
In response to 500 µg LPS, both WT and CCK2KO mice decreased food consumption
during the 4-day post-injection period (Fig. 4b). The decrease in consumption was greatest for
both strains during the first scotophase period following injection. During this period, the
number of pellets consumed by WT and CCK2KO mice decreased by 39.3 ± 2.6 and 28.9 ±4.2, respectively. Strain differences were observed in mice treated with 500 µg/kg LPS; most
notably during the first scotophase following LPS, when WT mice consumed 94 ± 1 % and
CCK2KO mice consumed 58 ± 10 % less than baseline. ANOVA indicated that scotophase
food intake varied significantly as a function of time, strain (F(1, 12)=8.01, p=.015, η2=.40),
and their interaction (F(1, 10)=5.90, p=.002, η2=.33). Simple main effects analyses revealed that
CCK2KO mice consumed significantly more than their WT counterparts on the first 2 days
post-injection only (F(1, 12)=9.98, p=.008, η2=.45; F(1, 12)=10.17, p=.008, η2=.46).
Consistent with other doses of LPS, the anorexic effects of 2500 µg/kg LPS were most
pronounced during the post-injection scotophase periods (Fig. 4b). For WT mice, the effects
persisted for the entire post-injection period, whereas CCK2KO mice had recovered to
baseline by the third post-injection photophase. Again, for both strains the effects of LPS on
food consumption were maximal during the first scotophase post-injection when food intake
Page 14 of 53

15
by WT and CCK2KO mice decreased by 36.2 ± 1.8 and 42.6 ± 4.5 pellets, respectively.
Although strain differences were observed during each scotophase, the greatest differences
between strains occurred during the third photophase, at which time CCK2KO mice had
returned to baseline and WT mice ate 51 ± 13 % less compared to the pre-injection period
(Fig. 4b). ANOVA on photophase data revealed significant effects for time, strain (F(1,
14)=10.71, p=.006, η2=.43), and their interaction (F(3, 42)=6.08, p=.002, η2=.30). Simple main
effects analyses indicated significant differences between strains on the first 3 days post-LPS
with WT mice consuming more than CCK2KO mice during the initial photophase (F(1,
14)=5.82, p=.030, η2=.29), and CCK2KO mice consuming more than controls during
photophases 2 and 3 (F(1, 14)=4.69, p=.048, η2=.25; F(1, 14)=7.56, p=.016, η2=.35). ANCOVA
performed on scotophase data revealed significant main effects for time, strain (F(1, 13)=16.47,
p<.001, η2=.56), and their interaction (F(3, 42)=5.33, p=.003, η2=.28). Simple main effects
analyses revealed that during the scotophase, CCK2KO mice consumed significantly more
that WT mice on days 1-3 post-injection (F(1, 14)=5.28, p=.038, η2=.27; F(1, 14)=14.31, p=.002,
η2=.51; F(1, 14)=10.51, p=.006, η2=.43).
Following saline, food pellet consumption by WT mice increased by 2.2 ± 1.3 and 5.6
± 1.3 (6 ± 3 % and 14 ± 2 %) during the first and second scotophases (Fig. 4a). In contrast,
consumption by CCK2KO mice decreased 8 ± 1 % during the first scotophase but no
difference was found during the second scotophase. A minimal but statistically significant
strain difference was observed during the first 2 scotophase periods post-injection (Fig. 4a).
For scotophase data ANOVA revealed a significant main effect for time and strain (F(1,
11)=9.85, p=.012, η2=.45), but not their interaction.
Water consumption. The decrease in water intake for mice administered 50 µg/kg LPS
was restricted to the first 24 hrs post-injection (Fig. 5a). For WT and CCK2KO mice the
Page 15 of 53
16
differences from baseline were 37 ± 9 and 30 ± 4 %, respectively, a difference which failed to
reach significance.
When treated with 500 µg/kg LPS, both strains exhibited a decrease in water
consumption which persisted for 48 hrs post-injection, but was most pronounced in the first
24 hrs following LPS (Fig. 5b). At this time, CCK2KO mice consumed 48 ± 11 % less than
baseline and WT mice consumed 84 ± 6 % less than at baseline. A clear strain difference was
apparent, with CCK2KO mice consuming more than WT mice (relative to baseline) on the
first day post-injection, but not on subsequent days (F(1, 14)=8.62, p=.011, η2=.38) (Fig. 5b).
Similar to the 500 µg/kg dose of LPS, water consumption by mice treated with 2500
µg/kg LPS was affected for the first 48 hrs following injection, with bothn strains decreasing
consumption by approximately 85% (Fig. 5b). CCK2KO mice, however, recovered quicker
and a strain difference was apparent on day 2 of testing. ANOVA revealed a significant time
by strain interaction (F(1, 13)=10.62, p=.006, η2=.45) and simple main effects analyses revealed
a significant increase in water consumption within each strain (WT: F(1, 13)=41.91, p<.001,
η2=.76; CCK2KO: F(1, 13)=110.63, p<.001, η2=.90) during post-injection day 2 compared to
day 1.
In response to saline, water consumption by CCK2KO mice decreased from baseline
by 8 ± 2 % (Fig. 5a). In contrast, the difference from baseline by WT mice was minimal,
though somewhat variable (-1 ± 5 %). After accounting for variance due to bodyweight
(44%), ANCOVA indicated a no significant effects of strain.
Discussion
Compared to controls, CCK2KO mice were significantly less affected by LPS on
measures of Tb, activity, body weight, and food intake. That the effects observed were
Page 16 of 53

17
apparent for a wide range of doses of LPS and dependent variables has important implications
for the involvement of CCK2 receptors in pathways of immune-brain signalling following ip
LPS. Studies concerned with elucidating pathways of neuroimmune communication have
ascribed differing levels of importance to vagal activation required for LPS or cytokine-
induced fever compared to behavioral depression (2, 25). A decrease in social interaction has
been shown to depend upon the integrity of vagal afferents regardless of dose (10, 11, 36, 43).
Subdiaphragmatic VGX attenuated the fever and anorexia induced by a low, but not a high,
dose of LPS (2, 71, 12, 43, 63). Thus, the mechanisms of communication from the periphery
to the brain, and their dose-dependence, differ for different components of the immune
response. Consequently, the following discussion will consider the dependent measures of
sickness separately.
There are several reasons to consider CCK as a neurochemical regulator of Tb under
pathological conditions. In addition to the activation of gastric vagal afferents (6), CCK is
capable of activating the common hepatic branch of the vagus (15), thought to be critical in
the genesis of LPS-induced fever (73). The expression of Fos protein in central autonomic
nuclei by CCK and LPS exhibits a similar pattern (23, 49). Both activate the central nucleus
of the amygdala and hypothalamic structures including the paraventricular nucleus (26, 80,
82), which has a role in temperature regulation (1, 26). Furthermore, in the rat, CCK is found
abundantly in the POA/anterior hypothalamus (47), an area long known for thermoregulatory
integration (5), and which has connections with the NTS (68).
CCK2KO mice were less affected than WT mice across a 50-fold range of LPS doses
ranging from modest (50 µg/kg) to high (2500 µg/kg). This is interesting with respect to a
possible mechanism of action since subdiaphragmatic VGX attenuates or abolishes LPS- and
IL-1β-induced fever when they are administered in low doses only (25, 63). Following high
doses VGX failed to prevent the induction of fever (2, 12, 43, 63). This raises the possibility
Page 17 of 53

18
that, in response to high doses of LPS, CCK may act on CCK2 receptors to induce the
expression of fever via a central, non-vagal route. This does not, however, preclude an
involvement of CCK2 receptors at the level of the vagus nerve. Rather, it points to the
possibility that activation of CCK2 receptors at this level may be sufficient, but not necessary,
for immune-brain communication required for fever when doses of LPS are high. As
highlighted by recent studies (36, 37), vagal activation may be of lesser importance for fever
genesis and HPA activation than for behavioral depression.
Our findings are in agreement with the reported inhibition of LPS-induced (sc, iv, 10
µg/kg) fever by a CCK2 receptor antagonist capable of crossing the BBB (79). Since fever
suppression persisted for longer when the antagonist was administered icv as opposed to
subcutaneously, the LPS-induced febrile response may occur primarily via the activation of
central CCK2 receptors rather than peripherally located CCK2 receptors. This hypothesis is
consistent with the largely central distribution of CCK2 receptors, including areas implicated
in thermoregulation (67).
In contrast to pharmacological studies examining the role of CCK2 receptors in fever
(77,79), we monitored Tb for several days following LPS. CCK2 receptor nullification
attenuated both the early and late changes in Tb induced by LPS with fever suppressing
persisting longer than 24 hrs with larger doses. This indicates a role for CCK2 receptor
activation in both the induction and maintenance of thermoregulatory changes that occur in
response to LPS.
The eicosanoid, PGE, is well accepted as one of the final steps in the fever process
(69, 76, 81), but cannot fully account for all thermoregulatory changes of the fever course
(79). PGE has been shown to act independently of CCK since the “fever-like” effects of icv
administered PGE1 could not be attenuated by CCK2 receptor antagonism (77). The reverse is
also true; the “fever-like” hyperthermic state induced by icv CCK was attenuated by CCK2
Page 18 of 53

19
receptor antagonism, but not the PG synthesis inhibitor, indomethacin (77). Thus, an
exclusive role for either CCK or PGE in the mediation of fever is unlikely.
Cholecystokinin interacts with a variety of neurohormones and peptides including
endogenous opioids (48). This interplay is especially interesting with respect to the present
study since opioids have been implicated in thermoregulation associated with systemic
inflammation. When administered to guinea pigs iv, the opioid antagonist, naloxone,
decreased the first and suppressed the second febrile phase elicited by LPS, and abolished the
febrile changes evoked by interferon-α2, TNF-α, and IL-6 (9). Although centrally
administered µ-opioid receptor antagonism attenuated LPS-induced fever in rats (4) but not
guinea pigs (62), peripheral administration attenuated fever in both species, suggesting that
circulating opioids may play a role in fever production (9,62). Given that the opioid system is
upregulated in CCK2KO mice (58), one may have hypothesised an increased febrile response
to LPS in this strain. This clearly did not occur except in response to the largest dose of LPS.
Pharmacological modulation of the opioid and CCK systems may provide further insight
regarding the coupling of these systems in thermoregulation.
The decrease in scotophase Tb compared to baseline may reflect a “true hypothermic”
reaction to LPS, that is, involving a decrease in set-point. The adaptive value of hypothermia
has been discussed previously (64). More recently, data were presented suggesting that
hypothermia and fever may be two different thermoregulatory strategies of the APR with
differing underlying mechanisms (21). Data from the present study indicate that, following
2500 µg/kg LPS WT mice produced a substantial decrease in scotophase Tb compared to
baseline, whereas no such decrease was observed for CCK2KO mice. CCK has been
implicated in the regulation of sympathetic vasomotor function (24). Further, CCK-8
modulates the firing rate of sympathetic nerves innervating interscapular brown adipose tissue
(85), induces skin vasodilation and a shock-like state, and a subsequent inhibition of heat-
Page 19 of 53

20
production and increase in heat-loss (35). Interestingly, however, the hypothermia induced by
CCK receptor activation has been demonstrated to depend on a CCK1, not a CCK2, receptor
mechanism (59, 77).
Prolonged hypothermia accompanied by a fall in mean arterial blood pressure is a
hallmark of septic shock (61). Although a brief decrease from baseline was present for WT
mice soon after injection with 2500 µg/kg LPS, this was rapidly followed by a prolonged
fever, a pattern that contrasts with previous studies employing this dose (39). Given the lack
of prolonged decreases in Tb during the photophase it is unlikely that any of the doses used in
the present study were sufficient to induce septic shock. Interestingly, CCK has been
demonstrated to reverse septic shock induced by large doses of LPS (8 mg/kg, iv, serotype
0111:B4; 41,42). It is unlikely that this is due to the activation of CCK2 receptors since KO
mice of the present study did not have an exacerbated shock response to the largest dose of
LPS. Moreover, it is unlikely that the present findings resulted from strain differences in
circulating CCK as a result of genetic compensation or an altered feedback loop. No
differences were observed between CCK2KO and their background strain in basal
concentrations of plasma, brainstem, or hypothalamic CCK (T.J. Weiland, unpublished
thesis). Furthermore, we have recently presented evidence of a decrease in murine plasma
CCK following low and high doses of LPS (84).
Evidence regarding the respective roles of CCK receptors in satiety is mixed. Since
vagal activation has been demonstrated to be critical for satiety (74), and since CCK1
receptors are present on the vagus nerve and vagal afferent terminals including the NTS, the
CCK1 receptor has been favoured for the regulation of food intake. However, satiety induced
by endogenous CCK has been demonstrated to require activation of the CCK2 receptor, and
although these receptors are located on the vagus nerve, they are also strongly represented in
Page 20 of 53

21
the hypothalamus. Indeed, it has been suggested that CCK may act not only at peripheral
sites, but also centrally to regulate food intake (22).
Results of the present study indicated that the anorexic effects of LPS were more
profound in WT compared to CCK2KO mice. In contrast, Bret-Dibat and Dantzer (8) found
that antagonism of the CCK2 receptor using a compound capable of crossing the blood brain
barrier failed to attenuate the suppression of food-motivated behavior in mice induced by a
low dose of ip LPS (serotype 0127:B8; 100 µg/kg) or IL-1β (20 µg/kg). The interpretation of
studies involving pharmacological manipulations is complicated by issues such as incomplete
antagonism, limited half-life, and bioavailability. While CCK2 receptor nullification through
genetic means is permanent, pharmacological receptor antagonism is not. However, since the
receptor antagonist employed by Bret-Dibat and Dantzer (8) is reasonably long-lasting, the
reason for the observed discrepancy is not clear. It should be noted, however, that they did not
verify the biological activity of the CCK2 antagonist employed. In addition, a variety of
procedural differences may account for these discrepant findings. The present study differed
from that of Bret-Dibat and Dantzer (8) in terms of ambient temperature (23 ± 2 °C vs. 30 ±1°C for the present study), timing of immune activation (scotophase vs. the photophase for the
present study), and food schedules (90 % food restricted vs. ad libitum in the present study).
The latter may be particularly relevant since a 10% food restriction increased plasma CCK
levels and reduced pancreatic function in the rat (14).
Assuming that CCK2 receptors are involved in LPS-induced anorexia as the present
study suggests, the potential levels at which CCK could become involved in immune-brain
communication are multiple. Receptors for CCK2 are present on the vagus nerve and at
several central sites. Thus, CCK may act centrally, peripherally, or at both levels. Studies
involving subdiaphragmatic VGX have indicated a critical role for the vagus nerve in food-
motivated behavior (7). Although this has not always been the case for LPS-induced changes
Page 21 of 53

22
in food intake itself (70), it is generally accepted that vagal afferents are required for the
expression of LPS-induced anorexia. More recently it has been shown that subdiaphragmatic
VGX blocks the anorexia induced by a “low” (5 µg/kg), but not “high” (125 µg/kg), dose of
ip LPS (71). However, since the serotype of LPS was not reported, it is difficult to compare
information regarding the precise dose with previous studies. Nonetheless, similar to Tb (12,
43, 63), these data suggest that vagal activation is necessary for the expression of anorexia
following a low dose of LPS, and that extra-vagal mechanisms are required following a high
dose. With this in mind, central CCK2 receptors are likely to mediate the anorexic effects of
large doses of LPS, whereas smaller doses may activate either peripheral CCK2 receptors of
the vagus, and/or central CCK2 receptors following vagal activation. However, that the most
robust strain differences occurred with the two large doses is suggestive of an exclusively
central role for CCK. The use of a CCK2 antagonist incapable of crossing the BBB or icv
injections may clarify this issue. Furthermore, since CCK exerts its effect on food intake via
both afferent and efferent vagal fibres (50), future studies may seek to determine the
contribution of CCK from vagal efferent fibres in moderating the response to illness.
The cachexic effects of LPS were more pronounced in WT mice compared to
CCK2KO mice across all doses of LPS. CCK acts synergistically with leptin (45), an
important circulating signal important for body weight regulation (31), and a recently
recognised mediator of LPS-induced anorexia and fever (66). Leptin receptors are also critical
in the recovery from LPS-induced hypothermia (75). In contrast to CCK, however, leptin is
thought to be devoid of a true thermoregulatory action; it acts via metabolic rate but does not
directly affect heat loss mechanisms (78). This synergy between CCK and leptin is
particularly interesting with respect to our results for Tb and body weight since circulating
leptin is decreased in CCK2KO mice compared to WTs (H. Chen, S. Kent & M. Morris,
Page 22 of 53

23
unpublished observations). It remains to be determined whether this strain difference remains
following LPS administration, and whether it impacts on thermoregulation and metabolism.
The close relationship of water consumption to food intake, makes it plausible that the
expression of LPS-induced adipsia and anorexia depend on a common pathway. Although
CCK2KO mice were significantly less anorexic compared to WT mice in response to all three
LPS doses, a strain difference in adipsia was observed only in response to the 500 µg/kg dose.
While this may be attributable to the larger variance in water consumption, it may also
indicate that the role, if any, of CCK2 receptors in mediating LPS-induced adipsia is indirect
or not robust.
In addition to food-motivated behavior and social exploration, decreased general
locomotor activity has also been demonstrated to be vagally-mediated (11, 43). Despite this,
relatively little is known regarding the mechanisms that support illness-associated changes in
locomotor activity. Under non-pathological conditions, CCK decreases locomotion in the rat
via a vagally-mediated pathway; conversely, CCK2 receptor antagonism increased the activity
of mice (33). LPS typically results in decreased locomotor activity, but this was minimal in
the CCK2KO mice. Consequently, it is possible that CCK may participate in LPS-induced
hypoactivity by acting on CCK2 receptors of the vagus nerve.
Further “downstream”, the locomotor effects observed may be due to the interaction of
CCK with opioid or dopaminergic systems. In several areas of the CNS, CCK is colocalised
with opioid peptides and/or dopamine (29, 57), and it antagonises opioid and dopamine-
mediated behavior (52, 56). Interestingly, opioid agonists increase locomotor activity in
rodents, and it is well established that this involves dopamine (3). Furthermore, the opioid
antagonist, naltrexone attenuates the LPS-induced decrease in locomotor activity (38). As
discussed earlier, CCK2KO mice differ from WTs in that they exhibit an increase in opioid
agonist tone, as well as a positive coupling of type 2 dopamine receptors to the cAMP
Page 23 of 53

24
pathway (58). Thus, it is unlikely that CCK acts alone to affect LPS-induced locomotor
activity.
The LPS-induced strain differences observed in the present study may be also be
related to the role of CCK2 receptors in depression. There is considerable overlap between the
APR and depressive episodes (85), and many features of the APR are prevented or attenuated
by chronic antidepressants. For example, fluoxetine attenuates LPS-induced anorexia and
cachexia, and abolishes its hypothermic effect (85). Similarly, tricyclic antidepressants
prevent LPS-induced anorexia, cachexia, adipsia, and decreased locomotor activity in rats
(72), and an atypical antidepressant attenuates the decreased social exploration and locomotor
effects of peripheral but not central LPS and IL-1β (13). Interestingly, mice treated with
CCK2 antagonists exhibit antidepressant-like responses in tests of reactitvity to stress (27,28).
This antidepressant effect is prevented by a selective dopamine D1 receptor agonist (27), and
by a δ-opioid antagonist (28). Thus, it is conceivable that CCK2 receptor invalidation may
attenuate the sickness syndrome by exerting an antidepressant effect involving stimulation of
δ-opioid and/or D1 receptor stimulation. This hypothesis is in agreement with the enhanced
opioid tone in CCK2KO mice.
Summary and Future Directions
Elucidating the role of CCK receptors in LPS-induced sickness behavior is far from
straightforward. Interpretation of the literature is complicated by species differences,
differences in immune activators, routes and timing of administration, and methods of
quantifying changes in behavior.
Using a genetic approach, this study has explored the roles of CCK2 receptors in LPS-
induced changes in Tb, activity, body weight, food intake, and water consumption. Our
findings strongly indicate an involvement of CCK2 receptors in LPS-induced sickness
behavior. Given the doses used and the fact that most CCK2 receptors are located centrally,
Page 24 of 53

25
this has important implications regarding the possible mechanisms of action of immune-to-
brain communication. While these data cannot exclude activation of CCK2 receptors at the
level of the vagus nerve, a possible role for these receptors in non-vagal routes of
communication is suggested.
CCK is known to alter the firing rate of sympathetic nerves innervating interscapular
brown adipose tissue (86), and has a documented involvement in blood pressure regulation
(24) and increased daytime Tb (83). Consequently, it would be invaluable to examine
thermoregulatory effector mechanisms in CCK2KO mice and mice pretreated with a CCK2
antagonist prior to LPS.
Page 25 of 53

26
Acknowledgements
We are grateful to Toshimitsu Matsui (Kobe University, Japan) for the kind donation of
homozygous CCK2KO breeding pairs, to Marika Gorrisen, Deb Anthony-Harvey-Beavis, and
Dominic Dwyer for practical assistance, and Ian Moore and Russell Beaton for technical
assistance.
Page 26 of 53

27
References
1. Avitsur R, Pollak Y, and Yirmiya R. Administration of interleukin-1 into the hypothalamic
paraventricular nucleus induces febrile and behavioral effects.
Neuroimmunomodulation, 4, 258-265, 1997.
2. Azab AN, and Kaplanski J. Vagotomy attenuates the effect of lipopolysaccharide on body
temperature of rats in a dose-dependent manner. J Endotoxin Res. 7(5), 359-64, 2001.
3. Baamonde A, Daugé V, Ruiz-Gayo M, Fulga IG, Turcaud S, Fournie-Zaluski MC, Roques
BP. Antidepressant-type effects of endogenous enkephalins protected by systemic RB
101 are mediated by opioid delta and dopamine D1 receptor stimulation. Eur J
Pharmacol, 216, 157-166, 1996.
4. Benamar K, Xin L, Geller EB, and Adler MW. Blockade of lipopolysaccharide-induced
fever by a mu-opioid receptor-selective antagonist in rats. Eur. J Pharmacol., 401,
161-165, 2000.
5. Bernheim HA, Block LH, and Atkins E. Fever: pathogenesis, pathophysiology and
purpose. Ann. Intern. Med., 91, 261-270, 1979.
6. Blackshaw LA, and Grundy D. Effects of cholecystokinin (CCK-8) on two classes of
gastroduodenal vagal afferent fibre. J. Auton. Nerv. Syst., 31, 191-201, 1990.
7. Bret-Dibat JL, Bluthé R-M, Kent S, Kelly KW, and Dantzer R. Lipopolysaccharide and
interleukin-1 depress food-motivated behavior in mice by a vagal-mediated
mechanism. Brain Behav. Immun., 9, 242-246, 1995.
8. Bret-Dibat JL, and Dantzer R. Cholecystokinin receptors do not mediate the suppression of
food-motivated behavior by lipopolysaccharide and interleukin-1β in mice. Physiol.
Behavl, 69, 325-331, 2000.
Page 27 of 53

28
9. Blatteis CM, Xin L, and Quan N. Neuromodulation of fever: apparent involvement of
opioids. Brain Res. Bull., 26, 219-223, 1991.
10. Bluthé R-M, Walter V, Parnet P, Layé S, Lestage J, Verrier D, Poole S, Stenning BE,
Kelley KW, and Dantzer R. Lipopolysaccharide induces sickness behavior in rats by a
vagal mediated mechanism. Comptes Rendus de L'academie des Sciences, III,
Sciences de la vie, 317, 499-503, 1994.
11. Bluthé R-M Martin SM, Michaud K, Kelley W, and Dantzer R. Vagotomy blocks
behavioral effects of interleukin-1 injected via the intraperitoneal route but not via
other systemic routes. Neuroreport, 7, 15-17 1996.
12. Caldwell FT, Jr., Graves DB, and Wallace BH. Humoral versus neural pathways for fever
production in rats after administration of lipopolysaccharide. J. Trauma, 47, 120-129,
1999.
13. Castanon N, Bluthé R-M, Dantzer R. Chronic treatment with the atypical antidepressant
tianeptine attenuates sickness behavior induced by peripheral but not central
lipopolysaccharide and interleukin-1beta in the rat. Psychopharmacology (Berlin),
154(1):50-60, 2001.
14. Chowdury P, and Rayford PL. Effect of food restriction on plasma cholecystokinin levels
and exocrine pancreatic function in rats. Ann Clin Lab Sci. 31(4), 376-82, 2001.
15. Cox JE, and Randich A. CCK-8 activates hepatic vagal C-fiber afferents. Brain Res., 776,
189-194, 1997.
16. Cunningham ME, Shaw-Stiffel TA, Berstein LH, Tinghitella TJ, Claus RE, Brogan DA,
and McMillen MA. Cholecystokinin-stimulated monocytes produce inflammatory
cytokines and eicosanoids. Am. J. Gastroenterol., 90, 621-625, 1995.
17. Dantzer R. Cytokine-induced sickness behavior: mechanisms and implications. Ann N Y
Acad Sci, 933, 222-234, 2001.
Page 28 of 53

29
18. Daun JM, and McCarthy DO. The role of cholecystokinin in interleukin-1-induced
anorexia. Physiol. Behav., 54, 237, 1993.
19. Day HEW, McKnight AT, Poat JA, Hughes J. Evidence that cholecystokinin induces
immediate early gene expression in the brainstem, hypothalamus, and amygdala of the
rat by a CCKA receptor mechanism. Neuropharmacology, 33, 719-727, 1994.
20. Deak T, Bellamy C, and Bordner KA. Protracted increases in core body temperature and
interleukin-1 following acute administration of lipopolysaccharide: implications for
the stress response. Physiol Behav. 85(3), 296-307, 2005.
21. Dogan MD, Ataoglu H, and Akarsu ES. Characterization of the hypothermic component
of LPS-induced dual thermoregulatory response in rats. Pharmacol., Biochem.,
Behav., 72, 143-150, 2002.
22. Dourish CT, Rycroft W, and Iversen SD. Postponement of satiety by blockade of brain
cholecystokinin (CCK-B) receptors. Science, 245, 1509-1511, 1989.
23. Elmquist JK, Scammell TE, and Saper CB. Mechanisms of CNS response to systemic
immune challenge: the febrile response. Trends Neurosci., 20, 565-570, 1997.
24. Fossa AA, DePasquale MJ, Morrone J, Zorn SH, Bryce D, Lowe JA, and McLean S.
Cardiovascular effects of cholecystokinin-4 are mediated by the cholecytokinin-B
receptor subtype in the conscious guinea pig and dog. J. Pharmacol. Exp. Ther., 281,
180-187, 1997.
25. Hansen MK, and Krueger JM. Subdiaphragmatic vagotomy blocks the sleep- and fever-
promoting effects of interleukin-1β. Am. J. Physiol., 273, R1246 -R1253, 1997.
26. Hare AS, Clarke G, and Tolchard S. Bacterial lipopolysaccharide-induced changes in Fos
protein expression in the rat brain, correlation with thermoregulatory changes and
plasma corticosterone. J. Neuroendocrinol., 7, 791-799, 1995.
Page 29 of 53
30
27. Hernando F, Fuentes JA, Roques BP, and Ruiz-Gayo M. The CCKB receptor antagonist,
L-365,260, elicits antidepressant-type effects in the forced-swim test in mice. Eur J
Pharmacol., 261(3), 257-63, 1994
28. Hernando F, Fuentes JA, Roques BP, Fournie-Zaluski MC, and Ruiz-Gayo M.
Antidepressant-like effects of CCK(B) receptor antagonists: involvement of the opioid
system. Eur J Pharmacol. 318(2-3), 221-9, 1996.
29. Hokfelt T, Lundberg JM, Schultzberg M, Johansson O, Skirboll L, Arggard A, Fredholm
B, Hamberger B, Pernow B, and Rehfeld J. Cellular localization of peptides in neural
structures. Proceedings of the Royal Society of London, Biological Science, 210, 62-
77, 1980.
30. Horinouchi Y, Akiyoshi J, Nagata A, Matshusita H, Tsutsumi T, Isogawa K, Noda T,
Nagayama H. Reduced anxious behavior in mice lacking the CCK2 receptor gene. Eur
Neuropsychopharmacol. 14(2),157-61, 2004
31. Hosoi T, Okuma Y, Ono A, and Nomura Y. Subdiaphragmatic vagotomy fails to inhibit
intravenous leptin-induced IL-1β expression in the hypothalamus. Am. J. Physiol.,
282, R627-631, 2002.
32. Howell DC. Statistical Methods for Psychology edn 3rd. Boston: PWS-Kent Publishing
Company; 1992.
33. Itoh S, and Katsura G. Behavioral effect of cholecystokinin octapeptide in vagotimised
rats. Can. J. Physiol. Pharmacol., 64, 745-747, 1986.
34. Ivanov AI, Kulchitsky VA, and Romanovsky AA. Role for the cholecystokinin-A receptor
in fever: a study of mutant rat strain and pharmacological analysis. J. Physiol. (Lond),
547, 941-949, 2003.
35. Kapas L, Obal Jnr F, Penke B, and Obal F. Cholecystokinin-octapeptide-induced
hypothermia in rat: dose-effect and structure-effect relationships, effects of ambient
Page 30 of 53

31
temperature, pharmacological interactions and tolerance. Neuropharmacology, 26,
131-137, 1987.
36. Konsman JP, Luheshi GN, Bluthé R-M, and Dantzer R. The vagus nerve mediates
behavioral depression, but not fever, in response to peripheral immune signals; a
functional anatomical anlaysis. Eur. J. Neurosci., 12, 4434-4446, 2000.
37. Konsman JP, Parnet P, and Dantzer R. Cytokine-induced sickness behavior: mechanisms
and implications. Trends Neurosci., 25, 154-159, 2002.
38. Kouhata S, Kagay A, Nakae S, Nakata Y, and Yamawaki S. Effect of acute
lipopolysaccharide administration on (+/-)-1-(2-dimethoxy-4-iodophenyl)-2
aminopropane-induced wet dog shake behavior in rats: comparison with body weight
change and locomotor activity. Prog. Neuropsychopharmacol. Biol Psych., 25, 395-
407, 2001.
39. Kozak W, Conn CA, and Kluger MJ. Lipopolysaccharide induces fever and depresses
locomotor activity in unrestrained mice. Am. J. Physiol., 35, R125-R135, 1994.
40. Kurosawa M, Uvnas-Moberg K, Miyasaka K, and Lundeberg T. Interleukin-1 increases
activity of the gastric vagal afferent nerve partly via stimulation of Type A CCK
receptor in anesthetized rats. J. Auton. Nerv. Syst., 62, 72-78, 1997.
41. Ling YL, Huang SS, Wang LF, Zhang JL, Wan M, and Hao RL. [Cholecystokinin-
octapeptide (CCK-8) reverses experimental endotoxin shock]. Sheng Li Xue Bao, 48,
390-394, 1996.
42. Ling YL, Meng AH, Zhao XY, Shan BE, Zhang JL, and Zhang XP. Effect of
cholecystokinin on cytokines during endotoxic shock in rats. World J. Gastroenterol.,
7, 667-671,2001.
Page 31 of 53

32
43. Luheshi GN, Bluthé R-M, Rusforth D, Mulcahy N, Konsman JP, Goldbach M, and
Dantzer R. Vagotomy attenuates the behavioral but not the pyrogenic effects of
interleukin-1 in rats. Auton. Neurosci., 85, 127-132, 2000.
44. Martin SM, Wilson BC, Chen X, Takahashi Y, Poulin P, Pittman, QJ. Vagal CCK and 5-
HT(3) receptors are unlikely to mediate LPS or IL-1-β-induced fever. Am. J. Physiol.,
279, R960-R965, 2000.
45. Matson CA, Reid DA, Cannon TA, and Ritter RC. Cholecystokinin and leptin act
synergistically to reduce body weight. Am. J. Physiol., 278, R882-R890, 2000.
46. Mercer LD, and Beart PM. Histochemistry in the rat brain and spinal cord with an
antibody directed at the cholecystokininA receptor. Neurosci. Lett., 225, 97-100, 1997.
47. Miceli MO, van der Kooy D, Post CA, Della-Fera MA, and Baile CA. Differential
distribution of cholecystokinin in hamster and rat forebrain. Brain Res., 402, 318-330,
1987.
48. Micevych P, Chaban V, Quesada A, and Sinchak K. Estrogen modulates cholecystokinin:
opioid interactions in the nervous system. Pharmacol. Toxicol, 91, 387-379, 2002.
49. Monnikes H, Lauer G, and Arnold R. Peripheral administration of cholecystokinin
activates c-fos expression in the locus coeruleus/sub-coeruleus nucleus, dorsal vagal
complex and paraventricular nucleus via capsaicin-sensitive vagal afferents and CCK-
A receptors in the rat. Brain Res., 770, 277-288, 1997.
50. Moran TH, Baldessarini AR, Salorio CF, Lowery T, and Schwartz GJ. Vagal afferent and
efferent contributions to the inhibition of intake by cholecystokinin. Am. J. Physiol.,
272, R1245-R1251, 1997.
51. Moran TH, Robinson PH, Goldrich MS, and McHugh PR. Two brain cholecystokinin
receptors: implications for behavioral actions. Brain Res., 362, 175-179, 1986.
Page 32 of 53

33
52. Moroji JE, and Hagino Y. A behavioral pharmacological study of CCK-8 related peptides
in mice. Neuropeptides, 8, 273-286, 1986.
53. Nagata A, Ito M, Iwata N, Kuno J, Takano H, Minowa O, Chihara K, Matsui T, and Noda
T. G-protein-coupled cholecystokinin-B/gastrin receptors are responsible for
physiological cell growth of the stomach mucosa. PNAS USA, 93, 11825-11830, 1996.
54. Noakes P. Creation of Transgenic Mice. In Neuroscience Methods: A guide for advanced
students. Edited by Martin R, Amsterdam: Harwood Academic Publishers, 220-232,
1997.
55. Noble F, Stephen AW, N. CJ, Bradwejn J, Seroogy KB, Hamon M, and Roques BP.
International Union of Pharmacology XXI. Structure, distribution, and functions of
cholecystokinin receptors. Pharmacol. Rev., 51, 747-781, 1999.
56. Noble F, Derrien M, and Roques BP. Modulation of opioid analgesia by CCK at the
supraspinal level: Evidence of regulatory mechanisms between CCK and enkephalin
systems in the control of pain. Br. J. Pharmacol., 109,1064-1070, 1993.
57. Pelaprát D, Daugé V, Durieux C, Charpentier B, and Roques BP. [Co-localization of CCK
and dopamine. Biochemical and pharmacological aspects]. Encephale, 15, 85-
89,1989.
58. Pommier B, Beslot F, Simon A, Pophillat M, Matsui T, Daugé V, Roques BP, and Noble
F. Deletion of the CCK2 receptor in mice results in an upregulation of the endogenous
opioid system. J. Neurosci., 22, 2005-2011, 2002.
59. Rezayat M, Ravandeh N, and Zarrindast MR. Cholecystokinin and morphine-induced
hypothermia. Eur. Neuropsychopharmacol., 9, 219-225, 1999.
60. Rietschel ET, Kirikae T, Schade FU, Ulmer AJ, Holst O, Brade H, Schmidt G, Mamate U,
Grimmecke HD, and Kusumoto S. The chemical structure of bacterial endotoxin in
relation to bioactivity. Immunobiology. 187(3-5), 169-90, 1993.
Page 33 of 53

34
61. Romanovsky AA, Shido O, Sakurada S, Sugimoto N, and Nagasaka T. Endotoxin shock:
thermoregulatory mechanisms. Am. J. Physiol., 270, R693-703, 1996.
62. Romanovsky AA, Shido O, Ungar AL, Blatteis CM. Peripheral naloxone attenuates
lipopolysaccharide fever in guinea pigs by an action outside the blood-brain barrier.
Am. J. Physiol., 266, R1824-R1831, 1994.
63. Romanovsky AA, Simons CT, Székely M, and Kulchitsky VA. The vagus nerve in the
thermoregulatory response to systemic inflammation. Am. J. Physiol., 273, R407-
R413, 1997.
64. Romanovsky AA, and Székely M. Fever and hypothermia: two adaptive thermoregulatory
responses to systemic inflammation. Med. Hyp., 50, 219-226, 1998.
65. Sacerdote P, Ruff MR, and Pert CB. Cholecystokinin and the immune system: receptor-
mediated chemotaxis of human and rat monocytes. Peptides, 9, 29-34, 1988.
66. Sachot C, Poole S, and Luheshi GN. Circulating leptin mediates lipopolysaccharide-
induced anorexia and fever in rats. J Physiol., 561(Pt 1), 263-72, 2004
67. Saito A, Williams JA, Waxler SH, and Goldfine ID. Alterations of brain cholecystokinin
receptors in mice made obese with goldthioglucose. J. Neurochem., 39, 525-528,
1982.
68. Sawchenko PE. Central connections of the sensory and motor nuclei of vagus nerve. J.
Auton. Nerv. Syst., 9, 13-26, 1983.
69. Scammell TE, Elmquist JK, Griffin JD, and Saper CB. Ventromedial preoptic
prostaglandin E2 activates fever producing autonomic pathways. J. Neurosci., 16,
6246-6254, 1996.
70. Schwartz GJ, Plata-Salamán CR, and Langhans W. Subdiaphragmatic vagal
deafferentation fails to block feeding-suppressive effects of LPS and IL-1 β in rats.
Am. J. Physiol., 273, R1193-R1198, 1997.
Page 34 of 53
35
71. Sergeer VG, and Akmaev IG. Effects of vagotomy and bacterial lipopolysaccharide on
food intake and expression of cyclooxygenase-2 mRNA in rat brain vessels. Bull Exp
Biol Med., 129(6), 553-5, 2000.
72. Shen Y, Connor TJ, Nolan Y, Kelly JP, & Leonard BE. Differential effect of chronic
antidepressant treatments on lipopolysaccharide-induced depressive-like behavioural
symptoms in the rat. Life Sci., 65(17):1773-86, 1999.
73. Simons CT, Kulchitsky VA, Sugimoto N, Homer LD, Székely M, and Romanovsky AA.
Signaling the brain in systemic inflammation: which vagal branch is involved in fever
genesis? Am. J. Physiol., 275, R63-68, 1998.
74. Smith GP, Jerome C, Cushin BJ, Eterno R, and Simansky KJ. Abdominal vagotomy
blocks the satiety effect of cholecystokinin in the rat. Science, 213, 1036-1037, 1981.
75. Steiner AA, Dogan MD, Ivanov AI, Patel S, Rudaya AY, Jennings DH, Orchinik M, Pace
TW, O'Connor KA, Watkins LR, and Romanovsky AA. A new function of the leptin
receptor: mediation of the recovery from lipopolysaccharide-induced hypothermia.
FASEB J., 18(15):1949-51, 2004
76. Stitt JT. Differential sensitivity in the sites of fever production by prostaglandin E1 within
the hypothalamus of the rat. J. Physiol., 432, 99-110, 1991.
77. Szelényi Z, Barthos L, Székely M, and Romanovsky AA. Cholecystokinin octapeptide
(CCK-8) injected into a cerebral ventricle induces a fever-like thermoregulatory
response mediated by type B CCK-receptors in the rat. Brain Res., 638, 69-77, 1994.
78. Székely M, Petervari E, and Szelényi Z. Orexigenic vs. anorexigenic peptides and feeding
status in the modulation of fever and hypothermia. Front Biosci., 9, 2746-63, 2004.
79. Székely M, Szelényi Z, and Balasko M. Cholecystokinin participates in the mediation of
fever. Pflugers Archives, 428, 671-673, 1994.
Page 35 of 53

36
80. Tkacs NC, and Li J. Immune stimulation induces Fos expression in brainstem amygdala
afferents. Brain Res. Bull., 48, 223-231, 1999.
81. Ushikubi F, Segi E, Sugimoto Y, Muratas T, Matsuoka T, Kobayashi T, Hizaki H, Tuboi
K, Katsuyama M, Ichikawa A, Tanaka Y, Yoshida N, and Narumiya S. Impaired
febrile responses in mice lacking the prostaglandin E receptor subtype EP3. Nature,
395, 281-284, 1998.
82. Wang L, Martinex v, Barrachina MD, Tache Y. Fos expression in the brain induced by
peripheral injection of CCK or leptin plus CCK in fasted lean mice. Brain Res, 791(1-
2):157-66, 1998.
83. Weiland TJ, Voudouris NJ, and Kent S. The role of CCK2 receptors in energy
homeostasis: Insights from the CCK2 receptor-deficient mouse. Physiol. Behav. , 82
(2-3), 471-476, 2004.
84. Weiland TJ, Kent S, Voudouris, NJ, and Shulkes AA. Cholecystokinin levels in murine
plasma and tissue following lipopolysaccharide administration. Peptides, 26 (3), 447-
455, 2005.
85. Yirmiya R, Pollack Y, Barak O, Avitsur R, Ovadia H, Bette M, Weihe E, and Weidenfeld
J. Effects of antidepressant drugs on the behavioral and physiological responses to
lipopolysaccharide (LPS) in rodents. Neuropsychopharmacology. 24(5), 531-44, 2001.
86. Yoshimatsu H, Egawa M, and Bray GA. Effects of cholecystokinin on sympathetic
activity to interscapular brown adipose tissue. Brain Res., 597, 298-303, 1992.
Page 36 of 53

37
Figure Legends
Figure 1
a) Mean (± SEM) 15 min Tb (°C) of CCK2KO and WT mice challenged with 50 µg/kg LPS or
vehicle expressed as difference from baseline (n=8 all groups). Mean 15 min Tb 2h prior to
injection and at injection: WT vehicle-treated mice = 37.20 ± .16 and 36.98 ± 0.14; KO
vehicle treated mice = 36.92 ± 0.11 and 37.22 ± 0.15; WT 50 µg/kg treated mice = 37.08 ±0.10 and 37.18 ± 0.22; KO 50 µg/kg treated mice = 37.17 ± 0.13 and 37.23 ± 0.13.
(b) Mean (± SEM) hourly Tb (°C) of CCK2KO and WT mice challenged with 50 µg/kg LPS
or vehicle expressed as difference from baseline (n=8 all groups). Mean hourly Tb 2h prior
to injection and at injection: WT vehicle-treated mice = 37.28 ±.12 and 37.02 ± 0.14; KO
vehicle treated mice = 36.85 ± 0.14 and 37.19 ± 0.14; WT 50 µg/kg treated mice = 37.04 ±0.07 and 37.22 ± 0.21; KO 50 µg/kg treated mice = 37.15 ± 0.13 and 37.20 ± 0.11.
(c) 12-hourly mean (± SEM) Tb (°C) of CCK2KO and WT mice challenged with 50 µg/kg
LPS or vehicle (n=8 all groups).
(d) Mean (± SEM) 15 min Tb (°C) of CCK2KO and WT mice challenged with 500 or 2500
µg/kg LPS expressed as difference from baseline (n=8 all groups). Mean 15 min Tb 2h prior
to injection and at injection: WT 500 µg/kg treated mice = 37.28 ± 0.14 and 37.34 ± 0.14; KO
500 µg/kg treated mice = 37.10 ± 0.15 and 37.71 ± 0.14; WT 2500 µg/kg treated mice = 37.23
± 0.13 and 37.20 ± 0.15; KO 2500 µg/kg treated mice = 37.01 ± 0.20 and 37.67 ± 0.15.
(e) Mean (± SEM) hourly Tb (°C) of CCK2KO and WT mice challenged with 500 or 2500
µg/kg LPS expressed as difference from baseline (n=8 all groups). Mean hourly Tb 2h prior
to injection and at injection: WT 500 µg/kg treated mice = 37.30 ± 0.12 and 37.49 ± 0.14; KO
500 µg/kg treated mice = 37.00 ± 0.09 and 37.75 ± 0.11; WT 2500 µg/kg treated mice = 37.23
± 0.09 and 37.22 ± 0.13; KO 2500 µg/kg treated mice = 36.95 ± 0.20 and 37.75 ± 0.12.
Page 37 of 53
38
(f) 12-hourly mean (± SEM) Tb (°C) of CCK2KO and WT mice challenged with 500 or 2500
µg/kg LPS (n=8 all groups).
Figure 2
(a) 12-hourly mean (± SEM) percentage change in locomotor activity of CCK2KO and WT
mice challenged with 50 µg/kg LPS or vehicle (n=8 all groups).
(b) 12-hourly mean (± SEM) percentage change in locomotor activity of CCK2KO and WT
mice challenged with 500 µg/kg LPS (n=7 and 6 respectively) or 2500 µg/kg LPS (n=8 both
groups).
Figure 3
(a) Mean (± SEM) percentage change in body weight of CCK2KO and WT mice challenged
with 50 (n=7 both groups) µg/kg LPS or vehicle (n=8 both groups).
(b) Mean (± SEM) percentage change in body weight of CCK2KO and WT mice challenged
with 500 µg/kg LPS or 2500 µg/kg LPS (n=8 all groups).
Figure 4
(a) 12-hourly mean (± SEM) percentage change in food intake by CCK2KO and WT mice
challenged with 50 µg/kg LPS (n=8 both groups) or vehicle (n=6 and 7 respectively).
(b) 12-hourly mean (± SEM) percentage change in food intake by CCK2KO and WT mice
challenged with 500 µg/kg LPS (n=8 and 6 respectively) or 2500 µg/kg LPS (n=8 both
groups) or vehicle.
Page 38 of 53
39
Figure 5
(a) Mean (± SEM) percentage change in average water consumption of CCK2KO and WT
mice administered 50 µg/kg LPS or vehicle (n=8 all groups).
(b) Mean (± SEM) percentage change in average water consumption of CCK2KO and WT
mice administered 500 or 2500 µg/kg LPS or vehicle (n=8 all groups).
Page 39 of 53

Figure 1(a)
Page 40 of 53
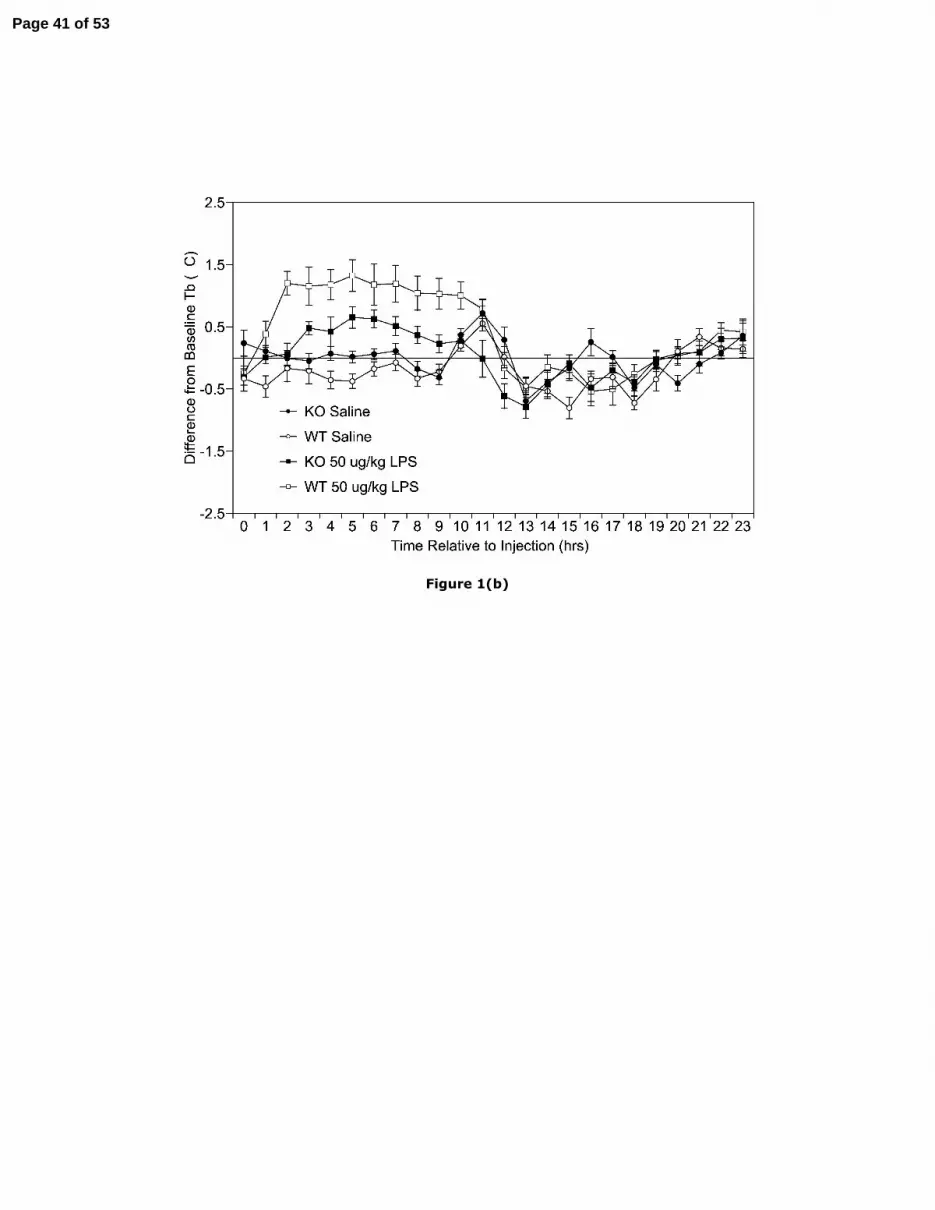
Figure 1(b)
Page 41 of 53

Figure 1(c)
Page 42 of 53

Figure 1(d)
Page 43 of 53

Figure 1(e)
Page 44 of 53

Figure 1(f)
Page 45 of 53

Figure 2(a)
Page 46 of 53

Figure 2(b)
Page 47 of 53

Figure 3(a)
Page 48 of 53

Figure 3(b)
Page 49 of 53

Figure 4(a)
Page 50 of 53

Figure 4(b)
Page 51 of 53
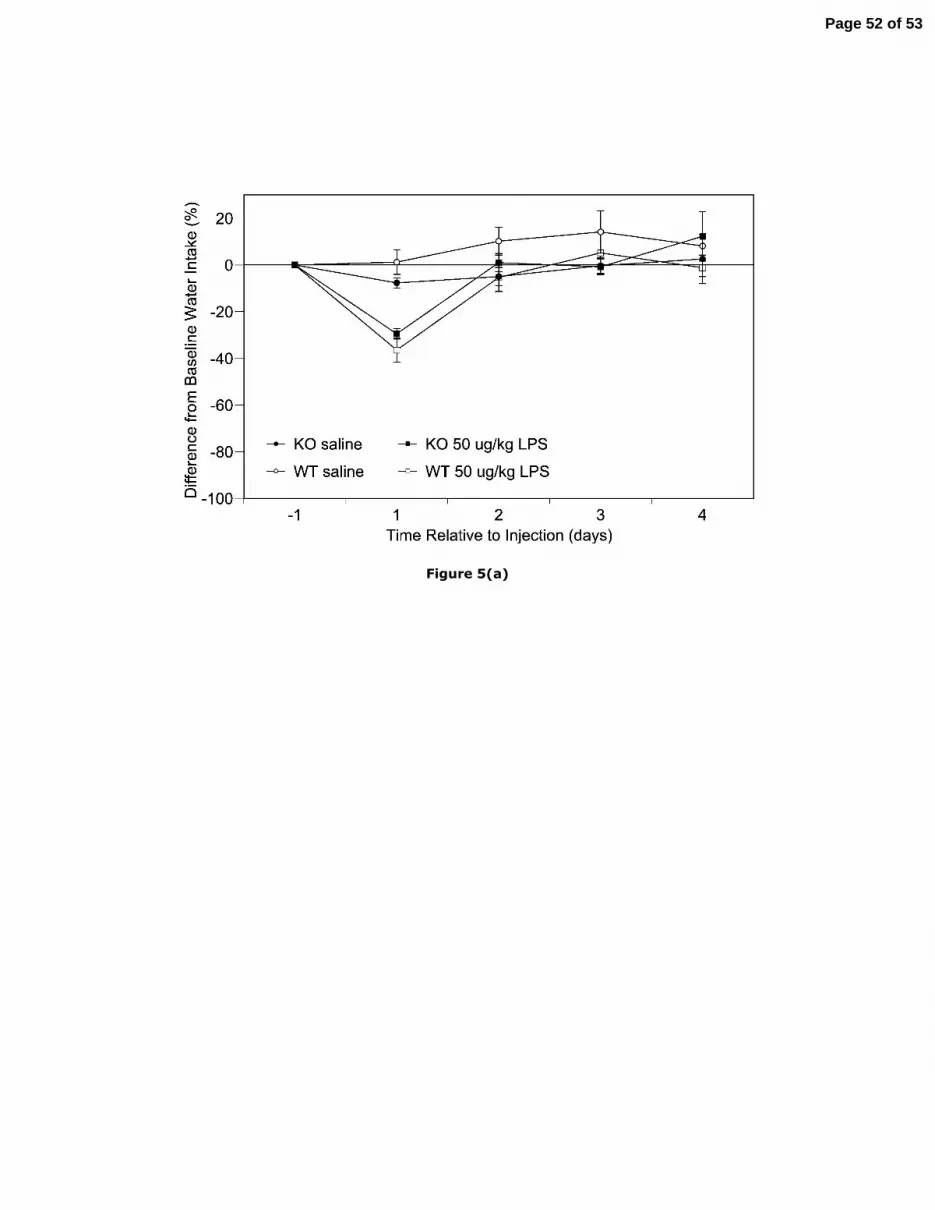
Figure 5(a)
Page 52 of 53

Figure 5(b)
Page 53 of 53
Top Related
Copyright © 2022 FDOKUMEN

