


Bahasa
Halaman
Hukum

Case Studies in the Mathematical Statistics Course
Deborah A. Nolan
Abstract
We have developed a model for teaching mathematical statistics through de-tailed case studies. We use these case studies to bridge the gap between statisticaltheory and practice, and to help students develop an understanding of the basicideas in mathematical statistics. We also use them to motivate students to explorethe concepts of statistics. Although we strongly advocate teaching mathematicalstatistics through case studies, there are many challenges that arise from this ap-proach. In this paper, we describe how we find case studies and incorporate theminto the course. We outline the challenges that we face in adopting this approach,and discuss our efforts to overcome these challenges.
Keywords: undergraduate statistical education; pedagogy
1 Introduction
Cobb and Moore [2] call for the design of a better undergraduate mathematical statisticscourse that both strengthens students' mathematical skills and integrates data analysisinto the curriculum. Others have called for similar courses (Hogg [11], Kempthorne[12], Moore and Roberts [13], Mosteller [14]). But, it is a challenge to bring dataanalysis skills into the mathematical statistics course. We advocate that we are betterable to achieve this integration by including case studies in the curriculum.
We (Nolan and Speed [15]) have developed a course that teaches mathematicalstatistics through in-depth case studies. Our approach integrates statistical theory andpractice in a way not commonly found in an undergraduate course in mathematicalstatistics. Each case study centers around a scientific question; it contains a dataset toaddress the question, and we develop statistical theory in order to answer this question.There are three salient aspects to our case studies approach:
• The problem central to the case is introduced first, and a rich context for theproblem and a description of data collected to address the problem are providedbefore any relevant statistical theory is discussed.
• The solution to the problem raised in the case study is not provided to the stu-dents. In fact, there are many possible solutions which may use different types ofanalysis.
166 D.A.Nolan
• The student plays the role of a consultant, analyst, government official, textbookauthor, etc. in developing and presenting the solution to the problem.
We have found that there are many advantages to incorporating case studies in thisway in the advanced mathematical statistics course. For example, when case studies arecentral to the course, the cases motivate students to learn the theory, and they providea meaningful framework for the theoretical material. Solving a case gives the studentexperience with how statistics can be used to answer scientific questions, and it helpsthe student develop skills in statistical thinking. The student also becomes practiced incommunicating his or her ideas in writing, and he or she becomes versed in the use ofstatistical software. However, the instructor faces many challenges when incorporatingcase studies in the mathematical statistics course, challenges which are different fromthe familiar ones faced in teaching mathematical statistics in a more traditional style.First, we need to find appropriate cases to use in our course. In our classroom we facethe challenge of how to integrate the cases with theory. Outside of the classroom, weneed to help students develop effective writing and data presentation skills, to quicklyteach them how to use statistical software, and we must provide fair and informativeevaluations of their reports and analyses.
In this paper, we present an example of how we use one particular case study ina mathematical statistics course. Through this example, we describe our model forteaching mathematical statistics via case studies, including providing sample classroomactivities and assignments. Finally, we conclude with a discussion of what we look forin a case study and practical details related to course management.
2 The Case of HIV and Hemophilia
One case with which we have had quite a lot of success addresses the question ofwhether the Human Immunodeficiency Virus (HIV) causes Acquired Immune Defi-ciency Syndrome (AIDS). A few leading scientists have questioned whether HIV causesAIDS (Harris [10]), and this debate has received a lot of public attention. See for ex-ample "Mbeki Details Quest to Grasp South Africa's AIDS Disaster" New York Times,May 7, 2000. A detailed description of this case study can be found in Nolan and Speed[16].
With this case, students have the opportunity to examine the question of causality.To begin, we briefly introduce the students to the core problem. In the 1960s and70s, there were major advances in hemophilia treatment when new techniques weredeveloped for making blood products with higher concentrations of clotting factors.The change in treatment resulted in dramatically higher survival rates for hemophiliacs,and the median age at death for hemophiliacs increased steadily. Unfortunately, thistrend turned downward in the 1980s when large numbers of people with hemophiliabegan to die from AIDS. Immune failure soon became the single most common causeof death in hemophiliacs (Harris [10]).
Case Studies 167
The blood supply was contaminated with the Human Immunodeficiency Virus. The
name of the virus alone implies that HIV causes AIDS. In fact, the current definition
of AIDS adopted by the U.S. Centers for Disease Control (CDC) requires patients to
have seroconverted {i.e. become infected with HΓV) in order to be diagnosed as having
AIDS. Some scientists contend that HIV infection is necessary for AIDS but that it
alone is not sufficient to cause AIDS. Others, such as the retrovirologist Peter Duesberg
at the University of California, Berkeley, have claimed that HIV is a harmless passenger
virus that acts as a marker for the number of transfusions a patient with hemophilia has
received. According to Duesberg, AIDS is caused by the large quantity of contaminants
people with hemophilia receive in their lifetime dosages of clotting factor (Cohen [3]).
In this case, students have the opportunity to examine the question of whether HIV
causes AIDS using data from a large study of hemophiliacs. Hemophiliacs offer a
unique window on the effects of HIV infection because there are solid data comparing
those who tested HIV-positive with those who tested HIV-negative. These data are from
the Multicenter Hemophilia Cohort Study (MHCS), which is sponsored by the U.S.
National Cancer Institute (NCI). The study followed over 1600 hemophilia patients at
16 treatment centers (12 in the U.S. and 4 in western Europe) during the period from
January 1, 1978 to December 31, 1995 (Goedert et al [7], Goedert [8]).
Conversion
B I Conversion 1 D e a t h
C\ 1 Withdrew
78 80 82 84 86 88 90 92 94 96
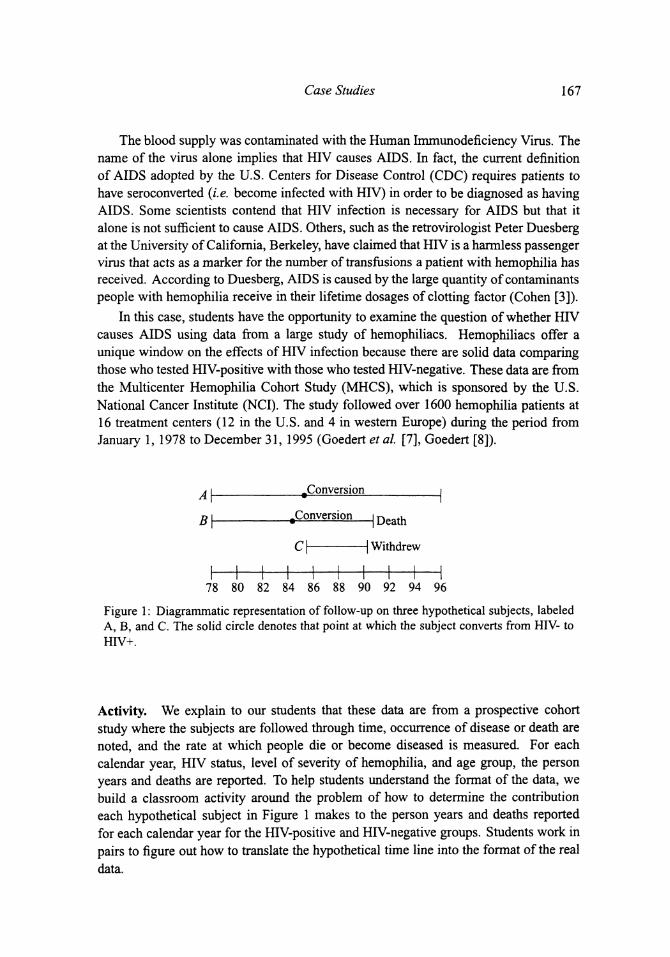
Figure 1: Diagrammatic representation of follow-up on three hypothetical subjects, labeledA, B, and C. The solid circle denotes that point at which the subject converts from HIV- toHIV+.
Activity. We explain to our students that these data are from a prospective cohort
study where the subjects are followed through time, occurrence of disease or death are
noted, and the rate at which people die or become diseased is measured. For each
calendar year, HIV status, level of severity of hemophilia, and age group, the person
years and deaths are reported. To help students understand the format of the data, we
build a classroom activity around the problem of how to determine the contribution
each hypothetical subject in Figure 1 makes to the person years and deaths reported
for each calendar year for the HIV-positive and HIV-negative groups. Students work in
pairs to figure out how to translate the hypothetical time line into the format of the real
data.
168 D. A. Nolan
3 More on Hemophilia, AIDS, and Causation
To emphasize the importance of working on a problem in context, we provide stu-dents with all sorts of background information relevant to the case. Students learnabout hemophilia. For example, they read that blood plasma contains twelve factors,I-XII, which play a role in blood coagulation, and a person with low factor VIII hashemophilia. Students learn how hemophilia is treated with blood products. They alsolearn about AIDS and the history of its definition. We compare the CDC definition withthose proposed by skeptics who argue that HIV is an innocent marker for other junk inthe blood. This leads to a discussion of Koch's postulates, which are simple rules pro-posed by the 19^ century physician Robert Koch that should be fulfilled in order toestablish that an organism causes a particular disease (Cohen [3]).
Discussion. We discuss the background to the problem in class, where students whohave taken courses in a field related to the application (e.g. biology, public health)bring their expertise to the discussion. We also have invited experts on the case to ourclassroom to deliver a guest lecture on the topic.
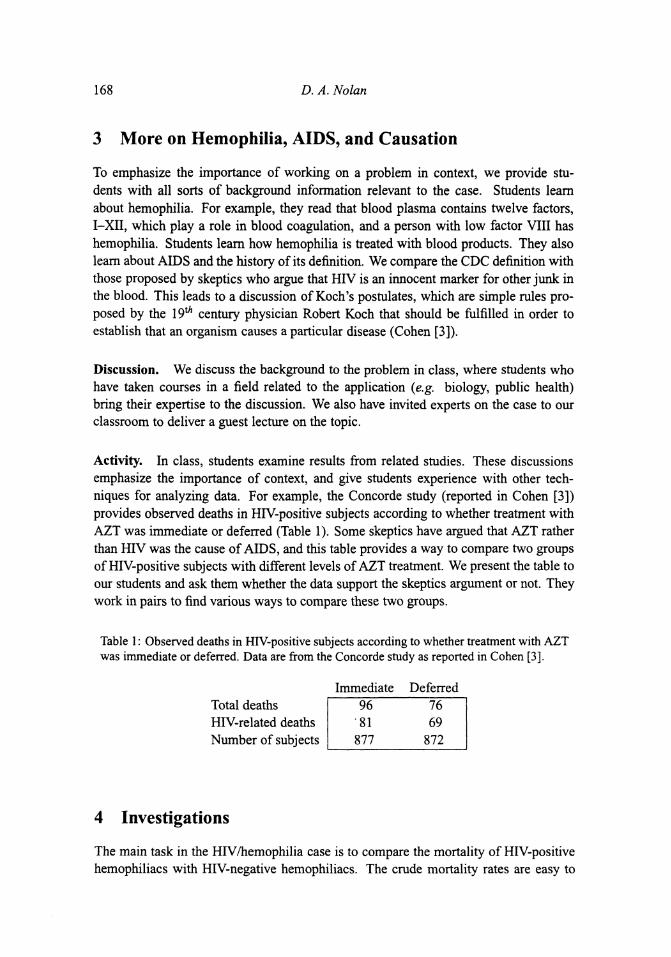
Activity. In class, students examine results from related studies. These discussionsemphasize the importance of context, and give students experience with other tech-niques for analyzing data. For example, the Concorde study (reported in Cohen [3])provides observed deaths in HIV-positive subjects according to whether treatment withAZT was immediate or deferred (Table 1). Some skeptics have argued that AZT ratherthan HIV was the cause of AIDS, and this table provides a way to compare two groupsof HIV-positive subjects with different levels of AZT treatment. We present the table toour students and ask them whether the data support the skeptics argument or not. Theywork in pairs to find various ways to compare these two groups.
Table 1: Observed deaths in HIV-positive subjects according to whether treatment with AZTwas immediate or deferred. Data are from the Concorde study as reported in Cohen [3].
Immediate DeferredTotal deathsHIV-related deathsNumber of subjects
9681
877
7669
872
4 Investigations
The main task in the HIV/hemophilia case is to compare the mortality of HIV-positivehemophiliacs with HIV-negative hemophiliacs. The crude mortality rates are easy to
Case Studies 169
compute and strikingly different, but it may be inappropriate to make such compar-isons because the HIV-positive and HIV-negative hemophiliacs may differ accordingto factors associated with mortality, such as age. To get this message across to thestudents, we make suggestions on how to approach the problem.
For example, we ask: Is the HIV-negative population younger or older than theHIV-positive population? Do you find evidence in the MHCS study to support Dues-berg's claim that it is not HIV that has caused AIDS among hemophiliacs but the "otherjunk" in the transfusions the patient receives? At times we get a bit more specific,with suggestions such as the following: provide interval estimates for the differencein mortality rates between HIV-positive and HIV-negative hemophiliacs according toseverity of hemophilia and calendar year. At the point where students are beginningto investigate the data, we introduce them to a variety of techniques for making inter-val estimates, and leave it to them to determine which are appropriate for the currentcircumstances. We emphasize that there is no single correct approach to analyzing thedata.
Activity. Notice that the suggestions do not request students to make specific com-putations. To prepare the students for translating these investigations into statisticalactivities, we analyze some case studies, or parts of cases, in the classroom. To do this,we supply handouts to the students to get them thinking about the problem presentedin the case. These handouts typically take one of two forms. One type gives an abbre-viated list of investigations, and we ask the students to work in pairs to come up with aplan of attack for how to begin to address the questions on the list. After they presenttheir plan, we provide results from analyses we have prepared in advance in anticipationof their suggestions. Other times, we give students a set of charts and graphs and askthem to further summarize and interpret the output in order to answer questions fromthe investigations. Groups present their solutions on the blackboard, and we lead theclass in a discussion of their findings, including how to interpret the analyses and howto address any shortcomings.
5 Proportions, Rates, and Ratios
We introduce students to several concepts related to proportions, rates, and ratios toprovide them with the tools to address the main question of the case. This material in-cludes: the Poisson model for mortality, estimation of the mortality rate, comparison ofrates for two groups using ratios, the log transformation to symmetrize the distributionof ratios, confidence intervals for ratios, adjustment of rates for possible confoundingfactors, and the Mantel-Haenszel test statistic.
The theoretical development of these statistical concepts and methodologies areintroduced as the students begin their investigations. Yet it is still a challenge to connectthe theory taught in the classroom to the students' work with data. One approach wehave taken uses simulation to achieve this connection. That is, we teach students how
170 D.A.Nolan
to conduct Monte Carlo and bootstrap studies, and we expect them to use the computer
to explore properties of the methods they are applying to the data.
Assignment. For example, we warn our students about problems of using statisti-
cal tests with small cell counts. In analyzing the data they may consider using the
Mantel-Haenszel statistic, and as part of their investigation they may perhaps study the
robustness of this test statistic to small cell counts. Then they would include results
from their simulation studies in a technical appendix to the report.
We are continuing efforts in this area and exploring how to develop simulation
studies and interactive activities that use multimedia to explore statistical concepts and
rules of thumb for applying statistical methods to data. These efforts are described in
Buttreyβ/α/. [1].
6 Summing Up
We find it especially effective to require students to write for a real-life setting that fits
the case study. Overall, the students enjoy such concrete assignments, and we find it
helps them better focus on the problem when they have an audience, albeit imagined,
other than the instructor. For most cases, students play the role of a statistician or
scientist when writing up their results. They may be asked to write an article for a
widely read science magazine, a memo to the head of a research group, or a pamphlet
for consumers, and we often additionally require a technical appendix for their "boss"
the instructor.
Assignment. This case was inspired by an article in Nature (Darby [4]) that examined
the hemophiliac population in the UK to address the question of whether HIV causes
AIDS. We follow Darby's example, and ask our students to write a letter to the editor
of Nature to explain their findings and whether or not they corroborate those of Darby.
Assignment. Not all the cases we use in a course are assigned to the entire class.
Sometimes students work in groups on different cases, and each group leads a class
discussion on its findings, including handouts and classroom activities. The group pre-
sentations are synchronized with the curriculum and scheduled throughout the semester.
Students have leeway in designing their presentation; some lead discussions modeled
after our in-class activities, and others play the role of a research team to present their
new research, or they hold a debate where they present conflicting statistical evidence
to make their arguments. To help students prepare their presentations, we schedule
two appointments with each group, one to discuss their investigations and one to re-
view their handouts and plan the class presentation. In this type of group work, we
expect a more thorough analysis, and a more in-depth report than for the other written
assignments.
Case Studies 171
7 Developing Cases
The two most important aspects to the success of a case are the quality of the corequestion and the quality of the accompanying data. Without a compelling question, thecase does not generate interest in pursuing the analysis of the data associated with it. Inaddition, a sufficiently rich context for making the case compelling goes hand-in-handwith the quality of the question.
The data must be at just the right level of detail. Data that are too tidy and smalldon't have enough substance for students to grab on to and puzzle over. On the otherhand, vast amounts of messy data quickly overwhelm most students and eats up time.We especially like cases with data that support multiple levels of analysis. So, depend-ing on the emphasis of the course, we may go deeper into the analysis of the problem,or we may take a second pass at a problem after students have obtained more toolsfor addressing it. When we reuse a case, the students can bring to the problem theexpertise they acquired from the earlier analysis. Thus, they see that there are multi-ple approaches to tackle a problem, and we can meld techniques learned earlier in thecourse with techniques currently under study, reaffirming that a thorough analysis of acase draws from all that they have learned so far in the course.
Once we have an interesting and compelling question accompanied with good, not-too-simple data, we look for interesting statistical lessons. For example, we have ac-quired several cases that focus on linear models, where each one has its own uniquelesson. These include a simple bivariate normal regression model of a biological pop-ulation, a calibration experiment with replicate measurements, a large observationalstudy with several confounding factors, and an example of ecological regression.
7.1 Sources
Suitable cases are difficult to find and assemble. Articles in the popular press, studentjournals such as Chance, and Masters and Ph.D. theses from other fields such as biologyand public health make good starting points for hunting down a case. Often a potentialcase falls through because of problems in acquiring data. Having a connection to theowner seems the most relevant factor to obtaining data, and many of our cases grewfrom our consulting projects, projects of our colleagues, presentations we attended atmeetings of professional societies, and visitors and post Docs in our department.
At times students have collected the data themselves. We have found this approachto be most successful for teaching controlled experiments and sampling surveys wherethe design is an important part of the statistical lesson. For example, we have organizedall-class projects where the students design and carry out a survey (Gelman and Nolan[6]). We have also organized undergraduate research projects to investigate potentialcase studies.
172 D. A. Nolan
7.2 Organization
The organization of a case dove-tails with our formula for a successful case. That is, wehave found it effective to organize the case around the scientific question and presentit in five parts: introduction, data description, background material, investigations, andtheory, as sketched for the HIV example presented here. We state the main question inthe introduction, where we also provide motivation for answering it. As in our example,the question is presented in the context of the scientific problem, and not as a requestto perform a particular statistical operation. We also provide students with documen-tation for the data collected to address the question, including a detailed description ofthe study protocol. To provide a rich context for the case, students read backgroundmaterial that we have summarized from various sources and present in nontechnicallanguage that is understandable to a broad college audience.
The suggestions in the investigations part of the case are written in the context ofthe case, and the student must figure out which statistical techniques are appropriatefor accomplishing the task. We find that this approach gives them a reason to learn thestatistical theory, and further, because the applications have depth and merit it generatesan interest in learning the theoretical material.
When we first started to develop these assignments, we were disappointed withthe results. This was in part because the assignments were too prescribed. They wereone page instruction sheets with sample code, and the students followed the instructionsheets without exploring the data on their own. To remedy this problem, we replacedspecific lists of instructions for how to analyze the data with suggestions for investigat-ing the main question posed in the introduction of the case.
We have collected the study descriptions and associated materials for a dozen casestudies in Nolan and Speed [16]. Plans are to put additional cases that we and othersdevelop on the Web at h t t p : / / w w w . s t a t . b e r k e l e y . e d u / u s e r s / s t a t l a b s / .
8 Further Considerations
8.1 More on Classroom Activities
In classes with fewer than 20 students, we run the class in a seminar style where wespend time brainstorming on how to address the questions posed in the investigations.Solving these problems leads to new statistical methods, and class time then switchesover to lectures when we cover the mathematical side to these new methods. In largerclasses of up to 60 students, we rely on group work in the classroom to facilitate discus-sion and analysis. In addition, when students are working on cases outside of class, wehold regular question and answer periods in class where students raise questions thatthey have come across in their investigation of the data.
Roughly about one class period in three is spent on these types of activities. The re-mainder of time is spent in a more traditional presentation of theoretical results. (Class
Case Studies 173
meets three hours a week with the instructor and one hour a week with a teaching as-sistant). We find that when we break from the traditional lecture style to teach moreinteractively, students are better prepared to analyze data on their own.
At the beginning of the course we schedule several in-class activities, such as thosedescribed earlier, for students to meet each other and interact. These activities help theclass establish as a group, and they help students choose partners for their work outsidethe classroom. As the semester progresses we reduce the frequency of these preparedclass time activities, and rely more on student initiated discussion. In our experience,students are very willing to work in groups, but we need to be strict in limiting the sizeof the groups to ensure full participation of all members.
8.2 Help with writing
It is crucial for statisticians to have good writing skills, and writing provides an excel-lent means for helping students develop their critical thinking skills. We dedicate classtime to a discussion of how to prepare the written report. We emphasize the importanceof making clear, careful arguments, and we encourage students to revise and proofreadtheir manuscripts. Since communicating ideas through charts and graphs is a partic-ularly important skill for statisticians, we dedicate one to two lectures on this topic,where we carefully review many examples of how to display data badly (see for exam-ple, Wainer [18]). We also find the writing process to be an effective learning processwhere students piece their data analyses into a coherent story and develop arguments insupport of their thesis.
Some of our favorite writing resources are Gopen and Swan's [9] article on howto write clear scientific arguments and Tollefson's [17] booklet containing examples ofcommon grammatical errors. In addition, Davis [5] provides many good ideas on howto help students write better.
8.3 Software
We have had success in using the Splus and R software to analyze the data in thecase studies. The syntax of both R and Splus is based on the statistical language S.In addition, the R software is free, which makes it particularly attractive for students(h t tp : / / l ib . s t a t . emu.edu /R/ ) .
Bringing the computer into the theoretical course enables us to go far beyond thesmall, artificial examples found in traditional text books. To help the student withlearning the software, the teaching assistant meets students in a computer laboratoryone hour each week, where they double up at workstations to work on the assignment.The teaching assistant provides advice as needed.
We also build a Frequently Asked Questions (FAQ) web page for each assignment.The page contains sample code and answers to questions that students have asked inoffice hours, class, and section. Some of these FAQs are available at the website h t t p :/ /www.s ta t .berkeley .edu/users /s ta t labs / .
174 D. A. Nolan
8.4 Grading
To stress the importance of the case studies, the writing assignments make up 40-50%of the total course grade. We also include questions related to the cases on the courseexams, which maintains consistency with our approach to integrating theory and appli-cations. These questions typically do not require students to recall specific calculationsor minor details in background material, and we restrict topics to those cases that allthe students have seen either in class or in class-wide assignments.
It can be difficult to grade students' written work because of the freedom studentshave in analyzing the data. We generally base our grading on four aspects: compo-sition, basic analyses, graphs and tables, and advanced analyses, where each receivesequal weight. In terms of composition, the reports must be well organized, presentclear arguments, and contain correct statistical statements. The graphs and tables mustbe relevant, labeled, and understandable. For the advanced analyses, there is a lot offlexibility. We make for ourselves a list of several more complex analyses that wouldbe appropriate for addressing the problem, and we look for a subset of these in the stu-dent's write-up. We do not provide this list to the students because we want the studentto determine what is relevant to his or her argument, and we want to encourage a studentto come up with something possibly not on our list.
We provide additional feedback to the students through written comments on theirpapers. In addition, we handout a "solution" to the assignment where we cut and pastesnippets from several reports to provide multiple examples of good introductions, anal-yses, and arguments.
Finally, we place restrictions on the length of a report and on the number of chartsand graphs that may be included in it. For instance, short reports are up to two single-spaced pages with at most 4 plots and tables, and long reports are typically a maximumof four pages plus 6-8 plots and an extra two pages for a technical appendix.
9 Conclusions
With the case study approach, students gain practical experience, problem-solving skills,and the ability to apply what they learn in the theoretical course to real applications. Weview the divide between applied and theoretical statistics as unnecessary and unnatural,and think that the integration of the two through the use of case studies makes for amore compelling and complete mathematical statistics course. Essentially, the processof understanding the question, analyzing data, and summarizing findings in a reportmimics what we do as data analysts, statisticians, and scientists.
The student feedback to this approach has been quite positive. In anonymous end-of-term evaluations, students report that the cases helped them better understand statis-tical theory. According to them, they liked, "the opportunity to work with real data,"that the cases "related to real situations," and that "real data was not perfect." As onestudent said, "It is easier to understand theory after some data manipulations."
Case Studies 175
When asked to rate their level of agreement to the statement that the cases were"interesting and stimulating," 76% of 75 students from 3 classes surveyed agreed orstrongly agreed with this statement. Also, 80% of those surveyed agreed or stronglyagreed with the statement, "Without the computer, I wouldn't have understood the basicconcepts so well." In rating the overall effectiveness of the course, on a 7-point scale,the average rating from 143 students in 5 classes was 5.6. In comparison, the averagerating for upper level undergraduate statistics courses was 5.2.
However, not all responses have been favorable. We observed a positive correlationbetween their rating of the course and their comfort with the statistical software. Mostnegative reactions center around computer anxiety, and students have requested morehelp with using the software.
We have also been pleased with feedback from students after the course. Manytell us they have used their reports as writing samples for job applications, and thatinterviewers have focused a job interview on the student's analysis of a particular case.Although some of our evidence is anecdotal, the success of our efforts to incorporatecase studies in the mathematical statistics course is encouraging.
Acknowledgments
This work was partially supported by NSF grants DMS-9720490 and DUE-9950161.This article is a more comprehensive version of an article published in the ICOTS-6Proceedings, and is reprinted here with the permission of the IASE.
Deborah A. Nolan, Statistics Department, University of CaliforniayBerkeley,[email protected]
References
[1] S. Buttrey, D. Nolan, and D. Temple Lang. Computing in the mathematical statis-tics course. In Proceedings of the Joint Statistical Meetings '01, 2001.
[2] G. W. Cobb and D. S. Moore. Mathematics , statistics, and teaching. AmericanMathematical Monthly, 104:801-823, 1997.
[3] J.Cohen. The Duesberg phenomenon. Science, 266:\642-\(A9, 1994.
[4] S.C. Darby. Mortality before and after HIV infection in the complete UK popula-tion of haemophiliacs. Nature, 377:79-82, 1995.
[5] B. G. Davis. Tools for Teaching. Jossey-Bass, San Francisco, 1993.
[6] A. Gelman and D. Nolan. Teaching Statistics: A Bag of Tricks. Oxford UniversityPress, Oxford, UK, 2002.
176 D.A.Nolan
[7] J.J. Goedert. A prospective study of human immunodeficiency virus type 1 in-fection and the development of aids in subjects with hemophilia. New EnglandJournal of Medicine, 321:1141-1148, 1989.
[8] J.J. Goedert. Mortality and haemophilia. Lancet, 346:1425-1426, 1995.
[9] G.D. Gopen and J.A. Swan. The science of scientific writing. American Scientist,78:550-558, 1990.
[10] S.B. Harris. The aids heresies: A case study in skepticism taken too far. Skeptic,3:42-79, 1995.
[11] R.V. Hogg. Statistical education for engineers: an initial task force report. TheAmerican Statistician, 39:21-24, 1985.
[12] O. Kempthorne. The teaching of statistics: content versus form. The AmericanStatistician, 34:17-21, 1980.
[13] T.L. Moore and R.A. Roberts. Statistics at liberal arts colleges. The AmericanStatistician, 43:80-85, 1989.
[14] F. Mosteller. Broadening the scope of statistics and statistical education. TheAmerican Statistician, 42:93-99, 1988.
[15] D. Nolan and T.P. Speed. Teaching statistics theory through applications. TheAmerican Statistician, 53:370-375, 1999.
[16] D. Nolan and T.P. Speed. Stat Labs: Mathematical Statistics through Applica-tions. Springer-Verlag, New York, 2000.
[17] S. Tollefson. Encouraging Student Writing. University of California, Berkeley,CA, 1988.
[18] H. Wainer. How to display data badly. The American Statistician, 38:137-147,1984.
Copyright © 2022 FDOKUMEN

