![Conversion of Hyperpolarized [1-13C]Pyruvate in Breast ...](https://static.fdokumen.com/doc/165x107/6328a69be491bcb36c0bdd22/conversion-of-hyperpolarized-1-13cpyruvate-in-breast-.jpg)


Bahasa
Halaman
Hukum

� ����� ��� � ��
Cardiac Metabolism in a Pig Model of Ischemia-Reperfusion by Cardiac
Magnetic Resonance with Hyperpolarized 13C-Pyruvate
Giovanni Donato Aquaro, Francesca Frijia, Vincenzo Positano, Luca
Menichetti, Maria Filomena Santarelli, Vincenzo Lionetti, Giulio Giovannetti,
Fabio Anastasio Recchia, Luigi Landini
PII: S2214-7624(15)00008-0
DOI: doi: 10.1016/j.ijcme.2015.01.007
Reference: IJCME 63
To appear in: International Journal of Cardiology
Received date: 17 July 2014
Revised date: 8 January 2015
Accepted date: 13 January 2015
Please cite this article as: Aquaro Giovanni Donato, Frijia Francesca, Positano Vincenzo,Menichetti Luca, Santarelli Maria Filomena, Lionetti Vincenzo, Giovannetti Giulio, Rec-chia Fabio Anastasio, Landini Luigi, Cardiac Metabolism in a Pig Model of Ischemia-Reperfusion by Cardiac Magnetic Resonance with Hyperpolarized 13C-Pyruvate, Inter-national Journal of Cardiology (2015), doi: 10.1016/j.ijcme.2015.01.007
This is a PDF file of an unedited manuscript that has been accepted for publication.As a service to our customers we are providing this early version of the manuscript.The manuscript will undergo copyediting, typesetting, and review of the resulting proofbefore it is published in its final form. Please note that during the production processerrors may be discovered which could affect the content, and all legal disclaimers thatapply to the journal pertain.
AC
CEPTED
MAN
USC
RIP
T
ACCEPTED MANUSCRIPT
Cardiac Metabolism in a Pig Model of Ischemia-Reperfusion by Cardiac Magnetic Resonance
with Hyperpolarized 13C-Pyruvate.
Giovanni Donato Aquaro1, Francesca Frijia1, Vincenzo Positano1, Luca Menichetti2, Maria Filomena
Santarelli2, Vincenzo Lionetti3, Giulio Giovannetti2, Fabio Anastasio Recchia4, Luigi Landini1.
1Fondazione G. Monasterio CNR-Regione Toscana, Pisa, Italy
2 C.N.R. Institute of Clinical Physiology, Pisa, Italy
3Gruppo Intini-SMA Laboratory of Experimental Cardiology, Institute of Life Sciences, Scuola
Superiore Sant’Anna, Pisa, Italy
4 Department of Physiology, Temple University School of Medicine, Philadelphia,
Pennsylvania, USA
Short title: Myocardial metabolism by 13C-MRI Address for correspondence: Giovanni Donato Aquaro, MD
1Fondazione G. Monasterio CNR-Regione Toscana Via G.Moruzzi, 1, 56124, Pisa, Italy Phone: 0039 - 050 – 315 2818 Fax 0039 – 050 – 315 2166 E-mail: [email protected] Total word count: 3999
AC
CEPTED
MAN
USC
RIP
T
ACCEPTED MANUSCRIPT
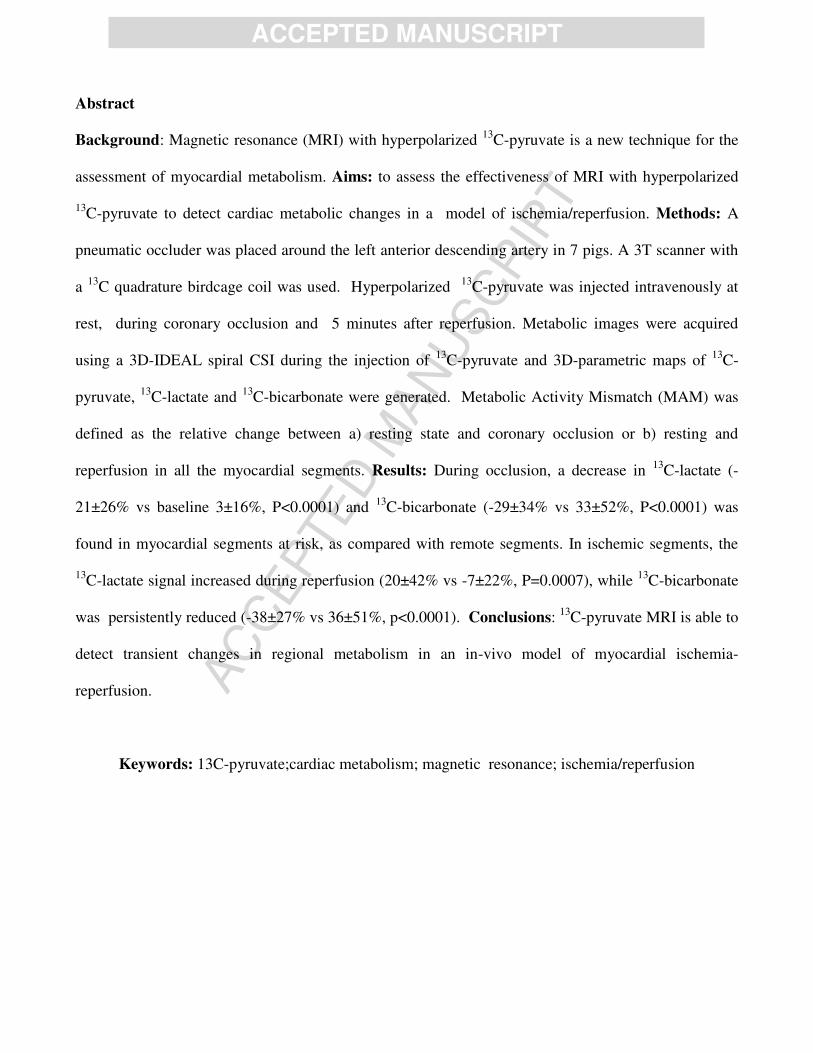
Abstract
Background: Magnetic resonance (MRI) with hyperpolarized 13C-pyruvate is a new technique for the
assessment of myocardial metabolism. Aims: to assess the effectiveness of MRI with hyperpolarized
13C-pyruvate to detect cardiac metabolic changes in a model of ischemia/reperfusion. Methods: A
pneumatic occluder was placed around the left anterior descending artery in 7 pigs. A 3T scanner with
a 13C quadrature birdcage coil was used. Hyperpolarized 13C-pyruvate was injected intravenously at
rest, during coronary occlusion and 5 minutes after reperfusion. Metabolic images were acquired
using a 3D-IDEAL spiral CSI during the injection of 13C-pyruvate and 3D-parametric maps of 13C-
pyruvate, 13C-lactate and 13C-bicarbonate were generated. Metabolic Activity Mismatch (MAM) was
defined as the relative change between a) resting state and coronary occlusion or b) resting and
reperfusion in all the myocardial segments. Results: During occlusion, a decrease in 13C-lactate (-
21±26% vs baseline 3±16%, P<0.0001) and 13C-bicarbonate (-29±34% vs 33±52%, P<0.0001) was
found in myocardial segments at risk, as compared with remote segments. In ischemic segments, the
13C-lactate signal increased during reperfusion (20±42% vs -7±22%, P=0.0007), while 13C-bicarbonate
was persistently reduced (-38±27% vs 36±51%, p<0.0001). Conclusions: 13C-pyruvate MRI is able to
detect transient changes in regional metabolism in an in-vivo model of myocardial ischemia-
reperfusion.
Keywords: 13C-pyruvate;cardiac metabolism; magnetic resonance; ischemia/reperfusion
AC
CEPTED
MAN
USC
RIP
T
ACCEPTED MANUSCRIPT
Background:
Magnetic Resonance (MRI) with hyperpolarized 13C-labeled tracers is an emerging imaging
technique for the evaluation of coronary artery anatomy, quantification of myocardial perfusion and a
direct assessment of myocardial viability (1). In particular, MRI with hyperpolarized 13C-pyruvate
has allowed, for the first time, to evaluate cardiac metabolism in real time and in vivo (2-
AC
CEPTED
MAN
USC
RIP
T
ACCEPTED MANUSCRIPT
4). Relative changes of pyruvate and of its metabolites lactate, alanine and bicarbonate can be
monitored under normal conditions, during either acute ischemia or reperfusion, following short- or
long-lasting coronary occlusion (5). Differently from PET where FDG is not metabolized by myocites,
the main advantage of hyperpolarized 13C-pyruvate MRI is that the metabolic fate of 13C-pyruvate
and its metabolites is directly assessed. A recent study using hyperpolarized 13C-pyruvate showed
increased levels of 13C-lactate after 10 minutes of global ischemia in isolated hearts (6). Golman and
colleagues combined conventional MRI scan and H13C by a single short-axis slice of chemical shift
images (CSI) in a pig model of ischemia-reperfusion, demonstrating decreased 13C-bicarbonate
production in stunned viable myocardial segments, after 15-minute coronary occlusion, and decreased
13C-bicarbonate and 13C-alanine production after 45-minute occlusion (7). Recently, Lau and
colleagues proposed a three-dimensional multislice cardiac-gated spiral 13C imaging approach,
permitting whole-heart coverage (8). A novel fast three-dimensional acquisition (3D IDEAL, Iterative
DEcomposition of water and fat with Echo Asymmetric and Least-squares estimation, spiral CSI pulse
sequene) was then implemented in a rat model, allowing a higher spatial resolution, over the whole
heart, of the spectral representation of single metabolites, separately acquired (9,10).
The objective of this study was to evaluate the capability and accuracy of MRI with hyperpolarized [1-
13C] –pyruvate using the fast three-dimensional pulse sequence to detect the presence and the regional
distribution of transient cardiac metabolic changes in a pig model of ischemia/reperfusion.
The objective of this study was to evaluate the capability and the accuracy of MRI with hyperpolarized
[1-13C] –pyruvate using a 3D-IDEAL Spiral CSI pulse sequence to detect the presence and the
regional distribution of metabolic changes in a pig model of acute ischemia and ischemia/reperfusion.
METHODS

AC
CEPTED
MAN
USC
RIP
T
ACCEPTED MANUSCRIPT
Pig instrumentation
Seven male pigs (38±3kg), fasted overnight, were sedated with a cocktail of tiletamine hydrochloride
and zolazepam hydrochloride (8mg · kg-1 i.m.) and premedicated with atropine sulfate (0.1 mg · kg-1
i.m.). General anesthesia was subsequently induced with propofol (2-4 mg · kg-1 i.v.) and maintained
with 1–2% isoflurane in 50% air and 50% oxygen. Ventilation was adjusted based on arterial blood gas
values. U sterile conditions and a 3 mm diameter pneumatic coronary occluder (Kent Scientific
Corporation Torrington, Connecticut - USA) was placed around the left anterior descending coronary
artery below the second diagonal branch through a direct thoracotomy at the fifth intercostal space.
After this procedure, the pigs were allowed to fully recover for 10 days. Animal instrumentation and
experimental protocol were approved by the Animal Care Committee of the Italian Ministry of Health
and was in accordance with the Italian law (DL-116, Jan. 27, 1992), which is in compliance with the
National Institutes of Health publication Guide for the Care and Use of Laboratory Animals.
MRI scanning
MRI was performed after post-surgical recovery. The pigs were sedated with continuous infusion of
propofol (2-4 mg · kg-1 · h-1 i.v.) and studied in spontaneous respiration. They were placed in the MRI
scanner laying on the right side. The hyperpolarized [1-13C]pyruvate dose (0.13 mmol/kg dissolved in
20 mL of buffer solution) was administered over 10 seconds by manual injection into the right ear vein.
Injections were performed at rest, during 2 minutes of full coronary occlusion and after 5 minutes of
reperfusion following 10 minutes of occlusion.
Coronary occlusion was performed by injecting 2 ml of saline solution in the pneumatic occluder.
Arterial O2 saturation, cardiac electric activity and blood pressure were continuously monitored during
the experiment.

AC
CEPTED
MAN
USC
RIP
T
ACCEPTED MANUSCRIPT
At the end of the MRI protocol the pigs were sacrificed by injecting 20 ml of KCl saturated solution
after anaesthesia induced by 20 ml propofol. In four animals, the chest was reopened ,the coronary
occluder was inflated, the ascending aorta was clamped and 10 ml of 1% methylene blue was injected
into the coronary tree through the aortic wall, as previously described (11). Then the heart was excised,
and 10 mm thick slices were cut and photographed. A qualitative and quantitative assessment of the
area at risk was performed and segments were classified as normal or at risk (Figure 1).
Hyperpolarization and Images Acquisition
[1-13C]pyruvate polarization was performed using Dynamic Nuclear Polarization (Hypersense, Oxford
Instruments, Oxford, UK) (11). The injection solution contained 230 mM of sodium [1-13C]pyruvate,
100 mM TRIS buffer, 0.27 mM Na 2EDTA and 20 microM Gd3+-complex (Dotarem – Guerbet –
France). The temperature of solution was approximately 37ºC and the pH ≈ 7.6. In order to achieve the
optimal timing to lead the pyruvate conversion on its metabolites, i.e. lactate, alanine and bicarbonate,
MRI acquisition started 20 s after the end of the bolus injection (4).
Image acquisition was done in a 3-T GE Excite HDxt (GE Healthcare, Waukesha, WI, USA) clinical
scanner, using a 13C quadrature birdcage coil (Rapid Biomedical, Würzburg, Germany) in low-pass
version (radius, 18.2 cm; length, 36 cm; 12 legs). The image acquisition protocol included acquisition
of anatomical reference images and CSI. Anatomical images were acquired with the scanner body coil
and a 2D TOF FSPGR sequence, ECG triggered, was used with TR=16.6 ms, TE 2.7 ms, FOV=30x30
cm, matrix 288x192. Twenty axial slices were acquired with a slice thickness of 5 mm (no spacing) to
cover the entire heart. Metabolic information covering the heart were obtained using a 3D IDEAL
spiral CSI prescribed on the same region imaged by the reference anatomical sequence. The IDEAL
spiral CSI is based on single-shot spiral image encoding and echo-time shifting between excitations for

AC
CEPTED
MAN
USC
RIP
T
ACCEPTED MANUSCRIPT
the CSI encoding. 3D IDEAL spiral sequence was implemented in axial plane (FOV= 30x30 cm2, slab
thickness=100 mm, 11 constant echo time shift of TE=0.9ms, FA=7°, 14 phase encoding steps along
the z-direction) with a resolution of 15mm. The acquisition time for the 3D-IDEAL spiral was of 17 s
and the sequence started 20 s after the beginning of the injection (4). In addition, an FID spectrum is
also acquired, and the obtained CSI prior knowledge is effectively utilized in the reconstruction, where
it allows mapping of the full spectrum rather than a limited number of peaks at certain prescribed
frequencies (12).
The data were reconstructed using spectrally-preconditioned, minimum-norm CSI inversion followed
by gridding reconstruction implemented in Matlab (The Mathworks, Inc., Natick, MA).
Images Analysis
Short axis (SA) views of left ventricle (LV) were reconstructed from axial anatomical images by using
Gate tool of PMOD software (PMOD Technologies Ltd., Zurich, Switzerland). Briefly, the geometrical
transformation used to extract SA views was recorded and applied to metabolic images that were
reconstructed with the same orientation and resolution of anatomical SA images. Hence, 20 SA slices
were involved in the image analysis process. Both anatomical and metabolic SA views were stored in
DICOM format. Figure 2 shows a typical example of corresponding anatomical and metabolic SA
views extracted as previously described.
Quantitative analysis was performed on SA views by a custom software tool (HIPPO C13) developed
in IDL 8.0 (Exelis Visual Information Solutions, Boulder, CO, USA). Myocardial contours were
manually defined in anatomical SA views covering the entire LV (Figure 2). A reference point
corresponding to superior insertion of right and left ventricle wall was also defined. Slices were
classified as basal, middle, or apical by the operator. Starting from the reference point, myocardium
was divided in 120 micro sectors, and the metabolite signal in each micro sector was evaluated. Finally,
AC
CEPTED
MAN
USC
RIP
T
ACCEPTED MANUSCRIPT
a polar map was constructed by reporting the signal value in a “bull's eye” representation (Figure 3).
The polar map values were averaged among six (basal and medium slices) or four (apical slices)
equiangular segments, and the values of metabolites concentration in corresponding segment of basal,
middle, and apical slices were averaged as well leading to a 16-segments model of metabolite
distribution, following the AHA guidelines (13).
To semi-quantitatively analyse the segmental distribution of metabolites signal over the LV wall, the
segmental variation map was defined as ΔSi = 100*(Si-Sg)/Sg, where Si (i=1,...16) is the relative
metabolite signal in the segment i and Sg is the mean relative metabolite signal over the entire LV. To
assess the differences among different conditions (i.e. basal, occlusion, reperfusion), the Metabolic
Activity Mismatch (MAM) between two segmental variation maps was defined as MAM = 100(Sai-
Sbi)/(Sai+Sbi)/2, where Sai and Sbi are the relative values of the signal of metabolite in the segment “i” in
condition “a” and “b”.
Hemodynamic study
Five additional male pigs (38±3 kg) were chronically instrumented as previously described (14).
Briefly, a Doppler flow transducer (Craig Hartley) was placed around the left anterior descending
coronary artery distally to the flow probe, the pneumatic vascular occluder was placed below the
second diagonal branch of the LAD. Coronary blood flow was measured with a pulsed Doppler
flowmeter (Model 100, Triton Technology). Arterial pressure was measured via a fluid filled catheter,
while LV pressure, dP/dtmax and dP/dtmin were measured using a solid state pressure gauge (Millar
Instruments Inc, Houston TX, USA) inserted percutaneously through the femoral artery and advanced
into the LV cavity under fluoroscopic guidance (15). The analogic signals were recorded through an
analogic-digital interface (National Instruments), at a sampling rate of 250 Hz (16). At ten days

AC
CEPTED
MAN
USC
RIP
T
ACCEPTED MANUSCRIPT
following thoracic surgery, the hemodynamic parameters were measured during pyruvate injections at
rest, during coronary occlusion and at 10’ of coronary reperfusion after the second LAD occlusion. The
animals were then sacrificed as described above
Statistical Analysis
All data were analysed using MedCalc software (v 12.1, MedCalc Software, Mariakerke, Belgium).
The Kolmogorov-Smirnov test was employed to assess normality of data distribution and for the residuals of
regression models. Data are presented as mean ± standard error of the mean (SEM), median and interquartile
range (IQR) and as proportions with percentage, as indicated. One-way repeated measures analysis of
variance (ANOVA) was used to evaluate whether there was a significant divergence between different
measurements. Bonferroni correction for multiple comparison was applied. Paired Student’s t-tests
were performed to detect significant differences between groups. In all tests, a two-tailed p < 0.05 was
considered statistically significant.
RESULTS
Coronary occlusion
Average MAM of lactate and bicarbonate at baseline and during occlusion is shown in Figure 4.
ANOVA analysis revealed a significant dependence of MAM from segmental location in both lactate
(P<0.001) and bicarbonate (P<0.001). As shown by the figure, the lactate distribution, the average of

AC
CEPTED
MAN
USC
RIP
T
ACCEPTED MANUSCRIPT
metabolic change and the value of MAM detected in the ischemic segments (middle anteroseptal and
anterior wall and the apical septum) were significantly different from of the remote regions (inferior
and inferolateral segments). As regards bicarbonate distribution ischemic segments were significantly
different from the remote segments.
This segmental localization of metabolic changes matched the regional distribution of myocardial
segments involved in the ischemic process as evidenced by the histologic evaluation with methylene
blue (figure 1).
Reperfusion after ten minutes occlusion
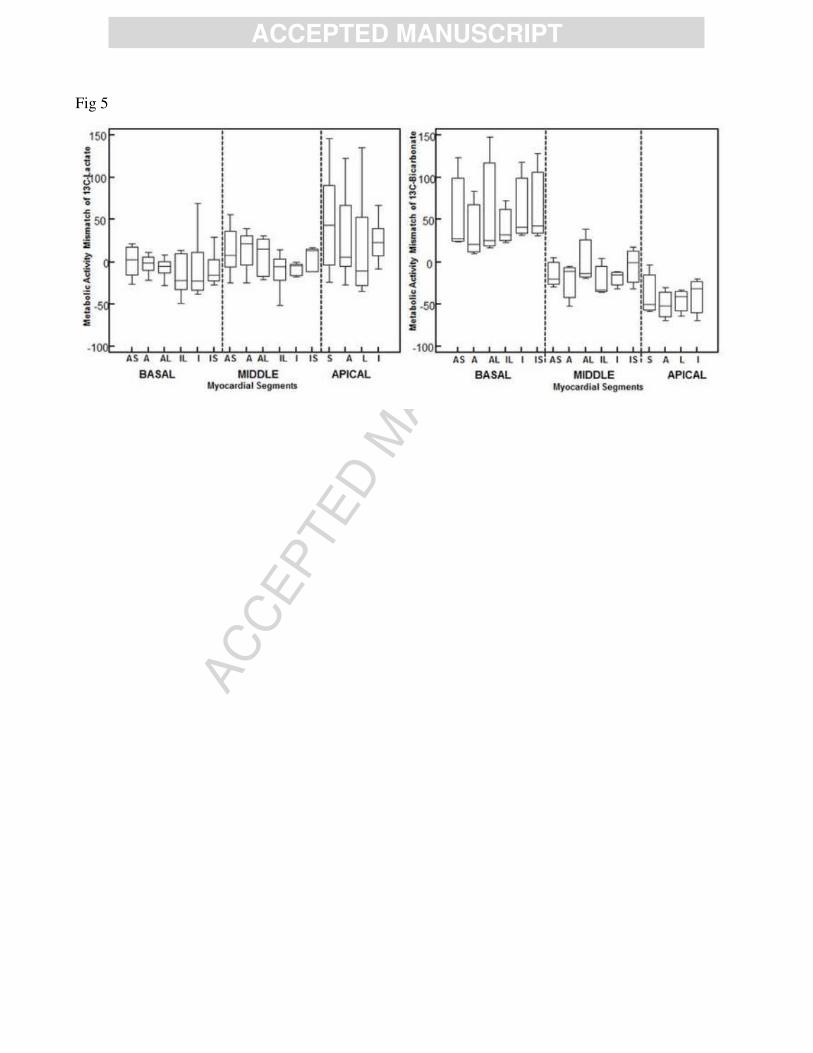
Average MAM from all experiments in segmental distribution of lactate and bicarbonate in either basal
or reperfusion condition is shown in Figure 5. ANOVA analysis revealed significant inhomogeneity of
MAM segmental distribution of bicarbonate (P<0.001). No significant difference among segments was
found in lactate distribution among segments (P=0.302). As regards bicarbonate distribution ischemic
segments were significantly different from the remote.
Hemodynamics
Heart rate and ECG were not significantly affected by the pyruvate injections: as shown in Table 1, the
hemodynamic parameters were unchanged during the pyruvate injection as compared to the
corresponding value at each experimental condition (resting, occlusion and reperfusion ) before the
pyruvate bolus injection.

AC
CEPTED
MAN
USC
RIP
T
ACCEPTED MANUSCRIPT
Area at risk and metabolic changes
Myocardial regions of LV were divided in the two clusters represented by segments involved by
ischemic process at anatomical analysis and remote segments metabolic activity. During occlusion,
lactate distribution demonstrated a significant lower MAM in ischemic segments than remote
segments (-21±6 vs 3±5, P<0.001). Bicarbonate metabolic activity was lower in ischemic than remote
segments (-29±7 vs 33±6, P<0.0001).
Following reperfusion, a significant increase in lactate signal (20±10 vs -7±5, P= 0.007) and a
significant decrease of bicarbonate signal (-38±12 vs 36±11, P<0.0001) was detected in segments
affected by occlusion than in remote segments.
The average extent of region metabolic mismatch during occlusion was 12±5 % of LV mass. The
extent of area at risk evaluated by methylene blue was 14±7 % of LV mass. The mean difference of
extent between the area at risk assessed by methylene blue and by hyperpolarized [1-13C] –pyruvate
was 5±2%.
Inter-study reproducibility
The injection of hyperpolarized [1-13C] –pyruvate was repeated during LAD occlusion in 4 pigs. The
average variation of the extent of area at risk in the same pigs, measured in different days was 6±2% of
LV mass. During reperfusion, we obtained an average variation of 13-lactate extent of 10±4%. This
greater difference may be attribuited to the changes in haemodynamic parameters in ischemic
conditions in different days.
DISCUSSION
The present study shows that MRI with hyperpolarized [1-13C] –pyruvate using a 3D-IDEAL Spiral
CSI pulse sequences can provide an accurate evaluation of pyruvate, lactate and bicarbonate
AC
CEPTED
MAN
USC
RIP
T
ACCEPTED MANUSCRIPT
distribution in either normoperfused or ischemic myocardium, in an animal model mirroring a
clinically relevant condition.
In the healthy heart, 60% to 90% energy production is achieved from beta-oxidation of fatty acids,
while mainly from pyruvate oxidation for the remainder (17). Pyruvate is a central metabolic substrate
linking glycolysis to the Krebs cycle, and leading to energy production, as well as to production of
lactate and CO2 , partly converted in bicarbonate. Pyruvate derives from cytosolic glycolysis and
lactate oxidation and, in the normoperfused heart, is mostly oxidized in the Krebs cycle, to form CO2,
and partly either reduced back to lactate or converted into alanine (18).
Magnetic resonance with hyperpolarized 13C-pyruvate allows in-vivo evaluation of relative changes of
pyruvate metabolites as lactate, bicarbonate and alanine (3). Metabolic evaluation may be clinically
relevant in ischemic heart disease, as well as in cardiomyopathy.
However, the objective of the current study was to test the sensitivity of the employed methodology in
detecting areas of ischemia during coronary occlusion and eventually the subsequent restoration of
metabolism during the reperfusion phase. The main finding is the demonstration that spatial resolution
obtained using a 3D-IDEAL Spiral CSI pulse sequence was high enough to provide three-dimensional
information of acute changes of pyruvate and metabolites in left ventricular myocardium using the
conventional on a regional segmentation. Moreover, a good concordance of regional distribution
between areas at risk evidenced with methylene blue at histology and the regions with metabolic
changes at MRI was found.
During acute coronary occlusion no signal related to pyruvate metabolites was detected in the involved
myocardial segments. This was expected, as in such condition the 13C-labeled substrate could not
reach the myocardial area at risk because the absence of perfusion prevents the arrival of exogenous
pyruvate to the myocardium and, obviously, metabolism of endogenous pyruvate was not evaluable by
the present approach.

AC
CEPTED
MAN
USC
RIP
T
ACCEPTED MANUSCRIPT
Myocardial uptake of [1-13C] –pyruvate occurs during the reperfusion phase and changes in
metabolites may be detected. In fact, lactate production was slightly increased during reperfusion ,
while the bicarbonate production was significantly reduced within the area at risk. Based on these
results we might speculate that, after 5 minutes of reperfusion following 10 minutes of occlusion, the
oxidative metabolism was still impaired, showing typical alterations associated with acute ischemia.
MRI with hyperpolarized 13-C technique does not permit a quantitative assessment of metabolites
concentration, but only the appreciation of relative changes of pyruvate and its metabolites. In the
current study, we evaluated the signal of each myocardial segment in the reconstructed metabolic maps
as the difference between the signal of the each segment and the average signal of the entire
myocardium, expressed as percentage of the average signal of the entire myocardium. Therefore, the
MAM index was used to evaluate the variations of metabolite signal of the same myocardial segment in
different conditions (either coronary occlusion or reperfusion versus baseline).
On the technical point of view, in the current study we used the IDEAL spiral CSI method which is
different from previously presented approaches. In the study by Golman a single slice 13C chemical
shift images in a single short-axis view midway through the long axis of the left ventricle with a slice
thickness of 20 mm, and a two-dimensional pixel size of 7.5 x 7.5 mm was used (7). Lau et al already
described a multislice cardiac-gated spiral 13C imaging pulse sequence consisting of a large permitting
whole-heart coverage (8). However, differently from the above mentioned technique, in the IDEAL
spiral CSI method the spectra are not just assumed to be sparse but that the spectral sparsity is used as
prior knowledge and then effectively utilized in the reconstruction process, where it allows mapping of
the full spectrum rather than a limited number of peaks at certain prescribed frequencies (10). Thus, the
IDEAL spiral CSI pulse sequence permits to get the complete 3D-dataset of information, with optimal
signal to noise ratio and with short acquisition time (17 seconds), for each metabolites simultaneously.
This might be potentially relevant for the application of hyperpolarized [1-13C]-pyruvate in human

AC
CEPTED
MAN
USC
RIP
T
ACCEPTED MANUSCRIPT
allowing complete acquisition during one breath-hold and then permitting to minimize the artifact from
respiratory motion.
Recently Schroeder and colleagues evaluate myocardial metabolism with hyperpolarized [1-13C]-
pyruvate in a pig model of pacing induced heart failure using a surface phased array coil (19). Surface
coil allows increase of signal from the cardiac structure next to the coil but produces signal decrease of
the distant region as the inferior myocardial segments of LV. In the current study we performed
hyperpolarized [1-13C]-pyruvate acquisition using a volumetric bird-cage coil which allowed a more
homogeneous signal in all the myocardial sections.
Large dose injection of pyruvate could have a pharmacodynamic effects that should be considered
(20). In this study, heart rate and ECG were not significantly affected by the pyruvate injections (see
table 1). The same findings have been reported by Goldman et al. (9) with a dose of 300mM of
pyruvate. Moreover, a study by Atherton et al (3) provided the evidence that even after an elevated
plasma peak of pyruvate no significant alteration in the concentration of glucose, insulin, lactate, -
idroxybutyrate, triacylglyceride and non esterified fatty acids were detected during the MRS time frame
experiments. Moreover, we analyzed in a previous study (4) the cardiac spectroscopic signal after the
infusion of 230mM of hyperpolarized pyruvate at rest and during inotropic stress. We have shown that
the cardiac work increased the signal of lactate and bicarbonate, leading to a two-fold increase in the
apparent enzymatic kinetic constants in non-steady state conditions. This finding parallels with a two-
fold increase in the rate-pressure product stress versus rest, an indirect parameter of cardiac oxygen
consumption during inotropic stress, and could partially exclude enzyme saturation effects.
Some limitations of this study should be mentioned: pulse sequence used to acquire images was not
ECG-triggered. This approach might have caused motion artifacts and conditioned the spatial
resolution; however, the signal was acquired throughout the whole cardiac cycle to increase the SNR,
also considering the fast signal decay which is intrinsic to the use of hyperpolarized substrates. In fact,
AC
CEPTED
MAN
USC
RIP
T
ACCEPTED MANUSCRIPT
the signal of magnetization undergo an exponential decay with typical time constants (T1, spin lattice
relaxation time) of about 60 seconds.
For these reasons, at present, we were forced to use the whole allowed time to get enough signal from
the myocardium.
Another limitation was that only changes in bicarbonate and lactate were assessed, while alanine
changes were not systematically detected. In fact, the alanine signal resulted rather low and in some
segments was not detectable, due to a low signal to noise ratio. This limitation was the consequence of
evaluation of cardiac metabolism using a whole-heart three dimensional approach and using a birdcage
volumetric coil.
Further studies are needed to verify if these limitations can be overcome, using a surface coil to
improve the SNR, as well as an accurate ECG triggering might allow a better identification of regional
metabolic changes.
Conclusions
This study shows that a three-dimensional evaluation of cardiac metabolism with 13C hyperpolarized
pyruvate is feasible in a large size animal model of ischemia and reperfusion. A good topographic
correlation on segmental basis was found between spectroscopic imaging maps and gross anatomical
analysis. The Food and Drug Administration recently approved the use of hyperpolarized 13C-
pyruvate for clinical studies of prostate cancer. Previous studies and the present one point to the
possibility that, in the near future, H13C-tracing may be used as a powerful diagnostic tool in the
cardiovascular field .
Aknowlegement:

AC
CEPTED
MAN
USC
RIP
T
ACCEPTED MANUSCRIPT
None.
Conflict of Interest:
None.
Bibliography
1) Månsson S, Johansson E,Magnusson P, Chai CM, Hansson G, Petersson JS,Ståhlberg F, Golman
K.13C imaging—a new diagnostic platform. Eur Radiol 2006;16:57–67
2) Schroeder M, Cochlin L, Heather L, Clarke K, Radda G, Tyler D. In vivo assessment of pyruvate
dehydrogenase flux in the heart using hyperpolarized carbon-13 magnetic resonance. Proc Natl Acad
Sci U S A. 2008;105:12051–12056.
3) Atherton HJ, Schroeder MA, Dodd MS, Heather L, Carter E, Cochlin LE, Nagel S, Sibson N, Radda
GK, Clarke KC, Tyler DJ. Validation of the in vivo assessment of pyruvate dehydrogenase activity
using hyperpolarised 13C-magnetic resonance spectroscopy. NMR Biomed. 2011;24:201–208.
4) Menichetti L, Frijia F, Flori A, Wiesinger F, Lionetti V, Giovannetti G, Aquaro GD, Recchia FA,
Ardenkjaer-Larsen JH, Santarelli MF, Lombardi M. Assessment of real-time myocardial uptake and
AC
CEPTED
MAN
USC
RIP
T
ACCEPTED MANUSCRIPT
enzymatic conversion of hyperpolarized [1-13C]pyruvate in pigs using slice selective magnetic
resonance spectroscopy, Contrast Media & Molecular Imaging. 2012;7:85:94
5) Schroeder MA, Clarke K, Neubauer S, Tyler DJ, Hyperpolarized Magnetic Resonance : A Novel
Technique for the In Vivo Assessment of Cardiovascular Disease Circulation 2011, 124:1580-1594
6) Schroeder MA, Atherton HJ, Ball D, Heather LC, Cole M, Griffin J, Clarke K, Radda GK, Tyler DJ.
Real time assessment of Krebs cycle metabolism using hyperpolarized 13C magnetic resonance
spectroscopy. FASEB J. 2009;23:2529 –2538.
7) Golman K, Petersson JS, Magnusson P, Johansson E, Akeson P, Chai CM, Hansson G, Mansson S.
Cardiac metabolism measured noninvasively by hyperpolarized 13C MRI. Magn Reson Med. 2008;59:
1005–1013.
8) Lau AZ, Chen AP, Ghugre NR, Ramanan V, Lam WW, Connelly KA, Wright GA, Cunningham
CH. Rapid multislice imaging of hyperpolarized (13)C pyruvate and bicarbonate in the heart. Magn
Reson Med.2010;64:1323–1331.
9) Reeder SB, Pineda AR, Wen Z, Shimakawa A, Yu H, Brittain JH, Gold GE, Beaulieu CH, Pelc
NJ.Iterative decomposition of water and fat with echo asymmetry and least-squares estimation
(IDEAL): application with fast spin-echo imaging.Magn Reson Med. 2005;54:636-44
10) Wiesinger F, Weidl E, Menzel MI, Janich MA, Khegai O, Glaser SJ, Haase A, Schwaiger M,
Schulte RF. IDEAL spiral CSI for dynamic metabolic MR imaging of hyperpolarized [1-(13)
C]pyruvate. Magn Reson Med. 2011:[Epub ahead of print] DOI: 10.1002/mrm.23212
11)Martorana PA, Göbel H, Kettenbach B, Nitz RE. Comparison of various methods for assessing
infarct-size in the dog. Basic Res Cardiol. 1982;77:301-308
12) J.H. Ardenkjaer-Larsen, B. Fridlund, A. Gram, G. Hansson, L. Hansson, M.H. Lerche, R. Servin,
M. Thaning, K. Golman, “Increase in signal-tonoise ratio of >10,000 times in liquidstate NMR”, Proc.
Natl. Acad. Sci. U. S. A. 2003:100:10158-10163
AC
CEPTED
MAN
USC
RIP
T
ACCEPTED MANUSCRIPT
13) Cerqueira MD, Weissman NJ, Dilsizian V, Jacobs AK, Kaul S, Laskey WK, Pennell DJ,
Rumberger JA, Ryan T, Verani MS; American Heart Association Writing Group on Myocardial
Segmentation and Registration for Cardiac Imaging.. Standardized myocardial segmentation and
nomenclature for tomographic imaging of the heart: a statement for healthcare professionals from the
Cardiac Imaging Committee of the Council on Clinical Cardiology of the American Heart
Association.Circulation. 2002;105:539-542.
14)Jageneau AH, Schaper WK, Van Gerven W. Enhancement of coronary reactive hyperemia in
unanesthetized pigs by an adenosine-potentiator (Lidoflazine). Naunyn Schmiedebergs Arch
Pharmakol. 1969;265(1):16-23
15)Simioniuc A, Campan M, Lionetti V, Marinelli M, Aquaro GD, Cavallini C, Valente S, Di Silvestre
D, Cantoni S, Bernini F, Simi C, Pardini S, Mauri P, Neglia D, Ventura C, Pasquinelli G, Recchia
FA.Placental stem cells pre-treated with a hyaluronan mixed ester of butyric and retinoic acid to cure
infarcted pig hearts: a multimodal study.Cardiovasc Res. 2011;90:546-556.
16)Lionetti V, Guiducci L, Simioniuc A, Aquaro GD, Simi C, De Marchi D, Burchielli S, Pratali L,
Piacenti M, Lombardi M, Salvadori P, Pingitore A, Neglia D, Recchia FA. Mismatch between uniform
increase in cardiac glucose uptake and regional contractile dysfunction in pacing-induced heart failure.
Am J Physiol Heart Circ Physiol. 2007;293:H2747-2756
17) Stanley WC, Recchia FA, Lopaschuk GD. Myocardial substrate metabolism in the normal and
failing heart. Physiol Rev. 2005;85:1093–1129.
18) Randle PJ. Fuel selection in animals. Biochem Soc Trans. 1986;14:799–806.
19) Schroeder MA, Lau AZ, Chen AP, Gu Y, Nagendran J, Barry J, Hu X, Dyck JR, Tyler DJ, Clarke
K, Connelly KA, Wright GA, Cunningham CH.Hyperpolarized (13)C magnetic resonance reveals
early- and late-onset changes to in vivo pyruvate metabolism in the failing heart.Eur J Heart Fail.
2013;15:130-140
AC
CEPTED
MAN
USC
RIP
T
ACCEPTED MANUSCRIPT
20) Moreno KC, Sabelhaus SM, Merritt ME,AD Sherry,Malloy CR. Competition of pyruvate with
physiological substrates for oxidation by the heart: implications for studies with hyperpolarized [1-
13C]pyruvate. Am J Physiol Heart Circ Physiol. 2010;298:H1556–H1564
Figure legends:
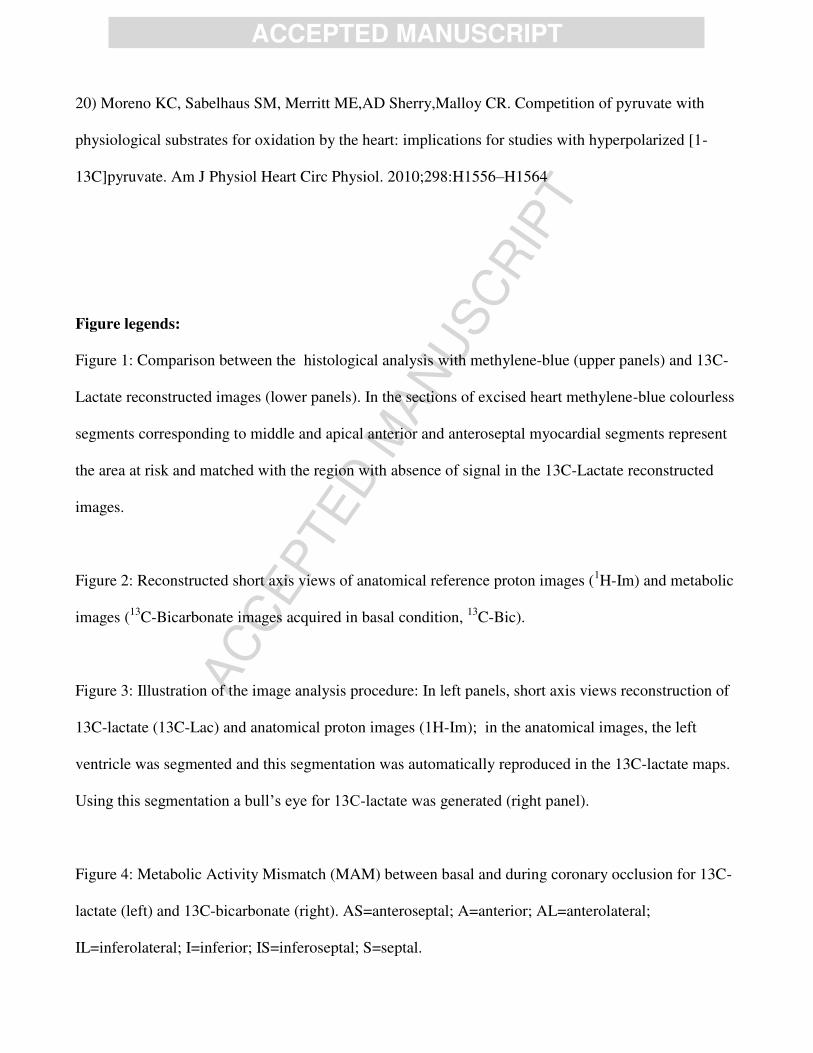
Figure 1: Comparison between the histological analysis with methylene-blue (upper panels) and 13C-
Lactate reconstructed images (lower panels). In the sections of excised heart methylene-blue colourless
segments corresponding to middle and apical anterior and anteroseptal myocardial segments represent
the area at risk and matched with the region with absence of signal in the 13C-Lactate reconstructed
images.
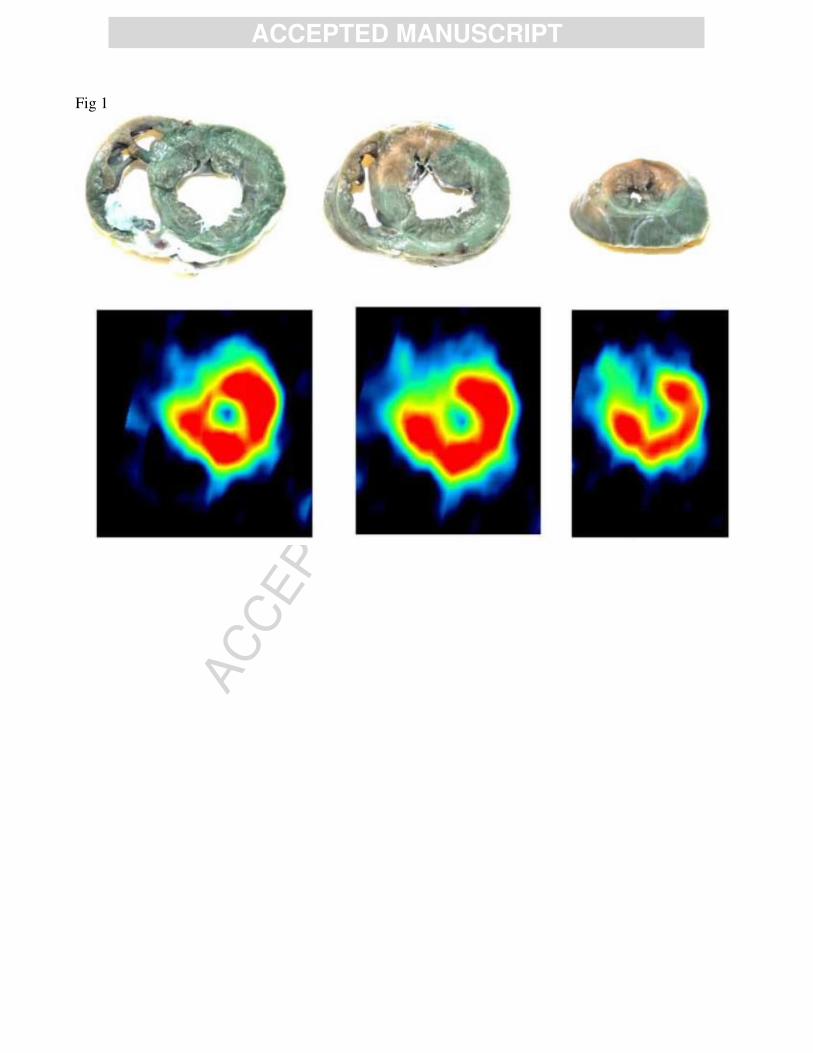
Figure 2: Reconstructed short axis views of anatomical reference proton images (1H-Im) and metabolic
images (13C-Bicarbonate images acquired in basal condition, 13C-Bic).
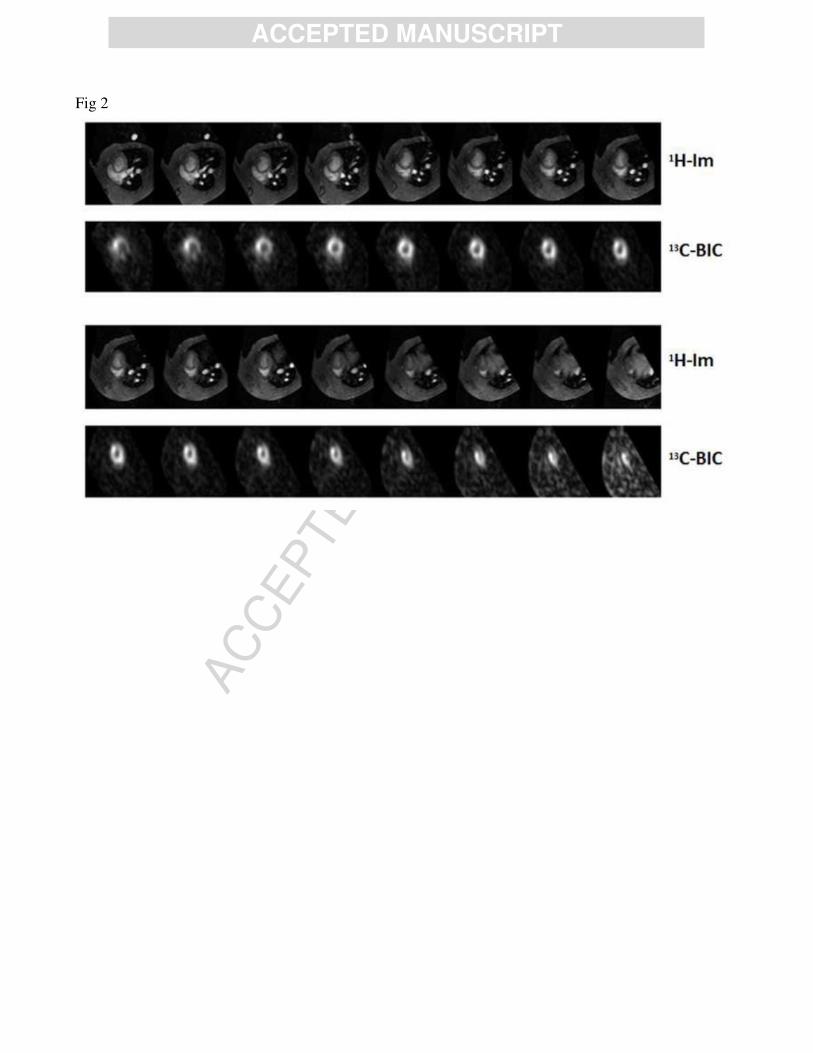
Figure 3: Illustration of the image analysis procedure: In left panels, short axis views reconstruction of
13C-lactate (13C-Lac) and anatomical proton images (1H-Im); in the anatomical images, the left
ventricle was segmented and this segmentation was automatically reproduced in the 13C-lactate maps.
Using this segmentation a bull’s eye for 13C-lactate was generated (right panel).
Figure 4: Metabolic Activity Mismatch (MAM) between basal and during coronary occlusion for 13C-
lactate (left) and 13C-bicarbonate (right). AS=anteroseptal; A=anterior; AL=anterolateral;
IL=inferolateral; I=inferior; IS=inferoseptal; S=septal.

AC
CEPTED
MAN
USC
RIP
T
ACCEPTED MANUSCRIPT
Figure 5: Metabolic Activity Mismatch (MAM) between basal condition and after reperfusion for 13C-
lactate (left) and 13C-bicarbonate (right). AS=anteroseptal; A=anterior; AL=anterolateral;
IL=inferolateral; I=inferior; IS=inferoseptal; S=septal.
Table 1: Haemodynamic parameters
REST REST OCCLUSION OCCLUSION REPERFUSION REPERFUSION
Pyruvate Pyruvate Pyruvate
CBF ml/min 30±3.66 27±3.62 6.1±0.55* 10.2±3* 25.4±2.2 24.3±2.53
CSF nl/beat 0.29±0.04 0.29±0.05 0.07±0.006* 0.09±0.01* 0.29±0.04 0.28±0.02
HeartRate, bpm 100±8.24 96.4±9.8 75.9±7.59* 72.3±7.3* 93.6±18.5 95.4±15.2
SAP, mmHg 118.17±6.08 113.4±7.99 102.2±13.5 100.5±15.4 124.7±35.3 122.4±30.2
DAP, mmHg 86.17±4.4 85.7±4.62 69.2±11.5* 66.3±12.4* 86.5±25.1 83±22.5
MAP, mmHg 104.6±5.16 103.2±5.86 86±12.4* 77.7±11.5* 105.5±29.2 98.5±25.4
LVESP, mmHg 117.7±6.16 112.87±8.1
3 100±14 101±12 122±34.6 120±33.4
LVEDP, mmHg 1.43±0.57 1.95±0.73 1.55±0.5 2.05±0.8 5±3 6.2±2.8
LVdP/dtmax, mmHg/s 2468.62±203.1 2238.6±196 1584±225* 1597±213* 2626±1217 2611±1110
LVdP/dtmin, mmHg/s -1704.3±190.7 -1551±218 -1004±318* -1010±330* -1245.2±412 -1250±422

AC
CEPTED
MAN
USC
RIP
T
ACCEPTED MANUSCRIPT
Mean valuesSEM; CBF, coronary blood flow; CSF, coronary stroke flow; SAP, systolic arterial pressure; DAP, diastolic arterial pressure; MAP, mean arterial pressure; LVESP, left ventricular end-systolic pressure; LVEDP, left ventricular end-diastolic pressure. * P<.05 vs Baseline.
AC
CEPTED
MAN
USC
RIP
T
ACCEPTED MANUSCRIPT
Fig 1
AC
CEPTED
MAN
USC
RIP
T
ACCEPTED MANUSCRIPT
Fig 2
AC
CEPTED
MAN
USC
RIP
T
ACCEPTED MANUSCRIPT
Fig 3

AC
CEPTED
MAN
USC
RIP
T
ACCEPTED MANUSCRIPT
Fig 4
AC
CEPTED
MAN
USC
RIP
T
ACCEPTED MANUSCRIPT
Fig 5
Top Related
Copyright © 2022 FDOKUMEN

