


Bahasa
Halaman
Hukum

JOURNAL OF GEOPHYSICAL RESEARCH, VOL. 93, NO. D2, PAGES 1377-1387, FEBRUARY 20, 1988
Carbon Dioxide in the Atmosphere Over the Amazon Basin
STEVEN C. WOFSY
Division of Applied Sciences and Department of Earth and Planetary Sciences Harvard University, Cambridge, Massachusetts
ROBERT C. HARRISS
NASA Langley Research Center, Hampton, Virginia
WARREN A. KAPLAN
Division of Applied Sciences and Department of Earth and Planetary Sciences Harvard University, Cambridge, Massachusetts
The cycle of atmospheric CO2 in the Amazon Basin was studied using measured vertical profiles of CO2 concentrations in the canopy and aloft and direct measurements of CO2 emissions from soils. The results pro- vide detailed information on daily exchanges of air between the tropical forest (0-30 m) and the atmospheric boundary layer (30-2000 m). The forest was a net source of CO2 at night and a sink during the day. High con- centrations of CO2 (380-400 ppm) accumulated in the forest at night and were transported into the nascent mixed layer in the morning. Between 1000 and 1200 LT, CO2 in the mixed layer declined to concentrations 4-6 ppm lower than free tropospheric values and remained low for the rest of the afternoon. The afternoon mixed layer became isolated at night, and the low values of CO2 were preserved until a new mixed layer developed the next morning. Entrainment of air into the mixed layer appeared to be a one-way process during the early stages of mixed layer growth. The rate for uptake of atmospheric CO2 by forests (soil and canopy) near midday was estimated to be 9(+_4) kg C ha -i hr -i, and mean uptake over the sunlit period was about 2.8 (+_1.2) kg C ha -1 hr -1. Forest soils emitted CO2 at a mean rate of 1.8 (_+0.2) kg C ha -1 hr -1. The atmospheric CO2 cycle over wetlands was weaker than over forests, with daytime uptake rates of approximately 1.6 kg C ha -• hr-'. Rivers remained net sources of CO2 throughout the day.
INTRODUCTION estimation of rates for exchange of CO2 and other trace gases between the forest and the atmosphere.
The daily cycle of atmospheric CO2 in forested regions reflects We first describe experimental methods and then present a exchange of metabolic CO• with vegetation and soils. selection of the data obtained. Observed variations of CO• in time Photosynthesis provides a net sink for atmospheric CO• during and space are compared with data from the lidar instrument daylight hours; respiration and decay represent net sources of CO• [Browell et al., 1987] and with data for Oa [Gregory et al., 1987]. at night. Consequently, atmospheric CO2 over forests usually Atmospheric CO• concentrations over forests, weftands and rivers declines during the day and increases at night. are examined, revealing characteristic differences. Finally,
Ecologists have exploited atmospheric variations of CO• to preliminary estimates are derived for mean daily exchange rates of study metabolic rates in a variety of environments. Pioneering CO• between the atmosphere and the forests and wetlands of the work by Odum et al. [1970] and Lemon et al. [1970] provided Amazon Basin. basic information on the CO• cycle in tropical forests. These studies were hampered, however, by the absence of information about CO2 variations above the treetops. Desjardins et al. [1982] EXPERIMENTAL METHODS Desjardins, [1985] and Alvo et al. [1984] measured CO• fluxes Gas fluxes across the soil-air interface were determined by over Canadian forests by eddy correlation using an airborne sampling air in the headspace of welded aluminum chambers (10 sensor. They observed that the rate of CO• uptake by vegetation cm high x 20 cm wide x 40 cm long, placed 1-2 cm deep into the increased linearlywiththeincidentsolarflux. soil for short periods (20-40 rain). Methods and analysis
The present paper examines the cycle of CO• in and over a procedures were the same as those described by Keller et al. tropical forest, as part of the ABLE 2A mission to Brazil's [1986]. Pressure equilibrium between the environment and the Amazon Basin [Harriss et al., 1987]. An extensive set of data interior of the chambers was maintained through a 5-cm-long was acquired from an airborne CO• sensor, from vertical profiles hypodermic needle with 0.3 mm ID. The internal volume of a obtained on a mast extending through the canopy in the tropical chamber was 7.2 L when eraplaced 1 cm deep or 6.4 L when forest, and from direct flux measurements at the soil-atmosphere inserted 2 cm deep. The deeper eraplacement was used in most interface. We show that there is a predictable cycle of cases, except where soils were heavy clay. The static open atmospheric CO2 in the forest environment and that CO• is a very chamber method was chosen as most appropriate to obtain useful tracer for transport processes in the lowest layers of the atmosphere. Careful analysis of the atmospheric CO2 cycle allows
Copyright 1988 by the American Geophysical Union.
Paper number 7D0485, 0148-0227/87/007D-D485 $05.00
representative results in the forest environment where air motions are usually very weak at the soil surface [Odum et al., 1970; Hutchinson et al., 1981].
Samples of 40-mL volume were slowly removed from the chamber at approximately 5-rain intervals using 50-mE (Propper Trophy) syringes with matched ground glass barrels and plungers.
1377
1378 WOFSY ET AL: CARBON DIOXIDE OVER THE AMAZON GTE/ABLE 2A
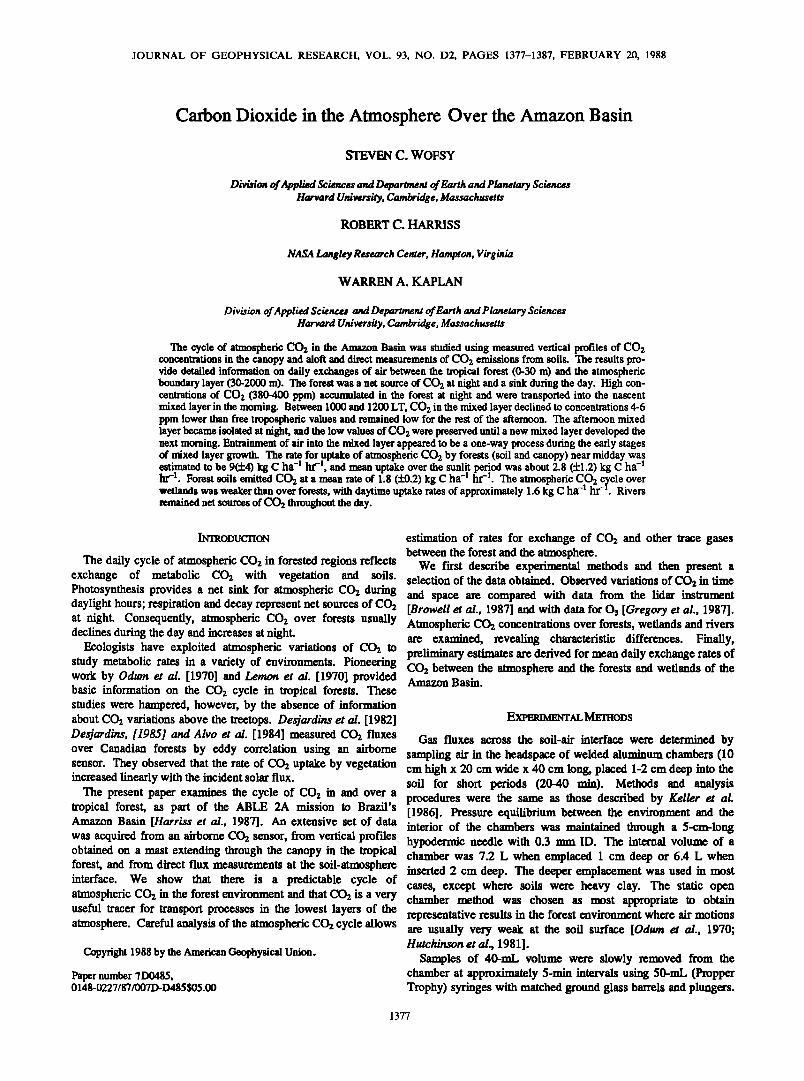
INLET
2-st solenoid selection valve valve
WAI LOG RATIO AMP
Chart recorder and
data logger
e xhoust
ice 6ram gloss both beads
liquid water trap
HARVARD AIRBORNE CO•. SENSOR
Fig. 1. Schematic diagram of airborne CO• analyzer.
The fu-st sample was taken less than 1 rain after cmplaccmcnt- introduced. The air then flowed through a microprocessor- Samples were analyzed in the field, using a gas chromatograph controlled solenoid valve into a glass trap filled with 6-ram glass with a thermal conductivity detector. Concentrations in dry air beads, maintained at 0øC in an ice bath, and finally into a modified were determined by comparison with commercially prepared Beckman Industrial model 865 nondispersed infrar• analyzer. standards of CO2 in air and/or in nitrogen (Scott Environmental Pressure in the instrument was sensed by an MKS 220B absolute Corporation, Plumsteadville, PA). We assigned absolute pressure gauge and maintained constant at 400 tort, independent concentrations to each commercial standard by comparing to of altitude, by the microprocessor (MKS 250 B valve controller). standard reference materials (SRM) from the National Bureau of The 90% response time for the instrument and the delay time in Standards. the sampling line were both about 3 s.
Fluxes across the air-soil interface were calculated using a Humidity in the sample cell was maintained at 46 tort by the ice linear least squares fit to the four or more points in the time series bath. The instrument was equipped with a narrow-pass of concentrations. Observed concentrations usually increased interference filter to reduce the sensitivity to H20 vapor. Total linearly with time except in the case of very large fluxes, where response to HzO under these conditions was equivalent to a CCh concentrations approached a steady value at long times. In these level of -1 ppm, maintained constant by the experimental cases the flux was calculated from the slope of a line drawn arrangement to better than :L-0.1 ppm (equivalent COz) for both between the first two data points. Occasional outliers were ambient air and standard mixtures. Pfima• standards at 336.2 and rejected by comparing residual variances for lines fitted to three 365.2 ppm CO• in air were obtained from Scott Environmental time points. Results of a few emplacements were rejected Corporation. We measured these relative to a set of four SRM altogether because concentrations at the first time point differed CCh standards. Results agreed with the manufacturer's values to markedly from ambient levels, indicating disturbance of the site better than x'-0.2 ppm. during emplacement or incomplete flushing of the box prior to the Instrument precision was about x'-0.5 ppm for a 10-s average m start of the experiment. About 10% of the field data were rejected level flight (:L-0.7 ppm in the strongest fair-weather turbulence). using the above criteria. Minimum detectable fluxes were 3 x 10 • During spirals the tilt of the aircraft induced a shift of 1-2 ppm, a molecules cm -z s -• (2 g C ha-•h-•). generic problem for this type of instrument. The influence of tilt
Vertical profiles of CCh in the forest environment were was effectively removed from the data by frequent calibration, obtained by filling previously evacuated 300-mi., glass flasks to a except in instances where the aircraft executed unscheduled turns. pressure of 2 atm, using a Teflon diaphram pump. The samples These infrequent maneuvers were carefully noted in our log and were obtained from 0 to 28 m by raising a 30-m-long fluorinated the associated data were rejected. Because of the rapid rate of ethylene propylene (FEP) Teflon inlet tube, 1/4-.inch OD, on the descent (or ascent) during spirals and the requirement for frequent aluminum mast described by Kaplan et al. [this issue]. Vertical calibration, only one standard was routinely used. Postflight profiles were obtained during two 24-hour cycles on July 26-27 analysis of the two-point calibrations revealed a slow gain drift and August 2-3, 1985. Samples were returned to Harvard and accounting for errors typically d:0.5 ppm or, in a few cases, d:l.0 analyzed for COz, using a gas chromatograph with ultrasonic ppm. The time constant for this drift was about 1 hour, whereas phase-shift detector. The samples were also analyzed for the the time required for an individual profile was usually about 15 •3C/zC ratio; in COz by P. Quay (University of Washington, min. Hence there was negligible effect on the measured variations Seattle) and for CH4 concentration, using gas chromatography of CO2 concentration with altitude, although variations between with flame ionization detector. flights or during long flights may have been affected. A particular
The airborne COz analyzer is shown schematically in Figure 1. anomaly was recorded in flights 6 and 7, which show mean COz Air was drawn through the instrument at 3-6 1 rain -• by a dual- levels about 2 ppm higher than other flights; a problem with the head Air Cadet pump. Air entered an inlet of 1/2-inch OD zero gas is suspected in this case. aluminum tubing, mounted 15 cm above the fuselage of the Data were recorded at 8 Hz, using a Hewlett-Packard 349'/A NASA Electra, which was connected via 1/2-inch OD data acquisition unit. coupled to an HP-85 computer and polypropylene tubing to a valve where standards could be associated disk drive. Data were averaged over 10 s during
GTE/ABLE 2A WOFSY ET AL: CARBON DIOXIDE OVER Tim AMAZON 1379
'E 3.0-- _
o
x
o •
o
0 .Ol
! I I ! t I ! ! I ! .i ! 3
- -2--':
-I
Normol distribution
S - 0.94
i I I I I I i I I I I I .05 .20 .40 .60 .80 .95 .99
FR ACT I LE
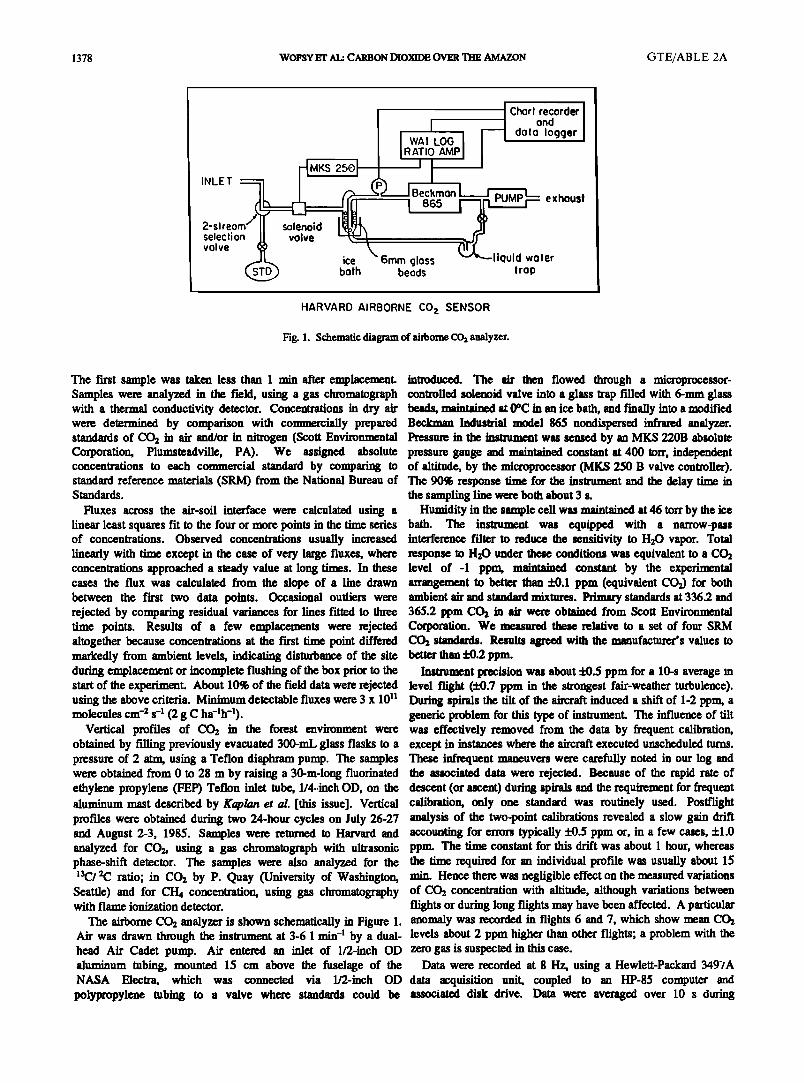
Fig. 2. Probability distribution of soil CO2 fluxes. The straight line represents a normal distribution with the same mean and standard deviation as the data sample.
al. [1980] which indicate that respiration and decomposition of mots are dominant factors in soft CO: production (see also, Keller et al., [1986]).
A summary of mean COz fluxes measured from terra firme forest softs near Manaus, Brazil, is given in Table 1. The standard deviation for each data set is relatively large, usually 30-50% of the mean value, and 90% confidence intervals are typically 10- 20% of mean values, reflecting intrinsic patchiness in the distributions [Keller et al., 1986]. There is an indication from Table 1 that soft COz fluxes in the wet season (November-June) may be lower than fluxes early in the dry season (July-August). This differen9e could reflect several environmental factors. The mean incident solar flux to the forest is lower during the wet season, which could lead to reduced root metabolism by reducing overall community photosynthesis. Production of COz from decay of organic matter could be inhibited by lower rates for diffusion of Oz into the soB. Decay of sob litter may peak in the' early dry season because of the enhanced fall of leaves at that time.
CO2 WrIItlN THE FOREST CANOPY
The vertical distribution of CO2 from the soil surface to 27 m height, (3 m above the main forest canopy) was studied during several 24- hour periods. The primary purpose of these studies was to investigate the use of CO2 as a tracer for exchange processes between air within the canopy and the atmosphere above and to define the lower boundary condition for the CO2
postflight processing, except for calibrations where the steady profiles obtained by the aircraft. segment was selected by hand from the raw data. A high- Figures 3 and 4 show vertical profiles of CO2 obtained on July performance chart recorder (Soltee) was used as backup data 26 and August 2-3. We usually observed accumulation of CO: at system. A few profiles were not recorded by the computer and night in the forest layer, followed by decline to an afternoon were retrieved from the chart record. Detailed analysis showed minimum (Figures 3 and 4). High concentrations of CO2 were the chart record to be reliable to better than 0.1 ppm at all observed between 0 and 6 m day and night, reflecting the frequencies that could be examined, i.e., up to 0.3 Hz. influence of soil emissions. The pattern is similar to observations
by Lemon et al. [1970] in a tropical rain forest in Costa Rica. CO2 DISTRmLrHONS: RESULTS AND DiSCUSSiON Nearly uniform CO2 concentrations were observed between 6
and 30 m (Figures 3 and 4), indicating significant turbulent We will first discuss the characteristics of soil CO2 emissions in mixing. Vertical mixing is expected in the daytime, because of
the Ducke forest near Manaus, Brazil [Harriss et al., this issue], buoyancy generated by solar heating or to impinging gusts from followed by an analysis of factors influencing the CO2 distribution above [Denmead and Bradley, 1985; Finnigan, 1985; Grant et al., in the surface layer of the atmosphere from the ground to 1986]. Nighttime mixing is somewhat unexpected. It probably immediately above the forest canopy. Then we will discuss the results from radiative and evapoi'ative cooling of the upper large-scale distribution of CO2 in the planetary boundary layer and canopy, which could create negative buoyancy at the top of the middle troposphere over the Amazon Basin. forest layer [Shuuteworth et al., 1984].
SOIL EMISSIONS
Measurements of CO2 flux from forest soils are summarized in TABLE 1. Mean CO: Fluxes From Soils in Tropical Forests Figure 2. The mean net CO2 flux from these softs was 2.45 x 10 t4 Near Manam, Brazil. molecules cm -2 s -• (1.76 kg C ha -• t•'-•), consistent with other Site CO 2 Flux n Date References data from these environs [Keller et al., 1986; Goreau and DeMello,. 1985]. The standard deviation on the measurements was Ducke 25:L9 36 July 1985 This Study 9.4 x 10 •a cm -2 s -• and the 90% confidence interval for the mean
was +2.6 x 10 •a cm -2 s -t (+10%). Figure 2 compares the observed Ducke 29+13 12 July-August 1984 1 distribution o.f fluxes to a normal distribution with the same mean Esteio 21+11 4 July-August 1984 1 and variance. The experimental distribution appears to be close, indicating that the mean and the confidence interval should be Fazenda" 27+13 20 July-August 1984 1 robust estimators.
Fazenda" 16 7 December 1983 2 The mean annual input of canopy litter to soils in Ducke forest
is approximately 6 t dry organic matter, ha-•yr -• [Klinge and Fazenda" 19 9 March 1984 2 Rodrigues, 1968]. If we assume 0.5 g C per gram of organic matter [Whittaker and Likens, 1972], the carbon source to soils Fluxes are given as 10 • molecules cm -2 s-i; Reference 1, Goreau and
DeMello [1986]; Reference 2, Keller et al. [1986]. Ranges refer to one from canopy litter is only 300 g C m -2 yr -• (0.34 kg C ha -• hr -•), standard deviation, n indicates number of samples. Soil type is yellow approximately 19% of the soil CO2 flux. This result agrees with oxisol in all cases. previous studies (for example, see Schlesinger [ 1977]; Medina et "Fazenda Porto Alegro, 75 ion NE of Manaus.
1380 WOFSY ET AL: CARBON DIOXIDE OVER TI-IE AMAZON GTE/ABLE 2A
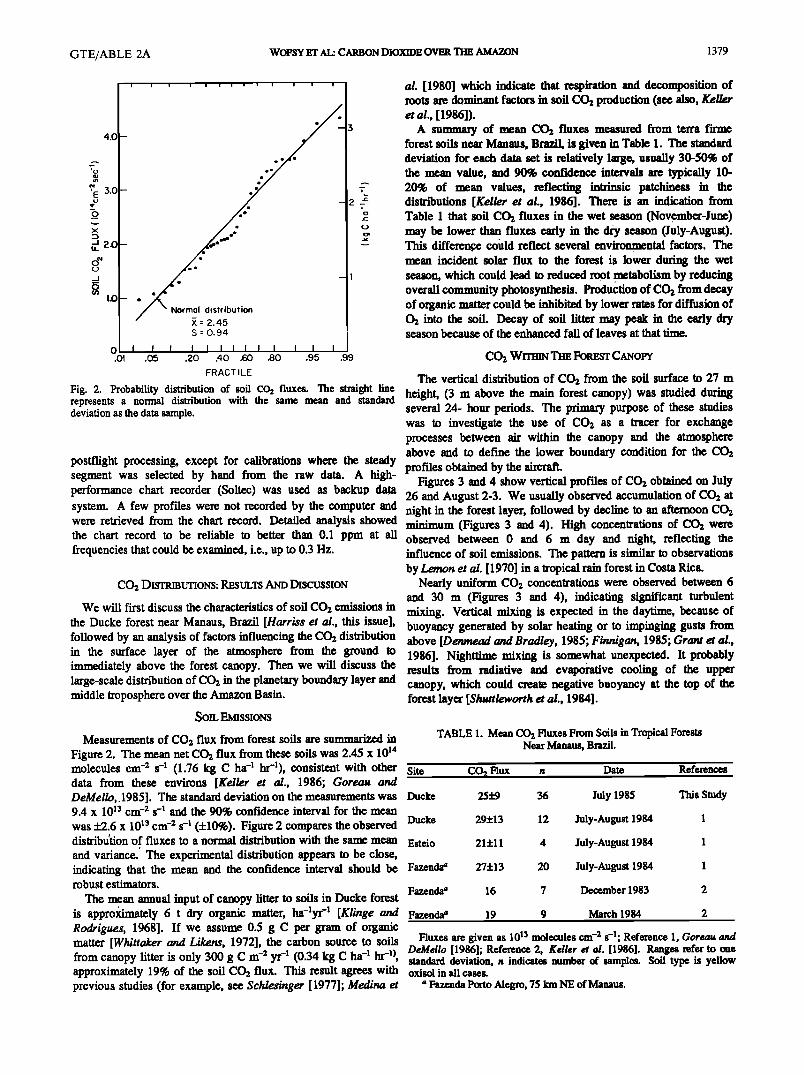
Mean value
I-oo 0700 - 28•-- x% J1400 • • 26July
24• [ t'l - •,•,,,•" • - • •o • ,' -
oF , , CO 2 (ppm)
interrupted at 2000 LT (Figure 5). Hence, there clearly were important exchanges of air at night between in the forest canopy and higher altitudes during the August experiment. Such exchanges appear to have been less significant during July, when much higher concentrations of COz and CH4 were observed in the early morning.
CO2 DISTRIBUTIONS IN TIlE PLANETARY BOUNDARY LAYER
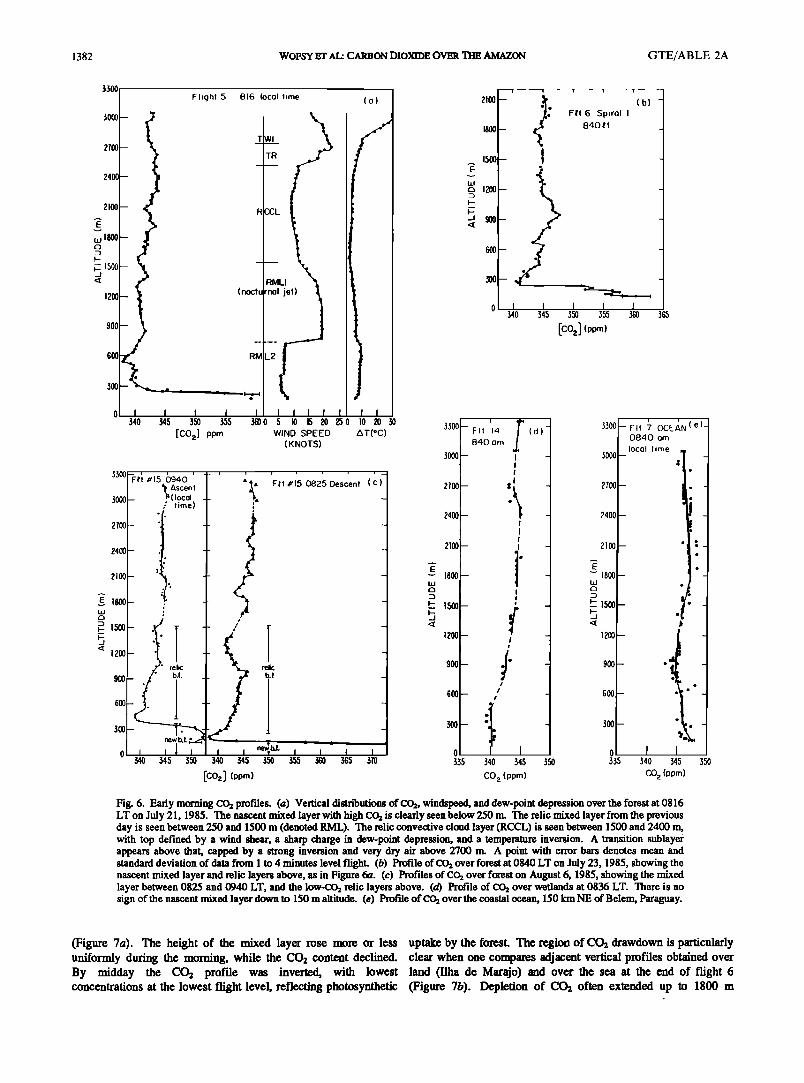
Daytime conditions. The mixed layer develops rapidly after sunrise as solar heating produces bouyancy at the top of the canopy (see Garstang et al., [this issue], for a complete discussion). Since the surface layer contains high concentrations of COz, a sharp COz gradient develops which unambiguously delineates the growing mixed layer. Figures 6a and 6b show the first appearance of a COz-rich mixed layer over forests at 150 m altitude between 0800 and 0900 LT. The remnants of the
detached relic layer may be seen just above the new mixed layer. The top of the developing mixed layer was observed to move up rapidly, at 5-10 cm s -•, eroding the low-COz relic layer above (Figure 6c). Growth of the mixed layer was somewhat retarded
Fig. 3. Distribution of CO• with height on July 26, 1985, in the forest at over wetlands, as illustrated in Figure 6d. Here the relic layer Ducke Reserve. The main canopy top is at 24-m height. The mean from the previous day was undisturbed at 0840 LT in contrast to concentration in the free troposhere was 344.6 ppm, denoted by an arrow profiles in Figures 6a-6c. at the top of the figure. The insert compares profiles near sunrise on The composition of the relic layer appeared to remain August 2 and August 3, 1985.
unchanged just above the top of the new mixed layer. The gradient was very sharp and there was little observable
Sharp decrease in CO2 concentrations was observed at the upper entrainment of high-CO2 air from the mixed layer into the relic canopy level during the night of August 2-3 (Figure 5). layer. During the period of rapid rise in mixed layer height, Concentratiom of COz at the canopy top declined to values typical transport appears to be one-way, entraining air from the relic layer of the afternoon, with a concentration less than 340 ppm observed aloft into the developing mixed layer. at 28 m at 0100 LT. As shown later, formation of the nocturnal The morning profile of CO2 over the ocean was very different inversion in late afternoon separates the atmosphere above 35 m from profiles obtained over land (Figure 6e), showing, at most, a from the forest canopy layer. Air from the afternoon mixed layer, 2-ppm enhancement at low altitudes. The mixed layer over the with 3-6 ppm le• COz than the mean values observed aloft (344.6 ocean does not decay at night, and there is no relic layer depleted ppm, Table 2), is stranded above the canopy. Subsidence of air in CO2 between 1 and 2 kin. The oceanic source is much weaker from this "relic" mixed layer into the forest canopy appears to than the nocturnal terrestrial source, and the small observed have occurred at our site on the night of August 2, staffing about enhancement may have been due to advection of terrestrial CO2 by 2000 LT. The same phenomenon is also evident in data for CH4 the land breeze. from the sample flasks, where nocturnal accumulation was A typical progression of CO2 profiles over forests is shown in
Figure 7. These data (Flight 6), represent a traverse of the forests in the eastern Amazon Basin between Manaus and Rio Xingu
? •"Q\ ' | 20 - • 3 Aug 0600 -
I I
L ....... - I '• "' ...... N• • •930
320 •0 3• 380 4• 420 • 4• a• 576
Fig. 4. Dis•budon of c• wi• heiCt on Au•st 2-3, 1985, at •cke
1.68
CH 4 ( ppm)I.64
390
370 -- CO z
(ppm) 350 --
330 --
310 0
i 1 ! i , ! ! i • i I i i i i
+
+ _ _
- / / _
_
t I t I '"T, , I • I • I I I
ONSET OF VENTILATION
/%+. /+
Aug 85 3 Aug 85 I • I • I , I , I , I , I ,
4 8 12 16 20 24 4
TIME
Reserve. Note the very low values observed at night just above the canopy Fig. 5. Temporal variations of CO• and CI-h at 28 m, just above the top. canopy, on August 2-3, 1985.
Flight [COz] bl
July 19, 1985 4.1 357.1
4.2 345.6 4.3 348.6
4.4 338.6
July 21, 1985 5.1 359.0
5.2 354.3 5.3 347.2
5.4 342.0
July 23, 1985 6.1 358.3
6.2 360.6 6.3 351.8 6.4 351.9 6.5 348.8
6.6 346.8 6.7 345.2
6.8 344.0 6.9 --
July 24, 1985 7.1 --
7.2 347.0
7.3 347.4
7.4 346.9
7.5 351.1 7.6 347.6
7.7 347.4 7.8 344.1
July 25 and 26, 1985 8/9 t' (340.5)
July 29, 1985 10.1 345.1
10.2 345.4 10.3 345.1 10.4 343.0 10.5 340.2
July 31, 1985 11.1 (340.0) 11.2 356.7
August 5, 1985 14.1 353.7 14.2 349.1
14.3 352.9 14.4 356.0
14.5 346.6 14.6 347.0
14.7 342.7 14.8 340.7 14.9 343.6
August 6, 1985 15.1 372.9 15.2 364.7
15.3 368.6 15.4 350.8 15.5 347.8 15.6 348.4 15.7 349.5
15.8 347.3 15.9 --
15.10 •
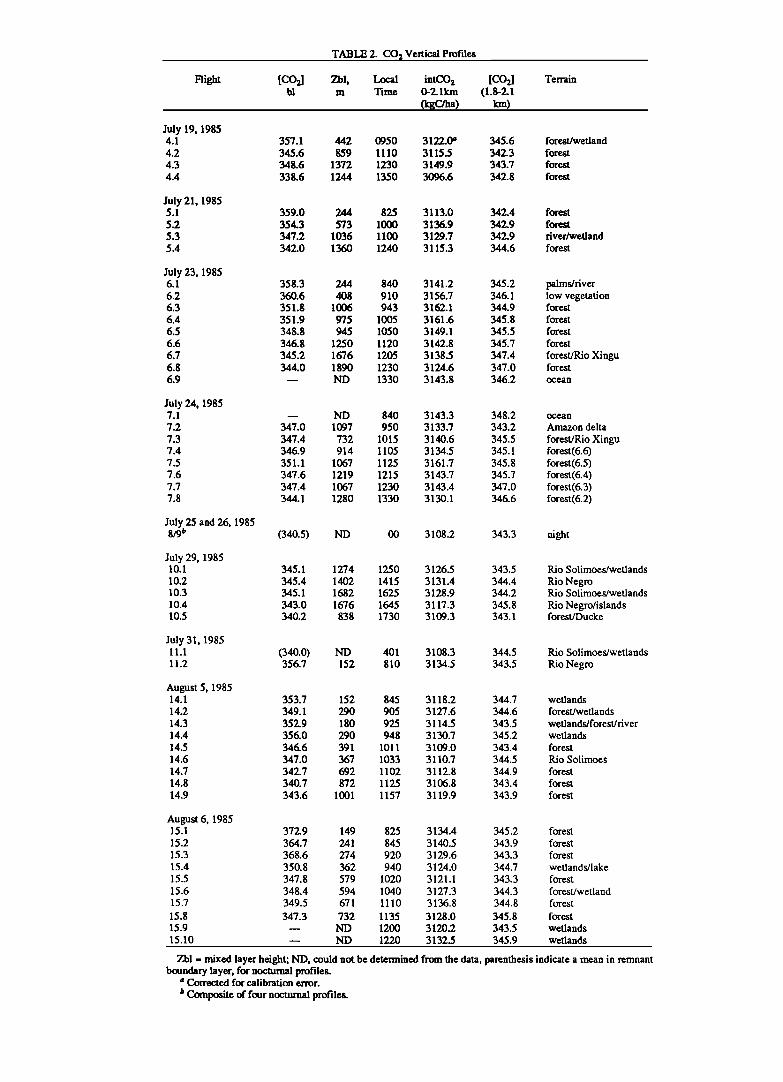
TABLE 2. CO? Vertical Profiles
Zbl, Local intCOz [CO z] m Time O-Zlkm (1.8-2.1
(lc•a) laxi)
Terrain
442 0950 3122.0 • 345.6 forest/wetland 859 1110 3115.5 342.3 forest
1372 1230 3149.9 343.7 forest 1244 1350 3096.6 342.8 forest
244 825 3113.0 573 1000 3136.9
1036 1100 3129.7 1360 1240 3115.3
244 840 3141.2
408 910 3156.7 1006 943 3162.1
975 1005 3161.6 945 1050 3149.1
1250 1120 3142.8 1676 1205 3138.5
1890 1230 3124.6 ND 1330 3143.8
342.4 forest
342.9 forest 342.9 river/wetland 344.6 forest
345.2 palms/fiver 346.1 low vegetation 344.9 forest
345.8 forest 345.5 forest
345.7 forest
347.4 forest/Rio Xingu 347.0 forest
346.2 ocean
ND 840 3143.3 1097 950 3133.7
732 1015 3140.6 914 1105 3134.5
1067 1125 3161.7 1219 1215 3143.7 1067 1230 3143.4 1280 1330 3130.1
ND 00 3108.2
1274 1250 3126.5
1402 1415 3131.4 1682 1625 3128.9 1676 1645 3117.3
838 1730 3109.3
348.2 ocean
343.2 Amazon delta
345.5 forest/Rio Xingu 345.1 forest(6.6) 345.8 forest(6.5) 345.7 forest(6.4) 347.0 forest(6.3) 346.6 forest(6.2)
343.3 night
343.5 Rio Solimoes/wetlands
344.4 Rio Negro 344.2 Rio Solimoes/wet!ands
345.8 Rio Negro/islands 343.1 forest/Ducke
ND 401 3108.3 152 810 3134.5
152 845 3118.2 290 905 3127.6
180 925 3114.5 290 948 3130.7
391 1011 3109.0 367 1033 3110.7
692 1102 3112.8 872 1125 3106.8
1001 1157 3119.9
344.5 Rio Solimoes/wefiands
343.5 Rio Negro
344.7 wetlands
344.6 forest/wetlands
343.5 wetlands/forest/fiver 345.2 wetlands
343.4 forest
344.5 Rio Solimoes
344.9 forest
343.4 forest 343.9 forest
149 825 3134.4 345.2 forest 241 845 31 40.5 343.9 forest 274 920 3129.6 343.3 forest
362 940 3124.0 344.7 wetlands/lake 579 1020 3121.1 343.3 forest
594 1040 3127.3 344.3 forest/wetland 671 1110 3136.8 344.8 forest
732 1135 3128.0 345.8 forest ND 1200 3120.2 343.5 wetlands ND 1220 3132.5 345.9 wetlands
Zbl = mixed layer height; ND, could not boundary layer, for nocturnal profiles.
a Corrected for calibration error.
e Composite of four nocturnal profiles.
be determined from the data, parenthesis indicate a mean in remnant
1382 WOFSY ET AL: CARBON DIOXIDE OVER TIlE AMAZON GTE/ABLE 2A
5000
2•0•
•00
9O0
600
0
Flight 5 816 local t•me ( o )
TWI
TR
:
1'
R'CCL ,• i
RMLI • (noctu rnol
RIV L2 • I I I I I I I I I I
550 555 •00 5 10 15 20 250 10 • •0
[CO2] ppm WIND SPEED AT(øC) (KNOTS)
500 t new b.L • , o/, , I ,,-'! , , , , , ,
540 545 550 540 545 550 555 •0 5t15 5•0
[COz] (ppm)
3300--
3000 --
2l'00 --
24O0 --
2100 --
--- 1800--
• 1500--
1200 --
90• --
2100
1800 F
F -J 9oo
340 )45
!
Fit 14
840 om
I
340 345
CO 2 (ppm)
•F (d) I I i
Ftt6 Spirol I 840/t
(b)
I I 350 355
[CO2] (ppm)
=
I , 360 365
3300
300O
2100
2400 --
2100-
1800--
1200 --
900-
600 -
0 3•5
FI! -• ' ( e -- OCEAN 0840 am
local time ,
ß
ß ß
340 345
GO 2 (p pm)
Fig. 6. Early morning C02 profiles. (a) Vertical distributions of C02, windspeed, and dew-point depression over the forest at 0816 LT on July 21, 1985. The nascent mixed layer with high CO• is clearly seen below 250 m. The relic mixed layer from the previous day is seen between 250 and 1500 m (denoted RML). The relic convective cloud layer (RCCL) is seen between 1500 and 2400 m, with top defined by a wind shear, a sharp charge in dew-point depression, and a temperature inversion. A transition sublaye r appears above that, capped by a strong inversion and very dry air above 2700 m. A point with error bars denotes mean and standard deviation of data from 1 to 4 minutes level flight. (b) Profile of CO• over forest at 0840 LT on July 23, 1985, showing the nascent mixed layer and relic layers above, as in Figure 6a. (c) Profiles of CO• over forest on August 6, 1985, showing the mixed layer between 0825 and 0940 LT, and the 1ow-CC• relic layers above. (d) Profile of CC• over wetlands at 0836 LT. There is no sign of the nascent mixed layer down to 150 m altitude. (e) Profile of CO• over the coastal ocean, 150 km NE of Belem, Paraguay.
(Figure 7a). The height of the mixed layer rose more or less uptake by the forest. The region of CO2 drawdown is particularly uniformly during the morning, while the CO2 content declined. clear when one compares adjacent vertical profiles obtained over By midday the CO2 profile was inverted, with lowest land (Ilha de Marajo) and over the sea at the end of flight 6 concentrations at the lowest flight level, reflecting photosynthetic (Figure 7b). Depletion of CO2 often extended up to 1800 m
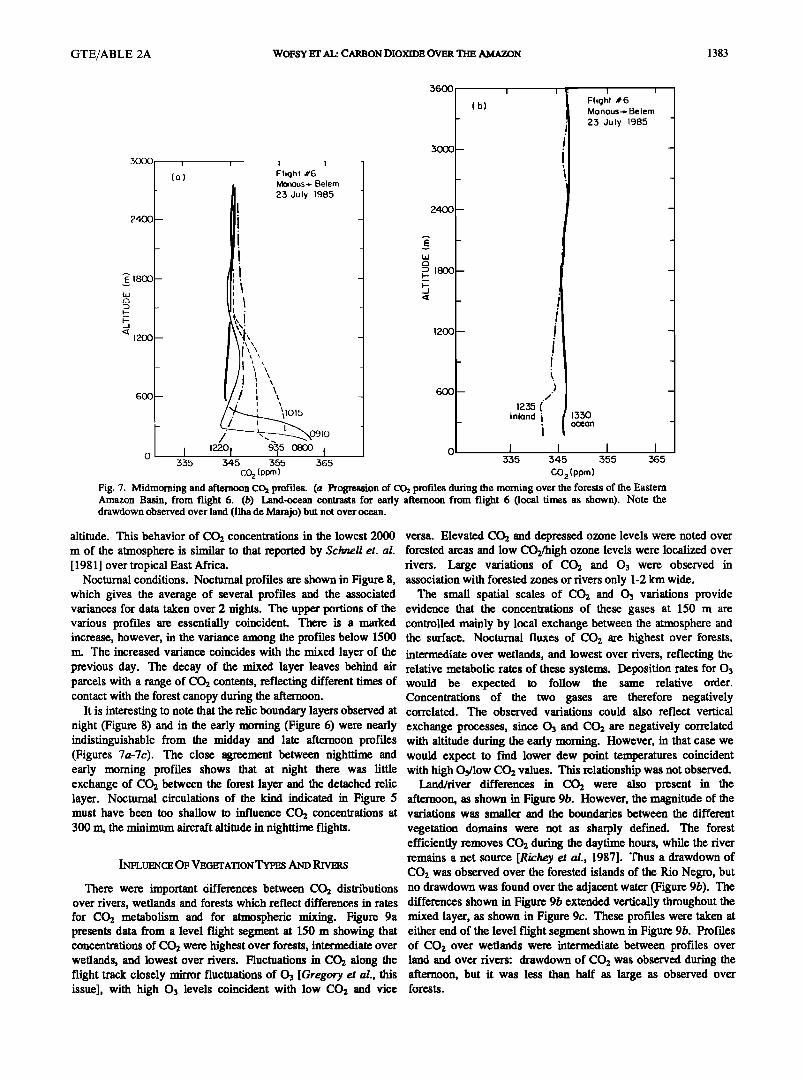
GTE/ABLE 2A WOFSY ET At.: CARBON DIOX•E OVER Tim AMAZON 1383
(b) Fllghl #6 Monaus-- Belem
- 23 July 1985
3000
(o) F•ight #G _ , Monaus--- Belem '
2:5 July ]985
2400 2400 -- '
_ _
•E •eO0-
ø
inland 1330
i ace on / '•% •oo I I I I o I •2zø! , I 0 335 345 355 365 335 345 355 365
C02(pom) C0z(ppm) Fig. ?. Midmorning and afternoon CO: profiles. (a Progression of CO: profiles during the morning over the forests of the Eastern Amazon Basin, from flight 6. (b) Land-ocean contrasts for early afternoon from flight 6 (local times as shown). Note the drawdown observed over land (Ilha dc Marajo) but not over ocean.
altitude. This behavior of CO: concentrations in the lowest 2000 versa. Elevated CO: and depressed ozone levels were noted over m of the atmosphere is similar to that reported by Schnell et. al. forested areas and low CO:/high ozone levels were localized over [19811over tropical East Africa. rivers. Large variations of CO: and O3 were observed in
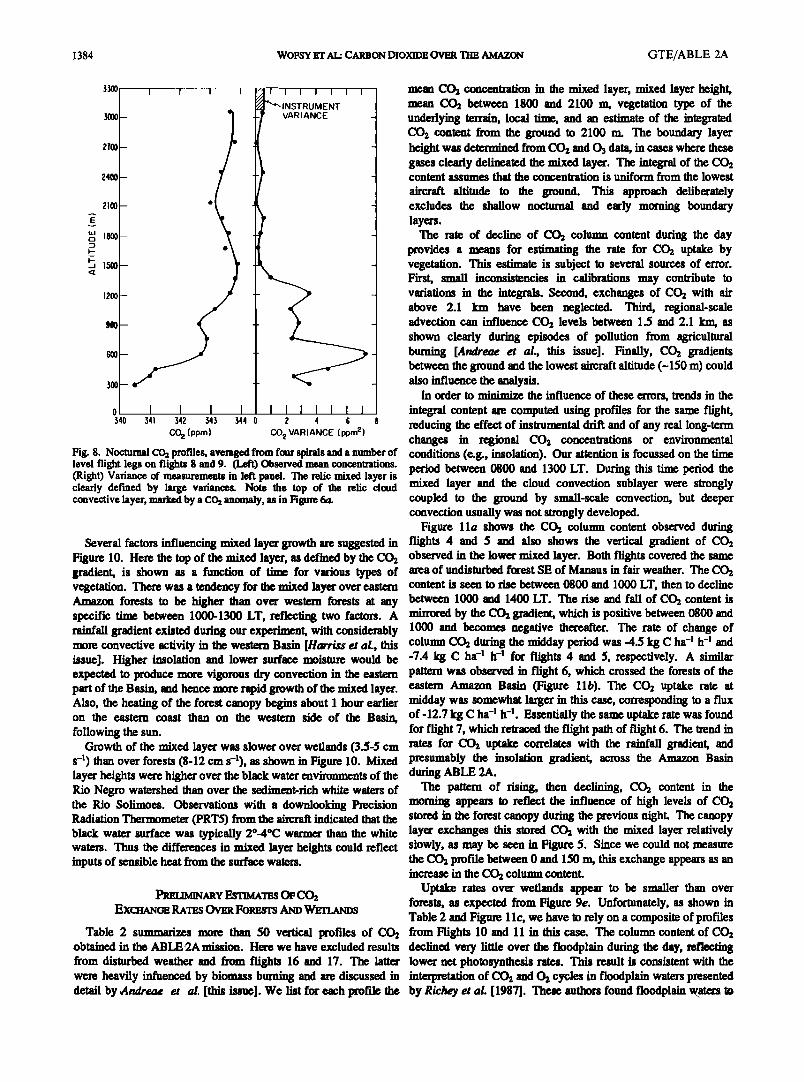
Nocturnal conditions. Nocturnal profiles are shown in Figure 8, association with forested zones or rivers only 1-2 km wide. which gives the average of several profiles and the associated The small spatial scales of CO: and Oa variations provide variances for data taken over 2 nights. The upper portions of the evidence that the concentrations of these gases at 150 m are various profiles are essentially coincident. There is a marked controlled mainly by local exchange between the atmosphere and increase, however, in the variance among the profiles below 1500 the surface. Nocturnal fluxes of CO: are highest over forests, m. The increased variance coincides with the mixed layer of the intermediate over wetlands, and lowest over riven, reflecting mc previous day. The decay of the mixed layer leaves behind air relative metabolic rates of these systems. Deposition rates for Oa parcels with a range of CO: contents, reflecting different times of would be expected to follow the same relative order. contact withtheforestcanopyduringtheafternoon. Concentrations of the two gases are therefore negatively
It is interesting to note that the relic boundary layers observed at correlated. The observed variations could also reflect vertical night (Figure 8) and in the early morning (Figure 6) were nearly exchange processes, since O• and CO2 are negatively correlated indistinguishable from the midday and late afternoon profiles with altitude during the early morning. However, in that case we (Figures 7a-7c). The close agreement between nighttime and would expect to find lower dew point temperatures coincident early morning profiles shows that at night there was little with high Odlow CO2 values. This relationship wasnot observed. exchange of CO: between the forest layer and the detached relic Land/river differences in CO: were also present in the layer. Nocturnal circulations of the kind indicated in Figure 5 afternoon, as shown in Figure 9b. However, the magnitude of the must have been too shallow to influence CO: concentrations at variations was smaller and the boundaries between the different 300 m, the minimum aircraft altitude in nighttime flights. vegetation domains were not as sharply defined. The forest
efficiently removes CO: during the daytime hours, while the fiver remains a net source [Richey et al., 1987]. Thus a drawdown of INFLUENCE OF VEOETAT•ON TYPES AND RPe•s COz was observed over the forested islands of the Rio Negro, but
There were important 0ffferences between COz distributions no drawdown was found over the adjacent water (Figure 9b). The over rivers, wetlands and forests which reflect differences in rates differences shown in Figure 9b extended vertically throughout the for CO: metabolism and for atmospheric mixing. Figure 9a mixed layer, as shown in Figure 9c. These profiles were taken at presents data from a level flight segment at 150 m showing that either end of the level flight segment shown in Figure 9b. Profiles concentrations of COz were highest over forests, intermediate over of COz over wetlands were intermediate between profiles over wetlands, and lowest over rivers. Fluctuations in COz along the land and over rivers: drawdown of COz was observed during the flight track closely mirror fluctuations of Oa [Gregory et al., this afternoon, but it was less than half as large as observed over issue], with high O• levels coincident with low COz and vice forests.
1384 WOFSY L:rr AL: CARBON DIOXIDE OVER THE AMAZON GTE/ABLE 2A
3300. • ---T ....... 1-' I L•q-• mean COz concentration in the mixed layer, mixed layer height, ••T mean COz between 1800 and 2100 m, vegetation type of the 3•- - underlying terrain, local time, and an estimate of the integrated
COz content from the ground to 2100 m. The boundary layer •(• - height was determined from CO• and O• data, in cases where these
gases clearly delineated the mixed layer. The integral of the COz •400- content assumes that the concentration is uniform from the lowest
aircraft altitude to the ground. This approach deliberately
... •)00•- * excludes the shallow nocturnal and early morning boundary • layers. "' •800- The rate of decline of CO•. column content during the day • * provides a means for estimating the rate for CO•. uptake by • 1500- - vegetation. This estimate is subject to several sources of error. • First, small inconsistencies in calibrations may contribute to
•200- - variations in the integrals. Second, exchanges of CO•. with air above 2.1 km have been neglected. Third, regional-scale
s00- - advection can influence CO•. levels between 1.5 and 2.1 kin; as shown clearly during episodes of pollution from agricultural
s00- _ burning [Andreae et al., this issue]. Finally, CO2 gradients between the ground and the lowest aircraft altitude (-150 m) could
300 - _ also influence the analysis. In order to minimi7g the influence of these errors, trends in the
0 I I I I ! ! I I I I I integral content are computed using profiles for the same flight, 3•0 3•t 3• 34• •44 0 • 4 s • reducing the effect of inslrumental drift and of any real long-term
CO•l•rn) CO•W•c• ½•me) changes in regional CO•. concentrations or environmental Fig. 8. Nocturnal CCh profiles, averaged from four spirals and a number of conditions (e.g., insolation). Our attention is focussed on the time level flight legs on flights 8 and 9. (Left) Observed mean concentrations. period between 0800 and 1300 LT. During this time period the (Righ0 Variance of measurements in left panel. The relic mixed layer is clearly defined by large variances. Note the top of the relic cloud mixed layer and the cloud convection sublayer were strongly convective layer, marked by a CO• anomaly, as in Figure 6a. coupled to the ground by small-scale convection, but deeper
convection usually was not strongly developed. Figure 11a shows the CO•. column content observed during
Several factors influencing mixed layer growth are suggested in flights 4 and 5 and also shows the vertical gradient of CO•. Figure 10. Here the top of the mixed layer, as defined by the CO• observed in the lower mixed layer. Both flights covered the same gradient, is shown as a function of time for various types of area of undisturbed forest SE of Manaus in fair weather. The CO•. vegetation. There was a tendency for the mixed layer over eastern content is seen to rise between 0800 and 1000 LT, then to decline Amazon forests to be higher than over western forests at any between 1000 and 1400 LT. The rise and fall of CO•. content is specific time between 1000-1300 LT, reflecting two factors. A mirrored by the CO•. gradient, which is positive between 0800 and rainfall gradient existed during our experiment, with considerably 1000 and becomes negative thereafter. The rate of change of more convective activity in the western Basin [Harriss et al., this column CO•. during the midday period was -4.5 kg C ha -1 h -1 and issue]. Higher insolation and lower surface moisture would be -7.4 kg C ha -1 h -I for flights 4 and 5, respectively. A similar expected to produce more vigorous dry convection in the eastern pattern was observed in flight 6, which crossed the forests of the part of the Basin, and hence more rapid growth of the mixed layer. eastern Amazon Basin (Figure 11b). The CO2 uptake rate at Also, the heating of the forest canopy begins about 1 hour earlier midday was somewhat larger in this case, corresponding to a flux on the eastern coast than on the western side of the Basin, of-12.7 kg C ha -• h -l. Essentially the same uptake rate was found following the sun. for flight 7, which retraced the flight path of flight 6. The trend in
Growth of the mixed layer was slower over wetlands (3.5-5 cm rates for CO•. uptake correlates with the rainfall gradient, and s -•) than over forests (8-12 cm s-•), as shown in Figure 10. Mixed presumably the insolation gradient, across the Amazon Basin layer heights were higher over the black water environments of the during ABLE 2A. Rio Negro watershed than over the sediment-rich white waters of The pattern of rising, then declining, CO•. content in the the Rio Solimoes. Observations with a downlooking Precision morning appears to reflect the influence of high levels of CO 2 Radiation Thermometer (PRT5) from the aircraft indicated that the stored in the forest canopy during the previous night. The canopy black water surface was typically 2ø-4øC warmer than the white layer exchanges this stored CO•. with the mixed layer relatively waters. Thus the differences in mixed layer heights could reflect slowly, as may be seen in Figure 5. Since we could not measure inputs of sensible heat from the surface waters. the CO2 profile between 0 and 150 m, this exchange appears as an
increase in the CO•. column content. Uptake rates over wetlands appear to be smaller than over
•ARY ESTIMATES OF CO•. forests, as expected from Figure 9e. Unfortunately, as shown in EXCHANOE RATES OVER FORESTS AND WETLANDS Table 2 and Figure 1 lc, we have to rely on a composite of profiles
Table 2 summarizes more than 50 vertical profiles of COg from Flights 10 and 11 in this case. The column content of COa obtained in the ABLE'2A mission. Here we have excluded results declined very little over the floodplain during the day, reflecting from disturbed weather and from flights 16 and 17. The latter lower net photosynthesis rates. This result is consistent with the were heavily infuenced by biomass burning and are discussed in interpretation of CO•. and O2 cycles in floodplain waters presented detail by •4ndreae et al, [this issue]. We list for each profile the by Richey et al. [1987]. These authors found floodplain ?aters to
GTE/ABLE 2A WOFSY ET AL: CARBON DIOXIDE OVER TI-IE AMAZON 1385
DISTANCE ALONG FLIGHT PATH (km) O 25 5O
14- • I • ' I I i i I /,• I i" 12
•0
8
6 •WETLAND-..ffT•RIVER •-'#ETLAND-•..f..•-FOREST -- .----WETLAND ' FORESTED • • FORESTED FOREST
•o• L[v[[ /• ' L[V[, -
360
340[ •- :: I q •o 4•7'S
61•I'W
5
TIME ALONG FLIGHT PATH (m•n.) 3045'S (833-843 local time) 61' 55'W
Fig. 9a. Transect of CO• concentration over rivers, forests, and wetlands at 150 m altitude on August 6, 1985, between 0833 and 0843 LT.
be a net source of COz with a mean emission rate of 1.8 kg C ha -c net fixation of CO•. proceeds with about the same quantum h -1. The organic material being oxidized on the floodplain is efficiency in Canadian and Amazonian forests. This result should thought to be provided by influx from the forest and/or by primary perhaps have been expected, since nearly all of the incident light is production during periods of low water. intercepted by leaf surfaces in both systems, and the plants are
Mean rates for CO•. uptake are summarized in Table 3. Midday presumably well adapted to other environmental conditions CO•. fluxes for the forests were estimated to be-9J:4 kg C ha -1 h -1, (temperature, soil type, moisture, etc.) in each forest type. using data from flights 4, 5, 6 and 7. The observed rates for COz We computed a vertical exchange coefficient for the height uptake in Amazon forests are close to values (-7+3 kg C ha -1 h -1) range 150-300 m, using the estimated noontime flux of COz and observed by Desjardins et al. [1985] over Canadian forests at the observed gradient. The derived values, 1-2x10 s cmz s -1, are in similar solar irradiance (--600 W m -z) and are similar also to the the range expected at this altitude for an active mixed layer mean value inferred by Odum et al. [1970] for forests of Puerto [Jacobi and Andre, 1963;Liuet al., 1984]. This result provides an Rico. The uptake rate for wetlands was much smaller than for independent check on our approach for estimating fluxes. forests with an estimated flux of-1.6 kg C ha -1 h -1. It appears that The daytime mean value for uptake of atmospheric COz can be
o
35o
348
346
344
3,•
340
338
336
DISTANCE TRAVELLED (km) 25 50 75
I I I
-- (b) ABLE 2A-FLIGHT 10 ALTITUDE - 150m dULY 29, 1985
-- 1620-]640 LOCAL TIME
o t 3o0's
60o28'W
I I
TIME ALONG FLIGHT PATH (rain) 2':'26'S 61o01' W
Fig. 9b. Transeet of river and island system at 150 m altitude at 1520 LT on July 29, 1985.
,
240o I (c) i .... .... / x•., • 2 o 26'S
F 29 JULY 1985 '• 61ø01'W
18• 60"28'W • x' t•me / 16311•al •,( /
•1 x x i I•A•S • RIO• NEGRO
0 / i ! i i i • i I i i I i 3• 345 3•
CO z (ppm) Fig. 9c. •fil• of C• at eider end of •e •ns•t in Figu• Fi• 9b.
1386 WOFSY ET AL: CARBON DIOXIDE OVER • AMAZON GTE/ABLE 2A
1800--
1500 --
1200 --
900--
600--
-r 300--
• 0
r• 1500 --
1200 --
900--
600-
0
/ FORESTS -
/
Eastern (6) '"x.. / .//•.Centrol (4,5) -
ß _ e •/e•,••/'•' Western (14,15) _
e• • 14 (•A•zon R.) - / o 15
I i I I i I x•
WETLANDS • _
/ //io Solimoes 8 •' wetlands
• I I I I I 08• 10• 12• 1• 16• 18•
LOCAL TIME (hr)
3160
o 5150
•-• •:•o
31•0 I
l
I I I I I I
(b) Flight 6 _ /.+ Forests _
+/
_ I -
_ • _
-•,•1Ch(:/'hr-' I I I ! ,I !
0800 0900 1000 II00 1200 1500 LOCAL TIME (hr)
Fig. I lb. Column abundance of CO• observed at various times of day for flight 6, covering forests of the eastern Amazon Basin. The CO• concentration was not observed below 150 m, leading to an underestimate for the first two time points (see tex0.
flux is estimated to be -2.8 kg C ha -• h -•. If we assume that daytime COz fixation should be balanced approximately by net evolution of COz at night, then the mean nocturnal COz flux for canopy and soils should be about +2.8 kg C ha -• h -•. Emission rates fwm soils, 1.8 kg C ha -• h -1, account for 65% of the estimated nocturnal COz flux, providing an indication of the major wle played by soils in oxidation of organic carbon in these forests.
SUMMARY AND CONCLUSIONS
The cycle of atmospheric COz in the Amazon Basin provides a Fig. 10. Mixed layer heights as defined by CO• concentrations, over detailed picture of daily exchanges of air between the tropical various vegetation types, shown as functions of time during the day for forest (0-30 m) and the atmospheric boundary layer (30-2000 m). flight numbers as indicated. The forest was a net source of COz at night and a sink during the
day. Large concentrations of COz (380-400 ppm) accumulated in estimated by assuming that total photosynthesis rates are roughly the forest at night were transported into the nascent mixed layer in proportional to incident solar flux [Odum et al., 1970; Desjardin.v the morning. Between 1000 and 1200 LT, COz in the mixed layer eta/., 1985]. The 12-hour mean solar irradiance at the canopy top declined to concentrations 4-6 ppm lower than free tropospheric was about 190 W m -1, and the corresponding daytime mean COz values, then remained low for the rest of the afternoon. The
5150 : ....
(o) CO z COLUMN ABUNDANCE •0 [el
OFIt ß FIt5 I
516O -- -4.5 kg Cha-lhr '1
aRemoon mixed layer became isolated at night and the lower values of COz were preserved until a new mixed layer developed the next morning. Entrainment of air into the mixed layer appeared to be a one-way process during the early stages of growth, but a significant exchange with higher altitudes occurred in later stages.
We have shown, by analyzing observed distributions of COz, that the lower atmosphere over forests functions separately from that over rivers or wetlands during the night and to some extent during the day. The basic diurnal cycle of COz over wetlands is much weaker than over forests, and the cycle is almost absent over rivers. This result is consistent with expectations based on tae biogeochemistry of organic carbon in these systems. Examination of the COz cycle in and over tropical forests provided basic
3000 I I I I I ! information about rates for forest-atmosphere exchange of the gas. + - CO z GRADIENT-LOWER -- 4
4-- IXEDLAYER --2 • • ..... 0 ...... 0 u E
! I I el I I • • ,• ,• ,2m ,• ,4m I• • ]l,O• WETLANDS
LOCAL TIME Fig. 1 la. (Up•r panel) •lculated •lu• abun•nce of C• over foms• • • •100• • Fit !1 between 0 and 2150 m al•mde at va•s •mes of day, •lculat• as d•bed in •e text, for fli•ts 4 and 5. •e low value at 0830 LT e Fit rapresents •e relic •• layer and conv•dve cloud layer, since •e new •0ffi• I . I I I I I •xed layer had not yet gm• to aimm• •tudes. 4• 6• 8• 1• 12ffi 14ffi 16• 18ffi (•wer panel) Gradients of C• •tw•n 150 and 3• m at va•ous •m• LOCAL TIME (hr) of day du•ng •i•ts 4 and 5. Fig. 1 lc. Same as Fi•m 1 lb for wet,ds in •e •o Ne• region.
GTE/ABLE 2A WOFSY ET AL: CARBON DIOXIDE OVER TIlE AMAZON 1387
TABLE 3. CO1 Fluxes From the Central Amazon Forests and Wetlands
Midday Day Mean
Forest -9'J:4 • -2.8+1.2 b
Wetland -1.6 a
Fluxes are in kg C ha -! h -l. ß From d/tit {f[COz] dz}, Figure 11. b From noon value and assumed proportionality to net insolation.
Grant, R. H., G. E. Bertolin, and L. P. Harrington, The intermittent vertical heat flux over a spruce forest canopy, Boundary Layer Meteoral., 35, 317-330, 1986.
Gregory, G. L., E. V. Browell, and L. S. Gahan, Boundary layer ozone: An airborne survey above the Amazon Basin. J. Geoph•s. Res.,, this issue.
Harriss, R. C., S.C. Wofsy, M. Garstang, L. C. B. Molion, R. S. McNeal, J. M. Hoell, R. J. Bendura, S. M. Beck, R. L. Navarro, J. T. Riley, and R. C. Shell, The Amazon Boundary Layer Experiment (ABLE 2A): Dry season 1985), J. Geophys. Res., this issue.
Hutchinson, (3. L., and A. R. Mosier, Imposed soil cover method for field measurement of nitrous oxide fluxes, Soil Sci. Soc. Am. J., 45, 311-316,
The midday rate for COz uptake was about 9 (+4) kg C ha-•h -•, 1981. Jacobi, W., and K. Andre, The vertical distribtuion of radon 222, radon and the daytime mean uptake rate was 2.8 (+1.2) kg C ha -1 h -1. 220, and their decay products in the atmosphere, J. Geophys. Res., 68, The flux of COz from soils of the tropical forest at Ducke reserve 3799-3814, 1963. averaged 1.8(+0.2) kg C ha-lh -1. If we assume approximate Kaplan, W. A., S.C. Wofsy, M. Keller, and J. M. da Costa, Emissions of balance between daytime COz uptake and nocturnal COz NO and deposition of 0 3 in a tropical forest system, J. Geophys. Res., emissions in forests, the nocturnal production rate for COz would this issue.
Keller, M., W. A. Kaplan, and S.C. Wofsy, Emissions of NzO, CH 4, and be 2.8 kg C ha-lh -1, of which soils would provide about two- CO 2 from tropical forests soils, J. Geophys. Res., 91, 11,791-11,8012,
thirds. 1986. Future work should help to refine the present results. Improved Klinge, H., and W. A. Rodrigues, Litter production in an arrea of
determinations of COz vertical fluxes (for example, by the eddy- Amazonian terra firme forest, Amazoniana, 1,287-310, 1968. correlation technique), in concert with careful characterization of Lemon, E. H., L. H. Allen, and L. Miller, Carbon dioxide exchange of a COz and trace gas distributions, should provide a powerful tool for tropical rain forest, II, Bioscience, 20, 1054-1059, 1970. analysis of gas and trace element exchanges between terrestrial Liu, S.C., J. R. McAfee, and R.J. Cicerone, Radon 222 and tropospheric systems and the atxnosphere. vertical transport, J. Geophys. Res., 89, 7291-7309, 1984.
Lundegardh, H., Carbon dioxide evolution and crop growth, Soil Sci., 23, Acknowledgements. We ar• indebted to Fanya (3im. melfarb, Irma 417-453, 1927.
Tovbina, Roger Navarro, James Hoell, and the late Dr. Otto Grubnet for Medina, E., H. Klinge, C. Jordan, and R. Hartera, Soil respiration in their assistance in this experiment. This work was supported by NASA gram NAG 1-55 to Harvard University.
Alvo, P., R. C. Desjardins, P. H. Schuepp, and J.I. MacPherson, Aircraft
Amazonian rain forests in the Rio Negro Basin, Flora, 170, 240-250, 1980.
Odum, H. T., A. Lugo, G. Cintronn, and C. F. Jordan, Metabolism and evapotranspiration of some rainforest plants and soil, in A Tropical Rainforest, edited by H. T. Odum and R. F. Pigeon, pp. I103-I164, Division of Technical Information, U.S. Atomic Energy Commission, Washington, D.C., 1970.
measurements of CO z Exchange over various ecosystems, Boundary- Raich, J., J. Ewel, and M. Olivera, Soil CO z efflux in simple and diverse Layer Meteorology, 29, 167-183, 1984. ecosystems on a volcanic soil in Costa Rica. Turrialba, 35, 33-42, 1985.
Andreae, M. O., et al., Biomass-burning emissions and associated haze Richey, J., A. H. Devol, S.C. Wofsy, R. Victoria, and M. N. G. Ribeiro, layers over Amazonia. J. Geophys. Res.,, this issue. Oxidation and reduction rates for organic carbon in the Amazon
Browell, E. V., G. L. Gregory, R. C. Harriss, and V. W. J. H. Kirchoof, Mainstem, Tributary and Floodplain, inferred from distributions of Tropospheric ozone and aerosol distributions across the Amazon Basin, dissolved gases, Limnol. Oceanogr., in press, 1987. J. Geophys. Res.,, this issue. Schlesinger, W. H., Carbon balance in terrestrial detritus. Annu. Rev. Ecd.
Denmead, O. T., and E. F. Bradley, Flux-gradient relationship in a forest Systematics, 8, 51-81, 1977. canopy, pp. 421-442, in The Forest-Atmosphere Interaction, edited by B. Schnell, R. C., S.-A. Odh, and L. N. Njau, Carbon dioxide measurements A. Hutchinson and B. B. Hicks, D. Reidel, Hingham, Mass., 1985. in tropical East African biomes, J. Geophys. Res., 86, 5364-5372, 1981.
Desjardins, R.L., J. L. MacPherson, P. Alvo, and P.H. Schuepp, Shuttleworth, W.J., et al., Daily variations of temperature and humidity Measurements of turbulent heat and CO 2 exchange over forests from within and above Amazonian forest, Weather, 40, 102-107, 1985. aircraft, pp. 645-658, in The Forest-Atmospheric Interaction, edited by Whittaker, R. H., and G. E. Likens, Carbon in the biota, in, Carbon and the B. A. Hutchinson and B. B. Hicks, D. Reidel, Hingham, Mass., 1985.
Desjardins, R. L., E. J. Brack, P. Alvo and P. H. Schuepp, Aircraft monitoring of surface carbon dioxide exchange, Science, 216, 733-735, 1982.
Finnigan, J. J., Turbulent transport in flexible plant canopies, pp. 443-480, in, The Forest-Atmosphere Interaction, edited by B. A. Hutchinson and b. B. Hicks, D. Reidel, Hingham, Mass., 1985.
Garstang, M. A., et al., Trace gas exchanges and convective transports over the Amazonian rain forest, J. Geophys. Res.,, this issue.
Biosphere, edited (3. M. Woodwell and E. V. Pecan, pp. 281-302, U.S. Atomic Energy Commission, Washington, D.C., 1972. (Available as Conf. 720510, Nat. Tech. Inf. Serv., Springfield, Va.
R. C. Hatriss, Mail Stop 483, NASA Langley Research Center, Hampton, VA 23665.•
W. A. Kaplan ara:; S.C. Wofsy, Division of Applied Sciences and Department of Eartl'• and Planetary Sciences, Harvard University,
Goreau, T. J. and W. Z. DeMello, Effects of deforestation on sources and Cambridge, MA 02138, sinks of atmospheric carbon dioxide, nitrous oxide, and methane from some Amazonian biota and soils, in Workshop on Biogeochemistry of Tropical Rainforests: Problems for Research, edited by D. Athaie,, T. E. Lovejoy, and P. deM Oyens, Universidad de Sao Paulo and World (Received December 18, 1986; Wildlife Fund, Diracicaba, S.P., Brasil, Piricicaba, Sao Paulo, Brasil, revised May 28, 1987; 1985. accepted May 29, 1987).
Top Related
Copyright © 2022 FDOKUMEN

