

Bahasa
Halaman
Hukum


Karun Intrachai [email protected]
+66 2611 3555
PREPARED BY FSS INTERNATIONAL INVESTMENT ADVISORY SECURITIES CO LTD (FSSIA). ANALYST CERTIFICATION AND IMPORTANT DISCLOSURES CAN BE FOUND AT THE END OF THIS REPORT
EQUITY RESEARCH - COMPANY REPORT
18 FEBRUARY 2021 THAILAND / CONSUMER STAPLES
CARABAO GROUP CBG TB
BUY UNCHANGED
To be the champion in CLMV
ปีท่ีดีกว่ารออยู่ข้างหน้า เราเชือ่ว่าแนวโน้มก าไรของ CBG จะยงัคงดใีนปี 2021-22 โดยคาดว่าก าไรจะโต 22%/15% ตามล าดบัโดยไดแ้รงหนุนจาก 1) การเตบิโตของความตอ้งการในตลาด CLMV ทีด่โีดยอยู่ที ่25%/15% ในปี 2021/22; 2) การฟ้ืนตวัในตลาดเครือ่งดืม่ชกู าลงัในประเทศจาก -6% y-y ในปี 2020 เป็น 8% y-y ในปี 2021; 3) ผลติภณัฑ ์C+ Lock และยอดขายจากการเป็นผูจ้ดัจ าหน่าย (Third-Party Distribution) ทีเ่พิม่ขึน้จาก (+30% y-y ในปี 2021/22E); และ 4) การประหยดัตน้ทุนจากโรงงานผลติบรรจุภณัฑใ์หม ่การสิน้สุดสญัญาเป็นผูส้นบัสนุนสโมสร Chelsea และภาษทีีป่ระหยดัไดจ้ากสทิธปิระโยชน์ของ BOI
พม่าอาจให้การเติบโตท่ีดีในปี 2021-22 เราคาดว่ายอดขายในพมา่จะเป็นปัจจยัหนุนการเตบิโตต่อเนื่องในปี 2021/22 โดยคาดว่ายอดขายจะโต 50%/25% y-y หลงัจากทีเ่คยโตอย่างโดดเด่นถงึกว่า 100% y-y ในปี 2020E ประมาณการของเราอยู่ในระดบัต ่าเมือ่เทยีบกบัเป้าประมาณการของบรษิทัฯ ทีก่ว่า 50% ในช่วงเดยีวกนั เราคาดว่าตลาดเครือ่งดืม่ชกู าลงัในพมา่อาจอิม่ตวัที ่25-30พนั ลบ. เทยีบกบัขนาดของตลาดในปัจจุบนัทีป่ระมาณ 15พนั ลบ. จากการบรโิภคต่อคนต่อปีทีเ่ท่ากนักบัในประเทศไทย ดงันัน้เราจงึยงัมัน่ใจว่าตลาดพมา่อาจโตไดใ้นอตัราสองหลกัในปีถดัไป
Upside เกิดใหม่จากมาตรการกีดกนัการเข้าสู่ตลาดเหล้าขาว เราเชือ่ว่ารายไดจ้าก การเป็นผูจ้ดัจ าหน่าย อาจมบีทบาทส าคญัส าหรบัการเตบิโตในประเทศ ซึง่นกัลงทุนไมค่วรมองขา้ม ตลาดดงักล่าวมกีารเตบิโตอย่างมนียัส าคญัทีป่ระมาณ 50% ในปี 2020 หลงัผลติภณัฑเ์หลา้ขาวขา้วหอมไดร้บัความนิยมในตลาด (สว่นแบ่งตลาดประมาณ 2%) ดงันัน้เราจงึเชือ่ว่า CBG มโีอกาสทีจ่ะขยายธุรกจิในตลาดเหลา้ขาวไดใ้นฐานะผูจ้ดัจ าหน่าย ปัจจุบนัมกีารคาดการณ์ว่าตลาดเหลา้ขาวในประเทศไทยมขีนาด 100พนั ลบ. เราเหน็ความเสีย่งขาขึน้ส าหรบั CBG ในฐานะผูจ้ดัจ าหน่ายส าหรบัผลติภณัฑบ์รัน่ดกีาแลคซี ่ซึง่คาดว่าจะมีขนาดตลาดอยู่ที ่8พนั ลบ.
คงแนะน าซ้ือหลงัปรบัราคาเป้าหมายเพ่ิมเป็น 180 บาท (จาก 150 บาท) เราปรบัเพิม่ประมาณการก าไรสุทธปีิ 2021/22 ขึน้ 4.3%/6.9% หลงัรวมสว่นแบ่งยอดขายจากการเป็นผูจ้ดัจ าหน่ายทีค่าดว่าจะสงูขึน้ และปรบัสมมตฐิานอตัราก าไรขัน้ตน้และสดัส่วนค่าใชจ้่ายการขายและการบรหิารต่อยอดขายขึน้อกี ราคาเป้าหมายใหมข่องเราทีเ่พิม่เป็น 180 บาท จาก 150 บาท (DCF) สะทอ้นการปรบัประมาณการก าไรของเราและแนวโน้มการเตบิโตระยะยาวทีด่ขีอง CBG ราคาดงักล่าวคดิเป็นค่า 2021E P/E ที ่41x (สงูกว่าค่าเฉลีย่ยอ้นหลงั 5 ปีที ่39x อยู่เลก็น้อย แต่อาจลดลงเหลอื 36x ในปี 2022E) เราเหน็ว่าก าไรของบรษิทัฯ มคีวามเสีย่งขาขึน้จากผลติภณัฑใ์หม ่เช่น เครือ่งดืม่จากกญัชง ซึง่อาจเป็นปัจจยัหนุนการเตบิโตส าคญัในปี 2022-23 รวมถงึตลาดเวยีดนามและจนีนบัตัง้แต่ปี 2023 เป็นตน้ไป
TARGET PRICE THB180.00
CLOSE THB138.50
UP/DOWNSIDE +30.0%
PRIOR TP THB150.00
CHANGE IN TP +20.0%
TP vs CONSENSUS +20.6%
KEY STOCK DATA
YE Dec (THB m) 2019 2020E 2021E 2022E
Revenue 15,052 17,421 20,898 23,708
Net profit 2,506 3,591 4,378 5,027
EPS (THB) 2.51 3.59 4.38 5.03
vs Consensus (%) - (0.5) (2.0) (2.6)
EBITDA 3,719 5,051 6,290 7,198
Core net profit 2,515 3,591 4,378 5,027
Core EPS (THB) 2.52 3.59 4.38 5.03
Chg. In EPS est. (%) - 0.0 4.3 6.9
EPS growth (%) 117.1 42.8 21.9 14.8
Core P/E (x) 55.1 38.6 31.6 27.6
Dividend yield (%) 1.2 1.8 2.2 2.5
EV/EBITDA (x) 38.1 28.2 22.4 19.5
Price/book (x) 16.2 14.4 12.6 11.1
Net debt/Equity (%) 36.3 38.8 22.4 13.9
ROE (%) 32.0 39.4 42.5 42.9
Share price performance 1 Month 3 Month 12 Month
Absolute (%) 13.1 18.4 52.2
Relative to country (%) 13.4 5.5 53.4
Mkt cap (USD m) 4,618
3m avg. daily turnover (USD m) 38.4
Free float (%) 34
Major shareholder Mr. Sathien Setthasit (34%)
12m high/low (THB) 152.50/46.25
Issued shares (m) 1,000.00
Sources: Bloomberg consensus; FSSIA estimates
(20)
0
20
40
60
80
0
20
40
60
80
100
120
140
160
ก.พ.-20 เม.ย.-20 มิ.ย.-20 ส.ค.-20 ต.ค.-20 ธ.ค.-20
(%) (THB) CBG Relative to SET
Feb-20 May-20 Aug-20 Nov-20 Feb-21
บทวิเคราะห์ฉบบัน้ีแปลมาจากบทวิเคราะห์ของ FSSIA ฉบบัวนัท่ี 18 กุมภาพนัธ์ 2021

Carabao Group CBG TB Karun Intrachai
2 FINANSIA
Investment thesis
We believe CBG‟s strategy to enter growing markets, rather than markets in their introductory stage, is an effective and proven strategy for the company. We are optimistic about CBG‟s entry into Myanmar‟s and Thailand‟s vitamin C drink markets, which could be the key growth drivers for the next few years. Moreover, we see more room for a gross profit margin (GPM) expansion, driven by 1) a projected 150-200bps GPM increase over 2020-22 from its new packaging plant; 2) increasing export sales that we estimate at 64% in 2022, from 55% in 2019; and 3) 2022E C+ Lock sales of THB1.0b, which have a significantly higher GPM due to C+ Lock‟s higher retail price of THB15 and its exemption from the sugar tax.
Overall, we expect CBG‟s earnings to experience double-
digit growth over 2020-22, which is outstanding
compared to its peers.
Company profile
Founded in 2001 as a partnership between three founders, one of which is the lead singer of Carabao (legendary Thai folk band), the Carabao Group is now the second largest energy drink company in Thailand with about a 23% market share.
www.carabaogroup.com
Principal activities (revenue, 2019)
Source: Carabao Group
Major shareholders
Source: Carabao Group
Sales of goods - 99.2 %
Other income - 0.8 %
Mr. Sathien Setthasit - 34.0 %
Ms. NutchamaiThanombooncharoen - 23.0 %
Mr. Yuenyoung Opakul - 14.0 %
Others - 29.0 %
Catalyst
Potential catalysts for CBG‟s share price include a higher-
than-expected GPM and sales growth, and the company‟s
potential entry into new markets, such as Vietnam, or new
product segments, such as ready-to-drink coffee.
Risk to our call
The key downside risks to our DCF-based TP are 1) slower-
than-expected sales growth in Myanmar, Cambodia, and the
vitamin C drink market; 2) a decrease in domestic energy
drink market share; and 3) higher-than-expected SG&A
expenses from overseas operations, such as in China and
the UK.
Event calendar
Date Event
19 Feb 2021 4Q20 results announcement
Key assumptions
2020E 2021E 2022E
(%) (%) (%)
Sales growth 15.5 20.0 13.4
- Energy drink sales (Domestic) (5.7) 8.0 2.0
- Energy drink sales (Overseas) 26.7 22.1 13.8
C+ Lock sales (THB m) 340 700 1,000
GPM 41.6 42.5 42.6
SG&A to sales 16.7 16.5 16.3
Source: FSSIA estimates
Earnings sensitivity
For every 1% increase in sales, we estimate 2021 EPS
would rise 0.4%, and vice versa, all else being equal.
For every 1ppt increase in GPM, we estimate 2021 EPS
would rise 3.9%, and vice versa, all else being equal.
For every 0.1% increase in SG&A to sales, we estimate
2021 EPS would fall 0.4%, and vice versa, all else being
equal.
Source: FSSIA estimates

Carabao Group CBG TB Karun Intrachai
3 FINANSIA

Carabao Group CBG TB Karun Intrachai
4 FINANSIA
Four pillars underpin net profit growth in 2021-22
We believe CBG‟s earnings outlook will remain solid over the next couple years and
expect earnings to grow by 22%/15% in 2021-22, supported by 1) solid growth in the
CLMV market at 25%/15% in 2021/22; 2) a rebound in the domestic energy drink
market from -6% y-y in 2020 to 8% y-y in 2021; 3) C+ Lock products and a sales leap
from third-party distribution (+30% y-y in 2021/22E); and 4) cost reduction from its new
packaging plant, the expiration of Chelsea‟s sponsorship, and tax savings due to the
BOI privilege. Overall, we expect domestic and overseas sales to grow by 18%/22% in
2021, which is slightly below CBG‟s target of 20%/25%.
Exhibit 1: Expect double-digit sales growth over 2020-22 Exhibit 2: Revenue breakdown by product
Sources: CBG; FSSIA estimates
Sources: CBG; FSSIA estimates
Exhibit 3: GPM of each product, 2019 to 2023E Exhibit 4: % contribution of each product vs 2021E GPM
GPM
(%)
Branded own (domestic) 43-47
Branded own (overseas) 48-53
Woody C+ Lock Above 50
Branded OEM 12-16
Distribution for third parties 7-8
CBD infused drinks Expected above other products due to its premium position
Sources: CBG; FSSIA estimates
Sources: CBG; FSSIA estimates
6 6 5 6 6
6 7 9
11 12 1 1
2
3
4
3
16
20
13
(6)
(2)
2
6
10
14
18
22
0
5
10
15
20
25
2018 2019 2020E 2021E 2022E
(%)(THB b)Domestic energy drink C+ Lock
Overseas energy drink Branded OEM
Distribution for 3rd party Change y-y (RHS)
42 39 32 29 26
45 48 52 53 53
7 10 12 13 15
0
20
40
60
80
100
2018 2019 2020E 2021E 2022E
(%)Domestic energy drink C+ Lock
Overseas energy drink Branded OEM
Distribution for 3rd party
28.8 3.4 53.1 1.4 13.4
4550 52
15
8
0
10
20
30
40
50
60
Domesticenergy drink
C+ Lock Overseasenergy drink
Coffee Alcohol
(%)GPM 2021E

Carabao Group CBG TB Karun Intrachai
5 FINANSIA
Exhibit 5: Gross profit breakdown classified by company Exhibit 6: Gross profit breakdown classified by company (%)
Sources: CBG; FSSIA estimates
Sources: CBG; FSSIA estimates
Exhibit 7: Gross profit breakdown classified by FSSIA Exhibit 8: Gross profit breakdown classified by FSSIA (%)
Sources: CBG; FSSIA estimates
Sources: CBG; FSSIA estimates
Driver #1: Myanmar still the overseas hero
We expect Myanmar sales to continue to be the key growth driver in 2021/22 at
50%/25% y-y, after delivering outstanding growth of over 100% y-y in 2020E. Our
forecast is conservative vs the company‟s target of over 50% growth in the same
period. We estimate that the energy drink market in Myanmar could mature to
THB25b-30b vs the current market size of cTHB15b, based on a similar
consumption/person/year as Thailand. Hence, we remain convinced that the Myanmar
market could potentially grow by double digits in the following year due to its similar
labour-intensive structure, younger population, and high base of blue-collar workers.
4.4 5.6 6.8 8.2 9.10
2
4
6
8
10
2018 2019 2020E 2021E 2022E
(THB b) Distribution for 3rd partyBranded OEMC+ LockEnergy drink (Domestic & overseas)
96 97 95 93 92
2 4 5
0
20
40
60
80
100
2018 2019 2020E 2021E 2022E
(%) Distribution for 3rd party
Branded OEM
C+ Lock
Energy drink (Domestic & overseas)
2.2 2.5 2.5 2.7 2.8
2.33.4
4.6
5.76.5
0
2
4
6
8
10
2018 2019 2020E 2021E 2022E
(THB b)Domestic energy drink C+ Lock
Overseas energy drink Branded OEM
Distribution for 3rd party
48 41 33 30 28
48 56 62 63 64
0
20
40
60
80
100
2018 2019 2020E 2021E 2022E
(%)Domestic energy drink C+ Lock
Overseas energy drink Branded OEM
Distribution for 3rd party

Carabao Group CBG TB Karun Intrachai
6 FINANSIA
Exhibit 9: CLMV market to continue delivering solid growth Exhibit 10: Myanmar is the key contributor to CLMV growth
Sources: CBG; FSSIA estimates
Sources: CBG; FSSIA estimates
Driver #2: A rebound in the domestic energy drink market
Energy drink sales in Thailand should recover from their low base in 2020 after
suffering from the lockdown that limited economic and social activities. We expect
energy drink sales to grow by 8% in 2021 but do not see this product as a key growth
driver in 2022-23, as the domestic energy drink market has already matured.
Exhibit 11: Domestic energy drink sales growth trend
Sources: CBG; FSSIA estimates
Driver #3: Emerging upside from high barrier to entry for white spirit market
We believe third-party distribution revenue could play a key role for domestic growth,
which should not be overlooked. This segment had significant growth of c50% in 2020
after “Kao Hom” white spirit products became more popular (c2% market share).
Hence, we believe CBG has an opportunity to grow its presence in the alcohol market
as a distributor. Currently, the white spirit market in Thailand is estimated at THB100b,
with c95% of the market share held by Thai Beverage Public Company Limited
(THBEV SP). Moreover, we see an upside risk for CBG as the distributor of the new
“Galaxy” brandy product, which has an estimated market size of THB8.0b.
5 6 8 9 11
7.3
28.025.0
15.0
0
5
10
15
20
25
30
0
2
4
6
8
10
12
14
2018 2019 2020E 2021E 2022E
(%)(THB b)CLMV ChinaAsia OthersCLMV Change y-y (RHS)
0.7 0.8 1.9 2.9 3.6
25.2
130.0
50.0
25.0
0
20
40
60
80
100
120
140
0.0
0.5
1.0
1.5
2.0
2.5
3.0
3.5
4.0
2018 2019 2020E 2021E 2022E
(%)(THB b)Myanmar Change y-y (RHS)
6.06 5.82 5.49 5.93 6.05
(4.0)
(5.7)
8.0
2.0
(10)
(8)
(6)
(4)
(2)
0
2
4
6
8
10
5.2
5.3
5.4
5.5
5.6
5.7
5.8
5.9
6.0
6.1
6.2
2018 2019 2020E 2021E 2022E
(%)(THB b)Carabao Original Change y-y (RHS)

Carabao Group CBG TB Karun Intrachai
7 FINANSIA
Exhibit 12: C+ Lock sales growth trend Exhibit 13: Third-party distribution sales growth trend
Sources: CBG; FSSIA estimates
Sources: CBG; FSSIA estimates
Driver #4: Cost savings from three factors
We expect that CBG‟s GPM could continue to improve by 90bps y-y to 42.5% in 2021
following 1) a higher proportion of high-margin overseas sales and C+ Lock products;
and 2) the new packaging plant that could boost GPM by 150-200bps. However, the
higher aluminium price at cUSD2,100 per tonne (+c20% y-y) could pressure GPM in
2021. We estimate that a USD100/tonne increase in the aluminium price would reduce
GPM by 30bps. Note that aluminium costs account for 8-10% of CBG‟s COGS.
Moreover, we expect SG&A expenses to lower by THB120m per year after the
expiration of Chelsea‟s sponsorship and tax savings of THB40m per year for five years
due to the Board of Investment (BOI) privilege.
Exhibit 14: Aluminium rising price trend
Sources: Bloomberg; FSSIA compilation
120
220
700
1,000
-
200
400
600
800
1,000
1,200
1H20 2H20E 2021E 2022E
(THB m)C+ Lock sales
1,020 1,409 2,114 2,748 3,572
38.1
50.0
30.0 30.0
0
10
20
30
40
50
60
0
500
1,000
1,500
2,000
2,500
3,000
3,500
4,000
2018 2019 2020E 2021E 2022E
(%)(THB m)
Third-party distribution sales Change y-y (RHS)
1,000
1,500
2,000
2,500
3,000
2009
2010
2011
2012
2013
2014
2015
2016
2017
2018
2019
2020
(USD/t)LME Aluminium SPOT Average

Carabao Group CBG TB Karun Intrachai
8 FINANSIA
Two upside risks in 2023 onward
Upside risk #1: Vietnamese market could be the next star
Management believes that Vietnam could be the next key growth driver following
Cambodia and Myanmar. Currently, Vietnam sales are worth cTHB300m vs sales of
over THB4.5b in Cambodia and cTHB2.0b in Myanmar. However, we do not expect to
see significant growth (50-100% sales growth) in 2021 due to the new wave of Covid-
19. We expect that the roll-out of a vaccine and the easing of border restrictions could
occur by this year‟s end. Hence, we think the Vietnamese market could be the next
star by 2022 onward.
According to the Rakhoi Wholesale website, the Carabao brand is ranked the fifth
most popular international energy drink brand in Vietnam. The most popular is Red
Bull (c30% market share), with Sting coming in at second place (c20% market share),
and Warrior (a product of TC Pharma (Thailand)) and Coca-Cola Energy in the third
and fourth places, respectively.
Despite the Vietnamese market having more intense competition compared to other
CLMV markets, we think CBG‟s experience with the similar characteristics of the
people in CLMV should be a key success factor for the company to gain more market
share in Vietnam. CBG typically aims to acquire at least the third largest market share,
or more than 10% of the market share, which could provide an upside of THB1.8b-
2.0b in sales derived from the Vietnamese market.
Exhibit 15: CLMV sales breakdown Exhibit 16: Available energy drink products on Rakhoi Wholesale
Sources: CBG; FSSIA estimates
Source: RAKHOI WHOLESALE
Upside risk #2: CBD drinks could become another champion product
We believe this year is too early for cannabidiol (CBD) drinks to make it onto the
market due to the limited hemp supply and the ongoing approval process from the
Thai FDA to allow CBD extracts in food and beverages. Hence, we expect to see the
first CBD drink product launched by early 2022, which could present an opportunity for
CBG. The market size could range from THB5.0b (current vitamin drink market size) to
THB20b (peak green tea market size), with a GPM not lower than other beverage
products, from 35% (Osotspa (OSP TB, BUY TP THB43)‟s average domestic
beverage GPM) to 48% (CBG‟s average branded beverage GPM), due to its premium
position. The global retail price of CBD drinks is THB80-120/unit and contains 10-
20mg of CBD. The incremental cost per unit would be THB0.7-2.0 based on the
market price of CBD extract at THB75k-100k/kg.
Cambodia60.8%
Myanmar32.4%
Vietnam+Laos6.8%

Carabao Group CBG TB Karun Intrachai
9 FINANSIA
NP and TP revisions
We revise our 2021/2022E net profit up by 4.3%/6.9% after incorporating the higher
estimated third-party distribution sales contributions and fine-tune our GPM and SG&A
to sales assumptions. The Chelsea contract will expire in mid-2021 and CBG does not
intend to renew the contract. This would reduce 2021/2022E SG&A expenses by
THB60m/120m. Our new DCF-derived TP is THB180 (from THB150) to reflect our
earnings revisions and CBG‟s promising long-term growth outlook. Our TP implies 41x
2021E P/E, slightly above its 5-year average at 39x, but could drop to 36x in 2022E.
We see an earnings upside risk from new products like CBD drinks – which could be
key growth drivers in 2022-23 – and the Vietnamese and Chinese markets in 2023
onward.
Exhibit 17: Assumption revisions
---------------------- New ------------------------- ----------------------- Previous ------------------ ----------------------Change -----------------
2020E 2021E 2022E 2020E 2021E 2022E 2020E 2021E 2022E
(%) (%) (%) (%) (%) (%) (% or ppt) (% or ppt) (% or ppt)
Retail sales (THB m) 17,253 20,701 23,485 17,248 20,474 22,675 0.0 1.1 3.6
Sales growth 15.5 20.0 13.4 15.5 18.7 10.7 0.0 1.3 2.7
Energy drink sales (Domestic) (5.7) 8.0 2.0 (5.7) 8.0 2.0 0.0 0.0 0.0
Energy drink sales (Overseas) 26.7 22.1 13.8 26.7 22.1 13.8 0.0 0.0 0.0
C+ Lock sales (THB m) 340 700 1,000 340 700 1,000 0.0 0.0 0.0
Distribution sales 50.0 30.0 30.0 50 20 10 0.0 10.0 20.0
Blended GPM 41.6 42.5 42.6 41.6 42.8 42.9 0.0 (0.3) (0.3)
SG&A to sales 16.7 16.5 16.3 16.7 17.6 17.8 0.0 (1.1) (1.5)
Net profit (THB m) 3,591 4,378 5,027 3,590 4,195 4,704 0.0 4.3 6.9 *Note: Change of items in percentage terms are represented in ppt change
Source: FSSIA estimates
Exhibit 18: DCF-derived TP
(%) (THB b)
Discount rate (WACC) 6.7
Terminal growth 3.0
NPV
44
Add: terminal value
139
Sum of PV
183
Add: investment
0
Less: debt
2.5
Less: minorities
0.2
Residual ordinary equity
180
No. of shares (m)
1,000
Residual ordinary equity (THB/share)
180
Source: FSSIA estimates
Exhibit 19: Rolling one-year forward P/E band Exhibit 20: Rolling one-year forward P/BV band
Sources: Bloomberg; FSSIA estimates
Sources: Bloomberg; FSSIA estimates
0
10
20
30
40
50
60
70
80
90
2016
2017
2018
2019
2020
2021
CBG PER (x)
std +2 = 74.6x (THB312)
std +1 = 56.7x (THB237)
5Y-avg = 38.9x (THB163)
std -1 = 21.1x (THB88)
std -2 = 3.3x (THB14)
2
4
6
8
10
12
14
2016
2017
2018
2019
2020
2021
CBG PBV (x)
std +2 = 12.5x (THB137)
std +1 = 10.2x (THB112)
5Y-avg = 8x (THB88)
std -1 = 5.7x (THB62)
std -2 = 3.4x (THB37)

Carabao Group CBG TB Karun Intrachai
10 FINANSIA
Financial Statements Carabao Group
Profit and Loss (THB m) Year Ending Dec 2018 2019 2020E 2021E 2022E
Revenue 14,597 15,052 17,421 20,898 23,708
Cost of goods sold (9,349) (8,589) (9,461) (11,160) (12,645)
Gross profit 5,248 6,463 7,960 9,738 11,063
Other operating income 0 0 0 0 0
Operating costs (3,333) (2,744) (2,909) (3,448) (3,864)
Operating EBITDA 1,915 3,719 5,051 6,290 7,198
Depreciation (464) (534) (618) (741) (841)
Goodwill amortisation 0 0 0 0 0
Operating EBIT 1,452 3,186 4,433 5,549 6,358
Net financing costs (107) (133) (121) (126) (97)
Associates 0 0 0 0 0
Recurring non operating income (16) (12) 0 0 0
Non recurring items 0 (9) 0 0 0
Profit before tax 1,329 3,032 4,312 5,423 6,261
Tax (368) (564) (681) (1,003) (1,190)
Profit after tax 960 2,468 3,631 4,420 5,071
Minority interests 198 38 (40) (42) (44)
Preferred dividends 0 0 0 0 0
Other items 0 0 0 0 0
Reported net profit 1,159 2,506 3,591 4,378 5,027
Non recurring items & goodwill (net) 0 9 0 - -
Recurring net profit 1,159 2,515 3,591 4,378 5,027
Per share (THB)
Recurring EPS * 1.16 2.52 3.59 4.38 5.03
Reported EPS 1.16 2.51 3.59 4.38 5.03
DPS 0.80 1.70 2.51 3.06 3.52
Diluted shares (used to calculate per share data) 1,000 1,000 1,000 1,000 1,000
Growth
Revenue (%) 11.7 3.1 15.7 20.0 13.4
Operating EBITDA (%) 39.6 94.2 35.8 24.5 14.4
Operating EBIT (%) 30.9 119.5 39.2 25.2 14.6
Recurring EPS (%) (7.0) 117.1 42.8 21.9 14.8
Reported EPS (%) (7.0) 116.3 43.3 21.9 14.8
Operating performance
Gross margin inc depreciation (%) 32.8 39.4 42.1 43.1 43.1
Gross margin of key business (%) 28.2 39.0 41.6 42.5 42.6
Operating EBITDA margin (%) 13.1 24.7 29.0 30.1 30.4
Operating EBIT margin (%) 9.9 21.2 25.4 26.6 26.8
Net margin (%) 7.9 16.7 20.6 20.9 21.2
Effective tax rate (%) 27.7 18.5 15.8 18.5 19.0
Dividend payout on recurring profit (%) 69.1 67.6 70.0 70.0 70.0
Interest cover (X) 13.4 23.9 36.7 44.1 65.6
Inventory days 30.1 39.9 40.3 39.1 39.8
Debtor days 23.3 24.8 25.8 25.4 26.0
Creditor days 72.4 69.2 58.7 57.0 58.1
Operating ROIC (%) 23.6 22.9 30.9 35.4 39.5
ROIC (%) 20.7 21.4 28.9 32.7 36.1
ROE (%) 16.2 32.0 39.4 42.5 42.9
ROA (%) 11.9 17.8 23.7 26.6 28.8
* Pre-exceptional, pre-goodwill and fully diluted
Revenue By Division (THB m) 2018 2019 2020E 2021E 2022E
Sales of goods 14,463 14,933 17,253 20,701 23,485
Other income 135 119 168 197 223
Sources: Carabao Group; FSSIA estimates

Carabao Group CBG TB Karun Intrachai
11 FINANSIA
Financial Statements Carabao Group
Cash Flow (THB m) Year Ending Dec 2018 2019 2020E 2021E 2022E
Recurring net profit 1,159 2,515 3,591 4,378 5,027
Depreciation 464 534 618 741 841
Associates & minorities 495 3 (40) (42) (44)
Other non-cash items (198) (38) 40 42 44
Change in working capital (308) (204) (122) (109) (102)
Cash flow from operations 1,611 2,810 4,086 5,010 5,765
Capex - maintenance (1,945) (316) (2,000) (500) (1,400)
Capex - new investment 0 0 0 0 0
Net acquisitions & disposals 8 60 (208) (132) (107)
Other investments (net) 0 0 0 0 0
Cash flow from investing (1,937) (256) (2,208) (632) (1,507)
Dividends paid (800) (1,700) (2,514) (3,064) (3,519)
Equity finance (296) 583 0 0 0
Debt finance 1,405 (612) 684 (1,243) (675)
Other financing cash flows 0 0 0 0 0
Cash flow from Financing 310 (1,730) (1,830) (4,307) (4,194)
Non-recurring cash flows - - - - -
Other adjustments 0 0 0 0 0
Net other adjustments 0 0 0 0 0
Movement in cash (16) 824 48 71 65
Free cash flow to firm (FCFF) (219.39) 2,686.80 1,998.86 4,503.50 4,355.54
Free cash flow to equity (FCFE) 1,079.23 1,941.84 2,561.85 3,135.00 3,583.70
Per share (THB)
FCFF per share (0.22) 2.69 2.00 4.50 4.36
FCFE per share 1.08 1.94 2.56 3.14 3.58 Recurring cash flow per share 1.92 3.01 4.21 5.12 5.87
Balance Sheet (THB m) Year Ending Dec 2018 2019 2020E 2021E 2022E
Tangible fixed asset (gross) 12,721 13,006 15,006 15,506 16,906
Less: Accumulated depreciation (1,630) (2,133) (2,751) (3,492) (4,333)
Tangible fixed assets (Net) 11,090 10,872 12,255 12,014 12,573
Intangible fixed assets (Net) 0 0 0 0 0
Long-term financial assets 0 0 0 0 0
Invest. In associates & subsidiaries 100 103 103 103 103
Cash & equivalents 138 962 1,010 1,081 1,146
A/C receivable 907 1,140 1,320 1,583 1,796
Inventories 887 992 1,096 1,294 1,466
Other current assets 546 104 120 144 163
Current assets 2,477 3,197 3,545 4,101 4,571
Other assets 652 607 878 1,054 1,195
Total assets 14,320 14,780 16,781 17,272 18,442
Common equity 7,177 8,566 9,643 10,956 12,464
Minorities etc. 188 153 153 153 153
Total Shareholders' equity 7,365 8,718 9,796 11,109 12,617
Long term debt 4,065 2,131 3,200 2,374 1,925
Other long-term liabilities 126 153 216 259 294
Long-term liabilities 4,191 2,284 3,416 2,633 2,219
A/C payable 1,810 1,447 1,598 1,887 2,139
Short term debt 676 1,997 1,612 1,196 970
Other current liabilities 278 333 359 447 498
Current liabilities 2,764 3,777 3,569 3,530 3,606
Total liabilities and shareholders' equity 14,320 14,780 16,781 17,272 18,442
Net working capital 251 455 578 686 789
Invested capital 12,094 12,038 13,814 13,857 14,660
* Includes convertibles and preferred stock which is being treated as debt
Per share (THB)
Book value per share 7.18 8.57 9.64 10.96 12.46
Tangible book value per share 7.18 8.57 9.64 10.96 12.46
Financial strength
Net debt/Equity (%) 62.5 36.3 38.8 22.4 13.9
Net debt/total assets (%) 32.1 21.4 22.7 14.4 9.5
Current ratio (x) 0.9 0.8 1.0 1.2 1.3
CF interest cover (x) 11.1 15.6 22.2 25.9 38.0
Valuation 2018 2019 2020E 2021E 2022E
Recurring P/E (x) * 119.5 55.1 38.6 31.6 27.6
Recurring P/E @ target price (x) * 155.4 71.6 50.1 41.1 35.8
Reported P/E (x) 119.5 55.3 38.6 31.6 27.6
Dividend yield (%) 0.6 1.2 1.8 2.2 2.5
Price/book (x) 19.3 16.2 14.4 12.6 11.1
Price/tangible book (x) 19.3 16.2 14.4 12.6 11.1
EV/EBITDA (x) ** 74.8 38.1 28.2 22.4 19.5
EV/EBITDA @ target price (x) ** 96.5 49.3 36.4 29.0 25.3
EV/invested capital (x) 11.8 11.8 10.3 10.2 9.6
* Pre-exceptional & pre-goodwill are fully diluted ** EBITDA includes associate income and recurring non operating income
Sources: Carabao Group; FSSIA estimates
Carabao Group CBG TB Karun Intrachai
12 FINANSIA
Corporate Governance report of Thai listed companies 2020
EXCELLENT LEVEL
AAV ADVANC AF AIRA AKP AKR ALT AMA AMATA AMATAV ANAN
AOT AP ARIP ARROW ASP BAFS BANPU BAY BCP BCPG BDMS
BEC BEM BGRIM BIZ BKI BLA BOL BPP BRR BTS BWG
CENTEL CFRESH CHEWA CHO CIMBT CK CKP CM CNT COL COMAN
COTTO CPALL CPF CPI CPN CSS DELTA DEMCO DRT DTAC DTC
DV8 EA EASTW ECF ECL EGCO EPG ETE FNS FPI FPT
FSMART GBX GC GCAP GEL GFPT GGC GPSC GRAMMY GUNKUL HANA
HARN HMPRO ICC ICHI III ILINK INTUCH IRPC IVL JKN JSP
JWD K KBANK KCE KKP KSL KTB KTC LANNA LH LHFG
LIT LPN MAKRO MALEE MBK MBKET MC MCOT METCO MFEC MINT
MONO MOONG MSC MTC NCH NCL NEP NKI NOBLE NSI NVD
NYT OISHI ORI OTO PAP PCSGH PDJ PG PHOL PLANB PLANET
PLAT PORT PPS PR9 PREB PRG PRM PSH PSL PTG PTT
PTTEP PTTGC PYLON Q-CON QH QTC RATCH RS S S & J SAAM
SABINA SAMART SAMTEL SAT SC SCB SCC SCCC SCG SCN SDC
SEAFCO SEAOIL SE-ED SELIC SENA SIRI SIS SITHAI SMK SMPC SNC
SONIC SORKON SPALI SPI SPRC SPVI SSSC SST STA SUSCO SUTHA
SVI SYMC SYNTEC TACC TASCO TCAP TFMAMA THANA THANI THCOM THG
THIP THRE THREL TIP TIPCO TISCO TK TKT TMB TMILL TNDT
TNL TOA TOP TPBI TQM TRC TSC TSR TSTE TSTH TTA
TTCL TTW TU TVD TVI TVO TWPC U UAC UBIS UV
VGI VIH WACOAL WAVE WHA WHAUP WICE WINNER TRUE
VERY GOOD LEVEL
2S ABM ACE ACG ADB AEC AEONTS AGE AH AHC AIT
ALLA AMANAH AMARIN APCO APCS APURE AQUA ASAP ASEFA ASIA ASIAN
ASIMAR ASK ASN ATP30 AUCT AWC AYUD B BA BAM BBL
BFIT BGC BJC BJCHI BROOK BTW CBG CEN CGH CHARAN CHAYO
CHG CHOTI CHOW CI CIG CMC COLOR COM7 CPL CRC CRD
CSC CSP CWT DCC DCON DDD DOD DOHOME EASON EE ERW
ESTAR FE FLOYD FN FORTH FSS FTE FVC GENCO GJS GL
GLAND GLOBAL GLOCON GPI GULF GYT HPT HTC ICN IFS ILM
IMH INET INSURE IRC IRCP IT ITD ITEL J JAS JCK
JCKH JMART JMT KBS KCAR KGI KIAT KOOL KTIS KWC KWM
L&E LALIN LDC LHK LOXLEY LPH LRH LST M MACO MAJOR
MBAX MEGA META MFC MGT MILL MITSIB MK MODERN MTI MVP
NETBAY NEX NINE NTV NWR OCC OGC OSP PATO PB PDG
PDI PICO PIMO PJW PL PM PPP PRIN PRINC PSTC PT
QLT RCL RICHY RML RPC RWI S11 SALEE SAMCO SANKO SAPPE
SAWAD SCI SCP SE SEG SFP SGF SHR SIAM SINGER SKE
SKR SKY SMIT SMT SNP SPA SPC SPCG SR SRICHA SSC
SSF STANLY STI STPI SUC SUN SYNEX T TAE TAKUNI TBSP
TCC TCMC TEAM TEAMG TFG TIGER TITLE TKN TKS TM TMC
TMD TMI TMT TNITY TNP TNR TOG TPA TPAC TPCORP TPOLY
TPS TRITN TRT TRU TSE TVT TWP UEC UMI UOBKH UP
UPF UPOIC UT UTP UWC VL VNT VPO WIIK WP XO
YUASA ZEN ZIGA ZMICO
GOOD LEVEL
7UP A ABICO AJ ALL ALUCON AMC APP ARIN AS AU
B52 BC BCH BEAUTY BGT BH BIG BKD BLAND BM BR
BROCK BSBM BSM BTNC CAZ CCP CGD CITY CMAN CMO CMR
CPT CPW CRANE CSR D EKH EP ESSO FMT GIFT GREEN
GSC GTB HTECH HUMAN IHL INOX INSET IP JTS JUBILE KASET
KCM KKC KUMWEL KUN KWG KYE LEE MATCH MATI M-CHAI MCS
MDX MJD MM MORE NC NDR NER NFC NNCL NPK NUSA
OCEAN PAF PF PK PLE PMTA POST PPM PRAKIT PRECHA PRIME
PROUD PTL RBF RCI RJH ROJNA RP RPH RSP SF SFLEX
SGP SISB SKN SLP SMART SOLAR SPG SQ SSP STARK STC
SUPER SVOA TC TCCC THMUI TIW TNH TOPP TPCH TPIPP TPLAS
TTI TYCN UKEM UMS VCOM VRANDA WIN WORK WPH
Description Score Range
Excellent 90-100
Very Good 80-89
Good 70-79
Disclaimer:
The disclosure of the survey results of the Thai Institute of Directors Association („IOD”) regarding corporate governance is made pursuant to the policy of the Office of the Securities and Exchange Commission. The survey of the IOD is based on the information of a company listed on the Stock Exchange of Thailand and the Market for Alternative Investment disclosed to the public and able to be accessed by a general public investor. The result, therefore, is from the perspective of a third party. It is not an evaluation of operation and is not based on inside information. The survey result is as of the date appearing in the Corporate Governance Report of Thai Listed Companies. As a result, the survey results may be changed after that date. FSS International Investment Advisory Company Limited does not confirm nor certify the accuracy of such survey results. * CGR scoring should be considered with news regarding wrong doing of the company or director or executive of the company such unfair practice on securities trading, fraud, and corruption SEC imposed a civil sanction against insider trading of director and executive; ** delisted Source: Thai Institute of Directors Association (IOD); FSSIA‟s compilation

Carabao Group CBG TB Karun Intrachai
13 FINANSIA
Anti-corruption Progress Indicator 2020
CERTIFIED
2S ADVANC AI AIE AIRA AKP AMA AMANAH AP AQUA ARROW
ASK ASP AYUD B BAFS BANPU BAY BBL BCH BCP BCPG
BGC BGRIM BJCHI BKI BLA BPP BROOK BRR BSBM BTS BWG
CEN CENTEL CFRESH CGH CHEWA CHOTI CHOW CIG CIMBT CM CMC
COL COM7 CPALL CPF CPI CPN CSC DCC DELTA DEMCO DIMET
DRT DTAC DTC EASTW ECL EGCO FE FNS FPI FPT FSS
FTE GBX GC GCAP GEL GFPT GGC GJS GPSC GSTEEL GUNKUL
HANA HARN HMPRO HTC ICC ICHI IFS INET INSURE INTUCH IRPC
ITEL IVL K KASET KBANK KBS KCAR KCE KGI KKP KSL
KTB KTC KWC L&E LANNA LHFG LHK LPN LRH M MAKRO
MALEE MBAX MBK MBKET MC MCOT MFC MFEC MINT MONO MOONG
MPG MSC MTC MTI NBC NEP NINE NKI NMG NNCL NSI
NWR OCC OCEAN OGC ORI PAP PATO PB PCSGH PDG PDI
PDJ PE PG PHOL PL PLANB PLANET PLAT PM PPP PPPM
PPS PREB PRG PRINC PRM PSH PSL PSTC PT PTG PTT
PTTEP PTTGC PYLON Q-CON QH QLT QTC RATCH RML RWI S & J
SABINA SAT SC SCB SCC SCCC SCG SCN SEAOIL SE-ED SELIC
SENA SGP SIRI SITHAI SMIT SMK SMPC SNC SNP SORKON SPACK
SPC SPI SPRC SRICHA SSF SSSC SST STA SUSCO SVI SYNTEC
TAE TAKUNI TASCO TBSP TCAP TCMC TFG TFI TFMAMA THANI THCOM
THIP THRE THREL TIP TIPCO TISCO TKT TMB TMD TMILL TMT
TNITY TNL TNP TNR TOG TOP TPA TPCORP TPP TRU TSC
TSTH TTCL TU TVD TVI TVO TWPC U UBIS UEC UKEM
UOBKH UWC VGI VIH VNT WACOAL WHA WHAUP WICE WIIK XO
ZEN TRUE
DECLARED
7UP ABICO AF ALT AMARIN AMATA AMATAV ANAN APURE B52 BKD
BM BROCK BUI CHO CI COTTO DDD EA EFORL EP ERW
ESTAR ETE EVER FSMART GPI ILINK IRC J JKN JMART JMT
JSP JTS KWG LDC MAJOR META NCL NOBLE NOK PK PLE
ROJNA SAAM SAPPE SCI SE SHANG SINGER SKR SPALI SSP STANLY
SUPER SYNEX THAI TKS TOPP TRITN TTA UPF UV WIN ZIGA
Level
Certified This level indicates practical participation with thoroughly examination in relation to the recommended procedures from the audit committee or the SEC‟s certified auditor, being a certified member of Thailand's Private Sector Collective Action Coalition Against Corruption programme (Thai CAC) or already passed examination to ensure independence from external parties.
Declared This level indicates determination to participate in the Thailand's Private Sector Collective Action Coalition Against Corruption programme (Thai CAC)
Disclaimer: The disclosure of the Anti-Corruption Progress Indicators of a listed company on the Stock Exchange of Thailand, which is assessed by Thaipat Institute, is made in order to comply with the policy and sustainable development plan for the listed companies of th e Office of the Securities and Exchange Commission. Thaipat Institute made this assessment based on the information received from the listed company, as stipulated in the form for the assessment of Anti-corruption which refers to the Annual Registration Statement (Form 56-1), Annual Report (Form 56-2), or other relevant documents or reports of such listed company . The assessment result is therefore made from the perspective of Thaipat Institute that is a third party. It is not an assessment of operation and is not based on any inside information. Since this assessment is only the assessment result as of the date appearing in the assessment result, it may be changed after that date or when there is any change to the relevant information. Nevertheless, FSS International Investment Advisory Company Limited does not confirm, verify, or certify the accuracy and completeness of the assessment results.
Note: Companies participating in Thailand's Private Sector Collective Action Coalition Against Corruption programme (Thai CAC) under Thai Institute of Directors (as of June 24, 2019) are categorised into: 1) companies that have declared their intention to join CAC, and; 2) companies certified by CAC. Source: The Securities and Exchange Commission, Thailand; * FSSIA‟s compilation
Carabao Group CBG TB Karun Intrachai
14 FINANSIA
GENERAL DISCLAIMER
ANALYST(S) CERTIFICATION
Karun Intrachai FSS International Investment Advisory Securities Co., Ltd
The individual(s) identified above certify(ies) that (i) all views expressed in this report accurately reflect the personal view of the analyst(s) with regard to
any and all of the subject securities, companies or issuers mentioned in this report; and (ii) no part of the compensation of the analyst(s) was, is, or will
be, directly or indirectly, related to the specific recommendations or views expressed herein.
This report has been prepared by FSS International Investment Advisory Company Limited (FSSIA). The information herein has been obtained from
sources believed to be reliable and accurate; however FSS makes no representation as to the accuracy and completeness of such information.
Information and opinions expressed herein are subject to change without notice. FSS has no intention to solicit investors to buy or sell any security in
this report. In addition, FSS does not guarantee returns nor price of the securities described in the report nor accept any liability for any loss or damage
of any kind arising out of the use of such information or opinions in this report. Investors should study this report carefully in making investment
decisions. All rights are reserved.
This report may not be reproduced, distributed or published by any person in any manner for any purpose without permission of FSSIA. Investment in
securities has risks. Investors are advised to consider carefully before making investment decisions.
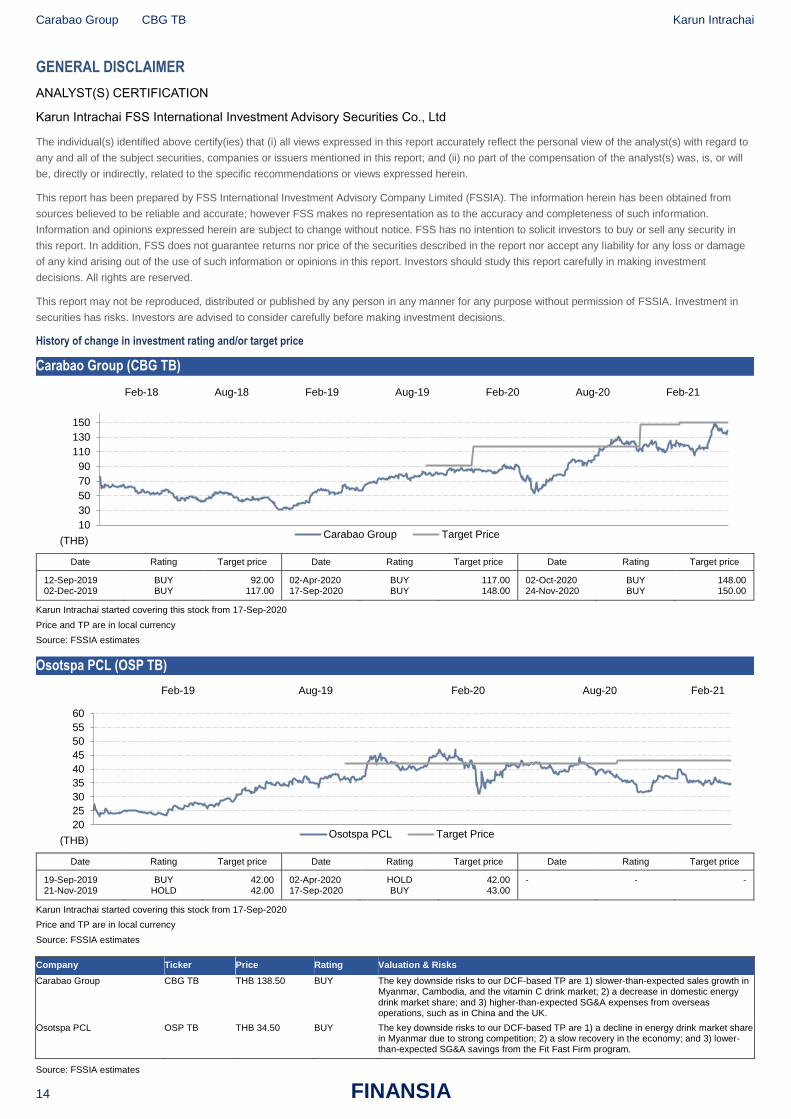
History of change in investment rating and/or target price
Carabao Group (CBG TB)
Date Rating Target price Date Rating Target price Date Rating Target price
12-Sep-2019 02-Dec-2019
BUY BUY
92.00 117.00
02-Apr-2020 17-Sep-2020
BUY BUY
117.00 148.00
02-Oct-2020 24-Nov-2020
BUY BUY
148.00 150.00
Karun Intrachai started covering this stock from 17-Sep-2020
Price and TP are in local currency
Source: FSSIA estimates
Osotspa PCL (OSP TB)
Date Rating Target price Date Rating Target price Date Rating Target price
19-Sep-2019 21-Nov-2019
BUY HOLD
42.00 42.00
02-Apr-2020 17-Sep-2020
HOLD BUY
42.00 43.00
- - -
Karun Intrachai started covering this stock from 17-Sep-2020
Price and TP are in local currency
Source: FSSIA estimates
Company Ticker Price Rating Valuation & Risks
Carabao Group CBG TB THB 138.50 BUY The key downside risks to our DCF-based TP are 1) slower-than-expected sales growth in Myanmar, Cambodia, and the vitamin C drink market; 2) a decrease in domestic energy drink market share; and 3) higher-than-expected SG&A expenses from overseas operations, such as in China and the UK.
Osotspa PCL OSP TB THB 34.50 BUY The key downside risks to our DCF-based TP are 1) a decline in energy drink market share in Myanmar due to strong competition; 2) a slow recovery in the economy; and 3) lower-than-expected SG&A savings from the Fit Fast Firm program.
Source: FSSIA estimates
10
30
50
70
90
110
130
150
ก.พ.-18 เม.ย.-18 ม.ิย.-18 ส.ค.-18 ต.ค.-18 ธ.ค.-18 ก.พ.-19 เม.ย.-19 มิ.ย.-19 ส.ค.-19 ต.ค.-19 ธ.ค.-19 ก.พ.-20 เม.ย.-20 มิ.ย.-20 ส.ค.-20 ต.ค.-20 ธ.ค.-20
(THB) Carabao Group Target Price
Feb-18 Aug-18 Feb-19 Aug-19 Feb-20 Aug-20 Feb-21
20
25
30
35
40
45
50
55
60
ต.ค.-18 ธ.ค.-18 ก.พ.-19 เม.ย.-19 มิ.ย.-19 ส.ค.-19 ต.ค.-19 ธ.ค.-19 ก.พ.-20 เม.ย.-20 ม.ิย.-20 ส.ค.-20 ต.ค.-20 ธ.ค.-20 ก.พ.-21
(THB) Osotspa PCL Target Price
Feb-19 Aug-19 Feb-20 Aug-20 Feb-21

Carabao Group CBG TB Karun Intrachai
15 FINANSIA
Additional Disclosures
Target price history, stock price charts, valuation and risk details, and equity rating histories applicable to each company rated in this report is available
in our most recently published reports. You can contact the analyst named on the front of this note or your representative at Finansia Syrus Securities
Public Company Limited
FSSIA may incorporate the recommendations and target prices of companies currently covered by FSS Research into equity research reports, denoted
by an „FSS‟ before the recommendation. FSS Research is part of Finansia Syrus Securities Public Company Limited, which is the parent company of
FSSIA.
All share prices are as at market close on 17-Feb-2021 unless otherwise stated.
RECOMMENDATION STRUCTURE
Stock ratings
Stock ratings are based on absolute upside or downside, which we define as (target price* - current price) / current price.
BUY (B). The upside is 10% or more.
HOLD (H). The upside or downside is less than 10%.
REDUCE (R). The downside is 10% or more.
Unless otherwise specified, these recommendations are set with a 12-month horizon. Thus, it is possible that future price volatility may cause a
temporary mismatch between upside/downside for a stock based on market price and the formal recommendation.
* In most cases, the target price will equal the analyst's assessment of the current fair value of the stock. However, if the analyst doesn't think the market
will reassess the stock over the specified time horizon due to a lack of events or catalysts, then the target price may differ from fair value. In most cases,
therefore, our recommendation is an assessment of the mismatch between current market price and our assessment of current fair value.
Industry Recommendations
Overweight. The analyst expects the fundamental conditions of the sector to be positive over the next 12 months.
Neutral. The analyst expects the fundamental conditions of the sector to be maintained over the next 12 months.
Underweight. The analyst expects the fundamental conditions of the sector to be negative over the next 12 months.
Country (Strategy) Recommendations
Overweight (O). Over the next 12 months, the analyst expects the market to score positively on two or more of the criteria used to determine market
recommendations: index returns relative to the regional benchmark, index sharpe ratio relative to the regional benchmark and index returns relative to
the market cost of equity.
Neutral (N). Over the next 12 months, the analyst expects the market to score positively on one of the criteria used to determine market
recommendations: index returns relative to the regional benchmark, index sharpe ratio relative to the regional benchmark and index returns relative to
the market cost of equity.
Underweight (U). Over the next 12 months, the analyst does not expect the market to score positively on any of the criteria used to determine market
recommendations: index returns relative to the regional benchmark, index sharpe ratio relative to the regional benchmark and index returns relative to
the market cost of equity.
Top Related
Copyright © 2022 FDOKUMEN

