


Bahasa
Halaman
Hukum


www.elsevier.com/locate/yexnr
Experimental Neurology
BSE and vCJD cause disturbance to uric acid levels
Tamuna Lekishvilia, Judyth Sassoona, Andrew R. Thompsetta, Alison Greenb,
James W. Ironsideb, David R. Browna,*
aDepartment of Biology and Biochemistry, University of Bath, Claverton Dow, Bath, BA2 7AY, UKbNational CJD Surveillance Unit, Western General Hospital, Edinburgh, EH4 2XU, Scotland
Received 22 April 2004; revised 9 June 2004; accepted 9 July 2004
Abstract
Bovine spongiform encephalopathy (BSE) and variant Creutzfeldt-Jakob disease (vCJD) are two new members of the family of
neurodegenerative conditions termed prion diseases. Oxidative damage has been shown to occur in prion diseases and is potentially
responsible for the rapid neurodegeneration that is central to the pathogenesis of these diseases. An important nonenzymatic antioxidant in
the brain is uric acid. Analysis of uric acid in the brain and cerebrospinal fluid (CSF) of cases of BSE and CJD showed a specific reduction in
CSF levels for both BSE and variant CJD, but not sporadic CJD. Further studies based on cell culture experiments suggested that uric acid in
the brain was produced by microglia. Uric acid was also shown to inhibit neurotoxicity of a prion protein peptide, production of the abnormal
prion protein isoform (PrPSc) by infected cells, and polymerization of recombinant prion protein. These findings suggest that changes in uric
acid may aid differential diagnosis of vCJD. Uric acid could be used to inhibit cell death or PrPSc formation in prion disease.
D 2004 Elsevier Inc. All rights reserved.
Keywords: Bovine spongiform encephalopathy; Creutzfeldt-Jakob disease; Nonenzymatic antioxidant
Introduction
Neuronal death is central to the fatal nature of prion
diseases (Prusiner, 1998). These diseases otherwise known
as transmissible spongiform encephalopathies include
Creutzfeldt-Jakob disease (CJD) (Bell and Ironside, 1993),
bovine spongiform encephalopathy (BSE) (Hope et al.,
1988), scrapie, and chronic wasting disease (Guiroy et al.,
1993). Particular interest in these diseases has been sparked
by the emergence of a variant of CJD (vCJD), which is
unlike the common form of this disease (sCJD) in that it has
been causally linked to BSE (Hill et al., 1997). Whether this
is true or not, there is quite a number of similarities between
these diseases. All prion diseases are characterized by the
deposition of an abnormal, protease-resistant isoform of the
prion protein (PrPc) in the central nervous tissue and some
0014-4886/$ - see front matter D 2004 Elsevier Inc. All rights reserved.
doi:10.1016/j.expneurol.2004.07.002
* Corresponding author. Fax: +44 1225 826 779.
E-mail address: [email protected] (D.R. Brown).
peripheral tissues (Head et al., 2004). This abnormal
isoform (PrPSc) is thought to be both the infectious agent
and the cause of neurodegeneration in the disease. Its
detection is central to diagnosis of prion disease. However,
this currently means that diagnosis can only be conclusive
following death (Kubler et al., 2003). As a result, there is
great interest in finding a marker for these diseases that
would serve diagnostic purposes before death and would
allow diagnosis before symptoms had progressed to the
point where the patient could not possibly recover.
The deposition in the brain of PrPSc does not cause
neuronal death without the expression by neurons of the
normal isoform, PrPc. This was first shown using a cell
culture model (Brown et al., 1994) and later confirmed
using tissue transplantation studies in mice (Brandner et al.,
1996). Recently, a conditional PrP-knockout model has
shown that, during the course of scrapie infection, switching
off PrPc expression halts the toxic effect of PrPSc and the
infected animal recovers (Mallucci et al., 2003). These
findings also imply an indirect element in the mechanism of
190 (2004) 233–244

T. Lekishvili et al. / Experimental Neurology 190 (2004) 233–244234
prion-induced neuronal death. This confirms previous
findings that showed oxygen radicals produced by PrPSc-
activated microglia trigger apoptosis in models of prion
disease (Brown et al., 1996a; Giese et al., 1998).
The current view of the mechanism of cell death in prion
disease is a complex one (Brown, 2002). There have been
many new theories in recent years, and there clearly is
much that needs to be resolved. However, there is now
overwhelming evidence that oxidative stress is a critical
trigger involved (Brown et al., 1996a; Guentchev et al.,
2000; Milhavet et al., 2000; Wong et al., 2001). It has been
shown previously that there is increased lipid oxidation in
both the CSF and brains of CJD patients (Arlt et al., 2002;
Wong et al., 2001). This suggests that there is either an
increase in oxidative substances in the brain or a reduction
in the ability of the brain’s antioxidant defense to deal with
oxidative stress. The implication is that regulating defense
against oxidative stress could be a viable method of
treatment for prion disease. It is therefore critical to begin
to understand more about changes in the inherent antioxi-
dants in the brain during prion disease. There has been
some investigation of cellular antioxidants in prion disease,
but currently, little is known about nonenzymatic antioxi-
dants. In the brain, the two main nonenzymatic antioxidants
are ascorbate and uric acid. Uric acid is a product of purine
metabolism and is also known to have antioxidant proper-
ties (Lopez-Torres et al., 1993). In nonprimates, the end
point of purine metabolism is allantoin, but in man, the
gene for urate oxidase is silent implying that the end point
is uric acid. Uric acid levels in man are much higher than in
other mammals, possibly as a result of this. In addition,
ascorbate in man can only be gained through the diet. In
comparison to ascorbate, uric acid is a more effective
antioxidant at lower concentrations (Spitsin et al., 2002).
Therefore, it is possible that uric acid has replaced
ascorbate as the main nonenzymatic antioxidant in the
human brain. It has been shown that ascorbate is reduced in
the CSF of CJD patients (Arlt et al., 2002). In parallel with
this, there was an increase in lipid peroxidation in the CSF
of CJD patients, but Vitamin E was unaffected. Although
uric acid has not been measured in prion diseases, it has
been suggested to be elevated in the CSF of patients with
other dementias (Degrell and Nicklasson, 1988) but is
probably decreased in Alzheimer disease (Tahgi et al.,
1993). In general, neurological conditions ranging from
stroke to meningitis are associated with increased CSF uric
acid levels (Stover et al., 1997). Whether this is beneficial
is unclear. In some studies of stroke patients, there is a
correlation between serum uric acid levels and the chance
of a good clinical outcome. Those with higher serum uric
acid levels showed lower levels of neurological impairment
(Chamorro et al., 2002). However, another study has
suggested the opposite (Weir et al., 2003). Despite this,
the majority of evidence suggests that having higher uric
acid levels might diminish the effects of neurodegenerative
disease.
We examine levels of uric acid in the brain and CSF of
BSE-infected cattle and humans with vCJD and sCJD. We
found reduction in uric acid levels specific for both vCJD
and BSE. In culture experiments, we found that the main
brain cell that produces uric acid was microglia. Application
of uric acid to in vitro test systems showed that uric acid
inhibited toxicity of a prion peptide, reduced the production
of PrPSc by infected cells, and inhibited prion protein
aggregation. These findings suggest that uric acid might
have a protective role in prion disease and that reduction of
uric acid might expose neurons to increased risk of cell
death. As uric acid levels can be elevated by dietary factors,
then altering uric acid might be beneficial to patients with
prion diseases.
Methods
Tissue samples
Human brain autopsy tissue samples from the National
CJD Surveillance Unit Brain Bank were obtained from
cases of sporadic and variant CJD in whom consent for use
of autopsy tissues for research had been obtained. Use of
this material has been approved by the Lothian Region
Ethics Committee. Some human CSF samples were
obtained from the University of Bern, Switzerland. Brain
and CSF samples from BSE-positive and BSE-negative
animals were obtained from the Veterinary Laboratories
Agency. Cows were orally challenged with 100 g BSE-
infected brain tissue. Samples were cut from the frontal lobe
of brains, snap-frozen, and shipped on dry ice and were
stored at �808C or prepared for assay in the following way.
Brain tissue samples of 0.5 g were homogenized in 5 ml of
PBS buffer (pH 7). The homogenized samples were then
disrupted 2 � 60 s using a sonicator. Aliquots, 1 ml, were
centrifuged in Eppendorf tubes at maximum speed in a MSE
Micro Centaur microfuge. Supernatants were then filtered
through a 0.22-Am syringe-driven MF membrane filter
(Millipore) and stored at �808C until required.
The majority of human CSF samples were obtained from
patients studied by the National CJD Surveillance Unit
(NCJDSU). CSF was available from 17 patients with variant
CJD [9 males, 8 females; aged 15 to 53 (meanF SD: 30.5F11.3) years at notification], 10 patients with sporadic CJD [7
males, 3 females; aged 50 to 84 (mean F SD: 64.7 F 10.5
years) at notification], and 17 control patients [9 males, 8
females; aged 18 to 85 (mean F SD: 45.6 F 19.5) years at
notification]. Of the 17 patients with vCJD, 14 met
published neuropathological criteria (Ironside, 1998), and
the remaining 3 were diagnosed with probable vCJD
according to the clinical criteria previously described (Will
et al., 2000). All 10 patients with sporadic CJD were
diagnosed according to established neuropathological cri-
teria (Kretzschmar et al., 1996). The control group consisted
of patients with suspected CJD referred to the NCJDSU in

T. Lekishvili et al. / Experimental Neurology 190 (2004) 233–244 235
whom the final diagnosis was not CJD. Of these 17 patients,
5 had neuropathological examination, 2 were found to have
no evidence of CJD but no alternative diagnosis was
identified, 1 patient had evidence of paraneoplastic ence-
phalitis, 1 patient had Alzheimer disease, and the remaining
patient had multiple sclerosis. Of the remaining 12 patients,
4 had dementia of unknown cause, 1 patient had Alzheimer
disease, 1 patient had cerebrovasculitis, 1 had Huntington
disease, 1 had an adverse drug reaction, and the diagnosis
was excluded in the remaining 4 patients. Reasons for
excluding the diagnosis of CJD included complete or partial
recovery or a prolonged or atypical clinical course with
either an alternative diagnosis probable on clinical grounds
or investigations suggestive of an alternative diagnosis. All
CSF samples were stored at �808C before analysis. All
samples were only identified by the CJD notification
number, and all analyses were undertaken blind to the
patients’ diagnostic category.
Determination of uric acid
Uric acid was measured using a Shimadzu LC-6A high-
performance liquid chromatographic (HPLC) system in
conjunction with a 20-Al sample loop, C-18 guard column,
and a C-18 analytical column (4.6 � 250 mm, ISCO). Peak
detection was carried out using a Shimadzu SPD-6AV
spectrophotometric detector configured in series with a
Bioanalytical systems CC-5 cross-flow thin-layer cell
(glassy carbon working electrode) coupled to a Petit
Ampere Potentiostat. Uric acid was detected with the
working electrode held at a potential of +800 mV versus
Ag/AgCl. The degassed mobile phase consisted of 50 mM
ammonium formate:methanol 95:5 at pH 4.0. Uric acid
peaks were also detected spectrophotometrically at 232 nm.
Quantification of uric acid was accomplished using standard
solutions, which were run before, during, and after the
analysis to verify the consistency of the chromatographic
method. Stock solutions of standards were prepared daily.
Enzymatic assays
Uric acid and urate oxidase (uricase) were measured
using Amplex Red-based assay kits (Molecular Probes).
Each of these assays depended on the generation of H2O2 in
the reaction which, in the presence of horseradish peroxi-
dase, reacts stoichiometrically with the Amplex Red reagent
(10-acetyl-3,7-dihydroxyphenoxazine) to generate the red-
fluorescent oxidation product, resorufin, having an absorp-
tion maximum at 563 nm. The intensity of the colored
product was measured using a plate reader (Techan,
Spectra).
Primary cell cultures
Cerebellar neuronal cultures were prepared from 6-day-
old 129SV mice (Harlen). Cultures were prepared as
described previously (Brown, 1999). Briefly, the cerebella
were dissociated in Hanks media (Sigma) containing 0.5%
trypsin (Sigma) and plated at 1–2 � 106 cells/cm2 in 24-well
trays (Falcon) coated with poly-d-lysine (50 Ag/ml, Sigma).
Cultures were maintained in Dulbecco minimal essential
media (Sigma) supplemented with 10% fetal calf serum and
1% antibiotics (penicillin, streptomycin) (Sigma). Cultures
were maintained at 378C with 5% CO2.
Mixed glial cultures were prepared from dissociating
cerebral cortices of newborn mice. Four to five cortices were
trypsinized in 0.05% trypsin (Sigma) and plated in a 75 cm2
culture flask (Falcon) in Dulbecco minimal essential
medium (Sigma) supplemented with 10% fetal calf serum
(Sigma) and 1% of antibiotic solution (penicillin, strepto-
mycin; Sigma). Cultures were maintained at 378C with 5%
CO2 for 14 days until glial cultures were confluent.
Microglia were dislodged into the medium and replated
in 24-well trays. Nonadhesive cells were removed after
15 min. This procedure produced pure microglial cultures
on the basis of morphology. Microglia were maintained
under the same conditions as for mixed glial cultures.
Astrocytes were purified by taking the remaining
adhesive cells from mixed cultures and trypsinizing. The
cells were preplated for 30 min to remove contaminating
microglia. Then astrocytes remaining in the medium were
collected and plated for 2 h at 104 cells per well into 24-well
trays, after which time the medium was replaced to remove
less-adhesive contaminating cells. Purified astrocytes were
maintained under the conditions described for mixed glial
cultures.
Purity of cultures was determined as previously
described (Brown, 1999; Brown et al., 1996b; Daniels and
Brown, 2001). Parallel wells to experimental wells con-
tained circular coverslips onto which the cells were plated.
Cells were fixed with 4% paraformaldehyde and stained
with each of the following primary antibodies: NeuN
(mouse; Chemicon), anti-glial fibrillary acid protein (anti-
GFAP, rabbit; Daco), or ferratin (Sigma). NeuN labels
neuronal cells, anti-GFAP labels astrocytes, and antiferratin
labels microglia. Secondary antibodies conjugated to FITC
(mouse; Daco) were used to detect labeled cells. Cells were
examined using fluorescence microscopy (Leitz). Only
cultures with greater than 90% purity were used.
For the assessment of uric acid levels, the enzymatic
assay was used. Cultured cells were maintained in culture
for up to 4 days following medium change. Cell culture
medium was collected from the cells at either 1, 2, 3, or 4
days after this. The medium was cleared by centrifugation
(14,000 rpm). At the same time, cells were also collected to
determine cellular uric acid levels. The cells were washed
with three changes of medium and then lysed by addition of
100 Al of double distilled water and physical disruption with
a cell scraped. The collected material was centrifuged to
remove cellular debris. Protein levels in the cellular super-
natant was determined using a BCA assay (sigma) accord-
ing to the manufacturer’s instructions.

T. Lekishvili et al. / Experimental Neurology 190 (2004) 233–244236
Cell lines
F14 and F21 fusion cell lines were produced by fusing a
neuroblastoma cell line with cerebellar neurons from PrP-
knockout mice and were as previously described (Holme et
al., 2003). These cells were maintained in the same medium
as for neurons and astrocytes. For experiments, the cells
were plated into 24-well trays at 30% confluency.
SMB and SMB-PS cells were derived from the brain of a
scrapie-infected mouse. The mouse had been infected with
the Chandler strain of scrapie (Clarke and Haig, 1970). The
resulting cell line was recently cured of the infection by the
use of pentosan sulfate (Birkett et al., 2001) to generate an
uninfected cell line that served as an appropriate control.
The cells were maintained at 378C and 5% CO2 in DMEM
medium contain 10% fetal calf serum and 5% newborn calf
serum with 1% antibiotics (penicillin/streptomycin).
Levels of uric acid in these cell lines was determined in
the same way as for primary cell cultures.
Toxicity assay
Cerebellar neurons were prepared as described above and
plated in 24-well trays. The peptide PrP106-126 was applied
at 80 AM with or without cotreatment with uric acid.
PrP106-126 was prepared as previously described (Brown
et al., 1996a). PrP106-126 had the amino acid sequence
KTNMKHMAGAAAAGAVVGGLG. The peptide was
solubilized in dimethyl sulfoxide (DMSO) at 50 mM and
applied to the culture wells directly. An equivalent amount
of vehicle was added to the control wells. The peptide was
applied as a single dose at the same time as uric acid. Uric
acid was also applied to similar cultures in the absence of
the peptide. Uric acid on its own had no effect on cell
survival (data not shown).
After 4-day treatment, the survival of the cerebellar cells
was determined. MTT (3, [4,5 dimethylthiazol-2-yl]-2,5
diphenyltetrazolium bromide; Sigma) was diluted to 200 AMin Hanks solution and added to cultures for 30 min at 378C.The MTT formazan product was released from cells by
addition of dimethyl sulfoxide (Sigma) and measured at
570 nm in a spectrophotometer (Bio50, Cary). Relative
survival in comparison to control treated with the DMSO
vehicle could then be determined.
Assay of protease resistant PrP
SMB cells were plated at 50% confluency per well in 6-
well plates. Cells were left for 24 h to allow for attachment.
The medium was then replaced with fresh medium
containing the appropriate dilution of uric acid. Uric acid
was reapplied 2 days after this treatment. Four days after the
initial treatment, the medium was removed and the protein
extracted. Cells were lysed in PBS containing 1% Triton-X
100, 1% Igepal CA-630 for 20 min at 378C. Cell lysateswere either placed on ice or treated with 80 Ag/ml proteinase
K for 1 h at 378C. Proteins were concentrated from the total
cell lysate by methanol precipitation and the protein pellet
resuspended and denatured by boiling for 5 min in 8 M urea.
Samples were electrophoresed on a 12% acrylamide gel and
transferred electrophoretically to PVDF membrane (Immo-
bilon-P, Millipore). PrP was detected using the primary
antibody DR1, as previously described (Brown, 2000), and
an HRP conjugated secondary antibody (Daco). Specific
protein bands were visualized using ECL Plus chemilumi-
nescent reagent (Amersham Pharmacia Biotech) followed
by autoradiography. Autoradiographs were analyzed using
Scion Image densitometric software (Scion Corporation).
Polymerization assay
All measurements were performed on a Cary 100Bio
UV-Visible spectrophotometer at 325 nm using a quartz
cuvette of 5-mm path length. Recombinant mouse PrP was
generated as previously described (Brown et al., 2000). The
assay was based on the ability of fibrillar recombinant PrP
(the seed) to initiate polymerization of soluble monomeric
recombinant PrP (substrate). Substrate recombinant mouse
PrP (rPrP) was refolded in the absence of metal ions, and the
seed for aggregation was aged manganese refolded recombi-
nant mouse PrP (MnPrP) prepared as previously described
(Brown et al., 2000). Briefly, a seed of MnPrP induces
immediate aggregation of substrate PrP, observed as an
increase in solution turbidity. The resultant scattering of UV
light at 325 nm results in an increased absorbance measure-
ment. The abilities of compounds to prevent this turbidity
increase were measured, and the results were expressed as a
percentage of the turbidity observed with a vehicle control.
PrP (50 Ag) and the test compound were preincubated in 500
Al H2O pH 6.5 for 30 min to provide a zero for the
measurement. MnPrP (10 Ag) seed from a 400-Ag ml�1
stock was added to the drug/rPrP mixture, and an initial
reading was obtained immediately. A second reading was
measured after 5 min, and the increase in absorbance over
5 min was recorded.
Results
CSF uric acid is reduced in prion disease
Uric acid is one of the major soluble nonenzymatic
antioxidants in the brain. We examined the levels of uric
acid in both the brain and CSF of patients with CJD, vCJD
and cattle with BSE using an HPLC-based system linked to
an electrochemical detector. Fig. 1A shows the levels of uric
acid in the CSF collected from field cases of BSE as
compared to controls (n = 10 for both). The range of values
was 0.9–1.5 AM for controls and 0.5–1.0 AM for BSE
samples. Uric acid in the CSF of BSE cases was
significantly (Student t test P b 0.05) lower than in controls.
Similar analysis was carried out on samples of frontal cortex

Fig. 2. Uric acid in human samples from patients with neurological
conditions. Uric acid levels were assessed using an HPLC coupled to an
electrochemical detector. (A) CSF from various neurological conditions
(normal, n = 6; Alzheimer, n = 4; Parkinson, n = 6; BBB = blood–brain
barrier disorder, n = 5). (B) CSF from vCJD and sCJD; (C) Frontal cortex
of vCJD and sCJD. Shown are the mean and SE for five patients per group.
Fig. 1. Uric acid in BSE field cases. Uric acid levels were assessed using
an HPLC coupled to an electrochemical detector. (A) CSF, (B) frontal
cortex. Shown are the mean and SE for 10 samples each in A and 4
samples each in B.
T. Lekishvili et al. / Experimental Neurology 190 (2004) 233–244 237
from BSE-positive cattle compared to controls. Fig. 1B
shows that uric acid in frontal cortex was reduced in BSE.
In humans, uric acid is the end product of purine
metabolism and is excreted from the body. However,
humans are unable to express uricase (urate oxidase), an
enzyme that converts uric acid to allantoin. Allantoin is the
normal end product of purine metabolism in most mammals,
and allantoin is excreted in cattle. Uricase is poorly
expressed in the brain. Nevertheless, there is a possibility
that the differences measured in BSE and control bovine
samples are a result of differences in uricase activity. Using
an Amplex Red kit, uricase was measured in bovine liver at
47.4 F 5.0 U/mg protein (four samples). Using the same
assay, uricase was undetectable in either the CSF or frontal
cortex of any bovine samples (four samples each).
Uric acid levels were also measured in the CSF from
patients with various neurological diseases and compared to
that of normal patients. As can be seen in Fig. 2A, uric acid
levels were significantly (P b 0.05) decreased in some
disorders such as Alzheimer disease and Parkinson disease
but increased in disorders that effect the blood–brain barrier.
Further analyses of samples from either sCJD or vCJD were
carried out in comparison to control samples from patients
with other neurological disorders (diagnoses included
dementia with Lewy bodies, astrocytosis, and arterioscle-
rosis) and shown in Fig. 2B. The values are shown for both
male and female because women usually have lower uric
acid levels than men. The controls of Fig. 2B (n = 16
averaging both sexes) showed an average of 34.8 F 4.5 AMand were not significantly different from those of normal
patients (36.0 F 2 AM, n = 6, three males and three
females). Fig. 2B shows the range of values. Patients with
sCJD (male = 37.9 F 4.9 AM, female = 31.0 F 3.5 AM) did
not show any significant change in uric acid levels
compared to controls (male = 40.8 F 5.6 AM, female =
26.4 F 4.2 AM). However, cases of vCJD showed a

T. Lekishvili et al. / Experimental Neurology 190 (2004) 233–244238
significant (P b 0.05) reduction in the levels of uric acid
(male = 22.2 F 2.2 AM, female = 17.4 F 2.5 AM). The
implication is that vCJD, unlike sCJD, causes a decrease in
CSF uric acid levels.
Uric acid levels in samples of frontal cortex of patients
with vCJD and sCJD were measured and compared to those
with other dementias (as for CSF). There was no significant
difference in uric levels between any of the groups (Fig. 2C).
The results suggest that BSE and vCJD are similar in that
both diseases show a decrease in CSF uric acid. Reduction
of uric acid levels in bovine brain in any disease has not
previously been reported. Therefore, this finding is worthy
of further investigation. Spectrophotometric-based enzy-
matic assays for uric acid are commercially available. The
sensitivity of such an assay was compared to that detected
using HPLC and electrochemical detection using uric acid at
concentrations found in CSF (Figs. 3A and B). As can be
seen, both assays showed the same range of sensitivity. This
implies that an enzymatic assay could be used to detect uric
acid in CSF. Samples of CSF from cattle orally challenged
with BSE were tested in both assays. These were compared
to unchallenged age-matched controls. These experimental
BSE-challenged animals were sampled at various times after
the date of challenge. Analyses of these samples by HPLC
analysis (Fig. 3C) gave information on changes in uric acid
levels of CSF during the time course of BSE. These
measurements therefore indicated the levels of uric acid in
BSE-challenged cattle before and after the onset of BSE
Fig. 3. Uric acid levels in a BSE time course. Sensitivity of the HPLC-electr
concentration curve (n = 3). The curve for the HPLC method (A) was similar to th
levels in bovine CSF from BSE orally challenge cattle (C, D). The enzymatic assay
the HPLC-based assay of the whole time course (C). BSE-infected animals (.) we
assessed for each time point except the final time point which was for three anima
challenged animals.
symptoms. For each of the four time points, four challenged
and four unchallenged animals were sampled. Animals had
begun to show early symptoms of BSE before the third time
point and had either early or full clinical signs by the last
time point. BSE was confirmed in these animals following
autopsy. The results indicate a significant (P b 0.05)
reduction in uric acid levels in BSE-challenged animals
before the development of symptoms. This reduction
continued through the rest of the course of the disease at
the time points monitored. The enzymatic uric acid assay
was used to confirm this finding by comparing the 3-month
and 29-month time points (Fig. 3D).
Uric acid levels in bovine frontal cortex were also assessed
for experimental BSE over a similar time course using the
enzymatic assay. The results are shown in Fig. 4. Uric acid
levels in frontal cortex began to be significantly lower from
18 months onwards. This result suggests that changes in uric
acid levels are an early change in the disease process.
Cellular release of uric acid
Little is known about which cells produce and release
uric acid in the brain. Cell culture experiments were
undertaken to determine which cells in the brain produce
the most uric acid and determine how PrPc expression
influences uric acid expression levels. Primary cultures of
cerebellar neurons, purified microglia, and purified astro-
cytes were produced from wild-type mice and maintained in
ochemical detector was compared to that of an enzymatic assay using a
at for the enzymatic assay (B). Both assays were used to measure uric acid
of the 3-month and 29-month time points (D) gave similar measurements to
re compared to unchallenged, age-matched controls (o). Four animals were
ls only. In D, open bars are the control animals, and black bars are the BSE-
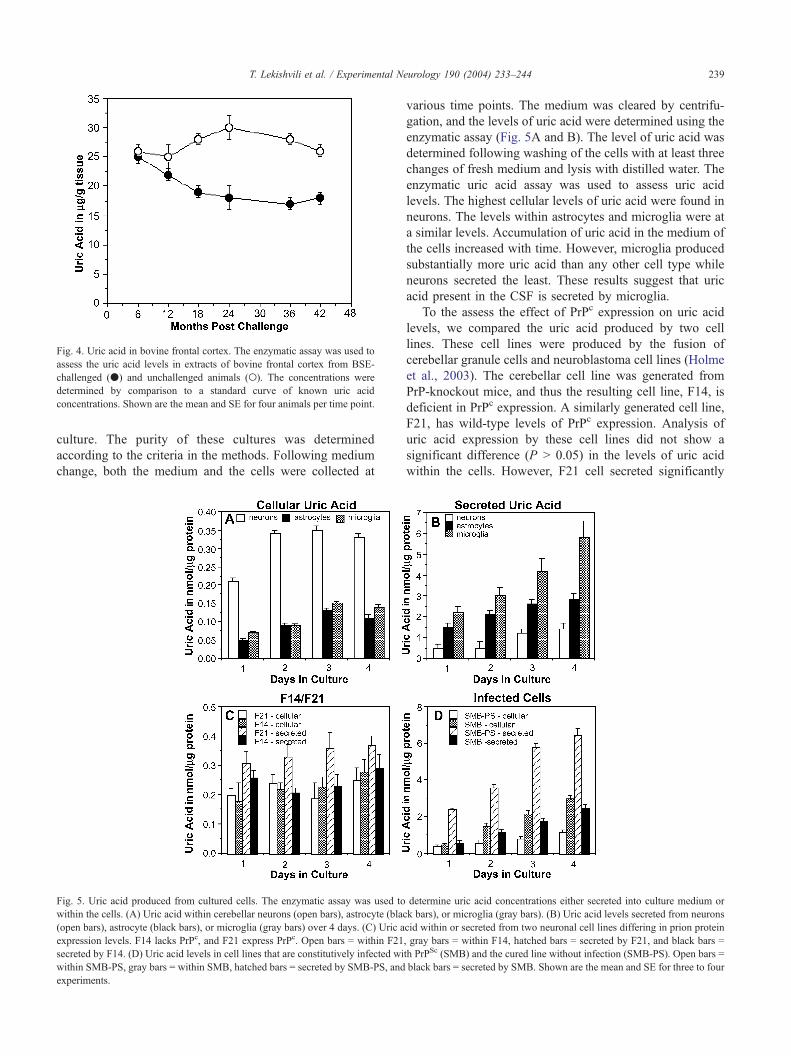
Fig. 4. Uric acid in bovine frontal cortex. The enzymatic assay was used to
assess the uric acid levels in extracts of bovine frontal cortex from BSE-
challenged (.) and unchallenged animals (o). The concentrations were
determined by comparison to a standard curve of known uric acid
concentrations. Shown are the mean and SE for four animals per time point.
T. Lekishvili et al. / Experimental Neurology 190 (2004) 233–244 239
culture. The purity of these cultures was determined
according to the criteria in the methods. Following medium
change, both the medium and the cells were collected at
Fig. 5. Uric acid produced from cultured cells. The enzymatic assay was used to
within the cells. (A) Uric acid within cerebellar neurons (open bars), astrocyte (blac
(open bars), astrocyte (black bars), or microglia (gray bars) over 4 days. (C) Uric a
expression levels. F14 lacks PrPc, and F21 express PrPc. Open bars = within F21
secreted by F14. (D) Uric acid levels in cell lines that are constitutively infected wi
within SMB-PS, gray bars = within SMB, hatched bars = secreted by SMB-PS, and
experiments.
various time points. The medium was cleared by centrifu-
gation, and the levels of uric acid were determined using the
enzymatic assay (Fig. 5A and B). The level of uric acid was
determined following washing of the cells with at least three
changes of fresh medium and lysis with distilled water. The
enzymatic uric acid assay was used to assess uric acid
levels. The highest cellular levels of uric acid were found in
neurons. The levels within astrocytes and microglia were at
a similar levels. Accumulation of uric acid in the medium of
the cells increased with time. However, microglia produced
substantially more uric acid than any other cell type while
neurons secreted the least. These results suggest that uric
acid present in the CSF is secreted by microglia.
To the assess the effect of PrPc expression on uric acid
levels, we compared the uric acid produced by two cell
lines. These cell lines were produced by the fusion of
cerebellar granule cells and neuroblastoma cell lines (Holme
et al., 2003). The cerebellar cell line was generated from
PrP-knockout mice, and thus the resulting cell line, F14, is
deficient in PrPc expression. A similarly generated cell line,
F21, has wild-type levels of PrPc expression. Analysis of
uric acid expression by these cell lines did not show a
significant difference (P N 0.05) in the levels of uric acid
within the cells. However, F21 cell secreted significantly
determine uric acid concentrations either secreted into culture medium or
k bars), or microglia (gray bars). (B) Uric acid levels secreted from neurons
cid within or secreted from two neuronal cell lines differing in prion protein
, gray bars = within F14, hatched bars = secreted by F21, and black bars =
th PrPSc (SMB) and the cured line without infection (SMB-PS). Open bars =
black bars = secreted by SMB. Shown are the mean and SE for three to four
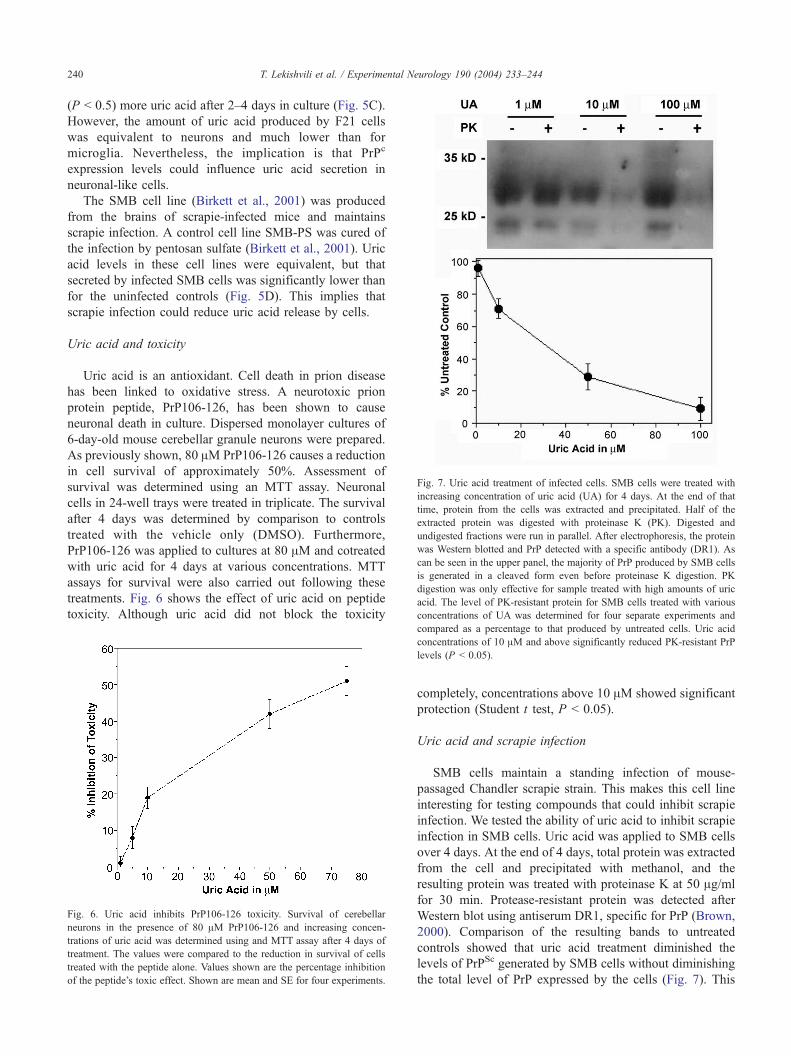
Fig. 7. Uric acid treatment of infected cells. SMB cells were treated with
increasing concentration of uric acid (UA) for 4 days. At the end of that
time, protein from the cells was extracted and precipitated. Half of the
extracted protein was digested with proteinase K (PK). Digested and
undigested fractions were run in parallel. After electrophoresis, the protein
was Western blotted and PrP detected with a specific antibody (DR1). As
can be seen in the upper panel, the majority of PrP produced by SMB cells
is generated in a cleaved form even before proteinase K digestion. PK
digestion was only effective for sample treated with high amounts of uric
acid. The level of PK-resistant protein for SMB cells treated with various
concentrations of UA was determined for four separate experiments and
T. Lekishvili et al. / Experimental Neurology 190 (2004) 233–244240
(P b 0.5) more uric acid after 2–4 days in culture (Fig. 5C).
However, the amount of uric acid produced by F21 cells
was equivalent to neurons and much lower than for
microglia. Nevertheless, the implication is that PrPc
expression levels could influence uric acid secretion in
neuronal-like cells.
The SMB cell line (Birkett et al., 2001) was produced
from the brains of scrapie-infected mice and maintains
scrapie infection. A control cell line SMB-PS was cured of
the infection by pentosan sulfate (Birkett et al., 2001). Uric
acid levels in these cell lines were equivalent, but that
secreted by infected SMB cells was significantly lower than
for the uninfected controls (Fig. 5D). This implies that
scrapie infection could reduce uric acid release by cells.
Uric acid and toxicity
Uric acid is an antioxidant. Cell death in prion disease
has been linked to oxidative stress. A neurotoxic prion
protein peptide, PrP106-126, has been shown to cause
neuronal death in culture. Dispersed monolayer cultures of
6-day-old mouse cerebellar granule neurons were prepared.
As previously shown, 80 AM PrP106-126 causes a reduction
in cell survival of approximately 50%. Assessment of
survival was determined using an MTT assay. Neuronal
cells in 24-well trays were treated in triplicate. The survival
after 4 days was determined by comparison to controls
treated with the vehicle only (DMSO). Furthermore,
PrP106-126 was applied to cultures at 80 AM and cotreated
with uric acid for 4 days at various concentrations. MTT
assays for survival were also carried out following these
treatments. Fig. 6 shows the effect of uric acid on peptide
toxicity. Although uric acid did not block the toxicity
Fig. 6. Uric acid inhibits PrP106-126 toxicity. Survival of cerebellar
neurons in the presence of 80 AM PrP106-126 and increasing concen-
trations of uric acid was determined using and MTT assay after 4 days of
treatment. The values were compared to the reduction in survival of cells
treated with the peptide alone. Values shown are the percentage inhibition
of the peptide’s toxic effect. Shown are mean and SE for four experiments.
compared as a percentage to that produced by untreated cells. Uric acid
concentrations of 10 AM and above significantly reduced PK-resistant PrP
levels (P b 0.05).
completely, concentrations above 10 AM showed significant
protection (Student t test, P b 0.05).
Uric acid and scrapie infection
SMB cells maintain a standing infection of mouse-
passaged Chandler scrapie strain. This makes this cell line
interesting for testing compounds that could inhibit scrapie
infection. We tested the ability of uric acid to inhibit scrapie
infection in SMB cells. Uric acid was applied to SMB cells
over 4 days. At the end of 4 days, total protein was extracted
from the cell and precipitated with methanol, and the
resulting protein was treated with proteinase K at 50 Ag/ml
for 30 min. Protease-resistant protein was detected after
Western blot using antiserum DR1, specific for PrP (Brown,
2000). Comparison of the resulting bands to untreated
controls showed that uric acid treatment diminished the
levels of PrPSc generated by SMB cells without diminishing
the total level of PrP expressed by the cells (Fig. 7). This

T. Lekishvili et al. / Experimental Neurology 190 (2004) 233–244 241
implies that uric acid has a strong effect decreasing the
levels of protease-resistant protein generated by SMB cells.
Uric acid and prion protein polymerization
A polymerization assay was used to assess the effect of
uric acid on aggregation of recombinant prion protein.
Recombinant mouse prion protein was generated in two
forms. The first was a soluble form and the second was an
aggregated form, rich in h-sheet structure and protease-
resistant. The second was generated by refolding the protein
in the presence of manganese (Brown et al., 2000). This
second form of PrP was used to bseedQ the polymerization of
soluble PrP. The progress of the reaction could be assessed
using a spectrophotometer with and without addition of uric
acid (Fig. 8A). It was found that there was a dose-dependent
effect of uric acid that limited the extent of this polymeri-
Fig. 8. Uric acid and PrP polymerization. (A) Time course of a single
polymerization assay from the point of addition of seeding protein. Baseline
for the unpolymerized substrate protein is determined before addition of
seeding protein. Addition of seed has no effect on the baseline of the
spectrophotometric absorbance. Uric acid is added to the assay before
addition of seed. The light line indicates the change in absorbance on
addition of the seed protein without uric acid. The dark line is the same
reaction in the presence of 100 AM uric acid. (B) Dose response of PrP
polymerization to the presence of uric acid. Uric acid was added to the
polymerization assay at the concentrations indicated and the extent of
polymerization measured. This was compared to a parallel assay where uric
acid was not added. The percentage inhibition of polymerization was then
determined. Shown are the mean and SE of four separate assays.
zation (Fig. 8B). Uric acid showed a significant effect at 10
AM and above (P b 0.05). In comparison, folic acid at 100
AM did not have this effect (data not shown).
Discussion
The findings described here support the notion that the
CSF level of uric acid is decreased in the two novel prion
diseases, BSE and vCJD. Uric acid is now accepted as a
major nonenzymatic antioxidant. As there have been
numerous reports suggesting that oxidative damage occurs
in prion disease (Guentchev et al., 2000; Milhavet et al.,
2000; Wong et al., 2001), the finding that a particular
antioxidant is decreased is quite significant. Other human
neurodegenerative orders that are also characterized by
oxidative damage have also been reported to show decreases
in CSF uric acid (Stover et al., 1997). This means that
decreased uric acid levels are not specific to prion diseases
and could not be used to diagnose them on their own.
Nevertheless, vCJD levels were the lowest observed in this
study, and in comparison to vCJD levels, sCJD levels were
not depressed. As demonstrated in this study, a simple
commercial assay can be used for assessing uric acid levels
in CSF. Therefore, it is possible, subject to further
confirmation, that a uric acid assay could be used in parallel
with other diagnostic tests. This does not imply that uric acid
could diagnose vCJD as uric acid levels were also decreased
in Parkinson and Alzheimer diseases (Fig. 2). However, as
the majority of vCJD patients are not in the age group
susceptible to these diseases, then this assay used in
conjunction with other current diagnostic tools might be
beneficial in reaching an earlier diagnosis. CSF levels of
various proteins and other molecules have been assessed
previously to determine if any molecule could be used as a
marker for prion disease. Such molecules include ascorbic
acid (Arlt et al., 2002), 14-3-3 (Zerr et al., 2000; Laplanche et
al., 2000), tau (Clark et al., 2003), and S100 (Beaudry et al.,
1999). Of these, only 14-3-3 has any repeatable correlation
with diagnosis of CJD (Van Everbroeck et al., 2003).
Uric acid levels are influenced by diet, especially levels
of meat (Loenen et al., 1990). Although CSF levels are
lower than in serum, both have been seen to be affected by
diet (Reiber et al., 1993). This implies that the diets of
patients with neurodegenerative conditions would have to
be closely monitored if uric acid levels were to be studied.
As this information is not available for the patients of this
study, it is unknown how differences in patient diets might
have affected the results in this study.
Independently of the findings for human disease,
analyses of CSF from BSE-challenged cows suggested that
changes in uric acid levels not only occur as a result of BSE
challenge but also are manifest before onset of neurological
symptoms of the disease. The implication of this finding is
that changes in uric acid levels are a potential surrogate
marker for BSE. Little is known about uric acid levels in

T. Lekishvili et al. / Experimental Neurology 190 (2004) 233–244242
cattle and the factors that affect its secretion into the CSF.
Therefore, there is no information about other diseases of
cattle that might decrease uric acid levels.
Little is known about the role of uric acid in the brain,
apart from its potential as an antioxidant. Indeed, it is
unclear which cells secrete uric acid, the mechanism of
secretion, and its regulation. Our findings suggest that the
most uric acid is secreted by glial cells. This is logical given
that glia are known to have a protective role in many
experimental systems. High uric acid levels have been
associated with gliosis (O’Neill and Lowry, 1995), support-
ing our suggestion that uric acid in the CSF is produced by
glia. In particular, we have shown that microglia produce the
most uric acid. During respiratory burst activity, microglia
can produce large amounts of oxygen radicals. Coproduc-
tion of uric acid might protect them from their own toxic by-
products. In prion disease, microglia proliferate (Giese et al.,
1998). Therefore, it would seem logical to assume that uric
acid levels would increase in the brain in proportion to the
increase in microglia. As this was not observed, then it is
likely that uric acid production by microglia is inhibited in
both vCJD and BSE.
The second part of this study was to assess the potential
of uric acid to inhibit or reduce characteristics of prion
diseases, namely, cell death, generation of PrPSc, and protein
aggregation. Our findings indicate that uric acid inhibits the
toxicity of a prion protein peptide, PrP106-126. This is not
surprising as it has been shown before that antioxidants
inhibit the toxicity of this peptide (Brown et al., 1996a).
Uric acid has been shown to protect neurons in culture from
glutamate toxicity and reduce the neuronal damage resulting
from ischemic insult (Yu et al., 1998). Uric acid also
inhibited both the formation of PrPSc and the aggregation of
recombinant protein. Interestingly, the level of uric acid that
has these protective effects is equivalent to that found in
humans without neurological disease.
The most interesting of these findings is the potential of
uric acid to decrease the formation of PrPSc by permanently
infected cells. Currently, a number of compounds have been
shown to inhibit production in infected cells (Birkett et al.,
2001; Peretz et al., 2001; Rudyk et al., 2000; Supattapone
et al., 2001). However, this is the first time that a compound
actually present in the brain has been shown to decrease the
levels of PrPSc. The implication of these findings is that
drugs that increase uric acid production in the brain could
potentially be a valuable resource for treatment of these
diseases. Furthermore, diet has been shown to increase uric
acid levels (Brule et al., 1992). Therefore, altering patients’
diet by, for example, increasing their meat intake could help
the treatment of prion diseases.
Despite this, uric acid was unable to completely block
polymerization or PrPSc formation. At the lowest concen-
tration detected in humans (17.4 AM), uric acid was able to
block formation of PrPSc by 40% and inhibit PrP polymeri-
zation by 30% (see Figs. 7 and 8). Therefore, uric acid at
this concentration would not inhibit prion disease in the
brain. However, this effect of uric acid was from exogenous
application, applied above that produced by the cells (see
Fig. 5). The levels of uric acid in the human brain might
have an inhibitory effect, and if there was no uric acid
present, the progression of vCJD might be more rapid.
Although there is currently no evidence that the normal
human levels of uric acid diminish the severity of prion
disease, a small increase in uric acid levels could be
beneficial. In our assay, 10 AM uric acid does have an
inhibitory effect. Therefore, if uric acid levels in vCJD
patients were raised from 17 to 27 AM or higher then, as
suggested by our in vitro assays, the patients might have an
improved prognosis.
Although we have shown a potential for uric acid to be
protective against characteristics of prion disease, our results
do not indicate the possible mechanism by which uric acid
levels are decreased in prion disease. Both PrPSc-infected
cell and cells not expressing PrP have reduced levels of uric
acid production. Potentially, the production of PrPSc could
inhibit or reduce purine metabolism or inhibit one of the
component enzymes such as xanthine oxidase. However, the
reduction of uric acid levels in vCJD, but not sCJD,
suggests that there are specific effects. Whatever the cause,
the mechanism of uric acid production in the brain and its
regulation in both health and disease requires further
investigation. In addition, although uric acid has been
assessed to be a major brain antioxidant, it is also known
that high uric acid levels have other effects that might
complicate any treatment based on elevating uric acid
levels. These other effects include inhibition of Na/K
ATPase activity (Bavaresco et al., 2004), induction of the
release of proinflammitory proteins (Ryckman et al., 2004),
and stimulation of the release of nitric oxide from macro-
phages (Jaramillo et al., 2004).
Many studies have looked at the correlation between uric
acid levels and neurological disease. Most of these studies
have looked at serum levels. As serum levels are consid-
erably different to those of the CSF, it is unclear as to
weather such studies indicate what uric acid is doing to the
brain. Some reports concerning serum uric acid levels in
stoke patients have suggested that elevated levels may not
be protective (Weir et al., 2003) or deleterious (Kanellis and
Johnson, 2003) or are associated with higher risk of cardiac-
related death following stroke (Wong et al., 2002). There
has been a reported correlation between serum urate levels
and stroke in diabetics (Lehto et al., 1998). In contrast, other
studies suggest that stroke victims with high serum urate are
more likely to make a good recovery from stroke (Chamorro
et al., 2002). It is possible that increased uric acid levels in
stroke patients are a result of a protective response in those
likely to have a stroke rather than something causative. The
true value of elevated uric acid levels in neurological
conditions needs further investigation.
In summary, we have shown a reduction in uric acid
produced by the brain and particularly the CSF in BSE and
vCJD, but not sCJD. This finding further supports the

T. Lekishvili et al. / Experimental Neurology 190 (2004) 233–244 243
notion of a similarity between vCJD and BSE. In addition,
the finding that an antioxidant is reduced in these diseases
further supports the notion that deregulation of defense
against oxidative stress is important in prion diseases.
Potentially, increasing production of uric acid by microglia
in the brain could diminish some of the resulting neuronal
damage that occurs in prion disease, either by a direct
antioxidant effect or by the inhibition of PrPSc formation.
The link between uric acid levels and diet should be
considered as a possible means to increase uric acid levels in
patients with prion diseases.
Acknowledgments
The authors thank Dr. J.-M. Burgunder (University of
Bern) for CSF from normal patients and some of the CSF
samples from patients with neurological conditions other
than CJD. Also thanks to the Veterinary Laboratories
Agency at Weybridge for bovine samples. DRB is supported
by a senior fellowship from the BBSRC of the UK. The
research was supported by a grant from DEFRA of the UK
(SE1774). Thanks to Kay Sinclair for proofreading the
manuscript.
References
Arlt, S., Kontush, A., Zerr, I., Buhmann, C., Jacobi, C., Schrfter, A., Poser,S., Beisiegel, U., 2002. Increase lipid peroxidation in cerebrospinal
fluid and plasma from patients with Creutzfeldt-Jakob disease. Neuro-
biol. Dis. 10, 150–156.
Bavaresco, C.S., Zugno, A.I., Tagliari, B., Wannmacher, C.M., Wajner, M.,
Wyse, A.T., 2004. Inhibition of Na+, K+-ATPase activity in rat striatum
by the metabolites accumulated in Lesch-Nyhan disease. Int. J. Dev.
Neurosci. 22, 11–17.
Beaudry, P., Cohen, P., Brandel, J.P., Delasnerie-Laupretre, N., Richard, S.,
Launay, J.M., Laplanche, J.L., 1999. 14-3-3 Protein, neuron-specific
enolase, and S-100 protein in cerebrospinal fluid of patients with
Creutzfeldt-Jakob disease. Dement. Geriatr. Cogn. Disord. 10, 40–46.
Bell, J.E., Ironside, J.W., 1993. Neuropathology of spongiform encepha-
lopathies in humans. Br. Med. Bull. 49, 738–777.
Birkett, C.R., Hennion, R.M., Bembridge, D.A., Clarke, M.C., Chree, A.,
Bruce, M.E., Bostock, C.J., 2001. Scrapie strains maintain biological
phenotypes on propagation in a cell line in culture. EMBO J. 20,
3351–3358.
Brandner, S., Isenmann, S., Raeber, A., Fischer,M., Sailer, A., Kobayashi, Y.,
Marino, S., Weissmann, C., Aguzzi, A., 1996. Normal host prion protein
necessary for scrapie-induced neurotoxicity. Nature 379, 339–343.
Brown, D.R., 1999. Prion protein peptide neurotoxicity can be mediated by
astrocytes. J. Neurochem. 73, 1105–1113.
Brown, D.R., 2000. PrPSc-like prion protein peptide inhibits the function of
cellular prion protein. Biochem. J. 252, 511–518.
Brown, D.R., 2002. Mayhem of the multiple mechanisms: modelling
neurodegeneration in prion disease. J. Neurochem. 82, 209–215.
Brown, D.R., Herms, J., Kretzschmar, H.A., 1994. Mouse cortical cells
lacking cellular PrP survive in culture with a neurotoxic PrP fragment.
NeuroReport 5, 2057–2060.
Brown, D.R., Schmidt, B., Kretzschmar, H.A., 1996a. Role of microglia
and host prion protein in neurotoxicity of a prion protein fragment.
Nature 380, 345–347.
Brown, D.R., Schmidt, B., Kretzschmar, H.A., 1996. A neurotoxic prion
protein fragment enhances proliferation of microglia but not astrocytes
in culture. Glia 18, 59–67.
Brown, D.R., Hafiz, F., Glasssmith, L.L., Wong, B.-S., Jones, I.M., Clive,
C., Haswell, S.J., 2000. Consequences of manganese replacement of
copper for prion protein function and proteinase resistance. EMBO J.
19, 1180–1186.
Brule, D., Sarwar, G., Savoie, L., 1992. Changes in serum and urinary uric
acid levels in normal human subjects fed purine-rich foods containing
different amounts of adenine and hypoxanthine. J. Am. Coll. Nutr. 11,
353–358.
Chamorro, A., Obach, V., Cervera, A., Revilla, M., Deulofeu, R., Aponte,
J.H., 2002. Prognostic significance of uric acid serum concentration in
patients with acute ischemic stroke. Stroke 33, 1048–1052.
Clark, C.M., Xie, S., Chittams, J., Ewbank, D., Peskind, E., Galasko, D.,
Morris, J.C., McKeel Jr., D.W., Farlow, M., Weitlauf, S.L., Quinn, J.,
Kaye, J., Knopman, D., Arai, H., Doody, R.S., DeCarli, C., Leight, S.,
Lee, V.M., Trojanowski, J.Q., 2003. Cerebrospinal fluid tau and beta-
amyloid: how well do these biomarkers reflect autopsy-confirmed
dementia diagnoses? Arch. Neurol. 60, 1696–1702.
Clarke, M.C., Haig, D.A., 1970. Evidence for the multiplication of scrapie
agent in cell culture. Nature 225, 100–101.
Daniels, M., Brown, D.R., 2001. Astrocytes regulate N-methyl-d-aspartate
receptor subunit composition increasing neuronal sensitivity to excito-
toxicity. J. Biol. Chem. 276, 22446–22452.
Degrell, I., Nicklasson, F., 1988. Purine metabolites in the CSF in presenile
and senile dementia of Alzheimer type and in multi infarct dementia.
Arch. Gerontol. Geriatr. 7, 173–178.
Giese, A., Brown, D.R., Groschup, M.H., Feldmann, C., Haist, I.,
Kretzschmar, H.A., 1998. Role of microglia in neuronal cell death in
prion disease. Brain Pathol. 8, 449–457.
Guentchev, M., Voigtl7nder, T., Haberler, C., Groschup, M.H., Budka, H.,
2000. Evidence for oxidative stress in experimental prion disease.
Neurobiol. Dis. 7, 270–273.
Guiroy, D.C., Williams, E.S., Song, K.J., Yanagihara, R., Gajdusek,
D.C., 1993. Fibrils in brain of Rocky Mountain elk with chronic
wasting disease contain scrapie amyloid. Acta Neuropathol. 86,
77–80.
Head, M.W., Ritchie, D., Smith, N., McLoughlin, V., Nailon, W., Samad,
S., Masson, S., Bishop, M., McCardle, L., Ironside, J.W., 2004.
Peripheral tissue involvement in sporadic, iatrogenic, and variant
Creutzfeldt-Jakob disease: an immunohistochemical, quantitative, and
biochemical study. Am. J. Pathol. 164, 143–153.
Hill, A.F., Desbruslais, M., Joiner, S., Sidle, K.C., Gowland, I., Collinge, J.,
Doey, L.J., Lantos, P., 1997. The same prion strain causes vCJD and
BSE. Nature 389, 448–450.
Holme, A., Daniels, M., Sassoon, J., Brown, D.R., 2003. A novel
method of generating neuronal cell lines from g gene-knockout mice
to study prion protein membrane orientation. Eur. J. Neurosci. 18,
571–579.
Hope, J., Multhaup, G., Reekie, L.J., Kimberlin, R.H., Beyreuther, K.,
1988. Molecular pathology of scrapie-associated fibril protein (PrP) in
mouse brain affected by the ME7 strain of scrapie. Eur. J. Biochem.
172, 271–277.
Ironside, J.W., 1998. Neuropathological findings in new variant Creutz-
feldt-Jakob disease and experimental transmission of BSE. FEMS 21,
9105.
Jaramillo, M., Naccache, P.H., Olivier, M., 2004. Monosodium urate
crystals synergize with IFN-gamma to generate macrophage nitric
oxide: involvement of extracellular signal-regulated kinase 1/2 and NF-
kappa B. J. Immunol. 172, 5734–5742.
Kanellis, J., Johnson, R.J., 2003. Editorial comment-elevated uric acid and
ischemic stroke: accumulating evidence that it is injurious and not
neuroprotective. Stroke 34, 1956–1957.
Kretzschmar, H.A., Ironside, J.W., DeArmond, S.J., Tateishi, J., 1996.
Diagnostic criteria for sporadic Creutzfeldt-Jakob disease. Arch.
Neurol. 53, 913–920.

T. Lekishvili et al. / Experimental Neurology 190 (2004) 233–244244
Kubler, E., Oesch, B., Raeber, A.J., 2003. Diagnosis of prion diseases. Br.
Med. Bull. 66, 267–279.
Laplanche, J.L., Will, R.G., Poser, S., 2000. Analysis of EEG and CSF 14-
3-3 proteins as aids to diagnosis of Creutzfeldt-Jakob disease.
Neurology 55, 811–815.
Lehto, S., Niskanen, L., Ronnemaa, T., Laakso, M., 1998. Serum uric acid
is a strong predictor of stroke in non-insulin–dependent diabetes
mellitus. Stroke 29, 635–639.
Loenen, H.M., Eshuis, H., Lowik, M.R., Schouten, E.G., Hulshof, K.F.,
Odink, J., Kok, F.J., 1990. Serum uric acid correlates in elderly men
and women with special reference to body composition and dietary
intake (Dutch Nutrition Surveillance System). J. Clin. Epidemiol. 43,
1297–1303.
Lopez-Torres, M., Perez-Campo, R., Cadenas, S., Rojas, C., Barja, G.,
1993. A comparative study of free radicals in vertebrates. II. Non
enzymatic antioxidants and oxidative stress. Comp. Biochem. Physiol.,
B 105, 757–763.
Mallucci, G., Dickinson, A., Linehan, J., Klohn, P.C., Brandner, S.,
Collinge, J., 2003. Depleting neuronal PrP in prion infection prevents
disease and reverses spongiosis. Science 302, 871–874.
Milhavet, O., McMahon, H.E., Rachidi, W., Nishida, N., Katamine, S.,
Mange, A., Arlotto, M., Casanova, D., Riondel, J., Favier, A.,
Lehmann, S., 2000. Prion infection impairs the cellular response to
oxidative stress. Proc. Natl. Acad. Sci. U. S. A. 97, 13937–13942.
O’Neill, R.D., Lowry, J.P., 1995. On the significance of brain extracellular
uric acid detected with in-vivo monitoring techniques: a review. Behav.
Brain Res. 71, 33–49.
Peretz, D., Williamson, R.A., Kaneko, K., Vergara, J., Leclerc, E., Schmitt-
Ulms, G., Mehlhorn, I.R., Legname, G., Wormald, M.R., Rudd, P.M.,
Dwek, R.A., Burton, D.R., Prusiner, S.B., 2001. Antibodies inhibit
prion propagation and clear cell cultures of prion infectivity. Nature
412, 739–743.
Prusiner, S.B., 1998. Prions. Proc. Natl. Acad. Sci. U. S. A. 95,
13363–13383.
Reiber, H., Ruff, M., Uhr, M., 1993. Ascorbate concentration in human
cerebrospinal fluid (CSF) and serum. Intrathecal accumulation and CSF
flow rate. Clin. Chim. Acta 217, 163–173.
Rudyk, H., Vasiljevic, S., Hennion, R.M., Birkett, C.R., Hope, J., Gilbert,
I.H., 2000. Screening Congo red and its analogues for their ability to
prevent the formation of PrP-res in scrapie-infected cells. J. Gen. Virol.
81, 1155–1164.
Ryckman, C., Gilbert, C., De Medicis, R., Lussier, A., Vandal, K., Tessier,
P.A., 2004. Monosodium urate monohydrate crystals induce the release
of the proinflammatory protein S100A8/A9 from neutrophils. J.
Leukocyte Biol. 76, 433–440.
Spitsin, S.V., Scott, G.S., Mikheeva, T., Zborek, A., Kean, R.B., Brimer,
C.M., Koprowski, H., Hooper, D.C., 2002. Comparison of uric acid and
ascorbic acid in protection against EAE. Free Radical Biol. Med. 33,
1363–1371.
Stover, J.F., Lowitzsch, K., Kempski, O.S., 1997. Cerebrospinal fluid
hypoxanthine, xanthine and uric acid levels may reflect glutamate-
mediated excitotoxicity in different neurological disease. Neurosci. Lett.
238, 25–28.
Supattapone, S., Wille, H., Uyechi, L., Safar, J., Tremblay, P., Szoka, F.C.,
Cohen, F.E., Prusiner, S.B., Scott, M.R., 2001. Branched polyamines
cure prion-infected neuroblastoma cells. J. Virol. 75, 3453–3461.
Tahgi, H., Abe, T., Takahashi, S., Kikuchi, T., 1993. The urate and xanthine
concentrations in the cerebrospinal fluid in patients with vascular
dementia of the Binswanger type, Alzheimer type dementia and
Parkinson’s disease. J. Neural Transm., Parkinson’s Dis. Dement. Sect.
6, 119–126.
Van Everbroeck, B., Quoilin, S., Boons, J., Martin, J.J., Cras, P., 2003. A
prospective study of CSF markers in 250 patients with possible
Creutzfeldt-Jakob disease. J. Neurol. Neurosurg. Psychiatry 74,
1210–1214.
Weir, C.J., Muir, S.W., Walters, M.R., Lees, K.R., 2003. Serum urate as an
independent predictor of poor outcome and future vascular events after
acute stroke. Stroke 34, 1951–1956.
Will, R.G., Zeidler, M., Stewart, G.E., Macleod, M.A., Ironside, J.W.,
Cousens, S.N., Mackenzie, J., Estibeiro, K., Green, A.J.E., Knight,
R.S.G., 2000. Diagnosis of new variant Creutzfeldt-Jakob disease. Ann.
Neurol. 47, 575–582.
Wong, B.-S., Chen, S.G., Colucci, M., Xie, Z., Pan, T., Liu, T., Li,
R., Gambetti, P., Sy, M.-S., Brown, D.R., 2001. Aberrant metal
binding by prion protein in human prion disease. J. Neurochem. 78,
1400–1408.
Wong, K.Y., MacWalter, R.S., Fraser, H.W., Crombie, I., Ogston, S.A.,
Struthers, A.D., 2002. Urate predicts subsequent cardiac death in stroke
survivors. Eur. Heart J. 23, 788–793.
Yu, Z.F., Bruce-Keller, A.J., Goodman, Y., Mattson, M.P., 1998. Uric acid
protects neurons against excitotoxic and metabolic insults in cell
culture, and against focal ischemic brain injury in vivo. J. Neurosci.
Res. 53, 613–625.
Zerr, I, Pocchiari, M., Collins, S., Brandel, J.P., de Pedro Cuesta, J.,
Knight, R.S.G., Bernheimer, H., Cardone, F., Delasnerie-Laupretre,
N., Cuadrado Corrales, N., Ladogana, A., Bodemer, M., Fletcher,
A., Awan, T., Ruiz Bremon, A., Budka, H., Laplanche, J.L., Will,
R.G., Poser, S., 2000. Analysis of EEG and 14-3-3 proteins as
aids to the diagnosis of Creutzfeldt-Jakob disease. Neurology 55,
811–815.
Top Related
Copyright © 2022 FDOKUMEN

