


Bahasa
Halaman
Hukum

www.elsevier.com/locate/biocon
Biological Conservation 122 (2005) 417–430
BIOLOGICAL
CONSERVATION
Bryophyte (moss and liverwort) conservation underremnant canopy in managed forests
Nicole J. Fenton 1, Katherine A. Frego *
Department of Biology, University of New Brunswick, P.O. Box 5050, Saint John, NB, Canada E2L 4L5
Received 5 February 2004
Abstract
Management of forest for timber values presents potential threats for forest floor bryophytes, as localized disturbances are
applied across landscapes. Dispersal limitation may exacerbate local extirpation, by preventing recolonization within a cut-block
rotation period. Populations of forest floor bryophytes that persist under those patches of tree canopy remaining after clear-cutting
could reduce dispersal distances and thereby contribute to conservation of species across the landscape. We examined bryophyte
guilds (liverworts, forest-habitat mosses and colonist–pioneer mosses) and community composition in relation to habitat quality
(microclimate and substrate) in five treatment classes in New Brunswick Acadian forest, 4 years after harvest. Four potential ref-
ugium classes with intact substrate were examined: three were characterized by remnant canopy height, one was treeless. These were
compared to clear-cut areas with substrate disturbance. Microclimate (temperature, total daily photosynthetically active radiation
and vapour pressure deficit) differed significantly between areas with and without remnant canopy, but differed little among refu-
gium classes. This suggests that any remnant canopy moderates microhabitat relative to treeless areas. Liverworts and forest-habitat
mosses were more frequent under remnant canopy than in open and clear-cut areas, with 25 species present only under remnant
canopy. Environmental variation explained approximately 24% of bryophyte pattern, highlighting the potential influence of the
pre-harvest community, which we could not document. In the absence of substrate disturbance, patches of remnant canopy provide
potential refugia for some forest-habitat bryophytes. Characteristics of effective refugia (size and shape) should be determined by
assessments of their impacts on: (i) change in bryophyte communities in refugia relative to natural dynamics and (ii) recolonization
of adjacent areas.
� 2004 Elsevier Ltd. All rights reserved.
Keywords: Bryophytes; Forest management; Refugia; Microclimate; Disturbance
1. Introduction
Replacement of natural disturbance regimes by dis-
turbance regimes created by forest management for
commercial timber values represents a potential threat
to forest organisms. Organisms respond to habitat alter-
0006-3207/$ - see front matter � 2004 Elsevier Ltd. All rights reserved.
doi:10.1016/j.biocon.2004.09.003
* Corresponding author. Tel.: +1 506 648 5566; fax: +1 506 648
5811.
E-mail address: [email protected] (K.A. Frego).1 Present address: URDFAT UQAT-UQAM, Universite du Que-
bec en Abitibi-Temiscamingue, 445 Boul. de l�Universite, Rouyn-
Noranda, Que., Canada J9X 1C5.
ation at local and landscape levels, and small organisms
such as forest floor bryophytes (mosses and liverworts)
may be particularly vulnerable to local extirpation
(Frisvoll and Prestø, 1997; Gustafsson and Hallingback,
1988). Local reduction in bryophyte diversity (Fenton
et al., 2003; Ross-Davis and Frego, 2002) after forest
management treatments such as clear cutting may resultfrom: (i) altered temperature and humidity regimes
(Renhorn et al., 1997; Saunders et al., 1991) where fluc-
tuations exceed the tolerance limits of some species (So-
derstrom, 1988; Busby et al., 1978), or (ii) reduction in
quantity or quality (especially humidity) of substrates
418 N.J. Fenton, K.A. Frego / Biological Conservation 122 (2005) 417–430
such as rotting wood that are required by some species
(Rambo and Muir, 1998; Frisvoll and Prestø, 1997; Le-
sica et al., 1991).
Loss of species immediately after harvest may be
exacerbated by the role of recruitment events in struc-
turing many bryophyte communities (Haig et al., 2000;Kimmerer and Driscoll, 2000; Frego, 1996). These
recruitment events may be rare in undisturbed forests,
and are the result of the interaction between meta-pop-
ulation dynamics of individual species (Soderstrom and
Herben, 1997) and chance events of disturbance that
create free space favourable for colonization (Hurtt
and Pacala, 1995). Metapopulation dynamics are
dependant on propagule dispersal and establishment,which is poorly understood for bryophytes. However,
the apparent vulnerability of early lifestages (i.e., spores
and protonemata), and low germination rates (Miles
and Longton, 1990), are likely to slow or prevent recol-
onization of extirpated species if rotation times of cut
blocks are short (Ross-Davis and Frego, 2004; Soder-
strom et al., 1992; Herben et al., 1991; Soderstrom,
1988; Soderstrom, 1987). The result may be an extinc-tion debt (sensu Tilman et al., 1994), as the most sensi-
tive species are lost and do not return.
The most effective way to promote bryophyte survival
across a managed landscape may be to conserve popula-
tions within harvested stands, thus minimizing dispersal
distances to, and recolonization times of, harvested
areas. Patches of retained canopy that escape substrate
disturbance constitute a potential type of refugium. Inthe context of a variety of harvest operations, including
selection, shelterwood and partial harvests, as well as
variable retention, stands of mature merchantable trees
are removed. The resulting mosaic of remnant canopy
varies in crown closure, height and species. The remnant
patches are interspersed with more or less discrete paths
of harvest machinery (e.g., feller-bunchers and skidders)
in which all canopy is removed or crushed, and the sub-strate is disrupted by scouring, crushing and/or com-
pression. Using definitions modified from White and
Pickett (1985), these trails receive direct disturbance,
where plants are lethally damaged or removed by phys-
ical impact, whereas remnant patches receive indirect
disturbance, i.e., environmental change related to can-
opy removal (increased temperature and incident photo-
synthetically active radiation (PAR), decreasedhumidity; Nyland, 1996) but negligible physical impact.
It is not surprising that all bryophyte vegetation is re-
moved on directly disturbed areas, however, we have
documented survival of much of the bryophyte commu-
nity in parts of the cutover that received only indirect
disturbance (Fenton et al., 2003). Many other species
found in mature closed-canopy forest persist in residual
forest patches in Maine, including birds (Hagan andGrove, 1999), ground beetles (Jennings et al., 1986), vas-
cular plants and lichens (Whitman and Hagan, 1999).
Do patches of remnant canopy between machinery
trails have the potential to act as refugia for forest floor
bryophytes within a clear-cut? What characteristics de-
fine conservation potential of remnant canopy patches?
In order to function as refugia, such areas: (i) must
not experience the extreme habitat changes associatedwith clear-cuts and (ii) must contain, and preserve, for-
est floor bryophyte species at risk. Our objectives were
therefore:
1. to compare bryophyte communities in remnant
patches to those in adjacent directly disturbed areas
of the cutover,
2. to compare bryophyte communities among remnantpatches of different characteristics and
3. to relate differences in these communities to environ-
mental features of the patch types.
2. Methods
2.1. Study site
This study took place within the Hayward Brook
Watershed, New Brunswick (45�52 0N, 65�11 0W), as part
of a monitoring study from 1995-present, where local-
ized impacts of forest harvest are well-documented (Fen-
ton et al., 2003; Roberts and Zhu, 2002). The site is
found in the Continental Lowlands Ecoregion, Ana-gance Ridge Ecodistrict (Department of Natural Re-
sources and Energy, 1997). Daily mean temperatures
range from �13.9 to 18.5 �C. Average annual precipita-
tion is 1228 mm, falling mostly in late autumn and early
spring. Approximately 30% of total annual precipitation
falls as snow, which may exceed 300 cm (Environment
Canada, 2003).
The Acadian forest region is characterized by Picea
rubens (red spruce) along with species of the boreal
and deciduous forests (e.g., Abies balsamea, balsam fir,
and Acer saccharum, sugar maple, respectively; Rowe,
1972). Historically, the region experienced both stand-
replacing (fire, widespread outbreaks of spruce bud-
worm, Choristoneura fumiferana) and gap-replacing
(lightning or isolated spruce budworm) disturbances,
depending on stand type (Woodley and Forbes, 1997).The stands of interest were most likely initiated by a fire
between 1900 and 1920 (Methven and Kendrick, 1995).
Stands used in this study were dominated by Abies
balsamea and Picea spp. before they were harvested in
fall 1995 by the landowner, J.D. Irving Ltd, according
to their operational plan at that time. While some por-
tions of the watershed were scarified and planted, a var-
iable-retention approach was applied to the study area,i.e., advanced regeneration (young trees of merchantable
species), non-merchantable trees (any age and low mar-
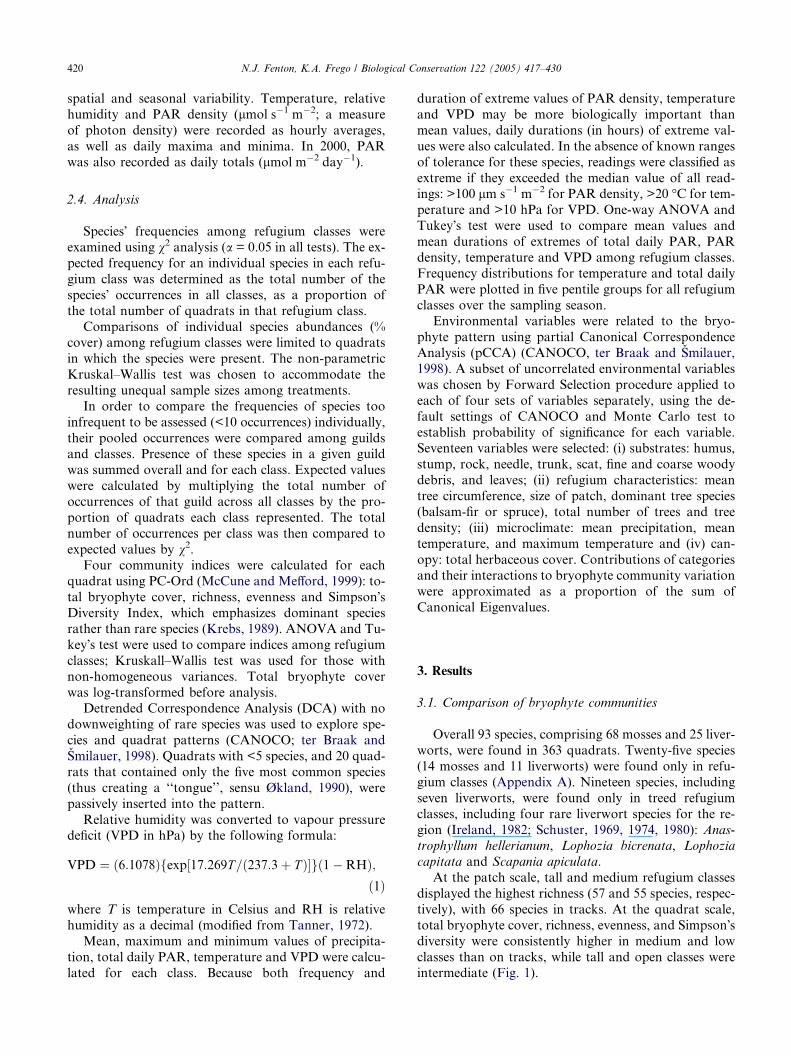
Table 1
Refugium class defined by substrate and canopy characteristics, corresponding to degrees of indirect and direct disturbance
Refugium
class
Substrate
disturbance
Tree species # patches # quadrats Mean area (m2) tree density
(trees m�2)
Basal area
(cm2m�2)
Indirect disturbance
Tall None Picea spp. (42%) Abies
balsamea (45%) trees
> 5 m in height
7 71 37.49b ± 8.47 1.69a ± 0.30 42.92 c ± 4.05
Medium None Abies balsamea (66%) trees
1.5–5 m in height
8 57 14.60a ± 2.56 2.66a ± 0.65 30.93b ± 2.36
Low None Abies balsamea (75%) trees
< 1.5 m in height
6 43 10.20a ± 4.00 3.79a ± 1.42 8.45a ± 1.62
Open None None 9 62 9.01a ± 1.35 NA NA
Direct disturbance
Machinery track Compressed,
disrupted, or slash
None or Populus spp.
saplings (>4 years)
22 120 NA NA
Patches were sample units of at least 25 m2, sampled using a transect of contiguous 0.25 m2 quadrats.
Means followed by the same letter in the same column are not significantly different.
Letters also indicate rank a < b < c.
N.J. Fenton, K.A. Frego / Biological Conservation 122 (2005) 417–430 419
ket value), wildlife trees (nest habitat for cavity-nesting
birds) and seed trees (large individuals of Pinus spp.)
were left in strips between tracks of machinery. Patches
of remnant canopy between machinery tracks experi-
enced indirect disturbance; four visually distinct refu-
gium classes (Table 1) were assigned, based on amount
of canopy removed and height of the tallest tree canopy
remaining. A fifth class, henceforth termed machinerytracks, received direct disturbance, and was expected
to have no refugium potential, while the four categories
of remnant canopy were predicted to offer different de-
grees of protection with tree height and density. For
ease, the refugium classes will be called open (no trees),
low (trees < 1.5 m in height), medium (trees 1.5–5 m)
and tall (trees > 5 m).
2.2. Sampling design
In 1999, 11 transects were placed through randomly
chosen 50 m sections of remnant canopy patches accord-
ing to the following criteria: (i) pre-harvest canopy dom-
inated by coniferous trees, (ii) no evidence of
anthropogenic substrate disturbance, and (iii) P5 m of
each of two refugium classes represented per transect.Transects were also chosen to balance replicates of
patch types, and to represent the range of vegetation
variability previously described for the area (Fenton
et al., 2003). Transects ranged from 13 to 20 m long,
and 67 to 87 masl in elevation.
2.3. Data collection
Bryophyte and environmental data were collected in
summers, 1999 and 2000. Vegetation was sampled using
contiguous 0.5 · 0.5 m quadrats from one machinery
track through remnant canopy to the next track. Percent
cover and substrate were recorded for each bryophyte
species, including those on slash to 1 m above the
ground surface and on trunks to 0.5 m. In each quadrat,
% covers of available substrates (not colonized by bryo-
phytes) were also recorded. Vouchers of bryophytes re-
main in the herbarium at the University of New
Brunswick, Saint John. Taxonomy follows Ireland
(1982) and Crum and Anderson (1981) for the mosses
and Schuster (1969, 1974, 1980) for the liverworts.Bryophyte species were assigned to one of the three
guilds: liverworts, colonist–pioneer mosses and forest-
habitat mosses. Liverworts are believed to be sensitive
to changes associated with forest harvest (Moen and
Jonsson, 2003; Frisvoll and Prestø, 1997; Soderstrom,
1988). Colonists sensu stricto and pioneers (During,
1992) have small spore sizes (<20 lm), colonize dis-
turbed habitats and are uncommon in undisturbed for-ests (Jonsson and Esseen, 1998; Rydgren et al., 1998;
Sims, 1996). Forest-habitat mosses are typically found
in interior forests, on substrates such as trunks, woody
debris and humus. This category also includes species
(e.g., Brachythecium rutabulum) that are found in many
habitats but unlike the colonists and pioneers, are not
specifically associated with soil disturbance.
Data-loggers recorded temperature, relative humidityand PAR using probes 207, HMP45C, and L190SB,
respectively (Campbell Scientific, Logan, UT). Temper-
ature and relative humidity probes were shielded from
direct sunlight and all probes were installed 10–15 cm
above the forest floor. Incident precipitation was re-
corded in millilitres. Data were collected June–Septem-
ber 1999 and April–September 2000, with some data
loss in 1999 when rodents damaged probe wires.One set of probes was permanently located in a tree-
less area of the clear-cut, where it functioned as the con-
trol for seasonal and diurnal fluctuations. Two pairs of
two probes each were rotated through four replicates
of each refugium class at weekly intervals to capture
420 N.J. Fenton, K.A. Frego / Biological Conservation 122 (2005) 417–430
spatial and seasonal variability. Temperature, relative
humidity and PAR density (lmol s�1 m�2; a measure
of photon density) were recorded as hourly averages,
as well as daily maxima and minima. In 2000, PAR
was also recorded as daily totals (lmol m�2 day�1).
2.4. Analysis
Species� frequencies among refugium classes were
examined using v2 analysis (a = 0.05 in all tests). The ex-
pected frequency for an individual species in each refu-
gium class was determined as the total number of the
species� occurrences in all classes, as a proportion of
the total number of quadrats in that refugium class.Comparisons of individual species abundances (%
cover) among refugium classes were limited to quadrats
in which the species were present. The non-parametric
Kruskal–Wallis test was chosen to accommodate the
resulting unequal sample sizes among treatments.
In order to compare the frequencies of species too
infrequent to be assessed (<10 occurrences) individually,
their pooled occurrences were compared among guildsand classes. Presence of these species in a given guild
was summed overall and for each class. Expected values
were calculated by multiplying the total number of
occurrences of that guild across all classes by the pro-
portion of quadrats each class represented. The total
number of occurrences per class was then compared to
expected values by v2.Four community indices were calculated for each
quadrat using PC-Ord (McCune and Mefford, 1999): to-
tal bryophyte cover, richness, evenness and Simpson�sDiversity Index, which emphasizes dominant species
rather than rare species (Krebs, 1989). ANOVA and Tu-
key�s test were used to compare indices among refugium
classes; Kruskall–Wallis test was used for those with
non-homogeneous variances. Total bryophyte cover
was log-transformed before analysis.Detrended Correspondence Analysis (DCA) with no
downweighting of rare species was used to explore spe-
cies and quadrat patterns (CANOCO; ter Braak and
Smilauer, 1998). Quadrats with <5 species, and 20 quad-
rats that contained only the five most common species
(thus creating a ‘‘tongue’’, sensu Økland, 1990), were
passively inserted into the pattern.
Relative humidity was converted to vapour pressuredeficit (VPD in hPa) by the following formula:
VPD ¼ ð6:1078Þfexp½17:269T=ð237:3þ T Þ�gð1�RHÞ;ð1Þ
where T is temperature in Celsius and RH is relative
humidity as a decimal (modified from Tanner, 1972).
Mean, maximum and minimum values of precipita-
tion, total daily PAR, temperature and VPD were calcu-
lated for each class. Because both frequency and
duration of extreme values of PAR density, temperature
and VPD may be more biologically important than
mean values, daily durations (in hours) of extreme val-
ues were also calculated. In the absence of known ranges
of tolerance for these species, readings were classified as
extreme if they exceeded the median value of all read-ings: >100 lm s�1 m�2 for PAR density, >20 �C for tem-
perature and >10 hPa for VPD. One-way ANOVA and
Tukey�s test were used to compare mean values and
mean durations of extremes of total daily PAR, PAR
density, temperature and VPD among refugium classes.
Frequency distributions for temperature and total daily
PAR were plotted in five pentile groups for all refugium
classes over the sampling season.Environmental variables were related to the bryo-
phyte pattern using partial Canonical Correspondence
Analysis (pCCA) (CANOCO, ter Braak and Smilauer,
1998). A subset of uncorrelated environmental variables
was chosen by Forward Selection procedure applied to
each of four sets of variables separately, using the de-
fault settings of CANOCO and Monte Carlo test to
establish probability of significance for each variable.Seventeen variables were selected: (i) substrates: humus,
stump, rock, needle, trunk, scat, fine and coarse woody
debris, and leaves; (ii) refugium characteristics: mean
tree circumference, size of patch, dominant tree species
(balsam-fir or spruce), total number of trees and tree
density; (iii) microclimate: mean precipitation, mean
temperature, and maximum temperature and (iv) can-
opy: total herbaceous cover. Contributions of categoriesand their interactions to bryophyte community variation
were approximated as a proportion of the sum of
Canonical Eigenvalues.
3. Results
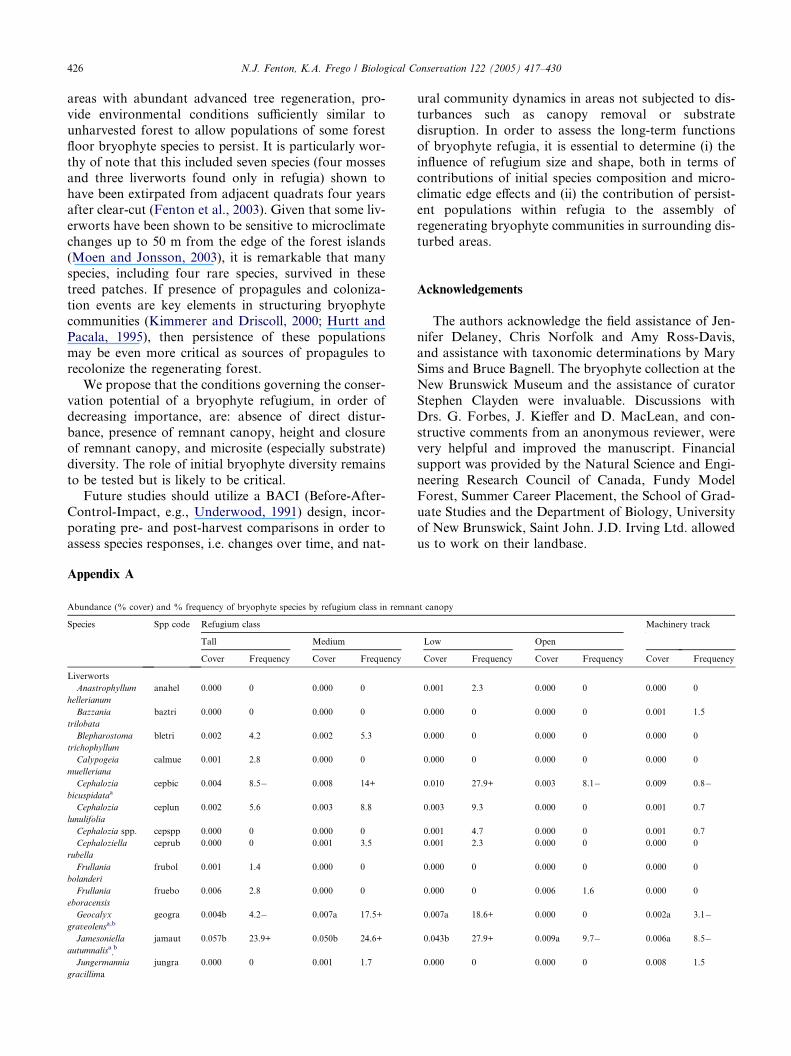
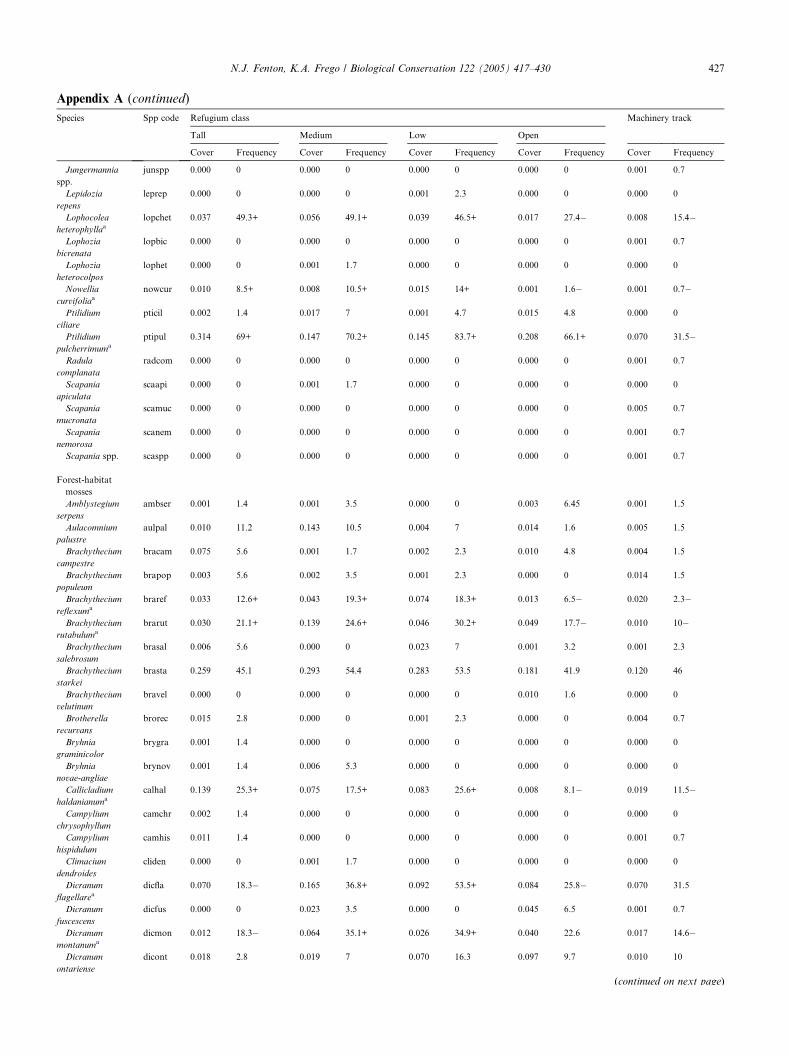
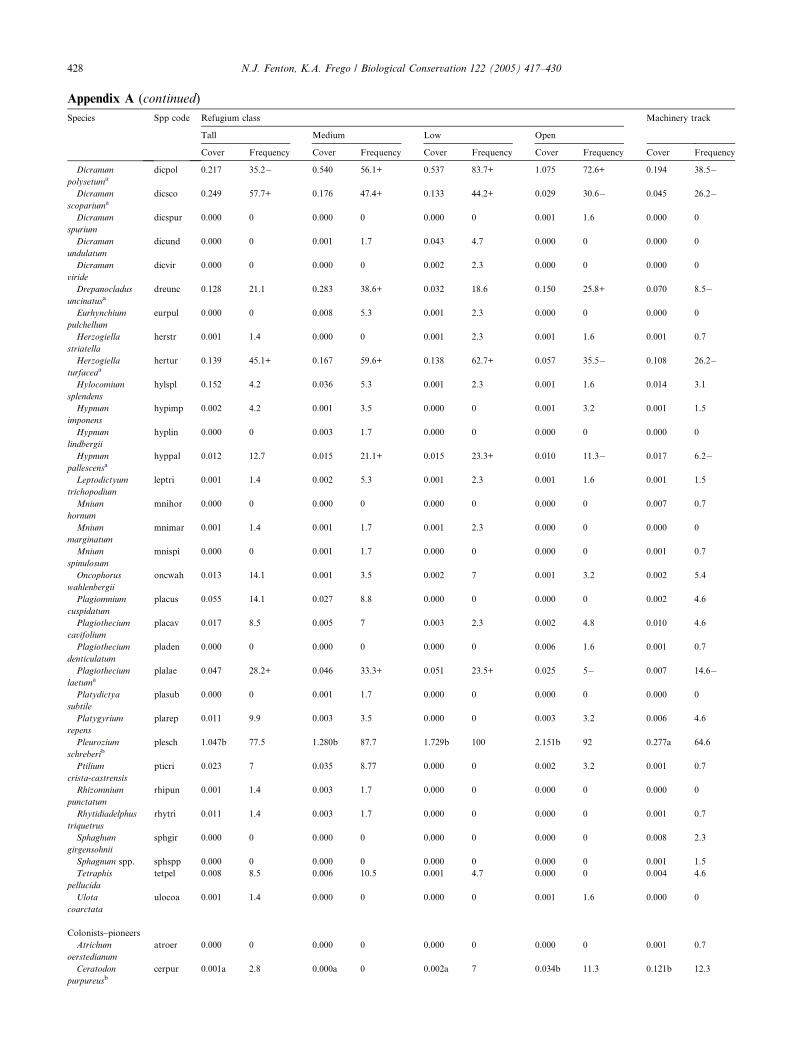
3.1. Comparison of bryophyte communities
Overall 93 species, comprising 68 mosses and 25 liver-
worts, were found in 363 quadrats. Twenty-five species
(14 mosses and 11 liverworts) were found only in refu-
gium classes (Appendix A). Nineteen species, including
seven liverworts, were found only in treed refugium
classes, including four rare liverwort species for the re-
gion (Ireland, 1982; Schuster, 1969, 1974, 1980): Anas-trophyllum hellerianum, Lophozia bicrenata, Lophozia
capitata and Scapania apiculata.
At the patch scale, tall and medium refugium classes
displayed the highest richness (57 and 55 species, respec-
tively), with 66 species in tracks. At the quadrat scale,
total bryophyte cover, richness, evenness, and Simpson�sdiversity were consistently higher in medium and low
classes than on tracks, while tall and open classes wereintermediate (Fig. 1).
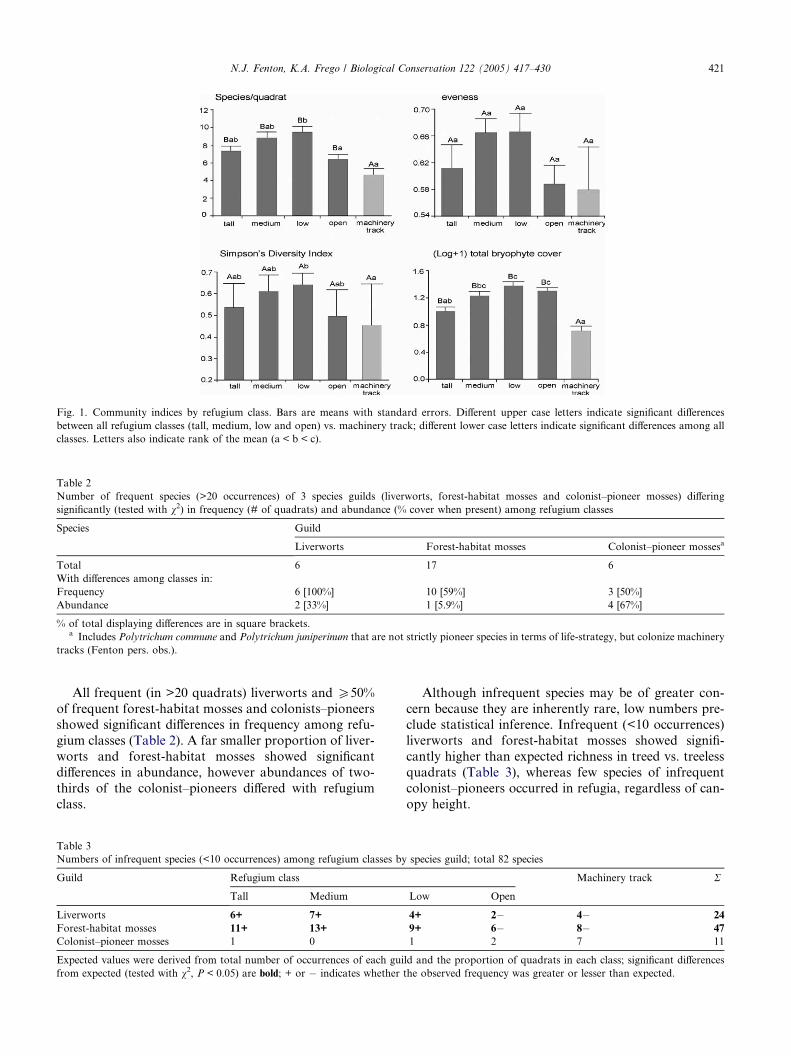
Table 2
Number of frequent species (>20 occurrences) of 3 species guilds (liverworts, forest-habitat mosses and colonist–pioneer mosses) differing
significantly (tested with v2) in frequency (# of quadrats) and abundance (% cover when present) among refugium classes
Species Guild
Liverworts Forest-habitat mosses Colonist–pioneer mossesa
Total 6 17 6
With differences among classes in:
Frequency 6 [100%] 10 [59%] 3 [50%]
Abundance 2 [33%] 1 [5.9%] 4 [67%]
% of total displaying differences are in square brackets.a Includes Polytrichum commune and Polytrichum juniperinum that are not strictly pioneer species in terms of life-strategy, but colonize machinery
tracks (Fenton pers. obs.).
Fig. 1. Community indices by refugium class. Bars are means with standard errors. Different upper case letters indicate significant differences
between all refugium classes (tall, medium, low and open) vs. machinery track; different lower case letters indicate significant differences among all
classes. Letters also indicate rank of the mean (a < b < c).
N.J. Fenton, K.A. Frego / Biological Conservation 122 (2005) 417–430 421
All frequent (in >20 quadrats) liverworts and P50%
of frequent forest-habitat mosses and colonists–pioneersshowed significant differences in frequency among refu-
gium classes (Table 2). A far smaller proportion of liver-
worts and forest-habitat mosses showed significant
differences in abundance, however abundances of two-
thirds of the colonist–pioneers differed with refugium
class.
Table 3
Numbers of infrequent species (<10 occurrences) among refugium classes by
Guild Refugium class
Tall Medium
Liverworts 6+ 7+
Forest-habitat mosses 11+ 13+
Colonist–pioneer mosses 1 0
Expected values were derived from total number of occurrences of each gui
from expected (tested with v2, P < 0.05) are bold; + or � indicates whether
Although infrequent species may be of greater con-
cern because they are inherently rare, low numbers pre-clude statistical inference. Infrequent (<10 occurrences)
liverworts and forest-habitat mosses showed signifi-
cantly higher than expected richness in treed vs. treeless
quadrats (Table 3), whereas few species of infrequent
colonist–pioneers occurred in refugia, regardless of can-
opy height.
species guild; total 82 species
Machinery track R
Low Open
4+ 2� 4� 24
9+ 6� 8� 47
1 2 7 11
ld and the proportion of quadrats in each class; significant differences
the observed frequency was greater or lesser than expected.
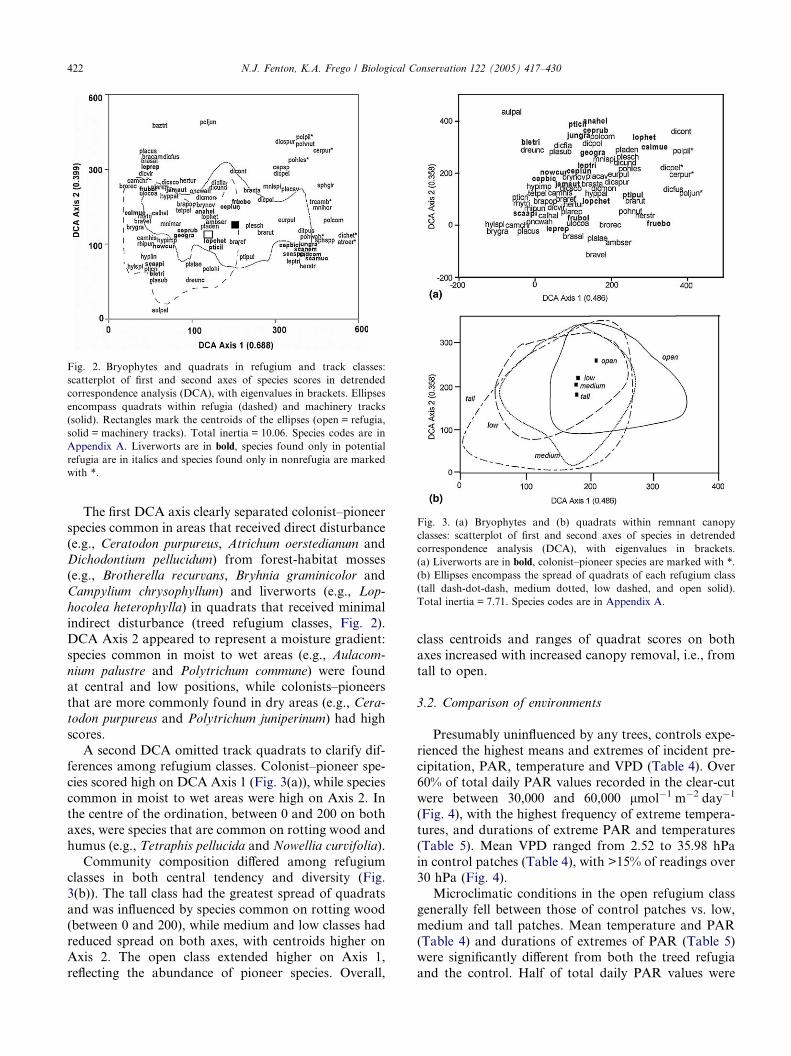
Fig. 2. Bryophytes and quadrats in refugium and track classes:
scatterplot of first and second axes of species scores in detrended
correspondence analysis (DCA), with eigenvalues in brackets. Ellipses
encompass quadrats within refugia (dashed) and machinery tracks
(solid). Rectangles mark the centroids of the ellipses (open = refugia,
solid = machinery tracks). Total inertia = 10.06. Species codes are in
Appendix A. Liverworts are in bold, species found only in potential
refugia are in italics and species found only in nonrefugia are marked
with *.
Fig. 3. (a) Bryophytes and (b) quadrats within remnant canopy
classes: scatterplot of first and second axes of species in detrended
correspondence analysis (DCA), with eigenvalues in brackets.
(a) Liverworts are in bold, colonist–pioneer species are marked with *.
(b) Ellipses encompass the spread of quadrats of each refugium class
(tall dash-dot-dash, medium dotted, low dashed, and open solid).
Total inertia = 7.71. Species codes are in Appendix A.
422 N.J. Fenton, K.A. Frego / Biological Conservation 122 (2005) 417–430
The first DCA axis clearly separated colonist–pioneer
species common in areas that received direct disturbance
(e.g., Ceratodon purpureus, Atrichum oerstedianum andDichodontium pellucidum) from forest-habitat mosses
(e.g., Brotherella recurvans, Bryhnia graminicolor and
Campylium chrysophyllum) and liverworts (e.g., Lop-
hocolea heterophylla) in quadrats that received minimal
indirect disturbance (treed refugium classes, Fig. 2).
DCA Axis 2 appeared to represent a moisture gradient:
species common in moist to wet areas (e.g., Aulacom-
nium palustre and Polytrichum commune) were foundat central and low positions, while colonists–pioneers
that are more commonly found in dry areas (e.g., Cera-
todon purpureus and Polytrichum juniperinum) had high
scores.
A second DCA omitted track quadrats to clarify dif-
ferences among refugium classes. Colonist–pioneer spe-
cies scored high on DCA Axis 1 (Fig. 3(a)), while species
common in moist to wet areas were high on Axis 2. Inthe centre of the ordination, between 0 and 200 on both
axes, were species that are common on rotting wood and
humus (e.g., Tetraphis pellucida and Nowellia curvifolia).
Community composition differed among refugium
classes in both central tendency and diversity (Fig.
3(b)). The tall class had the greatest spread of quadrats
and was influenced by species common on rotting wood
(between 0 and 200), while medium and low classes hadreduced spread on both axes, with centroids higher on
Axis 2. The open class extended higher on Axis 1,
reflecting the abundance of pioneer species. Overall,
class centroids and ranges of quadrat scores on both
axes increased with increased canopy removal, i.e., from
tall to open.
3.2. Comparison of environments
Presumably uninfluenced by any trees, controls expe-
rienced the highest means and extremes of incident pre-
cipitation, PAR, temperature and VPD (Table 4). Over
60% of total daily PAR values recorded in the clear-cut
were between 30,000 and 60,000 lmol�1 m�2 day�1
(Fig. 4), with the highest frequency of extreme tempera-tures, and durations of extreme PAR and temperatures
(Table 5). Mean VPD ranged from 2.52 to 35.98 hPa
in control patches (Table 4), with >15% of readings over
30 hPa (Fig. 4).
Microclimatic conditions in the open refugium class
generally fell between those of control patches vs. low,
medium and tall patches. Mean temperature and PAR
(Table 4) and durations of extremes of PAR (Table 5)were significantly different from both the treed refugia
and the control. Half of total daily PAR values were
Table 4
Microclimatic variables for refugium classes over 5 months (25 April to 26 September 2000)
Microclimatic variable Refugium class Control
Tall Medium Low Open
Precipitation
Total for sampling perioda 2021.2 6112.8 3153.6 3621.2 3456.4
Mean/sampling period 135.2 203.7 210.2 241.7 265.7
SE 34.3 51.9 55.5 50.9 60.2
N (recordings) 12 12 12 12 12
Total PAR
Mean 1663a 1371a 1544a 14,166b 34,776c
SE 90 88 92 916 1248
Minimum 84 150 272 172 8833
Maximum 4868 4501 4406 47,165 56,544
N (days) 128 113 121 128 119
Temperature
Mean 14.6a 14.8a 14.9a 15.8b 17.5c
SE 0.2 0.2 0.1 0.2 0.2
Minimum 3.6 3.9 4.0 5.9 5.8
Maximum 35.2 34.5 33.1 44.0 46.0
VPD
Mean 8.21a 12.10b 11.62b 13.16b 17.58c
SE 0.11 0.11 0.12 0.18 0.27
Minimum 0 0 0.04 0 2.52
Maximum 40.09 42.85 35.28 58.32 95.98
Total precipitation (ml), total PAR (lmol�2 m�2 day�1), temperature (�C) and vapour pressure deficit (VPD in hPa).
N for temperature and VPD for each refugium class varied from 2922 to 3347 recordings.
Means followed by the same letter in a row are not significantly different at P < 0.05; letters also indicate ranking (i.e: a < b < c < d).
SE : standard error.a Sampling periods varied from 1–3 weeks.
N.J. Fenton, K.A. Frego / Biological Conservation 122 (2005) 417–430 423
between 30,000 and 60,000 lmol�1 m�2 day�1, with 50%
of temperature readings over 17 �C (Fig. 4). Mean VPD
was higher only in tall patches (Table 4).
Tall, medium and low refugium classes were similarin means, ranges and durations of extremes of PAR
and temperature (Tables 4 and 5). Mean VPD and dura-
tion of high VPD were significantly lower in the tall
class. VPD values of 5–20 hPa were most frequent, with
few or no values greater than 30 hPa (Fig. 4).
Refugium classes differed in % covers of individual
substrates related to disturbance (Table 6). Percent cov-
ers of bare mineral soil, humus, roots, rocks, twigs andwoody debris were highest in directly disturbed areas,
reflecting mechanical damage to the forest floor and
deposition of slash. Open and low classes also had high
values of deposited woody debris. Frequent available
substrates in the refugium classes included trunks and
needles, from a maximum in tall to minimum values in
open. Substrate richness was significantly greater in
medium and low classes.
3.3. Relationship between bryophyte communities and
environmental features
In total, 24.4% of the variability captured in the bry-
ophyte communities could be directly related to environ-
mental and refugium characteristics. Of this, substrates
accounted for 50%, followed by refugium characteristics
(19.9%) and microclimate (10.2%), with minor contribu-
tions from interactions (Fig. 5).
4. Discussion
While confined to retrospective assessment of a clear-
cut harvest that was not designed to create refugia, this
study confirmed previous suggestions (Fenton et al.,
2003; Whitman and Hagan, 2003; Beese and Bryant,1999) that patches of retained canopy that escape sub-
strate disturbance may serve as refugia to preserve bry-
ophyte communities. Furthermore, it identified
environmental features of the remnant patches that are
most likely to contribute to their conservation value.
4.1. Remnant patches vs. direct disturbance
Four years after harvest, bryophyte communities in
the remnant patches differed from communities on the
machinery tracks in richness, total cover and species
composition. While these communities shared a core
group of relatively common species, they supported dif-
ferent suites of less frequent species: colonist–pioneer
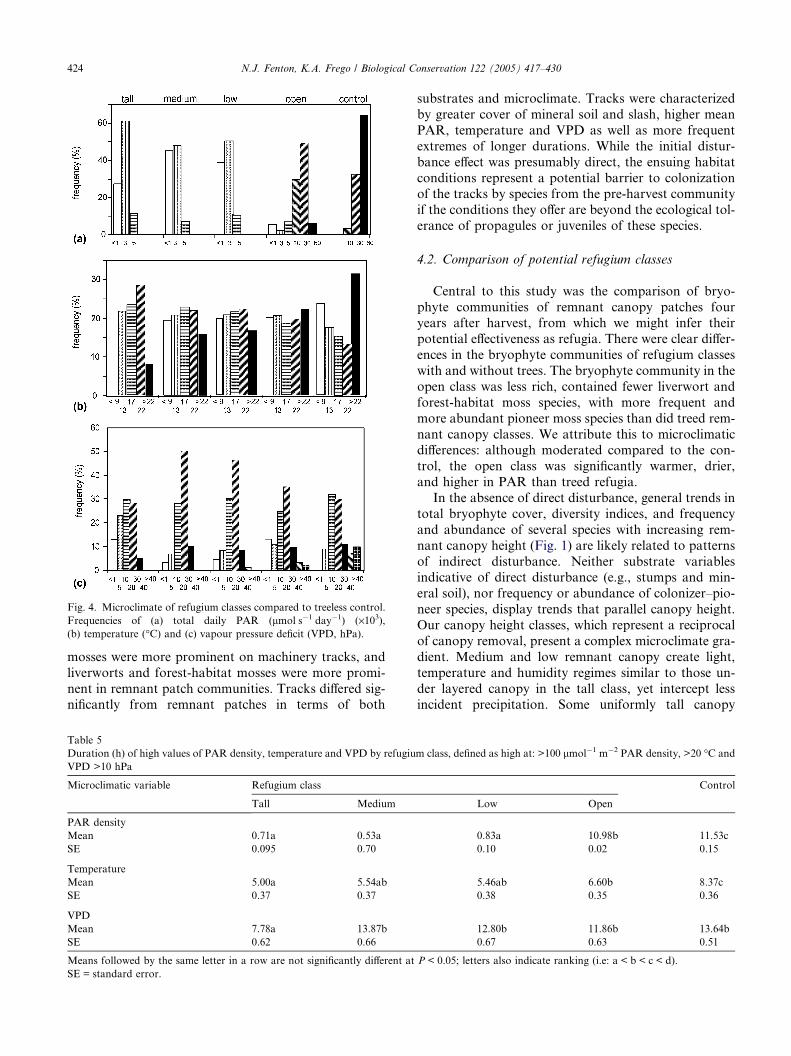
Fig. 4. Microclimate of refugium classes compared to treeless control.
Frequencies of (a) total daily PAR (lmol s�1 day�1) (·103),(b) temperature (�C) and (c) vapour pressure deficit (VPD, hPa).
424 N.J. Fenton, K.A. Frego / Biological Conservation 122 (2005) 417–430
mosses were more prominent on machinery tracks, and
liverworts and forest-habitat mosses were more promi-
nent in remnant patch communities. Tracks differed sig-nificantly from remnant patches in terms of both
Table 5
Duration (h) of high values of PAR density, temperature and VPD by refugiu
VPD >10 hPa
Microclimatic variable Refugium class
Tall Medium
PAR density
Mean 0.71a 0.53a
SE 0.095 0.70
Temperature
Mean 5.00a 5.54ab
SE 0.37 0.37
VPD
Mean 7.78a 13.87b
SE 0.62 0.66
Means followed by the same letter in a row are not significantly different at
SE = standard error.
substrates and microclimate. Tracks were characterized
by greater cover of mineral soil and slash, higher mean
PAR, temperature and VPD as well as more frequent
extremes of longer durations. While the initial distur-
bance effect was presumably direct, the ensuing habitat
conditions represent a potential barrier to colonizationof the tracks by species from the pre-harvest community
if the conditions they offer are beyond the ecological tol-
erance of propagules or juveniles of these species.
4.2. Comparison of potential refugium classes
Central to this study was the comparison of bryo-
phyte communities of remnant canopy patches fouryears after harvest, from which we might infer their
potential effectiveness as refugia. There were clear differ-
ences in the bryophyte communities of refugium classes
with and without trees. The bryophyte community in the
open class was less rich, contained fewer liverwort and
forest-habitat moss species, with more frequent and
more abundant pioneer moss species than did treed rem-
nant canopy classes. We attribute this to microclimaticdifferences: although moderated compared to the con-
trol, the open class was significantly warmer, drier,
and higher in PAR than treed refugia.
In the absence of direct disturbance, general trends in
total bryophyte cover, diversity indices, and frequency
and abundance of several species with increasing rem-
nant canopy height (Fig. 1) are likely related to patterns
of indirect disturbance. Neither substrate variablesindicative of direct disturbance (e.g., stumps and min-
eral soil), nor frequency or abundance of colonizer–pio-
neer species, display trends that parallel canopy height.
Our canopy height classes, which represent a reciprocal
of canopy removal, present a complex microclimate gra-
dient. Medium and low remnant canopy create light,
temperature and humidity regimes similar to those un-
der layered canopy in the tall class, yet intercept lessincident precipitation. Some uniformly tall canopy
m class, defined as high at: >100 lmol�1 m�2 PAR density, >20 �C and
Control
Low Open
0.83a 10.98b 11.53c
0.10 0.02 0.15
5.46ab 6.60b 8.37c
0.38 0.35 0.36
12.80b 11.86b 13.64b
0.67 0.63 0.51
P < 0.05; letters also indicate ranking (i.e: a < b < c < d).
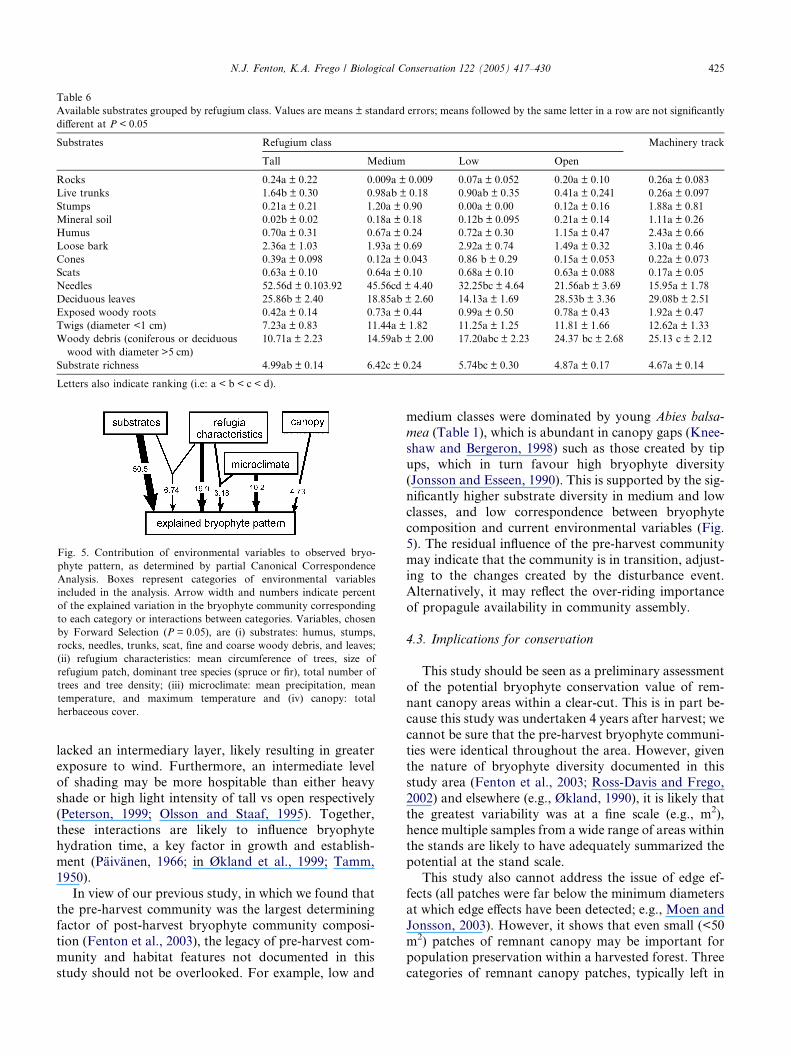
Table 6
Available substrates grouped by refugium class. Values are means ± standard errors; means followed by the same letter in a row are not significantly
different at P < 0.05
Substrates Refugium class Machinery track
Tall Medium Low Open
Rocks 0.24a ± 0.22 0.009a ± 0.009 0.07a ± 0.052 0.20a ± 0.10 0.26a ± 0.083
Live trunks 1.64b ± 0.30 0.98ab ± 0.18 0.90ab ± 0.35 0.41a ± 0.241 0.26a ± 0.097
Stumps 0.21a ± 0.21 1.20a ± 0.90 0.00a ± 0.00 0.12a ± 0.16 1.88a ± 0.81
Mineral soil 0.02b ± 0.02 0.18a ± 0.18 0.12b ± 0.095 0.21a ± 0.14 1.11a ± 0.26
Humus 0.70a ± 0.31 0.67a ± 0.24 0.72a ± 0.30 1.15a ± 0.47 2.43a ± 0.66
Loose bark 2.36a ± 1.03 1.93a ± 0.69 2.92a ± 0.74 1.49a ± 0.32 3.10a ± 0.46
Cones 0.39a ± 0.098 0.12a ± 0.043 0.86 b ± 0.29 0.15a ± 0.053 0.22a ± 0.073
Scats 0.63a ± 0.10 0.64a ± 0.10 0.68a ± 0.10 0.63a ± 0.088 0.17a ± 0.05
Needles 52.56d ± 0.103.92 45.56cd ± 4.40 32.25bc ± 4.64 21.56ab ± 3.69 15.95a ± 1.78
Deciduous leaves 25.86b ± 2.40 18.85ab ± 2.60 14.13a ± 1.69 28.53b ± 3.36 29.08b ± 2.51
Exposed woody roots 0.42a ± 0.14 0.73a ± 0.44 0.99a ± 0.50 0.78a ± 0.43 1.92a ± 0.47
Twigs (diameter <1 cm) 7.23a ± 0.83 11.44a ± 1.82 11.25a ± 1.25 11.81 ± 1.66 12.62a ± 1.33
Woody debris (coniferous or deciduous
wood with diameter >5 cm)
10.71a ± 2.23 14.59ab ± 2.00 17.20abc ± 2.23 24.37 bc ± 2.68 25.13 c ± 2.12
Substrate richness 4.99ab ± 0.14 6.42c ± 0.24 5.74bc ± 0.30 4.87a ± 0.17 4.67a ± 0.14
Letters also indicate ranking (i.e: a < b < c < d).
Fig. 5. Contribution of environmental variables to observed bryo-
phyte pattern, as determined by partial Canonical Correspondence
Analysis. Boxes represent categories of environmental variables
included in the analysis. Arrow width and numbers indicate percent
of the explained variation in the bryophyte community corresponding
to each category or interactions between categories. Variables, chosen
by Forward Selection (P = 0.05), are (i) substrates: humus, stumps,
rocks, needles, trunks, scat, fine and coarse woody debris, and leaves;
(ii) refugium characteristics: mean circumference of trees, size of
refugium patch, dominant tree species (spruce or fir), total number of
trees and tree density; (iii) microclimate: mean precipitation, mean
temperature, and maximum temperature and (iv) canopy: total
herbaceous cover.
N.J. Fenton, K.A. Frego / Biological Conservation 122 (2005) 417–430 425
lacked an intermediary layer, likely resulting in greater
exposure to wind. Furthermore, an intermediate level
of shading may be more hospitable than either heavy
shade or high light intensity of tall vs open respectively
(Peterson, 1999; Olsson and Staaf, 1995). Together,
these interactions are likely to influence bryophyte
hydration time, a key factor in growth and establish-ment (Paivanen, 1966; in Økland et al., 1999; Tamm,
1950).
In view of our previous study, in which we found that
the pre-harvest community was the largest determining
factor of post-harvest bryophyte community composi-
tion (Fenton et al., 2003), the legacy of pre-harvest com-
munity and habitat features not documented in this
study should not be overlooked. For example, low and
medium classes were dominated by young Abies balsa-
mea (Table 1), which is abundant in canopy gaps (Knee-shaw and Bergeron, 1998) such as those created by tip
ups, which in turn favour high bryophyte diversity
(Jonsson and Esseen, 1990). This is supported by the sig-
nificantly higher substrate diversity in medium and low
classes, and low correspondence between bryophyte
composition and current environmental variables (Fig.
5). The residual influence of the pre-harvest community
may indicate that the community is in transition, adjust-ing to the changes created by the disturbance event.
Alternatively, it may reflect the over-riding importance
of propagule availability in community assembly.
4.3. Implications for conservation
This study should be seen as a preliminary assessment
of the potential bryophyte conservation value of rem-nant canopy areas within a clear-cut. This is in part be-
cause this study was undertaken 4 years after harvest; we
cannot be sure that the pre-harvest bryophyte communi-
ties were identical throughout the area. However, given
the nature of bryophyte diversity documented in this
study area (Fenton et al., 2003; Ross-Davis and Frego,
2002) and elsewhere (e.g., Økland, 1990), it is likely that
the greatest variability was at a fine scale (e.g., m2),hence multiple samples from a wide range of areas within
the stands are likely to have adequately summarized the
potential at the stand scale.
This study also cannot address the issue of edge ef-
fects (all patches were far below the minimum diameters
at which edge effects have been detected; e.g., Moen and
Jonsson, 2003). However, it shows that even small (<50
m2) patches of remnant canopy may be important forpopulation preservation within a harvested forest. Three
categories of remnant canopy patches, typically left in
426 N.J. Fenton, K.A. Frego / Biological Conservation 122 (2005) 417–430
areas with abundant advanced tree regeneration, pro-
vide environmental conditions sufficiently similar to
unharvested forest to allow populations of some forest
floor bryophyte species to persist. It is particularly wor-
thy of note that this included seven species (four mosses
and three liverworts found only in refugia) shown tohave been extirpated from adjacent quadrats four years
after clear-cut (Fenton et al., 2003). Given that some liv-
erworts have been shown to be sensitive to microclimate
changes up to 50 m from the edge of the forest islands
(Moen and Jonsson, 2003), it is remarkable that many
species, including four rare species, survived in these
treed patches. If presence of propagules and coloniza-
tion events are key elements in structuring bryophytecommunities (Kimmerer and Driscoll, 2000; Hurtt and
Pacala, 1995), then persistence of these populations
may be even more critical as sources of propagules to
recolonize the regenerating forest.
We propose that the conditions governing the conser-
vation potential of a bryophyte refugium, in order of
decreasing importance, are: absence of direct distur-
bance, presence of remnant canopy, height and closureof remnant canopy, and microsite (especially substrate)
diversity. The role of initial bryophyte diversity remains
to be tested but is likely to be critical.
Future studies should utilize a BACI (Before-After-
Control-Impact, e.g., Underwood, 1991) design, incor-
porating pre- and post-harvest comparisons in order to
assess species responses, i.e. changes over time, and nat-
Appendix A
Abundance (% cover) and % frequency of bryophyte species by refugium class in remna
Species Spp code Refugium class
Tall Medium
Cover Frequency Cover Frequency
Liverworts
Anastrophyllum
hellerianum
anahel 0.000 0 0.000 0
Bazzania
trilobata
baztri 0.000 0 0.000 0
Blepharostoma
trichophyllum
bletri 0.002 4.2 0.002 5.3
Calypogeia
muelleriana
calmue 0.001 2.8 0.000 0
Cephalozia
bicuspidataacepbic 0.004 8.5� 0.008 14+
Cephalozia
lunulifolia
ceplun 0.002 5.6 0.003 8.8
Cephalozia spp. cepspp 0.000 0 0.000 0
Cephaloziella
rubella
ceprub 0.000 0 0.001 3.5
Frullania
bolanderi
frubol 0.001 1.4 0.000 0
Frullania
eboracensis
fruebo 0.006 2.8 0.000 0
Geocalyx
graveolensa,bgeogra 0.004b 4.2� 0.007a 17.5+
Jamesoniella
autumnalisa,b
jamaut 0.057b 23.9+ 0.050b 24.6+
Jungermannia
gracillima
jungra 0.000 0 0.001 1.7
ural community dynamics in areas not subjected to dis-
turbances such as canopy removal or substrate
disruption. In order to assess the long-term functions
of bryophyte refugia, it is essential to determine (i) the
influence of refugium size and shape, both in terms of
contributions of initial species composition and micro-climatic edge effects and (ii) the contribution of persist-
ent populations within refugia to the assembly of
regenerating bryophyte communities in surrounding dis-
turbed areas.
Acknowledgements
The authors acknowledge the field assistance of Jen-
nifer Delaney, Chris Norfolk and Amy Ross-Davis,
and assistance with taxonomic determinations by Mary
Sims and Bruce Bagnell. The bryophyte collection at the
New Brunswick Museum and the assistance of curator
Stephen Clayden were invaluable. Discussions with
Drs. G. Forbes, J. Kieffer and D. MacLean, and con-
structive comments from an anonymous reviewer, werevery helpful and improved the manuscript. Financial
support was provided by the Natural Science and Engi-
neering Research Council of Canada, Fundy Model
Forest, Summer Career Placement, the School of Grad-
uate Studies and the Department of Biology, University
of New Brunswick, Saint John. J.D. Irving Ltd. allowed
us to work on their landbase.
nt canopy
Machinery track
Low Open
Cover Frequency Cover Frequency Cover Frequency
0.001 2.3 0.000 0 0.000 0
0.000 0 0.000 0 0.001 1.5
0.000 0 0.000 0 0.000 0
0.000 0 0.000 0 0.000 0
0.010 27.9+ 0.003 8.1� 0.009 0.8�
0.003 9.3 0.000 0 0.001 0.7
0.001 4.7 0.000 0 0.001 0.7
0.001 2.3 0.000 0 0.000 0
0.000 0 0.000 0 0.000 0
0.000 0 0.006 1.6 0.000 0
0.007a 18.6+ 0.000 0 0.002a 3.1�
0.043b 27.9+ 0.009a 9.7� 0.006a 8.5�
0.000 0 0.000 0 0.008 1.5
Appendix A (continued)
Species Spp code Refugium class Machinery track
Tall Medium Low Open
Cover Frequency Cover Frequency Cover Frequency Cover Frequency Cover Frequency
Jungermannia
spp.
junspp 0.000 0 0.000 0 0.000 0 0.000 0 0.001 0.7
Lepidozia
repens
leprep 0.000 0 0.000 0 0.001 2.3 0.000 0 0.000 0
Lophocolea
heterophyllaalopchet 0.037 49.3+ 0.056 49.1+ 0.039 46.5+ 0.017 27.4� 0.008 15.4�
Lophozia
bicrenata
lopbic 0.000 0 0.000 0 0.000 0 0.000 0 0.001 0.7
Lophozia
heterocolpos
lophet 0.000 0 0.001 1.7 0.000 0 0.000 0 0.000 0
Nowellia
curvifoliaanowcur 0.010 8.5+ 0.008 10.5+ 0.015 14+ 0.001 1.6� 0.001 0.7�
Ptilidium
ciliare
pticil 0.002 1.4 0.017 7 0.001 4.7 0.015 4.8 0.000 0
Ptilidium
pulcherrimuma
ptipul 0.314 69+ 0.147 70.2+ 0.145 83.7+ 0.208 66.1+ 0.070 31.5�
Radula
complanata
radcom 0.000 0 0.000 0 0.000 0 0.000 0 0.001 0.7
Scapania
apiculata
scaapi 0.000 0 0.001 1.7 0.000 0 0.000 0 0.000 0
Scapania
mucronata
scamuc 0.000 0 0.000 0 0.000 0 0.000 0 0.005 0.7
Scapania
nemorosa
scanem 0.000 0 0.000 0 0.000 0 0.000 0 0.001 0.7
Scapania spp. scaspp 0.000 0 0.000 0 0.000 0 0.000 0 0.001 0.7
Forest-habitat
mosses
Amblystegium
serpens
ambser 0.001 1.4 0.001 3.5 0.000 0 0.003 6.45 0.001 1.5
Aulacomnium
palustre
aulpal 0.010 11.2 0.143 10.5 0.004 7 0.014 1.6 0.005 1.5
Brachythecium
campestre
bracam 0.075 5.6 0.001 1.7 0.002 2.3 0.010 4.8 0.004 1.5
Brachythecium
populeum
brapop 0.003 5.6 0.002 3.5 0.001 2.3 0.000 0 0.014 1.5
Brachythecium
reflexuma
braref 0.033 12.6+ 0.043 19.3+ 0.074 18.3+ 0.013 6.5� 0.020 2.3�
Brachythecium
rutabuluma
brarut 0.030 21.1+ 0.139 24.6+ 0.046 30.2+ 0.049 17.7� 0.010 10�
Brachythecium
salebrosum
brasal 0.006 5.6 0.000 0 0.023 7 0.001 3.2 0.001 2.3
Brachythecium
starkei
brasta 0.259 45.1 0.293 54.4 0.283 53.5 0.181 41.9 0.120 46
Brachythecium
velutinum
bravel 0.000 0 0.000 0 0.000 0 0.010 1.6 0.000 0
Brotherella
recurvans
brorec 0.015 2.8 0.000 0 0.001 2.3 0.000 0 0.004 0.7
Bryhnia
graminicolor
brygra 0.001 1.4 0.000 0 0.000 0 0.000 0 0.000 0
Bryhnia
novae-angliae
brynov 0.001 1.4 0.006 5.3 0.000 0 0.000 0 0.000 0
Callicladium
haldanianuma
calhal 0.139 25.3+ 0.075 17.5+ 0.083 25.6+ 0.008 8.1� 0.019 11.5�
Campylium
chrysophyllum
camchr 0.002 1.4 0.000 0 0.000 0 0.000 0 0.000 0
Campylium
hispidulum
camhis 0.011 1.4 0.000 0 0.000 0 0.000 0 0.001 0.7
Climacium
dendroides
cliden 0.000 0 0.001 1.7 0.000 0 0.000 0 0.000 0
Dicranum
flagellareadicfla 0.070 18.3� 0.165 36.8+ 0.092 53.5+ 0.084 25.8� 0.070 31.5
Dicranum
fuscescens
dicfus 0.000 0 0.023 3.5 0.000 0 0.045 6.5 0.001 0.7
Dicranum
montanuma
dicmon 0.012 18.3� 0.064 35.1+ 0.026 34.9+ 0.040 22.6 0.017 14.6�
Dicranum
ontariense
dicont 0.018 2.8 0.019 7 0.070 16.3 0.097 9.7 0.010 10
(continued on next page)
N.J. Fenton, K.A. Frego / Biological Conservation 122 (2005) 417–430 427
Appendix A (continued)
Species Spp code Refugium class Machinery track
Tall Medium Low Open
Cover Frequency Cover Frequency Cover Frequency Cover Frequency Cover Frequency
Dicranum
polysetuma
dicpol 0.217 35.2� 0.540 56.1+ 0.537 83.7+ 1.075 72.6+ 0.194 38.5�
Dicranum
scopariuma
dicsco 0.249 57.7+ 0.176 47.4+ 0.133 44.2+ 0.029 30.6� 0.045 26.2�
Dicranum
spurium
dicspur 0.000 0 0.000 0 0.000 0 0.001 1.6 0.000 0
Dicranum
undulatum
dicund 0.000 0 0.001 1.7 0.043 4.7 0.000 0 0.000 0
Dicranum
viride
dicvir 0.000 0 0.000 0 0.002 2.3 0.000 0 0.000 0
Drepanocladus
uncinatusadreunc 0.128 21.1 0.283 38.6+ 0.032 18.6 0.150 25.8+ 0.070 8.5�
Eurhynchium
pulchellum
eurpul 0.000 0 0.008 5.3 0.001 2.3 0.000 0 0.000 0
Herzogiella
striatella
herstr 0.001 1.4 0.000 0 0.001 2.3 0.001 1.6 0.001 0.7
Herzogiella
turfaceaahertur 0.139 45.1+ 0.167 59.6+ 0.138 62.7+ 0.057 35.5� 0.108 26.2�
Hylocomium
splendens
hylspl 0.152 4.2 0.036 5.3 0.001 2.3 0.001 1.6 0.014 3.1
Hypnum
imponens
hypimp 0.002 4.2 0.001 3.5 0.000 0 0.001 3.2 0.001 1.5
Hypnum
lindbergii
hyplin 0.000 0 0.003 1.7 0.000 0 0.000 0 0.000 0
Hypnum
pallescensahyppal 0.012 12.7 0.015 21.1+ 0.015 23.3+ 0.010 11.3� 0.017 6.2�
Leptodictyum
trichopodium
leptri 0.001 1.4 0.002 5.3 0.001 2.3 0.001 1.6 0.001 1.5
Mnium
hornum
mnihor 0.000 0 0.000 0 0.000 0 0.000 0 0.007 0.7
Mnium
marginatum
mnimar 0.001 1.4 0.001 1.7 0.001 2.3 0.000 0 0.000 0
Mnium
spinulosum
mnispi 0.000 0 0.001 1.7 0.000 0 0.000 0 0.001 0.7
Oncophorus
wahlenbergii
oncwah 0.013 14.1 0.001 3.5 0.002 7 0.001 3.2 0.002 5.4
Plagiomnium
cuspidatum
placus 0.055 14.1 0.027 8.8 0.000 0 0.000 0 0.002 4.6
Plagiothecium
cavifolium
placav 0.017 8.5 0.005 7 0.003 2.3 0.002 4.8 0.010 4.6
Plagiothecium
denticulatum
pladen 0.000 0 0.000 0 0.000 0 0.006 1.6 0.001 0.7
Plagiothecium
laetuma
plalae 0.047 28.2+ 0.046 33.3+ 0.051 23.5+ 0.025 5� 0.007 14.6�
Platydictya
subtile
plasub 0.000 0 0.001 1.7 0.000 0 0.000 0 0.000 0
Platygyrium
repens
plarep 0.011 9.9 0.003 3.5 0.000 0 0.003 3.2 0.006 4.6
Pleurozium
schreberibplesch 1.047b 77.5 1.280b 87.7 1.729b 100 2.151b 92 0.277a 64.6
Ptilium
crista-castrensis
pticri 0.023 7 0.035 8.77 0.000 0 0.002 3.2 0.001 0.7
Rhizomnium
punctatum
rhipun 0.001 1.4 0.003 1.7 0.000 0 0.000 0 0.000 0
Rhytidiadelphus
triquetrus
rhytri 0.011 1.4 0.003 1.7 0.000 0 0.000 0 0.001 0.7
Sphaghum
girgensohnii
sphgir 0.000 0 0.000 0 0.000 0 0.000 0 0.008 2.3
Sphagnum spp. sphspp 0.000 0 0.000 0 0.000 0 0.000 0 0.001 1.5
Tetraphis
pellucida
tetpel 0.008 8.5 0.006 10.5 0.001 4.7 0.000 0 0.004 4.6
Ulota
coarctata
ulocoa 0.001 1.4 0.000 0 0.000 0 0.001 1.6 0.000 0
Colonists–pioneers
Atrichum
oerstedianum
atroer 0.000 0 0.000 0 0.000 0 0.000 0 0.001 0.7
Ceratodon
purpureusbcerpur 0.001a 2.8 0.000a 0 0.002a 7 0.034b 11.3 0.121b 12.3
428 N.J. Fenton, K.A. Frego / Biological Conservation 122 (2005) 417–430
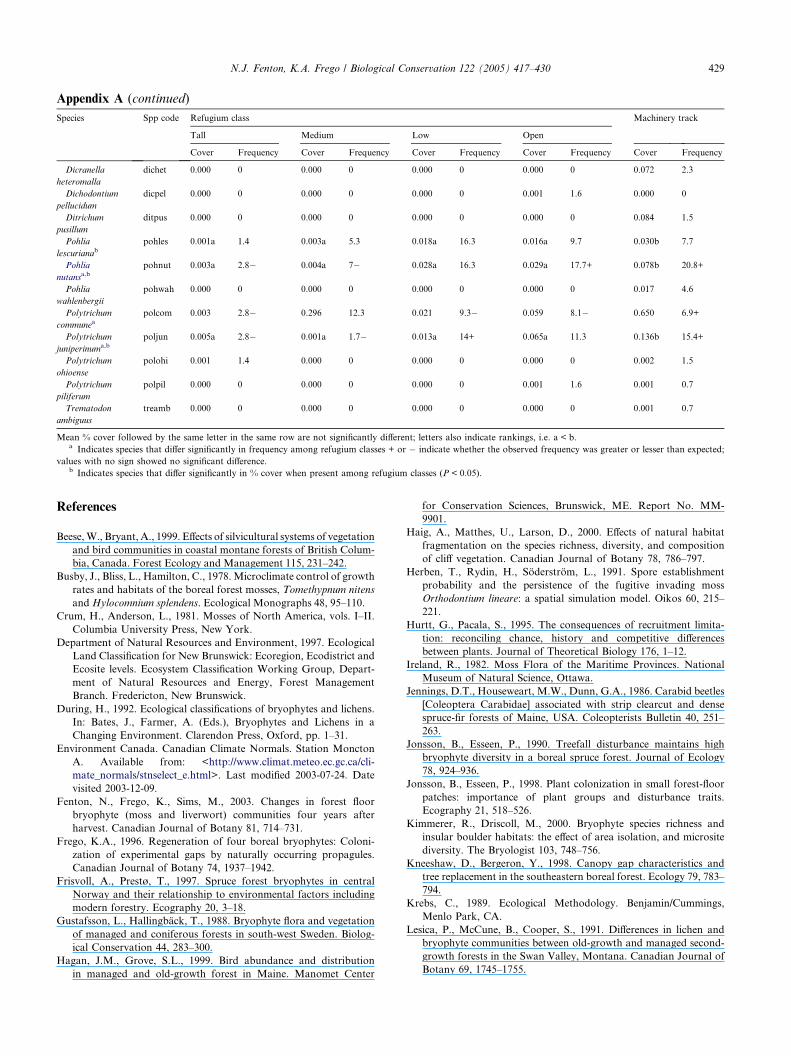
Appendix A (continued)
Species Spp code Refugium class Machinery track
Tall Medium Low Open
Cover Frequency Cover Frequency Cover Frequency Cover Frequency Cover Frequency
Dicranella
heteromalla
dichet 0.000 0 0.000 0 0.000 0 0.000 0 0.072 2.3
Dichodontium
pellucidum
dicpel 0.000 0 0.000 0 0.000 0 0.001 1.6 0.000 0
Ditrichum
pusillum
ditpus 0.000 0 0.000 0 0.000 0 0.000 0 0.084 1.5
Pohlia
lescurianabpohles 0.001a 1.4 0.003a 5.3 0.018a 16.3 0.016a 9.7 0.030b 7.7
Pohlia
nutansa,bpohnut 0.003a 2.8� 0.004a 7� 0.028a 16.3 0.029a 17.7+ 0.078b 20.8+
Pohlia
wahlenbergii
pohwah 0.000 0 0.000 0 0.000 0 0.000 0 0.017 4.6
Polytrichum
communeapolcom 0.003 2.8� 0.296 12.3 0.021 9.3� 0.059 8.1� 0.650 6.9+
Polytrichum
juniperinuma,b
poljun 0.005a 2.8� 0.001a 1.7� 0.013a 14+ 0.065a 11.3 0.136b 15.4+
Polytrichum
ohioense
polohi 0.001 1.4 0.000 0 0.000 0 0.000 0 0.002 1.5
Polytrichum
piliferum
polpil 0.000 0 0.000 0 0.000 0 0.001 1.6 0.001 0.7
Trematodon
ambiguus
treamb 0.000 0 0.000 0 0.000 0 0.000 0 0.001 0.7
Mean % cover followed by the same letter in the same row are not significantly different; letters also indicate rankings, i.e. a < b.a Indicates species that differ significantly in frequency among refugium classes + or � indicate whether the observed frequency was greater or lesser than expected;
values with no sign showed no significant difference.b Indicates species that differ significantly in % cover when present among refugium classes (P < 0.05).
N.J. Fenton, K.A. Frego / Biological Conservation 122 (2005) 417–430 429
References
Beese,W., Bryant, A., 1999. Effects of silvicultural systems of vegetation
and bird communities in coastal montane forests of British Colum-
bia, Canada. Forest Ecology and Management 115, 231–242.
Busby, J., Bliss, L., Hamilton, C., 1978.Microclimate control of growth
rates and habitats of the boreal forest mosses, Tomethypnum nitens
andHylocomnium splendens. Ecological Monographs 48, 95–110.
Crum, H., Anderson, L., 1981. Mosses of North America, vols. I–II.
Columbia University Press, New York.
Department of Natural Resources and Environment, 1997. Ecological
Land Classification for New Brunswick: Ecoregion, Ecodistrict and
Ecosite levels. Ecosystem Classification Working Group, Depart-
ment of Natural Resources and Energy, Forest Management
Branch. Fredericton, New Brunswick.
During, H., 1992. Ecological classifications of bryophytes and lichens.
In: Bates, J., Farmer, A. (Eds.), Bryophytes and Lichens in a
Changing Environment. Clarendon Press, Oxford, pp. 1–31.
Environment Canada. Canadian Climate Normals. Station Moncton
A. Available from: <http://www.climat.meteo.ec.gc.ca/cli-
mate_normals/stnselect_e.html>. Last modified 2003-07-24. Date
visited 2003-12-09.
Fenton, N., Frego, K., Sims, M., 2003. Changes in forest floor
bryophyte (moss and liverwort) communities four years after
harvest. Canadian Journal of Botany 81, 714–731.
Frego, K.A., 1996. Regeneration of four boreal bryophytes: Coloni-
zation of experimental gaps by naturally occurring propagules.
Canadian Journal of Botany 74, 1937–1942.
Frisvoll, A., Prestø, T., 1997. Spruce forest bryophytes in central
Norway and their relationship to environmental factors including
modern forestry. Ecography 20, 3–18.
Gustafsson, L., Hallingback, T., 1988. Bryophyte flora and vegetation
of managed and coniferous forests in south-west Sweden. Biolog-
ical Conservation 44, 283–300.
Hagan, J.M., Grove, S.L., 1999. Bird abundance and distribution
in managed and old-growth forest in Maine. Manomet Center
for Conservation Sciences, Brunswick, ME. Report No. MM-
9901.
Haig, A., Matthes, U., Larson, D., 2000. Effects of natural habitat
fragmentation on the species richness, diversity, and composition
of cliff vegetation. Canadian Journal of Botany 78, 786–797.
Herben, T., Rydin, H., Soderstrom, L., 1991. Spore establishment
probability and the persistence of the fugitive invading moss
Orthodontium lineare: a spatial simulation model. Oikos 60, 215–
221.
Hurtt, G., Pacala, S., 1995. The consequences of recruitment limita-
tion: reconciling chance, history and competitive differences
between plants. Journal of Theoretical Biology 176, 1–12.
Ireland, R., 1982. Moss Flora of the Maritime Provinces. National
Museum of Natural Science, Ottawa.
Jennings, D.T., Houseweart, M.W., Dunn, G.A., 1986. Carabid beetles
[Coleoptera Carabidae] associated with strip clearcut and dense
spruce-fir forests of Maine, USA. Coleopterists Bulletin 40, 251–
263.
Jonsson, B., Esseen, P., 1990. Treefall disturbance maintains high
bryophyte diversity in a boreal spruce forest. Journal of Ecology
78, 924–936.
Jonsson, B., Esseen, P., 1998. Plant colonization in small forest-floor
patches: importance of plant groups and disturbance traits.
Ecography 21, 518–526.
Kimmerer, R., Driscoll, M., 2000. Bryophyte species richness and
insular boulder habitats: the effect of area isolation, and microsite
diversity. The Bryologist 103, 748–756.
Kneeshaw, D., Bergeron, Y., 1998. Canopy gap characteristics and
tree replacement in the southeastern boreal forest. Ecology 79, 783–
794.
Krebs, C., 1989. Ecological Methodology. Benjamin/Cummings,
Menlo Park, CA.
Lesica, P., McCune, B., Cooper, S., 1991. Differences in lichen and
bryophyte communities between old-growth and managed second-
growth forests in the Swan Valley, Montana. Canadian Journal of
Botany 69, 1745–1755.
430 N.J. Fenton, K.A. Frego / Biological Conservation 122 (2005) 417–430
McCune, B., Mefford, M., 1999. PC-ORD. Multivariate Analysis of
Ecological Data, Version 4. MJM Software Design, Gleneden
Beach, OR.
Methven, I., Kendrick, M., 1995. A Disturbance History Analysis of
the Fundy Model Forest Area. Fundy Model Forest, Sussex, New
Brunswick.
Miles, C., Longton, R., 1990. The role of spores in reproduction in
mosses. Botanical Journal of the Linnean Society 104, 149–173.
Moen, J., Jonsson, B.G., 2003. Edge effects on liverworts and lichens in
forest patches in a mosaic of boreal forest and wetland. Conser-
vation Biology 17, 380–388.
Nyland, R., 1996. Silviculture: Concepts and Applications. McGraw-
Hill, New York.
Økland, R., 1990. Vegetation Ecology, Theory, Methods and Appli-
cations with Reference to Fennoscandia. Sommerfeltia Supple-
ment. Botanical Garden and Museum, University of Oslo, 154.
Økland, R., Rydgren, K., Økland, T., 1999. Single-tree influence on
understorey vegetation in a Norwegian boreal spruce forest. Oikos
87, 488–498.
Olsson, B., Staaf, H., 1995. Influence of harvesting intensity of logging
residues on ground vegetation in coniferous forests. Journal of
Applied Ecology 32, 640–654.
Paivanen, J., 1966. Sateen jakaantuminen erilaisissa metsikoissa (Eng.
summ.: The distribution of rainfall in different types of forest
stands). Silva Fennica 119, 1–37.
Peterson, J., 1999. The effects of forest harvest on bryophyte
recolonization in a mixed forest in New Brunswick. M.Sc. thesis,
Department of Biology, University of New Brunswick. Saint John.
Rambo, T., Muir, P., 1998. Forest floor bryophytes of Pseudotsuga
menziesii-Tsuga heterophylla stands in Oregon: Influence of sub-
strate and overstory. Bryologist 101, 116–130.
Renhorn, K.-E., Esseen, P.-A., Palmqvist, K., Sundberg, B., 1997.
Growth and vitality of epiphytic lichens. I. Responses to
microclimate along a forest edge-interior gradient. Oecologia
109, 1–9.
Roberts, M., Zhu, L.-X., 2002. Early response of the herbaceous layer
to harvesting in a mixed coniferous-deciduous forest in New
Brunswick, Canada. Forest Ecology and Management 155, 17–31.
Ross-Davis, A., Frego, K., 2002. Comparison of plantations and
naturally regenerated clearcuts in the Acadian forest: forest floor
bryophyte community and habitat features. Canadian Journal of
Botany 80, 21–33.
Ross-Davis, A., Frego, K., 2004. Propagule sources of forest floor
bryophytes: spatiotemporal compositional patterns. The Bryologist
107, 88–97.
Rowe, J., 1972. Forest Regions of Canada. Department of the
Environment Canadian Forest Service, Ottawa.
Rydgren, K., Hestmark, G., Økland, R., 1998. Revegetation following
experimental disturbance in a boreal old-growth Picea abies forest.
Journal of Vegetation Science 9, 763–776.
Saunders, D., Hobbs, R., Margules, C., 1991. Biological consequences
of ecosystem fragmentation: a review. Conservation Biology 5, 18–
32.
Schuster, R., 1969. The Hepaticae and Anthocerotae of North
America, East of the hundredth meridian, vol. II. Columbia
University Press, New York and London.
Schuster, R., 1974. The Hepaticae and Anthocerotae of North
America, East of the hundredth meridian, vol. III. Columbia
University Press, New York and London.
Schuster, R., 1980. The Hepaticae and Anthocerotae of North
America, East of the hundredth meridian, vol. IV. Columbia
University Press, New York and London.
Sims, M., 1996. Distribution of forest floor bryophyte in a north
temperate forest. B.Sc. thesis, Department of Biology, University
of New Brunswick Saint John.
Soderstrom, L., 1987. Dispersal as limiting factor for distribution
among epixylic bryophytes. Symposia Biologica Hungarica 35,
475–483.
Soderstrom, L., 1988. The occurrence of epixylic bryophyte and lichen
species in an old and a managed forest stand in northeast Sweden.
Biological Conservation 45, 169–178.
Soderstrom, L., Hallingback, T., Gustafsson, L., Cronberg, N.,
Hedenas, L., 1992. Bryophyte conservation for the future. Biolog-
ical Conservation 59, 265–270.
Soderstrom, L., Herben, T., 1997. Dynamics of bryophyte metapop-
ulations. Advances in Bryology 6, 205–240.
Tamm, C., 1950. Growth and plant nutrient concentration in
Hylocomnium proliferum (L.) Lindb. in relation to tree canopy.
Oikos 2, 60–64.
Tanner, C., 1972. Application of psychometry to micrometerology. In:
Brown, R., VanHaveren, B. (Eds.), Psychometry in Water Rela-
tions Research. Utah Agricultural Experiment Station, Utah State
University, Salt Lake City, UT, pp. 239–247.
ter Braak, C., Smilauer, P., 1998. CANOCO for Windows Version 4.2.
Center for Biometry Wagenin, CPRO-DLO, Wageningen, The
Netherlands.
Tilman, D., May, R., Lehman, C., Nowak, M., 1994. Habitat
destruction and the extinction debt. Nature 371, 65–66.
Underwood, A.J., 1991. Beyond BACI: Experimental designs for
detecting human environmental impacts on temporal variations in
natural populations. Australian Journal of Marine and Freshwater
Research 42, 569–588.
White, P., Pickett, S., 1985. Natural disturbance and patch dynamics:
An introduction. In: Pickett, S., White, P. (Eds.), The Ecology of
Natural Disturbance and Patch Dynamics. Academic Press,
Orlando, pp. 3–13.
Whitman, A.A., Hagan, J.M., 2003. Legacy retention: A tool for
retaining biodiversity in managed forests. Manomet Center for
Conservation Sciences, Brunswick, ME. Report No. MM 2003-1.
Whitman, A.A., Hagan, J.M., S.L. Grove., 1999. Herbaceous plant
communities in old growth and partial harvested forest in northern
Maine. Manomet Center for Conservation Sciences, Brunswick,
ME. Report No. MM-9902.
Woodley, S., Forbes, G. (Eds.), 1997. Forest Management Guidelines
to Protect Native Biodiversity in the Fundy Model Forest.
University of New Brunswick, Fredericton, NB.
Top Related
Copyright © 2022 FDOKUMEN

