


Bahasa
Halaman
Hukum


Q4 2013www.businessmonitor.com
KAZAKHSTANAGRIBUSINESS REPORTINCLUDES 5-YEAR FORECASTS TO 2017
ISSN 2044-5717Published by:Business Monitor International

Kazakhstan Agribusiness ReportQ4 2013INCLUDES 5-YEAR FORECASTS TO 2017
Part of BMI’s Industry Report & Forecasts Series
Published by: Business Monitor International
Copy deadline: August 2013
Business Monitor InternationalSenator House85 Queen Victoria StreetLondonEC4V 4ABUnited KingdomTel: +44 (0) 20 7248 0468Fax: +44 (0) 20 7248 0467Email: [email protected]: http://www.businessmonitor.com
© 2013 Business Monitor InternationalAll rights reserved.
All information contained in this publication iscopyrighted in the name of Business MonitorInternational, and as such no part of thispublication may be reproduced, repackaged,redistributed, resold in whole or in any part, or usedin any form or by any means graphic, electronic ormechanical, including photocopying, recording,taping, or by information storage or retrieval, or byany other means, without the express written consentof the publisher.
DISCLAIMERAll information contained in this publication has been researched and compiled from sources believed to be accurate and reliable at the time ofpublishing. However, in view of the natural scope for human and/or mechanical error, either at source or during production, Business MonitorInternational accepts no liability whatsoever for any loss or damage resulting from errors, inaccuracies or omissions affecting any part of thepublication. All information is provided without warranty, and Business Monitor International makes no representation of warranty of any kind asto the accuracy or completeness of any information hereto contained.


CONTENTS
BMI Industry View ............................................................................................................... 7
SWOT .................................................................................................................................. 10Agribusiness ........................................................................................................................................... 10
Industry Forecast .............................................................................................................. 12Dairy Outlook ......................................................................................................................................... 12
Table: Kazakhstan Milk Production & Consumption, 2012-2017 . . . . . . . . . . . . . . . . . . . . . . . . . . . . . . . . . . . . . . . . . . . . . . . . . . . . . . . . . . . . . . . . . . . . . . . . . . . . . . . . . . . . . . 13
Table: Kazakhstan Cheese Production & Consumption, 2012-2017 . . . . . . . . . . . . . . . . . . . . . . . . . . . . . . . . . . . . . . . . . . . . . . . . . . . . . . . . . . . . . . . . . . . . . . . . . . . . . . . . . . 13
Table: Kazakhstan Butter Production & Consumption, 2012-2017 . . . . . . . . . . . . . . . . . . . . . . . . . . . . . . . . . . . . . . . . . . . . . . . . . . . . . . . . . . . . . . . . . . . . . . . . . . . . . . . . . . . 13
Table: Kazakhstan Milk Production & Consumption, 2007-2012 . . . . . . . . . . . . . . . . . . . . . . . . . . . . . . . . . . . . . . . . . . . . . . . . . . . . . . . . . . . . . . . . . . . . . . . . . . . . . . . . . . . . . 15
Table: Kazakhstan Cheese Production & Consumption, 2007-2012 . . . . . . . . . . . . . . . . . . . . . . . . . . . . . . . . . . . . . . . . . . . . . . . . . . . . . . . . . . . . . . . . . . . . . . . . . . . . . . . . . . 15
Table: Kazakhstan Butter Production & Consumption, 2007-2012 . . . . . . . . . . . . . . . . . . . . . . . . . . . . . . . . . . . . . . . . . . . . . . . . . . . . . . . . . . . . . . . . . . . . . . . . . . . . . . . . . . . 15
Livestock Outlook .................................................................................................................................... 16Table: Kazakhstan Poultry Production & Consumption, 2012-2017 . . . . . . . . . . . . . . . . . . . . . . . . . . . . . . . . . . . . . . . . . . . . . . . . . . . . . . . . . . . . . . . . . . . . . . . . . . . . . . . . . . 17
Table: Kazakhstan Pork Production & Consumption, 2012-2017 . . . . . . . . . . . . . . . . . . . . . . . . . . . . . . . . . . . . . . . . . . . . . . . . . . . . . . . . . . . . . . . . . . . . . . . . . . . . . . . . . . . . . 17
Table: Kazakhstan Beef & Veal Production & Consumption, 2012-2017 . . . . . . . . . . . . . . . . . . . . . . . . . . . . . . . . . . . . . . . . . . . . . . . . . . . . . . . . . . . . . . . . . . . . . . . . . . . . . 17
Table: Kazakhstan Poultry Production & Consumption, 2007-2012 . . . . . . . . . . . . . . . . . . . . . . . . . . . . . . . . . . . . . . . . . . . . . . . . . . . . . . . . . . . . . . . . . . . . . . . . . . . . . . . . . . 21
Table: Kazakhstan Pork Production & Consumption, 2007-2012 . . . . . . . . . . . . . . . . . . . . . . . . . . . . . . . . . . . . . . . . . . . . . . . . . . . . . . . . . . . . . . . . . . . . . . . . . . . . . . . . . . . . . 21
Table: Kazakhstan Beef & Veal Production & Consumption, 2007-2012 . . . . . . . . . . . . . . . . . . . . . . . . . . . . . . . . . . . . . . . . . . . . . . . . . . . . . . . . . . . . . . . . . . . . . . . . . . . . . 21
Grains Outlook ....................................................................................................................................... 22Table: Kazakhstan Wheat Production & Consumption, 2012-2017 . . . . . . . . . . . . . . . . . . . . . . . . . . . . . . . . . . . . . . . . . . . . . . . . . . . . . . . . . . . . . . . . . . . . . . . . . . . . . . . . . . . 23
Table: Kazakhstan Corn Production & Consumption, 2012-2017 . . . . . . . . . . . . . . . . . . . . . . . . . . . . . . . . . . . . . . . . . . . . . . . . . . . . . . . . . . . . . . . . . . . . . . . . . . . . . . . . . . . . . 24
Table: Kazakhstan Barley Production & Consumption, 2012-2017 . . . . . . . . . . . . . . . . . . . . . . . . . . . . . . . . . . . . . . . . . . . . . . . . . . . . . . . . . . . . . . . . . . . . . . . . . . . . . . . . . . . 24
Table: Kazakhstan Wheat Production & Consumption, 2007-2012 . . . . . . . . . . . . . . . . . . . . . . . . . . . . . . . . . . . . . . . . . . . . . . . . . . . . . . . . . . . . . . . . . . . . . . . . . . . . . . . . . . . 30
Table: Kazakhstan Corn Production & Consumption, 2007-2012 . . . . . . . . . . . . . . . . . . . . . . . . . . . . . . . . . . . . . . . . . . . . . . . . . . . . . . . . . . . . . . . . . . . . . . . . . . . . . . . . . . . . 30
Table: Kazakstan Barley Production & Consumption, 2007-2012 . . . . . . . . . . . . . . . . . . . . . . . . . . . . . . . . . . . . . . . . . . . . . . . . . . . . . . . . . . . . . . . . . . . . . . . . . . . . . . . . . . . . 30
Commodities Price Analysis ............................................................................................. 31Monthly Grains Strategy ........................................................................................................................... 31
Table: Select Commodities - Performance & BMI Forecasts . . . . . . . . . . . . . . . . . . . . . . . . . . . . . . . . . . . . . . . . . . . . . . . . . . . . . . . . . . . . . . . . . . . . . . . . . . . . . . . . . . . . . . . . . . 39
Table: BMI Commodities Strategy . . . . . . . . . . . . . . . . . . . . . . . . . . . . . . . . . . . . . . . . . . . . . . . . . . . . . . . . . . . . . . . . . . . . . . . . . . . . . . . . . . . . . . . . . . . . . . . . . . . . . . . . . . . . . . . . . . . . . . 40
Monthly Softs Strategy .............................................................................................................................. 41Table: Select Commodities - Performance & BMI Forecasts . . . . . . . . . . . . . . . . . . . . . . . . . . . . . . . . . . . . . . . . . . . . . . . . . . . . . . . . . . . . . . . . . . . . . . . . . . . . . . . . . . . . . . . . . . 49
Table: BMI Commodities Strategy . . . . . . . . . . . . . . . . . . . . . . . . . . . . . . . . . . . . . . . . . . . . . . . . . . . . . . . . . . . . . . . . . . . . . . . . . . . . . . . . . . . . . . . . . . . . . . . . . . . . . . . . . . . . . . . . . . . . . . 50
Upstream Analysis ............................................................................................................ 51Europe GM Outlook ................................................................................................................................. 51
Europe Machinery Outlook ........................................................................................................................ 56
Europe Fertiliser Outlook ......................................................................................................................... 63
Downstream Analysis ....................................................................................................... 69Food ..................................................................................................................................................... 69
Food Consumption ................................................................................................................................. 69
Kazakhstan Agribusiness Report Q4 2013
© Business Monitor International Page 4

Table: Food Consumption Indicators Historical Data And Forecasts 2010-2017 . . . . . . . . . . . . . . . . . . . . . . . . . . . . . . . . . . . . . . . . . . . . . . . . . . . . . . . . . . . . . . . . . . . . . 71
Canned Food ........................................................................................................................................ 71Table: Canned Food Value/Volume Sales Historical Data And Forecasts 2010-2017 . . . . . . . . . . . . . . . . . . . . . . . . . . . . . . . . . . . . . . . . . . . . . . . . . . . . . . . . . . . . . . . . 72
Confectionery ........................................................................................................................................ 72Table: Confectionery Volume/Value Sales Historical Data And Forecasts 2010-2017 . . . . . . . . . . . . . . . . . . . . . . . . . . . . . . . . . . . . . . . . . . . . . . . . . . . . . . . . . . . . . . . . 73
Processed Foods .................................................................................................................................... 75Table: Processed Meat Volume Sales, Production And Trade Historical Data And Forecasts 2010-2017 . . . . . . . . . . . . . . . . . . . . . . . . . . . . . . . . . . . . . . . . . . . 76
Table: Frozen Fruits and Vegetables Volume Sales, Production And Trade Historical Data And Forecasts 2010-2017 . . . . . . . . . . . . . . . . . . . . . . . . . . . . . 76
Baked Products ..................................................................................................................................... 77Table: Baked Products Volume Sales, Production And Trade Historical Data And Forecasts 2010-2017 . . . . . . . . . . . . . . . . . . . . . . . . . . . . . . . . . . . . . . . . . . . 77
Pasta ................................................................................................................................................... 78Table: Pasta Volume Sales, Production And Trade Historical Data And Forecasts 2010-2017 . . . . . . . . . . . . . . . . . . . . . . . . . . . . . . . . . . . . . . . . . . . . . . . . . . . . . . 79
Dairy ................................................................................................................................................... 79Table: Dairy Products Volume Sales, Production And Trade Historical Data And Forecasts 2010-2017 . . . . . . . . . . . . . . . . . . . . . . . . . . . . . . . . . . . . . . . . . . . . 80
Drink .................................................................................................................................................... 82
Alcoholic Drinks ................................................................................................................................... 82Table: Alcoholic Drinks Volume/Value Sales Historical Data And Forecasts 2010-2017 . . . . . . . . . . . . . . . . . . . . . . . . . . . . . . . . . . . . . . . . . . . . . . . . . . . . . . . . . . . . . 83
Soft Drinks .......................................................................................................................................... 85Table: Soft Drinks Value/Volume Sales Historical Data And Forecasts 2010-2017 . . . . . . . . . . . . . . . . . . . . . . . . . . . . . . . . . . . . . . . . . . . . . . . . . . . . . . . . . . . . . . . . . . . 86
Hot Drinks ............................................................................................................................................ 89Table: Hot Drinks Volume/Value Sales Historical Data And Forecasts 2010-2017 . . . . . . . . . . . . . . . . . . . . . . . . . . . . . . . . . . . . . . . . . . . . . . . . . . . . . . . . . . . . . . . . . . . 90
Mass Grocery Retail ................................................................................................................................ 90
Regional Overview ............................................................................................................ 92Regional Overview - Europe ...................................................................................................................... 92
Table: EU Farm Size Statistics In 2007 . . . . . . . . . . . . . . . . . . . . . . . . . . . . . . . . . . . . . . . . . . . . . . . . . . . . . . . . . . . . . . . . . . . . . . . . . . . . . . . . . . . . . . . . . . . . . . . . . . . . . . . . . . . . . . . . 93
Demographic Forecast ..................................................................................................... 98Table: Kazakhstan's Population By Age Group, 1990-2020 ('000) . . . . . . . . . . . . . . . . . . . . . . . . . . . . . . . . . . . . . . . . . . . . . . . . . . . . . . . . . . . . . . . . . . . . . . . . . . . . . . . . . . . . 99
Table: Kazakhstan's Population By Age Group, 1990-2020 (% of total) . . . . . . . . . . . . . . . . . . . . . . . . . . . . . . . . . . . . . . . . . . . . . . . . . . . . . . . . . . . . . . . . . . . . . . . . . . . . . 100
Table: Kazakhstan's Key Population Ratios, 1990-2020 . . . . . . . . . . . . . . . . . . . . . . . . . . . . . . . . . . . . . . . . . . . . . . . . . . . . . . . . . . . . . . . . . . . . . . . . . . . . . . . . . . . . . . . . . . . . . 101
Table: Kazakhstan's Rural And Urban Population, 1990-2020 . . . . . . . . . . . . . . . . . . . . . . . . . . . . . . . . . . . . . . . . . . . . . . . . . . . . . . . . . . . . . . . . . . . . . . . . . . . . . . . . . . . . . . . 101
Methodology .................................................................................................................... 102
Kazakhstan Agribusiness Report Q4 2013
© Business Monitor International Page 5


BMI Industry View
BMI View: We expect the Kazakh grain sector to outperform, especially as Kazakhstan sees more export
opportunities to Central Asia and China. We expect limited growth for the livestock and dairy sectors, as
export potential for both industries will remain limited. Only domestic demand, which we expect to be
strong, could partially encourage domestic production. That said, cheap imports from Russia could put
local growers at a disadvantage. We have not identified any major public company operating in the sector
that we would highlight.
Grains Taking Their Share
Kazakhstan - BMI Market Value By Commodity (% of total)
Note: The BMI Market Value is an addition of all domestically produced commodities' value (calculated
by multiplying the production with the international benchmark prices, converted in US$/tonne); f = forecast.
Source: BMI.
Kazakhstan Agribusiness Report Q4 2013
© Business Monitor International Page 7

Key Forecasts
■ Wheat production to 2016/17: -23.7% to 17.4mn tonnes. Efforts to diversify into oilseeds and otherfield crops and little potential for a repeat of the perfect conditions of 2011/12 will see production fallover our five-year forecast period.
■ Cheese consumption growth to 2017: 51.5% to 81,300 tonnes. This will come from increased demandfor value-added dairy products on the back of accelerating urbanisation and improvements ininfrastructure.
■ Beef production growth to 2016/17: 35.7% to 576,700 tonnes. The comprehensive overhaul of the beefherd continues apace as imported breeding stocks improve quality.
■ 2013 real GDP growth: 5.4%, up from 5.0% in 2012.
■ 2013 average consumer price inflation: 6.2% year-on-year (y-o-y), up from 5.1% y-o-y in 2012.
■ BMI universe agribusiness market value: 35.5% y-o-y decrease to US$6.9bn in 2012/13, forecast togrow on average 9.8% annually between 2011/12 and 2016/17.
Key Revisions To Our Forecasts
■ 2013/14 wheat production revised up from 16.0mn tonnes to 17.0mn tonnes on the back of the latestofficial estimates.
■ 2014 wheat consumption revised up from 6.9mn tonnes to 7.2mn tonnes as lower prices boost localdemand.
■ 2012/13 poultry production revised up from 120,000 tonnes to 125,000 tonnes as the impact of highergrain prices seems to be wearing off.
■ 2012/13 pork production revised down from 231,000 tonnes to 215,000 tonnes owing to lowerpreference among the local population and subdued prospects for exports in the short term.
■ 2012/13 poultry consumption revised up from 369,000 tonnes to 379,500 tonnes because of localpreference for the meat and its price competitiveness compared with other meats.
Industry Outlook
We believe Black Sea countries will see increased grain demand from Asia in the coming years after the
region was largely ignored for at least the past three seasons. Disappointing harvests in Asian countries'
traditional suppliers, mainly the US, Australia and India, partially account for this. In addition, rising middle
classes and changing dietary habits are increasingly putting strains on the region's grain production balance;
this will force Asian importers to look for increased volumes and lower prices for grain purchases in the
medium term.
Kazakhstan Agribusiness Report Q4 2013
© Business Monitor International Page 8

We believe Kazakhstan has the potential to improve the quality and efficiency of its meat output via a
strong increase in cattle imports. This supports our forecast for beef production to grow by 35.7% out to the
end of our forecast period, to 576,720 tonnes in 2017. In 2011, the Ministry of Agriculture announced a
plan for 'the development of beef export potential for Kazakhstan' to be implemented in two phases. The
first phase, covering 2011-2015, targets the rapid expansion of the number of high-yielding breeding cattle
in Kazakhstan. The second phase, from 2016-2020, would push for the development of beef export
potential.
The Board of the Eurasian Economic Commission has increased custom duties on several dairy products in
order to protect domestic dairy producers against cheap competition in a context of high domestic feed and
strong demand. The duties were raised on butter, cottage cheese and dairy spreads from 15% to 20%. For
other types of dairy products, such as grated and powdered cheese, including Schabziger, duties were raised
to 20%. Import duties on feta cheese made from cow milk were taken to 25% of their customs value
(against 15% currently).
Kazakhstan Agribusiness Report Q4 2013
© Business Monitor International Page 9

SWOT
Agribusiness
SWOT Analysis
Strengths ■ Kazakhstan has fertile soil and a strong agricultural tradition.
■ More than 70% of Kazakhstan's land area is occupied by agricultural crops and
animal husbandry.
■ The recent efforts from the government to develop the industry will very likely help to
boost production over the long term.
Weaknesses ■ Decades of collective and state farming with little incentive to maximise production
have left Kazakhstan's agriculture with poor yields by international standards.
■ Aging Soviet-era infrastructure increases costs and makes expansion into new areas
difficult.
■ Many farmers lack the skills to run a profitable business without government aid.
• Because the country is land-locked and transportation infrastructure is lacking,
shipping costs for grains to the export market make the crop uncompetitive
compared with other Black Sea region producers such as Russia and Ukraine.
Opportunities ■ Poor yields leave much room for increasing production through better farming
practices.
■ The government has invested heavily in the development of large and efficient
corporate farms, creating greater opportunity for further expansion.
■ Rising disposable incomes will enable domestic demand for food products to pick up.
• Because of recently tight grains markets by historical standards, export demand is
likely to be sufficient to encourage production growth in Kazakhstan.
Threats ■ The global recession hit Kazakhstan hard. We estimate GDP growth was only 1.2% in
2009, accompanied by a rapid fall in consumer expenditure. While GDP growth has
Kazakhstan Agribusiness Report Q4 2013
© Business Monitor International Page 10

SWOT Analysis - Continued
since recovered, the eurozone crisis could continue to constrain the country's growth
and thus consumer demand.
■ The rural population is declining rapidly, with many young people heading for the
cities.
• Much of the country suffered from environmental degradation in Soviet times; if not
dealt with, this could threaten agricultural production in the future.
Kazakhstan Agribusiness Report Q4 2013
© Business Monitor International Page 11

Industry Forecast
Dairy Outlook
BMI Supply View: We forecast a 1.4% year-on-year (y-o-y) decline in milk production in 2012/13 to
4.9mn tonnes. This fall in production reflects damage to pastures due to the severe drought in summer 2012.
In the medium term, the country's output growth is likely to be limited, as 90% of dairy production comes
from the household sector, with most output for home consumption. Over the longer term, however, we are
positive about the government's recent plan for the development of large-scale modern dairy farms and its
significant investment in machinery for these farms. Therefore, we see plenty of room for growth coming
from the commercialisation of the sector and forecast milk production to rise 23.9% on the 2011/12 level to
6.1mn tonnes by 2016/17.
Less than 40% of milk produced in Kazakhstan is processed in formal dairy plants. This is because of the
uneven availability of fresh milk between summer and winter, the high cost of transportation, as well as the
poor quality of the milk produced in the country. Therefore, we maintain our view for cheese and butter
production to be subdued over our forecast period. We forecast cheese and butter production to come in at
24,090 and 18,060 tonnes respectively in 2012/13, reflecting increases of 9.0% and 14.0% y-o-y. Out to
2016/17, we expect cheese and butter production to remain low, at 30,600 and 23,650 tonnes respectively.
BMI Demand View: In 2013, we expect fluid milk consumption growth of 3.6% y-o-y to 4.9mn tonnes.
Even if demand is lower than domestic production, we see room for some imports because of the low
quality of domestic milk and the potential for spoilage. Out to 2017, we forecast milk consumption to grow
19.6% to 5.7mn tonnes, as a boost in production is likely to continue to increase milk demand.
However, we expect most dairy sector consumption growth to come from increased demand for processed
and higher-value dairy goods. This trend will be especially evident outside of Kazakhstan's major urban
centres, where underdeveloped infrastructure has to date impeded the distribution of perishable dairy items.
In line with this, we forecast cheese and butter consumption to grow 51.5% and 65.6% respectively to 2017.
Kazakhstan Agribusiness Report Q4 2013
© Business Monitor International Page 12

Table: Kazakhstan Milk Production & Consumption, 2012-2017
2012e 2013f 2014f 2015f 2016f 2017f
Milk Production, '000 tonnes 2 4,919.2 4,850.2 5,303.9 5,554.9 5,815.9 6,096.9
Liquid Milk Consumption, '000 tonnes 1,3 4,761.6 4,930.5 5,136.2 5,339.1 5,526.0 5,694.5
Notes: e BMI estimates. f BMI forecasts. 1 Based on food supply data; estimated after 2005. Sources: 2 The Agency ofStatistics of the Republic of Kazakhstan, BMI; 3 FAO.
Table: Kazakhstan Cheese Production & Consumption, 2012-2017
2012e 2013f 2014f 2015f 2016f 2017f
Cheese Production, '000 tonnes 1 22.1 24.1 25.8 27.3 29.0 30.6
Cheese Consumption, '000 tonnes 2 53.0 58.4 63.7 69.2 75.1 81.3
Notes: e BMI estimates. f BMI forecasts. Sources: 1 UN Industrial Commodity Statistics Database; 2 UN IndustrialCommodity Statistics Database, UN Comtrade, BMI calculation.
Table: Kazakhstan Butter Production & Consumption, 2012-2017
2012e 2013f 2014f 2015f 2016f 2017f
Butter Production, '000 tonnes 1 15.8 18.1 20.2 22.7 24.9 23.7
Butter Consumption, '000 tonnes 2 38.3 43.0 47.9 53.0 58.5 64.3
Notes: e BMI estimates. f BMI forecasts. Sources: 1 UN Industrial Commodity Statistics Database; 2 UN IndustrialCommodity Statistics Database, UN Comtrade, BMI calculation.
More Protectionist Measures To Aid Competitiveness Of Sector
The Board of the Eurasian Economic Commission (EEC) announced recently it would increase custom
duties on several dairy products in order to protect domestic dairy producers against cheap competition in a
context of high domestic feed and strong demand. The duties were raised on butter, cottage cheese and dairy
spreads from 15% to 20%. For other types of dairy products, such as grated and powdered cheese, including
Schabziger, duties were raised to 20%. Import duties on feta cheese made from cow milk were taken to 25%
of their customs value (against 15% currently).
Kazakhstan Agribusiness Report Q4 2013
© Business Monitor International Page 13

The EEC was established upon the decision of the presidents of Russia, Belarus and Kazakhstan at the end
of 2011. It is a single permanent regulating body of the Customs Union and the Single Economic Space. We
believe the recent restrictions in dairy imports were linked to difficult operating environment for dairy
producers in all three countries and the aim to protect them against foreign competition, especially from
Western Europe. All three markets are not concentrated and particularly vulnerable to shocks, such as
soaring input costs in 2012.
Investment To Boost Production In Spite Of Remaining Challenges
The Kazakh government has announced that it wants to invest US$1.5bn in milk and meat production in the
coming years in order to address major challenges facing both sectors. After the dissolution of the Soviet
Union, Kazakhstan lost its major export markets for dairy products, which resulted in milk production
plummeting by 40.0% in four years. This also drastically cut herds; levels have not yet regained their 1992
levels.
Kazakhstan's dairy sector is inefficient and uncompetitive, which makes it unlikely to find other export
markets of the size of the former Soviet Union. The quality of milk is poor, and agricultural workers'
productivity is very low. This is partly because small farms account for 90% of production, and because
most of the output is directed at household consumption. Historically, there has been little incentive for
production to increase beyond that level, especially as levels of government support to the sector have been
very low.
Foot-And-Mouth A Constant Threat
In 2011, Kazakhstan was hit by a number of foot-and-mouth disease (FMD) outbreaks, showing that the
disease continues to pose a serious risk to the country's dairy and beef industries. The country was affected
by three consecutive disease outbreaks in two villages in Uralsk in north-west Kazakhstan and in the village
of Kurchumskiy in eastern Kazakhstan. That incident resulted in the destruction of 69 animals. While all
three outbreaks were contained, there remains the possibility of a wider epidemic, and we see this as posing
downside risk to our forecasts through our outlook period.
Throughout the summer of 2012, cases were reported in the east of the country. Out of 1,040 susceptible
cattle, 721 cases were reported. All affected animals were destroyed. The source of the outbreak has yet to
be determined.
Kazakhstan Agribusiness Report Q4 2013
© Business Monitor International Page 14

In June 2013, more cases were reported in the east of the country. According to the World Organisation for
Animal Health, a total of 2111 cattle were found susceptible to the FMD virus (serotype A), out of which 50
cases were reported. A total of 901 animals were destroyed.
Table: Kazakhstan Milk Production & Consumption, 2007-2012
2007 2008 2009 2010 2011 2012e
Milk Production, '000 tonnes 2 5,073.2 5,198.0 5,303.0 5,381.0 5,235.0 4,919.2
Liquid Milk Consumption, '000 tonnes 1,3 3,978.7 4,165.0 4,233.1 4,491.1 4,612.8 4,761.6
Notes: e BMI estimates. 1 Based on food supply data; estimated after 2005. Sources: 2 The Agency of Statistics of theRepublic of Kazakhstan, BMI; 3 FAO.
Table: Kazakhstan Cheese Production & Consumption, 2007-2012
2007 2008 2009 2010 2011 2012e
Cheese Production, '000 tonnes 1 19.4 17.7 18.1 18.8 20.0 22.1
Cheese Consumption, '000 tonnes 2 36.4 39.0 40.5 45.5 49.6 53.0
Notes: e BMI estimates. Sources: 1 UN Industrial Commodity Statistics Database; 2 UN Industrial Commodity StatisticsDatabase, UN Comtrade, BMI calculation.
Table: Kazakhstan Butter Production & Consumption, 2007-2012
2007 2008 2009 2010 2011 2012e
Butter Production, '000 tonnes 1 19.7 16.6 15.3 14.0 14.6 15.8
Butter Consumption, '000 tonnes 2 27.0 23.3 24.8 31.5 35.3 38.3
Notes: e BMI estimates. Sources: 1 UN Industrial Commodity Statistics Database; 2 UN Industrial Commodity StatisticsDatabase, UN Comtrade, BMI calculation.
Risks To Outlook
We see upside risks to our Kazakh fluid milk production forecasts. Our current growth projections assume a
similar level of commercialisation over the next five years as has occurred over our review period.
Kazakhstan Agribusiness Report Q4 2013
© Business Monitor International Page 15

However, a wider government push towards improved food security, coupled with increased private sector
investment in agriculture, could see this rate of commercialisation accelerate. This would translate into
greater efficiencies and higher output quality and could see our currently reasonably modest milk
production growth forecasts surpassed.
Another outbreak of foot-and-mouth disease hit Kazakh dairy herds again in 2013. It has been contained so
far. We see the possibility of a wider outbreak posing downside risk to our milk production forecasts.
Livestock Outlook
BMI Supply View: We have revised up our 2012/13 forecast for poultry production to 125,000 tonnes
(from 120,000 tonnes previously). Over the forecast period, poultry is expected to be the outperformer of
the livestock sector, with output increasing by 69.2% to reach 203,000 tonnes by 2016/17. The
government's subsidy programme, combined with an import tariff system and financial support for new
enterprises, will underpin this growth. We also highlight renewed private sector interest in the sector, which
is likely to enhance efficiency and quality of the industry over the medium term. The sector nevertheless
faces challenges, notably rising feed prices and a lack of expertise.
We have revised down our forecast for 2012/13 pork production and now expect output to stagnate at
215,000 tonnes. Similarly, beef production is projected to stagnate at 425,000 tonnes in 2012/13. Over our
forecast period, all sectors of Kazakhstan's livestock industry are forecast to experience solid growth.
Government investment, including initiatives to improve livestock farming standards and encourage greater
industry participation, is part of a wider plan to improve the country's food self-sufficiency. With meat
representing a large part of the traditional Kazakh diet, the livestock industry is set to be a major
beneficiary. A government drive to improve the country's bovine genetics by importing stock from the US
is likely to have a fairly powerful effect on beef production, helping it to expand by 35.7% over our forecast
period, reaching 576,700 tonnes in 2016/17.
BMI Demand View: As with production, demand across all Kazakh livestock sectors will be robust,
although poultry is set to be the outperformer. To 2017, poultry demand is forecast to increase by 43.6%,
while consumption of pork and beef will increase by 29.1% and 17.2% respectively. The outperformance of
poultry will be a product of its lower starting point - it is not as widely consumed as pork or beef - but will
also be a result of the increased presence of imported processed poultry goods on the local market. More
generally, livestock consumption will benefit from strong domestic production increases, which will help to
improve product affordability, as well as from Kazakhstan's healthy forecast economic growth outlook,
which will increase demand for processed livestock products.
Kazakhstan Agribusiness Report Q4 2013
© Business Monitor International Page 16

Table: Kazakhstan Poultry Production & Consumption, 2012-2017
2012e 2013f 2014f 2015f 2016f 2017f
Poultry Production, '000 tonnes 1 120.0 125.0 125.0 146.0 171.0 203.0
Poultry Consumption, '000 tonnes 2 345.0 379.5 405.7 433.7 463.6 495.6
Notes: e BMI estimates. f BMI forecasts. Sources: 1 Official Statistics of Kazakhstan, USDA; 2 USDA.
Table: Kazakhstan Pork Production & Consumption, 2012-2017
2012e 2013f 2014f 2015f 2016f 2017f
Pork Production, '000 tonnes 1 215.0 215.0 237.9 244.5 251.1 257.7
Pork Consumption, '000 tonnes 2 231.0 243.0 258.4 272.9 286.3 298.2
Notes: e BMI estimates. f BMI forecasts. Sources: 1 Official Statistics of Kazakhstan, USDA; 2 USDA.
Table: Kazakhstan Beef & Veal Production & Consumption, 2012-2017
2012e 2013f 2014f 2015f 2016f 2017f
Beef & Veal Production, '000 tonnes 1 425.0 425.0 450.0 508.6 542.6 576.7
Beef & Veal Consumption, '000 tonnes 454.0 454.0 474.9 495.0 514.1 531.9
Notes: e BMI estimates. f BMI forecasts. Sources: 1 Official Statistics of Kazakhstan, USDA.
Support To Beef Sector To Aid Export Capacity
We believe Kazakhstan has the potential to improve the quality and efficiency of its meat output via a
strong increase in cattle imports. This supports our forecast for beef production to grow by 35.7% out to the
end of our forecast period, to 576,720 tonnes in 2017. In 2011, the Ministry of Agriculture announced a
plan for 'the development of beef export potential for Kazakhstan' to be implemented in two phases. The
first phase, covering 2011-2015, targets the rapid expansion of the number of high-yielding breeding cattle
in Kazakhstan. The second phase, from 2016-2020, would push for the development of beef export
potential.
Kazakhstan Agribusiness Report Q4 2013
© Business Monitor International Page 17

Recovering Slowly
Kazakhstan - Cattle Numbers ('000 head)
Source: Kazakhstan Statistics Agency
The strategy has been so far a success, as it has encouraged a boom in import demand for better-quality
cattle. Cattle imports into Kazakhstan climbed from just 1,556 head in 2009 (worth US$6mn) to more than
16,713 head in 2012 (worth US$66mn). In 2012, Kazakhstan imported mostly from the United States and
the EU, while Canada and Australia took a smaller share of the country's purchases. Most of the imports
were of beef breeds (primarily Angus).
Kazakhstan Agribusiness Report Q4 2013
© Business Monitor International Page 18

Booming Imports
Kazakhstan - Cattle Imports (head)
Source: Kazakhstan Customs, USDA
We expect these trends to accelerate further in the coming years, as the Kazakh government announced in
February that large-scale subsidised imports of cattle will continue. The goal is to develop the country's
herds back to the level seen at the start of the 1990s, when the country still had the capacity to export beef.
For 2013, an import target of 21,000 head of cattle has been set. This compares with 16,713 imported in
2012, and 13,892 imported in 2011. In addition to cattle imports, the plan also outlines goals for increased
use of semen for in vitro fertilisation and increased use of transplanted bovine embryos. The subsidy for
breeding cattle was set at KZT235,000 (US$1,555) for cattle from Australia or North and South America,
and KZT154,000 (US$1,020) for cattle from Europe.
Kazakhstan Agribusiness Report Q4 2013
© Business Monitor International Page 19

Looking For US Heifers
Kazakhstan - Cattle Imports By Country (LHS) & Type (% of total, RHS)
Source: Kazakhstan Ministry of Agriculture, USDA
Government support, combined with renewed private interest in the sector, underpins our forecast for the
country's beef production deficit to narrow over the coming years and turn into a small surplus out to 2017.
That said, we still believe the government is being too optimistic in expecting a return to 1990s production
levels by 2020. We forecast beef production to reach 576,720 tonnes in 2017; the country produced
600,000-700,000 tonnes in the early 1990s, which allowed steady exports every year. We would revise up
our forecasts if we see clear signs that the country's booming cattle imports and improvements in
genetics aid production capacity over the medium term. Also, we would need to see better quality and safety
standards in place if the country wants to be a reliable export source for some markets.
Private Sector Interest Highlights Strong Growth Potential
In the Kazakh poultry sector, we believe the recent US$108mn investment by Israeli technology provider
MAD Corporation to build five large poultry farms in the north of the country will unleash growth
potential in the sector. This is in addition to strong government support for the industry. Even though the
sector has benefited from large feed subsidy programmes, poultry production is still hampered by a lack of
breeding material as well as the vulnerability of animals to disease, as well as the lack of high-quality
vaccines to treat them. We expect the project to improve poultry farming technology and quality. We also
Kazakhstan Agribusiness Report Q4 2013
© Business Monitor International Page 20

believe these types of projects could attract other private companies to the country, boosting private
investment in the sector in the medium term.
As a result of these developments, we have revised up our forecasts for poultry production in Kazakhstan
out to 2016/17. We now forecast output to reach 203,000 tonnes out to 2016/17, as experts project annual
production of 50,000-70,000 tonnes from the new projects, with full capacity reached in four years.
Table: Kazakhstan Poultry Production & Consumption, 2007-2012
2007 2008 2009 2010 2011 2012e
Poultry Production, '000 tonnes 1 65.0 75.0 90.0 101.0 100.0 120.0
Poultry Consumption, '000 tonnes 2 209.0 206.0 199.0 225.0 278.0 345.0
Notes: e BMI estimates. Sources: 1 Official Statistics of Kazakhstan, USDA; 2 USDA.
Table: Kazakhstan Pork Production & Consumption, 2007-2012
2007 2008 2009 2010 2011 2012e
Pork Production, '000 tonnes 1 194.0 206.0 209.0 206.0 214.0 215.0
Pork Consumption, '000 tonnes 2 207.0 215.0 220.0 216.0 225.0 231.0
Notes: e BMI estimates. Sources: 1 Official Statistics of Kazakhstan, USDA; 2 USDA.
Table: Kazakhstan Beef & Veal Production & Consumption, 2007-2012
2007 2008 2009 2010 2011 2012e
Beef & Veal Production, '000 tonnes 1 370.0 384.0 400.0 407.0 415.0 425.0
Beef & Veal Consumption, '000 tonnes 414.0 419.0 411.0 422.0 433.0 454.0
Notes: e BMI estimates. Sources: 1 Official Statistics of Kazakhstan, USDA.
Kazakhstan Agribusiness Report Q4 2013
© Business Monitor International Page 21

Risks To Outlook
The key risks to our outlook relate to production and are weighted to the downside. If oil prices remain
subdued, we expect ongoing government investment in economic diversification. Agriculture and livestock
are likely to be key beneficiaries of this diversification owing to the secondary government initiative of
improving food security. However, any sustained uptick in oil prices could undermine this drive. Such an
uptick would mean greater oil revenues to invest, but it would also mean far lower urgency in terms of the
need for diversification.
Another general downside risk relates to possible disease outbreaks, particularly an outbreak of bird flu in
the case of our optimistic poultry production forecast. Kazakhstan's poultry industry has been growing
strongly in recent years. However, it remains under-invested and, consequently, the impact of a disease
outbreak in what remains a relatively immature agricultural sub-sector could be pronounced. The outbreak
of foot-and-mouth disease in eastern Kazakhstan in July 2012 shows the disease remains a threat and poses
downside risk to our pork and beef forecasts.
Grains Outlook
BMI Supply View: We have revised up slightly our 2013/14 wheat production forecast to 17.0mn tonnes
(compared with a previous forecast of 16.0mn tonnes) on the back of the latest official estimates. This still
represents a significant 73.4% year-on-year (y-o-y) rebound, as weather conditions have improved. Even
though in 2013/14 the country is expected to plant the same area for wheat as in 2012/13, area harvested is
likely to be slightly higher, and yields are expected to recover strongly, boosting total wheat production
back to 2010 levels. We expect wheat production to increase gradually by an average of 5.0% annually over
the last three years of our forecast period, reaching 17.4mn tonnes in 2016/17, which is still below the
2011/12 level.
The barley crop is also forecast to recover strongly in 2013/14, by 40.0% to 2.1mn tonnes. This will come
from increased area dedicated to the crop at the expense of wheat as the government seeks to decrease its
dependence on wheat production and exports. Also, barley yields will most likely recover from their low in
2012/13, when the crop was affected by droughts to the same extent as the wheat crop was. We forecast
barley production to increase by an average of 2.0% annually over the last three years of our forecast
period, reaching 2.3mn tonnes in 2016/17.
Kazakhstan Agribusiness Report Q4 2013
© Business Monitor International Page 22
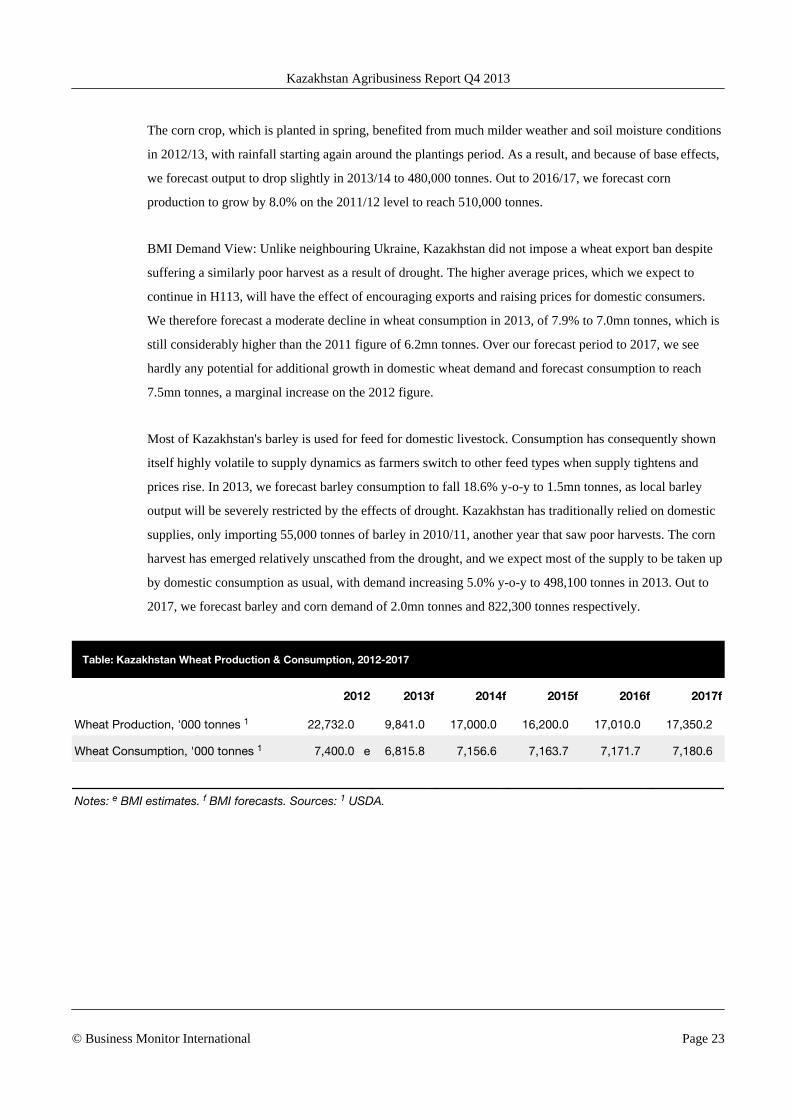
The corn crop, which is planted in spring, benefited from much milder weather and soil moisture conditions
in 2012/13, with rainfall starting again around the plantings period. As a result, and because of base effects,
we forecast output to drop slightly in 2013/14 to 480,000 tonnes. Out to 2016/17, we forecast corn
production to grow by 8.0% on the 2011/12 level to reach 510,000 tonnes.
BMI Demand View: Unlike neighbouring Ukraine, Kazakhstan did not impose a wheat export ban despite
suffering a similarly poor harvest as a result of drought. The higher average prices, which we expect to
continue in H113, will have the effect of encouraging exports and raising prices for domestic consumers.
We therefore forecast a moderate decline in wheat consumption in 2013, of 7.9% to 7.0mn tonnes, which is
still considerably higher than the 2011 figure of 6.2mn tonnes. Over our forecast period to 2017, we see
hardly any potential for additional growth in domestic wheat demand and forecast consumption to reach
7.5mn tonnes, a marginal increase on the 2012 figure.
Most of Kazakhstan's barley is used for feed for domestic livestock. Consumption has consequently shown
itself highly volatile to supply dynamics as farmers switch to other feed types when supply tightens and
prices rise. In 2013, we forecast barley consumption to fall 18.6% y-o-y to 1.5mn tonnes, as local barley
output will be severely restricted by the effects of drought. Kazakhstan has traditionally relied on domestic
supplies, only importing 55,000 tonnes of barley in 2010/11, another year that saw poor harvests. The corn
harvest has emerged relatively unscathed from the drought, and we expect most of the supply to be taken up
by domestic consumption as usual, with demand increasing 5.0% y-o-y to 498,100 tonnes in 2013. Out to
2017, we forecast barley and corn demand of 2.0mn tonnes and 822,300 tonnes respectively.
Table: Kazakhstan Wheat Production & Consumption, 2012-2017
2012 2013f 2014f 2015f 2016f 2017f
Wheat Production, '000 tonnes 1 22,732.0 9,841.0 17,000.0 16,200.0 17,010.0 17,350.2
Wheat Consumption, '000 tonnes 1 7,400.0 e 6,815.8 7,156.6 7,163.7 7,171.7 7,180.6
Notes: e BMI estimates. f BMI forecasts. Sources: 1 USDA.
Kazakhstan Agribusiness Report Q4 2013
© Business Monitor International Page 23

Table: Kazakhstan Corn Production & Consumption, 2012-2017
2012 2013f 2014f 2015f 2016f 2017f
Corn Production, '000 tonnes 1 482.0 500.0 480.0 490.0 500.0 510.0
Corn Consumption, '000 tonnes 1 475.0 e 498.8 514.1 601.5 703.7 823.3
Notes: e BMI estimates. f BMI forecasts. Sources: 1 USDA.
Table: Kazakhstan Barley Production & Consumption, 2012-2017
2012 2013f 2014f 2015f 2016f 2017f
Barley Production, '000 tonnes 1 2,593.0 1,500.0 2,096.0 2,148.4 2,202.1 2,257.2
Barley Consumption, '000 tonnes 1 1,825.0 e 1,485.1 1,793.4 1,861.8 1,918.3 1,976.4
Notes: e BMI estimates. f BMI forecasts. Sources: 1 USDA.
Export Potential Shifting East
We believe Black Sea countries will see increased grain demand from Asia in the coming years after the
region was largely ignored for at least the past three seasons. Disappointing harvests in Asian countries'
traditional suppliers, mainly the US, Australia and India, partially account for this. In addition, rising middle
classes and changing dietary habits are increasingly putting strains on the region's grain production balance;
this will force Asian importers to look for increased volumes and lower prices for grain purchases in the
medium term.
Thailand and the Philippines have already bought 200,000 tonnes of wheat from Black Sea countries in
recent months, and traders expect between 2.0mn and 2.5mn tonnes to flow into Asia in 2013/14. Thailand
bought Black Sea wheat for US$280-285/tonne, including cost and freight, while the Philippines purchased
wheat for US$282/tonne. India quoted about US$320-325/tonne for similar quantities. We see potential for
other large wheat importers in the region, such as Indonesia, China and Bangladesh, to turn to the Black Sea
region in the coming months, especially as we expect a bumper harvest in all the producing countries of the
region (we forecast a 41.4% year-on-year rebound in wheat production in Russia, Ukraine and Kazakhstan).
Kazakhstan Agribusiness Report Q4 2013
© Business Monitor International Page 24

Surging Import Demand
Select Asian Countries - Corn (LHS) & Wheat (RHS) Imports ('000 tonnes)
Source: USDA, BMI
More specifically, we see tremendous potential for China to increase its corn imports from Ukraine in the
coming years. A recent agreement between both governments could result in the delivery of 2mn-4mn
tonnes of corn from Ukraine to China for the 2013/14 season. As part of the agreement, Ukraine's State
Food Grain Corporation (GPZKU) obtained a US$1.5bn loan to finance improvements to the former Soviet
republic's agriculture. GPZKU will then export its grain output via Chinese operator China National
Machinery Complete Industry Engineering Corporation. Most of the grain shipped will be corn given
China's booming import demand for the feed. We believe this will come on the back of China's aim to
diversify away from the US as its major supplier for corn and soybean. As China has so far failed to develop
reliable supply agreements with Brazil and Argentina because of infrastructure and administrative
bottlenecks, Ukraine, which exported 12.9% of global corn in 2011/12, would be an efficient alternative.
Kazakhstan Agribusiness Report Q4 2013
© Business Monitor International Page 25

Asia Still Small Share Of Black Sea Exports
Ukraine (LHS) & Russia (RHS) - Wheat Exports By Region/Country (% of total)
Note: Ukraine exports are for 2011/12 season; Russian exports are for H113; Source: USDA, Sovecon
As a result of this emerging demand and significant long-term growth potential, we have seen tailored port
capacity coming online in the region. The plan by Russia's United Grain Company to develop a grain
terminal on Russia's Far East coast will serve that purpose. Russia is seeing grain shipments to Asia
expanding very fast (set to increase to about 1mn tonnes in 2012/13, compared with almost nothing in
2011/12) but is lacking the relevant infrastructure to keep up with demand. The development of shipping
capacity in Siberia and the Far East will make Russia even more competitive than it is currently on Asian
markets.
Kazakhstan Agribusiness Report Q4 2013
© Business Monitor International Page 26

Upside Potential For Far East Russian Ports
Port of Vostochny - Throughput ('000 tonnes) & Growth (% year-on-year)
e/f = BMI estimate/forecast. Source: Port Authority
Ukraine is pouring investment into its grain port terminal capacity in order to be better prepared for the
surge in demand from Asia. Recent financing projects aim to increase Illichivsk port's annual capacity from
30mn tonnes to 76mn tonnes. A new grain terminal was launched at the port of Odessa in April, with 11
reservoirs, a total capacity of 72,400 tonnes, brought online. The grain terminal will have a final annual
capacity of between 2mn and 3mn tonnes and will be one of the most advanced terminals in the Black Sea.
For Kazakhstan, transport subsidies support exports to Russian and Baltic ports, in turn directed to Asia,
mainly China. Approximately 160,000 tonnes of grain was shipped to China in 2011/12, compared with just
31,000 tonnes the year before. Also, Kazakhstan launched its own grain terminal in the Iranian port of
Amirabad (which it supplies from its port of Aktau). BMI believes that this will offer Kazakhstan the ability
to not only cater for Iranian demand, but also to Asia as grains will be shipped to Amirabad, freighted
through Iran and then shipped out to central and eastern Asia, via Iran's ports on the Persian Gulf.
Kazakhstan Agribusiness Report Q4 2013
© Business Monitor International Page 27

Booming Export Capacity
Black Sea Countries - Wheat Exports ('000 tonnes)
f = BMI forecast. Source: USDA, Sovecon
Only developed markets (and established grain importers) in Asia will resist the renewed attractiveness of
Black Sea grains. In fact, we expect Japan and South Korea to stay with their current traditional suppliers
(mainly the US), as they are far less price sensitive markets and more wary of the quality of imported
products. Also, volatility in export capacity could be an issue for these markets, as they import roughly the
same amount of grains every season and are looking for long-term supply agreements with exporters. This
will be less of a critical point for emerging grain importers in the region, as they are constantly looking for
the best bargain on global markets rather than long-term security of supply. Only India and China could be
exceptions to this rule.
Output Recovery, Diversification On The Cards
We forecast wheat production in Kazakhstan to recover by 73.4% in 2013/14 to 17.0mn tonnes thanks to
higher yields. The strong growth in output follows losses seen in 2012/13 as a result of severe droughts.
Area harvested is set to increase by about 7.2% in 2013/14, while yields are set to recover by more than
40%.
Kazakhstan Agribusiness Report Q4 2013
© Business Monitor International Page 28

Kazakhstan's objective to diversify away from wheat production is likely to push the country's corn and
barley production higher in 2013/14. The country has faced challenges in terms of getting wheat exports to
distant markets, and the government is pushing to increase domestic livestock and poultry production. The
area dedicated to feed crops and oilseeds is therefore likely to be prioritised at the expense of wheat. In
recent years, wheat planted area has represented 64% of all planted area in Kazakhstan, and 83% of grain
and pulse planted area. We believe the share allocated to wheat will decrease in the near term.
We expect an improvement in the grain production balance will benefit the country's exports in 2013/14.
Kazakh wheat exports remained particularly subdued in 2012/13, even below capacity. The US Department
of Agriculture estimates that the country exported about 6.5mn tonnes in 2012/13, while the production
balance stood at 3.0mn tonnes and stocks at a record of 11.8mn tonnes. Kazakh wheat prices were
supported by high prices in Russia, which saw wheat production almost halved owing to droughts in
2012/13. Kazakhstan also massively increased shipments to the region in order to fill the regional deficit,
which we see as temporary. In fact, we expect the country to boost exports to non-former Soviet Union
countries in 2013/14.
Overall, we see strong potential for growth in grain production and exports for Kazakhstan in the medium
term on the back of increased government support to the sector. In 2012, the Ministry of Agriculture
announced a number of programmes to support spring sowing and the 2013/14 crop production in general.
These included a KZT60bn (US$400mn) budgetary loan to major players in the sector, such as KazAgro
Holding. These funds will give preferential rates to farmers in order to support plantings as well as help
microcredit institutions propping up the sector. The ministry also launched a forward purchasing of wheat
and barley at a rate of KZT6,000/ha (US$40/ha), representing a total budget of KZT13bn (US$86mn). The
government also increasingly makes sure that relevant fuel, machinery, seeds and fertiliser supply are made
available to farmers.
Our outlook for grain prices will be supportive of increased plantings and investment in these crops in
Kazakhstan, as well as export demand, especially from Asia. We forecast wheat prices to remain
particularly elevated in the short term, while all grains are expected to trade at a premium compared with
their historical average in the coming years. Our strong forecasts for consumption growth in Asia, and the
country's development into these markets, will also boost revenues and investment in grain crops out to
2016/17.
Kazakhstan Agribusiness Report Q4 2013
© Business Monitor International Page 29

Table: Kazakhstan Wheat Production & Consumption, 2007-2012
2007 2008 2009 2010 2011 2012
Wheat Production, '000 tonnes 1 13,460.5 16,466.9 12,538.2 17,051.0 9,638.0 22,732.0
Wheat Consumption, '000 tonnes 1 7,500.0 7,500.0 7,500.0 7,600.0 6,200.0 7,400.0 e
Notes: e BMI estimates. Sources: 1 USDA.
Table: Kazakhstan Corn Production & Consumption, 2007-2012
2007 2008 2009 2010 2011 2012
Corn Production, '000 tonnes 1 414.0 421.0 420.0 470.8 462.0 482.0
Corn Consumption, '000 tonnes 1 425.0 425.0 425.0 425.0 450.0 475.0 e
Notes: e BMI estimates. Sources: 1 USDA.
Table: Kazakstan Barley Production & Consumption, 2007-2012
2007 2008 2009 2010 2011 2012
Barley Production, '000 tonnes 1 1,953.0 2,441.0 2,059.0 2,519.0 1,313.0 2,593.0
Barley Consumption, '000 tonnes 1 1,350.0 1,700.0 1,850.0 2,000.0 1,475.0 1,825.0 e
Notes: e BMI estimates. Sources: 1 USDA.
Risks To Outlook
The high prices Kazakh growers received for their wheat crop in 2012 may provide them with the capital to
make further investments, for instance, in improved mechanisation and storage. This represents an upside
risk to our forecasts. Drought, which in 2012 resulted in y-o-y falls in grains production of around 50%,
shows that the weather remains an ever-present risk to our forecasts.
Kazakhstan Agribusiness Report Q4 2013
© Business Monitor International Page 30

Commodities Price Analysis
Monthly Grains Strategy
■ Having declined steadily since Q412 in line with our view, we believe grain prices will find a base inQ413 as prices approach key support levels and planting prospects in the Southern Hemispheredeteriorate due to the lower prices.
■ Corn prices could stage a temporary recovery following recent weakness, as we believe the bulk of theprice declines are behind us. Corn (and to a lesser extent soybean) are expected to experience a period ofvolatile prices in the coming weeks leading up to the US harvest.
■ Wheat prices will remain supported owing to strong import demand from China and reduced plantingprospects in the Southern Hemisphere.
• Rice prices will face downside pressure in the coming months as the Thai government releases stockson the international market.
Grain Feels The Pain (weekly chart)
S&P GSCI Grains Index
Source: Bloomberg
Kazakhstan Agribusiness Report Q4 2013
© Business Monitor International Page 31

Corn: Temporary Strength After Free Fall
Our view of corn prices breaking below multi-year support around USc650/bushel has played out, and we
now see prices forming a base around support at USc425/bushel in the coming weeks. Prices have collapsed
in recent weeks: the US harvest remains on track for a significant rebound in 2013/14 owing to better
weather, and key demand drivers such as the livestock sector remain comparatively subdued. We have also
revised our 2013 and 2014 price forecasts lower to USc600/bushel and USc525/bushel respectively. The
view for lower prices is premised on our forecasts for three consecutive large global surpluses starting in
2013/14 - of at least 10mn tonnes - before the market returns to deficit in 2016/17.
Betting The Farm
US Corn - Largest Planted Areas By Season Since 1926 (mn acres)
Note: Corn and soybean began sharing acreage in 1964. Sources: BMI, USDA, NASS
However, we believe the bulk of the price declines is behind us and see potential for corn to form a base
around the USc400-425/bushel level, which corresponds with technical support. The main reason is that we
expect the significant decline in prices to reduce corn plantings in South America, a key export hub that
Kazakhstan Agribusiness Report Q4 2013
© Business Monitor International Page 32

experienced record plantings in 2012/13 on the back of high prices. Indeed, official forecasts are also for a
decline in the area dedicated to corn in 2013/14.
Mind The Gap
Front-Month CBOT Corn, USc/bushel (weekly chart)
Sources: BMI, Bloomberg
Rice: Signs Of Changes To Thai Policy
Supported by a price premium stemming from Thailand's rice pledging programme and tightness on the US
domestic market (which has a significant influence on CBOT rice prices), we believe front-month rice
prices will trade within their moderate channel uptrend (US$15.00/cwt and US$17.00/cwt) in the coming
months. We have slightly revised up our 2013 price forecast owing to the strength in prices since the
beginning of the year; we now expect rice to average US$15.00/cwt over the year (compared with US
$14.50/cwt previously).
Kazakhstan Agribusiness Report Q4 2013
© Business Monitor International Page 33

More Weakness Coming
Front-Month CBOT Rough Rice, US$/cwt (weekly chart)
Sources: BMI, Bloomberg
However, we continue to forecast lower average rice prices beyond 2013, as ample global supply is likely to
keep prices in check. The global market will record surpluses of around 5mn tonnes in 2012/13 and
2013/14, which will maintain the stocks-to-use ratio at a relatively elevated level. Prices are expected to
eventually head lower once Thailand releases its unsustainably high stocks on the market at a discounted
price. This will increase the availability of rice on the international market and push prices below multi-year
support, which comes in around US$15.00/cwt. As a result, we forecast prices to average lower in 2014, at
US$13.00/cwt.
Kazakhstan Agribusiness Report Q4 2013
© Business Monitor International Page 34
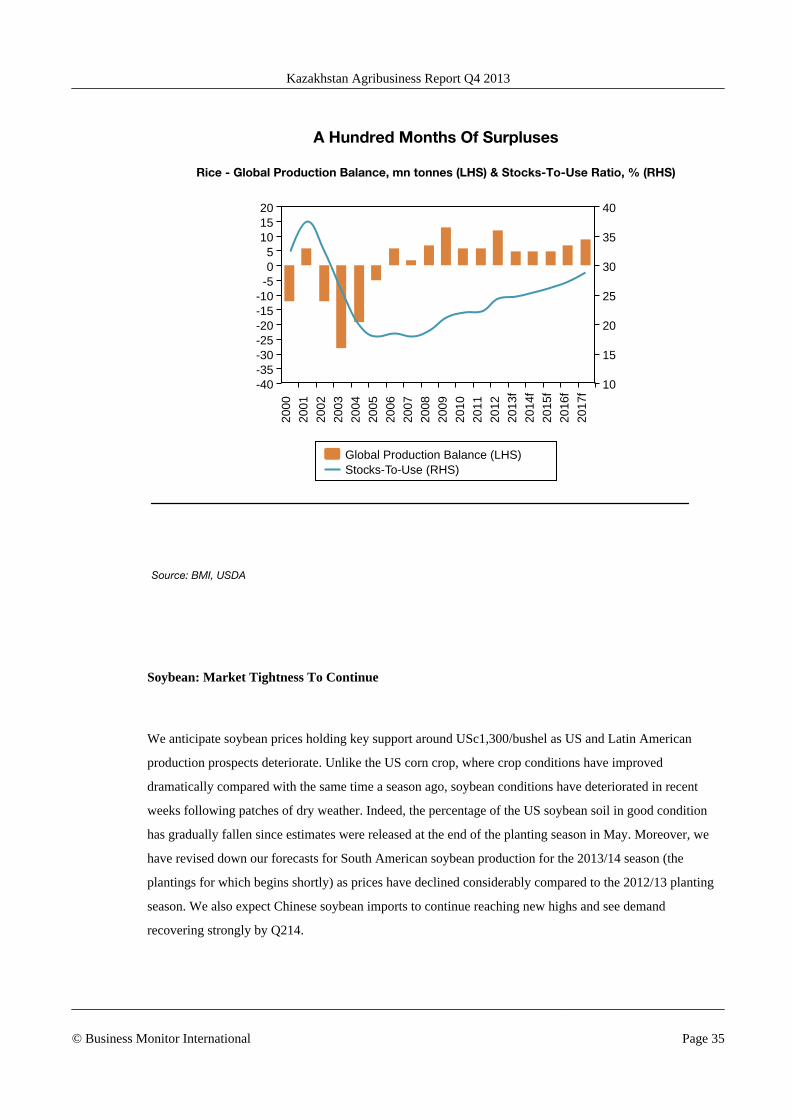
A Hundred Months Of Surpluses
Rice - Global Production Balance, mn tonnes (LHS) & Stocks-To-Use Ratio, % (RHS)
Global Production Balance (LHS)Stocks-To-Use (RHS)
2000
2001
2002
2003
2004
2005
2006
2007
2008
2009
2010
2011
2012
2013
f
2014
f
2015
f
2016
f
2017
f
-40-35-30-25-20-15-10-505
101520
10
15
20
25
30
35
40
Source: BMI, USDA
Soybean: Market Tightness To Continue
We anticipate soybean prices holding key support around USc1,300/bushel as US and Latin American
production prospects deteriorate. Unlike the US corn crop, where crop conditions have improved
dramatically compared with the same time a season ago, soybean conditions have deteriorated in recent
weeks following patches of dry weather. Indeed, the percentage of the US soybean soil in good condition
has gradually fallen since estimates were released at the end of the planting season in May. Moreover, we
have revised down our forecasts for South American soybean production for the 2013/14 season (the
plantings for which begins shortly) as prices have declined considerably compared to the 2012/13 planting
season. We also expect Chinese soybean imports to continue reaching new highs and see demand
recovering strongly by Q214.
Kazakhstan Agribusiness Report Q4 2013
© Business Monitor International Page 35

Weaker Growth In 2013/14
Brazil & Argentina - Combined Annual Growth In Soybean Plantings (%)
Source: BMI, USDA
Overall, we believe the soybean market will remain one of the tightest in the grains complex, as it is
rebounding from a record 17mn tonne deficit during the 2011/12 season. Indeed, the soybean futures curve
is the only curve in the grains complex that is in backwardation. Therefore, soybean is the only grain for
which we forecast higher average prices in 2014 (USc1,450/bushel) than 2013 (USc1,400/bushel).
Kazakhstan Agribusiness Report Q4 2013
© Business Monitor International Page 36

Weakness Won't Last
Front-Month CBOT Soybean, USc/bushel (weekly chart)
Source: BMI, Bloomberg
Wheat: Prices To Find Support
We have revised down our average annual wheat price forecasts. Wheat prices have fallen by almost 20%
since January, brought on by improving harvest prospects in major producers such as the EU, United States
and Black Sea region. Indeed, we forecast the global wheat market to rebound from a 35mn tonne deficit in
2012/13 to be essentially balanced in 2013/14. Consequently, we have revised our average price forecasts
lower and now see wheat averaging USc690/bushel in 2013 and USc650/bushel in 2014.
Kazakhstan Agribusiness Report Q4 2013
© Business Monitor International Page 37

Looking For Support
Front-Month CBOT Wheat, USc/bushel (weekly chart)
Sources: BMI, Bloomberg
Over the short term, however, we believe prices will remain supported around the USc600/bushel level as
more wheat is diverted to feed in the US and because Chinese imports are forecast to reach a multi-decade
high of 9mn tonnes in 2013/14. This would make China the world's largest wheat importer during the
season. Prices will also receive support as we are forecasting only a minor increase in Argentine production
for the 2013/14 season, mainly owing to better yields. Indeed, official forecasts see the area dedicated to
wheat in Argentina falling to its second lowest level in 40 seasons in 2013/14.
Kazakhstan Agribusiness Report Q4 2013
© Business Monitor International Page 38
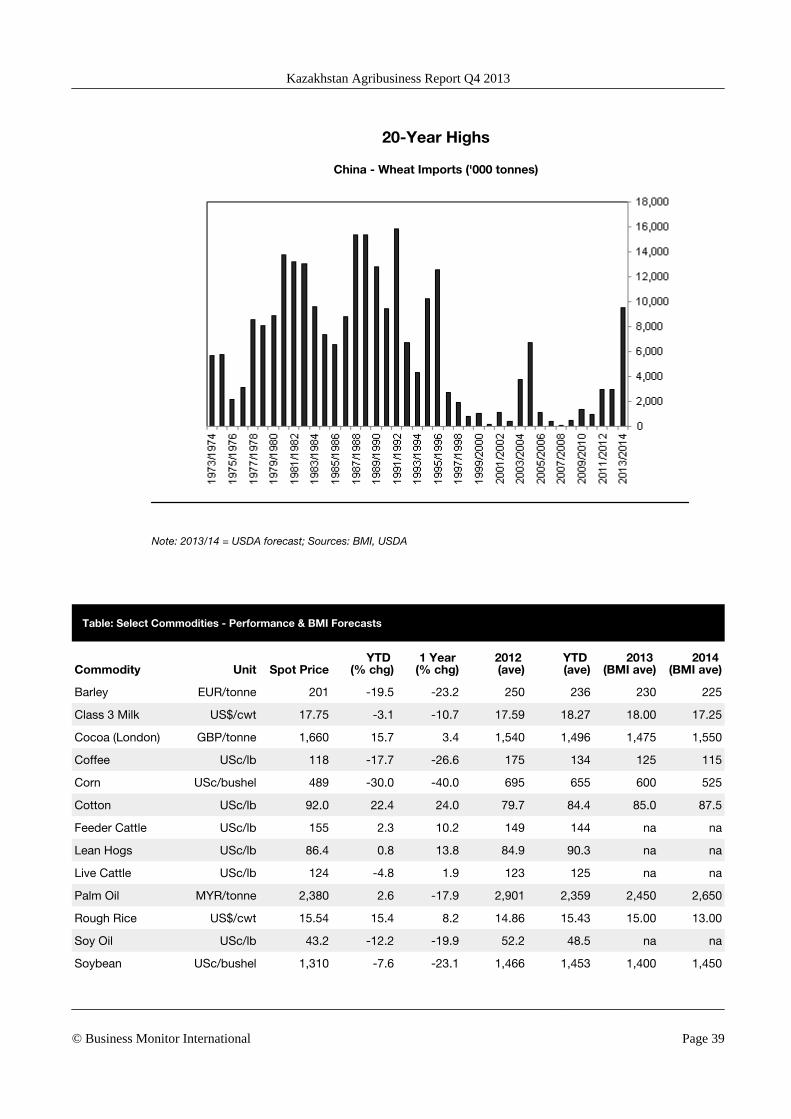
20-Year Highs
China - Wheat Imports ('000 tonnes)
Note: 2013/14 = USDA forecast; Sources: BMI, USDA
Table: Select Commodities - Performance & BMI Forecasts
Commodity Unit Spot PriceYTD
(% chg)1 Year
(% chg)2012 (ave)
YTD (ave)
2013 (BMI ave)
2014 (BMI ave)
Barley EUR/tonne 201 -19.5 -23.2 250 236 230 225
Class 3 Milk US$/cwt 17.75 -3.1 -10.7 17.59 18.27 18.00 17.25
Cocoa (London) GBP/tonne 1,660 15.7 3.4 1,540 1,496 1,475 1,550
Coffee USc/lb 118 -17.7 -26.6 175 134 125 115
Corn USc/bushel 489 -30.0 -40.0 695 655 600 525
Cotton USc/lb 92.0 22.4 24.0 79.7 84.4 85.0 87.5
Feeder Cattle USc/lb 155 2.3 10.2 149 144 na na
Lean Hogs USc/lb 86.4 0.8 13.8 84.9 90.3 na na
Live Cattle USc/lb 124 -4.8 1.9 123 125 na na
Palm Oil MYR/tonne 2,380 2.6 -17.9 2,901 2,359 2,450 2,650
Rough Rice US$/cwt 15.54 15.4 8.2 14.86 15.43 15.00 13.00
Soy Oil USc/lb 43.2 -12.2 -19.9 52.2 48.5 na na
Soybean USc/bushel 1,310 -7.6 -23.1 1,466 1,453 1,400 1,450
Kazakhstan Agribusiness Report Q4 2013
© Business Monitor International Page 39

Select Commodities - Performance & BMI Forecasts - Continued
Commodity Unit Spot PriceYTD
(% chg)1 Year
(% chg)2012 (ave)
YTD (ave)
2013 (BMI ave)
2014 (BMI ave)
Soymeal US$/tonne 417 -1.0 -21.8 430 433 na na
Sugar #11 USc/lb 16.54 -15.2 -19.3 21.57 17.50 17.50 17.00
Wheat USc/bushel 636 -18.3 -27.7 751 702 690 650
Source: BMI, Bloomberg
Table: BMI Commodities Strategy
EntryDate
EntryLevel
Gain/(Loss) Rationale
AGRICULTURE
- - - - -
ENERGY
- - - - -
METALS
Bullish Platinum (spot) vsGold (spot)
29-May-201
3 1.055 5.89%Supply disruption in South Africa, growing autos use to supportplatinum prices. Bearish gold.
Note: Returns do not take into account roll yield, unless stated otherwise. Source: BMI, Bloomberg
Kazakhstan Agribusiness Report Q4 2013
© Business Monitor International Page 40

Monthly Softs Strategy
■ In line with our view, softs have outperformed grains and industrial commodities since the start of theyear.
• We believe the softs index is close to a bottom, especially for sugar and coffee.
• Cotton and cocoa will remain the best supported among softs on the back of China's ongoingstockpiling policy (cotton) and subdued supply prospects in West Africa (cocoa).
• Despite little upside potential in the short term, palm oiI prices are likely to start to recover in 2014.
More Neutral On Softs Now
Select Commodities & Indices - Prices (rebased)
Note: 2 January 2013 = 100. Source: BMI, Bloomberg
Cocoa: Supply Risks Remaining
We expect cocoa prices to continue trading within the GBP1,400-1,700/tonne range in the coming months.
Concerns over delays to the coming West African crop, combined with quality issues, will prevent
significant declines in prices. Indeed, we have revised down our 2012/13 and 2013/14 cocoa supply
forecasts for Ghana, as poor rainfall has affected yields. However, we believe the recent rally in prices will
Kazakhstan Agribusiness Report Q4 2013
© Business Monitor International Page 41

fade as new supply comes online. Despite strong European grindings in Q213, we believe any demand
recovery in Europe will be uneven in the short term given the high prices.
Range Trading
Front-Month LIFFE Cocoa, GBP/tonne (weekly)
Source: Bloomberg, BMI
We forecast small global cocoa deficits in the coming seasons, which will push cocoa prices higher in the
medium term. We are particularly cautious about supply prospects in West Africa, where ageing trees and
farmers, low efficiency and limited access to credit will restrict production growth. As a result, we forecast
cocoa prices to average GBP1,550/tonne in 2014.
Kazakhstan Agribusiness Report Q4 2013
© Business Monitor International Page 42

Picking Up
Europe - Year-On-Year Q2 Cocoa Grindings (% of previous year)
Source: BMI, European Cocoa Association
Coffee: Finding A Bottom Soon?
We expect coffee prices to remain weak in the coming months as ample global supply puts pressure on
prices. The supply problems in Central America related to coffee rust disease have had little impact on
prices so far, mainly because Colombia is projected to offset its neighbours' production drop. Although we
still expect a decline in 2013/14 production in Vietnam, concerns over a prolonged dry spell have now
eased.
Kazakhstan Agribusiness Report Q4 2013
© Business Monitor International Page 43

Little Support Before US$1 Level
Front-Month ICE Coffee (USc/lb, weekly) & RSI (below)
Source: Bloomberg, BMI
Prices could drift towards USc100/lb, a level we believe presents strong psychological support. Farmers in
major producers, including Brazil, Colombia, Vietnam and Indonesia, will consider hoarding in the face of
sharply declining profitability. Moreover, Brazil's soon-to-be-announced support programme for coffee
farmers is likely to include a subsidies scheme, which will limit the downside for prices. We forecast prices
to stabilise in the coming years, averaging USc115/bushel in 2014 and 2015 compared with USc125/bushel
in 2013.
Kazakhstan Agribusiness Report Q4 2013
© Business Monitor International Page 44

Downside Pressure For Sugar And Coffee
BRL/US$ Exchange Rate (weekly chart)
Source: Bloomberg, BMI
Cotton: Stable For Now
We expect cotton prices to respect current resistance at USc90.00/lb in the coming months, as the global
market remains well supplied. Net speculative long positions are still high by historical standards, which is
likely to limit upside risks for prices in the near term. Prices could make a decisive move above the
USc90.00/lb level towards the end of the year, when the market is likely to enter a supply trough after a
disappointing year in terms of output growth. We do not foresee a major change to China's stockpiling
policy before mid-2014 at least; this will maintain domestic prices at elevated levels and incentivise millers
to import significant volumes of cotton.
In the medium term, we expect the global market to record decreasing surpluses as relatively low prices
continue to discourage plantings and demand recovers at a stronger pace. We forecast cotton prices to
average USc85.00/lb in 2013 and USc87.50/lb in 2014.
Kazakhstan Agribusiness Report Q4 2013
© Business Monitor International Page 45

Resistance To Hold For Now
Front-Month ICE Cotton, USc/lb (daily) & RSI (below)
Source: Bloomberg, BMI
Palm Oil: Recovery In 2014
Although we continue to believe palm oil prices have bottomed, we see limited upside to prices in the
coming months given the lack of a significant fundamental upward catalyst. We continue to expect prices to
trade along support at MYR2,250/tonne. The demand picture has deteriorated in recent months, as the
Kazakhstan Agribusiness Report Q4 2013
© Business Monitor International Page 46

depreciating Indian rupee is weighting on India's imports, which usually represent close to 20% of the
world's total trade. Meanwhile, Malaysia and Indonesia are now in the part of the season during which
yields peak, and when production is at its highest.
Weakness For Now
Three-Month Palm Oil (MYR/tonne, weekly)
Source: Bloomberg, BMI
Prices are expected to start to recover in 2014 as production growth slows and consumption maintains a
healthy growth rate. Palm oil remains competitive compared with other vegetable oils, as the palm oil/soy
oil and palm oil/soybean ratios are still low by historical standards. We see prices averaging MYR2,650/
tonne in 2014, compared with MYR2,450/tonne in 2013.
Kazakhstan Agribusiness Report Q4 2013
© Business Monitor International Page 47

Weak Rupee Weighting On Imports
India - Palm Oil Imports ('000 tonnes)
Source: BMI, India Solvent Association
Sugar: Bottoming Out
We maintain our view that sugar prices are close to bottoming out and are likely to show resilience over a
three-to-six-month horizon. Prices could face downward pressure in the very short term, as sugar prices
have recently regained competitiveness over ethanol prices in Brazil, which could prompt millers to turn
more cane into sugar. The continued weakness in the Brazilian real also poses downside risk to sugar
prices. However, unfavourable weather in June and July and the upcoming end of the harvest season in
Brazil suggest that supply will only tighten. The Brazilian sugarcane association Unica revised down its
production estimate for Brazil in April and could do so again in its next report in September. We forecast
the global surplus to significantly narrow in 2013/14, to 5mn tonnes, down 37.5% year-on-year. This will
help prices recover slightly in 2014 to average USc18.00/lb, compared with USc17.50/lb in 2013.
Kazakhstan Agribusiness Report Q4 2013
© Business Monitor International Page 48

Reversal In Sight?
Front-Month ICE Sugar, USc/lb (weekly)
Source: Bloomberg, BMI
Table: Select Commodities - Performance & BMI Forecasts
Commodity Unit Spot PriceYTD
(% chg)1 Year
(% chg)2012 (ave)
YTD (ave)
2013 (BMI ave)
2014 (BMI ave)
Barley EUR/tonne 205 -17.7 -21.5 250 236 230 225
Class 3 Milk US$/cwt 17.55 -4.2 -11.7 17.59 18.27 18.00 17.25
Cocoa (London) GBP/tonne 1,654 15.3 3.1 1,540 1,496 1,475 1,550
Coffee USc/lb 115 -20.2 -28.5 175 134 125 115
Corn USc/bushel 483 -30.8 -41.9 695 654 600 525
Cotton USc/lb 86.7 16.3 14.3 79.7 84.4 85.0 87.5
Feeder Cattle USc/lb 155 2.7 11.2 149 144 na na
Lean Hogs USc/lb 86.9 1.3 14.6 84.9 90.3 na na
Live Cattle USc/lb 124 -4.5 3.7 123 125 na na
Palm Oil MYR/tonne 2,385 2.8 -17.7 2,901 2,359 2,450 2,650
Rough Rice US$/cwt 15.75 15.4 8.2 14.86 15.43 15.00 13.00
Soy Oil USc/lb 43.0 -12.6 -22.7 52.2 48.5 na na
Soybean USc/bushel 1,309 -7.7 -25.3 1,466 1,452 1,400 1,450
Kazakhstan Agribusiness Report Q4 2013
© Business Monitor International Page 49

Select Commodities - Performance & BMI Forecasts - Continued
Commodity Unit Spot PriceYTD
(% chg)1 Year
(% chg)2012 (ave)
YTD (ave)
2013 (BMI ave)
2014 (BMI ave)
Soymeal US$/tonne 412 -2.0 -24.2 430 432 na na
Sugar #11 USc/lb 16.49 -15.5 -16.6 21.57 17.49 17.50 18.00
Wheat USc/bushel 635 -18.4 -29.5 751 702 690 650
Source: BMI, Bloomberg
Table: BMI Commodities Strategy
EntryDate
EntryLevel
Gain/(Loss) Rationale
AGRICULTURE
- - - - -
ENERGY
- - - - -
METALS
Bullish Platinum (spot) vsGold (spot)
29-May-201
3 1.055 5.47%Supply disruption in South Africa, growing autos use to supportplatinum prices. Bearish gold.
Note: Returns do not take into account roll yield, unless stated otherwise. Source: BMI, Bloomberg
Kazakhstan Agribusiness Report Q4 2013
© Business Monitor International Page 50

Upstream Analysis
Europe GM Outlook
BMI View: Europe is expected to remain the smallest region for genetically modified (GM) plantings in the
world, as there is still strong public opposition to GM products in the region's largest grain producers,
among them France. The EU's reliance on GM feed imports has pushed several retailers in the UK to step
back from their initial commitment to source non GM-fed poultry meat.
Strict regulations on production and the use of genetically modified (GM) food, as well as negative public
opinion, make the EU the smallest region for GM plantings in the world. GM plantings in the EU only
represent 0.6% of global GM plantings, while the US and South America represent 77.8%. Only two crops
are authorised for cultivation in the bloc: Monsanto's MON810 corn and BASF's Amflora potato. Since
2007, GM plantings in the EU have remained stable, between 93,000 and 110,000 hectares. Spain is the
leading producer of GM corn in the EU, accounting for an estimated 85.5% of plantings in 2012. Portugal,
the Czech Republic, Poland, Slovakia and Romania have boosted plantings in recent years, and this has
benefited their local livestock sectors.
Kazakhstan Agribusiness Report Q4 2013
© Business Monitor International Page 51

Spanish Planting Spree
Select Countries - GM Corn Area Planted (ha)
Source: USDA
Strong public opposition to field trials could discourage any private investment in the sector because of
uncertainty over demand prospects for GM products. In fact, Germany-based BASF announced recently it
would discontinue its pursuit of regulatory approval for its GM potato varieties, as the company has been
widely exposed to field destruction and radical shifts in the regulatory environment. There are still no field
tests allowed in most EU countries; vandalism of fields by activists occurs because, by law, exact locations
of the fields are available on the internet. Field tests have increased in some countries such as the Czech
Republic, Ireland, Poland, Portugal, Romania and the UK. The UK has a history of activist destruction of
field tests, but recent experiments of Cadenza wheat, modified to produce a non-toxic odour to repel aphids
and funded by the government, went ahead despite actions of protestors and amid tight security.
Kazakhstan Agribusiness Report Q4 2013
© Business Monitor International Page 52

Different Approaches To GM Plantings
EU - Countries By Approach To GM Plantings
Note: GE= genetically engineered. Source: USDA
We still do not expect France to reverse its unilateral ban of Monsanto corn plantings, especially after a
study into the effects of GM corn on health prompted loud reactions from anti-GM activists in the country.
However, the country dropped any further challenge to the company's license to sell GM corn in the EU, as
France's food-safety agency ruled that the experiment, which linked the absorption of GM corn to tumours
in rats, was inconclusive and flawed. Also, the country's highest court recently lifted the back on growing
Monsanto's genetically modified (GMO) maize MON810. The court found that the French ban violated
European Union law because the maize was authorised by the EU in 1998. Still, France is one of the eight
member states which have banned the cultivation of MON810 - France, Germany, Poland, Italy,
Luxemburg, Austria, Hungary and Greece. Monsanto itself recently announced that it will no longer pursue
cultivation approvals for new GMO crops in Europe because of the regulatory resistance.
Kazakhstan Agribusiness Report Q4 2013
© Business Monitor International Page 53

US Decreasing Importance
EU - Soybean Imports By Country In 2006-2010 Average (LHS) & 2011/12 (RHS), %
Source: Bloomberg, BMI
We believe imports of GM foods will be subject to much less restrictions than plantings in the medium
term. This is because imports benefit from more centralised ways of approval. The region is still very
dependent on soymeal and corn products imports from the Americas in order to feed its livestock. In the
2011/12 season, the EU shifted sourcing for soybean and corn products from the US to other countries in
South America because of stiffer regulations on sustainability criteria for soybean use in biofuels. Also,
higher quantities of domestically produced dried distillers grains with soluble (DDGS) and delays in the
approval of Syngenta's MIR162 DDGS variety reduced corn imports. In the 2012/13 season, we have seen
corn imports increase significantly and the EU approved imports of Syngenta's MIR162, a genetically
modified corn variety, in October 2012. As a result, we expect GM feed imports to increase in the medium
term as the EU does not have the production capacity to be self-sufficient in soybean and corn production
for feed.
Kazakhstan Agribusiness Report Q4 2013
© Business Monitor International Page 54

Steady Feed Imports
EU-27 - Corn, Soybean & Soymeal Imports ('000 tonnes)
f = BMI forecast. Source: USDA
The EU's reliance on GM feed imports has pushed several retailers in the UK to step back from their initial
commitment to source non-GM-fed poultry meat. Tesco, followed by Asda and Morrisons, have recently
indicated it is nearly impossible with its objective to sell non-GM fed animal meat only under its own
brands. The retailers pointed that quantities of non-GM soybean were not sufficient to supply its livestock
producers, making sourcing difficult, inefficient and expensive. This turnaround, even in a context where
retailers in other countries such as France and Germany have maintained their commitment to non GM-fed
animal meat, illustrates the limit of retailers' capacity to supply their processing chains outside of traditional
channels. Because the US, Brazil and Argentina, the world's three largest soybean producers, produce
mostly GM soy, we believe retailers' commitment to only sell non-GM animal meat will encounter major
hurdles in the medium term, and we see more European retailers turning around their strategy, in line with
UK retailers' decisions.
Ultimately, the lack of growth potential for GM plantings in the EU underpins our view for grains
production growth in the region to be subdued over our forecast period. Europe has lower yields than the
US, where almost 80% of plantings are GM, and is expected to soon fall behind Argentina and Brazil,
Kazakhstan Agribusiness Report Q4 2013
© Business Monitor International Page 55

where yields are picking up on the back of increased GM plantings. Out to 2016/17, we forecast corn
production in the EU to fall 18.5%, while we see output growing 8.3% in the US and 14.1% in Brazil, with
this growth partially linked to a greater use of GM seeds.
Europe Machinery Outlook
BMI View: Mainly owing to base effects, we continue to see higher potential for machinery industry growth
in Eastern Europe compared with Western Europe. The two key growth markets in Eastern Europe are
Russia and Kazakhstan. We expect machinery imports in both countries to be strong in the coming years,
and see stronger growth mitigating dire prospects in Western European sales for companies such as
AGCO.
In Western Europe, similar to the US, agricultural machinery sales in both volume and relative terms are
declining. The region's machinery market is already well supplied, and the sector has been affected by a
deteriorating business environment since the 2008 financial crisis, along with poor crop production
prospects, reducing demand for equipment. Indeed, poor credit conditions, the looming prospect of subsidy
reforms and the increased volatility of commodities prices have made it more difficult for the EU's
machinery manufacturers to resume previous production growth trends. For example, in Switzerland, the
number of tractors per 100 square kilometres has fallen from 2,645 in 2001 to 2,597 in 2007, showing a
decline even before the financial crisis. In Germany, consolidation of the farming sector has meant that the
number of tractors in use in the country fell from 1.5mn in 1990 to just over 675,000 by 2008.
Kazakhstan Agribusiness Report Q4 2013
© Business Monitor International Page 56

Sharp Decline In 2009
EU - Machinery Production & Market (EURbn, LHS) & Agricultural Machinery Employees Per Country(%)
Note: Market = total sales. Source: CEMA, VDMA & Eurostat
In Eastern Europe, we see much better prospects for tractor sales in the coming years and specifically
highlight Romania, Poland, Russia and Kazakhstan. In Romania, tractor use increased by 7.6% between
2001 and 2009 (the most recent year for which data is available). Given that the country is a key corn
exporter in the region and that corn prices are expected to remain elevated by historical standards, prospects
for tractor sales are likely to be relatively strong as the country seeks to improve production efficiency.
Indeed, we forecast corn production in Romania to recover 86.9% between 2012/13 and 2016/17.
Furthermore, the Romanian economy has been relatively resilient despite other troubles in the eurozone,
implying that credit conditions will remain relatively loose (albeit very tight) by regional standards,
particularly for businesses. We expect machinery sales in Poland to be slightly more limited than in
Romania, but still stronger than in Western Europe. The country has also seen strong tractor sales in recent
years, but because of the already high number of tractors present, sales could be relatively weaker compared
with other non-eurozone countries.
Kazakhstan Agribusiness Report Q4 2013
© Business Monitor International Page 57

More Growth To Come
Russia - Tractor Monthly Cumulative Sales (units)
Source: Bloomberg, Russian Association of Equipment Manufacturers
Kazakhstan Agribusiness Report Q4 2013
© Business Monitor International Page 58

Russian Imports To Increase On Accession To WTO
The two key growth markets we see in Eastern Europe are Russia and Kazakhstan. Both are coming from a
very low base (in 2010 Russia had fewer than 50 tractors per 100 square kilometres, while Kazakhstan had
only 17 by 2010), and both countries have made a strong commitment to increase grain production in the
coming years, implying a greater need for mechanisation. Between 2009 and 2012, Russian tractor unit
sales multiplied by almost 2.5x to 46,680 units. Sales growth in the first months of 2013 slowed slightly, but
we expect recent government support to the industry to at least keep its 2012 pace by the end of the year.
Russian tractors per 100 square kilometre is just over one-tenth of the US's 30-year average, suggesting
further room for growth over the long term.
Russian producers of agricultural machinery were affected by the country's entry into the WTO in August
2012, as local manufacturers lost competitiveness with foreign companies due to the steep decrease of
import duties. Over 2012, sales of tractors manufactured in Russia decreased by 3.7% year-on-year (y-o-y),
and their market share shrank from 37.1% to 32.0%, even though overall sales grew by 11.5% y-o-y,
according to Soyuzagromash, Russia's association of farm machinery manufacturers. The association
estimates that foreign imports of agricultural machinery in the Russian market share could increase to 84%
(from 48%) between 2011 to 2017, and that many of the imports will be of second-hand machinery.
Kazakhstan Agribusiness Report Q4 2013
© Business Monitor International Page 59

AGCO More Present In Europe
Select Companies - Revenues By Region, FY2012 (%)
Source: BMI, AGCO, CNH
Kazakhstan Agribusiness Report Q4 2013
© Business Monitor International Page 60

AGCO And European Manufacturers To Benefit The Most
Local machinery production capacity is unlikely to be sufficient to support increasing demand from farmers,
especially as the region has set impressive grain production targets over the medium term. We expect
machinery imports in Russia and Kazakhstan to be strong in the coming years. We still see US agricultural
equipment manufacturer AGCO benefiting the most from growth in the region compared with other US
competitors Deere & Company and CNH, which mainly sell to the Americas. Moreover, European
manufacturers, especially German and French companies, could also benefit. German companies (including
the CLAAS Group) already control 28% of the import market, followed by Belarusian companies at 16%
and US firms at 11%.
Stronger Growth In Eastern Europe
CLAAS - Revenue By Region (% chg y-o-y)
Source: BMI, CLAAS
In the short term, we are turning more cautious on profitability prospects for machinery companies
operating in Europe, especially for ones with strong exposure to Western Europe. AGCO announced
Q113 results on May 1, seeing a y-o-y improvement in EPS. AGCO beat analyst expectations by 35% for
Kazakhstan Agribusiness Report Q4 2013
© Business Monitor International Page 61

the quarter, while it was able to lift its guidance for full-year profits (from US$5.20/share to US$5.40/share)
despite a slowdown in sales in Europe's equipment market. As a result, the company highlighted that most
of its growth came from outside of Europe, especially from Latin America, where the company is increasing
exposure. AGCO suggested that tractor sales in Western Europe would fall by almost 5% in FY2013.
Eastern European sales will help mitigate these losses, but only slightly as farmers' income and credit
conditions in Russia are dire at the moment, and only extra government support and higher grain prices will
help to keep machinery sales in the country stable.
Kazakhstan Agribusiness Report Q4 2013
© Business Monitor International Page 62

Europe Fertiliser Outlook
BMI View: Over the short term, poor production in Europe is expected to weigh on farmer incomes, which
could reduce demand for fertiliser in 2013, especially in the Black Sea region. Consequently, we see
demand for fertilisers for Eastern and Western Europe showing some convergence, which would ultimately
be a short-term bearish development for seed manufacturers. Looking longer-term, we continue to see a
divide between Western and Eastern Europe in terms of fertiliser consumption.
Until 2010, EU-27 fertiliser consumption had been in a declining trend, largely as a result of low grain
prices and a decrease in the area dedicated to grains. Currently, the European fertiliser market consists of
three categories: phosphates, potash and nitrogen-based fertilisers. Within that, nitrogen fertilisers
(including ammonium- and urea-based fertilisers) account for almost 70% of total use, with the rest divided
equally between phosphates and potash-based products. This is a change from previous years; nitrogen
accounted for only 60% of total consumption in 2002. Nitrogen products also account for the majority of
production and trade within the region. In the case of nitrogen, the distribution of production among the
elements has remained largely stable.
Growth Moving East
Europe - Consumption Of Select Fertilisers In Western (LHS) & Eastern Europe (% of global)
Source: BMI, FAO
Kazakhstan Agribusiness Report Q4 2013
© Business Monitor International Page 63

We continue to see a long-term divide between Western and Eastern Europe in terms of fertiliser
consumption patterns. Mainly because of base effects, Western Europe's fertiliser consumption as a
percentage of the global total declined in the last decade because of moderate plantings growth. This has
also been the case since the start of 2012, as substantial winter crop damage and continued dry conditions
until May reduced farm demand for fertilisers.
All About France And Germany
EU - Fertiliser Consumption By Country In 2009 (% of total EU-27 consumption)
Source: BMI, FAO
Eastern Europe, by contrast, has increased its share of global fertiliser demand over the last decade, as
tremendous production growth for grains in countries such as Russia, Ukraine and Kazakhstan boosted
demand. The slow shift from small- to large-scale farms is also leading to rising demand for fertilisers. In
line with the region's objective to boost grain production in the medium term (Russia aims to double its
grain exports in the coming years), we expect steady growth in the region's fertiliser consumption over our
forecast period. However, we see the trend of divergence in usage growth continuing over the long term,
especially as reforms to farmers' EU subsidies will make them less competitive.
In terms of production, Russia is a large player in the production of all three elements. It accounts for more
than 50% of total European phosphate production and almost 50% of all nitrogen fertiliser production.
Kazakhstan Agribusiness Report Q4 2013
© Business Monitor International Page 64

Russia is also, along with Canada, one of the world's largest potash producers. Among smaller producers,
Eastern Europe (specifically Ukraine, Poland and Belarus) accounts for the majority of fertiliser production
in Europe. Domestic fertiliser production for these countries ensures a cheap supply of chemicals for their
local agricultural industry. We believe more fertilisers produced in Eastern Europe will be sold locally
instead of for export, reinforcing our view that domestic consumption growth will be strong over the long
term.
Against Support
Uralkali - Share Price (US$, weekly) & RSI (below)
Source: Bloomberg, BMI
Kazakhstan Agribusiness Report Q4 2013
© Business Monitor International Page 65

In the short term, we believe prospects for sales growth for companies producing fertilisers in Eastern
Europe will falter, but we maintain a positive medium-term view. Russian Potash producer Uralkali
recently revised down its forecast production for 2013 by 10-11% to 9.5-9.7mn tonnes, only 4.4-6.6%
higher than in 2012. This is because in spite of higher grain prices in 2012 helping farmers' revenues, lower
output limited profitability. Moreover, it is difficult to see which effect overcame the other. In Eastern
Europe, the US Department of Agriculture indicated that farmers' income growth after the 2012/13 season
was only minimal and that the lack of credit and recent reforms to government support after Russia entered
the WTO will restrict their investment capacity in the near term. One of the main points of this reform was
to restrict current price subsidies on fertilisers, which encouraged farmers to stock up on chemicals before
the subsidy was terminated at the end of 2012. This resulted in negative growth for fertiliser sales in Q113
in Russia, while domestic prices are still at a high.
Kazakhstan Agribusiness Report Q4 2013
© Business Monitor International Page 66

More Room To Run Down
Yara International - Share Price (NOK, weekly) & RSI (below)
Source: Bloomberg, BMI
We see a more neutral picture in Western Europe in 2013. Yara International, which mainly focuses on
the region, indicated that fertiliser sales were in line with those over the same period in 2012. Sales volumes
were temporarily affected in March by delayed applications on the back of a late spring, but we expect this
to have little impact on results in the coming quarters. Nitrogen fertiliser deliveries to Europe helped to
compensate for lower volume demand in Brazil and North America. In fact, total European sales, among
which nitrate sales are the most important, were up 6.0% since the start of the season (in line with historical
Kazakhstan Agribusiness Report Q4 2013
© Business Monitor International Page 67

growth averages), while sales outside Europe were down by 6.0% over the same period as phosphate trade,
the other nutrient Yara uses to produce fertilisers, was limited because of a reduction in price subsidies in
India.
Kazakhstan Agribusiness Report Q4 2013
© Business Monitor International Page 68

Downstream Analysis
Food
Food Consumption
■ Total food consumption value compound annual growth rate (CAGR) to 2017: +11.2%.
■ Per capita food consumption value CAGR to 2017: +10.1%.
Food Consumption
2010-2017
e/f = BMI estimate/forecast. Source: BMI
Through to 2017, BMI forecasts that food consumption in Kazakhstan will grow by a CAGR of 11.2% in
local currency terms, to reach KZT4,734bn (US$32.65bn). We hold to our view that the country's food
industry remains one of the most promising in Eurasia, owing to its relatively large and young population
and the country's favourable macroeconomic outlook, which is expected to result in changing consumption
patterns, particularly in urban areas. The global economic crisis had a negative impact on the country's
economy - and the food and drink sector - but a recovery followed. We highlight, however, that the
worsening external environment could have an impact on the market's performance in the shorter term.
Given the low starting point, expected economic growth will have a large bearing on our food consumption
forecast. The growth of the mass grocery retail (MGR) industry and a shift away from traditional
consumption habits in favour of processed and packaged foods will be a major contributor to this forecast
Kazakhstan Agribusiness Report Q4 2013
© Business Monitor International Page 69

growth. With the government keen to diversify the economy and develop the banking and financial sectors,
we expect an increase in credit availability for the consumer, particularly credit cards and overdraft
facilities, which will extend to the poorer sectors of the retail market and allow for an expansion in
consumption for Kazakh households.
Although most foreign investors have been slow to enter the Kazakh market, levels of foreign direct
investment in the food and drink production sector are slowly rising, which will help to stimulate greater
domestic consumption. As local production quality improves and more jobs are created in this sector,
demand for processed foods will grow. However, we caution that an uncertain political situation will
hamper faster involvement of foreign investors.
Kazakh consumers are curious to experiment with new food products and varieties, particularly after years
of Soviet rule when there was little variety available. Diets have become more diverse over the past 10
years, a trend that is expected to continue. Foods that would have been considered luxury items in the past,
such as snacks, sauces and seasoning, are all growing in popularity, contributing to the higher value of food
sales. Busier lifestyles are also contributing to the rising demand for convenience foods such as powdered
soups. Both of these trends are mostly evident in major urban centres. Wealthier urban residents are
becoming more aspirational and developing increasingly sophisticated and diverse tastes, fuelling the sale
of non-essential, higher-value food and drink items.
There will continue to be a significant urban-rural divide in consumption levels, owing to higher levels of
rural poverty, more traditional consumption patterns and a narrower availability of products in the
countryside. Consequently, food consumption in rural areas is focused on essential, staple food and drink
items, with subsistence farming still in place in some regions. While this trend is more evident in rural
areas, throughout the country traditional eating habits can reduce demand for pre-packed foods, which may
limit returns for food companies and serve as a deterrent for investors.
Kazakhstan Agribusiness Report Q4 2013
© Business Monitor International Page 70

Table: Food Consumption Indicators Historical Data And Forecasts 2010-2017
2010 2011 2012e 2013f 2014f 2015f 2016f 2017f
Food consumptionKZTbn 2,146 2,523 2,784 3,061 3,408 3,795 4,234 4,734
Food consumption,KZT, % chg y-o-y 20.52 17.57 10.34 9.94 11.35 11.36 11.55 11.81
Food consumption,KZT per capita 133,924.8 155,709.2 169,982.8 184,955.3 203,880.2 224,799.4 248,320.3 275,009.6
Food consumption,US$bn 14.56 17.21 18.69 20.60 23.27 26.00 29.00 32.65
Food consumptionUS$, % change y-o-y 20.76 18.14 8.61 10.23 12.94 11.75 11.55 12.58
Food consumption,US$ per capita 908.80 1,061.70 1,140.80 1,244.60 1,391.60 1,539.70 1,700.82 1,896.62
Source: Kazakhstan National Statistical Office, OECD, BMI e/f= BMI estimate, forecast
Canned Food
■ Canned food value sales CAGR to 2017: +10.5%.
■ Canned food volume sales CAGR to 2017: +3.8%.
Canned Food Sales
e/f = BMI estimate/forecast. Source: BMI
Canned foods in Kazakhstan are mostly represented by processed meats. Domestic products - such as those
manufactured by Bonduelle Groupe (a subsidiary of the French group, which holds around a quarter of the
Kazakhstan Agribusiness Report Q4 2013
© Business Monitor International Page 71

retail market) have a good reputation but can mostly be more expensive than imports from cheaper
manufacturing locations. The development of the canned and preserved food segments in Kazakhstan will,
therefore, remain shaped by the prevailing economic conditions. Changing consumer habits and busier
lifestyles will, in the meantime, be conducive to the development of volume sales of convenience-type food
products, including canned fruits and vegetables.
Table: Canned Food Value/Volume Sales Historical Data And Forecasts 2010-2017
2010 2011 2012e 2013f 2014f 2015f 2016f 2017f
Canned foodsales, tonnes 89,515 94,415 99,535 103,583 107,562 111,681 115,941 120,332
Canned foodsales, units, %change y-o-y 5.52 5.47 5.42 4.07 3.84 3.83 3.81 3.79
Canned foodsales, kg percapita 5.59 5.83 6.08 6.26 6.43 6.61 6.80 6.99
Canned foodsales, KZTmn 7,025,641 8,025,269 8,883,529 9,817,990 10,847,606 11,966,971 13,230,960 14,638,345
Canned foodsales, KZT, %change y-o-y 13.01 14.23 10.69 10.52 10.49 10.32 10.56 10.64
Canned foodsales, KZT percapita 438,380 495,181 542,297 593,197 648,834 708,689 775,887 850,254
Canned foodsales, US$mn 47,675 54,722 59,621 66,070 74,045 81,966 90,623 100,954
Canned foodsales, US$, %change y-o-y 13.24 14.78 8.95 10.82 12.07 10.70 10.56 11.40
Canned foodsales, US$ percapita 2,975 3,377 3,640 3,992 4,429 4,854 5,314 5,864
Source: Kazakhstan National Statistical Office, OECD, BMI e/f= BMI estimate, forecast
Confectionery
■ Confectionery volume sales CAGR to 2017: +7.6%.
■ Chocolate confectionery volume sales CAGR to 2017: +7.9%.
■ Sugar confectionery volume sales CAGR to 2017: +7.0%.
■ Gum volume sales CAGR to 2017: +4.0%.
Confectionery is considered a relatively affordable luxury in Kazakhstan. The demand is met by a
combination of domestically produced chocolate and other confectionery and imports. Some of the key
Kazakhstan Agribusiness Report Q4 2013
© Business Monitor International Page 72

local manufacturers are Rahkat, Karaganda Confectionery and Bayan-Sulu. Future drivers of growth
will be portfolio expansion by major manufacturers and importers, including strong marketing and
promotional campaigns targeting younger and more aspirational consumers.
Table: Confectionery Volume/Value Sales Historical Data And Forecasts 2010-2017
2010 2011 2012e 2013f 2014f 2015f 2016f 2017f
Confectionery sales,tonnes 211,491 231,610 247,249 265,694 286,894 309,151 332,633 357,385
Confectionery sales,tonnes, % change y-o-y 8.36 9.51 6.75 7.46 7.98 7.76 7.60 7.44
Confectionery sales, kg percapita 13.20 14.29 15.09 16.05 17.16 18.31 19.51 20.76
Confectionery sales KZTmn 42,351 50,246 56,332 64,298 73,885 84,606 96,962 111,065
Confectionery sales, KZT,% change y-o-y 16.12 18.64 12.11 14.14 14.91 14.51 14.60 14.55
Confectionery sales, KZTper capita 2,643 3,100 3,439 3,885 4,419 5,010 5,686 6,451
Confectionery sales, US$mn 287.39 342.61 378.06 432.69 504.34 579.49 664.12 765.96
Confectionery sales, US$,% change y-o-y 16.35 19.22 10.35 14.45 16.56 14.90 14.60 15.34
Confectionery sales, US$per capita 17.93 21.14 23.08 26.14 30.17 34.32 38.95 44.49
Confectionery sales,EURmn 216.66 246.48 297.69 346.16 420.28 482.91 553.43 638.30
Confectionery sales, EUR,% change y-o-y 22.80 13.77 20.77 16.28 21.41 14.90 14.60 15.34
Confectionery sales, EURper capita 13.52 15.21 18.17 20.91 25.14 28.60 32.45 37.08
Chocolate sales, tonnes 137,853 151,876 162,694 175,414 190,057 205,413 221,600 238,648
Chocolate sales, tonnes, %change y-o-y 9.29 10.17 7.12 7.82 8.35 8.08 7.88 7.69
Chocolate sales, kg percapita 8.60 9.37 9.93 10.60 11.37 12.16 13.00 13.86
Chocolate sales, KZTmn 28,640 34,172 38,437 44,011 50,737 58,263 66,940 76,848
Chocolate sales KZT, %change y-o-y 17.05 19.32 12.48 14.50 15.28 14.83 14.89 14.80
Chocolate sales KZT percapita 1,787 2,109 2,346 2,659 3,035 3,450 3,925 4,464
Chocolate sales US$mn 194.35 233.01 257.96 296.17 346.32 399.06 458.49 529.98
Chocolate sales, US$, %change y-o-y 17.28 19.90 10.71 14.81 16.93 15.23 14.89 15.59
Kazakhstan Agribusiness Report Q4 2013
© Business Monitor International Page 73

Confectionery Volume/Value Sales Historical Data And Forecasts 2010-2017 - Continued
2010 2011 2012e 2013f 2014f 2015f 2016f 2017f
Chocolate sales, US$ percapita 12.13 14.38 15.75 17.89 20.71 23.63 26.89 30.78
Chocolate sales, EURmn 146.51 167.63 203.12 236.94 288.60 332.55 382.08 441.65
Chocolate sales, EUR, %change y-o-y 23.79 14.41 21.17 16.65 21.81 15.23 14.89 15.59
Chocolate sales, EUR percapita 9.14 10.34 12.40 14.32 17.26 19.69 22.41 25.65
Sugar confectionery sales,tonnes 72,827 78,888 83,674 89,363 95,884 102,746 110,001 117,664
Sugar confectionery sales,tonnes, % change y-o-y 6.70 8.32 6.07 6.80 7.30 7.16 7.06 6.97
Sugar confectionery sales,kg per capita 4.54 4.87 5.11 5.40 5.74 6.08 6.45 6.83
Sugar confectionery sales,KZTmn 13,449 15,778 17,572 19,930 22,753 25,905 29,537 33,680
Sugar confectionery sales,KZT, % change y-o-y 14.27 17.31 11.37 13.42 14.16 13.85 14.02 14.03
Sugar confectionery sales,KZT per capita 839.18 973.52 1,072.66 1,204.15 1,360.91 1,534.10 1,732.08 1,956.25
Sugar confectionery salesUS$mn 91.26 107.58 117.93 134.12 155.31 177.43 202.31 232.27
Sugar confectionery sales,US$, % change y-o-y 14.50 17.88 9.62 13.73 15.80 14.24 14.02 14.81
Sugar confectionery sales,US$ per capita 5.69 6.64 7.20 8.10 9.29 10.51 11.86 13.49
Sugar confectionery sales,EURmn 68.80 77.40 92.86 107.29 129.42 147.86 168.59 193.56
Sugar confectionery sales,EUR, % change y-o-y 20.85 12.49 19.97 15.55 20.63 14.24 14.02 14.81
Sugar confectionery sales,EUR per capita 4.29 4.78 5.67 6.48 7.74 8.76 9.89 11.24
Gum sales, tonnes 812.1 845.8 880.6 916.4 953.5 991.9 1,031.7 1,072.9
Gum sales, tonnes, %change y-o-y 4.20 4.16 4.11 4.07 4.04 4.03 4.02 3.99
Gum sales, kg per capita 0.05 0.05 0.05 0.06 0.06 0.06 0.06 0.06
Gum sales KZTmn 262.44 296.05 323.62 357.66 395.94 437.65 484.81 537.43
Gum sales, KZTmn, %change y-o-y 11.60 12.80 9.31 10.52 10.70 10.53 10.78 10.85
Gum sales, KZT per capita 16.38 18.27 19.76 21.61 23.68 25.92 28.43 31.22
Gum sales US$mn 1.78 2.02 2.17 2.41 2.70 3.00 3.32 3.71
Kazakhstan Agribusiness Report Q4 2013
© Business Monitor International Page 74
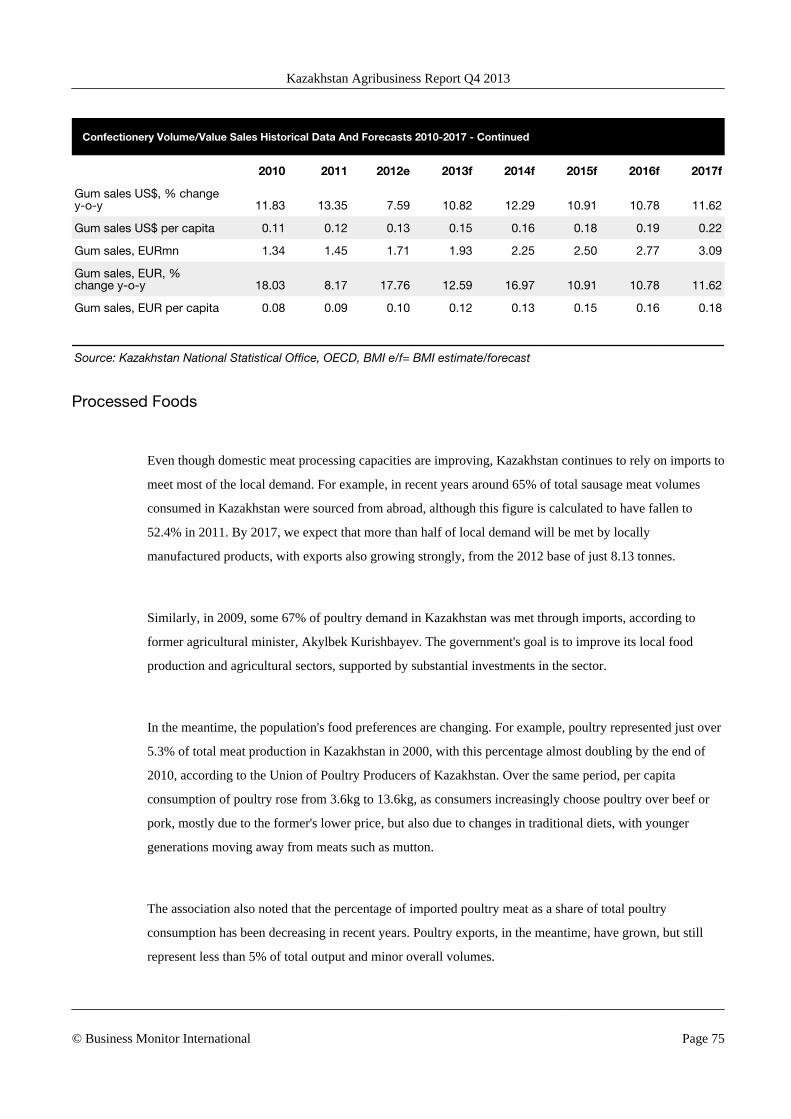
Confectionery Volume/Value Sales Historical Data And Forecasts 2010-2017 - Continued
2010 2011 2012e 2013f 2014f 2015f 2016f 2017f
Gum sales US$, % changey-o-y 11.83 13.35 7.59 10.82 12.29 10.91 10.78 11.62
Gum sales US$ per capita 0.11 0.12 0.13 0.15 0.16 0.18 0.19 0.22
Gum sales, EURmn 1.34 1.45 1.71 1.93 2.25 2.50 2.77 3.09
Gum sales, EUR, %change y-o-y 18.03 8.17 17.76 12.59 16.97 10.91 10.78 11.62
Gum sales, EUR per capita 0.08 0.09 0.10 0.12 0.13 0.15 0.16 0.18
Source: Kazakhstan National Statistical Office, OECD, BMI e/f= BMI estimate/forecast
Processed Foods
Even though domestic meat processing capacities are improving, Kazakhstan continues to rely on imports to
meet most of the local demand. For example, in recent years around 65% of total sausage meat volumes
consumed in Kazakhstan were sourced from abroad, although this figure is calculated to have fallen to
52.4% in 2011. By 2017, we expect that more than half of local demand will be met by locally
manufactured products, with exports also growing strongly, from the 2012 base of just 8.13 tonnes.
Similarly, in 2009, some 67% of poultry demand in Kazakhstan was met through imports, according to
former agricultural minister, Akylbek Kurishbayev. The government's goal is to improve its local food
production and agricultural sectors, supported by substantial investments in the sector.
In the meantime, the population's food preferences are changing. For example, poultry represented just over
5.3% of total meat production in Kazakhstan in 2000, with this percentage almost doubling by the end of
2010, according to the Union of Poultry Producers of Kazakhstan. Over the same period, per capita
consumption of poultry rose from 3.6kg to 13.6kg, as consumers increasingly choose poultry over beef or
pork, mostly due to the former's lower price, but also due to changes in traditional diets, with younger
generations moving away from meats such as mutton.
The association also noted that the percentage of imported poultry meat as a share of total poultry
consumption has been decreasing in recent years. Poultry exports, in the meantime, have grown, but still
represent less than 5% of total output and minor overall volumes.
Kazakhstan Agribusiness Report Q4 2013
© Business Monitor International Page 75

Table: Processed Meat Volume Sales, Production And Trade Historical Data And Forecasts 2010-2017
2010 2011 2012e 2013f 2014f 2015f 2016f 2017f
Bacon/hamproduction, tonnes 1,082.35 1,245.27 1,368.28 1,511.63 1,677.56 1,850.99 2,033.32 2,224.81
Bacon/hamproduction, tonnes,% change y-o-y 15.81 15.05 9.88 10.48 10.98 10.34 9.85 9.42
58.00 54.59 52.58 50.65 48.64 46.85 45.25 43.82
Sausageproduction, tonnes 43,875.67 47,818.42 50,795.34 54,264.67 58,280.20 62,477.40 66,890.07 71,524.15
Sausageproduction, tonnes,% change y-o-y 8.87 8.99 6.23 6.83 7.40 7.20 7.06 6.93
Sausage sales,tonnes 69,321.50 73,916.48 77,500.11 81,740.24 86,615.40 91,736.78 97,142.98 102,845.15
Sausage sales,tonnes, % changey-o-y 5.57 6.63 4.85 5.47 5.96 5.91 5.89 5.87
Sausage sales, kgper capita 4.33 4.56 4.73 4.94 5.18 5.43 5.70 5.97
Source: United Nations, BMI e/f= BMI estimate, forecast
Table: Frozen Fruits and Vegetables Volume Sales, Production And Trade Historical Data And Forecasts 2010-2017
2010 2011 2012e 2013f 2014f 2015f 2016f 2017f
Frozen vegetablesproduction, tonnes 19.57 22.56 24.82 27.45 30.50 33.69 37.04 40.55
Frozen vegetablesproduction, tonnes, %change y-o-y 16.10 15.29 10.01 10.61 11.10 10.44 9.94 9.50
Frozen vegetables sales,tonnes 1,377.17 1,466.77 1,549.90 1,654.59 1,770.64 1,895.38 2,029.44 2,173.50
Frozen vegetables sales,tonnes, % change y-o-y 0.98 6.51 5.67 6.75 7.01 7.05 7.07 7.10
Frozen vegetables sales,kg per capita 0.09 0.09 0.09 0.10 0.11 0.11 0.12 0.13
Frozen fruit exports, tonnes 25.28 35.09 41.48 55.71 79.02 103.41 129.40 157.08
Frozen fruit exports,tonnes, % change y-o-y 26.07 38.81 18.19 34.32 41.84 30.86 25.13 21.39
Frozen fruit imports, tonnes 186.98 191.94 196.56 202.43 208.99 216.04 223.61 231.76
Kazakhstan Agribusiness Report Q4 2013
© Business Monitor International Page 76
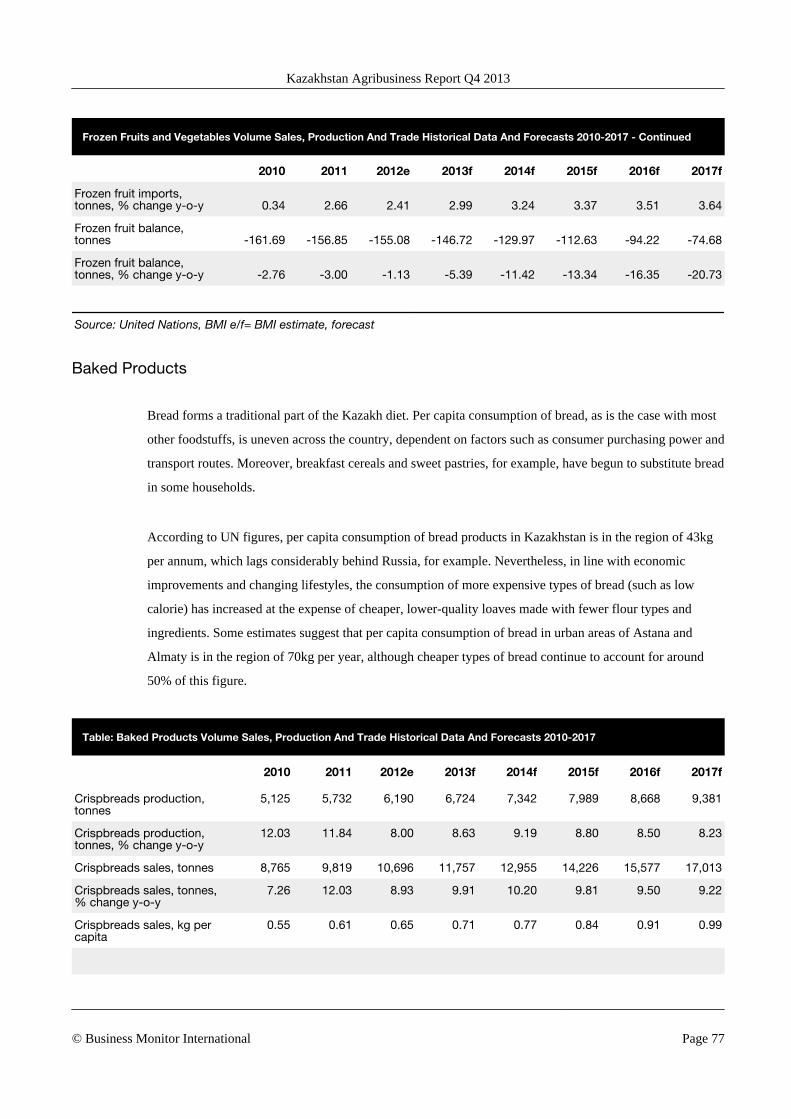
Frozen Fruits and Vegetables Volume Sales, Production And Trade Historical Data And Forecasts 2010-2017 - Continued
2010 2011 2012e 2013f 2014f 2015f 2016f 2017f
Frozen fruit imports,tonnes, % change y-o-y 0.34 2.66 2.41 2.99 3.24 3.37 3.51 3.64
Frozen fruit balance,tonnes -161.69 -156.85 -155.08 -146.72 -129.97 -112.63 -94.22 -74.68
Frozen fruit balance,tonnes, % change y-o-y -2.76 -3.00 -1.13 -5.39 -11.42 -13.34 -16.35 -20.73
Source: United Nations, BMI e/f= BMI estimate, forecast
Baked Products
Bread forms a traditional part of the Kazakh diet. Per capita consumption of bread, as is the case with most
other foodstuffs, is uneven across the country, dependent on factors such as consumer purchasing power and
transport routes. Moreover, breakfast cereals and sweet pastries, for example, have begun to substitute bread
in some households.
According to UN figures, per capita consumption of bread products in Kazakhstan is in the region of 43kg
per annum, which lags considerably behind Russia, for example. Nevertheless, in line with economic
improvements and changing lifestyles, the consumption of more expensive types of bread (such as low
calorie) has increased at the expense of cheaper, lower-quality loaves made with fewer flour types and
ingredients. Some estimates suggest that per capita consumption of bread in urban areas of Astana and
Almaty is in the region of 70kg per year, although cheaper types of bread continue to account for around
50% of this figure.
Table: Baked Products Volume Sales, Production And Trade Historical Data And Forecasts 2010-2017
2010 2011 2012e 2013f 2014f 2015f 2016f 2017f
Crispbreads production,tonnes
5,125 5,732 6,190 6,724 7,342 7,989 8,668 9,381
Crispbreads production,tonnes, % change y-o-y
12.03 11.84 8.00 8.63 9.19 8.80 8.50 8.23
Crispbreads sales, tonnes 8,765 9,819 10,696 11,757 12,955 14,226 15,577 17,013
Crispbreads sales, tonnes,% change y-o-y
7.26 12.03 8.93 9.91 10.20 9.81 9.50 9.22
Crispbreads sales, kg percapita
0.55 0.61 0.65 0.71 0.77 0.84 0.91 0.99
Kazakhstan Agribusiness Report Q4 2013
© Business Monitor International Page 77

Baked Products Volume Sales, Production And Trade Historical Data And Forecasts 2010-2017 - Continued
2010 2011 2012e 2013f 2014f 2015f 2016f 2017f
Sweet biscuits production,tonnes
65,565 71,285 75,604 80,638 86,464 92,554 98,956 105,680
Sweet biscuits production,tonnes, % change y-o-y
8.59 8.72 6.06 6.66 7.22 7.04 6.92 6.79
Sweet biscuits sales, tonnes 115,639 124,519 131,798 140,546 150,461 160,951 172,085 183,898
Sweet biscuits sales,tonnes, % change y-o-y
5.06 7.68 5.85 6.64 7.05 6.97 6.92 6.86
Sweet biscuits sales, kg percapita
7.22 7.68 8.05 8.49 9.00 9.53 10.09 10.68
Bread products (other)production, tonnes
666,185 683,029 695,747 710,568 727,723 745,654 764,505 784,302
Bread products (other)production, tonnes, %change y-o-y
2.35 2.53 1.86 2.13 2.41 2.46 2.53 2.59
Bread products (other)sales, tonnes
680,677 698,969 713,074 729,567 748,475 768,300 789,191 811,186
Bread products (other)sales, tonnes, % change y-o-y
2.32 2.69 2.02 2.31 2.59 2.65 2.72 2.79
Bread products (other)sales, kg per capita
42.47 43.13 43.53 44.08 44.77 45.50 46.28 47.12
Jams/jellies production,tonnes
1,338 1,434 1,507 1,591 1,689 1,791 1,898 2,011
Jams/jellies production,tonnes, % change y-o-y
6.95 7.16 5.05 5.60 6.14 6.04 5.99 5.94
Jams/jellies sales, tonnes 10,107 11,533 12,842 14,498 16,350 18,339 20,474 22,766
Jams/jellies sales, tonnes,% change y-o-y
2.62 14.11 11.35 12.90 12.77 12.16 11.64 11.20
Jams/jellies sales, kg percapita
0.63 0.71 0.78 0.88 0.98 1.09 1.20 1.32
Source: United Nations, BMI e/f= BMI estimate, forecast
Pasta
Most pasta sold in Kazakhstan is available in packaged form. Sales volumes have been increasing over the
past decades, in line with lifestyle changes and the expansion of organised retail, complete with more
targeted marketing campaigns. Future drivers of volume growth will be further urbanisation of the country,
new product launches and a shift towards pasta types that are perceived to have added health benefits.
Kazakhstan Agribusiness Report Q4 2013
© Business Monitor International Page 78

The market is supplied by a combination of locally made and imported products, the latter of which
represent over two-thirds of prepared pasta volumes consumed in Kazakhstan. Competition in the pasta
market has been strong, which will continue to hamper faster value growth.
One of the key players is Sultan Marketing TOO, which has a strong offering in the shape of its affordable
and wide-ranging Sultan brand. Another local company, KazAgroKhleb, is actively promoting pasta recipes
in order to increase the consumption of pasta in the country. Many of the local pasta producers (such as
Tcesna-Astyk and Zernovaya Industriya, the latter which is now part of the Astana Group) also deal in other
dry commodities, such as rice, confectionery and cereals.
Table: Pasta Volume Sales, Production And Trade Historical Data And Forecasts 2010-2017
2010 2011 2012e 2013f 2014f 2015f 2016f 2017f
Uncooked pasta production, tonnes 125,926 137,120 145,572 155,422 166,822 178,739 191,267 204,424
Uncooked pasta production, tonnes,% change y-o-y
8.77 8.89 6.16 6.77 7.34 7.14 7.01 6.88
Uncooked pasta sales, tonnes 125,657 136,801 145,227 154,997 166,253 178,018 190,386 203,372
Uncooked pasta sales, tonnes, %change y-o-y
8.76 8.87 6.16 6.73 7.26 7.08 6.95 6.82
Uncooked pasta sales, kg per capita 7.84 8.44 8.87 9.36 9.94 10.54 11.16 11.81
66.62 66.17 66.17 66.96 68.18 69.31 70.38 71.40
Prepared pasta production, tonnes 17,077 19,030 20,505 22,224 24,213 26,292 28,478 30,773
Prepared pasta production, tonnes, %change y-o-y
11.57 11.44 7.75 8.38 8.95 8.59 8.31 8.06
Prepared pasta sales, tonnes 30,075 33,885 37,232 41,005 44,889 49,041 53,467 58,185
Prepared pasta sales, tonnes, %change y-o-y
6.36 12.67 9.88 10.13 9.47 9.25 9.03 8.82
Prepared pasta sales, kg per capita 1.88 2.09 2.27 2.48 2.68 2.90 3.14 3.38
Source: United Nations, BMI e/f= BMI estimate, forecast
Dairy
Dairy products are very popular in Kazakhstan and make up an important part of the local diet. The dairy
market has grown in recent years as rising disposable incomes mean that locals are buying more products
and experimenting with new product varieties, such as drinks and cheeses. As a result, Ukrainian companies
have also been expanding their exports of cheese to Kazakhstan, which is their second-largest export market
in volume terms, after Russia.
Kazakhstan Agribusiness Report Q4 2013
© Business Monitor International Page 79
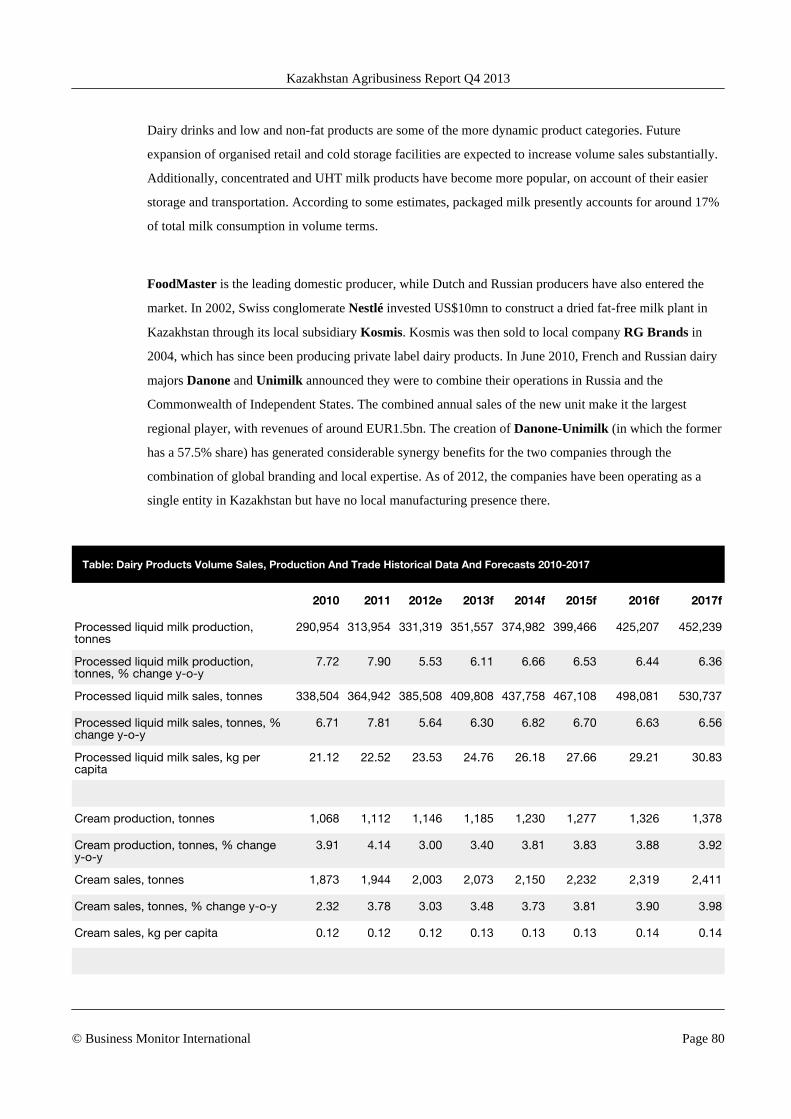
Dairy drinks and low and non-fat products are some of the more dynamic product categories. Future
expansion of organised retail and cold storage facilities are expected to increase volume sales substantially.
Additionally, concentrated and UHT milk products have become more popular, on account of their easier
storage and transportation. According to some estimates, packaged milk presently accounts for around 17%
of total milk consumption in volume terms.
FoodMaster is the leading domestic producer, while Dutch and Russian producers have also entered the
market. In 2002, Swiss conglomerate Nestlé invested US$10mn to construct a dried fat-free milk plant in
Kazakhstan through its local subsidiary Kosmis. Kosmis was then sold to local company RG Brands in
2004, which has since been producing private label dairy products. In June 2010, French and Russian dairy
majors Danone and Unimilk announced they were to combine their operations in Russia and the
Commonwealth of Independent States. The combined annual sales of the new unit make it the largest
regional player, with revenues of around EUR1.5bn. The creation of Danone-Unimilk (in which the former
has a 57.5% share) has generated considerable synergy benefits for the two companies through the
combination of global branding and local expertise. As of 2012, the companies have been operating as a
single entity in Kazakhstan but have no local manufacturing presence there.
Table: Dairy Products Volume Sales, Production And Trade Historical Data And Forecasts 2010-2017
2010 2011 2012e 2013f 2014f 2015f 2016f 2017f
Processed liquid milk production,tonnes
290,954 313,954 331,319 351,557 374,982 399,466 425,207 452,239
Processed liquid milk production,tonnes, % change y-o-y
7.72 7.90 5.53 6.11 6.66 6.53 6.44 6.36
Processed liquid milk sales, tonnes 338,504 364,942 385,508 409,808 437,758 467,108 498,081 530,737
Processed liquid milk sales, tonnes, %change y-o-y
6.71 7.81 5.64 6.30 6.82 6.70 6.63 6.56
Processed liquid milk sales, kg percapita
21.12 22.52 23.53 24.76 26.18 27.66 29.21 30.83
Cream production, tonnes 1,068 1,112 1,146 1,185 1,230 1,277 1,326 1,378
Cream production, tonnes, % changey-o-y
3.91 4.14 3.00 3.40 3.81 3.83 3.88 3.92
Cream sales, tonnes 1,873 1,944 2,003 2,073 2,150 2,232 2,319 2,411
Cream sales, tonnes, % change y-o-y 2.32 3.78 3.03 3.48 3.73 3.81 3.90 3.98
Cream sales, kg per capita 0.12 0.12 0.12 0.13 0.13 0.13 0.14 0.14
Kazakhstan Agribusiness Report Q4 2013
© Business Monitor International Page 80

Dairy Products Volume Sales, Production And Trade Historical Data And Forecasts 2010-2017 - Continued
2010 2011 2012e 2013f 2014f 2015f 2016f 2017f
Yoghurt production, tonnes 124,937 137,147 146,366 157,110 169,545 182,543 196,208 210,559
Yoghurt production, tonnes, % changey-o-y
9.73 9.77 6.72 7.34 7.92 7.67 7.49 7.31
Yoghurt sales, tonnes 161,378 177,265 189,909 204,992 222,252 240,437 259,680 280,028
Yoghurt sales, tonnes, % change y-o-y
7.70 9.84 7.13 7.94 8.42 8.18 8.00 7.84
Yoghurt sales, kg per capita 10.07 10.94 11.59 12.39 13.29 14.24 15.23 16.27
Butter production, tonnes 23,764 26,572 28,692 31,164 34,024 37,013 40,156 43,457
Butter production, tonnes, % changey-o-y
12.00 11.82 7.98 8.61 9.18 8.79 8.49 8.22
Butter sales, tonnes 33,260 36,117 38,289 40,813 43,715 46,751 49,945 53,300
Butter sales, tonnes, % change y-o-y 8.28 8.59 6.01 6.59 7.11 6.95 6.83 6.72
Butter sales, kg per capita 2.08 2.23 2.34 2.47 2.61 2.77 2.93 3.10
Cheese production, tonnes 20,695 23,146 24,996 27,153 29,649 32,258 35,001 37,882
Cheese production, tonnes, % changey-o-y
12.03 11.84 8.00 8.63 9.19 8.80 8.50 8.23
Cheese sales, tonnes 44,800 47,863 50,302 53,165 56,398 59,804 63,406 67,211
Cheese sales, tonnes, % change y-o-y 5.35 6.84 5.10 5.69 6.08 6.04 6.02 6.00
Cheese sales, kg per capita 2.80 2.95 3.07 3.21 3.37 3.54 3.72 3.90
Ice cream production, tonnes 16,234 17,955 19,255 20,769 22,522 24,354 26,280 28,303
Ice cream production, tonnes, %change y-o-y
10.64 10.60 7.24 7.87 8.44 8.13 7.91 7.70
Ice cream sales, tonnes 16,396 18,112 19,410 20,916 22,652 24,467 26,374 28,378
Ice cream sales, tonnes, % change y-o-y
10.49 10.47 7.16 7.76 8.30 8.01 7.80 7.60
Ice cream sales, kg per capita 1.02 1.12 1.18 1.26 1.35 1.45 1.55 1.65
Source: United Nations, BMI e/f= BMI estimate, forecast
Kazakhstan Agribusiness Report Q4 2013
© Business Monitor International Page 81

Drink
Alcoholic Drinks
■ Total alcoholic drinks volume sales CAGR to 2017: +6.3%.
■ Beer volume sales CAGR to 2017: +7.0%.
■ Wine volume sales CAGR to 2017: +4.1%.
■ Spirits volume sales CAGR to 2017: +0.4%.
Alcoholic Drinks Sales
e/f = BMI estimate/forecast. Source: BMI
Kazakhstan's alcoholic drinks industry has considerable long-term growth potential. A combination of
foreign investment into the sector and rising disposable incomes has created a degree of dynamism even
during the economic downturn. We expect that an economic recovery will reflect strong growth in the
alcoholic drinks sector, especially given the growing population.
Another major driving factor will be the trend of consumers moving away from illegal home-brewed
alcoholic drinks, which currently account for a significant proportion of alcoholic drinks consumption.
These drinks often have a dangerously high level of alcohol and, as consumers become more educated and
have higher disposable incomes, they will increasingly move away from these drinks. This shift will drive
growth in the economy end of the market.
Kazakhstan Agribusiness Report Q4 2013
© Business Monitor International Page 82

The beer market is expected to experience the strongest growth within the alcoholic drinks sub-sector as
investments by major operators continue to rise. Estimated at about 47 litres per capita in 2011, beer
consumption is growing off a low base, certainly relative to nearby Russia where about 70 litres are
consumed per capita. Carlsberg and Anadolu Efes' emerging Europe unit EBI is competing for market
share in the country, which will continue to drive investment and marketing strategies.
Young consumers in particular are illustrating a preference for drinks with a lower alcohol content, which is
reflected in beer's rising popularity at the expense of more traditional spirits. This has had a very
pronounced negative effect on the low- and mid-priced segments of the spirits market. However, premium
spirits are expected to experience stronger growth.
Table: Alcoholic Drinks Volume/Value Sales Historical Data And Forecasts 2010-2017
2010 2011 2012e 2013f 2014f 2015f 2016f 2017f
Alcoholic drinks sales, litres mn 690 754 806 841 900 961 1,025 1,094
Alcoholic drinks sales, litres, % changey-o-y
7.81 9.25 6.85 4.45 7.00 6.75 6.68 6.70
Alcoholic drinks sales, litres per capita 43.06 46.52 49.18 50.84 53.85 56.92 60.13 63.54
Alcoholic drinks sales, KZTmn 208,279 240,403 266,359 292,212 327,683 365,094 409,301 460,358
Alcoholic drinks sales, KZT, % changey-o-y
12.74 15.42 10.80 9.71 12.14 11.42 12.11 12.47
Alcoholic drinks sales, KZT per capita 12,996 14,834 16,260 17,655 19,600 21,621 24,002 26,739
Alcoholic drinks sales, US$mn 1,413 1,639 1,788 1,966 2,237 2,501 2,803 3,175
Alcoholic drinks sales, US$ % changey-o-y
12.97 15.98 9.05 10.00 13.75 11.80 12.11 13.25
Alcoholic drinks sales, US$ per capita 88.19 101.15 109.13 118.81 133.79 148.09 164.40 184.41
Alcoholic drinks sales, EURmn 1,066 1,179 1,408 1,573 1,864 2,084 2,336 2,646
Alcoholic drinks sales, EUR, % change 19.24 10.68 19.36 11.76 18.49 11.80 12.11 13.25
Alcoholic drinks sales, EUR per capita 66.48 72.77 85.93 95.05 111.49 123.41 137.00 153.68
Beer sales, litres mn 582.34 644.53 693.09 727.70 784.34 845.41 907.58 973.42
Beer sales, litres, % change y-o-y 9.26 10.68 7.53 4.99 7.78 7.79 7.35 7.25
Beer sales, litres per capita 36.34 39.77 42.31 43.97 46.91 50.07 53.22 56.54
Beer sales, KZTmn 118,287 141,784 160,091 178,506 204,713 234,445 268,044 306,463
Beer sales, KZT, % change y-o-y 17.02 19.86 12.91 11.50 14.68 14.52 14.33 14.33
Beer sales, KZT per capita 7,381 8,748 9,773 10,785 12,245 13,884 15,719 17,801
Beer sales US$mn 803 967 1,074 1,201 1,397 1,606 1,836 2,114
Beer sales, US$, % change y-o-y 17.26 20.45 11.13 11.80 16.32 14.92 14.33 15.12
Kazakhstan Agribusiness Report Q4 2013
© Business Monitor International Page 83

Alcoholic Drinks Volume/Value Sales Historical Data And Forecasts 2010-2017 - Continued
2010 2011 2012e 2013f 2014f 2015f 2016f 2017f
Beer sales, US$ per capita 50.08 59.65 65.59 72.58 83.58 95.10 107.66 122.76
Beer sales, EURmn 605 696 846 961 1,164 1,338 1,530 1,761
Beer sales, EUR, % change y-o-y 23.76 14.94 21.63 13.59 21.17 14.92 14.33 15.12
Beer sales, EUR per capita 37.76 42.92 51.64 58.06 69.65 79.25 89.72 102.30
Wine sales, litres mn 24.00 25.85 27.45 29.42 31.63 30.18 31.92 33.69
Wine sales, litres, % change y-o-y 3.34 7.69 6.19 7.17 7.51 -4.57 5.75 5.55
Wine sales, litres per capita 1.50 1.60 1.68 1.78 1.89 1.79 1.87 1.96
Wine sales, KZTmn 16,253 18,957 21,136 24,056 27,517 27,900 31,423 35,357
Wine sales, KZT, % change y-o-y 10.68 16.63 11.50 13.81 14.39 1.39 12.63 12.52
Wine sales, KZT per capita 1,014 1,170 1,290 1,453 1,646 1,652 1,843 2,054
Wine sales, US$mn 110.29 129.26 141.85 161.88 187.83 191.10 215.22 243.84
Wine sales, US$, % change y-o-y 10.90 17.20 9.74 14.12 16.03 1.74 12.63 13.30
Wine sales, US$ per capita 6.88 7.98 8.66 9.78 11.23 11.32 12.62 14.16
Wine sales, EURmn 83.15 92.99 111.70 129.50 156.52 159.25 179.35 203.20
Wine sales, EUR, % change y-o-y 17.05 11.84 20.11 15.94 20.86 1.74 12.63 13.30
Wine sales, EUR per capita 5.19 5.74 6.82 7.82 9.36 9.43 10.52 11.80
Spirits sales, litres mn 83.78 83.57 85.05 84.34 84.40 85.50 85.82 86.89
Spirits sales, litres, % change y-o-y -0.17 -0.25 1.78 -0.84 0.07 1.31 0.37 1.24
Spirits sales, litres per capita 5.23 5.16 5.19 5.10 5.05 5.06 5.03 5.05
Spirits sales, KZTmn 73,739 79,662 85,132 89,650 95,454 102,749 109,835 118,539
Spirits sales, KZT, % change y-o-y 6.92 8.03 6.87 5.31 6.47 7.64 6.90 7.92
Spirits sales, KZT per capita 4,601 4,915 5,197 5,417 5,709 6,085 6,441 6,885
Spirits sales, US$mn 500.39 543.20 571.36 603.30 651.56 703.76 752.29 817.51
Spirits sales, US$, % change y-o-y 7.13 8.56 5.18 5.59 8.00 8.01 6.90 8.67
Spirits sales, US$ per capita 31.22 33.52 34.88 36.45 38.97 41.68 44.12 47.48
Spirits sales, EURmn 377.23 390.79 449.89 482.64 542.97 586.47 626.91 681.26
Spirits sales, EUR, % change y-o-y 13.07 3.59 15.12 7.28 12.50 8.01 6.90 8.67
Spirits sales, EUR per capita 23.54 24.11 27.46 29.16 32.48 34.73 36.76 39.57
Source: United Nations, BMI e/f= BMI estimate, forecast
Kazakhstan Agribusiness Report Q4 2013
© Business Monitor International Page 84

Soft Drinks
■ Soft drinks volume sales CAGR to 2017: +8.0%.
■ Carbonated drinks volume sales CAGR to 2017:+7.2%.
■ Juice volume sales CAGR to 2017: +10.6%.
■ Bottled water volume sales CAGR to 2017:+7.9%.
■ Functional soft drinks volume sales CAGR to2017: +7.6%.
■ RTD volume sales CAGR to 2017: +7.3%.
Similar to the alcoholic drinks industry, significant
scope for growth remains in the soft drinks industry.
We expect both value and volume sales to continue
growing steadily, albeit from a relatively low base,
with the former negatively impacted by economic
downturn and the currency devaluation. In the shorter term at least, consumers will remain price sensitive.
Economic recovery, however, will very likely stimulate the sales of healthier soft drinks at the expense of
concentrates and carbonates.
New product launches and aggressive marketing and promotional activities focused on urban areas will
drive this growth. Sales of fruit juices will grow along with rising health consciousness, as will sales of
functional drinks such as energy and sports drinks, although to a more limited extent, particularly as the
health effects of energy drinks have begun to be called into question. Nevertheless, novel products, such as
ready-to-drink tea, have performed well over the past few years.
Bottled water sales have experienced very strong growth in recent years as health consciousness increases.
However, this is not a particularly dynamic product category, with hygiene concerns being the main driving
factor behind sales growth, rather than product innovation.
Soft Drinks Sales
f = BMI forecast. Source: BMI
Kazakhstan Agribusiness Report Q4 2013
© Business Monitor International Page 85
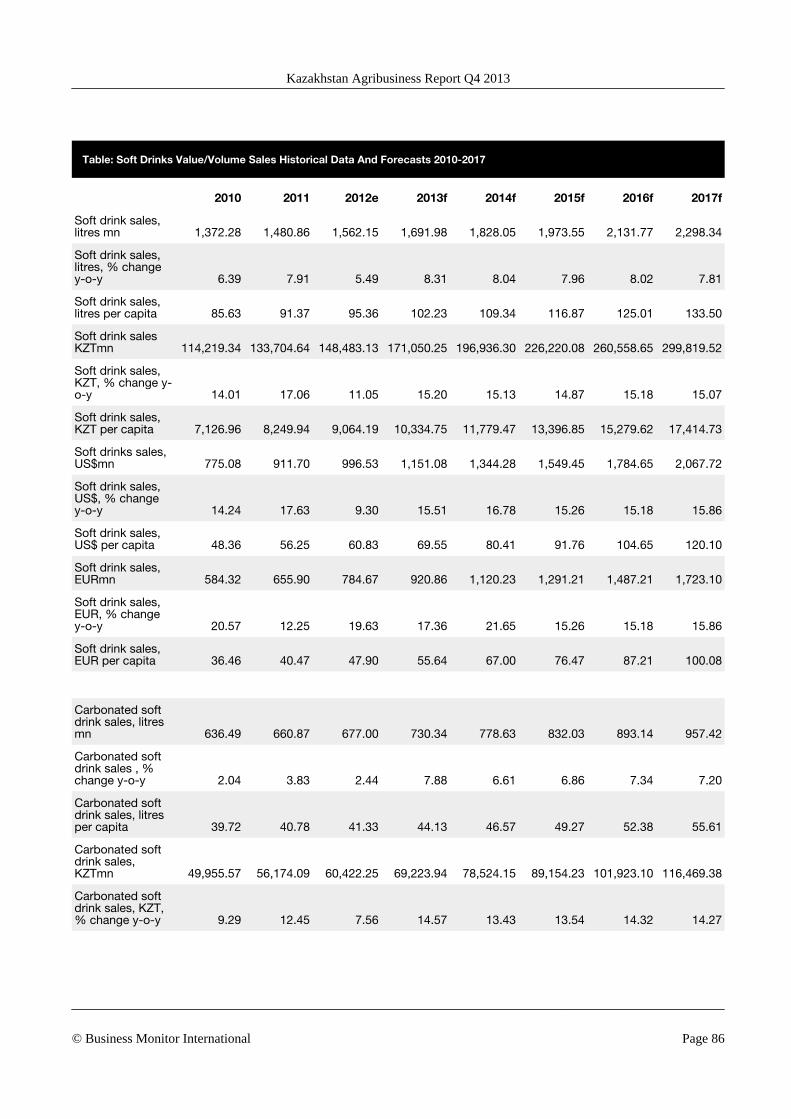
Table: Soft Drinks Value/Volume Sales Historical Data And Forecasts 2010-2017
2010 2011 2012e 2013f 2014f 2015f 2016f 2017f
Soft drink sales,litres mn 1,372.28 1,480.86 1,562.15 1,691.98 1,828.05 1,973.55 2,131.77 2,298.34
Soft drink sales,litres, % changey-o-y 6.39 7.91 5.49 8.31 8.04 7.96 8.02 7.81
Soft drink sales,litres per capita 85.63 91.37 95.36 102.23 109.34 116.87 125.01 133.50
Soft drink salesKZTmn 114,219.34 133,704.64 148,483.13 171,050.25 196,936.30 226,220.08 260,558.65 299,819.52
Soft drink sales,KZT, % change y-o-y 14.01 17.06 11.05 15.20 15.13 14.87 15.18 15.07
Soft drink sales,KZT per capita 7,126.96 8,249.94 9,064.19 10,334.75 11,779.47 13,396.85 15,279.62 17,414.73
Soft drinks sales,US$mn 775.08 911.70 996.53 1,151.08 1,344.28 1,549.45 1,784.65 2,067.72
Soft drink sales,US$, % changey-o-y 14.24 17.63 9.30 15.51 16.78 15.26 15.18 15.86
Soft drink sales,US$ per capita 48.36 56.25 60.83 69.55 80.41 91.76 104.65 120.10
Soft drink sales,EURmn 584.32 655.90 784.67 920.86 1,120.23 1,291.21 1,487.21 1,723.10
Soft drink sales,EUR, % changey-o-y 20.57 12.25 19.63 17.36 21.65 15.26 15.18 15.86
Soft drink sales,EUR per capita 36.46 40.47 47.90 55.64 67.00 76.47 87.21 100.08
Carbonated softdrink sales, litresmn 636.49 660.87 677.00 730.34 778.63 832.03 893.14 957.42
Carbonated softdrink sales , %change y-o-y 2.04 3.83 2.44 7.88 6.61 6.86 7.34 7.20
Carbonated softdrink sales, litresper capita 39.72 40.78 41.33 44.13 46.57 49.27 52.38 55.61
Carbonated softdrink sales,KZTmn 49,955.57 56,174.09 60,422.25 69,223.94 78,524.15 89,154.23 101,923.10 116,469.38
Carbonated softdrink sales, KZT,% change y-o-y 9.29 12.45 7.56 14.57 13.43 13.54 14.32 14.27
Kazakhstan Agribusiness Report Q4 2013
© Business Monitor International Page 86

Soft Drinks Value/Volume Sales Historical Data And Forecasts 2010-2017 - Continued
2010 2011 2012e 2013f 2014f 2015f 2016f 2017f
Carbonated softdrink sales, KZTper capita 3,117.09 3,466.09 3,688.49 4,182.47 4,696.81 5,279.75 5,976.95 6,765.01
Carbonated softdrink sales, US$mn 338.99 383.04 405.52 465.84 536.00 610.65 698.10 803.24
Carbonated softdrink sales, US$,% change y-o-y 9.51 12.99 5.87 14.88 15.06 13.93 14.32 15.06
Carbonated softdrink sales, US$per capita 21.15 23.63 24.75 28.15 32.06 36.16 40.94 46.66
Carbonated softdrink salesEURmn 255.56 275.57 319.31 372.67 446.67 508.87 581.75 669.36
Carbonated softdrink sales, EUR,% change y-o-y 15.58 7.83 15.87 16.71 19.86 13.93 14.32 15.06
Carbonated softdrink sales, EURper capita 15.95 17.00 19.49 22.52 26.72 30.14 34.12 38.88
Fruit/vegetablejuice sales, litresmn 184.63 211.37 232.96 258.60 287.62 318.25 350.70 385.06
Fruit/vegetablejuice sales, litres,% change y-o-y 11.04 14.48 10.21 11.01 11.22 10.65 10.20 9.80
Fruit/vegetablejuice sales, litresper capita 11.52 13.04 14.22 15.62 17.20 18.85 20.57 22.37
Fruit/vegetablejuice sales,KZTmn 21,310.03 26,421.01 30,575.56 36,045.52 42,655.78 50,148.90 58,854.74 68,885.82
Fruit/vegetablejuice sales, KZT,% y-o-y 18.93 23.98 15.72 17.89 18.34 17.57 17.36 17.04
Fruit/vegetablejuice sales, KZTper capita 1,329.69 1,630.25 1,866.49 2,177.85 2,551.40 2,969.84 3,451.35 4,001.17
Fruit/vegetablejuice sales, US$mn 144.61 180.16 205.21 242.57 291.17 343.49 403.11 475.07
Fruit/vegetablejuice sales, US$,% change y-o-y 19.17 24.58 13.90 18.21 20.03 17.97 17.36 17.85
Fruit/vegetablejuice sales, US$per capita 9.02 11.12 12.53 14.66 17.42 20.34 23.64 27.59
Kazakhstan Agribusiness Report Q4 2013
© Business Monitor International Page 87

Soft Drinks Value/Volume Sales Historical Data And Forecasts 2010-2017 - Continued
2010 2011 2012e 2013f 2014f 2015f 2016f 2017f
Fruit/vegetablejuice sales,EURmn 109.02 129.61 161.58 194.05 242.64 286.24 335.93 395.90
Fruit/vegetablejuice sales, EUR,% change y-o-y 25.77 18.89 24.67 20.10 25.04 17.97 17.36 17.85
Fruit/vegetablejuice sales, EURper capita 6.80 8.00 9.86 11.72 14.51 16.95 19.70 23.00
Bottled watersales, litres mn 551.16 608.62 652.20 703.05 761.81 823.27 887.92 955.86
Bottled watersales, litres, %change y-o-y 10.26 10.43 7.16 7.80 8.36 8.07 7.85 7.65
Bottled watersales, litres percapita 34.39 37.55 39.81 42.48 45.57 48.75 52.07 55.52
Bottled watersales, KZTmn 37,317.58 44,628.24 50,214.91 57,486.17 66,277.61 76,101.43 87,412.78 100,311.32
Bottled watersales, KZT, %change y-o-y 18.09 19.59 12.52 14.48 15.29 14.82 14.86 14.76
Bottled watersales, KZT percapita 2,328.51 2,753.68 3,065.38 3,473.28 3,964.30 4,506.76 5,126.04 5,826.49
Bottled watersales, US$mn 253.23 304.31 337.01 386.85 452.41 521.24 598.72 691.80
Bottled watersales, US$, %change y-o-y 18.33 20.17 10.75 14.79 16.95 15.22 14.86 15.55
Bottled watersales, US$ percapita 15.80 18.78 20.57 23.37 27.06 30.87 35.11 40.18
Bottled watersales, EURmn 190.91 218.93 265.36 309.48 377.01 434.37 498.93 576.50
Bottled watersales, EUR, %change y-o-y 24.89 14.68 21.21 16.63 21.82 15.22 14.86 15.55
Bottled watersales, EUR percapita 11.91 13.51 16.20 18.70 22.55 25.72 29.26 33.49
Source: United Nations, BMI e/f= BMI estimate, forecast
Kazakhstan Agribusiness Report Q4 2013
© Business Monitor International Page 88

Hot Drinks
■ Coffee volume sales CAGR to 2016: +8.7%.
• Tea volume sales CAGR to 2016: +7.3%.
As with other countries within the former Soviet
bloc, Kazakhstan is a large consumer of tea,
especially the black variety. Leading brands include
Lipton (produced by multinational food and drink
conglomerate Unilever) and Greenfield (produced
by the Russian Greenfield Tea Ltd, which was
itself created by Orimi Trade), most of which fall
outside the 'cheap' price bracket. Consumers are
highly loyal to their chosen brands, and this will
continue to boost retail values of tea in the forecast
period. New product launches, especially in the
specialty categories, will also stimulate growth in
this market.
Coffee has made headway in line with the development of urban environments. Instant coffee is popular,
with Nescafé (produced by Nestlé) being a popular choice, although there is evidence of a preference shift
towards fresh ground coffee. Over the coming years, the unsaturated coffee market is expected to make
great strides forward, boosted by innovation, the entrance of new players and changing consumption
patterns, including the rising popularity of café culture.
Other hot drinks, including powdered hot chocolate and similar beverages, remain a relatively minor
industry, especially given the largely limited investment in new products. Children are large consumers of
cocoa-powder drinks, with some of the major brands in the category being Nesquik, also manufactured by
Nestlé. The demand for these types of drinks is expected to grow in the coming year, in line with the
development of mass grocery retail and food and drink industries, increased advertising and the more
prominent presence of foreign players.
Tea Sales
2010-2017
e/f = BMI estimate/forecast. Source: BMI
Kazakhstan Agribusiness Report Q4 2013
© Business Monitor International Page 89

Table: Hot Drinks Volume/Value Sales Historical Data And Forecasts 2010-2017
2010 2011 2012e 2013f 2014f 2015f 2016f 2017f
Coffee sales, tonnes 4,630.12 5,080.22 5,584.24 6,065.24 6,635.18 7,204.27 7,821.01 8,488.31
Coffee sales, tonnes, %change y-o-y
8.76 9.72 9.92 8.61 9.40 8.58 8.56 8.53
Coffee sales, kg per capita 0.29 0.31 0.34 0.37 0.40 0.43 0.46 0.49
Coffee sales, KZTmn 1,567.47 1,862.59 2,149.75 2,479.69 2,886.31 3,329.73 3,849.74 4,453.97
Coffee sales,KZT, %change y-o-y
16.48 18.83 15.42 15.35 16.40 15.36 15.62 15.70
Coffee sales,KZT per capita 97.81 114.93 131.23 149.82 172.64 197.19 225.76 258.70
Coffee sales, US$mn 10.64 12.70 14.43 16.69 19.70 22.81 26.37 30.72
Coffee sales, US$, %change y-o-y
16.72 19.40 13.60 15.66 18.07 15.76 15.62 16.49
Coffee sales, US$ percapita
0.66 0.78 0.88 1.01 1.18 1.35 1.55 1.78
Tea sales, tonnes 30,357.16 33,204.42 35,370.61 37,889.05 40,785.82 43,816.79 47,005.38 50,356.25
Tea sales, tonnes, %change y-o-y
9.08 9.38 6.52 7.12 7.65 7.43 7.28 7.13
Tea sales, kg per capita 1.89 2.05 2.16 2.29 2.44 2.59 2.76 2.92
Tea sales, KZTmn 7,988.73 9,463.26 10,584.65 12,041.27 13,791.44 15,742.36 17,985.66 20,539.48
Tea sales, KZT, % changey-o-y
16.82 18.46 11.85 13.76 14.53 14.15 14.25 14.20
Tea sales, KZT per capita 498.47 583.91 646.14 727.53 824.92 932.27 1,054.71 1,193.02
Tea sales, US$mn 54.21 64.53 71.04 81.03 94.14 107.82 123.19 141.65
Tea sales US$ % change y-o-y
17.06 19.03 10.09 14.07 16.18 14.54 14.25 14.99
Tea sales US$ per capita 3.38 3.98 4.34 4.90 5.63 6.39 7.22 8.23
Source: United Nations, BMI e/f= BMI estimate, forecast
Mass Grocery Retail
The retail sector and consumer demand are growing significantly in Kazakhstan, which is fuelling the
growth of the mass grocery retail sector. External investments, such as those made by Russian and Turkish
retailers, and most recently Germany's Metro, will be crucial in driving growth in the consumer sector.
Indeed, the vast opportunities available for retailers to exploit will likely attract foreign retailers from
Russia, and potentially China, who will start to build up a market presence in Kazakhstan. Additionally,
Kazakhstan Agribusiness Report Q4 2013
© Business Monitor International Page 90

expected steady economic growth will continue to attract foreign direct investment from a range of foreign
players, with investment trickling down to underserved areas over the longer term.
As more consumers convert from shopping at independent shops and in bazaars to modern retail formats,
this will drive growth - as will the increasing demand for convenience and longer opening hours, as most
bazaars are closed one day a week. This convenience factor particularly appeals to working women.
Discount stores have started to appear in larger cities, helping to draw more low-income consumers, and
some local stores have started to introduce private-label products, although the scale of this still remains
small. In rural areas, local independent groceries continue to account for the bulk of retail volumes.
With the population forecast to top 17mn by 2020 and given rising GDP per capita, we believe that the
consumer will become instrumental in driving growth dynamics over the long term. With the government
keen to develop its banking and financial sectors, we expect to see an increase in credit availability for the
consumer, particularly credit cards and overdraft facilities, which will extend to the poorer sectors of the
retail market and thus allow for an expansion in consumption possibilities for Kazakh households. As a
result of these dynamics, we expect consumer spending to contribute to about a third of economic growth.
In much the same way that increased credit availability will spur consumer spending, we expect a broader
and more sophisticated array of financial products coming onto the market, which will facilitate investment
and business transactions. Internet retailing is, therefore, likely to become more than just a possibility. With
disposable incomes and demand rising, we forecast steady industry growth.
Kazakhstan Agribusiness Report Q4 2013
© Business Monitor International Page 91

Regional Overview
Regional Overview - Europe
BMI View: We believe the recent proposal by the EU to cap the amount of subsidies received by large
farms will support production growth in the union, as farms are on average smaller in size than other major
agricultural producers. Delays to the removal of production quotas for sugar will keep the regional sugar
market tighter for longer. We see pork supply in the EU tightening on the back of high feed prices and
reforms to health and safety standards. The recent horsemeat scandal unveiled a complicated and
intertwined supply chain in the EU, which will continue to impact food labelling and safety standards,
preventing proper testing.
1. CAP Reforms To Exacerbate Existing Trends
We believe the recent proposal by the EU to cap the amount of subsidies received by large farms will
support production growth in the bloc, as farms here are on average smaller-sized than other major
agricultural producers. In terms of individual products, we identify some agricultural products that will be
affected more than others by the reforms. First, grain markets are likely to be generally spared as current
intervention schemes will be maintained, helping to mitigate the effect of prices on farmers' profits.
Second, we believe delays to the removal of production quotas for sugar will keep the regional sugar
market tighter for longer. Initial reform drafts set 2015 as a target for sugar production quotas to be phased
out, but recent negotiations have indicated that they could be maintained until 2017 and 2020. Third, we
believe the EU livestock and dairy industries will be the worst-hit by the reforms, especially in a context of
tighter mandatory environmental and quality standards.
Kazakhstan Agribusiness Report Q4 2013
© Business Monitor International Page 92

Table: EU Farm Size Statistics In 2007
Average UAA
of all farms (ha)
Average UAA of the larger farms
(ha)Number of
larger farmsLarge farms (as %
of all farms)
Thresholdvalue
(ha)
Luxembourg 57 212 123 5.3 159
Finland 34 146 3,141 4.6 100
France 53 274 20,032 3.8 196
Netherlands 25 135 2,826 3.7 88
Sweden 43 388 1,605 2.2 234
Germany 46 1,391 2,434 0.7 705
Poland 6 250 12,392 0.5 74
Czech Republic 89 3,531 199 0.5 2,500
Italy 8 337 7,560 0.5 138
UK 54 2,416 1,335 0.5 891
Spain 24 1,087 4,580 0.4 517
Slovakia 28 3,934 98 0.1 2,782
Note: UAA stands for utilised agricultural area; 20% of the total UAA is covered by holdings larger than size the thresholdvalue determined in the last column. Source: Eurostat
2. Sugar Reforms: Turning More Cautious On Production Prospects
We have revised down our forecast for sugar production in the EU in 2013/14 from 17.2mn tonnes to
15.9mn tonnes, as planting growth in the bloc has been subdued, especially in Germany. We believe the
lower plantings were a result of farmers favouring more competitive crops, especially corn and wheat, for
which tight markets encouraged extensive growth in planting.
Kazakhstan Agribusiness Report Q4 2013
© Business Monitor International Page 93

Remaining In Deficit
EU-27 - Sugar Production Balance ('000 tonnes)
f = BMI forecast. Source: Bloomberg, BMI
Recent measures to allow additional imports to the region have not been sufficient to significantly loosen
the regional market, with prices in the EU surging in a context of moderating global prices. This has left
sugar prices in the EU at a high of EUR731/tonne as of June, while global sugar prices have dropped below
the EU reference price. Our forecast for a production deficit in the region over the years to 2016/17 is in line
with our view that the disconnect between price trends in the global market and in the European market is
here to stay.
3. EU Pork Supply To Tighten Significantly In Medium Term
We expect pork supply in Europe to tighten significantly in the coming years and have revised our outlook
for production in the EU on the back of recent data from Eurostat showing the pig population declining in
2011. We now estimate pork production in the EU-27 fell by 2.0% in 2012 and project it to fall by 1.0% in
2013. The recent surge in grain prices, especially for wheat, corn and barley, which are used in the EU for
feed, is putting significant pressure on farmers' margins. This is especially the case as retail pork prices have
Kazakhstan Agribusiness Report Q4 2013
© Business Monitor International Page 94

not increased by much in recent months, while global lean hog prices declined sharply over the summer of
2012 on the back of oversupply and disease concerns in the US.
Losing Pigs
EU-27 - Pig Herd ('000 head)
Source: Eurostat
4. Biofuels Incentive Shift To Decrease Farm Industry Competitiveness
The EU's recent shift in favour of second-generation biofuel produced from waste instead of food crops will
not have a significant impact on the actual volume of crops the biofuels industry uses. Ultimately, the EU's
move will effectively phase out incentives to boost grain, sugar and vegetable oil production for the biofuels
industry, which in the long term will remove positive spillover effects for the livestock, sugar and vegetable
oil industries. Consistent and potentially growing demand from the biofuels sector has encouraged
investment in farming land and increased productivity, as there are synergies between feed produced for the
livestock sector and ethanol production. For example, a by-product of the wheat-into-ethanol production
process can be used as a high protein content feed for livestock. Similar trends are visible in the sugar and
vegetable oil sectors: food demand for these products in a very mature regional market is insufficient to
Kazakhstan Agribusiness Report Q4 2013
© Business Monitor International Page 95
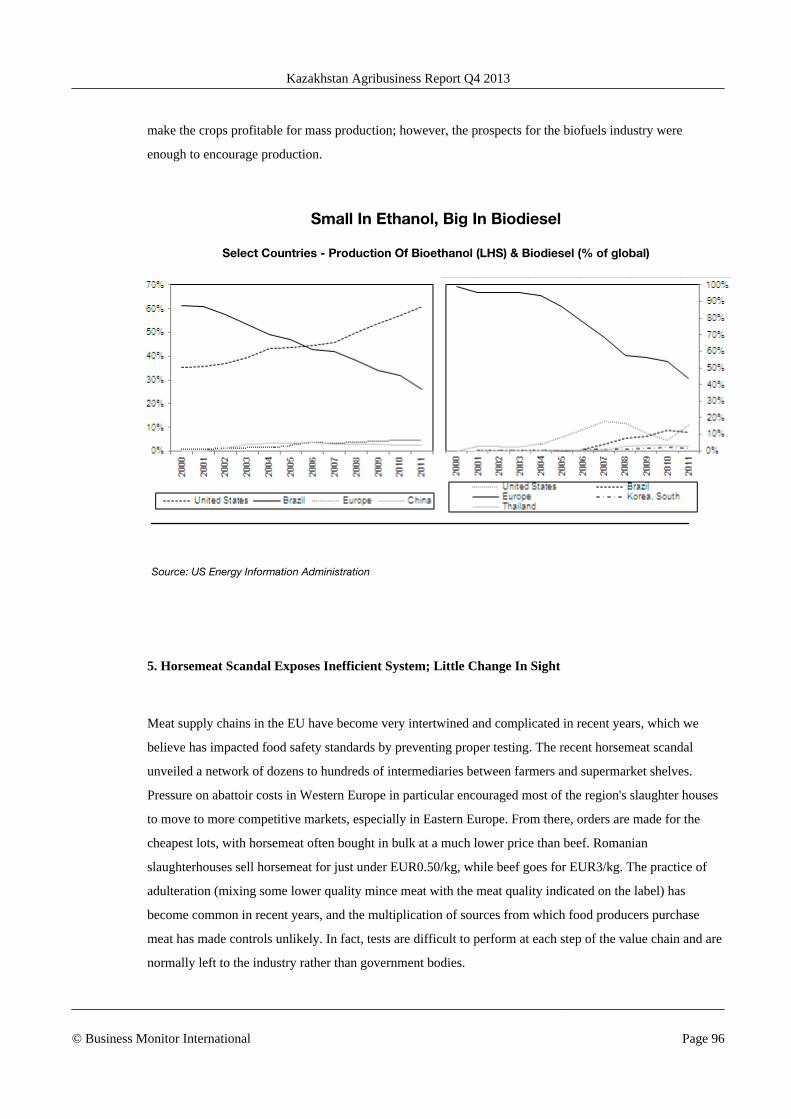
make the crops profitable for mass production; however, the prospects for the biofuels industry were
enough to encourage production.
Small In Ethanol, Big In Biodiesel
Select Countries - Production Of Bioethanol (LHS) & Biodiesel (% of global)
Source: US Energy Information Administration
5. Horsemeat Scandal Exposes Inefficient System; Little Change In Sight
Meat supply chains in the EU have become very intertwined and complicated in recent years, which we
believe has impacted food safety standards by preventing proper testing. The recent horsemeat scandal
unveiled a network of dozens to hundreds of intermediaries between farmers and supermarket shelves.
Pressure on abattoir costs in Western Europe in particular encouraged most of the region's slaughter houses
to move to more competitive markets, especially in Eastern Europe. From there, orders are made for the
cheapest lots, with horsemeat often bought in bulk at a much lower price than beef. Romanian
slaughterhouses sell horsemeat for just under EUR0.50/kg, while beef goes for EUR3/kg. The practice of
adulteration (mixing some lower quality mince meat with the meat quality indicated on the label) has
become common in recent years, and the multiplication of sources from which food producers purchase
meat has made controls unlikely. In fact, tests are difficult to perform at each step of the value chain and are
normally left to the industry rather than government bodies.
Kazakhstan Agribusiness Report Q4 2013
© Business Monitor International Page 96

6 Steps To Go
Findus' Case - Steps Between The Abattoir & The Retailer's Shelf
Source: Financial Times, France 24
Even though Poland was not originally targeted as responsible for beef adulteration detected in Western
European ground beef, recent DNA traces have revealed that the country could have been one origin of the
horsemeat exported to the rest of Europe. As a result of increasing distrust over beef products from Poland,
the country's beef exports fell by 30% since the start of 2013 compared with the same period last. We
believe beef exports for the entire year will be down in year-on-year terms. This is a significant drawback
for the industry, as the Polish beef sector is particularly export dependent, with trade accounting for more
than 80% of output on the back of subdued domestic demand for beef because of a local preference for pork
and poultry.
Kazakhstan Agribusiness Report Q4 2013
© Business Monitor International Page 97

Demographic Forecast
Demographic analysis is a key pillar of BMI's macroeconomic and industry forecasting model. Not only is
the total population of a country a key variable in consumer demand, but an understanding of the
demographic profile is key to understanding issues ranging from future population trends to productivity
growth and government spending requirements.
The accompanying charts detail Kazakhstan's population pyramid for 2011, the change in the structure of
the population between 2011 and 2050 and the total population between 1990 and 2050, as well as life
expectancy. The tables show key datapoints from all of these charts, in addition to important metrics
including the dependency ratio and the urban/rural split.
Source: World Bank, UN, BMI
Kazakhstan Agribusiness Report Q4 2013
© Business Monitor International Page 98

Table: Kazakhstan's Population By Age Group, 1990-2020 ('000)
1990 1995 2000 2005 2010 2012f 2015f 2020f
Total 16,530 15,926 14,957 15,172 16,026 16,381 16,886 17,680
0-4 years 1,876 1,462 1,117 1,198 1,641 1,752 1,660 1,608
5-9 years 1,729 1,719 1,411 1,099 1,184 1,338 1,640 1,651
10-14 years 1,597 1,556 1,606 1,388 1,099 1,079 1,183 1,632
15-19 years 1,443 1,427 1,417 1,577 1,397 1,261 1,096 1,175
20-24 years 1,323 1,312 1,273 1,384 1,597 1,560 1,390 1,085
25-29 years 1,467 1,187 1,195 1,238 1,366 1,471 1,582 1,373
30-34 years 1,412 1,299 1,079 1,156 1,206 1,246 1,345 1,556
35-39 years 1,170 1,242 1,145 1,034 1,120 1,142 1,180 1,317
40-44 years 874 1,054 1,066 1,093 1,019 1,028 1,089 1,150
45-49 years 582 766 920 1,008 1,091 1,048 981 1,053
50-54 years 918 501 641 855 954 997 1,035 936
55-59 years 550 805 415 581 761 810 884 968
60-64 years 621 451 651 360 505 575 681 803
65-69 years 360 509 332 542 299 318 430 593
70-74 years 218 277 359 254 423 343 237 351
75+ years 389 358 328 405 365 415 473 428
f = BMI forecast. Source: World Bank, UN, BMI
Kazakhstan Agribusiness Report Q4 2013
© Business Monitor International Page 99

Table: Kazakhstan's Population By Age Group, 1990-2020 (% of total)
1990 1995 2000 2005 2010 2012f 2015f 2020f
0-4 years 11.35 9.18 7.47 7.89 10.24 10.69 9.83 9.10
5-9 years 10.46 10.79 9.44 7.24 7.39 8.17 9.71 9.34
10-14 years 9.66 9.77 10.74 9.15 6.86 6.59 7.01 9.23
15-19 years 8.73 8.96 9.48 10.39 8.72 7.69 6.49 6.64
20-24 years 8.00 8.24 8.51 9.12 9.96 9.52 8.23 6.14
25-29 years 8.88 7.46 7.99 8.16 8.52 8.98 9.37 7.76
30-34 years 8.54 8.16 7.21 7.62 7.52 7.61 7.97 8.80
35-39 years 7.08 7.80 7.65 6.82 6.99 6.97 6.99 7.45
40-44 years 5.29 6.62 7.13 7.20 6.36 6.28 6.45 6.50
45-49 years 3.52 4.81 6.15 6.65 6.81 6.40 5.81 5.96
50-54 years 5.55 3.15 4.29 5.64 5.95 6.08 6.13 5.30
55-59 years 3.33 5.05 2.77 3.83 4.75 4.95 5.23 5.48
60-64 years 3.76 2.83 4.35 2.37 3.15 3.51 4.03 4.54
65-69 years 2.18 3.19 2.22 3.57 1.87 1.94 2.55 3.35
70-74 years 1.32 1.74 2.40 1.67 2.64 2.09 1.41 1.98
75+ years 2.36 2.25 2.19 2.67 2.27 2.53 2.80 2.42
f = BMI forecast. Source: World Bank, UN, BMI
Kazakhstan Agribusiness Report Q4 2013
© Business Monitor International Page 100

Table: Kazakhstan's Key Population Ratios, 1990-2020
1990 1995 2000 2005 2010 2012f 2015f 2020f
Dependent ratio, % of total working age 1 59.5 58.5 52.6 47.5 45.5 47.1 49.9 54.9
Dependent population, total, '000 2 6,169 5,880 5,155 4,885 5,011 5,243 5,623 6,263
Active population, % of total 3 62.7 63.1 65.5 67.8 68.7 68.0 66.7 64.6
Active population, total, '000 4 10,361 10,045 9,802 10,287 11,015 11,138 11,263 11,417
Youth population, % of total working age 5 50.2 47.2 42.2 35.8 35.6 37.4 39.8 42.8
Youth population, total, '000 6 5,202 4,737 4,135 3,685 3,925 4,168 4,483 4,891
Pensionable population, % of total workingage 7 9.3 11.4 10.4 11.7 9.9 9.7 10.1 12.0
Pensionable population, '000 8 967 1,144 1,020 1,200 1,087 1,075 1,140 1,372
f = BMI forecast; 1 0>15 plus 65+, as % of total working age population; 2 0>15 plus 65+; 3 15-64, as % of totalpopulation; 4 15-64; 5 0>15, % of total working age population; 6 0>15; 7 65+, % of total working age population; 8 65+.Source: World Bank, UN, BMI
Table: Kazakhstan's Rural And Urban Population, 1990-2020
1990 1995 2000 2005 2010 2012 2015 2020
Urban population, % of total 56.3 55.9 56.3 57.1 58.1 58.6 59.3 60.7
Rural population, % of total 43.7 44.1 43.7 42.9 41.9 41.4 40.7 39.3
Urban population, '000 9,203.9 8,840.9 8,379.5 8,648.9 9,311.3 9,596.2 10,013.4 10,731.8
Rural population, '000 7,144.1 6,974.7 6,504.1 6,498.1 6,715.0 6,785.1 6,872.6 6,948.2
Source: World Bank, UN, BMI
Kazakhstan Agribusiness Report Q4 2013
© Business Monitor International Page 101

Methodology
BMI's industry forecasts are generated using the best-practice techniques of time-series modelling and
causal/econometric modelling. The precise form of model we use varies from industry to industry, in each
case being determined, as per standard practice, by the prevailing features of the industry data being
examined. BMI mainly uses OLS estimators, and in order to avoid relying on subjective views and
encourage the use of objective views, BMI uses a 'general-to-specific' method. BMI mainly uses a linear
model, but simple non-linear models, such as the log-linear model, are used when necessary. During periods
of 'industry shock', for example poor weather conditions impeding agricultural output, dummy variables are
used to determine the level of impact.
Effective forecasting depends on appropriately selected regression models. BMI selects the best model
according to various different criteria and tests, including but not exclusive to:
■ R2 tests explanatory power; adjusted R2 takes degree of freedom into account
■ Testing the directional movement and magnitude of coefficients
■ Hypothesis testing to ensure coefficients are significant (normally t-test and/or P-value)
■ All results are assessed to alleviate issues related to auto-correlation and multi-collinearity
BMI uses the selected best model to perform forecasting.
It must be remembered that human intervention plays a necessary and desirable role in all of BMI's industry
forecasting. Experience, expertise and knowledge of industry data and trends ensure that analysts spot
structural breaks, anomalous data, turning points and seasonal features where a purely mechanical
forecasting process would not.
Within the Agribusiness industry, this intervention might include but is not exclusive to technology
development that might influence future output levels (for example greater use of biotechnology); dramatic
changes in local production levels due to public or private sector investment; the regulatory environment
and specific areas of legislation, such as import and export tariffs and farm subsidies; changes in lifestyles
and general societal trends; the formation of bilateral and multilateral trading agreements; and political
factors.
The following two examples show the demand (consumption) and the supply (production) of rice. Note that
the explanatory variables for both of them are quite similar, but the underlying economic theory is different.
Kazakhstan Agribusiness Report Q4 2013
© Business Monitor International Page 102

Example of rice consumption model:
(Rice Consumption)t = β0 + β1*(Real Private Consumption per capita)t + β2*(Inflation)t + β3*(Real
Lending Rate)t + β4*(Population)t + β5*(Government Expenditure)t + β6*(Food Consumption)t-1 + εt
Where:
■ β are parameters for this function.
■ Real private consumption per capita has a positive relationship with rice consumption, if rice is a normalgood in a particular country. If rice is an inferior good in a country, the relationship is negative. So thesign of β1 is determined by a specific product within a specific country.
■ When inflation is high, people with rational expectations will consume 'today' rather than wait for'tomorrow's high price to come. Higher rice demand in year t due to higher inflation in that year leads toan assumed positive sign of β2.
■ The relationship between real lending rate and rice consumption is expected to be negative. When reallending rates increase, disposable incomes, especially for those with mortgage burdens etc, will decrease.So the sign of β3 is expected to be negative.
■ Of course, other things being equal, growth in rice consumption can also be caused by growth inpopulation. Consequently, positive sign of β4 is expected.
■ Government expenditure typically causes total disposable incomes to rise. So the sign of β5 is expected tobe positive.
■ Human behaviour has a trend: A high level of food consumption in previous years means there is verylikely to be a high level of food consumption the next year. So the positive sign of β6 is expected.
■ ε is the error/residual term.
Example of rice production model:
(Rice Production)t = β0 + β1*(Real GDP per capita)t + β2*(Inflation)t + β3*(Real Lending Rate)t +
β4*(Rural Population)t + β5*(Government Expenditure)t + β6*(Food Production)t-1 + εt
Where:
■ The same as above, the relationship between real GDP per capita and rice production depends on whetherrice is normal or inferior good in that country.
■ If high inflation is caused by food prices increasing, farmers will be more profitable. Then they willsupply more agricultural product (eg, rice) to increase their marginal (extra) profit, although this istempered by the rising cost of other inputs in line with inflation.
■ There is a global move towards corporate farming, away from small holdings, in order to achieve greateragricultural productivity. Corporate farming means more investment in the modes of production i.e.agricultural machinery. Higher real lending rates discourage investment, which in turn reduce production.
Kazakhstan Agribusiness Report Q4 2013
© Business Monitor International Page 103

■ BMI assumes only the rural population has a positive effect on agricultural product supply.
■ With supportive government policy, other things being equal, rice production is expected to goup. Government expenditure is likely to play some role in supporting agribusiness.
■ Again, previous food production positively affects this year's prediction.
Kazakhstan Agribusiness Report Q4 2013
© Business Monitor International Page 104
Top Related
Copyright © 2022 FDOKUMEN

