


Bahasa
Halaman
Hukum

C
Original article 307
Blood pressure rise with swimming versus walking in olderwomen: the Sedentary Women Exercise AdherenceTrial 2 (SWEAT 2)Kay L. Coxa, Valerie Burkea, Lawrence J. Beilina, J. Robert Groveb,Brian A. Blanksbyb and Ian B. Puddeya
Objective Swimming is often recommended in the
prevention and treatment of hypertension. Few studies have
investigated the effect of swimming training on blood
pressure (BP). Our objective was to evaluate 6 months of
supervised moderate swimming or walking on BP in
previously sedentary, normotensive, older women.
Design Women aged 50–70 years (n U 116) were randomly
assigned to a supervised 6-month swimming or walking
programme. They were further randomized to receive usual
care or a behavioural intervention package.
Methods Exercise comprised 3 sessions/week with a
warm-up, cool down, and 30-min of moderate intensity walk-
ing or swimming. BP was recorded for 20 min supine, and
5 min standing. Assessments were made at 0 and 6 months.
Results At baseline, mean supine BP (W SD) was
115.7 W 1.3/66.8 W 0.7 mmHg. Swimming improved swim
distance by 78.1 m (29.3%) [95% confidence interval (CI);
66.7, 89.4] and walk time by 0.58 min (3.8%) (0.41, 0.74).
Walking decreased walk time by 1.0 min (6.5%) (0.81, 1.19).
After adjustment for initial BP, age, hypertension treatment
status and change in weight, swimming increased supine
and standing systolic BP relative to walking by 4.4 mmHg
(1.2, 7.5) (P U 0.008) and 6.0 mmHg (2.6, 9.5) (P U 0.001),
opyright © Lippincott Williams & Wilkins. Unauth
0263-6352 � 2006 Lippincott Williams & Wilkins
respectively. Supine and standing diastolic BP increased by
1.4 mmHg (S0.14, 3.0) (P U 0.07) and 1.8 mmHg (S0.02,
3.5) (P U 0.05), respectively.
Conclusion Relative to moderately paced walking, regular
swimming significantly elevates BP in previously sedentary,
normotensive, olderwomen.Thisfindingmayhave important
implications for exercise prescription in older subjects.
J Hypertens24:307–314Q2006 LippincottWilliams& Wilkins.
Journal of Hypertension 2006, 24:307–314
Keywords: blood pressure, older women, sedentary women, swimming,walking
aSchool of Medicine and Pharmacology and bSchool of Human Movement andExercise Science, University of Western Australia, Western Australian Institute forMedical Research, Perth, Western Australia
Correspondence and requests for reprints to Dr Kay L. Cox, University ofWestern Australia, School of Medicine and Pharmacology (Royal Perth HospitalUnit), GPO Box X2213 Perth, Western Australia 6001, AustraliaTel: +61 (08) 9224 0237; fax: +61 (08) 9224 0246;e-mail: [email protected]
Sponsorship: This research was supported by a grant from the WesternAustralian Health Promotion Foundation.
Received 11 July 2005 Revised 7 October 2005Accepted 3 November 2005
See editorial commentary page 269
IntroductionModerate intensity aerobic exercise such as walking [1,2]
and stationary cycling [3] has been shown to reduce
resting blood pressure (BP) in normotensive individuals.
Swimming is often recommended by various authorita-
tive groups as a mode of exercise for the prevention
and treatment of hypertension and cardiovascular disease
[4–6]. These recommendations are based on data from
studies using other forms of aerobic exercise. This
approach assumes that all of the benefits conferred from
walking, running and cycling studies may also be applied
to swimming. There is a paucity of information to support
this assumption, and the assertion that the health benefits
are similar to those achieved with walking, running and
cycling may therefore be tenuous [7].
Blood pressure increases with immersion in water and
with acute swimming, particularly in older individuals
[8]. For the same heart rate (HR), mean arterial BP is
higher with swimming compared to running [9]. Further-
more, BP in trained swimmers is higher than in other
endurance-trained athletes [10,11]. In the only controlled
(but not randomized) trial examining the effects of swim-
ming training on BP, BP fell after 10 weeks in middle-
aged hypertensive men and women [12]. Longer-term
effects of swimming training in previously sedentary,
older individuals with normal or controlled BP have
not been investigated.
In the present study we hypothesized that a 6-month
supervised, moderate-intensity walking programme in
normotensive/controlled, non-obese older women would
result in a greater reduction in resting BP compared with
a swimming programme of similar intensity.
MethodsParticipantsWomen aged 50–70 years were recruited from media
advertising. From 1312 telephone contacts, 212 women
orized reproduction of this article is prohibited.
C
308 Journal of Hypertension 2006, Vol 24 No 2
meeting the study entry criteria underwent further
screening. Women were included if they were non-smo-
kers, sedentary, that is, doing less than 30 min/week of
moderate activity for 6 months prior, BP less than 160/
100 mmHg, body mass index (BMI) less than 34 kg/m2
and alcohol intake less than 210 ml/week. Those taking
hormone replacement, BP or cholesterol-lowering medi-
cation were included. Participants unable to float or who
were limited in their capacity to participate in exercise
because of musculo-skeletal disorders, or with a history
of diabetes, cardiovascular, respiratory or other chronic
illness, were excluded. They underwent blood tests to
screen for common abnormalities, a 12-lead resting elec-
trocardiogram and a full medical examination. One hun-
dred and sixteen women entered the study and gave
informed written consent. The study was approved by
the University of Western Australia Committee for
Human Rights.
Study designParticipants underwent a 6-week run-in period. During
the last 2 weeks of this period BP, 24-h urine, fitness,
physical activity, body weight and body composition
were assessed. Women were stratified and matched for
age and BMI, then randomly assigned by research staff
via computer-generated random numbers (generated
and held by the statistician) to either a closely supervised
walking or swimming programme. They were further
randomized to behavioural intervention or usual care.
It was not possible to blind the participants, observers
or intervention staff to the participant’s group allocation.
Exercise protocolParticipants attended supervised exercise three times a
week for 6 months. Training HR was determined from
the HR reserve (HRres) [13]. Resting HR was taken with
baseline BP assessments. Maximum HR was taken as the
highest value of either the predicted maximum HR
formula (220 – age), or the maximum HR on the baseline
fitness tests. As maximal HR has been reported to be 10–
13 beats lower in swimming compared to land-based
activities [14] we also calculated post-hoc an adjusted
intensity for swimming relative to a 10-beat lower
maximal HR.
Sessions comprised of 10 min warm-up and 5 min stretch-
ing (stretching prior to water warm-up in the swim group)
followed by 30 min of swimming, or walking at a moder-
ate intensity (60–70% HRres), 10 min cooling down and
5 min stretching. Initially women exercised at 50% HRres
and by 8 weeks had progressed to 60–70% HRres. Mean
training HR measured by HR monitor (Polar Edge, Polar
Electro Oy Kempele, Finland) after 15 and 30 min of ex-
ercise was used to determine training intensity (% HRres).
Walking was completed as a continuous walk around
ovals and parks. Swimming was in heated indoor and
opyright © Lippincott Williams & Wilkins. Unautho
outdoor swimming pools (26.58C). Initially swimming
was completed as interval training. As fitness increased,
the rest periods became shorter and the amount of
continuous swimming increased.
Behavioural InterventionPreviously, we developed a behavioural intervention
package to encourage adoption and adherence to an
exercise programme [15]. This package was given to half
the participants, the others had ‘usual care’.
MeasurementsPhysical activity and fitness
Physical activity was assessed from the 7-day Physical
Activity Recall questionnaire [16]. The 1.6 km walk test
[17] was used to measure walking fitness. Heart rate
monitors were used to record HR every minute and, at
1.6 km, the time was taken and maximal oxygen con-
sumption estimated [17]. Two walks were performed
1 week apart, the lower time the baseline measure.
Swimming fitness was assessed using the 12-min swim
test [18]. Participants wore a HR monitor, and swam as far
as possible in 12 min, with HR taken on completing the
swim. Two tests were completed 1 week apart in the
same covered, heated, 25-m pool. The longer distance
was the baseline measurement. After 6 months, women
completed a walk and swim test. All fitness tests were
completed at least 48 h after the last exercise session.
At baseline and 6 months, swimming skill was assessed by
a highly skilled swimming teacher from observation and a
skill test. Subjects were rated as ‘competent’ or ‘non-
competent’ swimmers and ‘anxious’ or ‘not anxious’
when swimming with their faces in the water.
Blood pressure
Blood pressure and HR were measured with the Dina-
map 1846SX (Critikon Inc., Tampa, Florida, USA). The
precision and accuracy of the Dinamap 1846SX has been
demonstrated [19] and its use in the research setting
supported [20]. Mean BP for each visit was calculated
from 10 supine readings taken over 20 min and five
standing readings over 5 min. Baseline BP was the mean
of three separate visits at the end of baseline. At 6 months
BP was measured as the mean from two separate visits
[2]. All BP measurements were taken at least 48 h after
the last prescribed exercise session and no other moder-
ate or vigorous exercise. Participants were non-fasting but
refrained from any caffeine-containing food or beverages
in the preceding 2 h.
Anthropometrics
Height and weight were measured. Upper arm girth was
measured using a steel tape measure (Rabone Chester-
man, Birmingham, UK). A John Bull caliper (British
Indicators Ltd, Bedfordshire, UK) was used to measure
the triceps skinfold [2]. The upper arm girth and the
rized reproduction of this article is prohibited.

C
Swimming, walking and blood pressure changes Cox et al. 309
triceps skinfold were used to estimate arm muscle girth
[21].
Dietary compliance
Participants were asked to maintain their usual diet, salt
and alcohol intake throughout the study. Dietary salt
intake was monitored from 24-h urinary sodium excretion
[2]. Change in diet was monitored by a questionnaire,
mean alcohol intake by the completion of 7-day retro-
spective diaries [2].
Statistical analysisAll results are expressed as mean with 95% confidence
limits in brackets, except for baseline results, which are
expressed as mean � SD. The SPSS statistical software
(release 11.5; SPSS Inc., Chicago, Illinois, USA) was used
to analyse the data. Frequency counts and chi-squared
analyses were used to determine BP medication, demo-
graphic data and retention. Within-group differences
were determined from a paired t-test. Generalized linear
models (GLM) analysis of variance with interaction and
adjustment for baseline values were used to examine
effects of the interventions on exercise adherence, exer-
cise intensity, body weight, resting HR, measures of
fitness and lifestyle compliance. GLM were used with
BP as the dependent variable adjusted for initial BP, age,
BP medication, change in body weight and change in arm
muscle girth as indicated. Results were considered sig-
nificant if P < 0.05. An a posteriori calculation indicated
that the study had 90% power at a ¼ 0.05 to detect an
exercise mode or behavioural intervention main effect on
systolic BP of 5 mmHg.
ResultsBaseline characteristicsGroups were well matched at baseline (Table 1) with no
statistical differences between the groups. In the swim
group, 18% were classified as ‘not competent’ swimmers
opyright © Lippincott Williams & Wilkins. Unauth
Table 1 Baseline demographic and fitness characteristics of participa
Walking
Usual care (n ¼ 29) ‘SWEAT’ pa
Age (years) 55.03 � 4.87 55.45Height (mm) 1635.8 � 53.2 1633.0Weight (kg) 70.52 � 9.85 70.99BMI (kg/m2) 26.34 � 3.43 26.531.6 km walk time (min) 14.73 � 0.95 14.99Swim distance (m) 299.0 � 65.8 284.3
V̇O2max predicted (ml/kg per min) 28.14 � 3.28 27.00
Energy expenditure (kJ/kg per day) 34.36 � 1.45 34.26Supine systolic BP (mmHg) 117.3 � 12.5 118.7Supine diastolic BP (mmHg) 68.3 � 6.4 67.2Supine heart rate (mmHg) 69.2 � 7.7 68.4Drinkers (n) 25Alcohol intake (ml/week) 62.46 � 62.11 56.28Antihypertensive medication (n) 5Postmenopausal (n) 16Oral contraceptives/HRT (n) 11
BMI, body mass index; BP, blood pressure; V̇O2max , maximal oxygen consumption; HRTdifferences between groups at baseline.
and 80% were anxious about putting their face in the
water.
Behavioural interventionThe behavioural intervention did not have any significant
effect on retention and adherence rates, BP, HR and
body composition. Thus the results for the main outcome
variables are presented for the walking and swimming
groups.
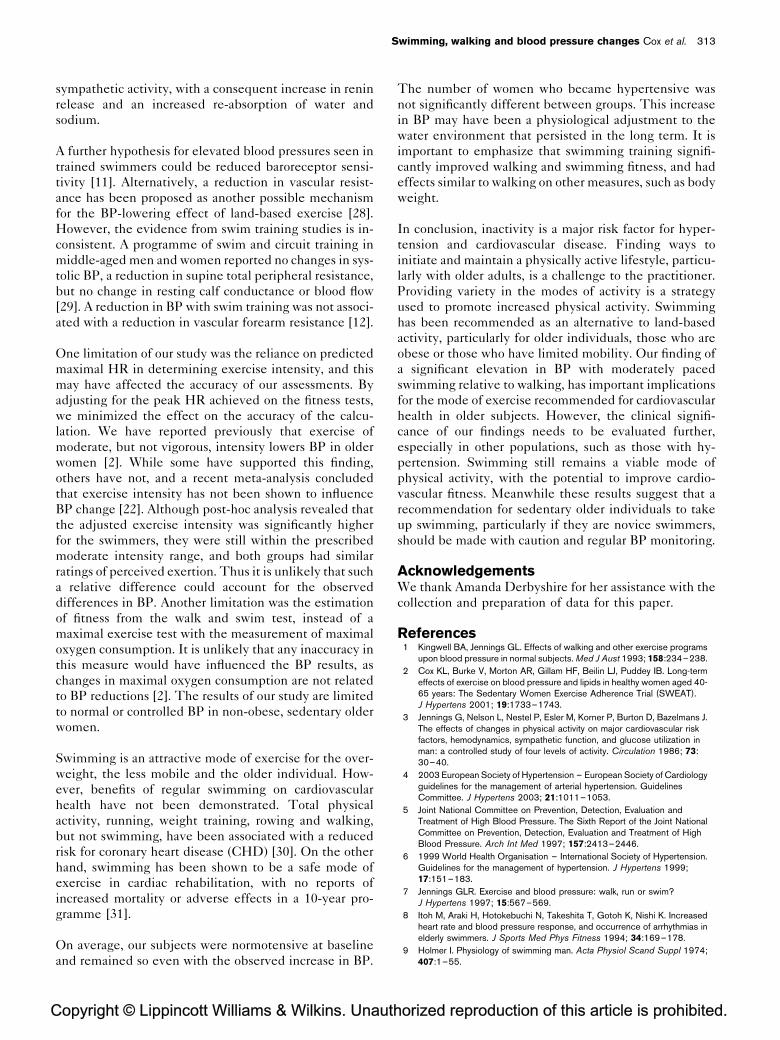
Retention rates and exercise adherenceAfter 6 months, 100 women were still in the study
(Fig. 1). There was no significant difference in retention
between the swimming or walking groups (85.7 versus
86.7%, respectively). Adherence to the number of pre-
scribed exercise sessions was similar in the swimming and
walking group 76.4% (69.5, 83.2) versus 74.3% (67.7,
80.9), respectively.
Both groups exercised at the target exercise intensity and
there was no significant difference in intensity between
the walking 59.7% HRres (57.9, 61.6) and the swimming
group 60.9% HRres (59.0, 62.8). When the training inten-
sity for the swim group was calculated using the adjusted
maximum HR approach, training intensity was 66.5%
HRres (64.5, 68.6), significantly higher than that of the
walk group (P ¼ 0.001).
Physical fitnessWalk time was reduced by 1.0 min (0.81, 1.19) (6.5%)
(P ¼ 0.001) in the walk group and 0.58 min (0.41, 0.74)
(3.8%) (P ¼ 0.001) in the swim group. There was a
significant difference in walk time between the walking
and swimming group after 6 months (P ¼ 0.001).
After 6 months the distance swum in the swim test
increased by 78.1 m (66.7, 89.4) (29.3%) within the swim
group (P ¼ 0.001) with no significant change in the walk
orized reproduction of this article is prohibited.
nts in the four study groups
Swimming
ckage (n ¼ 31) Usual care (n ¼ 29) ‘SWEAT’ package (n ¼ 27)
� 4.93 55.93 � 4.84 55.53 � 4.69� 70.2 1646.7 � 54.5 1635.9 � 59.2� 12.34 71.04 � 7.69 69.69 � 9.05� 3.67 26.37 � 2.98 26.31 � 3.22� 1.14 14.66 � 1.06 14.89 � 1.21� 67.2 300.65 � 81.1 288.3 � 80.3� 4.84 27.43 � 3.90 27.62 � 4.67
� 1.55 34.53 � 1.83 34.34 � 1.43� 16.0 113.6 � 12.3 113.6 � 10.5� 9.1 66.4 � 6.3 66.1 � 6.8� 7.5 66.1 � 5.7 66.9 � 6.5
28 22 22� 40.37 61.17 � 79.77 60.00 � 52.263 3 3
22 21 1815 10 14
, hormone replacement therapy. Values are mean � SD. There were no significant
C
310 Journal of Hypertension 2006, Vol 24 No 2
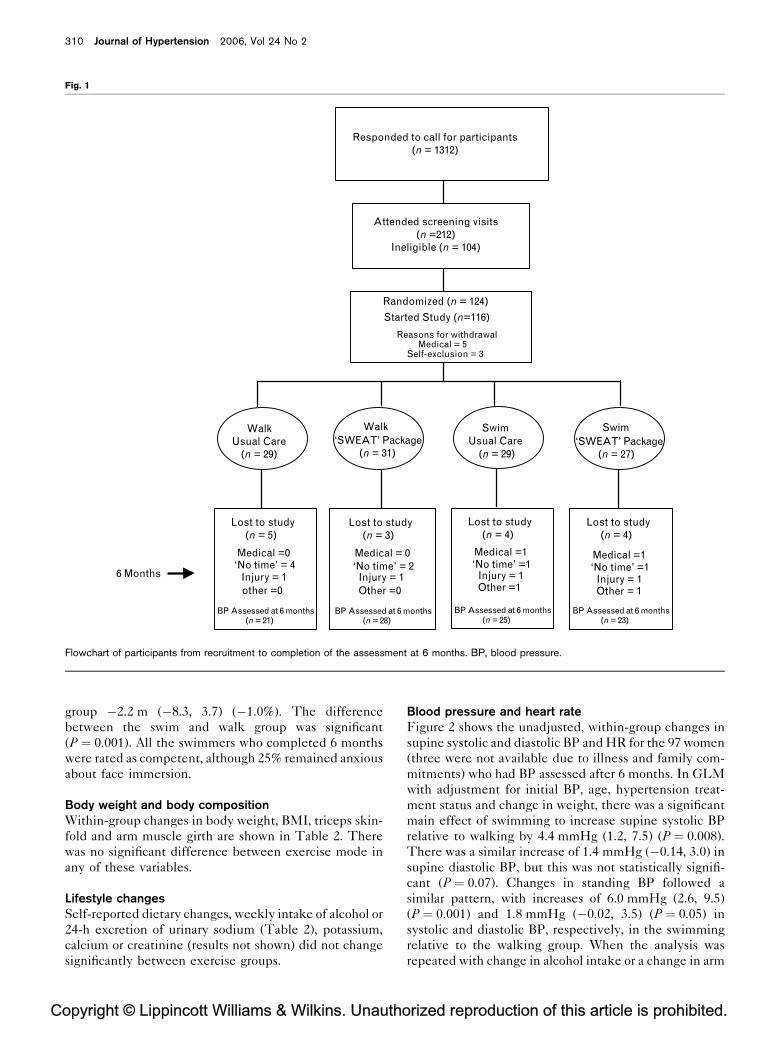
Fig. 1
Responded to call for participants(n = 1312)
Attended screening visits(n =212)
Ineligible (n = 104)
Randomized (n = 124)
Started Study (n=116)
Reasons for withdrawalMedical = 5
Self-exclusion = 3
WalkUsual Care
(n = 29)
Lost to study(n = 5)
Medical =0 ‘No time’ = 4
Injury = 1other =0
BP Assessed at 6 months(n = 21)
Lost to study(n = 3)
Medical = 0‘No time’ = 2
Injury = 1Other =0
BP Assessed at 6 months(n = 28)
Lost to study(n = 4)
Medical =1 ‘No time’ =1
Injury = 1Other =1
BP Assessed at 6 months(n = 25)
Lost to study(n = 4)
Medical =1 ‘No time’ =1
Injury = 1Other = 1
BP Assessed at 6 months(n = 23)
Walk‘SWEAT’ Package
(n = 31)
Swim‘SWEAT’ Package
(n = 27)
6 Months
SwimUsual Care
(n = 29)
Flowchart of participants from recruitment to completion of the assessment at 6 months. BP, blood pressure.
group �2.2 m (�8.3, 3.7) (�1.0%). The difference
between the swim and walk group was significant
(P ¼ 0.001). All the swimmers who completed 6 months
were rated as competent, although 25% remained anxious
about face immersion.
Body weight and body compositionWithin-group changes in body weight, BMI, triceps skin-
fold and arm muscle girth are shown in Table 2. There
was no significant difference between exercise mode in
any of these variables.
Lifestyle changesSelf-reported dietary changes, weekly intake of alcohol or
24-h excretion of urinary sodium (Table 2), potassium,
calcium or creatinine (results not shown) did not change
significantly between exercise groups.
opyright © Lippincott Williams & Wilkins. Unautho
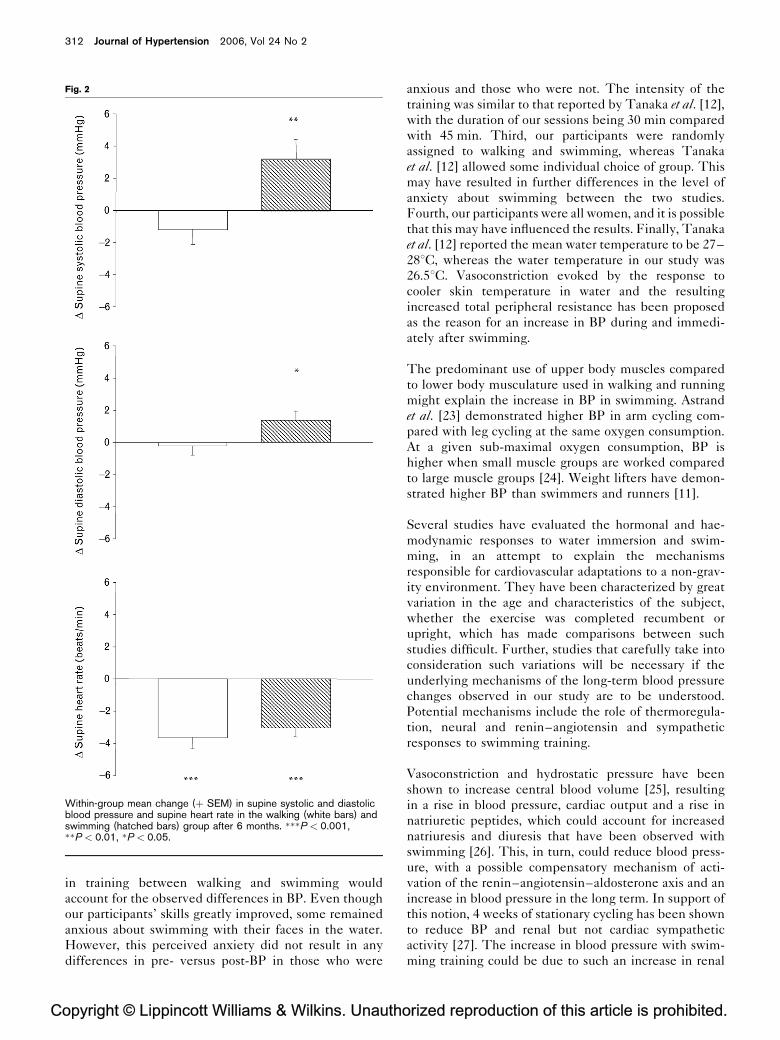
Blood pressure and heart rateFigure 2 shows the unadjusted, within-group changes in
supine systolic and diastolic BP and HR for the 97 women
(three were not available due to illness and family com-
mitments) who had BP assessed after 6 months. In GLM
with adjustment for initial BP, age, hypertension treat-
ment status and change in weight, there was a significant
main effect of swimming to increase supine systolic BP
relative to walking by 4.4 mmHg (1.2, 7.5) (P ¼ 0.008).
There was a similar increase of 1.4 mmHg (�0.14, 3.0) in
supine diastolic BP, but this was not statistically signifi-
cant (P ¼ 0.07). Changes in standing BP followed a
similar pattern, with increases of 6.0 mmHg (2.6, 9.5)
(P ¼ 0.001) and 1.8 mmHg (�0.02, 3.5) (P ¼ 0.05) in
systolic and diastolic BP, respectively, in the swimming
relative to the walking group. When the analysis was
repeated with change in alcohol intake or a change in arm
rized reproduction of this article is prohibited.
C
Swimming, walking and blood pressure changes Cox et al. 311
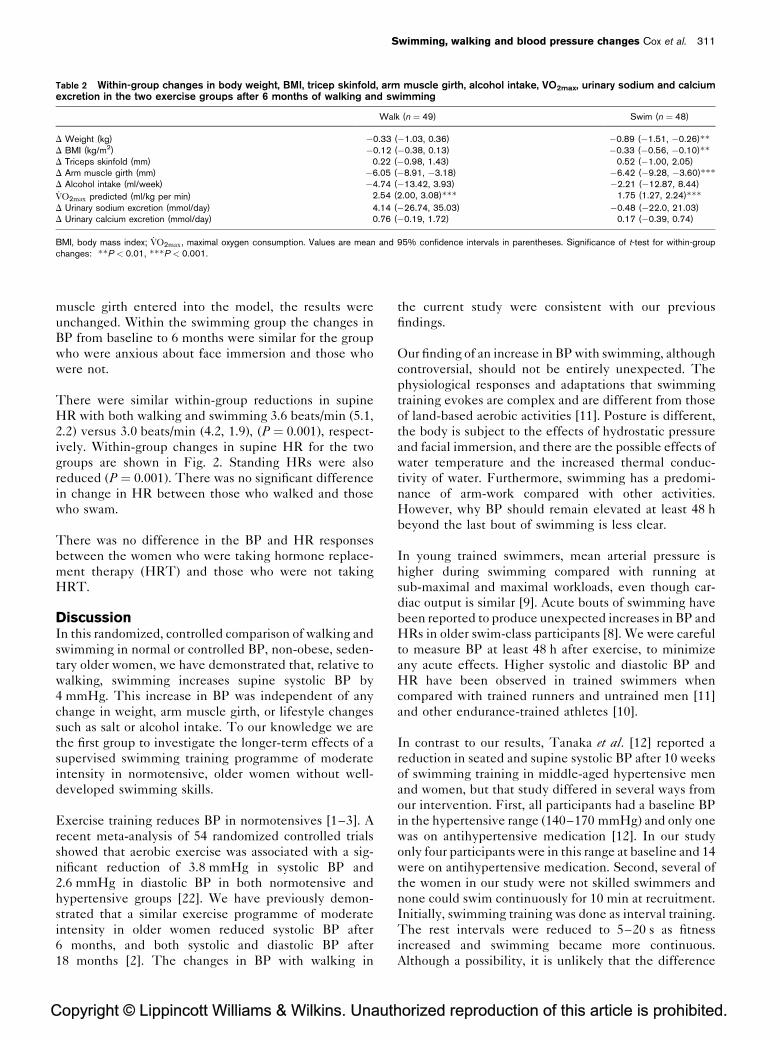
Table 2 Within-group changes in body weight, BMI, tricep skinfold, arm muscle girth, alcohol intake, VO2max, urinary sodium and calciumexcretion in the two exercise groups after 6 months of walking and swimming
Walk (n ¼ 49) Swim (n ¼ 48)
D Weight (kg) �0.33 (�1.03, 0.36) �0.89 (�1.51, �0.26)��D BMI (kg/m2) �0.12 (�0.38, 0.13) �0.33 (�0.56, �0.10)��D Triceps skinfold (mm) 0.22 (�0.98, 1.43) 0.52 (�1.00, 2.05)D Arm muscle girth (mm) �6.05 (�8.91, �3.18) �6.42 (�9.28, �3.60)���D Alcohol intake (ml/week) �4.74 (�13.42, 3.93) �2.21 (�12.87, 8.44)
V̇O2max predicted (ml/kg per min) 2.54 (2.00, 3.08)��� 1.75 (1.27, 2.24)���D Urinary sodium excretion (mmol/day) 4.14 (�26.74, 35.03) �0.48 (�22.0, 21.03)D Urinary calcium excretion (mmol/day) 0.76 (�0.19, 1.72) 0.17 (�0.39, 0.74)
BMI, body mass index; V̇O2max , maximal oxygen consumption. Values are mean and 95% confidence intervals in parentheses. Significance of t-test for within-groupchanges: ��P < 0.01, ���P < 0.001.
muscle girth entered into the model, the results were
unchanged. Within the swimming group the changes in
BP from baseline to 6 months were similar for the group
who were anxious about face immersion and those who
were not.
There were similar within-group reductions in supine
HR with both walking and swimming 3.6 beats/min (5.1,
2.2) versus 3.0 beats/min (4.2, 1.9), (P ¼ 0.001), respect-
ively. Within-group changes in supine HR for the two
groups are shown in Fig. 2. Standing HRs were also
reduced (P ¼ 0.001). There was no significant difference
in change in HR between those who walked and those
who swam.
There was no difference in the BP and HR responses
between the women who were taking hormone replace-
ment therapy (HRT) and those who were not taking
HRT.
DiscussionIn this randomized, controlled comparison of walking and
swimming in normal or controlled BP, non-obese, seden-
tary older women, we have demonstrated that, relative to
walking, swimming increases supine systolic BP by
4 mmHg. This increase in BP was independent of any
change in weight, arm muscle girth, or lifestyle changes
such as salt or alcohol intake. To our knowledge we are
the first group to investigate the longer-term effects of a
supervised swimming training programme of moderate
intensity in normotensive, older women without well-
developed swimming skills.
Exercise training reduces BP in normotensives [1–3]. A
recent meta-analysis of 54 randomized controlled trials
showed that aerobic exercise was associated with a sig-
nificant reduction of 3.8 mmHg in systolic BP and
2.6 mmHg in diastolic BP in both normotensive and
hypertensive groups [22]. We have previously demon-
strated that a similar exercise programme of moderate
intensity in older women reduced systolic BP after
6 months, and both systolic and diastolic BP after
18 months [2]. The changes in BP with walking in
opyright © Lippincott Williams & Wilkins. Unauth
the current study were consistent with our previous
findings.
Our finding of an increase in BP with swimming, although
controversial, should not be entirely unexpected. The
physiological responses and adaptations that swimming
training evokes are complex and are different from those
of land-based aerobic activities [11]. Posture is different,
the body is subject to the effects of hydrostatic pressure
and facial immersion, and there are the possible effects of
water temperature and the increased thermal conduc-
tivity of water. Furthermore, swimming has a predomi-
nance of arm-work compared with other activities.
However, why BP should remain elevated at least 48 h
beyond the last bout of swimming is less clear.
In young trained swimmers, mean arterial pressure is
higher during swimming compared with running at
sub-maximal and maximal workloads, even though car-
diac output is similar [9]. Acute bouts of swimming have
been reported to produce unexpected increases in BP and
HRs in older swim-class participants [8]. We were careful
to measure BP at least 48 h after exercise, to minimize
any acute effects. Higher systolic and diastolic BP and
HR have been observed in trained swimmers when
compared with trained runners and untrained men [11]
and other endurance-trained athletes [10].
In contrast to our results, Tanaka et al. [12] reported a
reduction in seated and supine systolic BP after 10 weeks
of swimming training in middle-aged hypertensive men
and women, but that study differed in several ways from
our intervention. First, all participants had a baseline BP
in the hypertensive range (140–170 mmHg) and only one
was on antihypertensive medication [12]. In our study
only four participants were in this range at baseline and 14
were on antihypertensive medication. Second, several of
the women in our study were not skilled swimmers and
none could swim continuously for 10 min at recruitment.
Initially, swimming training was done as interval training.
The rest intervals were reduced to 5–20 s as fitness
increased and swimming became more continuous.
Although a possibility, it is unlikely that the difference
orized reproduction of this article is prohibited.
C
312 Journal of Hypertension 2006, Vol 24 No 2
Fig. 2
Within-group mean change (þ SEM) in supine systolic and diastolicblood pressure and supine heart rate in the walking (white bars) andswimming (hatched bars) group after 6 months. ���P < 0.001,��P < 0.01, �P < 0.05.
in training between walking and swimming would
account for the observed differences in BP. Even though
our participants’ skills greatly improved, some remained
anxious about swimming with their faces in the water.
However, this perceived anxiety did not result in any
differences in pre- versus post-BP in those who were
opyright © Lippincott Williams & Wilkins. Unautho
anxious and those who were not. The intensity of the
training was similar to that reported by Tanaka et al. [12],
with the duration of our sessions being 30 min compared
with 45 min. Third, our participants were randomly
assigned to walking and swimming, whereas Tanaka
et al. [12] allowed some individual choice of group. This
may have resulted in further differences in the level of
anxiety about swimming between the two studies.
Fourth, our participants were all women, and it is possible
that this may have influenced the results. Finally, Tanaka
et al. [12] reported the mean water temperature to be 27–
288C, whereas the water temperature in our study was
26.58C. Vasoconstriction evoked by the response to
cooler skin temperature in water and the resulting
increased total peripheral resistance has been proposed
as the reason for an increase in BP during and immedi-
ately after swimming.
The predominant use of upper body muscles compared
to lower body musculature used in walking and running
might explain the increase in BP in swimming. Astrand
et al. [23] demonstrated higher BP in arm cycling com-
pared with leg cycling at the same oxygen consumption.
At a given sub-maximal oxygen consumption, BP is
higher when small muscle groups are worked compared
to large muscle groups [24]. Weight lifters have demon-
strated higher BP than swimmers and runners [11].
Several studies have evaluated the hormonal and hae-
modynamic responses to water immersion and swim-
ming, in an attempt to explain the mechanisms
responsible for cardiovascular adaptations to a non-grav-
ity environment. They have been characterized by great
variation in the age and characteristics of the subject,
whether the exercise was completed recumbent or
upright, which has made comparisons between such
studies difficult. Further, studies that carefully take into
consideration such variations will be necessary if the
underlying mechanisms of the long-term blood pressure
changes observed in our study are to be understood.
Potential mechanisms include the role of thermoregula-
tion, neural and renin–angiotensin and sympathetic
responses to swimming training.
Vasoconstriction and hydrostatic pressure have been
shown to increase central blood volume [25], resulting
in a rise in blood pressure, cardiac output and a rise in
natriuretic peptides, which could account for increased
natriuresis and diuresis that have been observed with
swimming [26]. This, in turn, could reduce blood press-
ure, with a possible compensatory mechanism of acti-
vation of the renin–angiotensin–aldosterone axis and an
increase in blood pressure in the long term. In support of
this notion, 4 weeks of stationary cycling has been shown
to reduce BP and renal but not cardiac sympathetic
activity [27]. The increase in blood pressure with swim-
ming training could be due to such an increase in renal
rized reproduction of this article is prohibited.
C
Swimming, walking and blood pressure changes Cox et al. 313
sympathetic activity, with a consequent increase in renin
release and an increased re-absorption of water and
sodium.
A further hypothesis for elevated blood pressures seen in
trained swimmers could be reduced baroreceptor sensi-
tivity [11]. Alternatively, a reduction in vascular resist-
ance has been proposed as another possible mechanism
for the BP-lowering effect of land-based exercise [28].
However, the evidence from swim training studies is in-
consistent. A programme of swim and circuit training in
middle-aged men and women reported no changes in sys-
tolic BP, a reduction in supine total peripheral resistance,
but no change in resting calf conductance or blood flow
[29]. A reduction in BP with swim training was not associ-
ated with a reduction in vascular forearm resistance [12].
One limitation of our study was the reliance on predicted
maximal HR in determining exercise intensity, and this
may have affected the accuracy of our assessments. By
adjusting for the peak HR achieved on the fitness tests,
we minimized the effect on the accuracy of the calcu-
lation. We have reported previously that exercise of
moderate, but not vigorous, intensity lowers BP in older
women [2]. While some have supported this finding,
others have not, and a recent meta-analysis concluded
that exercise intensity has not been shown to influence
BP change [22]. Although post-hoc analysis revealed that
the adjusted exercise intensity was significantly higher
for the swimmers, they were still within the prescribed
moderate intensity range, and both groups had similar
ratings of perceived exertion. Thus it is unlikely that such
a relative difference could account for the observed
differences in BP. Another limitation was the estimation
of fitness from the walk and swim test, instead of a
maximal exercise test with the measurement of maximal
oxygen consumption. It is unlikely that any inaccuracy in
this measure would have influenced the BP results, as
changes in maximal oxygen consumption are not related
to BP reductions [2]. The results of our study are limited
to normal or controlled BP in non-obese, sedentary older
women.
Swimming is an attractive mode of exercise for the over-
weight, the less mobile and the older individual. How-
ever, benefits of regular swimming on cardiovascular
health have not been demonstrated. Total physical
activity, running, weight training, rowing and walking,
but not swimming, have been associated with a reduced
risk for coronary heart disease (CHD) [30]. On the other
hand, swimming has been shown to be a safe mode of
exercise in cardiac rehabilitation, with no reports of
increased mortality or adverse effects in a 10-year pro-
gramme [31].
On average, our subjects were normotensive at baseline
and remained so even with the observed increase in BP.
opyright © Lippincott Williams & Wilkins. Unauth
The number of women who became hypertensive was
not significantly different between groups. This increase
in BP may have been a physiological adjustment to the
water environment that persisted in the long term. It is
important to emphasize that swimming training signifi-
cantly improved walking and swimming fitness, and had
effects similar to walking on other measures, such as body
weight.
In conclusion, inactivity is a major risk factor for hyper-
tension and cardiovascular disease. Finding ways to
initiate and maintain a physically active lifestyle, particu-
larly with older adults, is a challenge to the practitioner.
Providing variety in the modes of activity is a strategy
used to promote increased physical activity. Swimming
has been recommended as an alternative to land-based
activity, particularly for older individuals, those who are
obese or those who have limited mobility. Our finding of
a significant elevation in BP with moderately paced
swimming relative to walking, has important implications
for the mode of exercise recommended for cardiovascular
health in older subjects. However, the clinical signifi-
cance of our findings needs to be evaluated further,
especially in other populations, such as those with hy-
pertension. Swimming still remains a viable mode of
physical activity, with the potential to improve cardio-
vascular fitness. Meanwhile these results suggest that a
recommendation for sedentary older individuals to take
up swimming, particularly if they are novice swimmers,
should be made with caution and regular BP monitoring.
AcknowledgementsWe thank Amanda Derbyshire for her assistance with the
collection and preparation of data for this paper.
References1 Kingwell BA, Jennings GL. Effects of walking and other exercise programs
upon blood pressure in normal subjects. Med J Aust 1993; 158:234–238.
2 Cox KL, Burke V, Morton AR, Gillam HF, Beilin LJ, Puddey IB. Long-termeffects of exercise on blood pressure and lipids in healthy women aged 40-65 years: The Sedentary Women Exercise Adherence Trial (SWEAT).J Hypertens 2001; 19:1733–1743.
3 Jennings G, Nelson L, Nestel P, Esler M, Korner P, Burton D, Bazelmans J.The effects of changes in physical activity on major cardiovascular riskfactors, hemodynamics, sympathetic function, and glucose utilization inman: a controlled study of four levels of activity. Circulation 1986; 73:30–40.
4 2003 European Society of Hypertension – European Society of Cardiologyguidelines for the management of arterial hypertension. GuidelinesCommittee. J Hypertens 2003; 21:1011–1053.
5 Joint National Committee on Prevention, Detection, Evaluation andTreatment of High Blood Pressure. The Sixth Report of the Joint NationalCommittee on Prevention, Detection, Evaluation and Treatment of HighBlood Pressure. Arch Int Med 1997; 157:2413–2446.
6 1999 World Health Organisation – International Society of Hypertension.Guidelines for the management of hypertension. J Hypertens 1999;17:151–183.
7 Jennings GLR. Exercise and blood pressure: walk, run or swim?J Hypertens 1997; 15:567–569.
8 Itoh M, Araki H, Hotokebuchi N, Takeshita T, Gotoh K, Nishi K. Increasedheart rate and blood pressure response, and occurrence of arrhythmias inelderly swimmers. J Sports Med Phys Fitness 1994; 34:169–178.
9 Holmer I. Physiology of swimming man. Acta Physiol Scand Suppl 1974;407:1–55.
orized reproduction of this article is prohibited.
C
314 Journal of Hypertension 2006, Vol 24 No 2
10 Marconnet P, Slaoui F, Gastaud M, Ardisson JL. Pre-exercise, exercise andearly post exercise arterial blood pressure in young competitive swimmersversus non swimmers. J Sports Med Phys Fitness 1984; 24:252–258.
11 Jost J, Weiss M, Weicker H. Comparison of sympatho-adrenergicregulation at rest and of the adrenoceptor system in swimmers, long-distance runners, weight lifters, wrestlers and untrained men. Eur J ApplPhysiol Occup Physiol 1989; 58:596–604.
12 Tanaka H, Bassett DR Jr, Howley ET, Thompson DL, Ashraf M, Rawson FL.Swimming training lowers the resting blood pressure in individuals withhypertension. J Hypertens 1997; 15:651–657.
13 Karvonen MJ, Kentala E, Mastala O. The effects of training heart rate: alongitudinal analysis. Annales Medicinae Experimentalis et BiologiaeFenniae 1957; 35:307–315.
14 DiCarlo LJ, Sparling PB, Millard-Stafford ML, Rupp JC. Peak heart ratesduring maximal running and swimming: implications for exerciseprescription. Int J Sports Med 1991; 12:309–312.
15 Cox KL, Burke V, Gorely TJ, Beilin LJ, Puddey IB. Controlled comparison ofretention and adherence in home- vs center-initiated exercise interventionsin women aged 40–65 years: The S.W.E.A.T. Study (Sedentary WomenExercise Adherence Trial). Prev Med 2003; 36:17–29.
16 Blair SN. How to assess exercise habits and physical fitness. In: MatarazzoJD, Herd JA, Miller NE, Weiss SM, editors. Behavioral health: a handbookof health enhancement and disease prevention. New York: John Wiley &Sons; 1984. pp. 424–447.
17 Kline GM, Porcari JP, Hintermeister R, Freedson PS, Ward A, McCarronRF, et al. Estimation of VO2max from a one-mile track walk, gender, age, andbody weight. Med Sci Sports Exerc 1987; 19:253–259.
18 Cooper K. The aerobics way. New York: Bantam Books; 1977. pp. 86–91.19 Rosner BA, Appel LJ, Raczynski JM, Herbert PR, Whelton PK, Murphy JK,
et al. A comparison of two automated monitors in the measurement of bloodpressure reactivity. Trials of Hypertension Prevention Collaborative Group.Ann Epidemiol 1990; 1:57–69.
20 Whincup PH, Bruce NG, Cook DG, Shaper AG. The Dinamap 1846 SXautomated blood pressure recorder:comparison with the Hawksley randomzero sphygmomanometer under field conditions. J Epidemiol CommunityHealth 1992; 46:164–169.
21 Lukaski HC. Estimation of muscle mass. In: Roche AF, Heymsfield SB,Lohman TG, editors. Human body composition. Champaign, Illinois:Human Kinetics; 1996. pp. 109–128.
22 Whelton SP, Chin A, Xin X, He J. Effect of aerobic exercise on bloodpressure: a meta-analysis of randomized, controlled trials. Ann Int Med2002; 136:493–503.
23 Astrand PO, Ekblom B, Messin R, Saltin B, Stenberg J. Intraarterial bloodpressure during exercise with different muscle groups. J Appl Physiol1965; 20:253–256.
24 Stenberg J, Astrand PO, Ekblom B, Royce J, Saltin B. Hemodynamicresponse to work with different muscle groups, sitting and supine. J ApplPhysiol 1967; 22:61–70.
25 Greenleaf JE. Physiological responses to prolonged bed rest and fluidimmersion in adults. J Appl Physiol Respir Environ Exercise Physiol 1984;57:619–633.
26 Convertino VA, Tatro DL, Rogan RB. Renal and cardiovascular responsesto water immersion in trained runners and swimmers. Eur J Appl Physiol1993; 67:507–512.
27 Meredith IT, Friberg P, Jennings GL, Dewar EM, Fazio VA, Lambert GW,Esler MD. Exercise training lowers resting renal but not cardiac sympatheticactivity in humans. Hypertension 1991; 18:575–582.
28 Nelson L, Jennings GL, Esler MD, Korner PI. Effect of changing levels ofphysical activity on blood pressure and haemodynamics in essentialhypertension. Lancet 1986; ii:473–476.
29 Martin WH III, Montgomery J, Snell PG, Corbett JR, Sokolov JJ, Buckey JC,et al. Cardiovascular adaptations to intense swim training in sedentarymiddle-aged men and women. Circulation 1987; 75:323–330.
30 Tanasescu M, Leitzmann MF, Rimm EB, Willett WC, Stampfer MJ, Hu FB.Exercise type and intensity in relation to coronary heart disease in men.JAMA 2002; 288:1994–2000.
31 Foyer M, Sjoberg I, Ersson U. The use of the pool in rehabilitation. In:Eriksson B, Furberg B, editors. Swimming medicine IV. Baltimore MD:University Park Press; 1978. pp. 59–61.
opyright © Lippincott Williams & Wilkins. Unauthorized reproduction of this article is prohibited.
Top Related
Copyright © 2022 FDOKUMEN

