


Bahasa
Halaman
Hukum

Biofilm Structure and Function and Possible Implicationsfor Riverine DOC Dynamics
A.M. Romanı1, H. Guasch1, I. Munoz2, J. Ruana3, E. Vilalta2, T. Schwartz4, F. Emtiazi4 andS. Sabater1
(1) Inst. Ecologia Aquatica and Dep. Ciencies Ambientals, Universitat de Girona, Campus de Montilivi, 17071 Girona, Spain(2) Dep. Ecologia, Fac. Biologia, Universitat de Barcelona, Avgda. Diagonal 645, 08028 Barcelona, Spain(3) Consorci d’Aigues de Tarragona, Ctra N340 pKm 1094, l’Ampolla, Tarragona, Spain(4) Department of Environmental Microbiology, ITC-WGT, Forschungszentrum Karlsruhe GmbH, P.O. Box 3640, 76021 Karlsruhe, Germany
Received: 10 March 2003 / Accepted: 29 July 2003 / Online publication: 23 December 2003
Abstract
Biofilms are major sites of carbon cycling in streams andrivers. Here we elucidate the relationship between biofilmstructure and function and river DOC dynamics. Me-tabolism (extracellular enzymatic activity) and structure(algae, bacteria, C/N content) of light-grown (in an openchannel) and dark-grown (in a dark pipe) biofilms werestudied over a year, and variations in dissolved organiccarbon (DOC) and biodegradable DOC (BDOC) werealso recorded. A laboratory experiment on 14C-glucoseuptake and DOC dynamics was also performed by in-cubating natural biofilms in microcosms. On the basis ofour field (annual DOC budget) and laboratory results, weconclude that light-grown biofilm is, on annual average, anet DOC consumer. This biofilm showed a high monthlyvariability in DOC uptake/release rates, but, on average,the annual uptake rate was greater than that of the dark-grown biofilm. The higher algal biomass and greaterstructure of the light-grown biofilm may enhance thedevelopment of the bacterial community (bacterial bio-mass and activity) and microbial heterotrophic activity.In addition, the light-grown biofilm may promote abioticadsorption because of the development of a polysaccha-ride matrix. In contrast, the dark-grown biofilm is highlydependent on the amount and quality of organic matterthat enters the system and is more efficient in the uptakeof labile molecules (higher 14C-glucose uptake rate permgC). The positive relationships between the extracel-lular enzymatic activity of biofilm and DOC and BDOCcontent in flowing water indicate that biofilm metabo-lism contributes to DOC dynamics in fluvial systems.Our results show that short-term fluvial DOC dynamics
is mainly due to the use and recycling of the more labilemolecules. At the river ecosystem level, the potentialsurface area for biofilm formation and the quantity andquality of available organic carbon might determine theeffects of biofilm function on DOC dynamics.
Introduction
Dissolved organic matter (DOM) comprises most of thereduced C in streams and rivers [48] and is removedfrom or added to water through biotic and abioticpathways [35]. The microorganisms in the water columnor within attached biofilms in the river feed on organicmatter transported by the water [23]. The uptake rate oforganic compounds is heavily related to their lability, andmicroorganisms show a faster and preferential use of themost labile and fresh molecules [5, 32]. Bacterial utili-zation of DOM is determined by its size and diageneticstate [1]. However, the availability of dissolved organiccarbon (DOC) for the epilithic bacterial community maybe more dependent on the composition of organiccompounds rather than molecular weight [12]. Bio-availability of DOC for bacteria in fluvial ecosystems isrelated to variations in the composition of DOC (H/C,O/C ratios [27]). However, a large part of DOC thatenters the system is made up of humic substances andpolymeric molecules [48], which require extracellularenzyme activity for heterotrophic uptake [6]. It has beensuggested that, in fluvial ecosystems, labile compoundsare quickly recycled, mainly within the benthic biofilm,while more refractory substances may be transportedfurther before uptake [21].
In river ecosystems, the benthic community proc-esses organic matter [26, 30]. Surfaces of the streambedare covered by structured autotrophic–heterotrophic as-Correspondence to: A.M. Romanı; E-mail: [email protected]
316 DOI: 10.1007/s00248-003-2019-2 d Volume 47, 316–328 (2004) d � Springer-Verlag New York, LLC 2003
semblages embedded within polysaccharidic material,thereby forming a biofilm [24]. These biofilms are majorsites for the uptake and storage of fluvial DOC [3, 19]and contribute significantly to C cycling in rivers andstreams. Epilithic microbial communities feed on allo-chthonous and/or autochthonous organic matter.
Carbon cycling also occurs within the biofilm [49].The close contact between the algal and the heterotrophiccommunity in attached biofilms favors the use of algalmaterial by microorganisms within the biofilm [16, 31].Algal accumulation and activity enhance the hetero-trophic community’s use of organic matter by increasingthe amount of substrate available for bacteria [8, 38].Labile DOC in flowing water could be the primary con-trol factor of epilithic bacteria, while epilithic algae couldstimulate bacterial growth in later phases [43]. The re-lease of photosynthetically produced organic C and itsuse by bacteria in the microphytobenthos has also beenobserved in sediment [15].
Although a few studies have examined biofilm DOCuptake rates in rivers either in situ or by laboratory ex-periments [11, 19, 23], little information is available onthe effect of biofilm structure and metabolism on uptake.Here we elucidate whether biofilms act as sinks or sourcesof fluvial DOC, depending on their structure and bio-mass accumulation. In particular, we hypothesized that(i) light-grown biofilms have a low DOC consumptionrate because of high internal recycling (high-quality algal-released DOC available for heterotrophs within the bio-film); (ii) dark grown biofilms are net consumers ofDOC; and (iii) the DOC budget is affected not only bycommunity composition (algae, bacteria, microfauna)but also by the structural components of the biofilm (Cand N content), which may directly affect DOC recycling.To contrast these hypotheses, a field study was performedalong an open channel and also a dark pipe directly de-rived from the river. Whereas the former was subjected tolight irradiation, thereby providing the conditions for thedevelopment of autotrophic organisms, the dark pipeallowed growth of only heterotrophic organisms. The useof these two systems allowed us to circumscribe the effectof DOC transport and storage in the water mass and thebiofilm, and we avoided the influence of the hyporheiczone and groundwater.
Methodology
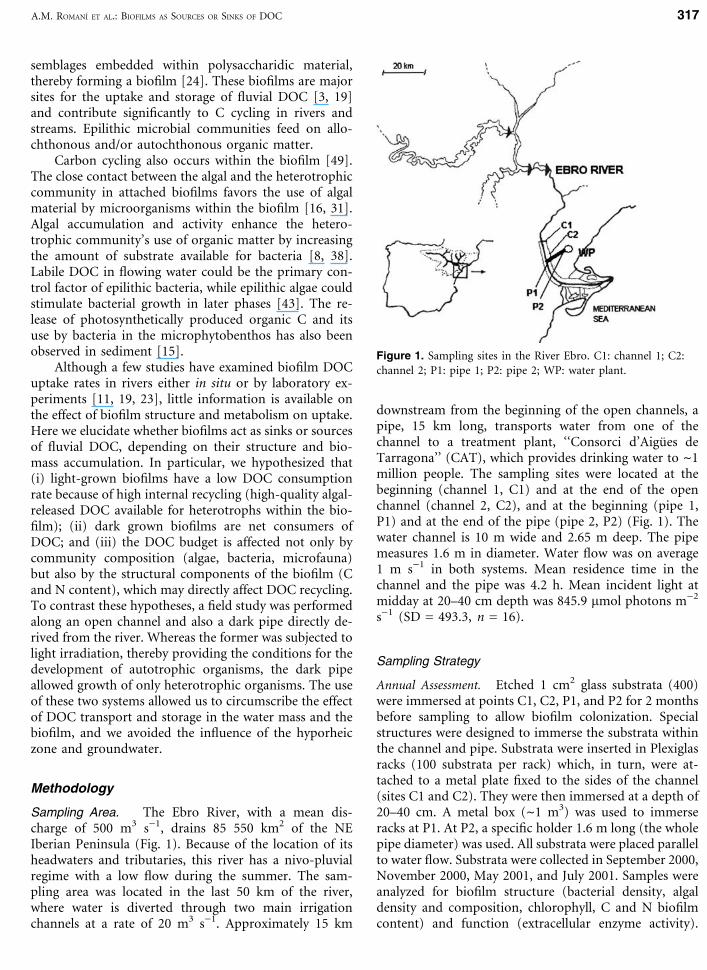
Sampling Area. The Ebro River, with a mean dis-charge of 500 m3 s)1, drains 85 550 km2 of the NEIberian Peninsula (Fig. 1). Because of the location of itsheadwaters and tributaries, this river has a nivo-pluvialregime with a low flow during the summer. The sam-pling area was located in the last 50 km of the river,where water is diverted through two main irrigationchannels at a rate of 20 m3 s)1. Approximately 15 km
downstream from the beginning of the open channels, apipe, 15 km long, transports water from one of thechannel to a treatment plant, ‘‘Consorci d’Aigues deTarragona’’ (CAT), which provides drinking water to ~1million people. The sampling sites were located at thebeginning (channel 1, C1) and at the end of the openchannel (channel 2, C2), and at the beginning (pipe 1,P1) and at the end of the pipe (pipe 2, P2) (Fig. 1). Thewater channel is 10 m wide and 2.65 m deep. The pipemeasures 1.6 m in diameter. Water flow was on average1 m s)1 in both systems. Mean residence time in thechannel and the pipe was 4.2 h. Mean incident light atmidday at 20–40 cm depth was 845.9 lmol photons m)2
s)1 (SD = 493.3, n = 16).
Sampling Strategy
Annual Assessment. Etched 1 cm2 glass substrata (400)were immersed at points C1, C2, P1, and P2 for 2 monthsbefore sampling to allow biofilm colonization. Specialstructures were designed to immerse the substrata withinthe channel and pipe. Substrata were inserted in Plexiglasracks (100 substrata per rack) which, in turn, were at-tached to a metal plate fixed to the sides of the channel(sites C1 and C2). They were then immersed at a depth of20–40 cm. A metal box (~1 m3) was used to immerseracks at P1. At P2, a specific holder 1.6 m long (the wholepipe diameter) was used. All substrata were placed parallelto water flow. Substrata were collected in September 2000,November 2000, May 2001, and July 2001. Samples wereanalyzed for biofilm structure (bacterial density, algaldensity and composition, chlorophyll, C and N biofilmcontent) and function (extracellular enzyme activity).
Figure 1. Sampling sites in the River Ebro. C1: channel 1; C2:channel 2; P1: pipe 1; P2: pipe 2; WP: water plant.
A.M. ROMANI ET AL.: BIOFILMS AS SOURCES OR SINKS OF DOC 317
Water samples were collected monthly from September2000 to November 2001 to analyze physical and chemicalparameters, DOC and biodegradable DOC (BDOC).
In November 2001 and April 2002 water samplesfrom C2 and P2 were also collected for the analysis ofpotential extracellular enzyme activity and algal densityin water.
Experimental Approach. In April 2002, glass substratawere collected from C2 and P2. These samples were takendirectly to the laboratory to measure 14C-glucose uptakeand DOC uptake and/or release rates in microcosm incu-bations. Samples were also analyzed for biofilm structureand function. Furthermore, denaturing gradient gel elect-rophoresis (DGGE) analysis was performed. Water sam-ples from the four sampling sites were also collected foranalysis of DOC, BDOC, and physical and chemicalparameters.
Physical and Chemical Parameters. Water sam-ples from the four sampling sites were analyzed monthlyfor conductivity, pH, ammonium, nitrite, nitrate, dis-solved inorganic phosphorus, and carbonates, followingstandard methods [2]. DOC was measured using a totalorganic carbon analyzer (TOC-5000, Shimadzu). Par-ticulate organic carbon (POC) was measured at threesampling times (in triplicate) by filtering 1 L of water onprecombusted and preweighed filters (Whatman GF/F).The filters were dried (48 h at 110�C) and combusted(4 h at 450�C). The ash-free dry weight was calculatedand transformed to organic C by the constant 2.4 [25].
BDOC was measured following the procedure de-scribed by Servais et al. [42]. Once taken, samples (fivereplicates for each sampling site) were incubated imme-diately for 28 days at room temperature (20–24�C) and inthe dark. The glass flasks and ampoules used were pre-viously heated for 4 h at 550�C to prevent the release oforganic C. All DOC samples were fixed with sodiumazide (2.7 mM) and preserved at 4�C until analysis.
Biofilm Structure
Bacterial Density. Bacterial density was estimated intriplicate after sonication (90 s, 40 W power, 40 kHzfrequency). After appropriate dilution, fixed sampleswere stained for 5 min with DAPI (4,6-diamidino-2-phenylindole; 2 lg mL)1 final concentration) and passedthrough 0.2 lm irgalan black-stained polycarbonate fil-ters (Nuclepore). Bacteria were then counted under afluorescence microscope (Nikon) at 1250· magnification[36]. Fifteen fields were counted per filter for a total of400–800 organisms.
Chlorophyll Density. Chlorophyll density on theglass substrata (three replicates for each sampling site)was measured after extraction in 90% acetone and so-
nication (4 min). A second and third extraction wasnecessary in some biofilms until all chlorophyll had beenextracted. Chlorophyll concentration was measuredspectrophotometrically (PerkinElmer, Lambda UV/VISspectrophotometer) after filtration (Whatman GF/F) ofthe extract, following the method described by Jeffrey andHumphrey [17]. The ratio of chlorophyll to carotenoidsand/or chlorophyll degradation products (OD430/OD665, [25]) was also calculated.
Algal Composition and Abundance. Glass substrata(three replicates for each sampling site) were fixed withformalin to study algal composition and abundance.Substrata were sonicated (3 min) to extract all algae fromthe biofilm, and samples were then observed under a lightmicroscope.
C and N Biofilm Content. Five mL of distilled waterwas added to the glass substrata, which were then soni-cated (4 min) and scraped with a spatula. The extract wasthen filtered (precombusted filters Whatman GF/F).Successive extractions (2–3) were performed to ensuretotal extraction of the colonized biofilm. Filters weredried (2 days at 110�C) and analyzed for C and N with a1500 Carlo Erba C/N Analyzer using vanadium pentoxideas the oxidation catalyzer.
Denaturing Gradient Gel Electrophoresis (DGGE).Samples from C2 and P2 (five replicates) collected inApril 2002 were analyzed by DGGE. Universal PCRprimers, GC27F and 517R, which target the regions (V1-3) of 16S rDNA gene of Eubacteria were used for am-plification [22, 29]. A ‘‘touch-down’’ PCR program de-signed by Kilb et al. [22] was run with 10 lL of thebiofilm suspension as target. DGGE analysis of the PCRproducts (~527 bp) by means of the D Code System(Bio-Rad Laboratories GmbH, Germany) was performedusing gels with a gradient of 40 to 70% denaturant(formamide, urea). The DNA bands in the gels weresubsequently stained with SYBR Green I (MolecularProbes). Pairwise community similarities were quantifiedusing the Sørenson index [29].
Extracellular Enzyme Activity. The extracellularenzymes lipase (EC 3.1.1.3), leucine-aminopeptidase (EC3.4.11.1), b-glucosidase (EC 3.2.1.21), b-xylosidase (EC3.2.1.37), and phosphatase (EC 3.1.3.1-2) were measuredusing fluorescent-linked substrates (methylumbelliferyl,MUF, but aminomethylcoumarin, AMC, for the pepti-dase). Immediately after sampling, glass substrata wereincubated at river temperature for 1 h in the dark in ashaking bath. Incubations were performed at a range ofsubstrate concentrations—0.1, 10, 300, and 600 lM—inorder to calculate saturation curves. Blanks and standardsof MUF and AMC (0–100 lM) were also incubated. At
318 A.M. ROMANI ET AL.: BIOFILMS AS SOURCES OR SINKS OF DOC
the end of the incubation, glycine buffer at pH 10.4 wasadded (1/1, v/v) and fluorescence was measured at 365/455 nm excitation/emission for MUF and 364/445 nmexcitation/emission for AMC (Kontron, SFM25). Allsubstrata and standards were prepared with filter-steri-lized river water (0.2-lm pore-size cellulose nitratemembrane filters). Enzymatic kinetic parameters, Vmax
(maximal reaction velocity), and Km (apparent Michaelisconstant), were calculated by nonlinear regression anal-ysis [40]. The turnover time (Km/Vmax ratio) was alsocalculated after transformation of the parameters to thesame units. Potential enzymatic activity in the water wasmeasured in a similar way by incubating 10 mL of waterwith 100 lL of concentrated artificial substrate to a finalconcentration of 600 lM.
14C-Glucose Assimilation and DOC Dynamics.
The uptake of 14C-g1ucose and DOC uptake or releaserates by the biofilms from C2 and P2 were measured byincubation of colonized glass substrata in microcosms atthe same temperature as found in the field (16.5�C). Eachmicrocosm consisted of a glass jar (19 cm in diameter, 9cm high) and 18 colonized glass substrata attached to thebottom by a plastic rod. Water (1.5 L) from the corre-sponding sampling site was continuously recirculatedwith a pump at a current of 0.3 m s)1 on average. Tomeasure 14C-glucose uptake, four microcosms plus acontrol were studied for each sampling site. The controlmicrocosm contained uncolonized glass substrata and0.2-lm filtered river water. For each microcosm, 5 lCi (1ml) of 14C-glucose (specific activity 303 mCi mmol)1,PerkinElmer) was added to a final concentration of 3.3lCi L)1. Similar 14C-glucose concentrations were usedfor incubations of epilithic and wood biofilms [34, 44].Three replicate water samples (1 ml) were taken fromeach microcosm at 0, 15, 30, 45, 60, 90, and 120 min. 15ml of scintillation liquid (Biogreen 1, Scharlau) was thenadded to each sample. At the end of the experiment, threeglass substrata were collected from each microcosm tomeasure 14C-glucose uptake by the biofilm. Each sub-
strate was gently rinsed with distilled water, sonicated for2–3 min (with 5 mL of distilled water), and then 15 mLof scintillation liquid was added. 14C-Glucose abioticadsorption was measured by using the glass substrataincubated in the control microcosm. Radioactivity wasmeasured in a Packard Tri-Carb 1500 liquid scintillationanalyzer (3 min per vial).
In a separate experiment, DOC uptake or releaserates by the biofilms in the channel and pipe were testedby incubating colonized glass substrata in microcosms(same design as above) and changes in DOC and BDOCconcentrations were recorded. Samples for DOC analyses(two 15-mL replicates) were taken at 0, 1, 2, 4, 6, and 8 h.They were collected with a syringe, filtered with pre-combusted Whatman GF/F filters, and preserved withsodium azide (2.7 mM) in the refrigerator until analysis.For the pipe biofilms, four microcosms (colonized bio-film plus water: P-BW) and two water controls (micro-cosms with pipe water and uncolonized glass substrata:P-WC) were considered. Incubation was performed indark conditions (wrapped in aluminium foil). For thechannel biofilms, light and dark conditions were simu-lated. Four microcosms (CD-BW) and two water con-trols (CD-WC) were incubated in the dark, and fourmicrocosms (CL-BW) and two water controls (CL-WC)in the light (under artificial light, providing incident lightof 180 lmol photons m)2 s)1). A blank microcosm withuncolonized glass substrata and 0.2 lm filtered water wasalso analyzed. At the beginning of the experiment, weanalyzed the DOC and BDOC concentrations of the foursampling points. At the end, the BDOC content of eachmicrocosm (two replicates) was measured.
Statistical Analyses. The differences in the phys-ical and chemical parameters among C1, C2, P1, and P2were analyzed by t-test for paired values. For the com-parison of DOC and BDOC between C1 and C2, and P1and P2, from the same sampling time, a two-tailed t-testwas used. The Pearson correlation coefficient was calcu-lated for the physical and chemical parameters in the four
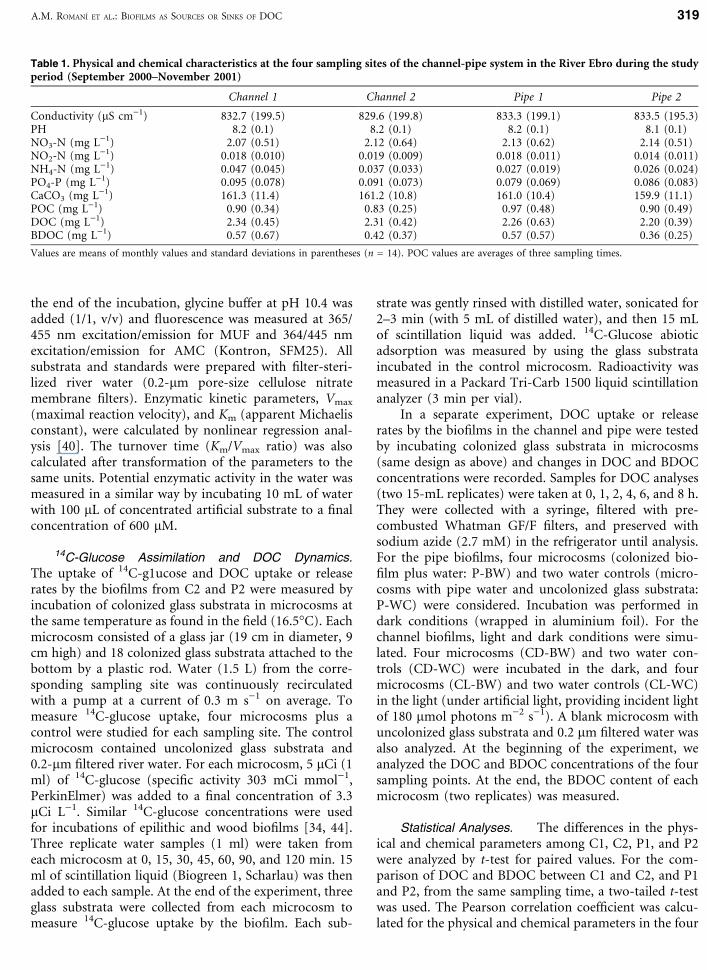
Table 1. Physical and chemical characteristics at the four sampling sites of the channel-pipe system in the River Ebro during the studyperiod (September 2000–November 2001)
Channel 1 Channel 2 Pipe 1 Pipe 2
Conductivity (lS cm)1) 832.7 (199.5) 829.6 (199.8) 833.3 (199.1) 833.5 (195.3)PH 8.2 (0.1) 8.2 (0.1) 8.2 (0.1) 8.1 (0.1)NO3-N (mg L)1) 2.07 (0.51) 2.12 (0.64) 2.13 (0.62) 2.14 (0.51)NO2-N (mg L)1) 0.018 (0.010) 0.019 (0.009) 0.018 (0.011) 0.014 (0.011)NH4-N (mg L)1) 0.047 (0.045) 0.037 (0.033) 0.027 (0.019) 0.026 (0.024)PO4-P (mg L)1) 0.095 (0.078) 0.091 (0.073) 0.079 (0.069) 0.086 (0.083)CaCO3 (mg L)1) 161.3 (11.4) 161.2 (10.8) 161.0 (10.4) 159.9 (11.1)POC (mg L)1) 0.90 (0.34) 0.83 (0.25) 0.97 (0.48) 0.90 (0.49)DOC (mg L)1) 2.34 (0.45) 2.31 (0.42) 2.26 (0.63) 2.20 (0.39)BDOC (mg L)1) 0.57 (0.67) 0.42 (0.37) 0.57 (0.57) 0.36 (0.25)
Values are means of monthly values and standard deviations in parentheses (n = 14). POC values are averages of three sampling times.
A.M. ROMANI ET AL.: BIOFILMS AS SOURCES OR SINKS OF DOC 319
sampling sites and also for extracellular enzyme activityand turnover times. Differences in extracellular enzy-matic activity between sites were analyzed by one-wayanalysis of variance followed by a Tukey’s multiplecomparison test for each activity.
Analyses of variance (ANOVA) were performed forthe DOC and BDOC variations in the microcosms after 8h of incubation.
River DOC Budget. The DOC and BDOC uptakeor release rates of the channel and pipe were calculated bymeans of the DOC and BDOC balance between sites C1and C2, and P1 and P2, respectively, at the samplingtimes when differences between sites were significant. TheDOC and BDOC balance was transformed to lg cm)2
h)1 by knowing the total water volume and surface areapotentially covered by biofilm in each system (357,750m3 and 204,900 m2 for the channel, 30,159 m3 and 75,398m2 for the pipe), and the travel time of certain water
parcel from C1 to C2 and P1 to P2, respectively. Meanannual uptake or release rates were calculated frommonthly results (November 2000–October 2001), and avalue of zero was assigned when nonsignificant differ-ences were obtained between sampling sites.
Results
Physical, Chemical, and Biological Parameters of the
Flowing Water. The Ebro River water has a high nu-trient content, especially for dissolved N (Table 1). Meanwater pH is 8.2 and temperatures range between 8.9�C inwinter and 25�C in summer (annual mean 18.1, SD 5.7).The chemical characteristics of the river water (exceptBDOC) showed no significant differences between thefour sampling points (t-test, P > 0.2).
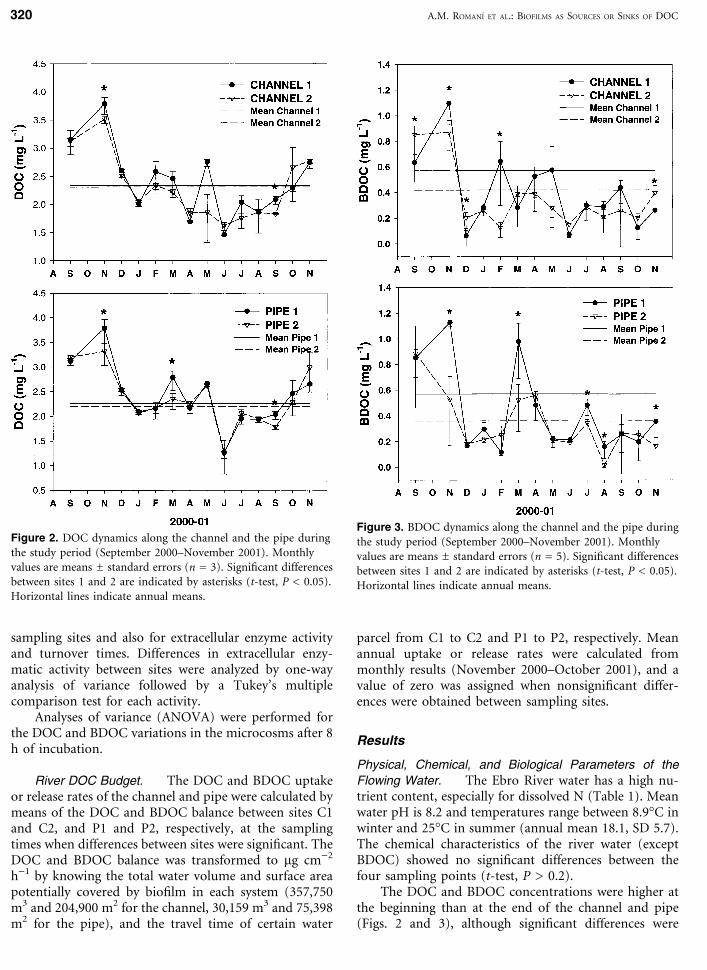
The DOC and BDOC concentrations were higher atthe beginning than at the end of the channel and pipe(Figs. 2 and 3), although significant differences were
Figure 2. DOC dynamics along the channel and the pipe duringthe study period (September 2000–November 2001). Monthlyvalues are means ± standard errors (n = 3). Significant differencesbetween sites 1 and 2 are indicated by asterisks (t-test, P < 0.05).Horizontal lines indicate annual means.
Figure 3. BDOC dynamics along the channel and the pipe duringthe study period (September 2000–November 2001). Monthlyvalues are means ± standard errors (n = 5). Significant differencesbetween sites 1 and 2 are indicated by asterisks (t-test, P < 0.05).Horizontal lines indicate annual means.
320 A.M. ROMANI ET AL.: BIOFILMS AS SOURCES OR SINKS OF DOC
found only for BDOC in the latter (t-test, P = 0.05, Fig.3). Monthly results for DOC and BDOC showed signif-icant differences between C1 and C2, and between P1 andP2 on several occasions (Figs. 2 and 3). The productionof BDOC along the channel was observed in Septemberand December 2000 and in November 2001, and con-sumption was observed in November 2000 and February2001 (Fig. 3). Significant consumption of BDOC at fivesampling times along the pipe was observed (Fig. 3).
Forty percent of the total cell density in the watercolumn samples corresponded to cells of benthic origin.Algal cell densities in the samples from the channel andpipe ranged from 127 to 494 cell mL)1 and from 67 to154 cell mL)1, respectively. Extracellular enzymatic ac-tivity measured in the water column was clearly higher inApril 2002 than in November 2001. Respectively for thetwo periods, b-glucosidase and b-xylosidase activitiesranged between 0.95 and 36.56 nmol L)1 h)1, phospha-tase between 31.1 and 232.5 nmol L)1 h)1, peptidasebetween 1619 and 8194 nmol L)1 h)1, and lipase between0.77 and 19.81 nmol L)1 h)1. For most enzymatic ac-tivities, the pipe samples showed lower activity than thosefrom the channel.
Biofilm Structure. The biofilms in C1 and C2 werecharacterized by a high C and N content (C/N ratio of14.1, Table 2). The chlorophyll content did not signifi-cantly differ between these two sites (t-test, P = 0.17),reaching 2.9 lg cm)2 in autumn–winter and 7.1 lg cm)2
in spring–summer. The biofilms were mainly composedof benthic cyanobacteria (especially in autumn–winter),and diatoms and green algae (especially in spring–sum-mer). Some of the taxa were of planktonic origin. Bac-terial density ranged between 0.21 and 1.84 · 107 cellcm)2, values being significantly higher in C1 than in C2(t-test, P = 0.02).
Although the biofilms at P1 and P2 had a signifi-cantly lower C content than C1 and C2, they showed asimilar N content, which resulted in a lower C/N ratio,especially for the P2 samples (Table 2). Chlorophyll andalgal density was very low and had a high OD430/OD665ratio. A few diatoms and green algae, mainly planktonic,were detected in the pipe biofilm. Bacterial cell densitywas on average 0.29 · 107 cm)2 (differences between P1
and P2 were not significant, t-test, P = 0.52), and sig-nificantly lower than C1 and C2 (t-test, P = 0.02). Cili-ates, fungi, and nematodes were observed in P1 and P2.
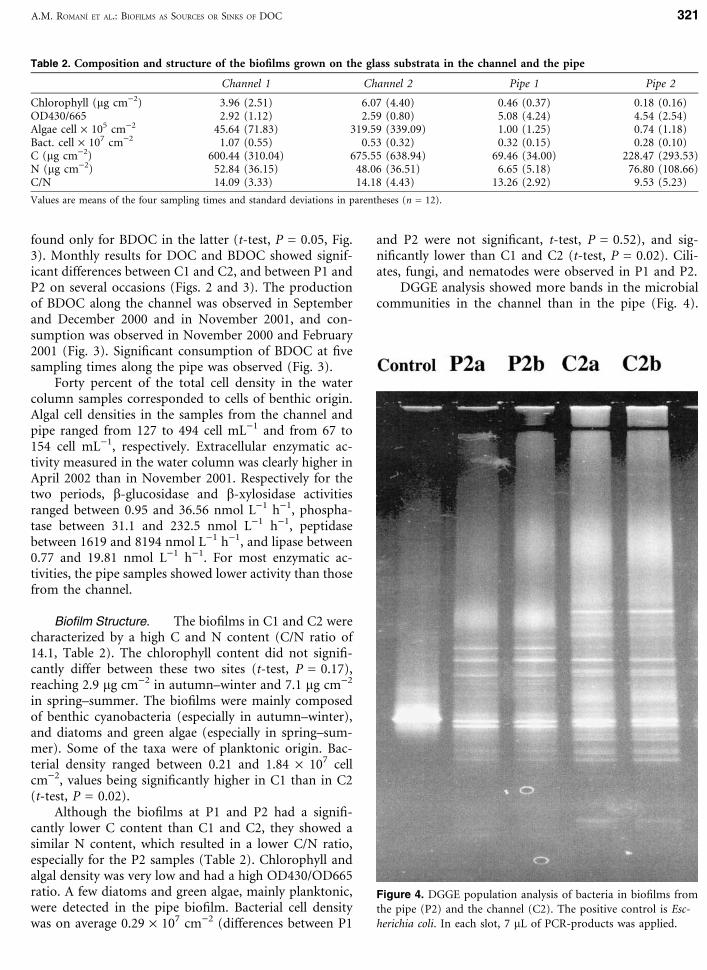
DGGE analysis showed more bands in the microbialcommunities in the channel than in the pipe (Fig. 4).
Table 2. Composition and structure of the biofilms grown on the glass substrata in the channel and the pipe
Channel 1 Channel 2 Pipe 1 Pipe 2
Chlorophyll (lg cm)2) 3.96 (2.51) 6.07 (4.40) 0.46 (0.37) 0.18 (0.16)OD430/665 2.92 (1.12) 2.59 (0.80) 5.08 (4.24) 4.54 (2.54)Algae cell · 105 cm)2 45.64 (71.83) 319.59 (339.09) 1.00 (1.25) 0.74 (1.18)Bact. cell · 107 cm)2 1.07 (0.55) 0.53 (0.32) 0.32 (0.15) 0.28 (0.10)C (lg cm)2) 600.44 (310.04) 675.55 (638.94) 69.46 (34.00) 228.47 (293.53)N (lg cm)2) 52.84 (36.15) 48.06 (36.51) 6.65 (5.18) 76.80 (108.66)C/N 14.09 (3.33) 14.18 (4.43) 13.26 (2.92) 9.53 (5.23)
Values are means of the four sampling times and standard deviations in parentheses (n = 12).
Figure 4. DGGE population analysis of bacteria in biofilms fromthe pipe (P2) and the channel (C2). The positive control is Esc-herichia coli. In each slot, 7 lL of PCR-products was applied.
A.M. ROMANI ET AL.: BIOFILMS AS SOURCES OR SINKS OF DOC 321
Comparison between the bands of the two systems re-sulted in similarity index of 0.56. Similarity betweenreplicates was ~0.96–1.
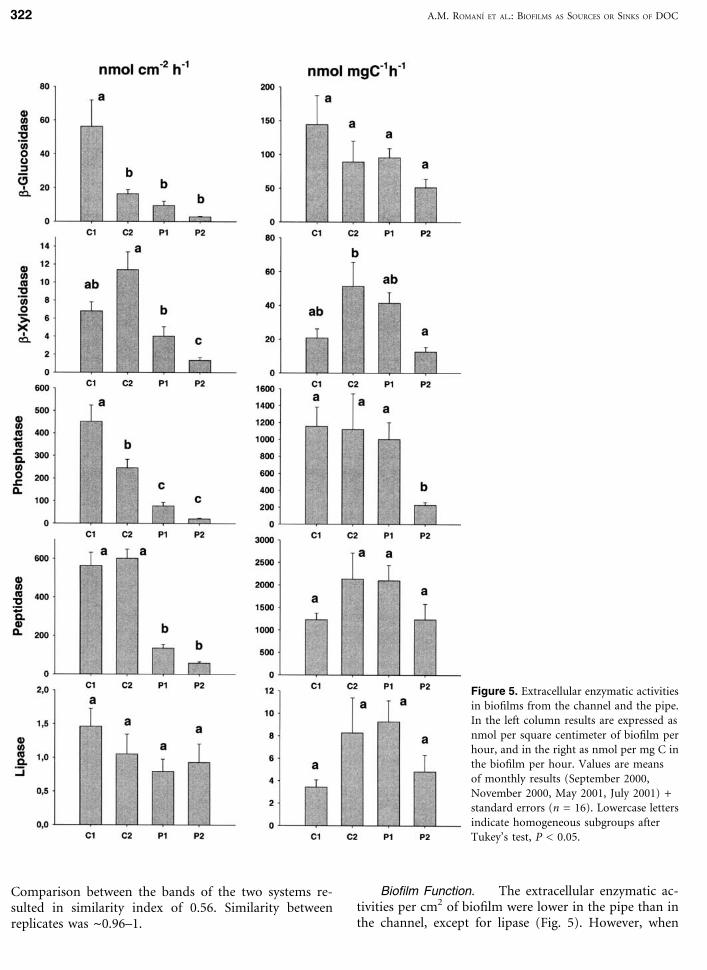
Biofilm Function. The extracellular enzymatic ac-tivities per cm2 of biofilm were lower in the pipe than inthe channel, except for lipase (Fig. 5). However, when
Figure 5. Extracellular enzymatic activitiesin biofilms from the channel and the pipe.In the left column results are expressed asnmol per square centimeter of biofilm perhour, and in the right as nmol per mg C inthe biofilm per hour. Values are meansof monthly results (September 2000,November 2000, May 2001, July 2001) +standard errors (n = 16). Lowercase lettersindicate homogeneous subgroups afterTukey’s test, P < 0.05.
322 A.M. ROMANI ET AL.: BIOFILMS AS SOURCES OR SINKS OF DOC
enzymatic activities were calculated per mg of C, differ-ences were less obvious. The ANOVA analysis and theTukey’s test indicated significant differences between sitesfor b-xylosidase and phosphatase (Fig. 5).
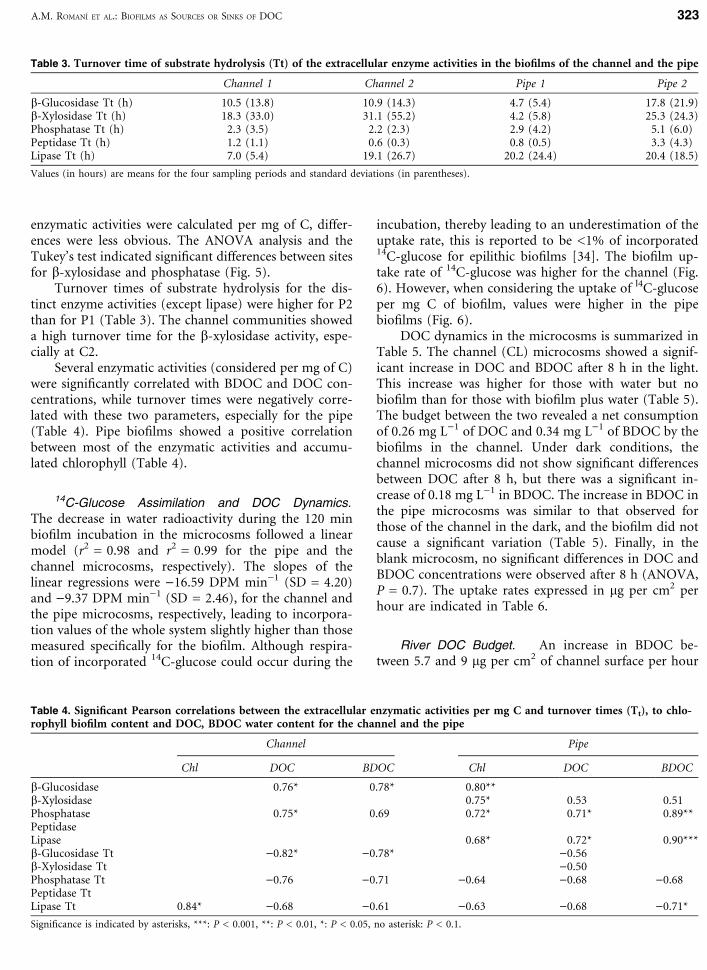
Turnover times of substrate hydrolysis for the dis-tinct enzyme activities (except lipase) were higher for P2than for P1 (Table 3). The channel communities showeda high turnover time for the b-xylosidase activity, espe-cially at C2.
Several enzymatic activities (considered per mg of C)were significantly correlated with BDOC and DOC con-centrations, while turnover times were negatively corre-lated with these two parameters, especially for the pipe(Table 4). Pipe biofilms showed a positive correlationbetween most of the enzymatic activities and accumu-lated chlorophyll (Table 4).
14C-Glucose Assimilation and DOC Dynamics.
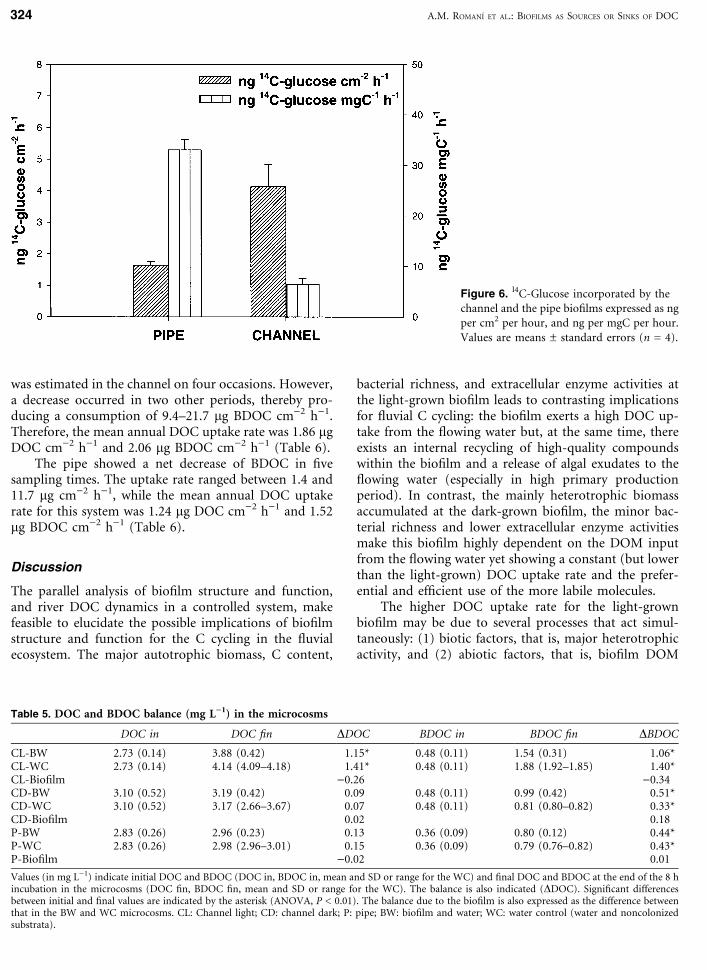
The decrease in water radioactivity during the 120 minbiofilm incubation in the microcosms followed a linearmodel (r2 = 0.98 and r2 = 0.99 for the pipe and thechannel microcosms, respectively). The slopes of thelinear regressions were )16.59 DPM min)1 (SD = 4.20)and )9.37 DPM min)1 (SD = 2.46), for the channel andthe pipe microcosms, respectively, leading to incorpora-tion values of the whole system slightly higher than thosemeasured specifically for the biofilm. Although respira-tion of incorporated 14C-glucose could occur during the
incubation, thereby leading to an underestimation of theuptake rate, this is reported to be <1% of incorporated14C-glucose for epilithic biofilms [34]. The biofilm up-take rate of 14C-glucose was higher for the channel (Fig.6). However, when considering the uptake of l4C-glucoseper mg C of biofilm, values were higher in the pipebiofilms (Fig. 6).
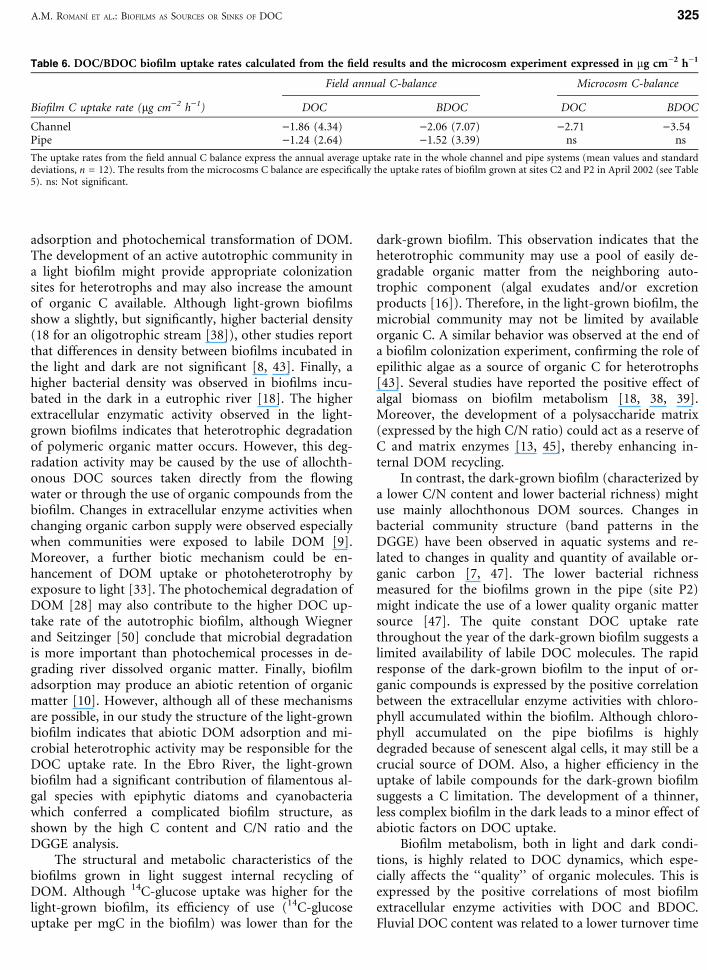
DOC dynamics in the microcosms is summarized inTable 5. The channel (CL) microcosms showed a signif-icant increase in DOC and BDOC after 8 h in the light.This increase was higher for those with water but nobiofilm than for those with biofilm plus water (Table 5).The budget between the two revealed a net consumptionof 0.26 mg L)1 of DOC and 0.34 mg L)1 of BDOC by thebiofilms in the channel. Under dark conditions, thechannel microcosms did not show significant differencesbetween DOC after 8 h, but there was a significant in-crease of 0.18 mg L)1 in BDOC. The increase in BDOC inthe pipe microcosms was similar to that observed forthose of the channel in the dark, and the biofilm did notcause a significant variation (Table 5). Finally, in theblank microcosm, no significant differences in DOC andBDOC concentrations were observed after 8 h (ANOVA,P = 0.7). The uptake rates expressed in lg per cm2 perhour are indicated in Table 6.
River DOC Budget. An increase in BDOC be-tween 5.7 and 9 lg per cm2 of channel surface per hour
Table 3. Turnover time of substrate hydrolysis (Tt) of the extracellular enzyme activities in the biofilms of the channel and the pipe
Channel 1 Channel 2 Pipe 1 Pipe 2
b-Glucosidase Tt (h) 10.5 (13.8) 10.9 (14.3) 4.7 (5.4) 17.8 (21.9)b-Xylosidase Tt (h) 18.3 (33.0) 31.1 (55.2) 4.2 (5.8) 25.3 (24.3)Phosphatase Tt (h) 2.3 (3.5) 2.2 (2.3) 2.9 (4.2) 5.1 (6.0)Peptidase Tt (h) 1.2 (1.1) 0.6 (0.3) 0.8 (0.5) 3.3 (4.3)Lipase Tt (h) 7.0 (5.4) 19.1 (26.7) 20.2 (24.4) 20.4 (18.5)
Values (in hours) are means for the four sampling periods and standard deviations (in parentheses).
Table 4. Significant Pearson correlations between the extracellular enzymatic activities per mg C and turnover times (Tt), to chlo-rophyll biofilm content and DOC, BDOC water content for the channel and the pipe
Channel Pipe
Chl DOC BDOC Chl DOC BDOC
b-Glucosidase 0.76* 0.78* 0.80**b-Xylosidase 0.75* 0.53 0.51Phosphatase 0.75* 0.69 0.72* 0.71* 0.89**PeptidaseLipase 0.68* 0.72* 0.90***b-Glucosidase Tt )0.82* )0.78* )0.56b-Xylosidase Tt )0.50Phosphatase Tt )0.76 )0.71 )0.64 )0.68 )0.68Peptidase TtLipase Tt 0.84* )0.68 )0.61 )0.63 )0.68 )0.71*
Significance is indicated by asterisks, ***: P < 0.001, **: P < 0.01, *: P < 0.05, no asterisk: P < 0.1.
A.M. ROMANI ET AL.: BIOFILMS AS SOURCES OR SINKS OF DOC 323
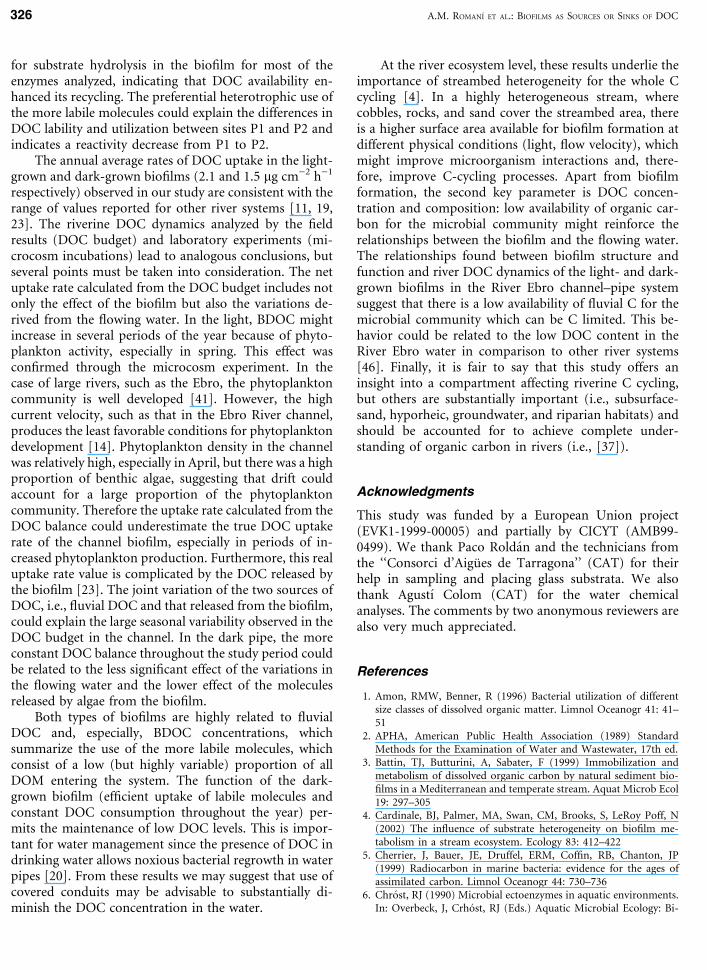
was estimated in the channel on four occasions. However,a decrease occurred in two other periods, thereby pro-ducing a consumption of 9.4–21.7 lg BDOC cm)2 h)1.Therefore, the mean annual DOC uptake rate was 1.86 lgDOC cm)2 h)1 and 2.06 lg BDOC cm)2 h)1 (Table 6).
The pipe showed a net decrease of BDOC in fivesampling times. The uptake rate ranged between 1.4 and11.7 lg cm)2 h)1, while the mean annual DOC uptakerate for this system was 1.24 lg DOC cm)2 h)1 and 1.52lg BDOC cm)2 h)1 (Table 6).
Discussion
The parallel analysis of biofilm structure and function,and river DOC dynamics in a controlled system, makefeasible to elucidate the possible implications of biofilmstructure and function for the C cycling in the fluvialecosystem. The major autotrophic biomass, C content,
bacterial richness, and extracellular enzyme activities atthe light-grown biofilm leads to contrasting implicationsfor fluvial C cycling: the biofilm exerts a high DOC up-take from the flowing water but, at the same time, thereexists an internal recycling of high-quality compoundswithin the biofilm and a release of algal exudates to theflowing water (especially in high primary productionperiod). In contrast, the mainly heterotrophic biomassaccumulated at the dark-grown biofilm, the minor bac-terial richness and lower extracellular enzyme activitiesmake this biofilm highly dependent on the DOM inputfrom the flowing water yet showing a constant (but lowerthan the light-grown) DOC uptake rate and the prefer-ential and efficient use of the more labile molecules.
The higher DOC uptake rate for the light-grownbiofilm may be due to several processes that act simul-taneously: (1) biotic factors, that is, major heterotrophicactivity, and (2) abiotic factors, that is, biofilm DOM
Figure 6. l4C-Glucose incorporated by thechannel and the pipe biofilms expressed as ngper cm2 per hour, and ng per mgC per hour.Values are means ± standard errors (n = 4).
Table 5. DOC and BDOC balance (mg L)1) in the microcosms
DOC in DOC fin DDOC BDOC in BDOC fin DBDOC
CL-BW 2.73 (0.14) 3.88 (0.42) 1.15* 0.48 (0.11) 1.54 (0.31) 1.06*CL-WC 2.73 (0.14) 4.14 (4.09–4.18) 1.41* 0.48 (0.11) 1.88 (1.92–1.85) 1.40*CL-Biofilm )0.26 )0.34CD-BW 3.10 (0.52) 3.19 (0.42) 0.09 0.48 (0.11) 0.99 (0.42) 0.51*CD-WC 3.10 (0.52) 3.17 (2.66–3.67) 0.07 0.48 (0.11) 0.81 (0.80–0.82) 0.33*CD-Biofilm 0.02 0.18P-BW 2.83 (0.26) 2.96 (0.23) 0.13 0.36 (0.09) 0.80 (0.12) 0.44*P-WC 2.83 (0.26) 2.98 (2.96–3.01) 0.15 0.36 (0.09) 0.79 (0.76–0.82) 0.43*P-Biofilm )0.02 0.01
Values (in mg L)1) indicate initial DOC and BDOC (DOC in, BDOC in, mean and SD or range for the WC) and final DOC and BDOC at the end of the 8 hincubation in the microcosms (DOC fin, BDOC fin, mean and SD or range for the WC). The balance is also indicated (DDOC). Significant differencesbetween initial and final values are indicated by the asterisk (ANOVA, P < 0.01). The balance due to the biofilm is also expressed as the difference betweenthat in the BW and WC microcosms. CL: Channel light; CD: channel dark; P: pipe; BW: biofilm and water; WC: water control (water and noncolonizedsubstrata).
324 A.M. ROMANI ET AL.: BIOFILMS AS SOURCES OR SINKS OF DOC
adsorption and photochemical transformation of DOM.The development of an active autotrophic community ina light biofilm might provide appropriate colonizationsites for heterotrophs and may also increase the amountof organic C available. Although light-grown biofilmsshow a slightly, but significantly, higher bacterial density(18 for an oligotrophic stream [38]), other studies reportthat differences in density between biofilms incubated inthe light and dark are not significant [8, 43]. Finally, ahigher bacterial density was observed in biofilms incu-bated in the dark in a eutrophic river [18]. The higherextracellular enzymatic activity observed in the light-grown biofilms indicates that heterotrophic degradationof polymeric organic matter occurs. However, this deg-radation activity may be caused by the use of allochth-onous DOC sources taken directly from the flowingwater or through the use of organic compounds from thebiofilm. Changes in extracellular enzyme activities whenchanging organic carbon supply were observed especiallywhen communities were exposed to labile DOM [9].Moreover, a further biotic mechanism could be en-hancement of DOM uptake or photoheterotrophy byexposure to light [33]. The photochemical degradation ofDOM [28] may also contribute to the higher DOC up-take rate of the autotrophic biofilm, although Wiegnerand Seitzinger [50] conclude that microbial degradationis more important than photochemical processes in de-grading river dissolved organic matter. Finally, biofilmadsorption may produce an abiotic retention of organicmatter [10]. However, although all of these mechanismsare possible, in our study the structure of the light-grownbiofilm indicates that abiotic DOM adsorption and mi-crobial heterotrophic activity may be responsible for theDOC uptake rate. In the Ebro River, the light-grownbiofilm had a significant contribution of filamentous al-gal species with epiphytic diatoms and cyanobacteriawhich conferred a complicated biofilm structure, asshown by the high C content and C/N ratio and theDGGE analysis.
The structural and metabolic characteristics of thebiofilms grown in light suggest internal recycling ofDOM. Although 14C-glucose uptake was higher for thelight-grown biofilm, its efficiency of use (14C-glucoseuptake per mgC in the biofilm) was lower than for the
dark-grown biofilm. This observation indicates that theheterotrophic community may use a pool of easily de-gradable organic matter from the neighboring auto-trophic component (algal exudates and/or excretionproducts [16]). Therefore, in the light-grown biofilm, themicrobial community may not be limited by availableorganic C. A similar behavior was observed at the end ofa biofilm colonization experiment, confirming the role ofepilithic algae as a source of organic C for heterotrophs[43]. Several studies have reported the positive effect ofalgal biomass on biofilm metabolism [18, 38, 39].Moreover, the development of a polysaccharide matrix(expressed by the high C/N ratio) could act as a reserve ofC and matrix enzymes [13, 45], thereby enhancing in-ternal DOM recycling.
In contrast, the dark-grown biofilm (characterized bya lower C/N content and lower bacterial richness) mightuse mainly allochthonous DOM sources. Changes inbacterial community structure (band patterns in theDGGE) have been observed in aquatic systems and re-lated to changes in quality and quantity of available or-ganic carbon [7, 47]. The lower bacterial richnessmeasured for the biofilms grown in the pipe (site P2)might indicate the use of a lower quality organic mattersource [47]. The quite constant DOC uptake ratethroughout the year of the dark-grown biofilm suggests alimited availability of labile DOC molecules. The rapidresponse of the dark-grown biofilm to the input of or-ganic compounds is expressed by the positive correlationbetween the extracellular enzyme activities with chloro-phyll accumulated within the biofilm. Although chloro-phyll accumulated on the pipe biofilms is highlydegraded because of senescent algal cells, it may still be acrucial source of DOM. Also, a higher efficiency in theuptake of labile compounds for the dark-grown biofilmsuggests a C limitation. The development of a thinner,less complex biofilm in the dark leads to a minor effect ofabiotic factors on DOC uptake.
Biofilm metabolism, both in light and dark condi-tions, is highly related to DOC dynamics, which espe-cially affects the ‘‘quality’’ of organic molecules. This isexpressed by the positive correlations of most biofilmextracellular enzyme activities with DOC and BDOC.Fluvial DOC content was related to a lower turnover time
Table 6. DOC/BDOC biofilm uptake rates calculated from the field results and the microcosm experiment expressed in lg cm)2 h)1
Field annual C-balance Microcosm C-balance
Biofilm C uptake rate (lg cm)2 h)1) DOC BDOC DOC BDOC
Channel )1.86 (4.34) )2.06 (7.07) )2.71 )3.54Pipe )1.24 (2.64) )1.52 (3.39) ns ns
The uptake rates from the field annual C balance express the annual average uptake rate in the whole channel and pipe systems (mean values and standarddeviations, n = 12). The results from the microcosms C balance are especifically the uptake rates of biofilm grown at sites C2 and P2 in April 2002 (see Table5). ns: Not significant.
A.M. ROMANI ET AL.: BIOFILMS AS SOURCES OR SINKS OF DOC 325
for substrate hydrolysis in the biofilm for most of theenzymes analyzed, indicating that DOC availability en-hanced its recycling. The preferential heterotrophic use ofthe more labile molecules could explain the differences inDOC lability and utilization between sites P1 and P2 andindicates a reactivity decrease from P1 to P2.
The annual average rates of DOC uptake in the light-grown and dark-grown biofilms (2.1 and 1.5 lg cm)2 h)1
respectively) observed in our study are consistent with therange of values reported for other river systems [11, 19,23]. The riverine DOC dynamics analyzed by the fieldresults (DOC budget) and laboratory experiments (mi-crocosm incubations) lead to analogous conclusions, butseveral points must be taken into consideration. The netuptake rate calculated from the DOC budget includes notonly the effect of the biofilm but also the variations de-rived from the flowing water. In the light, BDOC mightincrease in several periods of the year because of phyto-plankton activity, especially in spring. This effect wasconfirmed through the microcosm experiment. In thecase of large rivers, such as the Ebro, the phytoplanktoncommunity is well developed [41]. However, the highcurrent velocity, such as that in the Ebro River channel,produces the least favorable conditions for phytoplanktondevelopment [14]. Phytoplankton density in the channelwas relatively high, especially in April, but there was a highproportion of benthic algae, suggesting that drift couldaccount for a large proportion of the phytoplanktoncommunity. Therefore the uptake rate calculated from theDOC balance could underestimate the true DOC uptakerate of the channel biofilm, especially in periods of in-creased phytoplankton production. Furthermore, this realuptake rate value is complicated by the DOC released bythe biofilm [23]. The joint variation of the two sources ofDOC, i.e., fluvial DOC and that released from the biofilm,could explain the large seasonal variability observed in theDOC budget in the channel. In the dark pipe, the moreconstant DOC balance throughout the study period couldbe related to the less significant effect of the variations inthe flowing water and the lower effect of the moleculesreleased by algae from the biofilm.
Both types of biofilms are highly related to fluvialDOC and, especially, BDOC concentrations, whichsummarize the use of the more labile molecules, whichconsist of a low (but highly variable) proportion of allDOM entering the system. The function of the dark-grown biofilm (efficient uptake of labile molecules andconstant DOC consumption throughout the year) per-mits the maintenance of low DOC levels. This is impor-tant for water management since the presence of DOC indrinking water allows noxious bacterial regrowth in waterpipes [20]. From these results we may suggest that use ofcovered conduits may be advisable to substantially di-minish the DOC concentration in the water.
At the river ecosystem level, these results underlie theimportance of streambed heterogeneity for the whole Ccycling [4]. In a highly heterogeneous stream, wherecobbles, rocks, and sand cover the streambed area, thereis a higher surface area available for biofilm formation atdifferent physical conditions (light, flow velocity), whichmight improve microorganism interactions and, there-fore, improve C-cycling processes. Apart from biofilmformation, the second key parameter is DOC concen-tration and composition: low availability of organic car-bon for the microbial community might reinforce therelationships between the biofilm and the flowing water.The relationships found between biofilm structure andfunction and river DOC dynamics of the light- and dark-grown biofilms in the River Ebro channel–pipe systemsuggest that there is a low availability of fluvial C for themicrobial community which can be C limited. This be-havior could be related to the low DOC content in theRiver Ebro water in comparison to other river systems[46]. Finally, it is fair to say that this study offers aninsight into a compartment affecting riverine C cycling,but others are substantially important (i.e., subsurface-sand, hyporheic, groundwater, and riparian habitats) andshould be accounted for to achieve complete under-standing of organic carbon in rivers (i.e., [37]).
Acknowledgments
This study was funded by a European Union project(EVK1-1999-00005) and partially by CICYT (AMB99-0499). We thank Paco Roldan and the technicians fromthe ‘‘Consorci d’Aigues de Tarragona’’ (CAT) for theirhelp in sampling and placing glass substrata. We alsothank Agustı Colom (CAT) for the water chemicalanalyses. The comments by two anonymous reviewers arealso very much appreciated.
References
1. Amon, RMW, Benner, R (1996) Bacterial utilization of differentsize classes of dissolved organic matter. Limnol Oceanogr 41: 41–51
2. APHA, American Public Health Association (1989) StandardMethods for the Examination of Water and Wastewater, 17th ed.
3. Battin, TJ, Butturini, A, Sabater, F (1999) Immobilization andmetabolism of dissolved organic carbon by natural sediment bio-films in a Mediterranean and temperate stream. Aquat Microb Ecol19: 297–305
4. Cardinale, BJ, Palmer, MA, Swan, CM, Brooks, S, LeRoy Poff, N(2002) The influence of substrate heterogeneity on biofilm me-tabolism in a stream ecosystem. Ecology 83: 412–422
5. Cherrier, J, Bauer, JE, Druffel, ERM, Coffin, RB, Chanton, JP(1999) Radiocarbon in marine bacteria: evidence for the ages ofassimilated carbon. Limnol Oceanogr 44: 730–736
6. Chrost, RJ (1990) Microbial ectoenzymes in aquatic environments.In: Overbeck, J, Crhost, RJ (Eds.) Aquatic Microbial Ecology: Bi-
326 A.M. ROMANI ET AL.: BIOFILMS AS SOURCES OR SINKS OF DOC
ochemical and Molecular Approaches. Springer-Verlag, New York,pp 47–78
7. Eiler, A, Langenheder, S, Bertilsson, S, Tranvik, LJ (2003)Heterotrophic bacterial grown efficiency and community structureat different natural organic carbon concentrations. Appl EnvironMicrobiol 69: 3701–3709
8. Espeland, EM, Francoeur, SN, Wetzel, RG (2001) Influence of algalphotosynthesis on biofilm bacterial production and associatedglucosidase and xylosidase activities. Microb Ecol 42: 524–530
9. Findlay, SEG, Sinsabaugh, RL, Sobczak, WV, Hoostal, M (2003)Metabolic and structural response of hyporheic microbial com-munities to variations in supply of dissolved organic matter.Limnol Ocenogr 48: 1608–1617
10. Fischer, H (2002) The role of biofilms in the uptake and trans-formation of dissolved organic matter. In: Findlay, SEG, Sinsab-augh, RL (Eds.) Aquatic Ecosystems: Interactivity of DissolvedOrganic Matter. Academic Press, San Diego, pp 285–313
11. Fischer, H, Sachse, A, Steinberg, CEW, Pusch, M (2002) Differ-ential retention of dissolved organic carbon by bacteria in riversediments. Limnol Oceanogr 47: 1702–1711
12. Ford, TE, Lock, MA (1985) A temporal study of colloidal anddissolved organic carbon in rivers: apparent molecular weightspectra and their relationship to bacterial activity. Oikos 45: 71–78
13. Freeman, C, Lock, MA (1995) The biofilm polysaccharide matrix:A buffer against changing organic substrate supply? Limnol Oce-anogr 40: 273–278
14. Friedrich, G, Viehweg, M (1984) Recent developments of thephytoplankton and its activity in the Lower Rhine. Verh Int VerLimnol 22: 2029–2035
15. Goto, N, Mitamura, O, Hisayoshi, T (2001) Biodegradation ofphotosynthetically produced extracellular organic carbon fromintertidal benthic algae. J Exp Mar Biol Ecol 257: 73–86
16. Haack, TK, McFeters, GA (1982) Nutritional relationships amongmicroorganisms in an epilithic biofilm community. Microb Ecol 8:115–126
17. Jeffrey, SW, Humphrey, GF (1975) New spectrophotometricequations for determining chlorophylls a, b, and c in higher plants,algae and natural phytoplankton. Biochem Physiol Pflanz 167:191–194
18. Jones, SE, Lock, MA (1993) Seasonal determinations of extracel-lular hydrolytic activities in heterotrophic and mixed hetero-trophic/autotrophic biofilms from two contrasting rivers.Hydrobiologia 257: 1–16
19. Kaplan, LA, Bott, TL (1983) Microbial heterotrophic utilization ofdissolved organic matter in a piedmont stream. Freshwat Biol 13:363–377
20. Kaplan, LA, Newbold, JD (1995) Measurement of stream-waterbiodegradable dissolved organic carbon with a plug-flow bioreac-tor. Wat Res 29: 2696–2706
21. Kaplan, LA, Newbold, JD (2002) The role of monomers in streamecosystem metabolism. In: Findlay, SE, Sinsabaugh, RL (Eds.)Aquatic Ecosystems, Interactivity of Dissolved Organic Matter.Academic Press, San Diego, pp 97–119
22. Kilb, B, Kuhlmann, B, Eschweiler, B, Preuß, G, Ziemann, E,Schottler, U (1998) Community structures of different ground-water habitats investigated using methods of molecular biology.Acta Hydrochim Hydrobiol 26: 349–354
23. Kuserk, FT, Kaplan, LA, Bott, TL (1984) In situ measures of dis-solved organic carbon flux in a rural stream. Can J Fish Aquat Sci41: 964–973
24. Lock, MA (1993) Attached microbial communities in rivers. In:Ford, TE (Ed.) Aquatic Microbiology: An Ecological Approach.Blackwell Scientific Publications, Oxford, pp 113–138
25. Margalef, R (1983) Limnologıa. Ediciones Omega SA, Barcelona
26. Meyer, JL (1988) Benthic bacterial biomass and production in ablackwater river. Verh Int Ver Limnol 23: 1832–1838
27. Meyer, JL (1994) The microbial loop in flowing waters. MicrobEcol 28: 195–199
28. Moran, MA, Zepp, RG (1997) Role of photoreactions in the for-mation of biologically labile compounds from dissolved organicmatter. Limnol Oceanogr 42: 1307–1316
29. Murray, AE, Hollibaugh, JT, Orrego, C (1996) Phylogeneticcomposition of bacterioplankton from two different Californiaestuaries compared by denaturing gradient gel electrophoresis of16S rDNA fragments. Appl Environ Microbiol 62: 2676–2680
30. Naiman, RJ, Melillo, JM, Lock, MA, Ford, TE, Reice, SR (1987)Longitudinal patterns of ecosystem processes and commu-nity structure in a subarctic river continuum. Ecology 68: 1139–1156
31. Nakano, S (1996) Bacterial response to extracellular dissolved or-ganic carbon released from healthy and senescent Fragilaria cro-tonensis (Bacillariophyceae) in experimental systems. Hydrobiol339: 47–55
32. Norrman, B, Zweifel, UL, Hopkinson, CS, Fry, B (1995) Produc-tion and utilization of dissolved organic carbon during an exper-imental diatom bloom. Limnol Oceanogr 40: 898–907
33. Paerl, HW, Bebout, BM, Joye, SB, DesMarais, DJ (1993) Micro-scale characterization of dissolved organic matter production anduptake in marine microbial mat communities. Limnol Oceanogr38: 1150–1161
34. Paul, BJ, Corning, KE, Duthie, HC (1989) An evaluation of themetabolism of sestonic and epilithic communities in runningwaters using an improved chamber technique. Freshwat Biol 21:207–215
35. Petersen, RC, Cummins, KW, Ward, GM (1989) Microbial andanimal processing of detritus in a woodland stream. Ecol Monogr59: 21–39
36. Porter, KG, Feig, YS (1980) The use of DAPI for identifying andcounting aquatic microflora. Limnol Oceanogr 25: 943–948
37. Pusch, M, Fiebig, D, Brettar, I, Eisenmann, H, Ellis, BK, Kaplan,LA, Lock, MA, Naegeli, MW, Traunspurger, W (1998) The role ofmicro-organisms in the ecological connectivity of running waters.Freshwat Biol 40: 453–495
38. Romanı, AM, Sabater, S (1999) Effect of primary producers on theheterotrophic metabolism of a stream biofilm. Freshwat Biol 41:729–736
39. Romanı, AM, Sabater, S (2000) Influence of algal biomass onextracellular enzyme activity in river biofilms. Microb Ecol 41: 16–24
40. Romanı, AM (2000) Characterization of extracellular enzyme ki-netics in two Mediterranean streams. Arch Hydrobiol 148: 99–117
41. Sabater, S, Munoz, I (1990) Successional dynamics of the phyto-plankton in the lower part of the river Ebro. J Plank Res 12: 573–592
42. Servais, P, Anzil, A, Ventresque, C (1989) Simple method for de-termination of biodegradable dissolved organic carbon in water.Appl Environ Microbiol 55: 2732–2734
43. Sobczak, WV (1996) Epilithic bacterial responses to variations inalgal biomass and labile dissolved organic carbon during biofilmcolonization. J N Am Benthol Soc 15: 143–154
44. Tank, JL, Winterbourn, MJ (1995) Biofilm development and in-vertebrate colonization of wood in four New Zealand streams ofcontrasting pH. Freshwat Biol 34: 303–315
45. Thompson, AJ, Sinsabaugh, RL (2000) Matric and particulatephosphatase and aminopeptidase activity in limnetic biofilms.Aquat Microb Ecol 21: 151–159
46. Thurman, EM (1985) Organic Geochemistry of Natural Water.Nijhoff, Dordrecht
47. van Hannen, EJ, Mooij, W, van Agterveld, MP, Gons, HJ, La-anbroek, HJ (1999) Detritus-dependent development of the mi-
A.M. ROMANI ET AL.: BIOFILMS AS SOURCES OR SINKS OF DOC 327
crobial community in an experimental system: qualitative analysisby denaturing gradient gel electroforesis. Appl Environ Microbiol65: 2478–2484
48. Volk, CJ, Volk, CB, Kaplan, LA (1997) Chemical composition ofbiodegradable dissolved organic matter in streamwater. LimnolOceanogr 42: 39–44
49. Wetzel, RG (1993) Microcommunities and microgradients: linkingnutrient regeneration, microbial mutualism, and high sustainedaquatic primary production. Neth J Aquat Ecol 27: 3–9
50. Wiegner, TN, Seitzinger, SP (2001) Photochemical and microbialdegradation of external dissolved organic matter inputs to rivers.Aquat Microb Ecol 24: 27–40
328 A.M. ROMANI ET AL.: BIOFILMS AS SOURCES OR SINKS OF DOC
Copyright © 2022 FDOKUMEN

