


Bahasa
Halaman
Hukum

BRAINA JOURNAL OF NEUROLOGY
Back seat driving: hindlimb corticospinalneurons assume forelimb control followingischaemic strokeMichelle Louise Starkey,1,* Christiane Bleul,1 Bjorn Zorner,1,† Nicolas Thomas Lindau,1
Thomas Mueggler,2,z Markus Rudin2 and Martin Ernst Schwab1
1 Department of Health Sciences and Technology, Brain Research Institute, University of Zurich, 8057 Zurich, Switzerland
2 Animal Imaging Centre, ETH Zurich, 8093 Zurich, Switzerland
*Present address: Balgrist University Hospital, Forchstrasse 340, 8008 Zurich, Switzerland
†Present address: Neurology Clinic, University Hospital Zurich, Frauenklinikstrasse 26, 8091 Zurich, Switzerland
zPresent address: Neuroscience Department, Pharmaceutical Division, F. Hoffmann-La Roche Ltd, 4070 Basel, Switzerland
Correspondence to: Michelle L. Starkey, PhD,
Balgrist University Hospital,
Forchstrasse 340,
CH-8008 Zurich,
Switzerland
E-mail: [email protected]
Whereas large injuries to the brain lead to considerable irreversible functional impairments, smaller strokes or traumatic lesions
are often associated with good recovery. This recovery occurs spontaneously, and there is ample evidence from preclinical
studies to suggest that adjacent undamaged areas (also known as peri-infarct regions) of the cortex ‘take over’ control of the
disrupted functions. In rodents, sprouting of axons and dendrites has been observed in this region following stroke, while
reduced inhibition from horizontal or callosal connections, or plastic changes in subcortical connections, could also occur. The
exact mechanisms underlying functional recovery after small- to medium-sized strokes remain undetermined but are of utmost
importance for understanding the human situation and for designing effective treatments and rehabilitation strategies. In the
present study, we selectively destroyed large parts of the forelimb motor and premotor cortex of adult rats with an ischaemic
injury. A behavioural test requiring highly skilled, cortically controlled forelimb movements showed that some animals recovered
well from this lesion whereas others did not. To investigate the reasons behind these differences, we used anterograde and
retrograde tracing techniques and intracortical microstimulation. Retrograde tracing from the cervical spinal cord showed a
correlation between the number of cervically projecting corticospinal neurons present in the hindlimb sensory–motor cortex
and good behavioural recovery. Anterograde tracing from the hindlimb sensory–motor cortex also showed a positive correlation
between the degree of functional recovery and the sprouting of neurons from this region into the cervical spinal cord. Finally,
intracortical microstimulation confirmed the positive correlation between rewiring of the hindlimb sensory–motor cortex and the
degree of forelimb motor recovery. In conclusion, these experiments suggest that following stroke to the forelimb motor cortex,
cells in the hindlimb sensory–motor area reorganize and become functionally connected to the cervical spinal cord. These new
connections, probably in collaboration with surviving forelimb neurons and more complex indirect connections via the brain-
stem, play an important role for the recovery of cortically controlled behaviours like skilled forelimb reaching.
Keywords: stroke; functional recovery; plasticity; sprouting; movement control
Abbreviations: CST = corticospinal tract; ICMS = intracortical microstimulation
doi:10.1093/brain/aws270 Brain 2012: 135; 3265–3281 | 3265
Received March 2, 2012. Revised July 17, 2012. Accepted August 12, 2012
� The Author (2012). Published by Oxford University Press on behalf of the Guarantors of Brain. All rights reserved.
For Permissions, please email: [email protected]
by guest on May 26, 2016
http://brain.oxfordjournals.org/D
ownloaded from
IntroductionSmall cortical stroke lesions are often followed by good recovery
of function both experimentally and clinically. Under specific cir-
cumstances, the adult cortex is considerably plastic after a lesion,
and there is clinical and preclinical evidence that following small,
subtotal lesions to the cortex, adjacent undamaged areas ‘take
over’ control of lost or disrupted functions (Feydy et al., 2002;
Werhahn et al., 2003; Murphy and Corbett, 2009; Dancause and
Nudo, 2011). However, the exact mechanisms behind this phe-
nomenon are unknown. Following small subtotal strokes, the cor-
tical area surrounding the stroke lesion, the peri-infarct region, has
many properties that could aid growth and functional recovery,
such as changes in gene expression, e.g. of cytoskeletal proteins,
the growth-associated protein GAP-43 and neurotrophic factors
(Stroemer et al., 1993; Keyvani et al., 2002; Lu et al., 2003; Li
and Carmichael, 2006; Li et al., 2010). Additionally, under these
circumstances, regions directly surrounding the peri-infarct area
have been shown to remain relatively damage free and functional
(Enright et al., 2007; Zhang and Murphy, 2007; Winship and
Murphy, 2008; Brown et al., 2009) and thus are potentially avail-
able for processes of recovery. Sprouting of neurites and changes
in dendritic spine densities in this area have been shown preclini-
cally (Zhang et al., 2005; Brown et al., 2007, 2010; Li et al.,
2010). The situation is different following large cortical lesions,
for example, those that involve the entire motor cortex (unilat-
erally). In animal models, cortical map shifts following such lesions
are often permanent, i.e. activation shifts to the non-impaired
cortex (Emerick et al., 2003; Markus et al., 2005), whereas in
humans, such map shifts tend to be transitory and activations
shift back to the damaged cortex as functional recovery progresses
(Liepert et al., 2000; Marshall et al., 2000).
Functionally, the ipsilesional cortex has been shown to be highly
active post-lesion such that representations of the damaged body
parts relocate to surrounding undamaged (peri-infarct) tissue both
clinically and preclinically. For example, following lesion to the
forelimb motor cortex in adult rats, it was shown that partial re-
covery of forelimb function was associated with a reduction of
contralesional functional MRI responses in favour of significant
responses in the infarct periphery on the ipsilesional side
(Dijkhuizen et al., 2001, 2003). In humans, it was shown that
after stroke, an enlargement of the hand region of the ipsilesional
cortex was correlated with improved arm/hand movement control
and clinical scores (Cicinelli et al., 1997; Traversa et al., 1997;
Ward et al., 2006, 2007). Also, following rehabilitative training
in chronic stroke patients, a shift in the motor output maps to
an area adjacent to the lesion was observed (Liepert et al.,
1998; Marshall et al., 2000). In most of these functional studies,
however, the exact mechanisms behind these changes remain elu-
sive. Activity changes in specific cortical areas may result from a
reduction in inhibition from horizontal or callosal connections
(Adesnik and Scanziani, 2010). Alternatively, new connections
may form due to lesion-induced sprouting at the cortical or sub-
cortical level (Kaas et al., 2008; Li et al., 2010). Here we show
that following an ischaemic subtotal lesion of the rat forelimb
motor cortex, spontaneous recovery of forelimb function was
correlated with hindlimb corticospinal neurons changing their
target, anatomically and functionally, to the cervical, forelimb-
related, spinal cord. These results in rodents have potential impli-
cations for understanding the anatomical basis of recovery from
small subtotal strokes in humans.
Materials and methods
AnimalsAdult female Long-Evans rats (200–250 g, n = 170) were obtained
from a specific pathogen-free breeding colony (Charles River).
Animals were kept in groups of four in standardized cages (Type 4
Macrolon) on a standard regimen of 12-h light/dark cycle with food
and water ad libitum. All experiments were performed in accordance
with the guidelines of the Veterinary Office of the Canton Zurich,
Switzerland.
Behavioural training and testingThe single pellet grasping test (Whishaw and Pellis, 1990; Whishaw
et al., 1993; Starkey et al., 2011) assesses fine motor control of the
forelimb. Animals were placed in a Plexiglas box (34 � 14 cm) with
two openings on opposite ends. During a training session, rats had to
grasp 25 sugar pellets (45-mg dustless precision pellets, TSE Systems
Intl. Group) presented at alternating ends. Animals were given five
practice pellets followed by 20 test pellets. A maximum time of
10 min was given to grasp all pellets. Grasping performance was
scored by the experimenter blinded to the group as follows: a trial,
defined as the animal putting its paw through the grasping window to
grasp a new pellet presented to the preferred side into a shallow well,
was scored as 1 (successful grasp) if the animal retrieved the pellet
with its impaired paw and brought it directly to its mouth. A score of 1
was given either if the animal succeeded on first attempt or if it used
several attempts to grasp the pellet, without retracting the paw
through the window and into the box, which was defined as the
end of the attempt. If the animal succeeded in grasping the pellet
but dropped it inside the box before bringing it to its mouth, the
trial was scored as 0.5. If the animal knocked the pellet off the
small shallow well on the shelf without retrieving it, the trial was
scored as 0. The success rate was calculated as the sum of the
retrieved pellets divided by the number of trials. Owing to variations
in the abilities of animals to learn this complicated behavioural task, all
of our success rates are expressed as a percentage of the baseline
score, thus all animals achieved 100% at baseline. Animals were
trained for �3 weeks before baseline recordings and were food
deprived the night before training and testing sessions. Only animals
with a 60% or higher success rate (prior to normalization) at baseline
were selected for the study.
Post-lesion animals were tested on Days 2, 4, 7, 14, 21, 28, 35 and
42 by an experimenter blinded to the treatment and recovery group.
All animals that scored a success rate 560% of baseline on Day 2
were excluded from the study, as it was assumed that they had not
sustained an adequate lesion (59 of 170 lesioned animals were
excluded for this reason). In addition, each testing session was
filmed (Panasonic NVGS500, 25 frames/s), and single grasps were
evaluated using frame-by-frame video analysis (Virtualdub; www.vir-
tualdub.org) as described in detail previously (Starkey et al., 2011).
Briefly, five successful grasps were analysed under the following cri-
teria: body position, targeting, number of attempts, pellet position,
3266 | Brain 2012: 135; 3265–3281 M. L. Starkey et al.
by guest on May 26, 2016
http://brain.oxfordjournals.org/D
ownloaded from

supination, pellet sensing and pellet release (Starkey et al., 2011). Each
subcategory contained scores to categorize the movement compo-
nents. For the purpose of the present data, we found that first attempt
success and body position in relation to the pellet was important. If the
animal grasped the pellet at the first attempt it scored 1, if subsequent
attempts were required (without the animal retracting its paw back
through the grasping window), regardless of number, the animal
scored 2. Several attempts meant that the animal grasped several
times when its paw was already through the grasping window. If
the animal brought its paw back into the box without having grasped
the pellet and then started grasping again and was successful then this
would be scored as a failed attempt followed by a successful attempt.
For body position, the most perfect body position, meaning the animal
was standing directly in front of the pellet, was scored 1. For a full
description of the analysis see Starkey et al. (2011).
Endothelin-1 lesion to the forelimbmotor areaEndothelin-1 lesions were performed similarly to those described pre-
viously (Gilmour et al., 2004; Zhang et al., 2005; Hewlett and Corbett,
2006; Zorner et al., 2010). Trained animals (n = 170) from the retro-
grade acute/chronic, anterograde acute/chronic and intracortical
microstimulation (ICMS) chronic groups were anaesthetized with a
subcutaneous injection of a mixture of hypnorm/dormicum (hypnorm:
120ml/200 g body weight, Janssen Pharmaceutics; dormicum:
0.75 mg/200 g body weight, Roche Pharmaceuticals). The animal
was fixed into a stereotaxic frame, the scalp was opened and the
skull cleaned. The lesion area (forelimb motor cortex area of the pre-
ferred paw as determined with the single pellet reaching test) was
marked based on stereotaxic coordinates defined by retrograde tracing
(Supplementary Fig. 1A–F and H). The skull in this area was drilled
(Foredom Electric Co.) at the slowest drill speed and intermittently
cooled with Ringer’s solution (Fresenius Kabi) until only a thin
veneer of bone remained. This veneer of bone was then carefully
removed. Stereotaxic injections of endothelin-1 (0.3 mg/ml, American
Peptide Company) using a 10 ml syringe (World Precision Instruments)
driven by an electric pump (World Precision Instruments) with a
flow rate of 3 nl/s were made through an intact dura. Injections
were 1 � 300 nl in the rostral forelimb area and 7 � 150 nl in all
caudal forelimb area sites. Site 1 (rostral forelimb area): anterior/pos-
terior = + 3.5 mm, mediolateral = 2.0 mm, dorsoventral = �1.5 mm;
Site 2 (caudal forelimb area): anterior/posterior = + 0.5 mm, mediola-
teral = 2.0 mm, dorsoventral = �1.0 mm; Site 3 (caudal forelimb area):
anterior/posterior = + 1.5 mm, mediolateral = 2.0 mm, dorsoventral =
�1.0 mm; Site 4 (caudal forelimb area): anterior/posterior = + 1.5 mm,
mediolateral = 3.0 mm, dorsoventral = �1.0 mm; Site 5 (caudal fore-
limb area): anterior/posterior = + 0.5 mm, mediolateral = 3.0 mm,
dorsoventral = �1.0 mm; Site 6 (caudal forelimb area): anterior/
posterior = + 1.0 mm, mediolateral = 2.5 mm, dorsoventral =
�1.0 mm; Site 7 (caudal forelimb area): anterior/posterior = + 0.5 mm,
mediolateral = 3.5 mm, dorsoventral = �1.0 mm; Site 8 (caudal fore-
limb area): anterior/posterior = + 1.5 mm, mediolateral = 3.5 mm,
dorsoventral = �1.0 mm. Thus, a total of 1.35 ml endothelin-1 was
injected into the forelimb area. There was a 3-min waiting time
after each injection and 10 min after the last injection. The waiting
time was required to limit the backflow of the endothelin-1 out of
the brain. Previous publications (Adkins et al., 2004) have reported
that the animal should remain unmoved for at least 5 min after the
injections, which is why there was a longer waiting time given after
the final injection. Sham animals (n = 8) received the entire surgery
including the needle penetration but excluding the injection of
endothelin-1. At the end of the surgery, the animal was removed
from the frame and sutured. The animals were warmed on a heating
pad for 24 h before being returned to their home room. Immediately
after surgery and for up to 3 days post-lesion, rats received subcuta-
neous injections of an analgesic (Rimadyl�, 2.5 mg per kg body
weight, Pfizer), an antibiotic (Baytril�, 5 mg per kg body weight,
Bayer) and saline (Ringer’s solution, 5 ml, glucose 5%, NaCl 0.9%
2:1, Fresenius Kabi). The health of the animals was checked daily
for the duration of the experiment.
Assessment of lesion by magneticresonance imagingIn vivo MRI examinations of the brain were performed on a 4.7-T
Pharmascan magnetic resonance system 47/16 (Bruker BioSpin)
equipped with a birdcage resonator of 24-mm diameter 24 h post-lesion
on a subset of lesioned and sham-operated animals (n = 24,
Supplementary Fig. 1G) to check that the lesions were reproducible.
Animals were anaesthetized with isoflurane supplied in an air/oxygen
mixture (3/1) at 4% for induction and 1.8% for maintenance. T2-
weighted images were acquired using a 3D fast spin echo rapid acqui-
sition with relaxation enhancement (Hennig et al., 1986) sequence with
a repetition time of 1500 ms, an inter-echo time of 6.5 ms and a train of
16 echoes (no averaging) leading to an echo time of 54.6 ms, field of
view of 40 � 35 � 16.8 mm3 and a matrix of 256 � 225 � 56 and a
voxel dimension of 0.156 � 0.156 � 0.3 mm3. For image acquisition,
rats were placed on a support where body temperature was maintained
at 37�C using warm air. The total MRI scanning time was 30 min per
rat. To export the data into the analysis software (ImageJ, Version
1.37 c, National Institutes of Health), sagittal and coronal images were
re-sliced using the ParaVision� (Bruker, BioSpin) software tool Jive.
Intracortical microstimulationSix weeks post-lesion a subset of trained, lesioned (n = 8) and trained,
normal control (n = 8, Supplementary Fig. 1G) rats were anaesthetized
with an intramuscular injection of a mixture of ketamine (50 mg/ml,
70 mg/kg body weight, Streuli Pharma) and xylazine (20 mg/ml,
5 mg/kg body weight, Streuli Pharma). It took a short time (53 h)
to map the entire hindlimb sensory–motor area with ICMS in these
animals; therefore, supplementary doses of anaesthetic were rarely
required. On the few occasions where additional anaesthetic was
required, supplementary intramuscular doses of ketamine (50 mg/ml,
20 mg/kg body weight) were given to maintain the animal at an
anaesthetic level that was unresponsive to paw pinch, as described
previously (Neafsey et al., 1986; Z’Graggen et al., 2000; Emerick
et al., 2003). Following the supplementary dose of ketamine, ICMS
did not restart until the same response (visually and with EMG) was
seen in the same location with the identical current as was observed in
the final two points before the injection. The fore- and hindlimbs were
shaved (to better visualize muscle movements), and the animal was
secured in a stereotaxtic frame. Mannitol (20%, 17 ml/kg, B. Braun
Medical) was delivered subcutaneously to reduce swelling of the
cortex. The ipsilesional motor cortex was marked (based on stereotaxic
coordinates defined by retrograde tracing). A craniotomy was per-
formed as described earlier for the lesion but instead over the ipsile-
sional hindlimb sensorimotor cortex. The dura was kept intact, and
warm saline or mineral oil was used to keep the brain moist. Using
Bregma as a landmark, electrode penetrations perpendicular to the pial
surface were made on a grid in random sequence. This grid covered
Hindlimb cortex controls forelimb after stroke Brain 2012: 135; 3265–3281 | 3267
by guest on May 26, 2016
http://brain.oxfordjournals.org/D
ownloaded from

the entire hindlimb sensory–motor area and the caudal parts of the
forelimb area up to the lesion site (anterior/posterior = + 0.8 mm to
�2.4 mm, mediolateral = 1 mm to 3.2 mm, depths from 1.3–1.9 mm).
Stimulation points were a minimum of 400 mm apart. A glass-insulated
platinum/tungsten stimulation electrode with an impedance of 1–2
M� (Thomas Recording) was used to map the cortex. Stimulation
was performed with 45 ms trains of 0.2 ms biphasic pulses at
333 Hz. For the readout, visually detectable movements and EMG of
the fore- and hindlimb were used. EMG recordings were performed for
muscle groups (forelimb: trapezius for shoulder movement, biceps and
triceps for elbow, extensor digitorum for wrist and finger; hindlimb:
soleus and tibialis for general hindlimb movements). The signals were
amplified, filtered, digitized and visualized with PowerLab
(ADInstruments). One investigator (blinded to the treatment groups
and the location of the electrode) applied the stimulation current and
assessed the EMG output, while the other experimenter (also blinded
to the treatment and recovery groups, as well as the current applied)
assessed the limb movements. Stimulation was considered successful if
a visible movement and/or an EMG response could be observed at a
stimulation current 490 mA. The current threshold for every point on
the cortex was determined as the lowest current necessary to elicit a
consistent response, either forelimb, hindlimb or for the forelimb and
then hindlimb when both responded at a particular point. When no
response was seen at the maximal current (90mA) at any depth, ‘no
response’ was recorded. In the case of both fore- and hindlimbs
responding, the threshold current was defined for the forelimb first
and then the hindlimb. Thus, a forelimb/hindlimb response meant
that responses for the fore- and hindlimb were found at the same
map point but not necessarily at the same depth or current. The max-
imal current (90 mA) was chosen based on previous publications
(Neafsey and Sievert, 1982; Gharbawie et al., 2005; Brus-Ramer
et al., 2007) where a maximal current of 100mA was used. EMG
data were high and low pass filtered (10–500 Hz), and a notch filter
(45–55 Hz) was applied. At the end of the ICMS session the animal
was removed from the frame, sutured and warmed on a heating pad
for 24 h before being returned to their home room.
For the ICMS group, the area of the brain eliciting forelimb move-
ments was measured following the construction of the ICMS maps.
For this the full maps were loaded into Image J (Version 1.42, National
Institutes of Health). The area where both fore- and hindlimb re-
sponses were elicited was measured, i.e. the area containing red
dots (Fig. 5A and D) as a percentage of double responses in the
hindlimb area, which was measured in the same way by outlining, in
this case, the yellow and red dots (Fig. 5A and D).
Retrograde tracing: cervical spinalcord (forelimb)Following the completion of behavioural testing, the sham group
(n = 8, Supplementary Fig. 1G), the retrograde tracing (acute and
chronic) groups (n = 20, Supplementary Fig. 1G) and double-labelling
(control and chronic) groups (n = 8, Supplementary Fig. 1G) received
retrograde tracer injections into the cervical spinal cord (Supplementary
Fig. 1A–F). Animals were anaesthetized as mentioned previously for
the lesion surgery, and a laminectomy was performed at vertebral level
C5–C6 (spinal level C6–C7). The animal was then attached to a
stereotaxic frame at vertebral levels C2 and T2. Fast blue retrograde
tracer (2% suspension in 0.1 M phosphate buffer with 2% dimethyl
sulphoxide, EMS-Chemie) was injected stereotaxically using a 28
gauge, 10 ml syringe (Hamilton, BGB Analytik) driven by an electric
pump (World Precision Instruments) with a flow rate of 170 nl/s
(Supplementary Fig. 1A and B). Six injections of 120 nl each were
made unilaterally into the cervical spinal cord ventral horn, contralat-
eral to the lesioned cortex. The injection coordinates were as follows:
0.8 mm lateral to the midline and 1.2 mm below the spinal cord sur-
face. The first injection was made at the C6 level. When this was
complete, the injection needle was retracted, moved rostrally by
0.8 mm, and the second injection was then made. This method was
repeated, moving 0.8 mm rostral for each subsequent injection until all
six injections had been made. The application needle was kept in place
for 3 min after each injection. After the last injection, the animals
(sham and acute and chronic retrograde groups) either received post-
operational care (see later in the article) or had their hindlimb sensory–
motor connections traced in addition (double retrograde groups, see
later in the article). At the end of the surgery, the animal was removed
from the frame and sutured. The animals were warmed on a heating
pad for 24 h before being returned to their home room. Immediately
after surgery and for up to 3 days post-lesion, rats received subcuta-
neous injections of an analgesic (Rimadyl�, 2.5 mg per kg body
weight, Pfizer), an antibiotic (Baytril�, 5 mg per kg body weight,
Bayer) and saline (Ringer’s solution, 5 ml, glucose 5%, NaCl 0.9%
2:1, Fresenius Kabi). The health of the animals was checked daily
for the entire experiment.
Retrograde tracing: lumbar spinalcord (hindlimb)Under the same anaesthesia as mentioned earlier, animals from the
double-labelling group (control and chronic) (n = 8, Supplementary
Fig. 1G) received retrograde tracing of their hindlimb-projecting corti-
cospinal tract (CST). A second laminectomy was performed at lumbar
levels T12–T13 (spinal level L1–L3), and the animal was attached to
the stereotaxic frame at vertebral level T13. The lumbar spinal cord
segments L1–L3 were injected with tetramethylrhodamine (10% in
injectable water, Invitrogen) using a 28 gauge, 10ml syringe driven
by an electric pump with a flow rate of 170 nl/s (Supplementary Fig.
1A and C). Six injections of 120 nl each were made of the tracer
unilaterally into the lumbar spinal cord ventral horn with the injection
coordinates 0.7 mm lateral to the midline and 1 mm below the spinal
cord surface. After the last injection, the animal was sutured and kept
on a heating pad for 24 h to recover before being returned to their
home room. As mentioned earlier, they were given postoperational
care for up to 3 days post-lesion and then were checked daily. This
constituted: subcutaneous injections of an analgesic (Rimadyl�, 2.5 mg
per kg body weight, Pfizer), an antibiotic (Baytril�, 5 mg per kg body
weight, Bayer) and saline (Ringer’s solution, 5 ml, glucose 5%, NaCl
0.9% 2:1, Fresenius Kabi).
Additionally, before the start of the experiment in order to establish
lesion coordinates, the motor cortex was mapped with lumbar and
cervical retrograde tracing in normal control, trained animals (mapping
group, n = 10, Supplementary Fig. 1G). For these animals, following a
subcutaneous injection of hypnorm/dormicum (as mentioned earlier),
the two laminectomies were performed as described earlier. The cer-
vical spinal cord was traced with Fast blue (as mentioned earlier) and
the lumbar spinal cord with diamidino yellow dihydrochloride, 2%
suspension in 0.1 M phosphate buffer and 2% dimethyl sulphoxide
(Sigma-Aldrich), using the same protocol as described earlier for tetra-
methylrhodamine. It was not possible to use diamidino yellow dihy-
drochloride for the entire experiment because it went out of
production before the double-labelling experiments were performed.
However, we carried out pilot experiments in the laboratory which
3268 | Brain 2012: 135; 3265–3281 M. L. Starkey et al.
by guest on May 26, 2016
http://brain.oxfordjournals.org/D
ownloaded from
showed that tetramethylrhodamine had a comparable efficiency to
diamidino yellow dihydrochloride (data not shown).
For all these surgeries, the tracers were always injected unilaterally
on the side to label the cortex of the preferred paw as determined
behaviourally (Supplementary Fig. 1B and C). Post-mortem all tracer
injection sites were examined in detail. Animals where any of the in-
jections hit either the main portion of the CST in the dorsal funiculus
or where spill over to the opposite side of the spinal cord had occurred
were excluded from the study (22 of the total 170 animals were
excluded because of this problem). Fast blue tracing of the cervical
spinal cord labelled layer V pyramidal cells in both the rostral
(Supplementary Fig. 1D) and caudal (Supplementary Fig. 1E) forelimb
areas. Tetramethylrhodamine tracing of the lumbar spinal cord labelled
layer V pyramidal cells in the hindlimb sensory–motor area exclusively
(Supplementary Fig. 1F). We chose Fast blue because it is known to be
a highly efficient tracer, which was confirmed before the start of the
experiment. This tracer labels neurons even when at low local concen-
tration or low levels of sprouting. This was confirmed by the low
variation between the numbers of cells labelled in normal control ani-
mals 10 670 � 1190 (SEM) cells.
The locations of the labelled cells were reconstructed in 3D (see later
in the article) to map the fore- and hindlimb sensory–motor cortices.
Fixation of the brain before 3D reconstruction was done by perfusion
(described later in the article). Shrinkage of the brains during this pro-
cess, which could have affected the coordinates chosen for the lesion,
was very minor. This minor shrinkage was compensated for by freez-
ing the brains rapidly, simultaneously and identically between all
groups. Finally, all animals were tested for lesion deficit and excluded
if the lesion was not considerable. Along with the positions of each
cell, we also labelled Bregma on each of the 2D representations of the
3D reconstructions. Therefore, following reconstruction of the map-
ping animals, we were able to accurately overlay all of the reconstruc-
tions using Bregma as the landmark (Supplementary Fig. 1H). This
gave an ‘average’ hindlimb area, i.e. the region where hindlimb-pro-
jecting cells were found in all animals, i.e. the darkest yellow region
(Supplementary Fig. 1H). For analysis, we selected this as our hindlimb
area (appears as shaded yellow area on other reconstructions). Thus, it
is highly likely that for each animal we underestimate the actual
number of cells in this region.
Anterograde tracing of hindlimbcorticospinal tractIn another group of animals, following the completion of behavioural
testing, trained and lesioned animals (acute and chronic anterograde
groups, n = 27, Supplementary Fig. 1G) were anaesthetized as
described earlier. The animal was fixed into a stereotaxic frame, the
scalp was opened and the skull cleaned. The hindlimb sensory–motor
area was marked according to stereotaxic coordinates defined in the
mapping experiments detailed earlier. A craniotomy was performed
(as mentioned earlier) over the ipsilesional hindlimb sensory–motor
area. Stereotaxic injections of the anterograde tracer biotinylated dex-
tran amine (10 000 molecular weight, 10% solution in 0.01 M PBS,
Invitrogen) were made through an intact dura using a 35 gauge, 10 ml
syringe (World Precision Instruments) driven by an electric pump
(World Precision Instruments) with a flow rate of 6 nl/s. A total
volume of 400 nl was injected at two injection sites (200 nl per site).
The injection coordinates were Site 1: anterior/posterior = �1.5 mm,
mediolateral = 2.5 mm; Site 2: anterior/posterior = �2.5 mm, mediola-
teral = 2.5 mm. All injections were at 1 mm depth, and the syringe
remained in place for 2 min after completion of each injection. After
the second injection, the rat was carefully removed from the frame
and sutured and given postoperational care (see above). The animals
were warmed on a heating pad for 24 h before being returned to their
home room, and their health was checked daily for the remainder of
the experiment.
Tissue preparation and stainingOne week after retrograde tracing (Fast blue, tetramethylrhodamine,
diamidino yellow dihydrochloride) and 3 weeks after anterograde tra-
cing (biotinylated dextran amine), animals were deeply anaesthetized
with pentobarbital (450 mg/kg body weight i.p.; Abbott Laboratories),
and perfused transcardially with 100 ml Ringer’s solution (containing
100 000 IU/l heparin, Liquemin, Roche, and 0.25% NaNO2) followed
by 300 ml of 4% phosphate-buffered paraformaldehyde (pH 7.4).
Spinal cords and brains were dissected and post-fixed in the same
fixative overnight at 4�C before being cryoprotected in phosphate-
buffered 30% sucrose for an additional 5 days. The cervical spinal
cord (C1–T1), lumbar spinal cord (L1–L5), brain and brainstem were
embedded in Tissue-Tec (OCT) and frozen in isopentane (Sigma) at
�40�C. Brains and spinal cords of retrogradely traced animals were
cut in 40-mm-thick coronal sections on a cryostat and collected on
slides (Superfrost) before being cover-slipped with Mowiol� mounting
medium (Calbiochem). Biotinylated dextran amine-traced spinal cords
were cut in 50-mm thick horizontal sections, and the brainstems
from the same animals (for normalization of tracing) were cut in
50-mm thick coronal sections on a cryostat and collected on slides
(Superfrost) before being stained by on-slide processing using the
nickel-enhanced DAB (3,3’-diaminobenzidine) protocol (Vectastain�
ABC Elite Kit, Vector Laboratories; 1:100 in Tris-buffered saline plus
TritonTM X-100) as described previously (Herzog and Brosamle, 1997).
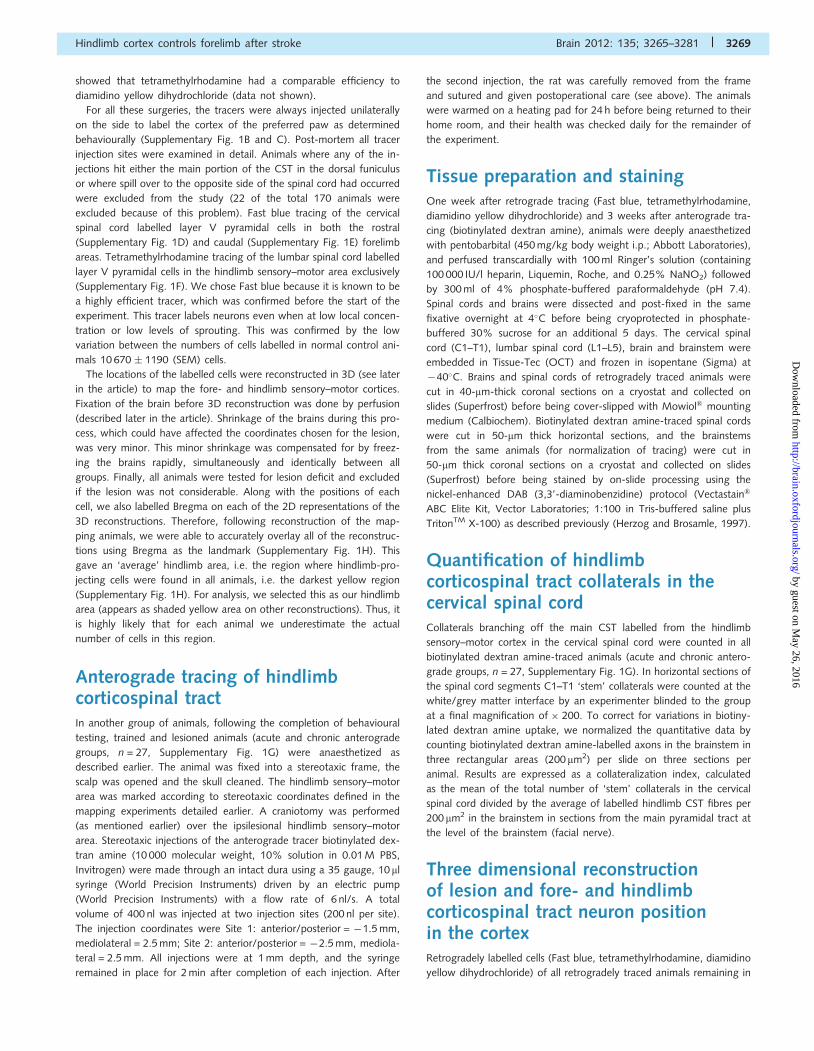
Quantification of hindlimbcorticospinal tract collaterals in thecervical spinal cordCollaterals branching off the main CST labelled from the hindlimb
sensory–motor cortex in the cervical spinal cord were counted in all
biotinylated dextran amine-traced animals (acute and chronic antero-
grade groups, n = 27, Supplementary Fig. 1G). In horizontal sections of
the spinal cord segments C1–T1 ‘stem’ collaterals were counted at the
white/grey matter interface by an experimenter blinded to the group
at a final magnification of � 200. To correct for variations in biotiny-
lated dextran amine uptake, we normalized the quantitative data by
counting biotinylated dextran amine-labelled axons in the brainstem in
three rectangular areas (200 mm2) per slide on three sections per
animal. Results are expressed as a collateralization index, calculated
as the mean of the total number of ‘stem’ collaterals in the cervical
spinal cord divided by the average of labelled hindlimb CST fibres per
200 mm2 in the brainstem in sections from the main pyramidal tract at
the level of the brainstem (facial nerve).
Three dimensional reconstructionof lesion and fore- and hindlimbcorticospinal tract neuron positionin the cortexRetrogradely labelled cells (Fast blue, tetramethylrhodamine, diamidino
yellow dihydrochloride) of all retrogradely traced animals remaining in
Hindlimb cortex controls forelimb after stroke Brain 2012: 135; 3265–3281 | 3269
by guest on May 26, 2016
http://brain.oxfordjournals.org/D
ownloaded from

the study after inspection of the injection sites (sham, retrograde
acute/chronic, ICMS control/chronic, double labelling control/chronic,
and mapping groups, n = 62, Supplementary Fig. 1G) and the lesion
sites of all lesioned animals (retrograde acute/chronic, anterograde
acute/chronic, double-labelling control/chronic, ICMS control/chronic,
n = 71, Supplementary Fig. 1G) were reconstructed in 3D by an
experimenter blinded to the treatment groups using Neurolucida 8.0
(MicroBrightField). Every ninth section and thus cells present at 360 mm
intervals were reconstructed in series to give a 3D image of the brain.
Data shown are dorsal views of full 3D reconstructions (2D represen-
tations), total lesion volume, total Fast blue labelled/forelimb project-
ing cells on the ipsi- and contralesional cortex, total diamidino yellow
dihydrochloride/tetramethylrhodamine labelled/hindlimb projecting
cells on the ipsi- and contralesional cortex, and double-labelled/fore-
and hindlimb projecting cells on the ipsilesional cortex. As only every
ninth section was reconstructed, the final cell counts were multiplied
by nine to give an extrapolated final cell count. However, 2D repre-
sentations of the 3D reconstructions show every ninth section, and
thus under-represent the total number of labelled cells. In order to
reconstruct the lesion site, alternate sections from all lesioned animals
were stained with cresyl violet. These sections were also reconstructed,
and the lesioned area was superimposed (red shaded area) onto the
corresponding 2D representations of the 3D reconstructions of the
retrogradely traced cells. To define the medial and lateral caudal fore-
limb area, a line was drawn rostro-caudally along the lateral edge of
the hindlimb area on every brain. This line transected the caudal fore-
limb area dividing it into a medial and lateral part within which the
Fast blue-labelled cells were counted. In order for comparisons to be
made, all reconstructions are shown with the lesion and ipsilesional
(contralateral) tracing on the right side. As animals received lesions
impairing their preferred paw, 2D representations of the 3D recon-
structions were flipped wherever necessary.
For lesioned, retrogradely traced animals (n = 20, Supplementary
Fig. 1G), the hindlimb sensory–motor areas were defined by overlaying
the reconstructed hindlimb sensory–motor areas of the retrogradely
traced mapping animals (n = 10, Supplementary Fig. 1G) using
Neurolucida 8.0. For this we traced around the hindlimb areas with
ImageJ. The area where all hindlimb areas overlapped (darkest yellow
area in Supplementary Fig. 1H, outlined in yellow) was defined as the
averaged hindlimb sensory–motor area. This averaged hindlimb sen-
sory–motor area was then superimposed on all reconstructions from
lesioned animals using defined landmarks. In the control and chronic
ICMS and control and chronic double-labelling groups, all traced cells,
including the hindlimb sensory–motor cells, were mapped.
Defining recovery groupsThe animals showed a high degree of variability in their recovery pro-
files following injury (Fig. 1E). Owing to this variability, we decided to
show data for single animals instead of group averages. We decided to
average the score that the animals achieved at Days 35 and 42 be-
cause by this time point the animals were no longer improving in
function, but there was variability in their actual scores, as has been
reported previously (Whishaw, 2000). Therefore, we took the average
of these two time points to give a more accurate score due to the
inherent variability in this task, which is never completely stable as it
depends on a number of factors in addition to function such as: mo-
tivation, attention and slight changes in the experimental room. To
define ‘good’ and ‘bad’ recovery groups, the percentage change in
success rate on the single pellet reaching task between Days 2 and
35/42 was calculated. All animals where the percentage change
was450% were put into the good recovery group. The range of
percentage changes in this group was 51.8–93.2%. Whereas, all ani-
mals where the percentage was 550% were put into the bad recov-
ery group. The range of percentage changes in this group was:
�16.7% to 48.5%, plotted in addition to single animals scores
(Fig. 1E) and number of hindlimb collaterals in the cervical spinal
cord (Fig. 3H). In addition to this and for all other results, we carried
out correlations between the measured variable (cell or fibre counts,
volume of forelimb area) with the success rate at Day 35/42 for all the
individual animals.
Statistical analysisGrasping data were analysed using either parametric analysis of vari-
ance (two-/one-way repeated measures ANOVA) of the appropriate
design, followed by Bonferroni post hoc pair-wise comparisons when-
ever a main effect or interaction achieved statistical significance;
non-parametric (Mann–Whitney) tests; and Spearman or Pearson cor-
relations between the behavioural recovery and the lesion volume,
retrogradely labelled cells, anterogradely labelled fibres and ICMS
data. All statistical analyses were conducted using the software
Graph Pad Prism. Data are presented as means � SEM, single data
points represent single animals, and asterisks indicate significances:
*P4 0.05, **P4 0.01, ***P4 0.001.
ResultsWith a total of nine stereotaxic intracortical injections of
endothelin-1, we achieved a considerable ischaemic destruction
of the rostral (Fig. 1C) and caudal (Fig. 1B and D) forelimb
motor cortex. In a subset of animals, T2-weighted MRI scans
24 h post-lesion showed that the damage extended through all
layers of the cortex (Fig. 1B), whereas sham lesioned animals
showed no damage (Fig. 1A). Retrograde tracings from the cer-
vical spinal cord segments C6 and C7 showed that 470% of the
CST neurons innervating the forepaw-related spinal cord were
destroyed (sham: 6233.6 � 798.4 Fast blue-labelled cells in fore-
limb area; chronic lesioned: 1823.6 � 312.2 Fast blue-labelled cells
in forelimb area). However, small numbers of neurons remained,
mostly in the rostral forelimb area and the lateral sensory areas
(Table 1 and Fig. 2A–D).
Skilled reaching for single pellets through a small slit in a
Plexiglas box was used, as it is a well-established test for
CST-dependent forelimb function. Most animals showed a 60–
80% deficit in success rate at Day 2 post-lesion. Lesion positions
were variable between animals (Fig. 2D), but this was not corre-
lated to initial lesion deficit, which was large in all cases. Those
that achieved a superior performance at Day 2 were excluded
from further analysis (59 of the original 170 animals lesioned
were excluded for this reason), as they had not received a suffi-
cient lesion to the forelimb area to assess recovery. Over Days 14
to 35/42, the individual lesioned animals showed large differences
in the recovery of digit and forelimb control as assessed in the
single pellet grasping task (Fig. 1E). However, the majority of the
rats showed good recovery of the original behaviour (change in
the success rate between Day 2 and 35/42 450%; Fig. 1E),
whereas the remainder of the animals showed poor recovery
(change in the success rate between Day 2 and 35/42 550%;
Fig. 1E). Interestingly, there was no significant correlation between
behavioural recovery and the overall lesion volume as determined
3270 | Brain 2012: 135; 3265–3281 M. L. Starkey et al.
by guest on May 26, 2016
http://brain.oxfordjournals.org/D
ownloaded from

by 3D reconstruction of the lesions in the individual animals (1.86–
5.42 mm3; mean 3.1 � 0.13 mm3; n = 71, P40.05, r = 0.01,
Spearman correlation, Fig. 1F). Additionally, there was no correl-
ation (P4 0.05, r = 0.19, Spearman correlation) between the
pre-lesion and post-lesion success rate when the raw data were
used (as opposed to per cent of baseline).
Identification of corticospinal tractneurons projecting to the forepaw areaof the spinal cord (C6–C7) in intact ratsand following large forelimb strokesLesioned animals were retrogradely traced with multiple unilateral
injections of Fast blue into the grey matter of cervical spinal cord
segments C6–C7 on the denervated side of the spinal cord
(Supplementary Fig. 1A–C). Each tracer injection site in every
animal was examined in detail and animals where any of the
injections either hit the main portion of the CST in the dorsal
funiculus or where tracer diffused across the midline to the
intact side of the spinal cord were excluded from the study
(22 of 75 traced animals excluded).
Two dimensional representations of 3D reconstructions of the Fast
blue-labelled layer V forepaw CST cells in trained sham-lesioned
animals (n = 8) showed the typical pattern of the forelimb innerv-
ation (Fig. 2A and C). The majority of the neurons were localized in
the caudal (‘ipsilesional’) forelimb area (4957.9 � 619.3 Fast blue-
labelled cells), rostral forelimb area (1275.8 � 194.7 Fast
blue-labelled cells), S2 (806.6 � 83.8 Fast blue-labelled cells), con-
tralesional forelimb area (542.3 � 86.6 Fast blue-labelled cells)
and ipsilesional hindlimb field (1719.0 � 87.5 diamidino yellow
dihydrochloride-labelled cells). There were few Fast blue-labelled
projecting neurons in the hindlimb field (114.9 � 37.1 Fast
blue-labelled cells).
In the acutely lesioned animals, 2 days survival after the stroke
(n = 4, Fig. 2B and C), the bulk of the caudal forelimb neurons
(1192.5 � 117.5 Fast blue-labelled cells remaining) and a majority
of the rostral forelimb area neurons (434.3 � 127.1 Fast blue-
labelled cells remaining) were destroyed (total 1626.8 � 172.8
Fast blue-labelled cells remaining). Comparisons with the data
from sham animals showed that acutely lesioned animals had sig-
nificantly fewer Fast blue-labelled cells in the rostral forelimb area
(P5 0.05, Mann–Whitney test) and in the medial and lateral
caudal forelimb area (P50.01, Mann–Whitney test). However,
the most lateral, sensory area S2 was largely spared (Fig. 2B and
C, 573.8 � 26.6 Fast blue-labelled cells remaining), as were the
cells in the contralesional cortex (265.5 � 35.0 Fast blue-labelled
cells remaining). As with sham animals, there were very few Fast
Figure 1 Multiple stereotaxic intracortical injections of endothelin-1 destroy the forelimb motor cortex leading to functional deficits.
Cross-sections through the caudal forelimb area with T2-weighted MRI scans taken 24 h post-lesion show minimal damage in sham-
operated animals (A) and a hypo-dense region centred on the primary motor cortex in animals receiving a stroke (B, black arrows). Cellular
damage throughout the layers of the cortex was confirmed with cresyl violet staining of the rostral (C, black arrows) and caudal (D, black
arrows) forelimb area of lesioned animals (49 days post-lesion). (E) Endothelin-1-induced stroke lesions lead to a marked deficit on the
single pellet grasping task 2 days after the lesion. Animals showed variable recovery courses, with some animals recovering well (‘Good’:
450% change from Day 2 to Day 35/42 post-lesion, open circles, n = 23) and others badly (‘Bad’: 550% change from Day 2 to Day 35/
42 post-lesion, closed circles, n = 20). Single animals appear in light grey and group averages in black. (F) Despite some variation in lesion
size, there was no correlation between the lesion volume and the success rate on the single pellet grasping task at Day 35/42. Animals
showing good recovery (n = 23) are represented with crosses and those with bad recovery (n = 20) with filled squares. Scale bars: A,
B = 5 mm, C = 2 mm, D = 2.5 mm. Data are presented as means � SEM; asterisks indicate significances: **P4 0.01, ***P40.001.
Hindlimb cortex controls forelimb after stroke Brain 2012: 135; 3265–3281 | 3271
by guest on May 26, 2016
http://brain.oxfordjournals.org/D
ownloaded from

blue-labelled i.e. C6-C7 projecting neurons in the hindlimb field
(Fig. 2B and C, 90.0 � 11.6 Fast blue-labelled cells).
In the chronic lesioned animals (n = 16) traced 6 weeks
post-lesion, the organization of the C6–C7-projecting cortical neu-
rons was broadly similar to that of the acute animals; for example,
in the rostral and caudal forelimb area, the number of retrogradely
labelled CST neurons remaining was 462.9 � 84.8 and
1360.7 � 248.8, respectively, which was not significantly different
from those of the acutely lesioned animals (Fig. 2B–D). As in the
acute animals, the lateral S1 and S2 regions were largely spared
(784.7 � 79.3 Fast blue-labelled cells remaining, Fig. 2C and D).
Of particular interest was the contralesional cortex where surpris-
ingly we did not detect a significant difference in the number of
ipsilaterally projecting neurons (330.8 � 45.1 Fast blue-labelled
cells remaining) between all three groups (intact, acute and chron-
ically lesioned, Fig. 2A–D). An important difference between intact
or acute animals and chronic was found in the ipsilesional hindlimb
field: in sham and acute animals a mean of 114.9 � 37.1 (n = 8)
and 90.0 � 11.6 (n = 4) neurons projected to the cervical spinal
cord, respectively, whereas chronically lesioned animals had a sig-
nificantly higher number of forelimb-projecting cells in the hind-
limb field, 285.8 � 35.2 (Fig. 2C, n = 16). This corresponds to an
increase of 149% and 218% in comparison to sham and acute
animals, respectively. These cells were scattered over all regions of
the hindlimb sensory–motor area (Fig. 2D).
Correlation of retrogradely labelledcorticospinal tract neuron patterns withbehavioural recoveryWe correlated the behavioural outcome 5–6 weeks after the
stroke with the numbers of retrogradely labelled C6–C7-projecting
CST neurons in the different parts of the ipsi- and contralesional
cortex for all the individual animals of the chronic lesion group
(Fig. 2E–J and Supplementary Fig. 2). Five cortical regions were
used for the analysis: the lesioned (ipsilesional) medial and lateral
caudal forelimb areas, the rostral forelimb area, S2, the contrale-
sional cortex and the ipsilesional hindlimb sensory–motor area.
There was no correlation found between the behavioural recovery
and the numbers of cells in the contralesional cortex (P40.05,
r = 0.24, Spearmann correlation, Fig. 2E). The same was true for
the total number of cells in the ipsilesional cortex (P4 0.05,
r = 37, Spearmann correlation, Fig. 2F) and also the forelimb
regions in the ipsilesional cortex (P40.05, r = 39, Spearmann cor-
relation, Fig. 2G). However, strong correlations were seen be-
tween the increased numbers of neurons from the ipsilesional
hindlimb field projecting to the cervical spinal cord and the success
rate (P50.05, r = 0.61, Spearmann correlation, Fig. 2H), as well
as the precision of pellet reaching (P50.01, r = 0.71, Spearmann
correlation, Fig. 2I).
Anterograde tracing of the hindlimbsensory–motor cortex revealedincreased projections to the cervicalspinal cord, correlated with highfunctional recoveryThe anterograde axonal tracer biotinylated dextran amine was in-
jected into the ipsilesional hindlimb sensory–motor area in a subset
of acutely (n = 4) and chronically lesioned animals (n = 23), and
the cervical spinal cord was analysed to quantify the labelled CST
fibres and collateral branches. In naıve animals, the vast majority
of the hindlimb sensory–motor cortex CST axons traverse the
Table 1 Grasping success rate (%) and number of Fast blue-labelled cells in different regions of the ipsilesional cortex inchronic lesioned animals
good
bad
reco
very
Animal number Success rateDay 35/42 (%)
RFA Medial CFA Lateral CFA S2 HLarea
412 3.2 54 288 396 963 126
414 14.6 90 63 702 360 99
400 22.2 342 18 837 693 36
126 31.7 504 81 1260 621 135
416 43.5 630 162 828 513 207
156 64.3 504 180 477 945 81
388 66.7 1170 216 1224 639 693
146 68.2 1233 576 4140 1152 99
243 86.1 252 126 936 369 297
403 87.5 558 225 1566 1071 288
415 88.9 144 180 954 477 333
411 90.4 333 0 324 1143 144
244 95.8 189 189 936 558 279
393 96.2 423 477 1188 1449 306
160 105.0 612 99 1179 666 405
161 112.5 369 333 1611 936 207
The table shows the total number of Fast blue retrogradely labelled cells 49 days after the stroke. Animals are ranked from the worst (top) to the best (bottom) recovery onthe single pellet reaching task at Day 35/42 (columns 1–2). The number of Fast blue-labelled cells in any of the four forelimb regions (columns 3–6) was not correlated with
good or bad recovery. However, the number of cells in the hindlimb area (column 7) was.RFA = rostral forelimb area; CFA = caudal forelimb area; HL area = hindlimb sensorimotor area.
3272 | Brain 2012: 135; 3265–3281 M. L. Starkey et al.
by guest on May 26, 2016
http://brain.oxfordjournals.org/D
ownloaded from

Figure 2 Fast blue (FB) retrograde tracing of cells from the cervical C6–C7 spinal cord. (A) Representative 2D representations of the
3D reconstruction of Fast blue-labelled cells in a sham-lesioned animal, viewed from above. Large numbers of Fast blue-labelled cells (blue
dots) are found on the ipsilesional (right) rostral (RFA) and caudal forelimb area (CFA) and in the secondary somatosensory cortex S2. Few
labelled cells are present in the contralesional cortex (left) representing the very minor ipsilateral projection of the CST. Also, very few
labelled cells are present in the hindlimb sensory–motor cortex (HL; yellow oval). (B) Reconstruction of Fast blue-labelled cells in a lesioned
animal acutely after the stroke. The lesion (red, shaded area) has largely destroyed the rostral forelimb area (FL) and medial (motor) caudal
forelimb area neurons, sparing S2 and the hindlimb field. (C) Quantification of the C6–C7-projecting CST neurons in the rostral forelimb
area, medial and lateral caudal forelimb area, S2 and hindlimb of intact (n = 10), acute (n = 4) and chronically lesioned (n = 16) rats.
(D) Maps of C6–C7-projecting CST neurons in 16 chronically lesioned rats arranged from top left (Rat 412) to bottom right (Rat 161) in
rows from the worst success rate on the single pellet reaching test at Day 35/42 (Rat 412, 3.2%) to the best (Rat 161, 112.5%).
Hindlimb cortex controls forelimb after stroke Brain 2012: 135; 3265–3281 | 3273
(continued)
by guest on May 26, 2016
http://brain.oxfordjournals.org/D
ownloaded from

cervical spinal cord in a straight manner, sending few, if any, col-
laterals into the grey matter (Fouad et al., 2001). The same situ-
ation was found in animals analysed immediately after the stroke
(acutely lesioned; Fig. 3A and H). However, in the chronic stroke
animals, the number of collaterals leaving the main CST and enter-
ing the grey matter in the C2–C7 region of the spinal cord was
significantly increased in the majority of, but not all, rats (Fig. 3B–
D and H). We correlated the number of cervical spinal cord col-
laterals of fibres originating in the hindlimb field to the behavioural
recovery of each individual animal. A weak, but significant, cor-
relation was found for success rate (P50.05, r = 0.50, Pearson
correlation, Fig. 3E) and for correct body position in front of the
grasping window (P50.01, r = 0.56, Pearson correlation, Fig. 3F).
Retrograde tracing of the fore- andhindlimb sensory–motor cortex revealedthat the majority of reorganizedhindlimb cells are connected purelyto the cervical spinal cordWe were interested in whether the reorganized hindlimb cells re-
tained their original connection to the lumbar spinal cord or
whether this was instead retracted or lost in favour of the new
connection to the cervical spinal cord. To investigate this, we
carried out a double retrograde tracing of the spinal cord with
Fast blue injected into the cervical spinal cord and tetramethylrho-
damine injected into the lumbar spinal cord in intact rats and in a
group of chronically lesioned animals that showed good recovery.
We only reported data from animals that showed good recovery
(460% success rate at Day 35/42), as we had already established
in previous experiments (Figs. 2 and 3) that poorly recovering
animals (440% success rate at Day 35/42) did not show reorgan-
ization of the hindlimb area and so we would not expect to find
double-labelled cells.
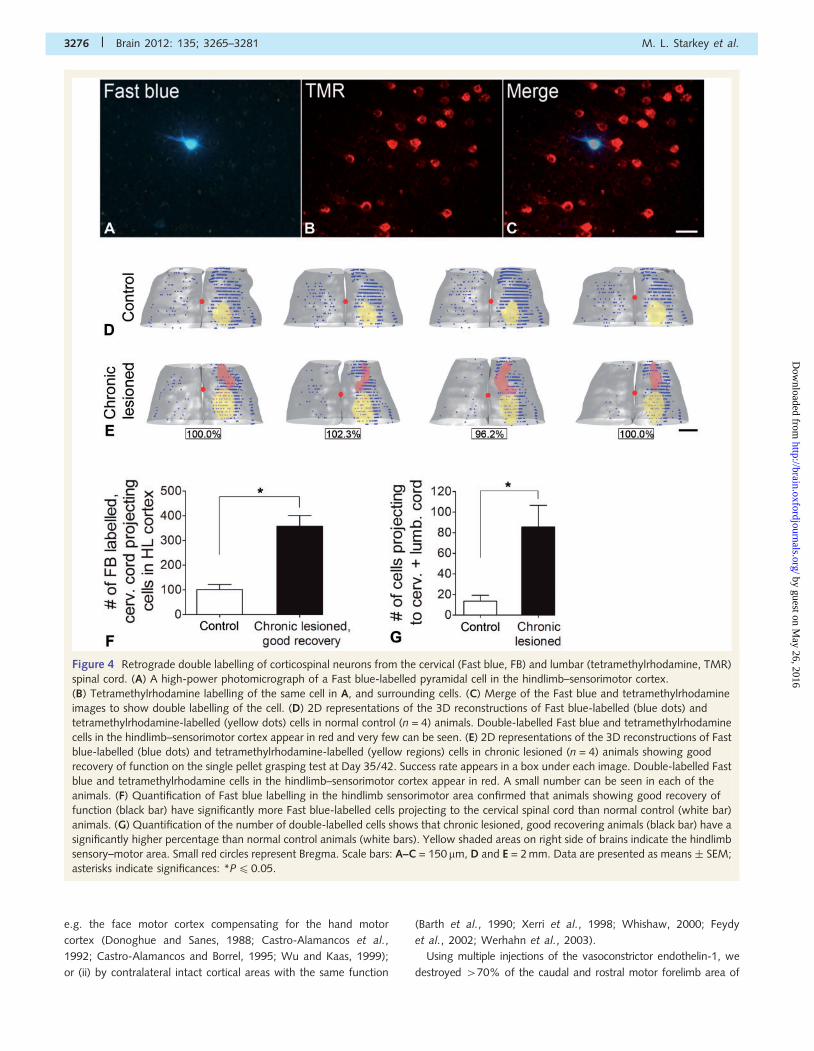
Double-labelled cells, which had transported the tracers from
both the lumbar and cervical spinal cord, were very rare in the
intact, normal control rat hindlimb field (13.5 � 5.8 cells, Fig. 4A–
D and G). Their number was increased 6.8-fold 6–8 weeks after
the forelimb stroke (85.5 � 20.9 cells, Fig. 4A–C, E and G), which
was significantly more than normal control animals (P50.05,
Mann–Whitney test, Fig. 4G). The double-labelled cells were
spread throughout the hindlimb area (Fig. 4E). Interestingly, of
the total number of hindlimb field neurons projecting to the cer-
vical spinal cord in the chronic stroke animals (390.4 � 69.7 cells,
Fig. 4F), only 21.9% were double labelled, suggesting that in the
majority of cases, reorganized hindlimb cells retracted/lost their
original connection to the lumbar spinal cord and instead
became solely connected to the cervical spinal cord. In normal
control animals, 13.3% of hindlimb neurons projecting to the cer-
vical spinal cord were double labelled (Fig. 4F).
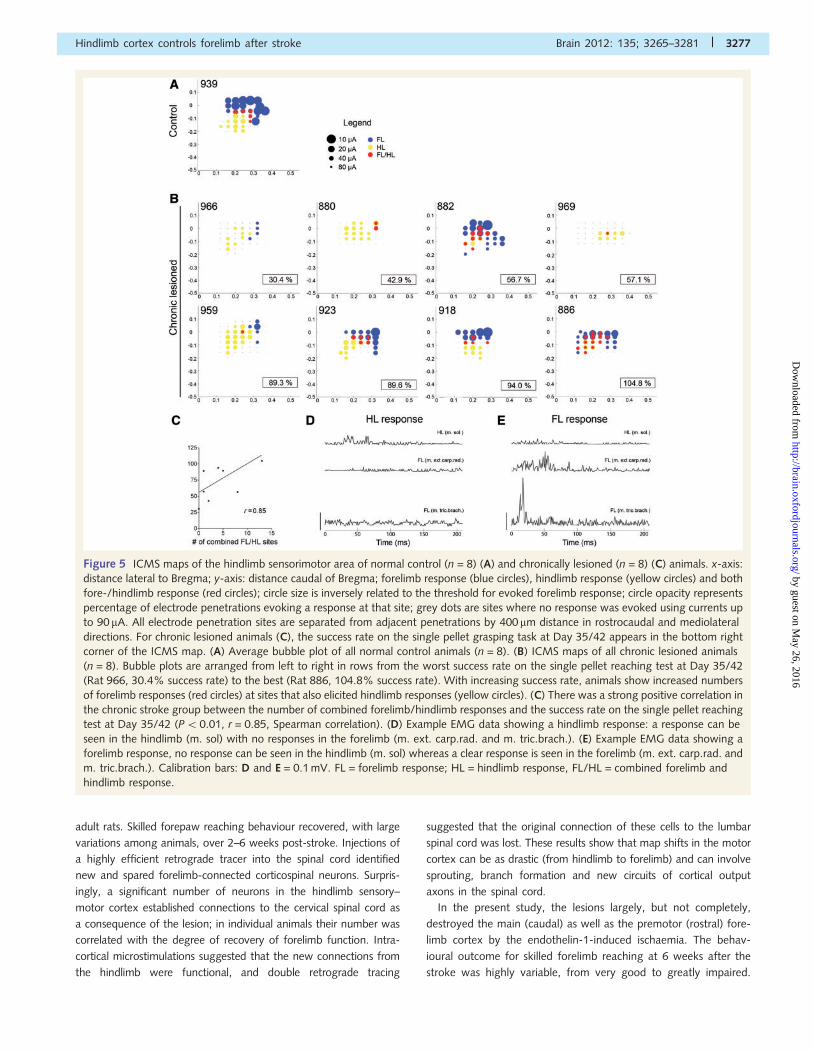
Stimulation of hindlimb sensory–motorcortex elicits forelimb movements inrats with good recovery of functionWe mapped the hindlimb and the most caudal region of the
caudal forelimb representation with ICMS and recorded fore- as
well as hindlimb movements. We carried out ICMS experiments in
a subset of lesioned (6 weeks post-lesion; different levels of re-
covery of skilled pellet reaching) and normal control animals; all
animals were randomly number coded and the experimenter was
blinded to the code. ICMS maps are shown in Fig. 5A and D. Each
circle in the map plots the inverse threshold for evoking a forelimb
(blue), hindlimb (yellow) or fore- as well as hindlimb (red) re-
sponse at each site. The larger the circle the lower the current
required to evoke a motor response. Grey dots indicate sites
where no movements were evoked at the highest current
(90 mA). Despite choosing 90 mA as the maximal current this was
rarely the lowest threshold for a movement, particularly at sites
where fore- and hindlimb responses were reported. Instead the
average maximal movement threshold currents were as follows:
forelimb (at a forelimb only site): 52.4 � 3.8 mA; hindlimb (at a
hindlimb only site): 58.9 � 2.1mA; forelimb (at a forelimb/hind-
limb site): 56.9 � 4.0 mA; hindlimb (at a forelimb/hindlimb site):
52.9 � 3.2mA. Normal control animals (n = 8) showed the typical
pattern of well separated fore- and hindlimb motor areas (Fig. 5A)
with minimal overlap along the border between the two fields and
relatively consistent maps between individuals. The average
number of sites producing combined forelimb/hindlimb move-
ments in these animals was 4.4 � 1.0. In the chronic stroke ani-
mals (n = 8), there was considerable variation between individuals.
Figure 2 ContinuedSuccess rates at Day 35/42 appear in a box on the right side of each reconstruction. With increasing success rate, animals show increased
numbers of Fast blue-labelled cells in their hindlimb areas (yellow shaded areas). Red shaded areas represent the lesions. (E–J) Correlations
between behavioural performance in the skilled reaching test and C6–C7-projecting neurons in different cortical areas. There was no
significant correlation between the number of Fast blue-labelled cells on the contralesional (left in image) cortex of chronic lesioned
animals (n = 16) and the success rate at Day 35/42 (E, P4 0.05, r = 0.24, Spearmann correlation); neither was there a correlation between
the total number of Fast blue-labelled cells on the ipsilesional (right) cortex of chronic lesioned animals (n = 16) and the success rate at Day
35/42 (F, P40.05, r = 0.37, Spearmann correlation) nor was there a correlation between the number of Fast blue-labelled cells in the
ipsilesional forelimb area and grasping success (G, P40.05, r = 0.39, Spearmann correlation). However, there was a positive correlation
(P50.05, r = 0.61, Spearmann correlation) between the number of Fast blue-labelled cells in the ipsilesional hindlimb area (yellow shaded
area) of chronic lesioned animals (n = 16) and the success rate at Day 35/42 (H) and with the first attempt success rate at Day 35/42
(P50.01, r = 0.71, Spearmann correlation) (I) but no correlation between the number of Fast blue-labelled cells in the ipsilesional
hindlimb area of chronic lesioned animals (n = 16) and body position 1 (J, P4 0.05, r = 0.13, Spearmann correlation). Small red circles
represent Bregma. Scale bars: A, B and D = 2 mm. Data are presented as means � SEM; asterisks indicate significances: *P40.05,
**P40.01.
3274 | Brain 2012: 135; 3265–3281 M. L. Starkey et al.
by guest on May 26, 2016
http://brain.oxfordjournals.org/D
ownloaded from

Interestingly, animals showing many forelimb responses elicited in
the original hindlimb sensory–motor area were mostly those with
good recovery of forelimb function at Day 35/42 (Fig. 5D). The
correlation of the number of combined forelimb and hindlimb re-
sponses in the hindlimb field with the behavioural outcome is
shown in Fig. 5C (P50.01, r = 0.85, Spearman correlation).
There was no correlation between baseline success rate on the
single pellet grasping task and the post-lesion ICMS maps, i.e. it
is not the case that animals that performed best before the lesion
recovered better afterwards. These results suggest that many of
the hindlimb cells that rewired to the cervical spinal cord as a
consequence of the forelimb stroke made functional connections.
DiscussionThe outcome following stroke in humans is highly variable, ran-
ging from lifelong hemiplegia to almost complete recovery (Brown
and Schultz, 2010; Stinear, 2010; Langhorne et al., 2011), but the
reasons for this variation and the exact mechanisms underlying it
remain unknown. Both clinical and preclinical data suggest that
the size and location of the lesion are key determinants of deficit
and recovery potential. Following small (subtotal) lesions to the
motor cortex, takeover of functions by other intact areas plays a
crucial compensatory role in recovery. Compensatory takeover can
occur (i) by remaining spared parts with corresponding functions,
Figure 3 Biotinylated dextran amine anterograde tracing of collaterals from the hindlimb (HL) sensory–motor cortex in the cervical spinal
cord. (A) Horizontal section shows biotinylated dextran amine-labelled hindlimb fibres travelling through the cervical spinal cord of acutely
lesioned (n = 4) animals in a compact bundle sending only few collaterals into the grey matter of the cervical spinal cord (black arrow-
heads). (B and C) Collaterals from hindlimb-originating fibres can be seen frequently in chronic stroke animals with good recovery of
function. Fibres arborize in the grey matter (black arrowheads). (D) Low magnification image of the cervical spinal cord of an animal
showing good recovery of function (dashed box indicates region of panel C). The collaterals of biotinylated dextran amine-labelled
hindlimb fibres can be seen throughout the length of the spinal cord (black arrowheads). In horizontal sections of the spinal cord segments
C1–T1 ‘stem’ collaterals were counted at the white/grey matter interface and normalized to biotinylated dextran amine-labelled axons in
the brainstem. Results are expressed as a collateralization index, i.e. the mean of the total number of stem collaterals in the cervical spinal
cord. (E–G) There was a positive correlation between the numbers of biotinylated dextran amine-labelled hindlimb collaterals in the
cervical spinal cord and the success rate for skilled reaching at Day 35/42 (P50.05, r = 0.50, Spearmann correlation, E) as well as with the
most perfect body position for grasping (P50.01, r = 0.56, Spearmann correlation, F), but not with the first attempt success (G, P40.01,
r = 0.14, Spearmann correlation). (H) Group averages show that animals showing good recovery of function (n = 12, grey bar) on the
single pellet grasping test at Day 35/42 had significantly more biotinylated dextran amine-labelled hindlimb collaterals in the cervical spinal
cord than those animals that recovered badly (n = 11, black bar). Scale bars: A–D = 200mm. Data are presented as means � SEM; asterisks
indicate significances: **P40.01.
Hindlimb cortex controls forelimb after stroke Brain 2012: 135; 3265–3281 | 3275
by guest on May 26, 2016
http://brain.oxfordjournals.org/D
ownloaded from
e.g. the face motor cortex compensating for the hand motor
cortex (Donoghue and Sanes, 1988; Castro-Alamancos et al.,
1992; Castro-Alamancos and Borrel, 1995; Wu and Kaas, 1999);
or (ii) by contralateral intact cortical areas with the same function
(Barth et al., 1990; Xerri et al., 1998; Whishaw, 2000; Feydy
et al., 2002; Werhahn et al., 2003).
Using multiple injections of the vasoconstrictor endothelin-1, we
destroyed 470% of the caudal and rostral motor forelimb area of
Figure 4 Retrograde double labelling of corticospinal neurons from the cervical (Fast blue, FB) and lumbar (tetramethylrhodamine, TMR)
spinal cord. (A) A high-power photomicrograph of a Fast blue-labelled pyramidal cell in the hindlimb–sensorimotor cortex.
(B) Tetramethylrhodamine labelling of the same cell in A, and surrounding cells. (C) Merge of the Fast blue and tetramethylrhodamine
images to show double labelling of the cell. (D) 2D representations of the 3D reconstructions of Fast blue-labelled (blue dots) and
tetramethylrhodamine-labelled (yellow dots) cells in normal control (n = 4) animals. Double-labelled Fast blue and tetramethylrhodamine
cells in the hindlimb–sensorimotor cortex appear in red and very few can be seen. (E) 2D representations of the 3D reconstructions of Fast
blue-labelled (blue dots) and tetramethylrhodamine-labelled (yellow regions) cells in chronic lesioned (n = 4) animals showing good
recovery of function on the single pellet grasping test at Day 35/42. Success rate appears in a box under each image. Double-labelled Fast
blue and tetramethylrhodamine cells in the hindlimb–sensorimotor cortex appear in red. A small number can be seen in each of the
animals. (F) Quantification of Fast blue labelling in the hindlimb sensorimotor area confirmed that animals showing good recovery of
function (black bar) have significantly more Fast blue-labelled cells projecting to the cervical spinal cord than normal control (white bar)
animals. (G) Quantification of the number of double-labelled cells shows that chronic lesioned, good recovering animals (black bar) have a
significantly higher percentage than normal control animals (white bars). Yellow shaded areas on right side of brains indicate the hindlimb
sensory–motor area. Small red circles represent Bregma. Scale bars: A–C = 150 mm, D and E = 2 mm. Data are presented as means � SEM;
asterisks indicate significances: *P40.05.
3276 | Brain 2012: 135; 3265–3281 M. L. Starkey et al.
by guest on May 26, 2016
http://brain.oxfordjournals.org/D
ownloaded from
adult rats. Skilled forepaw reaching behaviour recovered, with large
variations among animals, over 2–6 weeks post-stroke. Injections of
a highly efficient retrograde tracer into the spinal cord identified
new and spared forelimb-connected corticospinal neurons. Surpris-
ingly, a significant number of neurons in the hindlimb sensory–
motor cortex established connections to the cervical spinal cord as
a consequence of the lesion; in individual animals their number was
correlated with the degree of recovery of forelimb function. Intra-
cortical microstimulations suggested that the new connections from
the hindlimb were functional, and double retrograde tracing
suggested that the original connection of these cells to the lumbar
spinal cord was lost. These results show that map shifts in the motor
cortex can be as drastic (from hindlimb to forelimb) and can involve
sprouting, branch formation and new circuits of cortical output
axons in the spinal cord.
In the present study, the lesions largely, but not completely,
destroyed the main (caudal) as well as the premotor (rostral) fore-
limb cortex by the endothelin-1-induced ischaemia. The behav-
ioural outcome for skilled forelimb reaching at 6 weeks after the
stroke was highly variable, from very good to greatly impaired.
Figure 5 ICMS maps of the hindlimb sensorimotor area of normal control (n = 8) (A) and chronically lesioned (n = 8) (C) animals. x-axis:
distance lateral to Bregma; y-axis: distance caudal of Bregma; forelimb response (blue circles), hindlimb response (yellow circles) and both
fore-/hindlimb response (red circles); circle size is inversely related to the threshold for evoked forelimb response; circle opacity represents
percentage of electrode penetrations evoking a response at that site; grey dots are sites where no response was evoked using currents up
to 90 mA. All electrode penetration sites are separated from adjacent penetrations by 400 mm distance in rostrocaudal and mediolateral
directions. For chronic lesioned animals (C), the success rate on the single pellet grasping task at Day 35/42 appears in the bottom right
corner of the ICMS map. (A) Average bubble plot of all normal control animals (n = 8). (B) ICMS maps of all chronic lesioned animals
(n = 8). Bubble plots are arranged from left to right in rows from the worst success rate on the single pellet reaching test at Day 35/42
(Rat 966, 30.4% success rate) to the best (Rat 886, 104.8% success rate). With increasing success rate, animals show increased numbers
of forelimb responses (red circles) at sites that also elicited hindlimb responses (yellow circles). (C) There was a strong positive correlation in
the chronic stroke group between the number of combined forelimb/hindlimb responses and the success rate on the single pellet reaching
test at Day 35/42 (P50.01, r = 0.85, Spearman correlation). (D) Example EMG data showing a hindlimb response: a response can be
seen in the hindlimb (m. sol) with no responses in the forelimb (m. ext. carp.rad. and m. tric.brach.). (E) Example EMG data showing a
forelimb response, no response can be seen in the hindlimb (m. sol) whereas a clear response is seen in the forelimb (m. ext. carp.rad. and
m. tric.brach.). Calibration bars: D and E = 0.1 mV. FL = forelimb response; HL = hindlimb response, FL/HL = combined forelimb and
hindlimb response.
Hindlimb cortex controls forelimb after stroke Brain 2012: 135; 3265–3281 | 3277
by guest on May 26, 2016
http://brain.oxfordjournals.org/D
ownloaded from
The lesion left a variable number of CST neurons with an intact
connection to the cervical spinal cord as shown by retrograde
tracing. Interestingly, no correlation was found between the num-
bers of these spared CST neurons in the caudal or rostral forelimb
areas and the behavioural recovery of the individual animals. The
same was true for the small number of ipsilaterally projecting CST
neurons in the contralesional hemisphere; the number of these
neurons did not change as a consequence of the lesion, and
there was no correlation between their number and behavioural
recovery. However, a very different situation occurred in the
ipsilesional spared hindlimb sensory–motor cortex where few
cells project to the cervical spinal cord/forelimb in intact rats.
On average this number was more than doubled in the chronic
stroke rats, and there was a strong correlation between the
number of hindlimb CST neurons projecting to the cervical spinal
cord and the functional recovery of individual animals.
Increased numbers of Fast blue-labelled cells in the hindlimb
sensory–motor area might also have resulted from terminal sprout-
ing of fibres from forelimb-projecting cells in the hindlimb sensory–
motor area, which had only a small axonal arbour not sufficient
for dye uptake prior to the lesion. However, this explanation is
unlikely because stem collaterals were rare in naive animals, in our
controls and in those animals that recovered badly. Therefore,
even if arborization in the grey matter would have been insuffi-
cient to pick up detectable amounts of Fast blue, the stem collat-
eral giving rise to the sprouting would still have been detected by
the anterograde tracing. Additionally, we had a high number of
animals in each group, we did not see many Fast blue-labelled
cells in the hindlimb sensory–motor area in the control/acute
groups and we report strong correlations between grasping suc-
cess and the number of these cells. Thus, this threshold of sprout-
ing explanation seems unlikely.
It is known that cortical motor areas exhibit considerable
interindividual spatial variability (Kline and Reid, 1984) and that
they are influenced by behavioural experience and training (Kleim
et al., 1998, 2004; Adkins et al., 2006; Wang et al., 2011), which
could have influenced our lesion coordinates. However, these two
concerns were dealt with by using high animal numbers for each
part of the study and by all animals that were used being trained
on the single pellet reaching task. This led to low interindividual
variability, e.g. cell counts were similar, and ICMS map locations
were similar. Consideration was also given to other cortical map-
ping techniques, but all available techniques had negative aspects,
e.g. with functional MRI only the location of the sensory cortex is
known, and the technique has a low spatial resolution,
voltage-sensitive dye imaging is a terminal procedure, ICMS map-
ping before the lesion may have caused small amounts of damage
to the cortex and intrinsic optical imaging also gives only the sen-
sory cortex. This is an issue because although there is an almost
complete overlap of hindlimb sensory responses with the hindlimb
motor cortex, this is not the case for the forelimb cortex where the
medial aspects are purely motor and it is only in the lateral aspects
that there is overlap with the forelimb sensory areas (Donoghue
and Wise, 1982). Thus, accurately locating the area of the fore-
limb sensory region does not accurately locate the forelimb motor
region. As it was not possible to use the ICMS mapping technique
on an individual basis, owing to potential damage to the cortex by
electrode penetrations, we chose tracing because this was the
method we used for analysis.
Anterograde tracing confirmed previous results (Fouad et al.,
2001) that collaterals branching off the hindlimb-projecting CST
in the cervical spinal cord are normally rare in intact animals. In
contrast, a much higher number of collaterals establishing highly
branched terminal networks in the cervical grey matter were
observed in chronic stroke rats. Again, there was a high variation
among individuals but a significant correlation between the
number of stem collaterals, which gave rise to branched terminals,
and forelimb performance. These anatomical observations there-
fore suggest that a significant contributor to functional recovery of
skilled reaching after selective forelimb strokes comes from the
hindlimb sensory–motor cortex. Although these cells are small in
number, they branch extensively in the cervical grey matter and
their contribution to functional recovery seems more important
than the role of remaining, possibly functionally impaired, caudal
and rostral forelimb area neurons or the intact ipsilateral (contrale-
sional) cortex.
In accordance with many studies in animals and humans, the
contralesional cortex plays a minor role in cases of smaller partial
strokes (Xerri et al., 1998; Marshall et al., 2000; Whishaw, 2000;
Dijkhuizen et al., 2001, 2003; Feydy et al., 2002; Werhahn et al.,
2003; Mostany and Portera-Cailliau, 2011). It appears that the
overall size of the lesion, and thus the degree of cellular damage,
is the reason for this, as following small cortical lesions in rats (Barth
et al., 1990) and primates (Xerri et al., 1998), reorganization was
seen within the lesioned cortex with no change in the undamaged
contralesional cortex. Thus, it is likely that in our case, where the
lesions were subtotal for the motor cortex, the intact contralesional
cortex played a minor role in recovery, as evidenced by no change in
Fast blue-labelled cells on this side of the cortex, compared with the
ipsilesional cortex, where a rise in the number of Fast blue-labelled
cells in the hindlimb sensory–motor area was observed. Additionally,
reorganization to more distant regions ipsilaterally, for example the
rostral forelimb area, could also have occurred as has been shown
previously (Dancause et al., 2005), but in our case, this is unlikely, as
in the majority of the rats the lesions destroyed a large proportion of
this region.
ICMS was used to investigate the functionality of the new con-
nections from the hindlimb to the cervical spinal cord. The typical
sharp distinction between forelimb and hindlimb motor cortex was
found in the intact animals. In the chronic stroke animals, how-
ever, forelimb responses were frequently elicited at low current
amplitude from the hindlimb field. Again, a correlation existed
between these electrophysiological results and behavioural recov-
ery in individual animals. Forelimb as well as hindlimb responses
were often obtained from the same stimulation site (albeit at a
different depth and/or current), probably due to the fact that a
number of CST neurons were excited simultaneously. A maximal
current of 90 mA was chosen based on previous publications
(Neafsey and Sievert, 1982; Gharbawie et al., 2005; Brus-Ramer
et al., 2007); however, this was rarely the lowest movement
threshold. Previous studies estimate that a 90mA stimulus could
spread radially from the electrode tip to 300mm (Asanuma, 1967),
thus potentially co-activating both forelimb and hindlimb simultan-
eously. However, as our stimulation sites were 400 mm apart,
3278 | Brain 2012: 135; 3265–3281 M. L. Starkey et al.
by guest on May 26, 2016
http://brain.oxfordjournals.org/D
ownloaded from

forelimb and hindlimb responses were often at different depths
and currents at the particular mapping point and because 90 mA
was well above the average current threshold for movement, we
think this is not a significant concern for our data. In addition, our
results are also in line with previous studies, e.g. it was shown that
following a stroke to the forelimb area, forelimb movements could
be evoked from the original hindlimb area in well recovered ani-
mals (Castro-Alamancos and Borrel, 1995). Using in vivo calcium
imaging following selective strokes, it was shown that individual
somatosensory neurons altered their input selectivity, either from
fore- to hindlimb or from a single to multiple limbs (Winship and
Murphy, 2008). In primates and rats following deafferentation by
arm amputation, the forelimb area of M1 became fully filled in
with adjacent body representations (Donoghue and Sanes, 1988;
Wu and Kaas, 1999). Similar results are also observed in humans
following limb immobilization (Langer et al., 2012), bimanual
upper limb training (Hoffman and Field-Fote, 2007) and spinal
cord injury (Green et al., 1999).
Double retrograde tracing from the cervical and lumbar spinal
cord was used to determine whether hindlimb neurons innervating
the cervical spinal cord also connected to the lumbar cord.
Interestingly, there were very few double-labelled cells, the ma-
jority of neurons in this region, many of which appeared as a
consequence of the stroke, were labelled exclusively from the cer-
vical cord. Although it is not possible to make conclusions about
presumably activity-dependent axon growth dynamics without an
extensive time course study, these results suggest that the original
axon to the hindlimb cord was retracted or degraded. Indeed,
degeneration of axons has been seen by electron microscopy in
the lumbar spinal cord in the similar paradigm (Weishaupt et al.,
2010), but further investigation would be required to confirm this
for the present results.
As the rat was used as the experimental model in this study the
question arises of whether topographical mapping in this species is
sufficiently precise to be generally applicable. We believe that it is
for several reasons. Firstly, retrogradely labelled cell counts were
highly consistent between separate animals, suggesting that sen-
sorimotor cortex anatomy is relatively stable between individual
rats. Secondly, the border region between the forelimb and hind-
limb sensorimotor cortex was not particularly significant for re-
organization, as our results show that reorganized cells were
seen throughout the hindlimb area, and their number was highly
correlated with grasping success. Thirdly, ICMS experiments were
performed in the hindlimb area and there were few forelimb
responses in this region in sham/control animals or those that re-
covered badly. Although it is known that connections through the
corpus callosum are present in humans and that they play an im-
portant role in inhibition and excitation, this is not known for
rodents. We believe, however, that such connections did not
play a large role in our experiments because following anterograde
tracing we counted the number of ‘stem collaterals’ (the fibres
crossing the white–grey matter boundary) originating from hind-
limb cortex fibres and entering the cervical spinal cord. Their
increased number in animals with good recovery was not due to
branching of arbours in the grey matter but rather due to in-
creases in the number of fibres crossing the white–grey matter
boundary.
If forelimb-projecting neurons in the hindlimb sensory motor
field are to become fully functional, they have to receive sensory
input from the forelimb. Extension of the forelimb sensory map
into the hindlimb sensory–motor field after stroke has been
described using voltage-sensitive dyes in mouse models (Xerri
et al., 1998; Dijkhuizen et al., 2001; Winship and Murphy,
2008; Brown et al., 2009), and recently increased responses in
the sensorimotor cortex post-stroke have been linked to motor
recovery in humans (Schaechter et al., 2011). Whether
pre-existing connections or growth of new horizontal connections
are responsible for these map shifts (Li and Carmichael, 2006), and
how the specificity of these connections is established, is currently
unknown. In a model of thoracic spinal cord injury, a similar map
shift of hindlimb to forelimb functions and anatomy has been
described. Specifically, hindlimb neurons connected to the cervical
spinal cord after transection of their axons in the thoracic cord,
and sensory stimulation of the forepaw elicited rapid activation of
the hindlimb (as well as forelimb) sensory–motor field (Ghosh
et al., 2010).
The molecular mechanisms underlying these impressive anatom-
ical changes are currently unknown. Perilesional regions of the
cortex are known to express elevated levels of neurotrophic factors
as well as growth-related messenger RNAs and proteins (Stroemer
et al., 1993; Keyvani et al., 2002; Lu et al., 2003; Zhao et al., 2006;
Li et al., 2010). Additionally, sprouting over significant distances
horizontally has been shown (Adesnik and Scanziani, 2010; Brown
et al., 2010; Li et al., 2010). Thus, an elevated level of plasticity and
growth is probably present in the hindlimb cortex adjacent to the
stroke lesions in our model. In the spinal cord, selective lesions of
the CST were shown to lead to changes of messenger RNA expres-
sion to include growth-related genes (Bareyre and Schwab, 2003;
Maier et al., 2008). Finally, activity was shown to regulate CST
growth and branching in developing as well as adult injured rats
(Martin et al., 1999, 2004; Brus-Ramer et al., 2007; Maier et al.,
2008; Carmel et al., 2010). Denervation or the change in functional
status of spinal cord neurons after the stroke could induce factors
that increase local plasticity and induce/attract sprouting fibres from
neighbouring pathways including the hindlimb CST. All these mech-
anisms, which will require future detailed investigation, probably
contribute and collaborate to produce the anatomical and functional
changes that lead to behavioural recovery shown in the present
experimental paradigm and potentially also the functional recovery
observed clinically.
In conclusion, the present results show that large map shifts,
e.g. between hindlimb and forelimb, can occur as a consequence
of ischaemic destruction of large parts of the sensory–motor cortex
in adult rats. Major anatomical changes including rewiring of hind-
limb neurons to the forelimb spinal cord occur and probably con-
tribute to functional recovery. These results add to our
understanding of structural and functional plasticity after lesions
in the adult CNS.
AcknowledgementsThe authors thank Marc Bolliger for his help with and loan of the
EMG set-up, Eric Rouiller for his expertise in establishing ICMS,
Hindlimb cortex controls forelimb after stroke Brain 2012: 135; 3265–3281 | 3279
by guest on May 26, 2016
http://brain.oxfordjournals.org/D
ownloaded from

Wendy Kartje and Arko Ghosh for helpful advice and discussion
and Mirjam Gullo, Hansjorg Kasper and Stefan Giger for technical
support.
FundingSwiss National Science Foundation (Grant number 3100AO-
122527/1); the National Centre for Competence in Research
‘Neural Plasticity and Repair’ of the Swiss National Science Foun-
dation; The European Union’s Seventh Framework Programme
FP7/2007-2013 (Grant numbers 201024 and 202213) (European
Stroke Network, www.europeanstrokenetwork.info/); The Euro-
pean Commission under the 7th Framework Programme—
HEALTH—Collaborative Project Plasticise (www.plasticise.eu)
(Grant number 223524) and The Spinal Cord Consortium of the
Christopher and Dana Reeve Foundation.
Supplementary materialSupplementary material is available at Brain online.
ReferencesAdesnik H, Scanziani M. Lateral competition for cortical space by
layer-specific horizontal circuits. Nature 2010; 464: 1155–60.Adkins DL, Boychuk J, Remple MS, Kleim JA. Motor training induces
experience-specific patterns of plasticity across motor cortex and
spinal cord. J Appl Physiol 2006; 101: 1776–82.Adkins DL, Voorhies AC, Jones TA. Behavioral and neuroplastic effects of
focal endothelin-1 induced sensorimotor cortex lesions. Neuroscience
2004; 128: 473–86.
Asanuma H, Sakata H. Functional organization of a cortical efferent
system examined with focal depth stimulation in cats. J Neurophysiol
1967; 30: 35–54.
Bareyre FM, Schwab ME. Inflammation, degeneration and regeneration
in the injured spinal cord: insights from DNA microarrays. Trends
Neurosci 2003; 26: 555–63.
Barth TM, Jones TA, Schallert T. Functional subdivisions of the rat som-
atic sensorimotor cortex. Behav Brain Res 1990; 39: 73–95.Brown AW, Schultz BA. Recovery and rehabilitation after stroke. Semin
Neurol 2010; 30: 511–17.Brown CE, Aminoltejari K, Erb H, Winship IR, Murphy TH. In vivo
voltage-sensitive dye imaging in adult mice reveals that somatosensory
maps lost to stroke are replaced over weeks by new structural and
functional circuits with prolonged modes of activation within both the
peri-infarct zone and distant sites. J Neurosci 2009; 29: 1719–34.
Brown CE, Boyd JD, Murphy TH. Longitudinal in vivo imaging reveals
balanced and branch-specific remodeling of mature cortical pyramidal
dendritic arbors after stroke. J Cereb Blood Flow Metab 2010; 30:
783–91.
Brown CE, Li P, Boyd JD, Delaney KR, Murphy TH. Extensive turnover of
dendritic spines and vascular remodeling in cortical tissues recovering
from stroke. J Neurosci 2007; 27: 4101–9.
Brus-Ramer M, Carmel JB, Chakrabarty S, Martin JH. Electrical stimula-
tion of spared corticospinal axons augments connections with ipsilat-
eral spinal motor circuits after injury. J Neurosci 2007; 27: 13793–801.
Carmel JB, Berrol LJ, Brus-Ramer M, Martin JH. Chronic electrical stimu-
lation of the intact corticospinal system after unilateral injury restores
skilled locomotor control and promotes spinal axon outgrowth. J
Neurosci 2010; 30: 10918–26.
Castro-Alamancos MA, Borrel J. Functional recovery of forelimb response
capacity after forelimb primary motor cortex damage in the rat is due
to the reorganization of adjacent areas of cortex. Neuroscience 1995;
68: 793–805.
Castro-Alamancos MA, Garcia-Segura LM, Borrell J. Transfer of function
to a specific area of the cortex after induced recovery from brain
damage. Eur J Neurosci 1992; 4: 853–63.Cicinelli P, Traversa R, Bassi A, Scivoletto G, Rossini PM. Interhemispheric
differences of hand muscle representation in human motor cortex.
Muscle Nerve 1997; 20: 535–42.Dancause N, Barbay S, Frost SB, Plautz EJ, Chen D, Zoubina EV, et al.
Extensive cortical rewiring after brain injury. J Neurosci 2005; 25:
10167–79.
Dancause N, Nudo RJ. Shaping plasticity to enhance recovery after
injury. Prog Brain Res 2011; 192: 273–95.
Dijkhuizen RM, Ren J, Mandeville JB, Wu O, Ozdag FM,
Moskowitz MA, et al. Functional magnetic resonance imaging of re-
organization in rat brain after stroke. Proc Natl Acad Sci USA 2001;
98: 12766–71.
Dijkhuizen RM, Singhal AB, Mandeville JB, Wu O, Halpern EF,
Finklestein SP, et al. Correlation between brain reorganization, ische-
mic damage, and neurologic status after transient focal cerebral ische-
mia in rats: a functional magnetic resonance imaging study. J Neurosci
2003; 23: 510–17.
Donoghue JP, Sanes JN. Organization of adult motor cortex representa-
tion patterns following neonatal forelimb nerve injury in rats. J
Neurosci 1988; 8: 3221–32.
Donoghue JP, Wise SP. The motor cortex of the rat: cytoarchitecture and
microstimulation mapping. J Comp Neurol 1982; 212: 76–88.
Emerick AJ, Neafsey EJ, Schwab ME, Kartje GL. Functional
reorganization of the motor cortex in adult rats after cortical lesion
and treatment with monoclonal antibody IN-1. J Neurosci 2003; 23:
4826–30.
Enright LE, Zhang S, Murphy TH. Fine mapping of the spatial relationship
between acute ischemia and dendritic structure indicates selective vul-
nerability of layer V neuron dendritic tufts within single neurons
in vivo. J Cereb Blood Flow Metab 2007; 27: 1185–200.
Feydy A, Carlier R, Roby-Brami A, Bussel B, Cazalis F, Pierot L, et al.
Longitudinal study of motor recovery after stroke: recruitment and
focusing of brain activation. Stroke 2002; 33: 1610–17.
Fouad K, Pedersen V, Schwab ME, Brosamle C. Cervical sprouting of
corticospinal fibers after thoracic spinal cord injury accompanies
shifts in evoked motor responses. Curr Biol 2001; 11: 1766–70.
Gharbawie OA, Gonzalez CL, Williams PT, Kleim JA, Whishaw IQ.
Middle cerebral artery (MCA) stroke produces dysfunction in adjacent
motor cortex as detected by intracortical microstimulation in rats.
Neuroscience 2005; 130: 601–10.Ghosh A, Haiss F, Sydekum E, Schneider R, Gullo M, Wyss MT, et al.
Rewiring of hindlimb corticospinal neurons after spinal cord injury. Nat
Neurosci 2010; 13: 97–104.
Gilmour G, Iversen SD, O’Neill MF, Bannerman DM. The effects of
intracortical endothelin-1 injections on skilled forelimb use: implications
for modelling recovery of function after stroke. Behav Brain Res 2004;
150: 171–83.
Green JB, Sora E, Bialy Y, Ricamato A, Thatcher RW. Cortical motor
reorganization after paraplegia: an EEG study. Neurology 1999; 53:
736–43.
Hennig J, Nauerth A, Friedburg H. RARE imaging: a fast imaging method
for clinical MR. Magn Reson Med 1986; 3: 823–33.
Herzog A, Brosamle C. ’Semifree-floating’ treatment: a simple and fast
method to process consecutive sections for immunohistochemistry and
neuronal tracing. J Neurosci Methods 1997; 72: 57–63.Hewlett KA, Corbett D. Delayed minocycline treatment reduces
long-term functional deficits and histological injury in a rodent model
of focal ischemia. Neuroscience 2006; 141: 27–33.Hoffman LR, Field-Fote EC. Cortical reorganization following bimanual
training and somatosensory stimulation in cervical spinal cord injury: a
case report. Phys Ther 2007; 87: 208–23.
3280 | Brain 2012: 135; 3265–3281 M. L. Starkey et al.
by guest on May 26, 2016
http://brain.oxfordjournals.org/D
ownloaded from

Kaas JH, Qi HX, Burish MJ, Gharbawie OA, Onifer SM, Massey JM.
Cortical and subcortical plasticity in the brains of humans, primates,
and rats after damage to sensory afferents in the dorsal columns of the
spinal cord. Exp Neurol 2008; 209: 407–16.
Keyvani K, Witte OW, Paulus W. Gene expression profiling in perile-
sional and contralateral areas after ischemia in rat brain. J Cereb
Blood Flow Metab 2002; 22: 153–60.
Kleim JA, Barbay S, Nudo RJ. Functional reorganization of the rat motor
cortex following motor skill learning. J Neurophysiol 1998; 80: 3321–5.
Kleim JA, Hogg TM, VandenBerg PM, Cooper NR, Bruneau R, Remple M.
Cortical synaptogenesis and motor map reorganization occur during late,
but not early, phase of motor skill learning. J Neurosci 2004; 24: 628–33.
Kline J, Reid KH. Variability of bregma in 300 g Long-Evans and
Sprague-Dawley rats. Physiol Behav 1984; 33: 301–3.Langer N, Hanggi J, Muller NA, Simmen HP, Jancke L. Effects of limb
immobilization on brain plasticity. Neurology 2012; 78: 182–8.Langhorne P, Bernhardt J, Kwakkel G. Stroke rehabilitation. Lancet 2011;
377: 1693–702.
Li S, Carmichael ST. Growth-associated gene and protein expression in
the region of axonal sprouting in the aged brain after stroke.
Neurobiol Dis 2006; 23: 362–73.
Li S, Overman JJ, Katsman D, Kozlov SV, Donnelly CJ, Twiss JL, et al. An
age-related sprouting transcriptome provides molecular control of
axonal sprouting after stroke. Nat Neurosci 2010; 13: 1496–504.
Liepert J, Graef S, Uhde I, Leidner O, Weiller C. Training-induced
changes of motor cortex representations in stroke patients. Acta
Neurol Scand 2000; 101: 321–6.
Liepert J, Miltner WH, Bauder H, Sommer M, Dettmers C, Taub E, et al.
Motor cortex plasticity during constraint-induced movement therapy in
stroke patients. Neurosci Lett 1998; 250: 5–8.
Lu A, Tang Y, Ran R, Clark JF, Aronow BJ, Sharp FR. Genomics of the
periinfarction cortex after focal cerebral ischemia. J Cereb Blood Flow
Metab 2003; 23: 786–810.
Maier IC, Baumann K, Thallmair M, Weinmann O, Scholl J, Schwab ME.
Constraint-induced movement therapy in the adult rat after unilateral
corticospinal tract injury. J Neurosci 2008; 28: 9386–403.
Markus TM, Tsai SY, Bollnow MR, Farrer RG, O’Brien TE, Kindler-
Baumann DR, et al. Recovery and brain reorganization after stroke
in adult and aged rats. Ann Neurol 2005; 58: 950–3.
Marshall RS, Perera GM, Lazar RM, Krakauer JW, Constantine RC,
DeLaPaz RL. Evolution of cortical activation during recovery from cor-
ticospinal tract infarction. Stroke 2000; 31: 656–61.
Martin JH, Choy M, Pullman S, Meng Z. Corticospinal system develop-
ment depends on motor experience. J Neurosci 2004; 24: 2122–32.
Martin JH, Kably B, Hacking A. Activity-dependent development of cor-
tical axon terminations in the spinal cord and brain stem. Exp Brain Res
1999; 125: 184–99.
Mostany R, Portera-Cailliau C. Absence of large-scale dendritic plasticity
of layer 5 pyramidal neurons in peri-infarct cortex. J Neurosci 2011;
31: 1734–8.
Murphy TH, Corbett D. Plasticity during stroke recovery: from synapse to
behaviour. Nat Rev Neurosci 2009; 10: 861–72.
Neafsey EJ, Bold EL, Haas G, Hurley-Gius KM, Quirk G, Sievert CF, et al.
The organization of the rat motor cortex: a microstimulation mapping
study. Brain Res 1986; 396: 77–96.
Neafsey EJ, Sievert C. A second forelimb motor area exists in rat frontal
cortex. Brain Res 1982; 232: 151–6.Schaechter JD, van Oers CA, Groisser BN, Salles SS, Vangel MG,
Moore CI, et al. Increase in sensorimotor cortex response to somato-
sensory stimulation over subacute poststroke period correlates with
motor recovery in hemiparetic patients. Neurorehabil Neural Repair
2012; 26: 325–34.
Starkey ML, Bleul C, Maier IC, Schwab ME. Rehabilitative training fol-lowing unilateral pyramidotomy in adult rats improves forelimb func-
tion in a non-task specific way. Exp Neurol 2011; 232: 81–9.
Stinear C. Prediction of recovery of motor function after stroke. Lancet
Neurol 2010; 9: 1228–32.Stroemer RP, Kent TA, Hulsebosch CE. Acute increase in expression of
growth associated protein GAP-43 following cortical ischemia in rat.
Neurosci Lett 1993; 162: 51–4.
Traversa R, Cicinelli P, Bassi A, Rossini PM, Bernardi G. Mapping ofmotor cortical reorganization after stroke. A brain stimulation study
with focal magnetic pulses. Stroke 1997; 28: 110–17.
Wang L, Conner JM, Rickert J, Tuszynski MH. Structural plasticity withinhighly specific neuronal populations identifies a unique parcellation of
motor learning in the adult brain. Proc Natl Acad Sci USA 2011; 108:
2545–50.
Ward NS, Newton JM, Swayne OB, Lee L, Frackowiak RS, Thompson AJ,et al. The relationship between brain activity and peak grip force is
modulated by corticospinal system integrity after subcortical stroke.
Eur J Neurosci 2007; 25: 1865–73.
Ward NS, Newton JM, Swayne OB, Lee L, Thompson AJ, Greenwood RJ,et al. Motor system activation after subcortical stroke depends on
corticospinal system integrity. Brain 2006; 129: 809–19.
Weishaupt N, Silasi G, Colbourne F, Fouad K. Secondary damage in the
spinal cord after motor cortex injury in rats. J Neurotrauma 2010; 27:1387–97.
Werhahn KJ, Conforto AB, Kadom N, Hallett M, Cohen LG. Contribution
of the ipsilateral motor cortex to recovery after chronic stroke. AnnNeurol 2003; 54: 464–72.
Whishaw IQ. Loss of the innate cortical engram for action patterns used
in skilled reaching and the development of behavioral compensation
following motor cortex lesions in the rat. Neuropharmacology 2000;39: 788–805.
Whishaw IQ, Pellis SM. The structure of skilled forelimb reaching in
the rat: a proximally driven movement with a single distal rotatory
component. Behav Brain Res 1990; 41: 49–59.Whishaw IQ, Pellis SM, Gorny B, Kolb B, Tetzlaff W. Proximal and distal
impairments in rat forelimb use in reaching follow unilateral pyramidal
tract lesions. Behav Brain Res 1993; 56: 59–76.Winship IR, Murphy TH. In vivo calcium imaging reveals functional
rewiring of single somatosensory neurons after stroke. J Neurosci
2008; 28: 6592–606.
Wu CW, Kaas JH. Reorganization in primary motor cortex of primateswith long-standing therapeutic amputations. J Neuroscience 1999; 19:
7679–97.
Xerri C, Merzenich MM, Peterson BE, Jenkins W. Plasticity of primary
somatosensory cortex paralleling sensorimotor skill recovery fromstroke in adult monkeys. J Neurophysiol 1998; 79: 2119–48.
Z’Graggen WJ, Fouad K, Raineteau O, Metz GA, Schwab ME, Kartje GL.
Compensatory sprouting and impulse rerouting after unilateral pyram-
idal tract lesion in neonatal rats. J Neurosci 2000; 20: 6561–9.Zhang S, Boyd J, Delaney K, Murphy TH. Rapid reversible changes in
dendritic spine structure in vivo gated by the degree of ischemia. J
Neurosci 2005; 25: 5333–8.Zhang S, Murphy TH. Imaging the impact of cortical microcirculation on
synaptic structure and sensory-evoked hemodynamic responses
in vivo. PLoS Biol 2007; 5: e119.
Zhao BQ, Wang S, Kim HY, Storrie H, Rosen BR, Mooney DJ, et al. Roleof matrix metalloproteinases in delayed cortical responses after stroke.
Nature Med 2006; 12: 441–5.
Zorner B, Filli L, Starkey ML, Gonzenbach R, Kasper H, Rothlisberger M,
et al. Profiling locomotor recovery: comprehensive quantification ofimpairments after CNS damage in rodents. Nat Methods 2010; 7:
701–8.
Hindlimb cortex controls forelimb after stroke Brain 2012: 135; 3265–3281 | 3281
by guest on May 26, 2016
http://brain.oxfordjournals.org/D
ownloaded from
Top Related
Copyright © 2022 FDOKUMEN

