


Bahasa
Halaman
Hukum

ARC
P2009‐10NSY‐GAUTA
M‐FINALRE
PORT
]
1
FINAL REPORT for APN PROJECT
ARCP2009‐10NSY‐Gautam
The following collaborators worked on this project:
Chinta Mani Gautam, Nepal Development Research Institute, Nepal, Email: [email protected]
Teiji Watanabe, Hokkaido University, Japan, Email: [email protected]
Sunardi, Padjadjaran University, Indonesia, Email: [email protected]
AAsssseessssmmeenntt ooff RRoollee ooff
CCoommmmuunniittyy FFoorreessttss ((CCFFss))
iinn CCOO22 SSeeqquueessttrraattiioonn,,
BBiiooddiivveerrssiittyy aanndd LLaanndd
UUssee CChhaannggee
AAsssseessssmmeenntt ooff RRoollee ooff CCoommmmuunniittyy FFoorreessttss ((CCFFss)) iinn CCOO22
SSeeqquueessttrraattiioonn,, BBiiooddiivveerrssiittyy aanndd LLaanndd UUssee CChhaannggee Project Reference Number: ARCP2009‐10NSY‐Gautam Final Report submitted to APN
©Asia‐Pacific Network for Global Change Research
ARC
P2009‐10NSY‐GAUTA
M‐FINALRE
PORT
]
3
OVERVIEW OF PROJECT WORK AND OUTCOMES Non‐technical summary
Community Forestry, a successful program for protecting and rehabilitating the forests has received highest priority of all the programmes of Nepal’s forestry sector since 1978. Community Forests (CFs) are getting wide attention not only because they constitute a major component of livelihood in the rural areas but also due to emerging policy process such as mainstreaming the climate change issue in development agendas. However, the studies on CO2 sequestration, species diversity, and land use change relevant to CF are limited. Therefore, this study aimed to: estimate carbon deposit in forest, document tree species diversity, map land use change areas in selected CFs, and analyze the role of CFs in CO2 sequestration, biodiversity, and land use change. The major project activities included: review of relevant literature, Focus Group Discussion (FGD) and Participatory Rural Appraisal (PRA) regarding the process of land use change and knowledge of biodiversity among the locals, vegetation survey, interpretation of satellite images, analysis of biodiversity, estimation of carbon deposit, organization of stakeholder meeting and workshop in Kathmandu, and finally report writing. The study showed that CFs have been playing crucial role in increasing forest cover and tree density in public and private lands, and contributing to a substantial increment in carbon sequestration.
Objectives The main objectives of the project were:
• To estimate carbon deposit in selected CFs, • To document tree species diversity in selected CFs, • To map the land use change in selected CFUGs affected areas, and • To analyze the role of Community Forests in CO2 sequestration, biodiversity and land use
change.
Amount received and number years supported A total of US$ 38050 (Thirty eight thousand and fifty US Dollars) was awarded to this project for 2009/2010.
Activity undertaken
Major project activities undertaken were: • Review of literature, • Collection of the data and information of the 10 selected community forests,
Field work to verify the present boundaries, Questionnaire survey and PRA regarding the land use and biodiversity in CFs, Vegetation survey to record species and measure the diameter at breast
height (DBH) and height of the tree, • Analysis of biodiversity and estimation of carbon deposit, • Sharing of relevant information and knowledge from collaborative countries, and • Organization of stakeholder meeting and knowledge sharing workshop.
Results Key results are given below:
• CFs have been playing crucial role in increasing forest cover and tree density in public and private lands, and ultimately the sequester carbon,
• The community forest user groups (CFUGs) are unaware about the role of CFs on land use changes and carbon sequestration,
• Compared to other hilly areas of Nepal, the tree species diversity observed at the sites investigated was richer; nevertheless, some species were already extinct and some were largely depleted,
• The project provided CFUGs and other related stakeholders an opportunity to understand the possible benefits of CFs in terms of ecosystem services and carbon trading in addition to the silvicultural practices and social equity of which they were already aware,
• Land use change analysis between 1988 and 2009 in the selected areas of CFs showed great changes in forest and cultivated lands: increase in forest land and decrease in cultivated land in almost all studied areas, and
• Carbon deposit was found higher in climax than the secondary succession forests due to the presence of big sized trees.
Relevance to APN’s Science Agenda and objectives The project has addressed the three APN science agendas: climate, biodiversity and land use, and use of resources. Importance of sustainable CFs management is not only confined within local and national level, but also a matter of great concern at regional and global level. The growth and degradation of surface vegetation produces changes in the global atmospheric concentration of CO2; and changes in the land surface. This reflects a variation in surface energy budgets affecting local, regional and global climate. Besides, forest management was directly related to socio‐economic development and had several consequences in the regeneration process, community structure and plant diversity. CO2 emission and climate change are global issues and also related to CO2 sequestration capacity of CFs. As APN Strategic Plan 2005‐2010 emphasizes the needs to contribute to solving social and economic problems associated with global change, the project activity was considered highly relevant to APN mission. Regarding the policy agendas, the output of this project was anticipated to be useful for local/national/regional policy making process. The third important attribute of the project contributed in amending the CF operational plans and in raising the awareness of users and management authorities. In addition, participation of key experts from national and international level during the workshop was a major component towards addressing institutional agenda.
Self evaluation
A self evaluation was made as follows: • Altogether 10 Community Forest User Groups (CFUGs) in Nepal were selected for the
project activities. They are now aware on biodiversity and concept of carbon trading through the activities of this project,
• Awareness level of CFUGs, forest related authorities and development practitioners was also found to be enhanced,
• The analysis and investigations of initial stage indicated that majority of CFUG members are entirely unknown about the main component of this project; carbon trading and biodiversity,
• It was observed that the academic background of participants from CFUGs differed, therefore, the delivery of the content and concept of the project was not to the level as expected, and
ARC
P2009‐10NSY‐GAUTA
M‐FINALRE
PORT
]
5
• The analysis and investigations indicated a need of further research on a few aspects like REDD and CO2 sequestration.
Potential for further work
This study has opened the door for further work in incorporating climate change issues with community forests. If the similar study is continued on yearly basis, we can get the potential of the community forests in sequestering carbon dioxide. Also further work in such study can provide a database and a framework through which REDD (Reducing Emission from Deforestation and Degradation) can provide financial and livelihood benefits.
Publications A few publications are in progress. References Acknowledgments
Project team appreciates the help extended by Graduate school of Environmental Science, Hokkaido University, Japan and Institute of Ecology, Padjadjaran University, Indonesia to conduct the project activities. The contribution and support of chief executive officers and junior officers of the District Forest Offices and member of concerned CFUGs is also highly appreciated. Finally, we would like to extend sincere thanks to National Science Foundation (NSF) for financial support through APN.
6
ARC
P2009‐10NSY‐GAUTA
M‐FINALRE
PORT
TECHNICAL REPORT Preface This technical report titled “Assessment of Role of Community Forests (CFs) in CO2 Sequestration, Biodiversity, and Land Use Change” provides an overview of a research project executed by Nepal Development Research Institute (NDRI) and funded by Asia Pacific Network for Global Change Research. The findings of the report are based on the primary and secondary information collected from the selected 10 community forests in Nepal. The report also includes feedback/comments from the workshop. It is expected that the report in present form will be useful for further research studies.
……………………………………… Punya Prasad Regmi, PhD Executive Director
ARC
P2009‐10NSY‐GAUTA
M‐FINALRE
PORT
]
7
TABLE OF CONTENTS CHAPTER I………………………………………………………………………………………..10
Introduction.................................................................................................................11 1.1 Background.............................................................................................................................11 1.2 Objectives...............................................................................................................................11 1.3 Justification ............................................................................................................................12 1.4 Organization of the report.....................................................................................................12
CHAPTER II ………………………………………………………………………………………..13
Methodology ……………………………………………………………………………………..13 2.1 Selection of the community forests.......................................................................................13 2.2 Data collection and analysis...................................................................................................13 2.2.1 Land use change …………………………………………………………………………13 2.2.2 Biodiversity ………………………………………………………………………………14 2. 3 Carbon deposit………………………………………………………………………………………………………………….16 2.4 Assessment of role of CFs in CO2 sequestration, biodiversity, and land use change……………16 2.5 Interaction with stakeholders…………………………………………………………………………………………….16 2.6 Organization of a workshop………………………………………………………………………………………………..17 2.7 Desk analysis and report writing………………………………………………………………………………………….18
CHAPTER III .................................................................................................................. 19
Results & Discussion ...................................................................................................... 19 3.1 Results ................................................................................................................... 19 3.1.1 Land use change ................................................................................................ 19 3.1.2 Species composition and diversity ........................................................................ 23 3.2 Carbon deposit:…………………………………………………………………………………………………………………..27 3.3 Discussion……………………………………………………………………………………………………………………………27
CHAPTER IV .................................................................................................................. 31
Conclusions .................................................................................................................. 31
CHAPTER V ................................................................................................................... 32
Future Directions .......................................................................................................... 32
References ................................................................................................................... 33
8
ARC
P2009‐10NSY‐GAUTA
M‐FINALRE
PORT
LIST OF TABLES
Table 2.1 Selected community forests .................................................................... 13
Table 2.2 Number of sample plots for vegetation survey in each CF. ........................... 15
Table 3.1 General description of land use categories ................................................ 19
Table 3.2 Land use change in buffer area of Surke Salme Mahabhir CF ........................ 19
Table 3.3 Land use change in buffer area of Sulithumka CF ....................................... 20
Table 3.4 Land use change in buffer area of Seltap Mangalamai CF ............................ 20
Table 3.5 Land use change in buffer area of Indrayani Ka/Kha CF ............................... 21
Table 3.6 Land use change in buffer area of Dulbu CF ............................................... 21
Table 3.7 Land use change in buffer area of Diyale Dada CF ....................................... 21
Table 3.8 Land use change in buffer area of Shivanari CF .......................................... 22
Table 3.9 Land use change in buffer area of Chisapani CF .......................................... 22
Table 3.10 Land use change in buffer area of Ramche Bihare CF ................................ 23
Table 3.11 Land use change in buffer area of Kantheswara CF ................................... 23
Table 3.12 Stages of surveyed CFs ......................................................................... 24
Table 3.13 Dominant and co‐dominant species in the studied CFs .............................. 25
Table 3.14 Tree species diversity in the studied forests ............................................. 26
Table 3.15 Tree density, basal area and carbon deposit in the studied forest…………………27
Table 3.16 Summary of land use change in the studied CFs between 1988 and 2009.……28
ARC
P2009‐10NSY‐GAUTA
M‐FINALRE
PORT
]
9
LIST OF ANNEXES
Annex 1 : Landuse change between 1988 and 2009 in the studied forests Annex 2: Statistical summary of tree species in the studied forests Annex 3: Stakeholders meeting on “ assessment of role of communuty forests (CFs) in Co2 sequestration , biodiversity and landuse change ” Annex 4: List of participants of the stakeholder meeting Annex 5: Presentation slides of the stakeholder meeting Annex 6: List of photo of the stakeholder meeting Annex 7: Knowledge sharing international wokshop on ” Role of community forests in in Co2 sequestration, biodiversity and landuse change ” Annex 8: List of participants of the workshop Annex 9: Rappoter’s Report of the workshop Annex 10 Presentation slide of the workshop
10
ARC
P2009‐10NSY‐GAUTA
M‐FINALRE
PORT
Acronyms
CFP ‐ Community Forest Program
CFs – Community Forests
CFUGs‐ Community Forests User Groups
CO2 ‐ Carbon dioxide
CP ‐ Chisapani Community Forest
DB – Dulbu Community Forest
DBH – Diameter at breast height
DD ‐ Diyale Dada Community Forest
DFO‐ District Forest Office
GCPs – Ground Control Points
GPS – Global Positioning System
IMP – Importance Percentage
IPCC – Intergovernmental Panel on Climate Change
IY ‐ Indrayani Ka/Kha Community Forest
KS – Kantheswara Community Forest
NDRI – Nepal Development Research Institute
NGOs – Non Governmental Organizations
PRA – Participatory Rural Appraisal
RB – Ramche Bihare Community Forest
REDD – Reducing Emissions from Deforestration and Degradation
SM – Seltap Mangalmai Community Forest
SN ‐ Sivanari Community Forest
SSM – Salme Surke Mahabir Community Forest
ST ‐Sulithumka Community Forest
ARC
P2009‐10NSY‐GAUTA
M‐FINALRE
PORT
]
11
CHAPTER I
INTRODUCTION
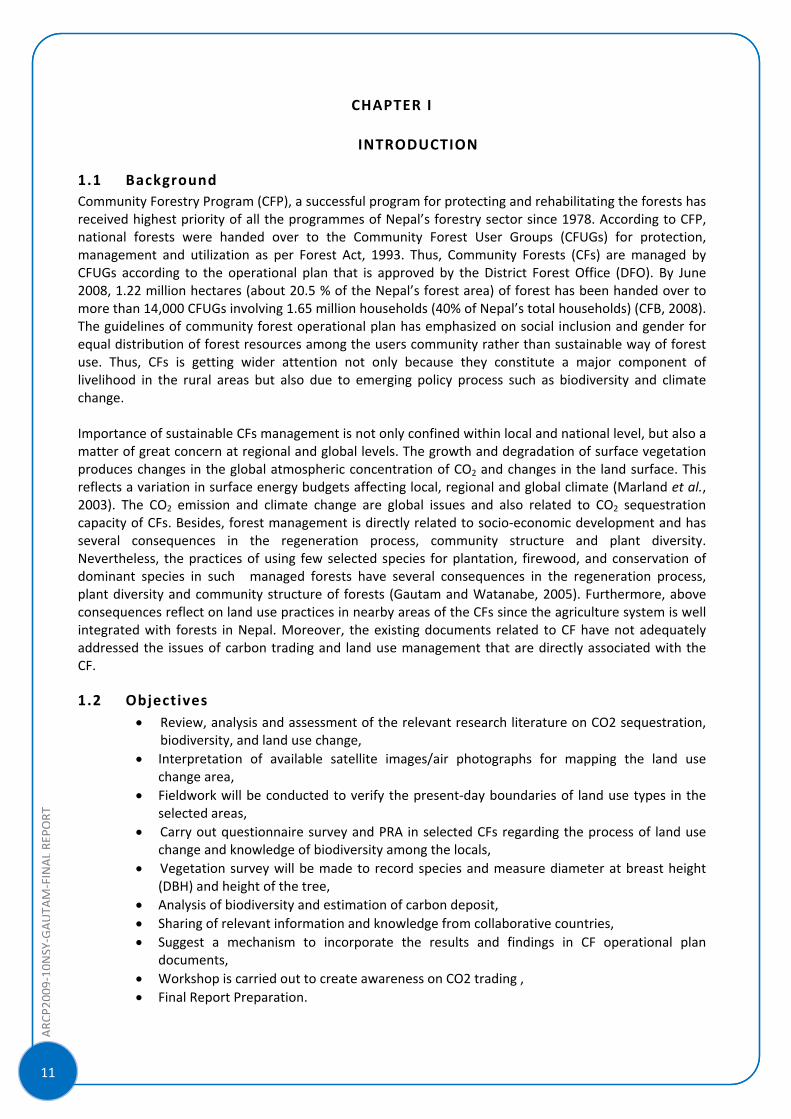
1.1 Background Community Forestry Program (CFP), a successful program for protecting and rehabilitating the forests has received highest priority of all the programmes of Nepal’s forestry sector since 1978. According to CFP, national forests were handed over to the Community Forest User Groups (CFUGs) for protection, management and utilization as per Forest Act, 1993. Thus, Community Forests (CFs) are managed by CFUGs according to the operational plan that is approved by the District Forest Office (DFO). By June 2008, 1.22 million hectares (about 20.5 % of the Nepal’s forest area) of forest has been handed over to more than 14,000 CFUGs involving 1.65 million households (40% of Nepal’s total households) (CFB, 2008). The guidelines of community forest operational plan has emphasized on social inclusion and gender for equal distribution of forest resources among the users community rather than sustainable way of forest use. Thus, CFs is getting wider attention not only because they constitute a major component of livelihood in the rural areas but also due to emerging policy process such as biodiversity and climate change. Importance of sustainable CFs management is not only confined within local and national level, but also a matter of great concern at regional and global levels. The growth and degradation of surface vegetation produces changes in the global atmospheric concentration of CO2 and changes in the land surface. This reflects a variation in surface energy budgets affecting local, regional and global climate (Marland et al., 2003). The CO2 emission and climate change are global issues and also related to CO2 sequestration capacity of CFs. Besides, forest management is directly related to socio‐economic development and has several consequences in the regeneration process, community structure and plant diversity. Nevertheless, the practices of using few selected species for plantation, firewood, and conservation of dominant species in such managed forests have several consequences in the regeneration process, plant diversity and community structure of forests (Gautam and Watanabe, 2005). Furthermore, above consequences reflect on land use practices in nearby areas of the CFs since the agriculture system is well integrated with forests in Nepal. Moreover, the existing documents related to CF have not adequately addressed the issues of carbon trading and land use management that are directly associated with the CF.
1.2 Objectives • Review, analysis and assessment of the relevant research literature on CO2 sequestration,
biodiversity, and land use change, • Interpretation of available satellite images/air photographs for mapping the land use
change area, • Fieldwork will be conducted to verify the present‐day boundaries of land use types in the
selected areas, • Carry out questionnaire survey and PRA in selected CFs regarding the process of land use
change and knowledge of biodiversity among the locals, • Vegetation survey will be made to record species and measure diameter at breast height
(DBH) and height of the tree, • Analysis of biodiversity and estimation of carbon deposit, • Sharing of relevant information and knowledge from collaborative countries, • Suggest a mechanism to incorporate the results and findings in CF operational plan
documents, • Workshop is carried out to create awareness on CO2 trading , • Final Report Preparation.
12
ARC
P2009‐10NSY‐GAUTA
M‐FINALRE
PORT
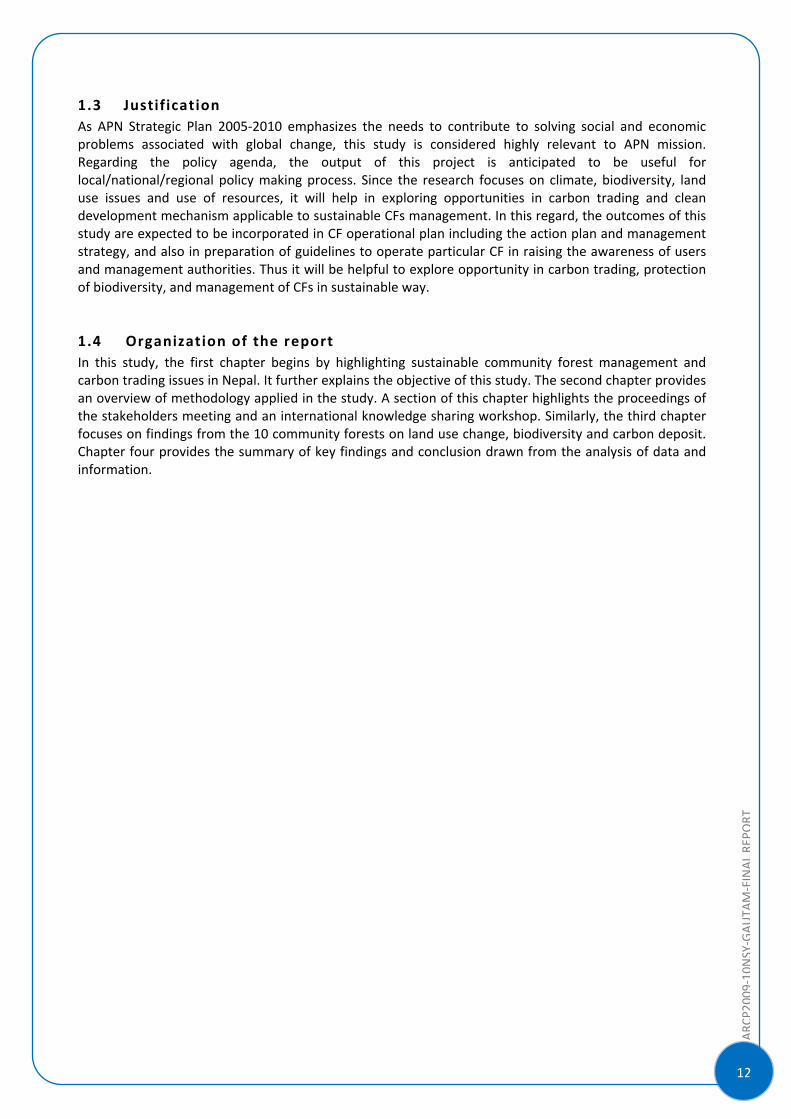
1.3 Justif ication As APN Strategic Plan 2005‐2010 emphasizes the needs to contribute to solving social and economic problems associated with global change, this study is considered highly relevant to APN mission. Regarding the policy agenda, the output of this project is anticipated to be useful for local/national/regional policy making process. Since the research focuses on climate, biodiversity, land use issues and use of resources, it will help in exploring opportunities in carbon trading and clean development mechanism applicable to sustainable CFs management. In this regard, the outcomes of this study are expected to be incorporated in CF operational plan including the action plan and management strategy, and also in preparation of guidelines to operate particular CF in raising the awareness of users and management authorities. Thus it will be helpful to explore opportunity in carbon trading, protection of biodiversity, and management of CFs in sustainable way.
1.4 Organization of the report In this study, the first chapter begins by highlighting sustainable community forest management and carbon trading issues in Nepal. It further explains the objective of this study. The second chapter provides an overview of methodology applied in the study. A section of this chapter highlights the proceedings of the stakeholders meeting and an international knowledge sharing workshop. Similarly, the third chapter focuses on findings from the 10 community forests on land use change, biodiversity and carbon deposit. Chapter four provides the summary of key findings and conclusion drawn from the analysis of data and information.
ARC
P2009‐10NSY‐GAUTA
M‐FINALRE
PORT
]
13
CHAPTER II
METHODOLOGY
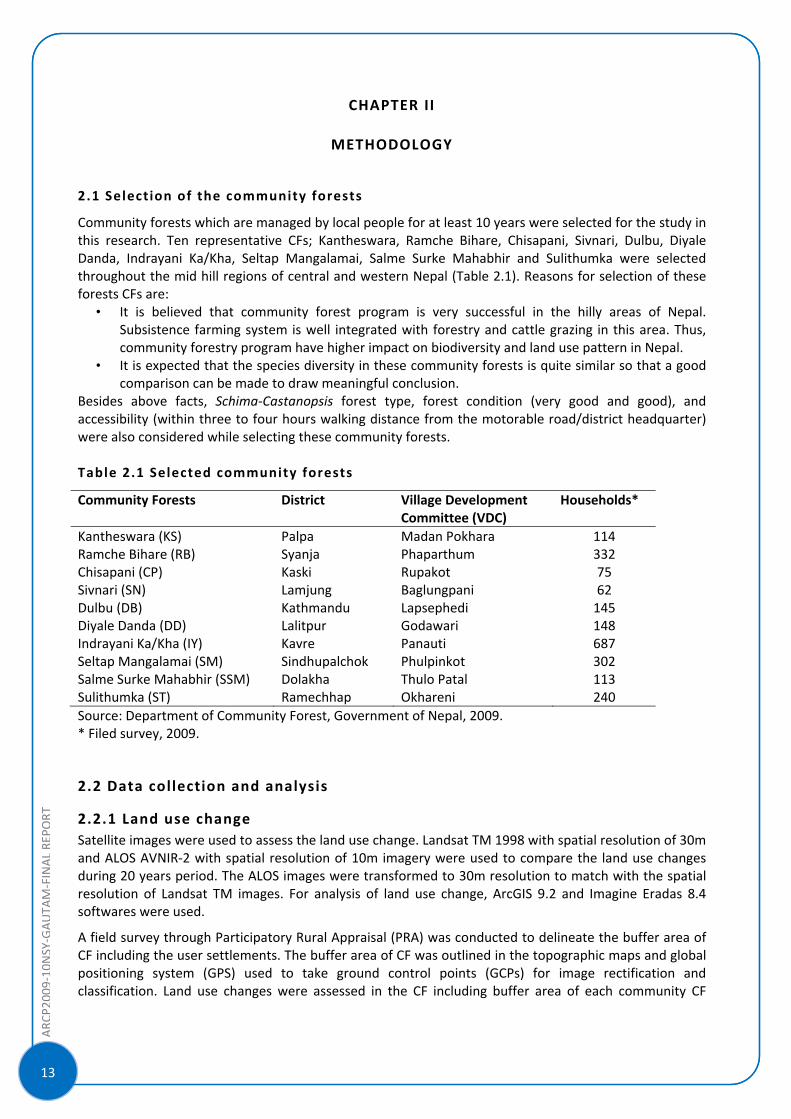
2.1 Selection of the community forests
Community forests which are managed by local people for at least 10 years were selected for the study in this research. Ten representative CFs; Kantheswara, Ramche Bihare, Chisapani, Sivnari, Dulbu, Diyale Danda, Indrayani Ka/Kha, Seltap Mangalamai, Salme Surke Mahabhir and Sulithumka were selected throughout the mid hill regions of central and western Nepal (Table 2.1). Reasons for selection of these forests CFs are:
• It is believed that community forest program is very successful in the hilly areas of Nepal. Subsistence farming system is well integrated with forestry and cattle grazing in this area. Thus, community forestry program have higher impact on biodiversity and land use pattern in Nepal.
• It is expected that the species diversity in these community forests is quite similar so that a good comparison can be made to draw meaningful conclusion.
Besides above facts, Schima‐Castanopsis forest type, forest condition (very good and good), and accessibility (within three to four hours walking distance from the motorable road/district headquarter) were also considered while selecting these community forests. Table 2.1 Selected community forests
Community Forests District Village Development Committee (VDC)
Households*
Kantheswara (KS) Ramche Bihare (RB) Chisapani (CP) Sivnari (SN) Dulbu (DB) Diyale Danda (DD) Indrayani Ka/Kha (IY) Seltap Mangalamai (SM) Salme Surke Mahabhir (SSM) Sulithumka (ST)
Palpa Syanja Kaski Lamjung Kathmandu Lalitpur Kavre Sindhupalchok Dolakha Ramechhap
Madan Pokhara Phaparthum Rupakot Baglungpani Lapsephedi Godawari Panauti Phulpinkot Thulo Patal Okhareni
114 332 75 62 145 148 687 302 113 240
Source: Department of Community Forest, Government of Nepal, 2009. * Filed survey, 2009.
2.2 Data collection and analysis
2.2.1 Land use change Satellite images were used to assess the land use change. Landsat TM 1998 with spatial resolution of 30m and ALOS AVNIR‐2 with spatial resolution of 10m imagery were used to compare the land use changes during 20 years period. The ALOS images were transformed to 30m resolution to match with the spatial resolution of Landsat TM images. For analysis of land use change, ArcGIS 9.2 and Imagine Eradas 8.4 softwares were used.
A field survey through Participatory Rural Appraisal (PRA) was conducted to delineate the buffer area of CF including the user settlements. The buffer area of CF was outlined in the topographic maps and global positioning system (GPS) used to take ground control points (GCPs) for image rectification and classification. Land use changes were assessed in the CF including buffer area of each community CF
14
ARC
P2009‐10NSY‐GAUTA
M‐FINALRE
PORT
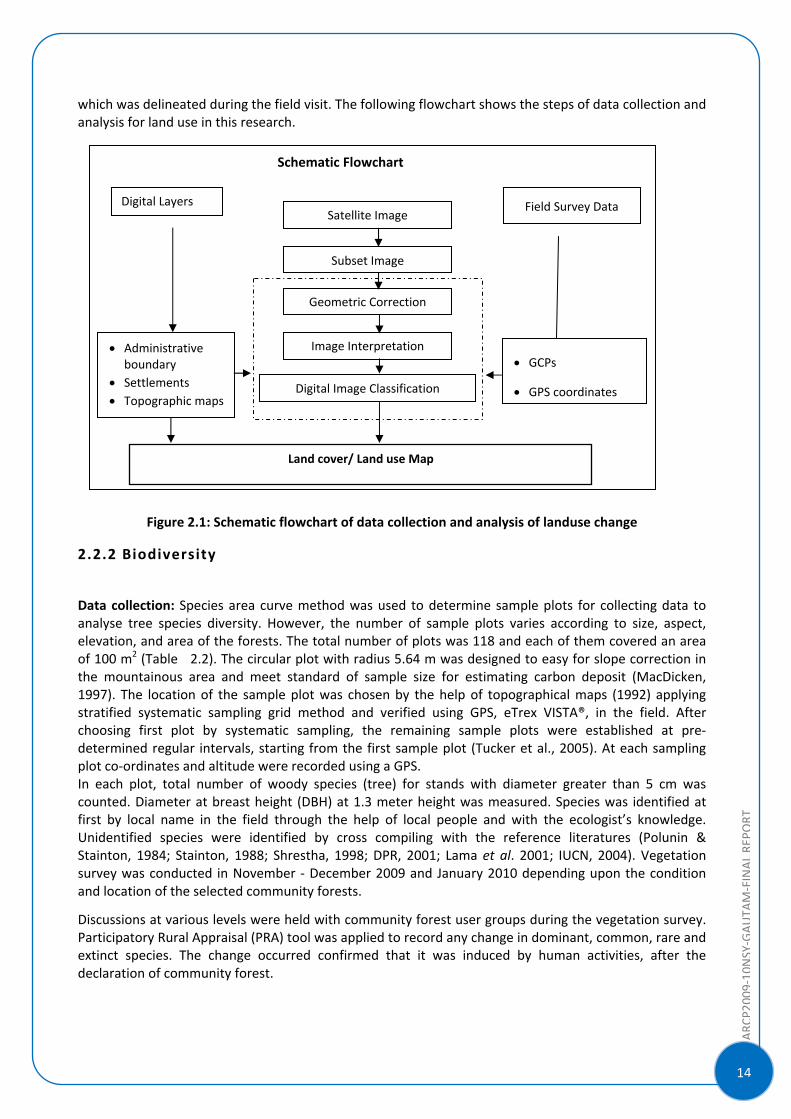
which was delineated during the field visit. The following flowchart shows the steps of data collection and analysis for land use in this research.
Figure 2.1: Schematic flowchart of data collection and analysis of landuse change
2.2.2 Biodiversity
Data collection: Species area curve method was used to determine sample plots for collecting data to analyse tree species diversity. However, the number of sample plots varies according to size, aspect, elevation, and area of the forests. The total number of plots was 118 and each of them covered an area of 100 m2 (Table 2.2). The circular plot with radius 5.64 m was designed to easy for slope correction in the mountainous area and meet standard of sample size for estimating carbon deposit (MacDicken, 1997). The location of the sample plot was chosen by the help of topographical maps (1992) applying stratified systematic sampling grid method and verified using GPS, eTrex VISTA®, in the field. After choosing first plot by systematic sampling, the remaining sample plots were established at pre‐determined regular intervals, starting from the first sample plot (Tucker et al., 2005). At each sampling plot co‐ordinates and altitude were recorded using a GPS. In each plot, total number of woody species (tree) for stands with diameter greater than 5 cm was counted. Diameter at breast height (DBH) at 1.3 meter height was measured. Species was identified at first by local name in the field through the help of local people and with the ecologist’s knowledge. Unidentified species were identified by cross compiling with the reference literatures (Polunin & Stainton, 1984; Stainton, 1988; Shrestha, 1998; DPR, 2001; Lama et al. 2001; IUCN, 2004). Vegetation survey was conducted in November ‐ December 2009 and January 2010 depending upon the condition and location of the selected community forests.
Discussions at various levels were held with community forest user groups during the vegetation survey. Participatory Rural Appraisal (PRA) tool was applied to record any change in dominant, common, rare and extinct species. The change occurred confirmed that it was induced by human activities, after the declaration of community forest.
Field Survey Data
• GCPs
• GPS coordinates
Digital Layers
• Administrative boundary
• Settlements • Topographic maps
Satellite Image
Subset Image
Geometric Correction
Image Interpretation
Digital Image Classification
Land cover/ Land use Map
Schematic Flowchart
ARC
P2009‐10NSY‐GAUTA
M‐FINALRE
PORT
]
15
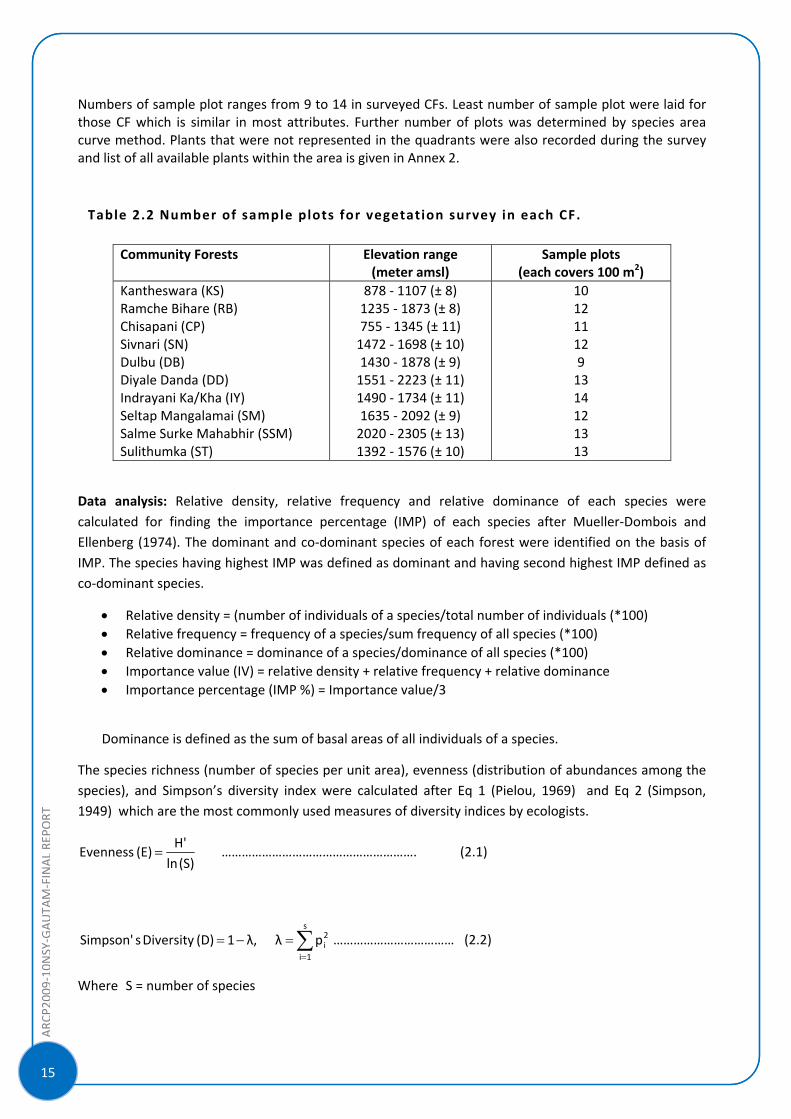
Numbers of sample plot ranges from 9 to 14 in surveyed CFs. Least number of sample plot were laid for those CF which is similar in most attributes. Further number of plots was determined by species area curve method. Plants that were not represented in the quadrants were also recorded during the survey and list of all available plants within the area is given in Annex 2.
Table 2.2 Number of sample plots for vegetation survey in each CF.
Data analysis: Relative density, relative frequency and relative dominance of each species were calculated for finding the importance percentage (IMP) of each species after Mueller‐Dombois and Ellenberg (1974). The dominant and co‐dominant species of each forest were identified on the basis of IMP. The species having highest IMP was defined as dominant and having second highest IMP defined as co‐dominant species.
• Relative density = (number of individuals of a species/total number of individuals (*100) • Relative frequency = frequency of a species/sum frequency of all species (*100) • Relative dominance = dominance of a species/dominance of all species (*100) • Importance value (IV) = relative density + relative frequency + relative dominance • Importance percentage (IMP %) = Importance value/3
Dominance is defined as the sum of basal areas of all individuals of a species.
The species richness (number of species per unit area), evenness (distribution of abundances among the species), and Simpson’s diversity index were calculated after Eq 1 (Pielou, 1969) and Eq 2 (Simpson, 1949) which are the most commonly used measures of diversity indices by ecologists.
(S) lnH'
(E) Evenness = …………………………………………………. (2.1)
∑=
=−=s
1i
2ipλλ,1(D) Diversity sSimpson' ……………………………… (2.2)
Where S = number of species
Community Forests Elevation range (meter amsl)
Sample plots (each covers 100 m2)
Kantheswara (KS) Ramche Bihare (RB) Chisapani (CP) Sivnari (SN) Dulbu (DB) Diyale Danda (DD) Indrayani Ka/Kha (IY) Seltap Mangalamai (SM) Salme Surke Mahabhir (SSM) Sulithumka (ST)
878 ‐ 1107 (± 8) 1235 ‐ 1873 (± 8) 755 ‐ 1345 (± 11) 1472 ‐ 1698 (± 10) 1430 ‐ 1878 (± 9) 1551 ‐ 2223 (± 11) 1490 ‐ 1734 (± 11) 1635 ‐ 2092 (± 9) 2020 ‐ 2305 (± 13) 1392 ‐ 1576 (± 10)
10 12 11 12 9 13 14 12 13 13
16
ARC
P2009‐10NSY‐GAUTA
M‐FINALRE
PORT
ln = natural logarithm
n = total number of individuals in the area
pi = the proportion of individuals found in the species
λ = Simpson’s concentration of dominance
2. 3 Carbon deposit Estimation of carbon in forest was made according to the standards set by the IPCC (2003) for the Land Use, Land Use Change and Forestry (LULUCF) sector. For that, A Guide to Monitoring Carbon Storage in Forestry and Agro‐forestry Projects developed by MacDicken (1997) were reviewed carefully. However, the carbon estimation for Nepal is based on standard forest inventory principles and techniques, with minor differences to suit differing field conditions, forest types, local forest management, and available technical resources (Banskota et al., 2007).
Biomass estimation: To estimate above ground biomass of trees, the national allometric biomass tables developed by the Department of Forest Research and Survey and Department of Forest, Tree Improvement and Silviculture Component, were used. This table had simplified equations that required only DBH as a single input variable to calculate biomass of the tree species. Since the allometric table does not contain all species found in the studied CFs, value of similar species was used. Biomass of species not covered by allometric table was primarily grouped as per the genus, family and other similar characteristics and then the value of similar genera was used for the biomass calculation. For below ground biomass, root: shoot ratio value of 0.125 was used (Tewari and Karky, 2007). Fifty percent of the biomass was taken as the carbon deposit (MacDicken, 1997).
2.4 Assessment of role of CFs in CO2 sequestration, biodiversity, and land use change
To assess the role of CFs in CO2 sequestration, biodiversity, and land use change, following activities were conducted:
- The results of land use change and tree species diversity obtained from this study were verified with the consultation of CFUGs through stakeholder meeting.
- Discussion was made with CFUGs about the land use change and tree species diversity to confirm whether the change was due to community forest or any other factors.
- Awareness program in carbon measurement and trading was conducted among the studied community user groups and documented their knowledge about this matter.
- The role of community forests in land use change and biodiversity were assessed based on results obtained.
2.5 Interaction with stakeholders NDRI arranged a stakeholder meeting titled "Assessment of Role of Community Forests (CFs) in CO2 Sequestration, Biodiversity, and Land Use Change” on April 25, 2010 in Dhulikhel, Nepal. The main objective of the stakeholder meeting was to discuss the importance of community forests in CO2 sequestration and biodiversity and to share the knowledge/ finding of the project so far. A total of 27 participants including chairperson from different community forest user groups (CFUGs), government authorities and other concerned stakeholders attended the meeting. The meeting consisted of two sessions; opening session and technical session. Dr. Tara Nidhi Bhattarai, President of NDRI chaired the opening session. Dr. Punya Prasad Regmi, Coordinator (Policy Studies) of
ARC
P2009‐10NSY‐GAUTA
M‐FINALRE
PORT
]
17
NDRI delivered the welcome speech on behalf of NDRI. The programme was inaugurated by lighting the panas by chief guest Secretary of Ministry of Forestry and Soil conservation, Mr. Yubaraj Bhusal which was followed by the opening remarks. He emphasized the need of coordination between government and private sector in materializing the carbon trading from community forest. Dr. Chintamani Gautam, Project Leader presented a background paper highlighting the brief introduction of the project, study site and aim of the project. Dr. Nawa Raj Khatiwada, the then Executive Director presented the brief introduction of NDRI which was followed by the presentation of Mr. Ram Asheshwar Mandal, Forest Officer, REDD‐Forest and Climate Change Cell, on "Climate Change in Nepal and preparation of REDD for Climate Change" highlighting the present status of REDD in Nepal. Finally, Dr. Tara Nidhi Bhattarai, President of NDRI delivered the vote of thanks and concluded the opening session. The technical session consisted of a joint paper presentation by three team members on the results and findings of the project. Dr. Chintamani Gautam, Project Leader presented first part titled "Income generating successful project and Climate Change" was followed by Mr. Dipesh Pyakurel, Ecologist on “Biodiversity and CO2 Sequestration ". Third part was presented by Mr. Man Bahadur Kshetri, Senior Research Associate, NDRI on “Landuse” All the presentations were followed by discussion where participants put forward their queries regarding the project. After the presentation, a group work was assigned to the participants and the results were discussed by the team members. Finally, Dr. Tara Nidhi Bhattarai thanked all the participants and adjourned the event. The program was evidenced by the active participation from the CFUGs and other stakeholders. Ms. Sriju Sharma, Research Associate of NDRI served as a Master of Ceremony/Facilitator during the whole event.
2.6 Organization of a workshop NDRI organized a one day knowledge sharing international workshop titled “Role of Community Forests in CO2 Sequestration, Biodiversity and Land Use Change” on June 28, 2010 in Kathmandu. The main objective of the workshop was to discuss and share knowledge on the importance of community forests in sequestering carbon dioxide, conservation of biodiversity and its impact on land use changes. A total of 78 participants from different sectors including government authorities, national and international organizations, academic and research institutions attended the program. International participants from Japan, Indonesia, Thailand and India were also present. The workshop consisted of three sessions; opening session, technical session and a panel discussion. The opening session was chaired by Dr. Tara Nidhi Bhattrai, President of NDRI and inaugurated by the chief guest Dr. Ganesh Raj Joshi, Secretary, Ministry of Environment. On the occasion, Dr. Jaya Kumar Gurung, member of NDRI welcomed all the participants and brief introduction of NDRI was presented by Dr. Punya Prasad Regmi, Executive Director of NDRI. Dr. Shovakar Dhakal, Executive Director of Global Carbon Project, National Institute for Environmental Studies, Japan delivered the Keynote address on “Global trends of carbon emissions and sinks with emphasis on land use change and the inter‐linkages”. He highlighted on the global scenario of the carbon concentration, present issues and benefits from REDD+. Dr. Ganesh Raj Joshi delivered the opening remarks and congratulated NDRI for its achievement in such a short period of time. He highlighted the recent work done by the ministry to combat the impacts of climate change. Finally, Dr. Bhattarai delivered the vote of thanks and concluded the opening session. Ms. Sriju Sharma served as a Master of Ceremony of the event. The first technical session was chaired by Dr. Laxmi P. Devkota, NDRI member and former NPC member that consisted of two presentations. The first presentation was on the findings of the APN‐NDRI joint study on Role of Community Forests in CO2 Sequestration, Biodiversity and Land Use by Dr. Nawa Raj Khatiwada, Mr. Dipesh Pyakurel and Mr. Man Bahadur Kshetri. Second presentation was regarding the Status of REDD in Nepal by Mr. Ram Asheshwor Mandal, Forest Officer from REDD and Climate change
18
ARC
P2009‐10NSY‐GAUTA
M‐FINALRE
PORT
cell, ministry of forests and soil conservation. At the end of the technical session there was a floor discussion where participants put forward their queries. The second session chaired by Dr. Sunil Babu Shrestha, NDRI member and former NPC member consisted of three presentations followed by the floor discussion. Foreign participants from Thailand, Indonesia and India presented the paper on Recent developments on REDD and forestry sector representing their respective countries. Speakers included Mr. Dendi Muhamad from IOE, Indonesia, Dr. Qwanruedee Chotichanathawewong, Assistant President from Thailand Environment Institute and Dr. Puja Sawhney from New Dehli, India. Many participants expressed their views and provided feedback during the discussion. Finally, there was a Panel discussion session on the topic “Prospects of Regional Collaboration on REDD and Forestry” which was chaired by Mr. Resham Bahadhur Dangi, Joint Secretary in Ministry of forests and soil conservation and all the speakers served as a panelist. At the end of the programme, Dr. Punya Prasad Regmi thanked all the participants, guests and the organizers for their contribution for the successful completion of the event. 2.7 Desk analysis and report writing
Field study and desk analysis were performed to visualize the management of community forests. Literature and research papers were reviewed in a team to extract major information and methodologies relevant to the study objectives. Data were analyzed using different software. In addition to this, a stakeholders meeting and knowledge sharing international workshop was also organised in Kathmandu.
ARC
P2009‐10NSY‐GAUTA
M‐FINALRE
PORT
]
19
CHAPTER I I I
RESULTS & DISCUSSION
3.1 Results
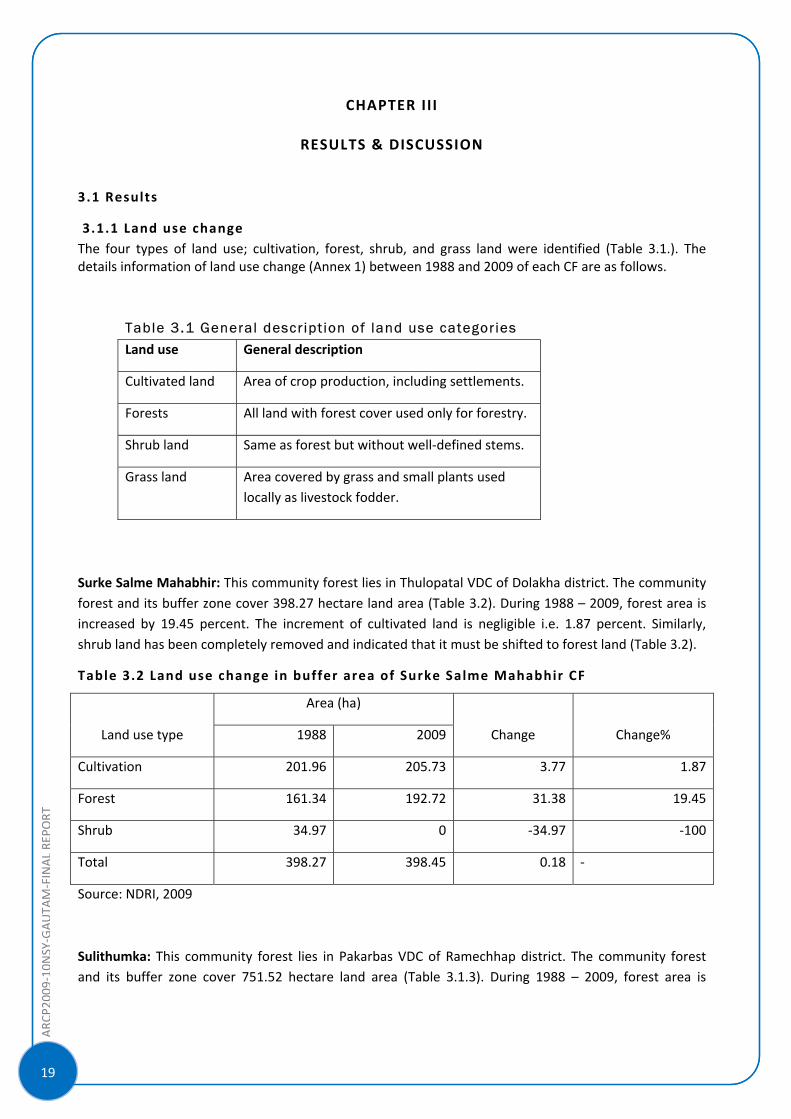
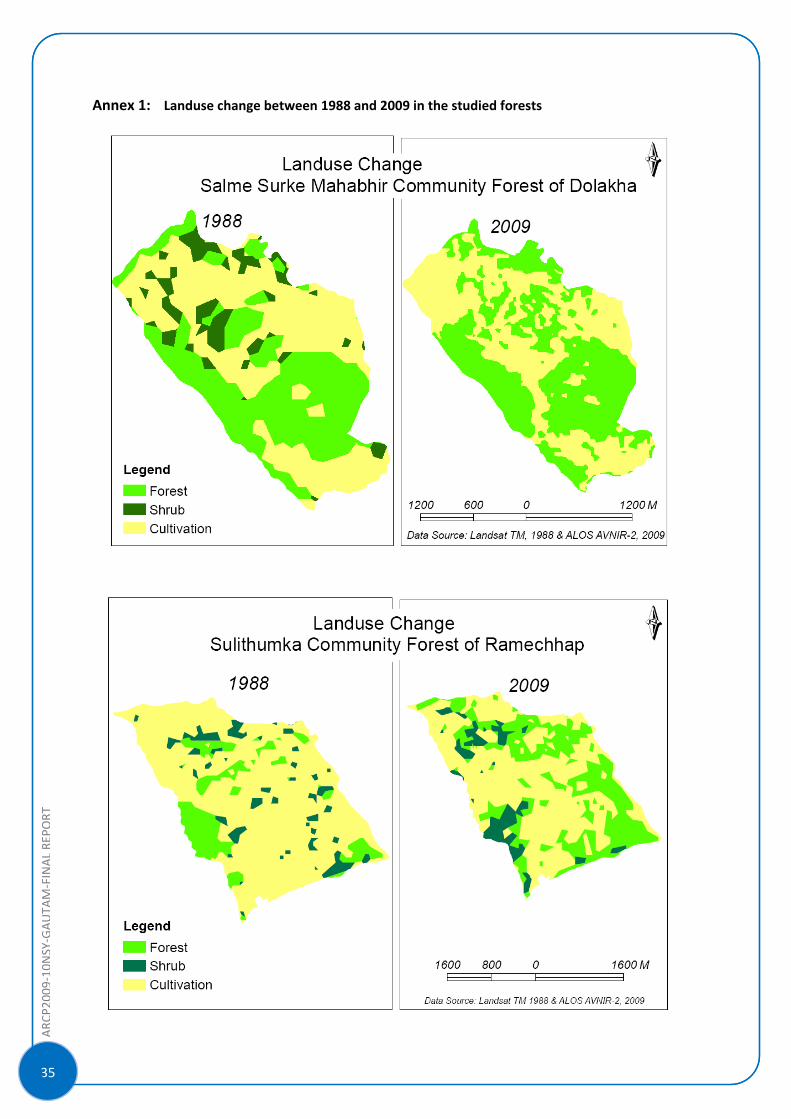
3.1.1 Land use change The four types of land use; cultivation, forest, shrub, and grass land were identified (Table 3.1.). The details information of land use change (Annex 1) between 1988 and 2009 of each CF are as follows.
Surke Salme Mahabhir: This community forest lies in Thulopatal VDC of Dolakha district. The community forest and its buffer zone cover 398.27 hectare land area (Table 3.2). During 1988 – 2009, forest area is increased by 19.45 percent. The increment of cultivated land is negligible i.e. 1.87 percent. Similarly, shrub land has been completely removed and indicated that it must be shifted to forest land (Table 3.2).
Table 3.2 Land use change in buffer area of Surke Salme Mahabhir CF
Land use type
Area (ha)
Change Change% 1988 2009
Cultivation 201.96 205.73 3.77 1.87
Forest 161.34 192.72 31.38 19.45
Shrub 34.97 0 ‐34.97 ‐100
Total 398.27 398.45 0.18 ‐
Source: NDRI, 2009
Sulithumka: This community forest lies in Pakarbas VDC of Ramechhap district. The community forest and its buffer zone cover 751.52 hectare land area (Table 3.1.3). During 1988 – 2009, forest area is
Table 3.1 General descript ion of land use categories Land use General description
Cultivated land Area of crop production, including settlements.
Forests All land with forest cover used only for forestry.
Shrub land Same as forest but without well‐defined stems.
Grass land Area covered by grass and small plants used locally as livestock fodder.
20
ARC
P2009‐10NSY‐GAUTA
M‐FINALRE
PORT
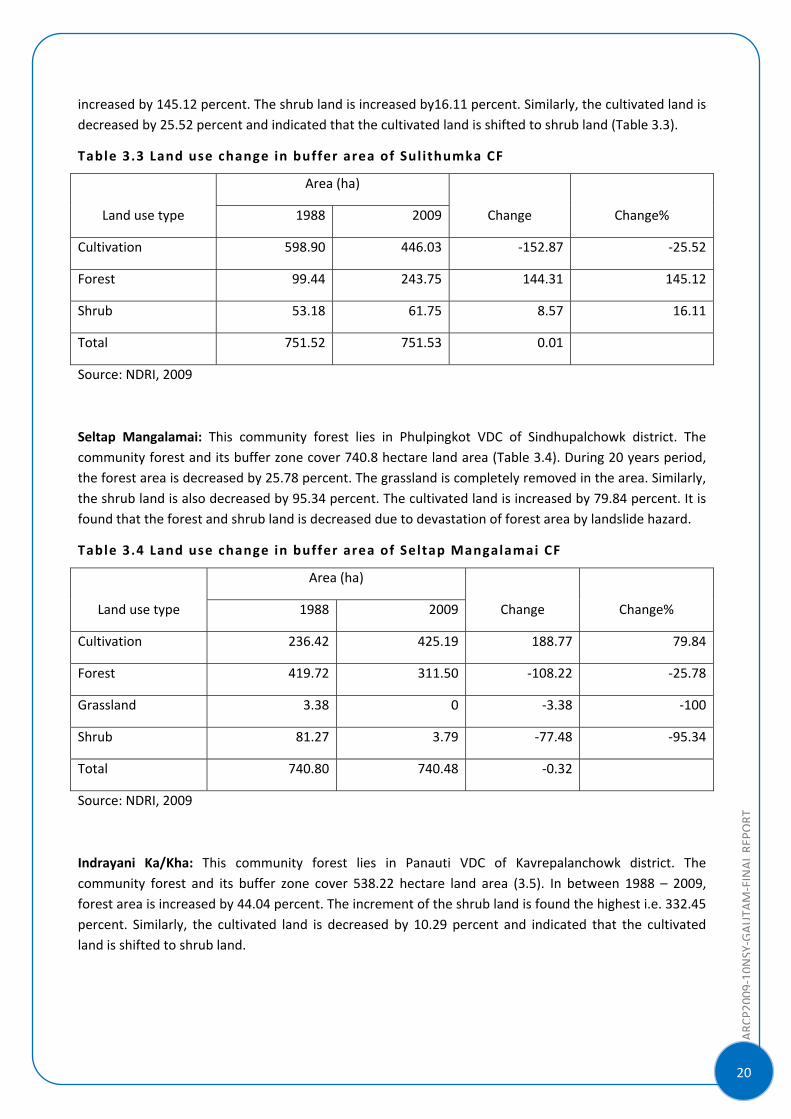
increased by 145.12 percent. The shrub land is increased by16.11 percent. Similarly, the cultivated land is decreased by 25.52 percent and indicated that the cultivated land is shifted to shrub land (Table 3.3).
Table 3.3 Land use change in buffer area of Sulithumka CF
Land use type
Area (ha)
Change Change% 1988 2009
Cultivation 598.90 446.03 ‐152.87 ‐25.52
Forest 99.44 243.75 144.31 145.12
Shrub 53.18 61.75 8.57 16.11
Total 751.52 751.53 0.01
Source: NDRI, 2009
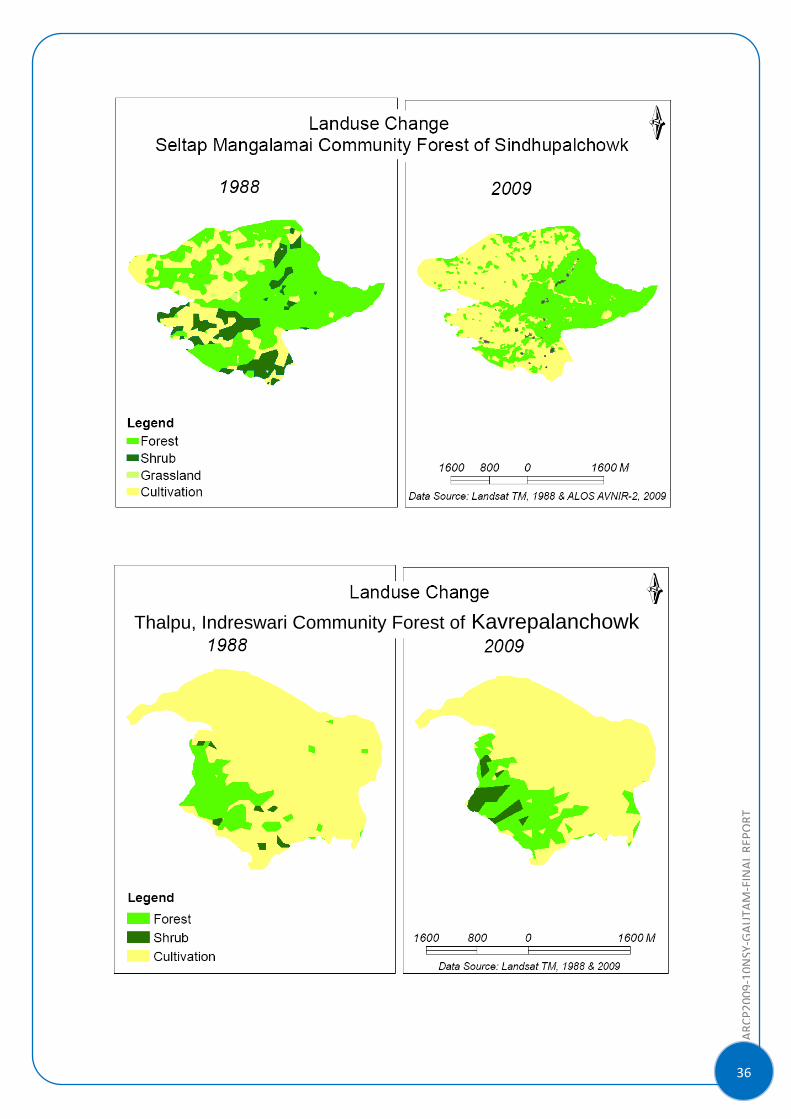
Seltap Mangalamai: This community forest lies in Phulpingkot VDC of Sindhupalchowk district. The community forest and its buffer zone cover 740.8 hectare land area (Table 3.4). During 20 years period, the forest area is decreased by 25.78 percent. The grassland is completely removed in the area. Similarly, the shrub land is also decreased by 95.34 percent. The cultivated land is increased by 79.84 percent. It is found that the forest and shrub land is decreased due to devastation of forest area by landslide hazard.
Table 3.4 Land use change in buffer area of Seltap Mangalamai CF
Land use type
Area (ha)
Change Change% 1988 2009
Cultivation 236.42 425.19 188.77 79.84
Forest 419.72 311.50 ‐108.22 ‐25.78
Grassland 3.38 0 ‐3.38 ‐100
Shrub 81.27 3.79 ‐77.48 ‐95.34
Total 740.80 740.48 ‐0.32
Source: NDRI, 2009
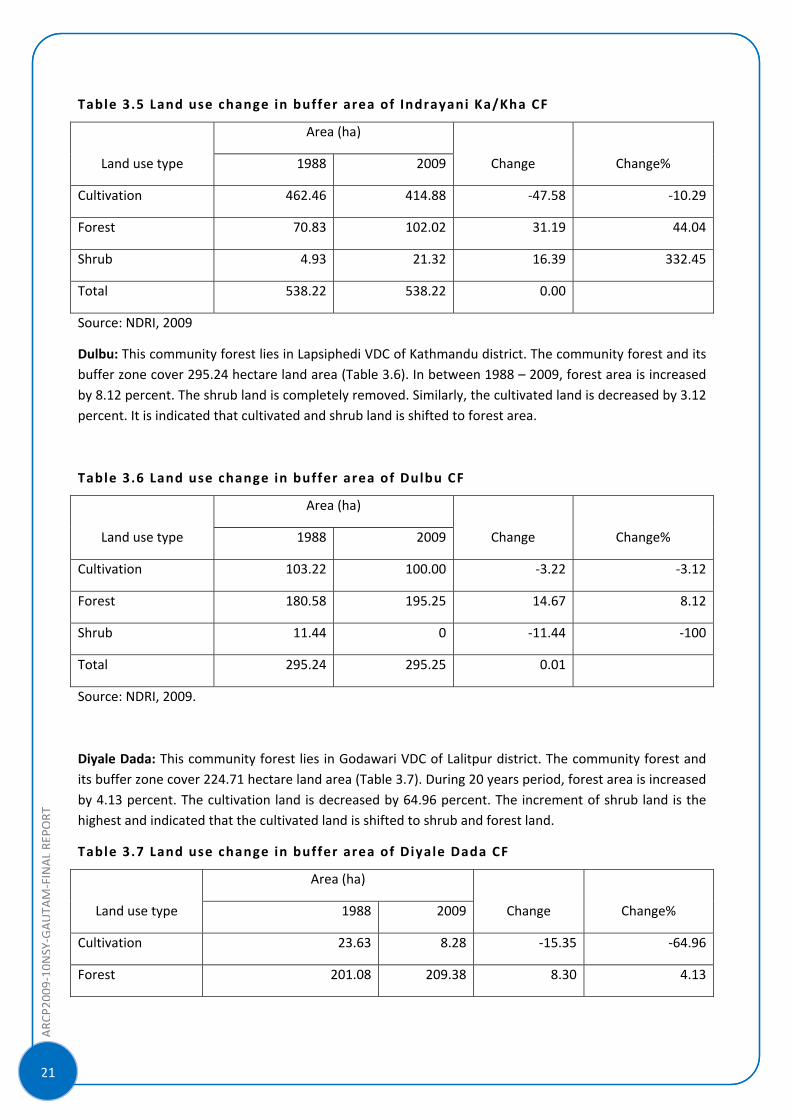
Indrayani Ka/Kha: This community forest lies in Panauti VDC of Kavrepalanchowk district. The community forest and its buffer zone cover 538.22 hectare land area (3.5). In between 1988 – 2009, forest area is increased by 44.04 percent. The increment of the shrub land is found the highest i.e. 332.45 percent. Similarly, the cultivated land is decreased by 10.29 percent and indicated that the cultivated land is shifted to shrub land.
ARC
P2009‐10NSY‐GAUTA
M‐FINALRE
PORT
]
21
Table 3.5 Land use change in buffer area of Indrayani Ka/Kha CF
Land use type
Area (ha)
Change Change% 1988 2009
Cultivation 462.46 414.88 ‐47.58 ‐10.29
Forest 70.83 102.02 31.19 44.04
Shrub 4.93 21.32 16.39 332.45
Total 538.22 538.22 0.00
Source: NDRI, 2009
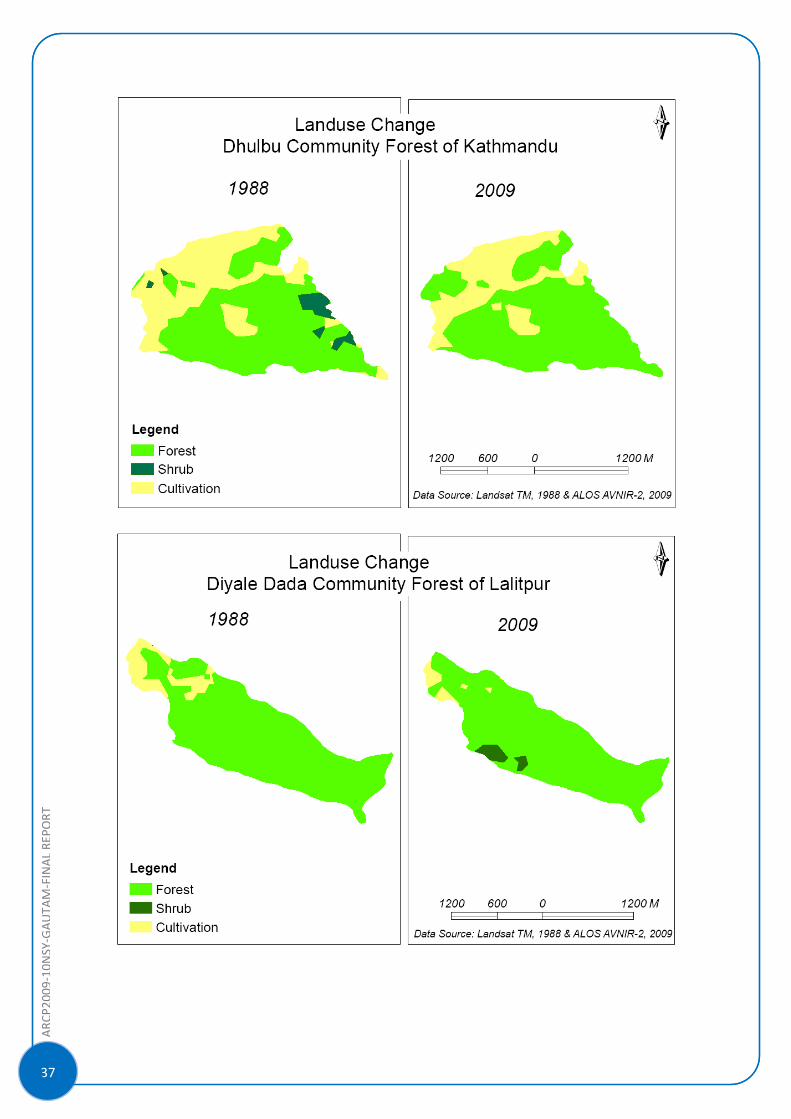
Dulbu: This community forest lies in Lapsiphedi VDC of Kathmandu district. The community forest and its buffer zone cover 295.24 hectare land area (Table 3.6). In between 1988 – 2009, forest area is increased by 8.12 percent. The shrub land is completely removed. Similarly, the cultivated land is decreased by 3.12 percent. It is indicated that cultivated and shrub land is shifted to forest area.
Table 3.6 Land use change in buffer area of Dulbu CF
Land use type
Area (ha)
Change Change% 1988 2009
Cultivation 103.22 100.00 ‐3.22 ‐3.12
Forest 180.58 195.25 14.67 8.12
Shrub 11.44 0 ‐11.44 ‐100
Total 295.24 295.25 0.01
Source: NDRI, 2009.
Diyale Dada: This community forest lies in Godawari VDC of Lalitpur district. The community forest and its buffer zone cover 224.71 hectare land area (Table 3.7). During 20 years period, forest area is increased by 4.13 percent. The cultivation land is decreased by 64.96 percent. The increment of shrub land is the highest and indicated that the cultivated land is shifted to shrub and forest land.
Table 3.7 Land use change in buffer area of Diyale Dada CF
Land use type
Area (ha)
Change Change% 1988 2009
Cultivation 23.63 8.28 ‐15.35 ‐64.96
Forest 201.08 209.38 8.30 4.13
22
ARC
P2009‐10NSY‐GAUTA
M‐FINALRE
PORT
Shrub 0.00092 7.04 7.04 764369.5
Total 224.71 224.70
Source: NDRI, 2009
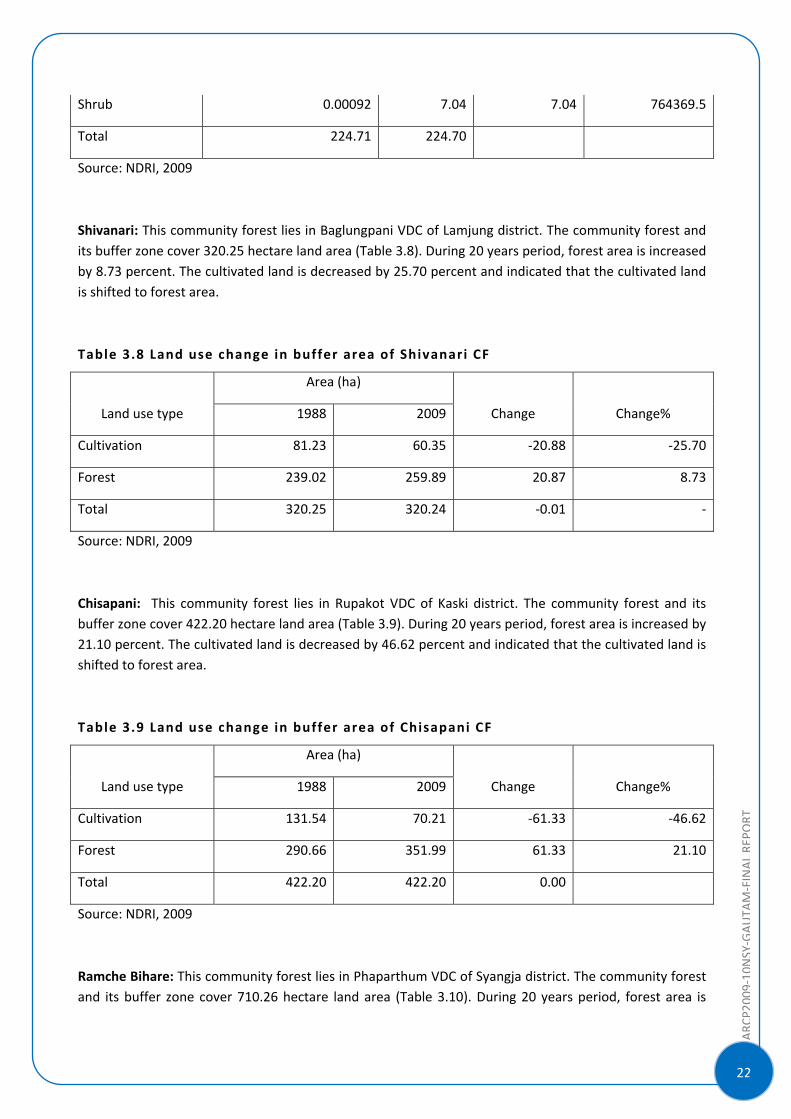
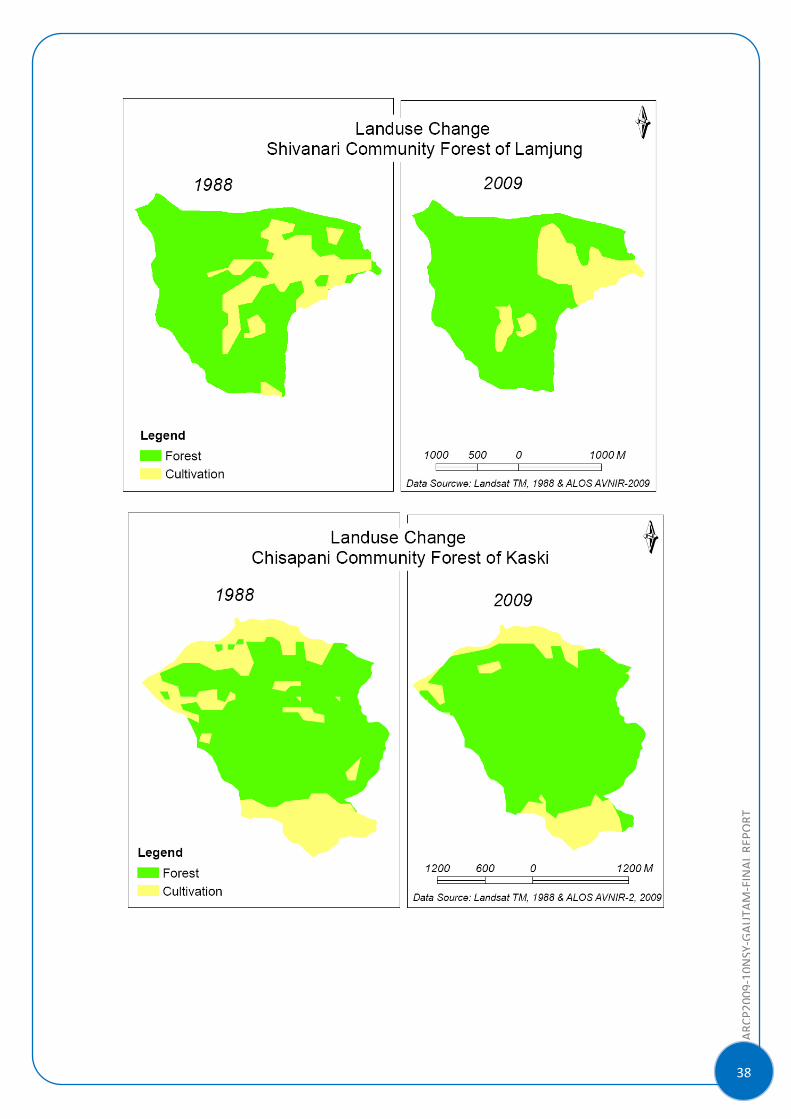
Shivanari: This community forest lies in Baglungpani VDC of Lamjung district. The community forest and its buffer zone cover 320.25 hectare land area (Table 3.8). During 20 years period, forest area is increased by 8.73 percent. The cultivated land is decreased by 25.70 percent and indicated that the cultivated land is shifted to forest area.
Table 3.8 Land use change in buffer area of Shivanari CF
Land use type
Area (ha)
Change Change% 1988 2009
Cultivation 81.23 60.35 ‐20.88 ‐25.70
Forest 239.02 259.89 20.87 8.73
Total 320.25 320.24 ‐0.01 ‐
Source: NDRI, 2009
Chisapani: This community forest lies in Rupakot VDC of Kaski district. The community forest and its buffer zone cover 422.20 hectare land area (Table 3.9). During 20 years period, forest area is increased by 21.10 percent. The cultivated land is decreased by 46.62 percent and indicated that the cultivated land is shifted to forest area.
Table 3.9 Land use change in buffer area of Chisapani CF
Land use type
Area (ha)
Change Change% 1988 2009
Cultivation 131.54 70.21 ‐61.33 ‐46.62
Forest 290.66 351.99 61.33 21.10
Total 422.20 422.20 0.00
Source: NDRI, 2009
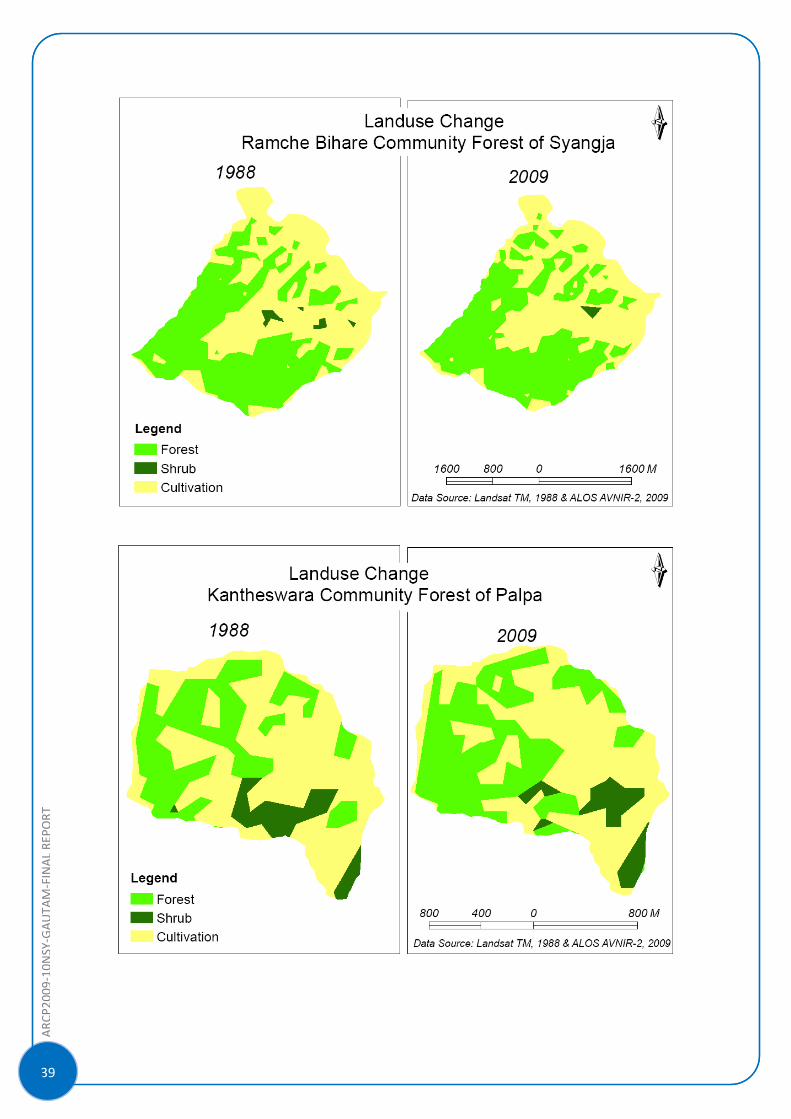
Ramche Bihare: This community forest lies in Phaparthum VDC of Syangja district. The community forest and its buffer zone cover 710.26 hectare land area (Table 3.10). During 20 years period, forest area is
ARC
P2009‐10NSY‐GAUTA
M‐FINALRE
PORT
]
23
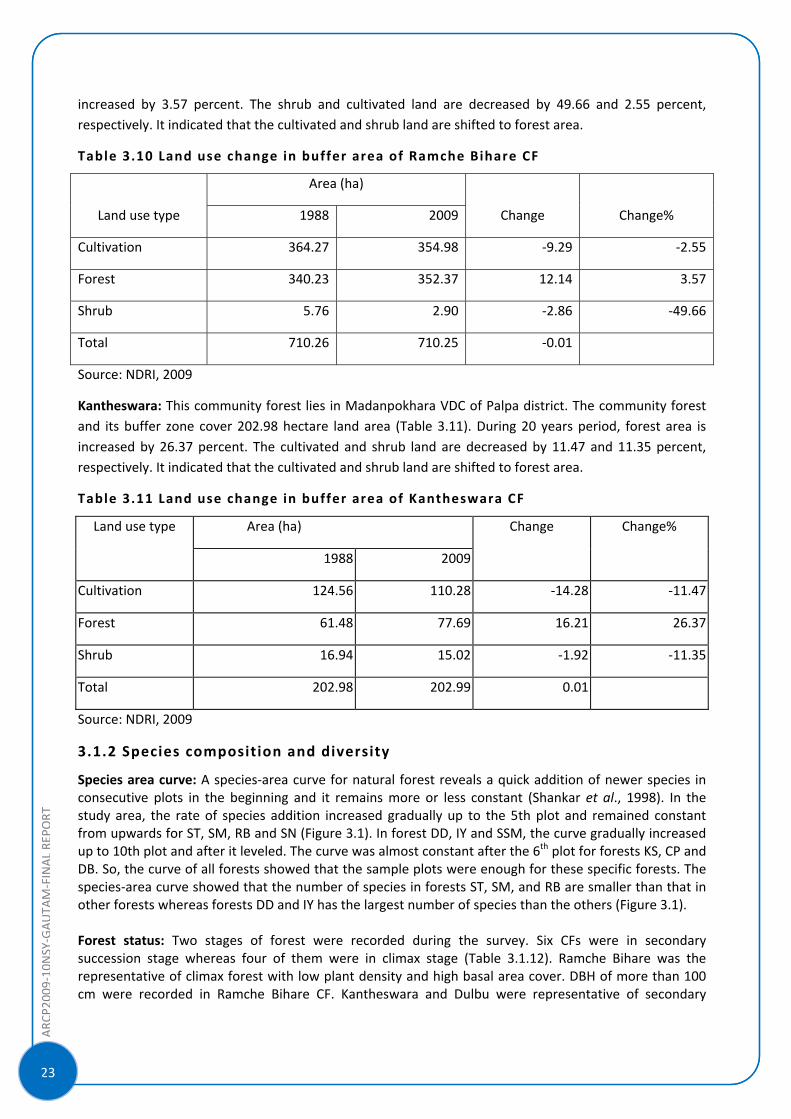
increased by 3.57 percent. The shrub and cultivated land are decreased by 49.66 and 2.55 percent, respectively. It indicated that the cultivated and shrub land are shifted to forest area.
Table 3.10 Land use change in buffer area of Ramche Bihare CF
Land use type
Area (ha)
Change Change% 1988 2009
Cultivation 364.27 354.98 ‐9.29 ‐2.55
Forest 340.23 352.37 12.14 3.57
Shrub 5.76 2.90 ‐2.86 ‐49.66
Total 710.26 710.25 ‐0.01
Source: NDRI, 2009
Kantheswara: This community forest lies in Madanpokhara VDC of Palpa district. The community forest and its buffer zone cover 202.98 hectare land area (Table 3.11). During 20 years period, forest area is increased by 26.37 percent. The cultivated and shrub land are decreased by 11.47 and 11.35 percent, respectively. It indicated that the cultivated and shrub land are shifted to forest area.
Table 3.11 Land use change in buffer area of Kantheswara CF
Land use type Area (ha) Change Change%
1988 2009
Cultivation 124.56 110.28 ‐14.28 ‐11.47
Forest 61.48 77.69 16.21 26.37
Shrub 16.94 15.02 ‐1.92 ‐11.35
Total 202.98 202.99 0.01
Source: NDRI, 2009
3.1.2 Species composition and diversity
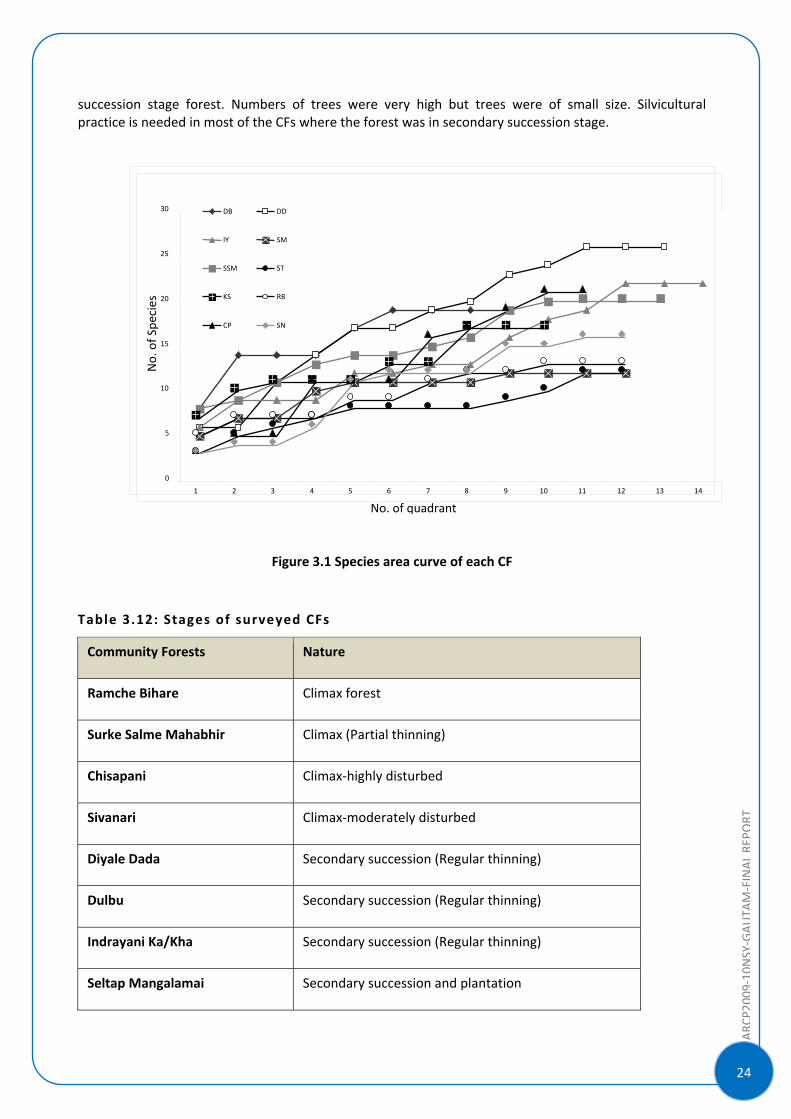
Species area curve: A species‐area curve for natural forest reveals a quick addition of newer species in consecutive plots in the beginning and it remains more or less constant (Shankar et al., 1998). In the study area, the rate of species addition increased gradually up to the 5th plot and remained constant from upwards for ST, SM, RB and SN (Figure 3.1). In forest DD, IY and SSM, the curve gradually increased up to 10th plot and after it leveled. The curve was almost constant after the 6th plot for forests KS, CP and DB. So, the curve of all forests showed that the sample plots were enough for these specific forests. The species‐area curve showed that the number of species in forests ST, SM, and RB are smaller than that in other forests whereas forests DD and IY has the largest number of species than the others (Figure 3.1). Forest status: Two stages of forest were recorded during the survey. Six CFs were in secondary succession stage whereas four of them were in climax stage (Table 3.1.12). Ramche Bihare was the representative of climax forest with low plant density and high basal area cover. DBH of more than 100 cm were recorded in Ramche Bihare CF. Kantheswara and Dulbu were representative of secondary
24
ARC
P2009‐10NSY‐GAUTA
M‐FINALRE
PORT
succession stage forest. Numbers of trees were very high but trees were of small size. Silvicultural practice is needed in most of the CFs where the forest was in secondary succession stage.
Figure 3.1 Species area curve of each CF
Table 3.12: Stages of surveyed CFs
Community Forests Nature
Ramche Bihare Climax forest
Surke Salme Mahabhir Climax (Partial thinning)
Chisapani Climax‐highly disturbed
Sivanari Climax‐moderately disturbed
Diyale Dada Secondary succession (Regular thinning)
Dulbu Secondary succession (Regular thinning)
Indrayani Ka/Kha Secondary succession (Regular thinning)
Seltap Mangalamai Secondary succession and plantation
0
5
10
15
20
25
30
1 2 3 4 5 6 7 8 9 10 11 12 13 14
DB DD
IY SM
SSM ST
KS RB
CP SN
No. of Spe
cies
No. of quadrant
ARC
P2009‐10NSY‐GAUTA
M‐FINALRE
PORT
]
25
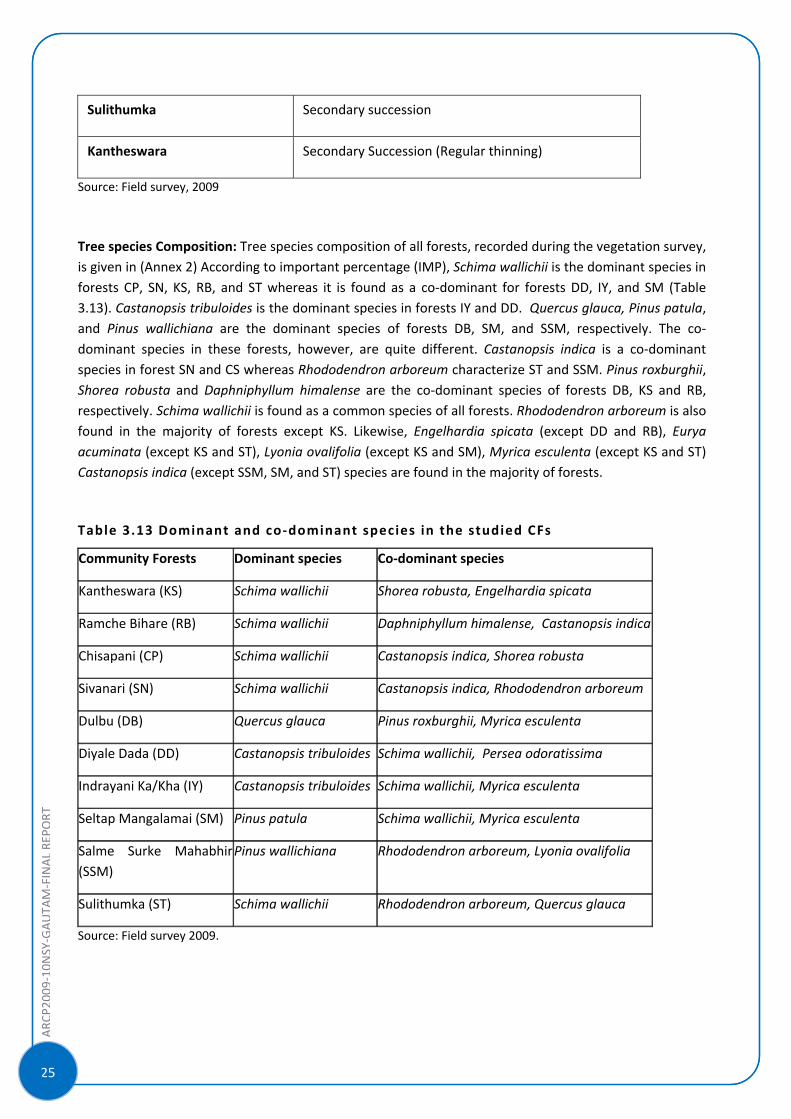
Sulithumka Secondary succession
Kantheswara Secondary Succession (Regular thinning)
Source: Field survey, 2009
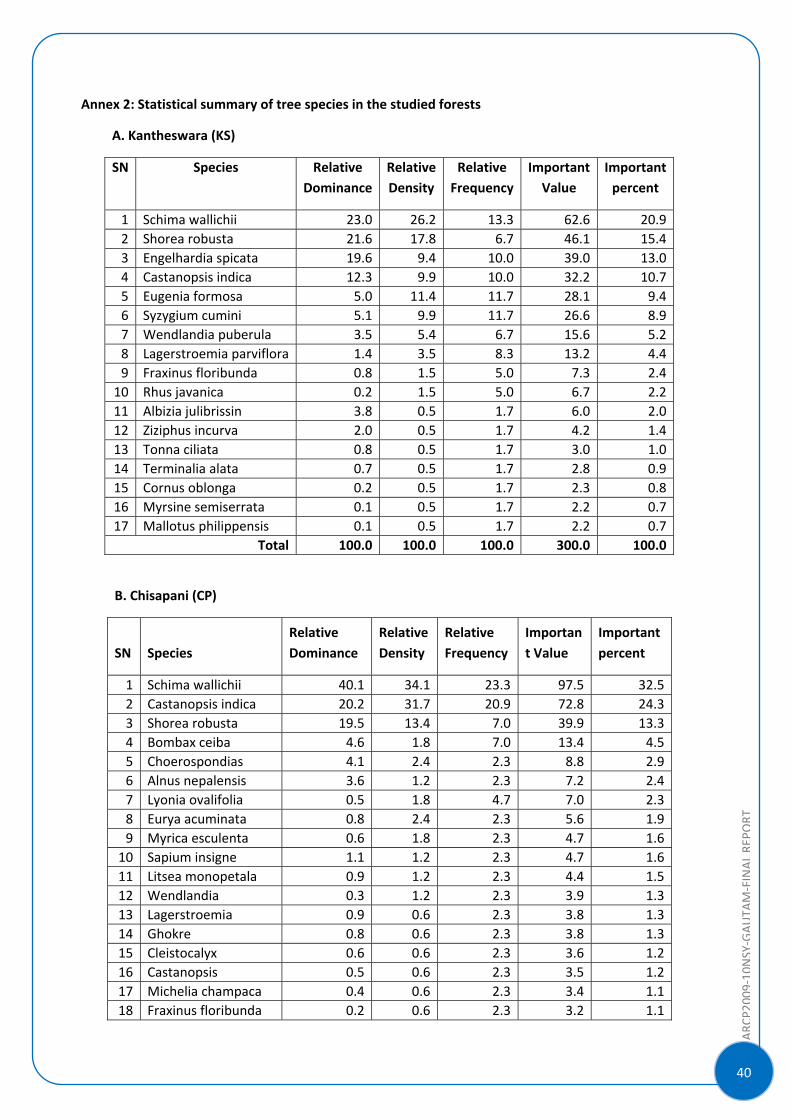
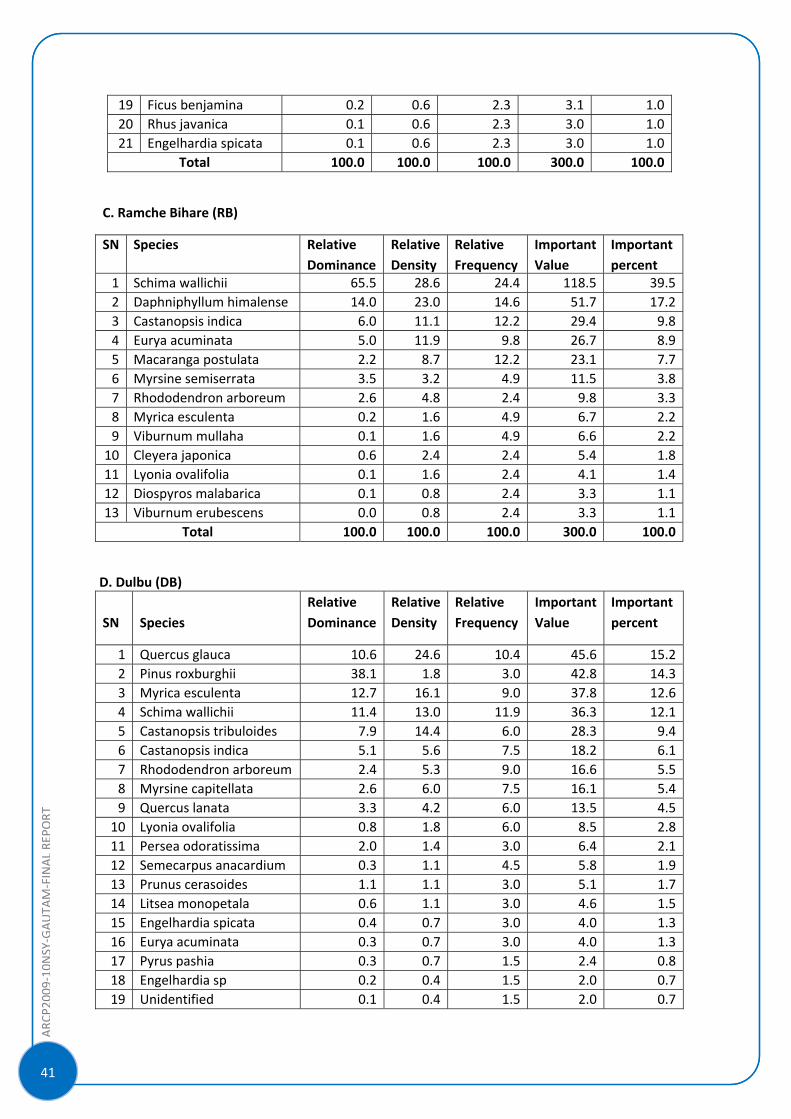
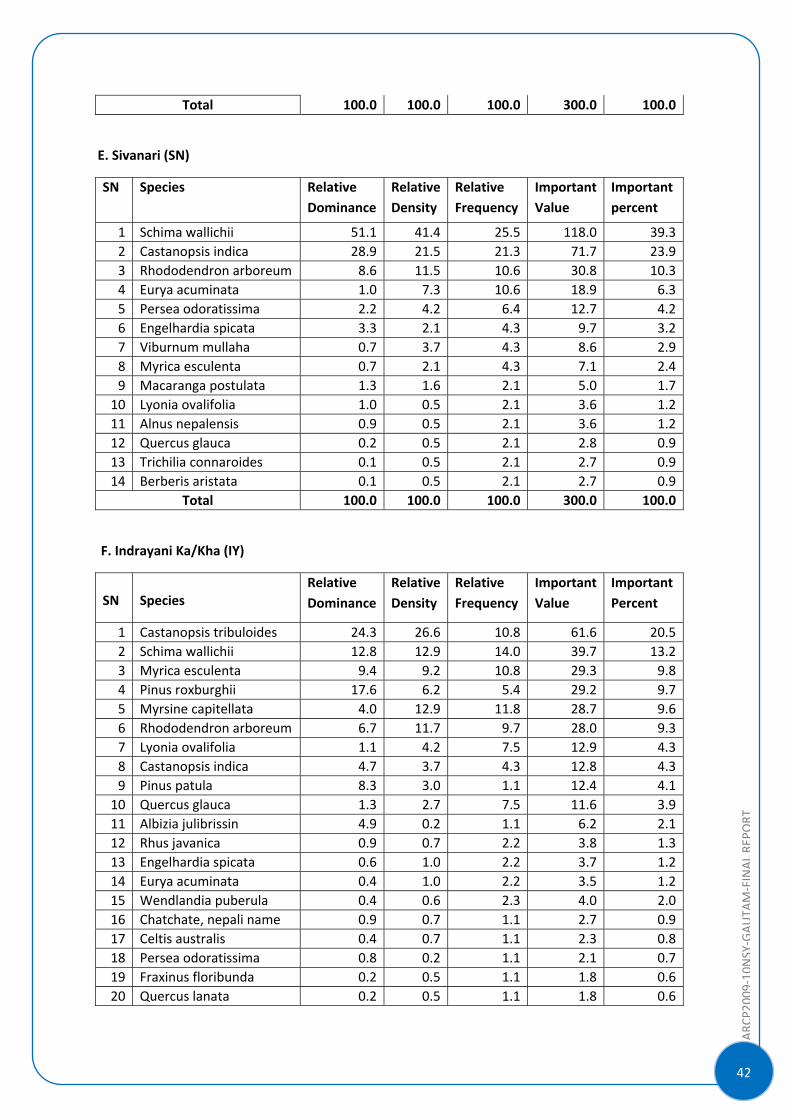
Tree species Composition: Tree species composition of all forests, recorded during the vegetation survey, is given in (Annex 2) According to important percentage (IMP), Schima wallichii is the dominant species in forests CP, SN, KS, RB, and ST whereas it is found as a co‐dominant for forests DD, IY, and SM (Table 3.13). Castanopsis tribuloides is the dominant species in forests IY and DD. Quercus glauca, Pinus patula, and Pinus wallichiana are the dominant species of forests DB, SM, and SSM, respectively. The co‐dominant species in these forests, however, are quite different. Castanopsis indica is a co‐dominant species in forest SN and CS whereas Rhododendron arboreum characterize ST and SSM. Pinus roxburghii, Shorea robusta and Daphniphyllum himalense are the co‐dominant species of forests DB, KS and RB, respectively. Schima wallichii is found as a common species of all forests. Rhododendron arboreum is also found in the majority of forests except KS. Likewise, Engelhardia spicata (except DD and RB), Eurya acuminata (except KS and ST), Lyonia ovalifolia (except KS and SM), Myrica esculenta (except KS and ST) Castanopsis indica (except SSM, SM, and ST) species are found in the majority of forests.
Table 3.13 Dominant and co‐dominant species in the studied CFs
Community Forests Dominant species Co‐dominant species
Kantheswara (KS) Schima wallichii Shorea robusta, Engelhardia spicata
Ramche Bihare (RB) Schima wallichii Daphniphyllum himalense, Castanopsis indica
Chisapani (CP) Schima wallichii Castanopsis indica, Shorea robusta
Sivanari (SN) Schima wallichii Castanopsis indica, Rhododendron arboreum
Dulbu (DB) Quercus glauca Pinus roxburghii, Myrica esculenta
Diyale Dada (DD) Castanopsis tribuloides Schima wallichii, Persea odoratissima
Indrayani Ka/Kha (IY) Castanopsis tribuloides Schima wallichii, Myrica esculenta
Seltap Mangalamai (SM) Pinus patula Schima wallichii, Myrica esculenta
Salme Surke Mahabhir (SSM)
Pinus wallichiana Rhododendron arboreum, Lyonia ovalifolia
Sulithumka (ST) Schima wallichii Rhododendron arboreum, Quercus glauca
Source: Field survey 2009.
26
ARC
P2009‐10NSY‐GAUTA
M‐FINALRE
PORT
Some species are found only one forest having very poor value of IMP. Such species are: Antidesma bunius in ST, Pyrus pasia in DB, Berberis aristata and Trichilia connaroides in SN, Betula alnoides, Juglans regia, and Tsuga dumosa in SSM, Bombax ceiba, Ficus benjamina, Ghorke (Nepali name), Michelia champaca, and Sapium insigne in CP, Cinnamomum camphora, Ficus neriifolia, Pandanus nepalensis, and Xylosma controversum in DD, Cornus oblonga, Mallotus philippensis, Terminalia alata, Toona serrata and Ziziphus incurva in KS. Forest IY doesn’t have any distinct species like other forests. Kamale (Nepali name) is found only in SM having fourth position in important percentage. Forest SSM and KS have distinct forest composition among the all forests having the lowest number of common species compared to other forests.
Associated species: Schima‐Castanopsis was dominant tree species of the study sites. However, 150 species of associated plants were recorded from ten CFs. Champ (Michelia champaca) was almost extinct from all the surveyed sites due to extensive looping and felling for high valued timber. Satuwa (Paris polyphylla) which was once abundant, now has been disappeared from Ramche Bihare CF. Likewise, Simal (Bombax ceiba) was disappeared from Indrayani CF. Kafal (Myrica esculenta) and Guras (Rhododendron arboreum) were conserved species in few CFs including Sivanari CF of Lamjung. Similarly, Dar (Debregeasia salicifolia) was endangered due to the collection of bark. Few Non Governmental Organizations (NGOs) are working in the CFs of surveyed sites but are more focused on CF management, silvicultural practices and social equity issues. Even the executive members of CF are unaware about the biodiversity and land use change and there are not a single program that work on biodiversity and carbon sequestration.
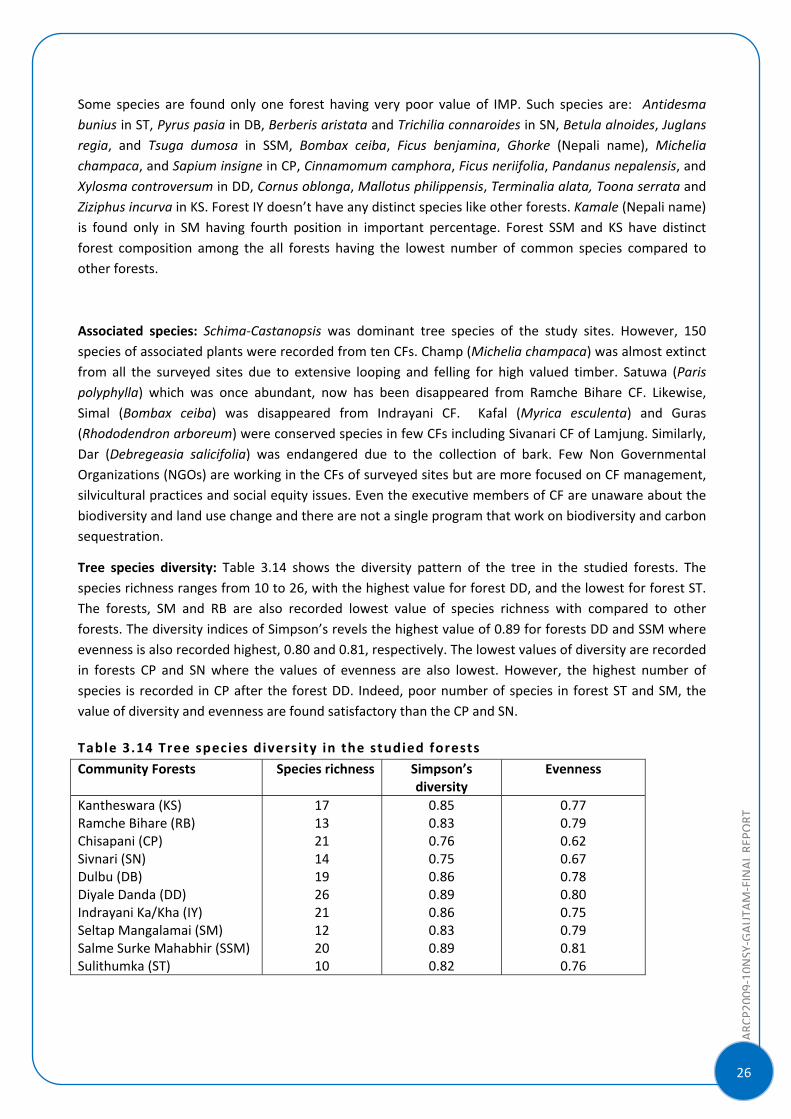
Tree species diversity: Table 3.14 shows the diversity pattern of the tree in the studied forests. The species richness ranges from 10 to 26, with the highest value for forest DD, and the lowest for forest ST. The forests, SM and RB are also recorded lowest value of species richness with compared to other forests. The diversity indices of Simpson’s revels the highest value of 0.89 for forests DD and SSM where evenness is also recorded highest, 0.80 and 0.81, respectively. The lowest values of diversity are recorded in forests CP and SN where the values of evenness are also lowest. However, the highest number of species is recorded in CP after the forest DD. Indeed, poor number of species in forest ST and SM, the value of diversity and evenness are found satisfactory than the CP and SN.
Table 3.14 Tree species diversity in the studied forests
Community Forests Species richness Simpson’s diversity
Evenness
Kantheswara (KS) Ramche Bihare (RB) Chisapani (CP) Sivnari (SN) Dulbu (DB) Diyale Danda (DD) Indrayani Ka/Kha (IY) Seltap Mangalamai (SM) Salme Surke Mahabhir (SSM) Sulithumka (ST)
17 13 21 14 19 26 21 12 20 10
0.85 0.83 0.76 0.75 0.86 0.89 0.86 0.83 0.89 0.82
0.77 0.79 0.62 0.67 0.78 0.80 0.75 0.79 0.81 0.76
ARC
P2009‐10NSY‐GAUTA
M‐FINALRE
PORT
]
27
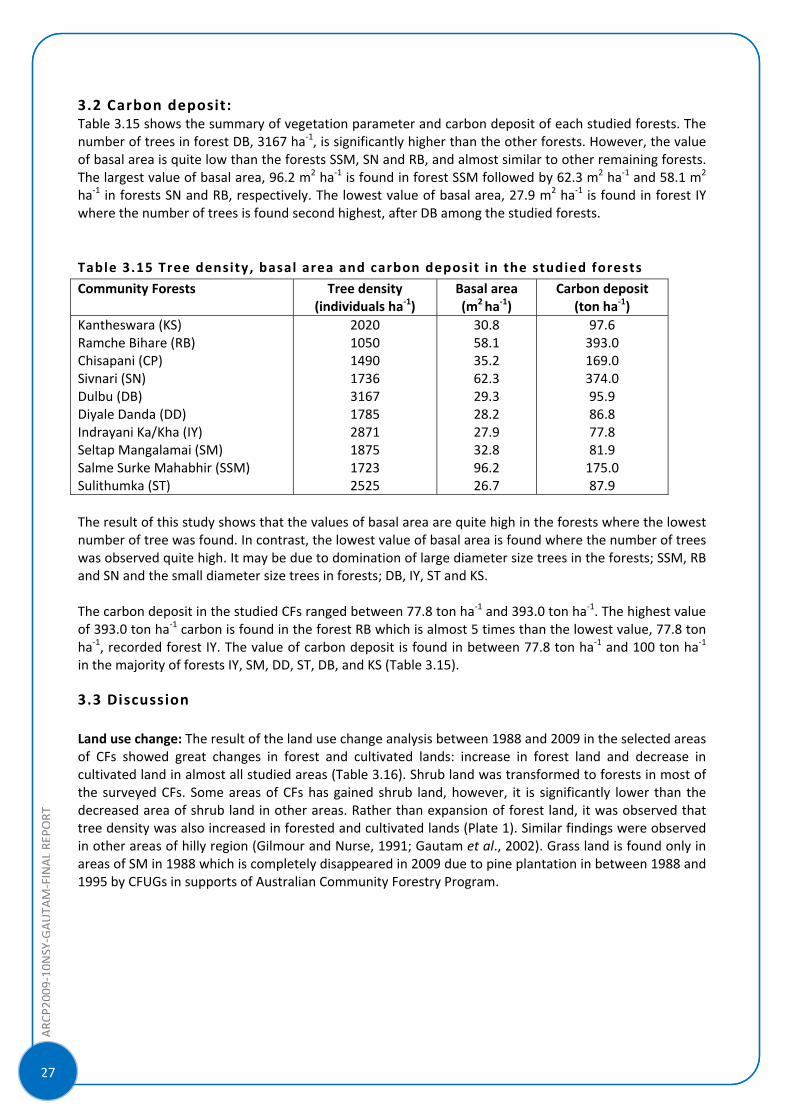
3.2 Carbon deposit: Table 3.15 shows the summary of vegetation parameter and carbon deposit of each studied forests. The number of trees in forest DB, 3167 ha‐1, is significantly higher than the other forests. However, the value of basal area is quite low than the forests SSM, SN and RB, and almost similar to other remaining forests. The largest value of basal area, 96.2 m2 ha‐1 is found in forest SSM followed by 62.3 m2 ha‐1 and 58.1 m2 ha‐1 in forests SN and RB, respectively. The lowest value of basal area, 27.9 m2 ha‐1 is found in forest IY where the number of trees is found second highest, after DB among the studied forests.
Table 3.15 Tree density, basal area and carbon deposit in the studied forests
Community Forests Tree density (individuals ha‐1)
Basal area (m2 ha‐1)
Carbon deposit (ton ha‐1)
Kantheswara (KS) Ramche Bihare (RB) Chisapani (CP) Sivnari (SN) Dulbu (DB) Diyale Danda (DD) Indrayani Ka/Kha (IY) Seltap Mangalamai (SM) Salme Surke Mahabhir (SSM) Sulithumka (ST)
2020 1050 1490 1736 3167 1785 2871 1875 1723 2525
30.8 58.1 35.2 62.3 29.3 28.2 27.9 32.8 96.2 26.7
97.6 393.0 169.0 374.0 95.9 86.8 77.8 81.9 175.0 87.9
The result of this study shows that the values of basal area are quite high in the forests where the lowest number of tree was found. In contrast, the lowest value of basal area is found where the number of trees was observed quite high. It may be due to domination of large diameter size trees in the forests; SSM, RB and SN and the small diameter size trees in forests; DB, IY, ST and KS. The carbon deposit in the studied CFs ranged between 77.8 ton ha‐1 and 393.0 ton ha‐1. The highest value of 393.0 ton ha‐1 carbon is found in the forest RB which is almost 5 times than the lowest value, 77.8 ton ha‐1, recorded forest IY. The value of carbon deposit is found in between 77.8 ton ha‐1 and 100 ton ha‐1 in the majority of forests IY, SM, DD, ST, DB, and KS (Table 3.15).
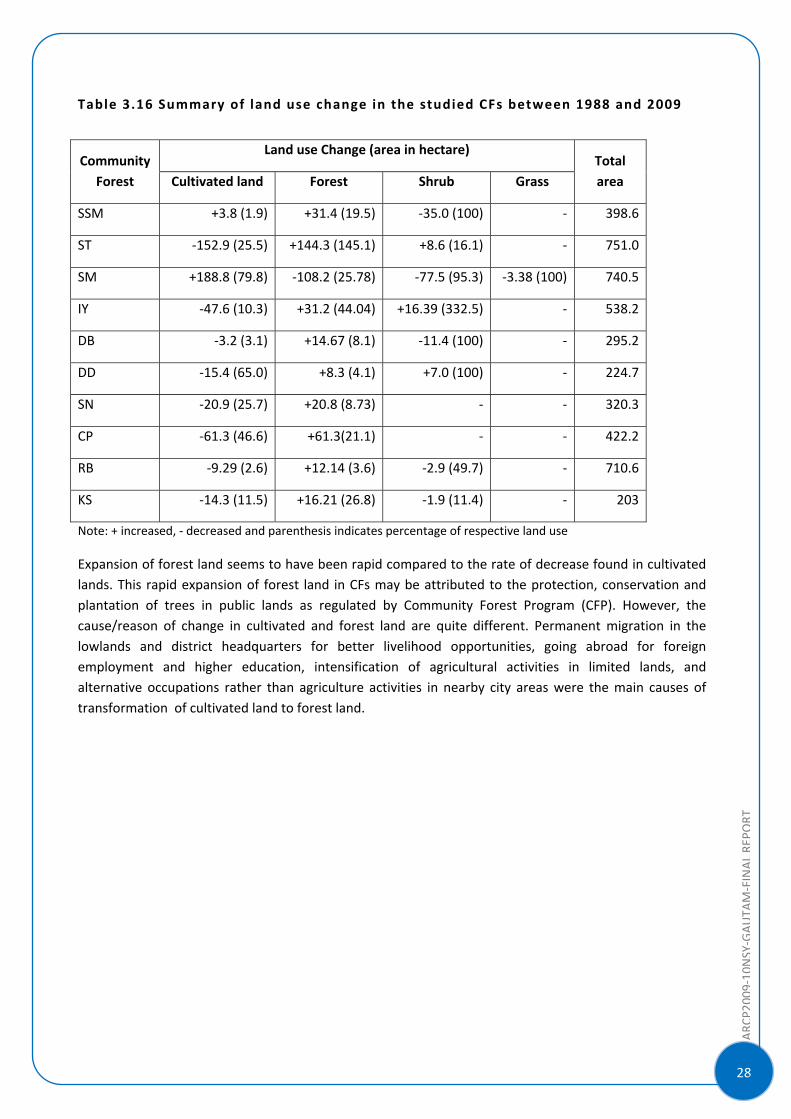
3.3 Discussion Land use change: The result of the land use change analysis between 1988 and 2009 in the selected areas of CFs showed great changes in forest and cultivated lands: increase in forest land and decrease in cultivated land in almost all studied areas (Table 3.16). Shrub land was transformed to forests in most of the surveyed CFs. Some areas of CFs has gained shrub land, however, it is significantly lower than the decreased area of shrub land in other areas. Rather than expansion of forest land, it was observed that tree density was also increased in forested and cultivated lands (Plate 1). Similar findings were observed in other areas of hilly region (Gilmour and Nurse, 1991; Gautam et al., 2002). Grass land is found only in areas of SM in 1988 which is completely disappeared in 2009 due to pine plantation in between 1988 and 1995 by CFUGs in supports of Australian Community Forestry Program.
28
ARC
P2009‐10NSY‐GAUTA
M‐FINALRE
PORT
Table 3.16 Summary of land use change in the studied CFs between 1988 and 2009
Community Forest
Land use Change (area in hectare) Total area Cultivated land Forest Shrub Grass
SSM +3.8 (1.9) +31.4 (19.5) ‐35.0 (100) ‐ 398.6
ST ‐152.9 (25.5) +144.3 (145.1) +8.6 (16.1) ‐ 751.0
SM +188.8 (79.8) ‐108.2 (25.78) ‐77.5 (95.3) ‐3.38 (100) 740.5
IY ‐47.6 (10.3) +31.2 (44.04) +16.39 (332.5) ‐ 538.2
DB ‐3.2 (3.1) +14.67 (8.1) ‐11.4 (100) ‐ 295.2
DD ‐15.4 (65.0) +8.3 (4.1) +7.0 (100) ‐ 224.7
SN ‐20.9 (25.7) +20.8 (8.73) ‐ ‐ 320.3
CP ‐61.3 (46.6) +61.3(21.1) ‐ ‐ 422.2
RB ‐9.29 (2.6) +12.14 (3.6) ‐2.9 (49.7) ‐ 710.6
KS ‐14.3 (11.5) +16.21 (26.8) ‐1.9 (11.4) ‐ 203
Note: + increased, ‐ decreased and parenthesis indicates percentage of respective land use Expansion of forest land seems to have been rapid compared to the rate of decrease found in cultivated lands. This rapid expansion of forest land in CFs may be attributed to the protection, conservation and plantation of trees in public lands as regulated by Community Forest Program (CFP). However, the cause/reason of change in cultivated and forest land are quite different. Permanent migration in the lowlands and district headquarters for better livelihood opportunities, going abroad for foreign employment and higher education, intensification of agricultural activities in limited lands, and alternative occupations rather than agriculture activities in nearby city areas were the main causes of transformation of cultivated land to forest land.
ARC
P2009‐10NSY‐GAUTA
M‐FINALRE
PORT
]
29
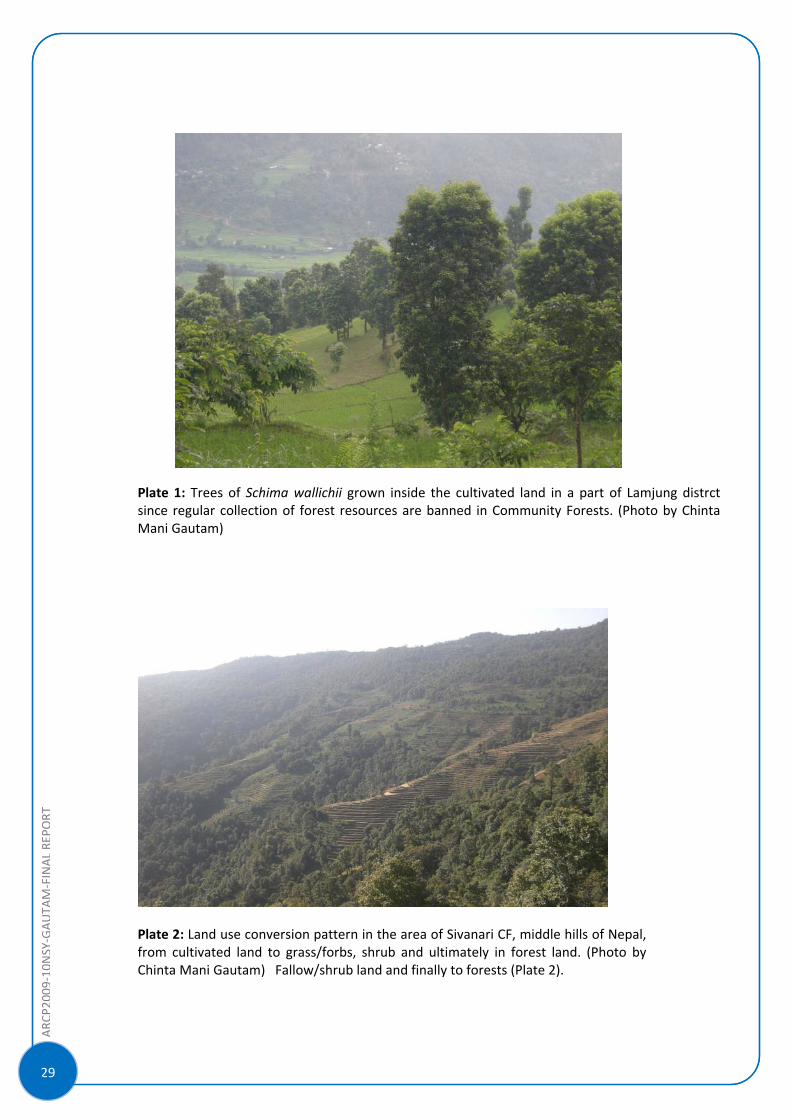
Plate 1: Trees of Schima wallichii grown inside the cultivated land in a part of Lamjung distrct since regular collection of forest resources are banned in Community Forests. (Photo by Chinta Mani Gautam)
Plate 2: Land use conversion pattern in the area of Sivanari CF, middle hills of Nepal, from cultivated land to grass/forbs, shrub and ultimately in forest land. (Photo by Chinta Mani Gautam) Fallow/shrub land and finally to forests (Plate 2).
30
ARC
P2009‐10NSY‐GAUTA
M‐FINALRE
PORT
In the surrounding area of Sulithumka CF, large area of cultivated land has been converted to forest land in the initiative of local people in efforts to conserve forest resources in certain unproductive areas of cultivated and shrub lands. Now, they use limited land for cultivation using high variety of improved seeds and chemical fertilizer with compost manure, and produce cash crops (e.g., vegetables, potato) in alternation of traditional low value cereal crops (barley, buckwheat, and millet). Such trend was also observed in the areas of KS, RB, CP, and SN. Since open access was restricted in most of the CFs, people stated to protect and conserve plants in their own lands, primarily for the fuelwood supply and fodder. This activity helped farmers to increase tree density in their own lands and expansion of forest cover in public lands, as confirmed by the local people during the field visit and participants of stakeholder meeting. Therefore, the study concluded that CFs played crucial role in increasing forest cover in the public and private lands in the hilly areas of Nepal rather than other factors associated with land use changes (e.g., migration). Such findings were also observed in the middle hills and mountains of Nepal (Gautam, 2005; Gautam and Watanabe, 2004). Therefore, this study is concluded that community forestry program have been played crucial role to increase forest cover in the public and private lands in the Hilly areas of Nepal.
Tree species composition and diversity: Analysis of tree species composition of the studied CFs shows a different combination of species with different dominants and co‐dominants. Schima wallichii is dominant species in Forests KS, RB, CP, SN, and ST whereas Castanopsis tribuloides in forests DD and IY. Dominant species in forests DB, SM and SSM are quite different than the other forests. Forest RB, CP and SN have some similarities in species composition than the other forests. Forest SSM appears distinct among the studied forest. This difference might be due to impact of geographical factors (i.e. altitude, slope, aspect and properties of soil) and anthropogenic disturbances (Gautam and Watanabe, 2005). This difference might be due to impact of altitude, slope, aspect and properties of soil. A similarity in species composition is found for forests RB, SN, CP, DD, IY, DB and ST. However, there are some species that are found only in particular forests. Majority of studied CFs were dominated by same species, which is rational as Schima‐Castanopsis forest was the basis of selection of CFs. The differences in the species composition may be controlled by altitude (Oshawa, 1983), and intensity of human disturbances (Gautam and Poudel, 2010; Khatry‐Chhetry, 1997).
Indeed local people were unaware about the biodiversity; the observed value of tree species diversity in the studied forests was quite similar with the previous studies (Tachibana and Adhikari, 2002; Gautam, 2005). However, no any efforts were taken by CFP to conserve rare and indigenous species in the area. Therefore, some species (e.g., Michelia champaca) are almost extinct and some (e.g., Debregeasia salicifolia) are in threat of being extinction from the CFs. Index of diversity shows high value in secondary succession forests under regular thinning. However, climax with partial thinning forest, SSM, has high value of diversity index. This may be due to wide altitudinal variation (Table 2.2.2) that was also found in the other areas of Nepal (Osawa 1983). The result of this study indicates that secondary succession forest under regular thinning helps to maintain diversity for tree species. Higher values of diversity for trees in secondary succession under regular thinning forests may be due to a specific response to the managed‐disturbance (cutting) that causes an increment in species diversity (Gautam and Watanabe, 2005). Carbon deposit: Value of carbon deposit ranged between 77.8 ton ha‐1 and 393.0 ton ha‐1 with an average value of 163.9 ton ha‐1. The average value of carbon deposit of the studied forests is quite high than the previous study conducted in the three CFs in middle hills of Nepal (Tewari and Karky, 2007). Status of forest and tree density was found to be responsible for the wide variation in carbon value. Therefore, carbon deposit was found higher in climax than the secondary succession forests due to the presence of big sized trees.
ARC
P2009‐10NSY‐GAUTA
M‐FINALRE
PORT
]
31
CHAPTER IV
CONCLUSIONS
The project results show that CFs have been playing crucial role in increasing forest cover and tree density in public and private lands, and ultimately the sequester carbon. However, the community forest user groups (CFUGs) are unaware about the role of CFs on land use changes and carbon sequestration. Even most of the participants of stakeholders’ meeting were unaware on the ecosystem services and their possible benefits (e.g., carbon trading) that CFs can provide. Compared to other hilly areas of Nepal, the tree species diversity observed at the sites investigated was richer; nevertheless, some species were already extinct and some were largely depleted. It is confirmed that Michelia champaca (local name: Chanp) was almost extinct from all the surveyed sites due to extensive looping and felling for high valued timber. Likewise, Debregeasia salicifolia (local name: Dar) was endangered due to the collection of bark. Few Non Governmental Organizations (NGOs) are working in the CFs of surveyed sites but they are more focused on CF management, silvicultural practices and social equity issues. Even the executive members of CF are unaware about the biodiversity and ecosystem services and not a single program deals with biodiversity and carbon sequestration.
To be brief, this project provided CFUGs and other related stakeholders an opportunity to understand the possible benefits of CFs in terms of ecosystem services and carbon trading in addition to the silvicultural practices and social equity of which they were already aware. Moreover, CFUGs were made aware about the conservation of rare and indigenous species and preserving the existing biodiversity found in their areas. Positive changes in CFs (increase in forest cover and tree density) are useful for foresters, planners and locals as they offer benefits through carbon trading and environmental services in both local and national level. Therefore, the outcomes of this project are useful in working out CF operational plan including the action plan and management strategy, and also in preparation of guidelines to operate particular CF. The project outcomes are also anticipated to support policy and planning, and strengthen the decision making process of the users and management authorities.

32
ARC
P2009‐10NSY‐GAUTA
M‐FINALRE
PORT
CHAPTER V
FUTURE DIRECTIONS
This study has opened the door for further research in this area. Following are some recommendations study team would like to make:
• As this study is confined to the mid hill regions of central and western regions of Nepal , for the total area coverage, estimation of the biomass carbon deposit in Terai and other development regions is strongly recommended.
• For the assessment of total CO2 sequestration of CFs, estimation of soil carbon deposit should be taken into account for which further study is recommended.
• For further analysis, annual data of carbon deposit will provide more accurate data on estimation of CO2 sequestration and gives higher confidence on data. Therefore, studies which have provision for the collection of annual data and their analysis are also recommended.
• Comprehensive studies on awareness raising is necessary including strong lobbying for CF on REDD framework.
• This study has other implication such as application for funding under various mechanisms; however, detailed study will be necessary.
• To harness more benefits out of CFs and biodiversity regional collaboration will be needed however, for the proper modality further study will be required.
• This study has given lot of awareness for tremendous opportunities for research, entrepreneurship, employment and involvement
ARC
P2009‐10NSY‐GAUTA
M‐FINALRE
PORT
]
33
References
Banskota K, BS Karky and M Skutch. 2007. Reducing carbon emissions through community‐managed forests in the Himalaya. Kathmandu, Nepal: ICIMOD.
CFB. 2008. Community Forestry Bulletin (CFB). Ministry of Forest and Conservation, Government of Nepal. (in Nepali).
DPR. 2001. Flowering plants of Nepal. Department of Plant Resources (DPR), Ministry of Forestry and Soil Conservation, Kathmandu.
Gautam AP; EL Webb and A Eiumnoh. 2002. GIS assessment of land use/land cover changes associated with community forestry implementation in the middle hills of Nepal. Mountain Research and Development. 22.
Gautam CM. 2005. Anthropogenic Disturbance, Floristic Composition and Diversity in the Hill Forests, Bharse Area, Gulmi District of Nepal. Ph.D. Thesis. Hokkaido University. Japan.
Gautam CM and S Poudel. 2010. Anthropogenic disturbance and its impact on density‐diameter distribution in the hill forests, Gulmi district of Nepal. Bulletin of Department of Plant Resources. No. 32. 60‐68 pp.
Gautam CM and T Watanabe. 2005. Composition, distribution and diversity of tree species under different management systems in the hill forests of Bharse village, Gulmi, Western Nepal. Himalayan Journal of Sciences. Vol 3 (5). 69‐76 pp.
Gautam CM and T Watanabe. 2004. Reliability of land use/land cover assessment in montane Nepal. A case study in the Kangchenjunga Conservation Area (KCA). Mountain Research and Development. 24:35‐43.
Gilmour DA and MC Nurse. 1991. Farmer initiatives in increasing tree cover in Central Nepal. Mountain Research and Development. 11:329‐337.
IPCC. 2003. Good practice guidance for land use, landuse change and forestry. Kanagawa, Japan: Institute for Global Environment Strategies.
IUCN 2004. National Register of Medicinal and Aromatic Plants. IUCN Nepal.
Khatry‐Chhetry DB. 1997. The Ecology of Warm‐Temperature Forests in the Central Himalayas Across a Human‐induced Disturbance Gradient. PhD Thesis. Michigan University, Michigan.
Lama YC, SK Ghimire and Y Aumeeruddy‐Thomas. 2001. Medicinal Plants of Dolpo: Amchis Knowledge and Conservation. WWF‐Nepal Program, Kathmandu.
MacDicken KG 1997. A guide to monitor carbon storage in forestry and agroforestry, projects, Winrock International Institute for Agricultural Development, Forest Carbon Monitoring Programme. Arlington: Winrock International Institute.
Marland G, RA Pielke, M Apps, R Avissar, RA Betts, KJ Davis, PC Frumhoff, ST Jackion, LA Joyce, P Kauppi, J Katzenberger, KJ MacDicken, RP Neilson, JO Niles, DS Niyogi, RJ Norby, N Pena, N Sampsonl and Y
34
ARC
P2009‐10NSY‐GAUTA
M‐FINALRE
PORT
Xue. 2003. The climatic impacts of land surface change and carbon management, and implications for climatic‐change mitigation policy. Climatic Policy. Vol 3. 149‐157. pp.
Müeller‐Dombois D and H Ellenberg. 1974. Aims and Methods of Vegetation Ecology. John Wiley and Sons, New York.
NARMSAP 2000. Biomass and volume tables with species description for community forest management. Department of Forest, Kathmandu, Nepal.
Oshawa M. 1983. Distribution, structure and regeneration of forest communities in Eastern Nepal. Chiba University, Japan, Chiba. 89‐120.
Pielou EC. 1969. An Introduction to Mathematical Ecology. Wiley and Sons, New York.
Polunin O. and A Stainton. 1984. Flowers of the Himalaya. Oxford University Press. New Delhi.
Press, JR, KK Shrestha and DA Sutton. 2000. Annotated Checklist of the Flowering Plants of Nepal. The Natural History Museum, London.
Shankar U; SD Lama and KS Bawa. 1998. Ecosystem reconstruction through 'taungya' plantations following commercial logging of a dry, mixed deciduous forest in Darjeeling Himalaya. Forest Ecology and Management. 102:131‐142.
Shrestha K. 1998. Dictionary of Nepalese Plant. Mandala Book Point, Nepal.
Simpson EH. 1949. Measurement of diversity. Nature. 163:688.
Stainton A. 1988. Flowers of the Himalaya, A Supplement. Oxford University Press. New Delhi.
Tachibana T and S Adhikari. 2004. Forest Resources Conditions of Nepal: Effects of Management Systems and Impact on Users' Welfare. Kobe: Kobe University. Available from the author.
Tewari A., BS Karky, 2007. Carbon measurement methodology and results. In K. Baskota, BS Karky, and M Skutsch (Eds.). Reducing Carbon Emission through Community‐managed Forests in the Himalaya. Kathmandu. ICIMOD.
Tucker G, P Bubb, MD Heer, L Miles, A Lawrence and JV Rijsoort. 2005. Guidelines for biodiversity assessment and monitoring for protected areas. KMTNC, Kathmandu, Nepal.
ARC
P2009‐10NSY‐GAUTA
M‐FINALRE
PORT
]
35
Annex 1: Landuse change between 1988 and 2009 in the studied forests
36
ARC
P2009‐10NSY‐GAUTA
M‐FINALRE
PORT
Thalpu, Indreswari Community Forest of Kavrepalanchowk
ARC
P2009‐10NSY‐GAUTA
M‐FINALRE
PORT
]
37
38
ARC
P2009‐10NSY‐GAUTA
M‐FINALRE
PORT
ARC
P2009‐10NSY‐GAUTA
M‐FINALRE
PORT
]
39
40
ARC
P2009‐10NSY‐GAUTA
M‐FINALRE
PORT
Annex 2: Statistical summary of tree species in the studied forests
A. Kantheswara (KS)
SN Species Relative Dominance
Relative Density
Relative Frequency
Important Value
Important percent
1 Schima wallichii 23.0 26.2 13.3 62.6 20.92 Shorea robusta 21.6 17.8 6.7 46.1 15.43 Engelhardia spicata 19.6 9.4 10.0 39.0 13.04 Castanopsis indica 12.3 9.9 10.0 32.2 10.75 Eugenia formosa 5.0 11.4 11.7 28.1 9.46 Syzygium cumini 5.1 9.9 11.7 26.6 8.97 Wendlandia puberula 3.5 5.4 6.7 15.6 5.28 Lagerstroemia parviflora 1.4 3.5 8.3 13.2 4.49 Fraxinus floribunda 0.8 1.5 5.0 7.3 2.4
10 Rhus javanica 0.2 1.5 5.0 6.7 2.211 Albizia julibrissin 3.8 0.5 1.7 6.0 2.012 Ziziphus incurva 2.0 0.5 1.7 4.2 1.413 Tonna ciliata 0.8 0.5 1.7 3.0 1.014 Terminalia alata 0.7 0.5 1.7 2.8 0.915 Cornus oblonga 0.2 0.5 1.7 2.3 0.816 Myrsine semiserrata 0.1 0.5 1.7 2.2 0.717 Mallotus philippensis 0.1 0.5 1.7 2.2 0.7
Total 100.0 100.0 100.0 300.0 100.0
B. Chisapani (CP)
SN Species Relative Dominance
Relative Density
Relative Frequency
Important Value
Important percent
1 Schima wallichii 40.1 34.1 23.3 97.5 32.52 Castanopsis indica 20.2 31.7 20.9 72.8 24.33 Shorea robusta 19.5 13.4 7.0 39.9 13.34 Bombax ceiba 4.6 1.8 7.0 13.4 4.55 Choerospondias 4.1 2.4 2.3 8.8 2.96 Alnus nepalensis 3.6 1.2 2.3 7.2 2.47 Lyonia ovalifolia 0.5 1.8 4.7 7.0 2.38 Eurya acuminata 0.8 2.4 2.3 5.6 1.99 Myrica esculenta 0.6 1.8 2.3 4.7 1.6
10 Sapium insigne 1.1 1.2 2.3 4.7 1.611 Litsea monopetala 0.9 1.2 2.3 4.4 1.512 Wendlandia 0.3 1.2 2.3 3.9 1.313 Lagerstroemia 0.9 0.6 2.3 3.8 1.314 Ghokre 0.8 0.6 2.3 3.8 1.315 Cleistocalyx 0.6 0.6 2.3 3.6 1.216 Castanopsis 0.5 0.6 2.3 3.5 1.217 Michelia champaca 0.4 0.6 2.3 3.4 1.118 Fraxinus floribunda 0.2 0.6 2.3 3.2 1.1
ARC
P2009‐10NSY‐GAUTA
M‐FINALRE
PORT
]
41
19 Ficus benjamina 0.2 0.6 2.3 3.1 1.020 Rhus javanica 0.1 0.6 2.3 3.0 1.021 Engelhardia spicata 0.1 0.6 2.3 3.0 1.0
Total 100.0 100.0 100.0 300.0 100.0
C. Ramche Bihare (RB)
SN Species Relative Dominance
Relative Density
Relative Frequency
Important Value
Important percent
1 Schima wallichii 65.5 28.6 24.4 118.5 39.52 Daphniphyllum himalense 14.0 23.0 14.6 51.7 17.23 Castanopsis indica 6.0 11.1 12.2 29.4 9.84 Eurya acuminata 5.0 11.9 9.8 26.7 8.95 Macaranga postulata 2.2 8.7 12.2 23.1 7.76 Myrsine semiserrata 3.5 3.2 4.9 11.5 3.87 Rhododendron arboreum 2.6 4.8 2.4 9.8 3.38 Myrica esculenta 0.2 1.6 4.9 6.7 2.29 Viburnum mullaha 0.1 1.6 4.9 6.6 2.2
10 Cleyera japonica 0.6 2.4 2.4 5.4 1.811 Lyonia ovalifolia 0.1 1.6 2.4 4.1 1.412 Diospyros malabarica 0.1 0.8 2.4 3.3 1.113 Viburnum erubescens 0.0 0.8 2.4 3.3 1.1
Total 100.0 100.0 100.0 300.0 100.0
D. Dulbu (DB)
SN Species Relative Dominance
Relative Density
Relative Frequency
Important Value
Important percent
1 Quercus glauca 10.6 24.6 10.4 45.6 15.22 Pinus roxburghii 38.1 1.8 3.0 42.8 14.33 Myrica esculenta 12.7 16.1 9.0 37.8 12.64 Schima wallichii 11.4 13.0 11.9 36.3 12.15 Castanopsis tribuloides 7.9 14.4 6.0 28.3 9.46 Castanopsis indica 5.1 5.6 7.5 18.2 6.17 Rhododendron arboreum 2.4 5.3 9.0 16.6 5.58 Myrsine capitellata 2.6 6.0 7.5 16.1 5.49 Quercus lanata 3.3 4.2 6.0 13.5 4.5
10 Lyonia ovalifolia 0.8 1.8 6.0 8.5 2.811 Persea odoratissima 2.0 1.4 3.0 6.4 2.112 Semecarpus anacardium 0.3 1.1 4.5 5.8 1.913 Prunus cerasoides 1.1 1.1 3.0 5.1 1.714 Litsea monopetala 0.6 1.1 3.0 4.6 1.515 Engelhardia spicata 0.4 0.7 3.0 4.0 1.316 Eurya acuminata 0.3 0.7 3.0 4.0 1.317 Pyrus pashia 0.3 0.7 1.5 2.4 0.818 Engelhardia sp 0.2 0.4 1.5 2.0 0.719 Unidentified 0.1 0.4 1.5 2.0 0.7
42
ARC
P2009‐10NSY‐GAUTA
M‐FINALRE
PORT
Total 100.0 100.0 100.0 300.0 100.0
E. Sivanari (SN)
SN Species Relative Dominance
Relative Density
Relative Frequency
Important Value
Important percent
1 Schima wallichii 51.1 41.4 25.5 118.0 39.32 Castanopsis indica 28.9 21.5 21.3 71.7 23.93 Rhododendron arboreum 8.6 11.5 10.6 30.8 10.34 Eurya acuminata 1.0 7.3 10.6 18.9 6.35 Persea odoratissima 2.2 4.2 6.4 12.7 4.26 Engelhardia spicata 3.3 2.1 4.3 9.7 3.27 Viburnum mullaha 0.7 3.7 4.3 8.6 2.98 Myrica esculenta 0.7 2.1 4.3 7.1 2.49 Macaranga postulata 1.3 1.6 2.1 5.0 1.7
10 Lyonia ovalifolia 1.0 0.5 2.1 3.6 1.211 Alnus nepalensis 0.9 0.5 2.1 3.6 1.212 Quercus glauca 0.2 0.5 2.1 2.8 0.913 Trichilia connaroides 0.1 0.5 2.1 2.7 0.914 Berberis aristata 0.1 0.5 2.1 2.7 0.9
Total 100.0 100.0 100.0 300.0 100.0
F. Indrayani Ka/Kha (IY)
SN Species Relative Dominance
Relative Density
Relative Frequency
Important Value
Important Percent
1 Castanopsis tribuloides 24.3 26.6 10.8 61.6 20.52 Schima wallichii 12.8 12.9 14.0 39.7 13.23 Myrica esculenta 9.4 9.2 10.8 29.3 9.84 Pinus roxburghii 17.6 6.2 5.4 29.2 9.75 Myrsine capitellata 4.0 12.9 11.8 28.7 9.66 Rhododendron arboreum 6.7 11.7 9.7 28.0 9.37 Lyonia ovalifolia 1.1 4.2 7.5 12.9 4.38 Castanopsis indica 4.7 3.7 4.3 12.8 4.39 Pinus patula 8.3 3.0 1.1 12.4 4.1
10 Quercus glauca 1.3 2.7 7.5 11.6 3.911 Albizia julibrissin 4.9 0.2 1.1 6.2 2.112 Rhus javanica 0.9 0.7 2.2 3.8 1.313 Engelhardia spicata 0.6 1.0 2.2 3.7 1.214 Eurya acuminata 0.4 1.0 2.2 3.5 1.215 Wendlandia puberula 0.4 0.6 2.3 4.0 2.016 Chatchate, nepali name 0.9 0.7 1.1 2.7 0.917 Celtis australis 0.4 0.7 1.1 2.3 0.818 Persea odoratissima 0.8 0.2 1.1 2.1 0.719 Fraxinus floribunda 0.2 0.5 1.1 1.8 0.620 Quercus lanata 0.2 0.5 1.1 1.8 0.6
ARC
P2009‐10NSY‐GAUTA
M‐FINALRE
PORT
]
43
21 Syzigium cumini 0.1 0.2 1.1 1.5 0.5Total 100.0 100.0 100.0 300.0 100.0
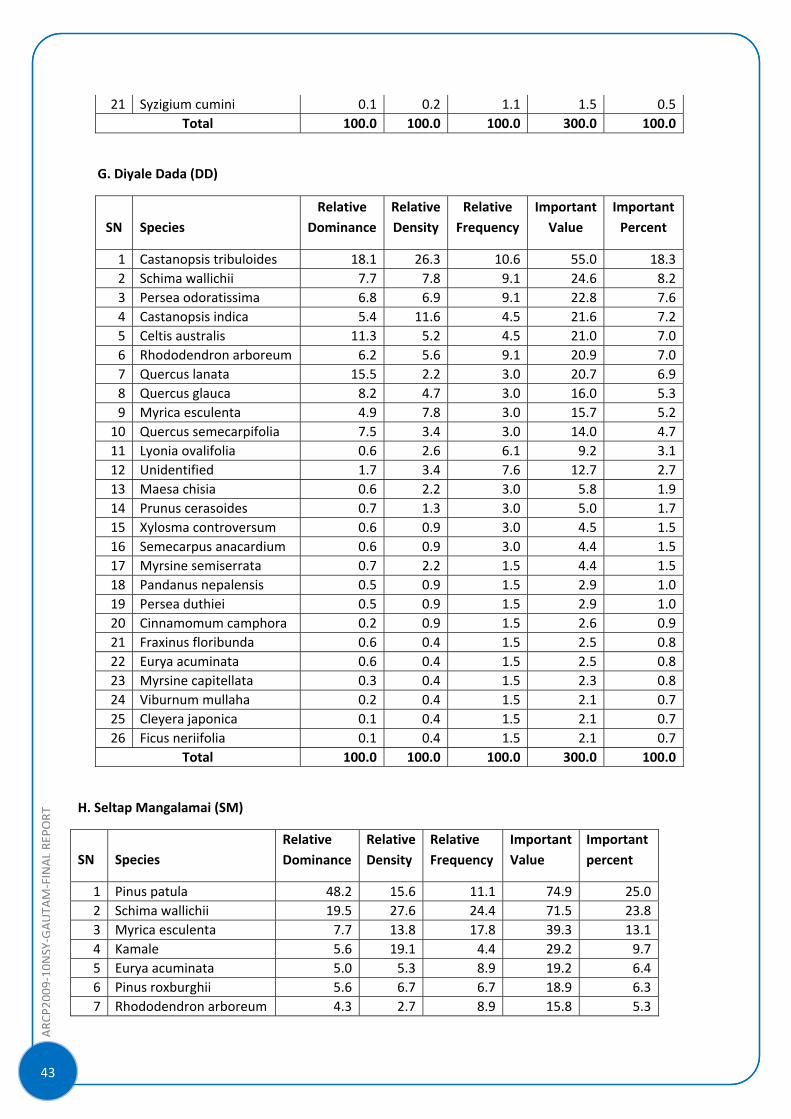
G. Diyale Dada (DD)
SN Species Relative
DominanceRelative Density
Relative Frequency
Important Value
Important Percent
1 Castanopsis tribuloides 18.1 26.3 10.6 55.0 18.32 Schima wallichii 7.7 7.8 9.1 24.6 8.23 Persea odoratissima 6.8 6.9 9.1 22.8 7.64 Castanopsis indica 5.4 11.6 4.5 21.6 7.25 Celtis australis 11.3 5.2 4.5 21.0 7.06 Rhododendron arboreum 6.2 5.6 9.1 20.9 7.07 Quercus lanata 15.5 2.2 3.0 20.7 6.98 Quercus glauca 8.2 4.7 3.0 16.0 5.39 Myrica esculenta 4.9 7.8 3.0 15.7 5.2
10 Quercus semecarpifolia 7.5 3.4 3.0 14.0 4.711 Lyonia ovalifolia 0.6 2.6 6.1 9.2 3.112 Unidentified 1.7 3.4 7.6 12.7 2.713 Maesa chisia 0.6 2.2 3.0 5.8 1.914 Prunus cerasoides 0.7 1.3 3.0 5.0 1.715 Xylosma controversum 0.6 0.9 3.0 4.5 1.516 Semecarpus anacardium 0.6 0.9 3.0 4.4 1.517 Myrsine semiserrata 0.7 2.2 1.5 4.4 1.518 Pandanus nepalensis 0.5 0.9 1.5 2.9 1.019 Persea duthiei 0.5 0.9 1.5 2.9 1.020 Cinnamomum camphora 0.2 0.9 1.5 2.6 0.921 Fraxinus floribunda 0.6 0.4 1.5 2.5 0.822 Eurya acuminata 0.6 0.4 1.5 2.5 0.823 Myrsine capitellata 0.3 0.4 1.5 2.3 0.824 Viburnum mullaha 0.2 0.4 1.5 2.1 0.725 Cleyera japonica 0.1 0.4 1.5 2.1 0.726 Ficus neriifolia 0.1 0.4 1.5 2.1 0.7
Total 100.0 100.0 100.0 300.0 100.0
H. Seltap Mangalamai (SM)
SN Species Relative Dominance
Relative Density
Relative Frequency
Important Value
Important percent
1 Pinus patula 48.2 15.6 11.1 74.9 25.0 2 Schima wallichii 19.5 27.6 24.4 71.5 23.8 3 Myrica esculenta 7.7 13.8 17.8 39.3 13.1 4 Kamale 5.6 19.1 4.4 29.2 9.7 5 Eurya acuminata 5.0 5.3 8.9 19.2 6.4 6 Pinus roxburghii 5.6 6.7 6.7 18.9 6.3 7 Rhododendron arboreum 4.3 2.7 8.9 15.8 5.3
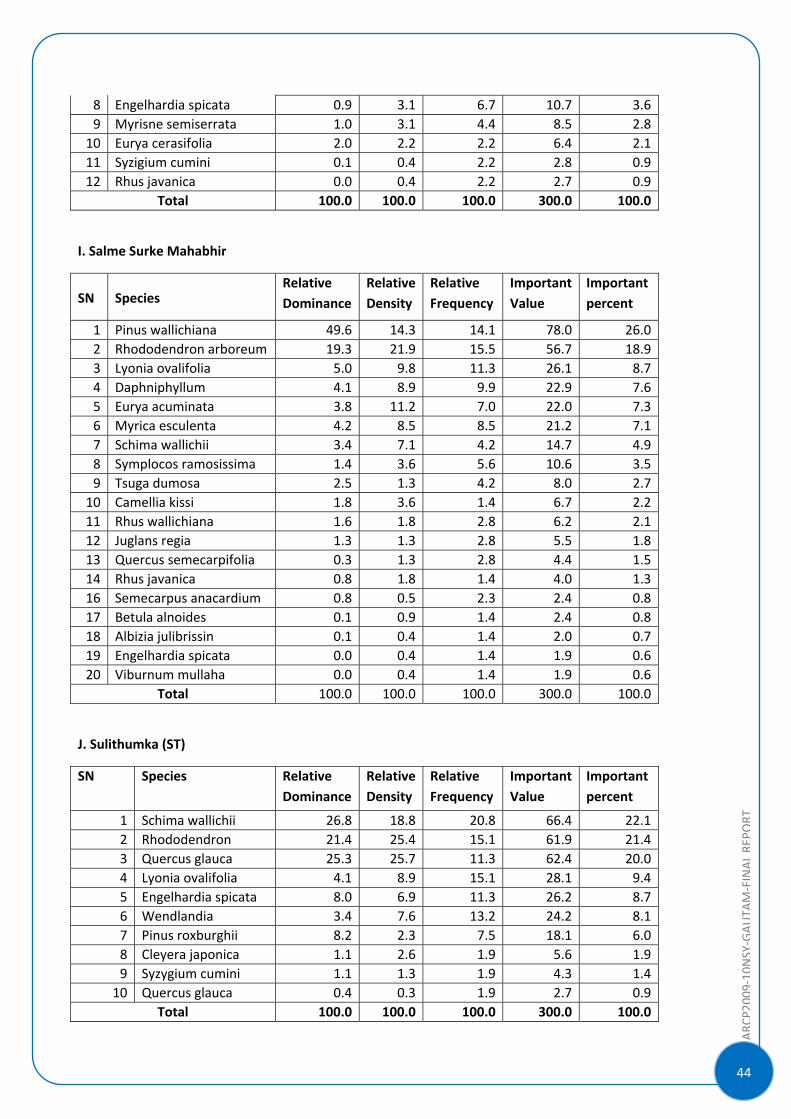
44
ARC
P2009‐10NSY‐GAUTA
M‐FINALRE
PORT
8 Engelhardia spicata 0.9 3.1 6.7 10.7 3.6 9 Myrisne semiserrata 1.0 3.1 4.4 8.5 2.8
10 Eurya cerasifolia 2.0 2.2 2.2 6.4 2.1 11 Syzigium cumini 0.1 0.4 2.2 2.8 0.9 12 Rhus javanica 0.0 0.4 2.2 2.7 0.9
Total 100.0 100.0 100.0 300.0 100.0
I. Salme Surke Mahabhir
SN Species Relative Dominance
Relative Density
Relative Frequency
Important Value
Important percent
1 Pinus wallichiana 49.6 14.3 14.1 78.0 26.0 2 Rhododendron arboreum 19.3 21.9 15.5 56.7 18.9 3 Lyonia ovalifolia 5.0 9.8 11.3 26.1 8.7 4 Daphniphyllum 4.1 8.9 9.9 22.9 7.6 5 Eurya acuminata 3.8 11.2 7.0 22.0 7.3 6 Myrica esculenta 4.2 8.5 8.5 21.2 7.1 7 Schima wallichii 3.4 7.1 4.2 14.7 4.9 8 Symplocos ramosissima 1.4 3.6 5.6 10.6 3.5 9 Tsuga dumosa 2.5 1.3 4.2 8.0 2.7
10 Camellia kissi 1.8 3.6 1.4 6.7 2.2 11 Rhus wallichiana 1.6 1.8 2.8 6.2 2.1 12 Juglans regia 1.3 1.3 2.8 5.5 1.8 13 Quercus semecarpifolia 0.3 1.3 2.8 4.4 1.5 14 Rhus javanica 0.8 1.8 1.4 4.0 1.3 16 Semecarpus anacardium 0.8 0.5 2.3 2.4 0.8 17 Betula alnoides 0.1 0.9 1.4 2.4 0.8 18 Albizia julibrissin 0.1 0.4 1.4 2.0 0.7 19 Engelhardia spicata 0.0 0.4 1.4 1.9 0.6 20 Viburnum mullaha 0.0 0.4 1.4 1.9 0.6
Total 100.0 100.0 100.0 300.0 100.0
J. Sulithumka (ST)
SN Species Relative Dominance
Relative Density
Relative Frequency
Important Value
Important percent
1 Schima wallichii 26.8 18.8 20.8 66.4 22.1 2 Rhododendron 21.4 25.4 15.1 61.9 21.4 3 Quercus glauca 25.3 25.7 11.3 62.4 20.0 4 Lyonia ovalifolia 4.1 8.9 15.1 28.1 9.4 5 Engelhardia spicata 8.0 6.9 11.3 26.2 8.7 6 Wendlandia 3.4 7.6 13.2 24.2 8.1 7 Pinus roxburghii 8.2 2.3 7.5 18.1 6.0 8 Cleyera japonica 1.1 2.6 1.9 5.6 1.9 9 Syzygium cumini 1.1 1.3 1.9 4.3 1.4
10 Quercus glauca 0.4 0.3 1.9 2.7 0.9 Total 100.0 100.0 100.0 300.0 100.0
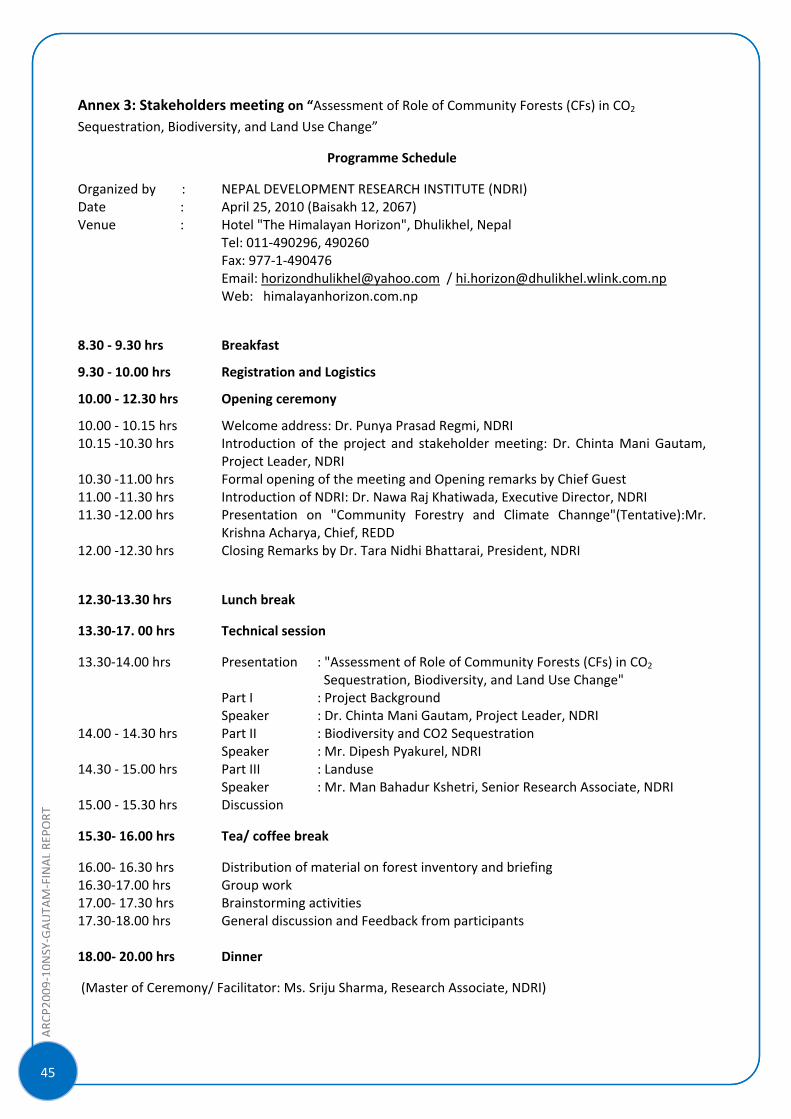
ARC
P2009‐10NSY‐GAUTA
M‐FINALRE
PORT
]
45
Annex 3: Stakeholders meeting on “Assessment of Role of Community Forests (CFs) in CO2
Sequestration, Biodiversity, and Land Use Change”
Programme Schedule
Organized by : NEPAL DEVELOPMENT RESEARCH INSTITUTE (NDRI) Date : April 25, 2010 (Baisakh 12, 2067) Venue : Hotel "The Himalayan Horizon", Dhulikhel, Nepal Tel: 011‐490296, 490260 Fax: 977‐1‐490476 Email: [email protected] / [email protected] Web: himalayanhorizon.com.np
8.30 ‐ 9.30 hrs Breakfast
9.30 ‐ 10.00 hrs Registration and Logistics
10.00 ‐ 12.30 hrs Opening ceremony
10.00 ‐ 10.15 hrs Welcome address: Dr. Punya Prasad Regmi, NDRI 10.15 ‐10.30 hrs Introduction of the project and stakeholder meeting: Dr. Chinta Mani Gautam,
Project Leader, NDRI 10.30 ‐11.00 hrs Formal opening of the meeting and Opening remarks by Chief Guest 11.00 ‐11.30 hrs Introduction of NDRI: Dr. Nawa Raj Khatiwada, Executive Director, NDRI 11.30 ‐12.00 hrs Presentation on "Community Forestry and Climate Channge"(Tentative):Mr.
Krishna Acharya, Chief, REDD 12.00 ‐12.30 hrs Closing Remarks by Dr. Tara Nidhi Bhattarai, President, NDRI
12.30‐13.30 hrs Lunch break
13.30‐17. 00 hrs Technical session
13.30‐14.00 hrs Presentation : "Assessment of Role of Community Forests (CFs) in CO2 Sequestration, Biodiversity, and Land Use Change" Part I : Project Background
Speaker : Dr. Chinta Mani Gautam, Project Leader, NDRI 14.00 ‐ 14.30 hrs Part II : Biodiversity and CO2 Sequestration
Speaker : Mr. Dipesh Pyakurel, NDRI 14.30 ‐ 15.00 hrs Part III : Landuse
Speaker : Mr. Man Bahadur Kshetri, Senior Research Associate, NDRI 15.00 ‐ 15.30 hrs Discussion
15.30‐ 16.00 hrs Tea/ coffee break
16.00‐ 16.30 hrs Distribution of material on forest inventory and briefing 16.30‐17.00 hrs Group work 17.00‐ 17.30 hrs Brainstorming activities 17.30‐18.00 hrs General discussion and Feedback from participants 18.00‐ 20.00 hrs Dinner
(Master of Ceremony/ Facilitator: Ms. Sriju Sharma, Research Associate, NDRI)
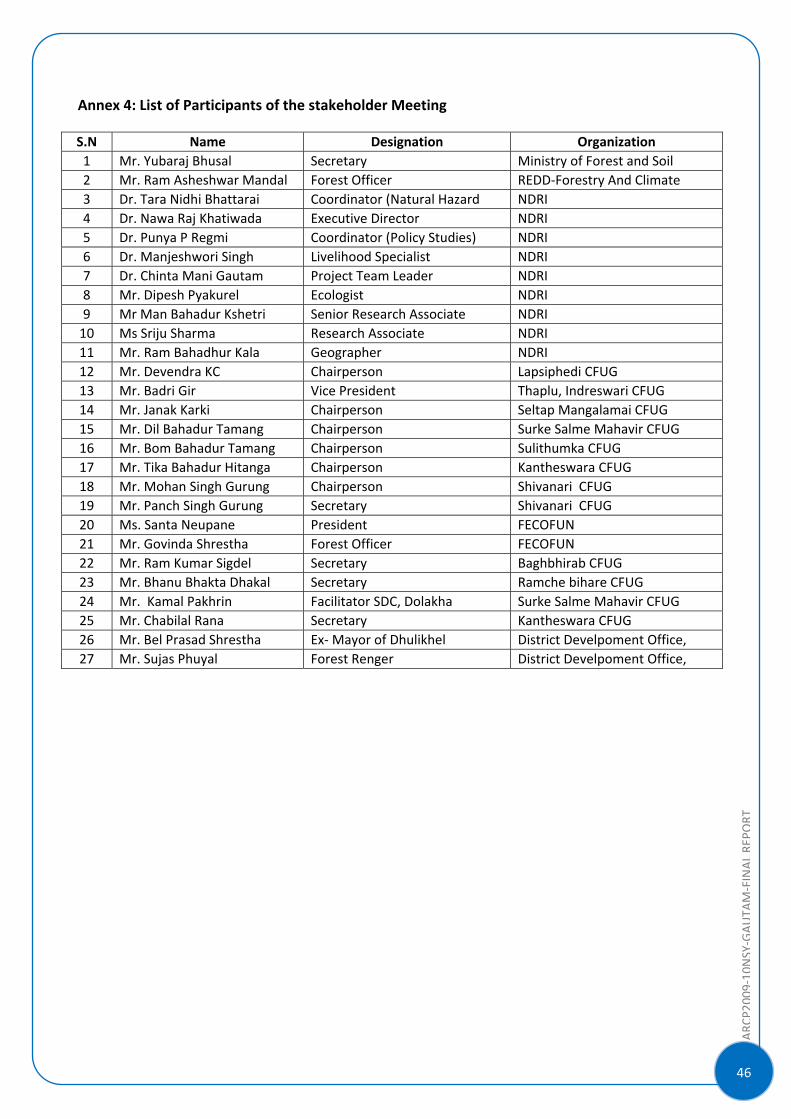
46
ARC
P2009‐10NSY‐GAUTA
M‐FINALRE
PORT
Annex 4: List of Participants of the stakeholder Meeting
S.N Name Designation Organization 1 Mr. Yubaraj Bhusal Secretary Ministry of Forest and Soil 2 Mr. Ram Asheshwar Mandal Forest Officer REDD‐Forestry And Climate 3 Dr. Tara Nidhi Bhattarai Coordinator (Natural Hazard NDRI 4 Dr. Nawa Raj Khatiwada Executive Director NDRI 5 Dr. Punya P Regmi Coordinator (Policy Studies) NDRI 6 Dr. Manjeshwori Singh Livelihood Specialist NDRI 7 Dr. Chinta Mani Gautam Project Team Leader NDRI 8 Mr. Dipesh Pyakurel Ecologist NDRI 9 Mr Man Bahadur Kshetri Senior Research Associate NDRI 10 Ms Sriju Sharma Research Associate NDRI 11 Mr. Ram Bahadhur Kala Geographer NDRI 12 Mr. Devendra KC Chairperson Lapsiphedi CFUG 13 Mr. Badri Gir Vice President Thaplu, Indreswari CFUG 14 Mr. Janak Karki Chairperson Seltap Mangalamai CFUG 15 Mr. Dil Bahadur Tamang Chairperson Surke Salme Mahavir CFUG 16 Mr. Bom Bahadur Tamang Chairperson Sulithumka CFUG 17 Mr. Tika Bahadur Hitanga Chairperson Kantheswara CFUG 18 Mr. Mohan Singh Gurung Chairperson Shivanari CFUG 19 Mr. Panch Singh Gurung Secretary Shivanari CFUG 20 Ms. Santa Neupane President FECOFUN 21 Mr. Govinda Shrestha Forest Officer FECOFUN 22 Mr. Ram Kumar Sigdel Secretary Baghbhirab CFUG 23 Mr. Bhanu Bhakta Dhakal Secretary Ramche bihare CFUG 24 Mr. Kamal Pakhrin Facilitator SDC, Dolakha Surke Salme Mahavir CFUG 25 Mr. Chabilal Rana Secretary Kantheswara CFUG 26 Mr. Bel Prasad Shrestha Ex‐ Mayor of Dhulikhel District Develpoment Office, 27 Mr. Sujas Phuyal Forest Renger District Develpoment Office,
ARC
P2009‐10NSY‐GAUTA
M‐FINALRE
PORT
]
47
Annex 5: Presentation slides of the Stakeholder Meeting
Page No.
1. Mr. Ram Asheshwor Mandal …………………………………………………………………….48
2. Dr. Chinta Mani Gautam…………………………………………………………………………….54
3. Mr. Dipesh Pyakurel…………………………………………………………………………………..57
4. Mr. Man Bahadur Khsetri…………………………………………………………………………..62
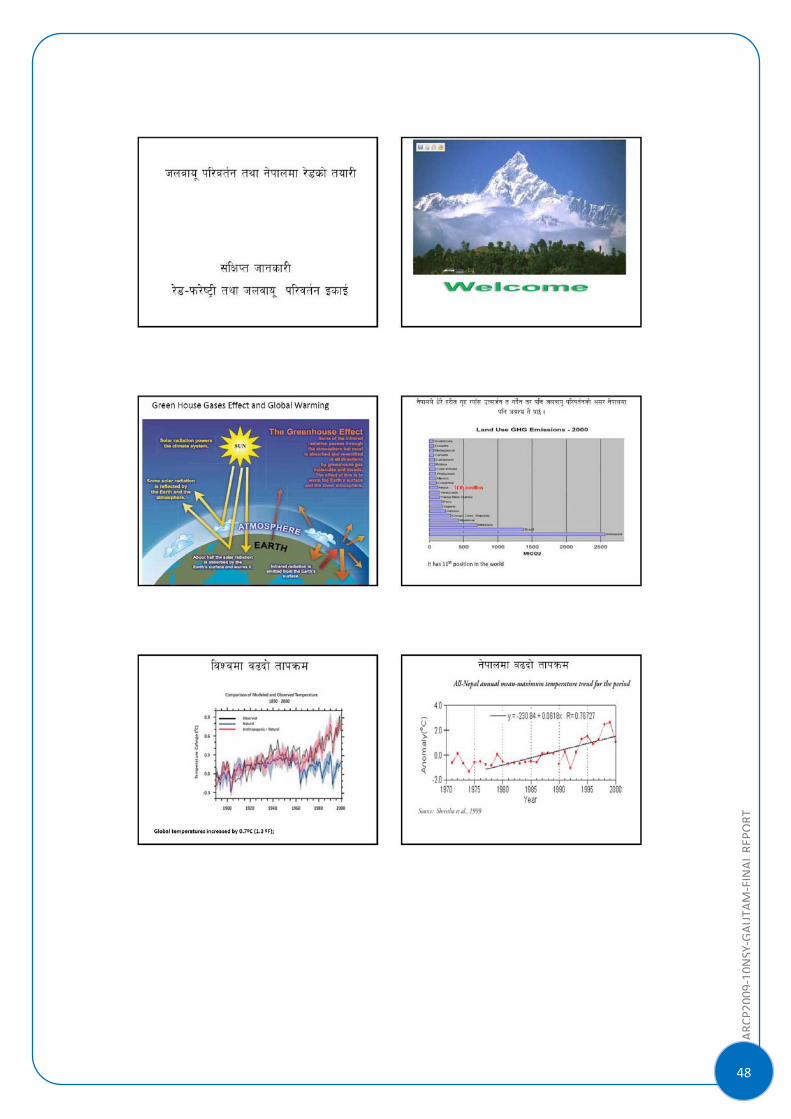
48
ARC
P2009‐10NSY‐GAUTA
M‐FINALRE
PORT
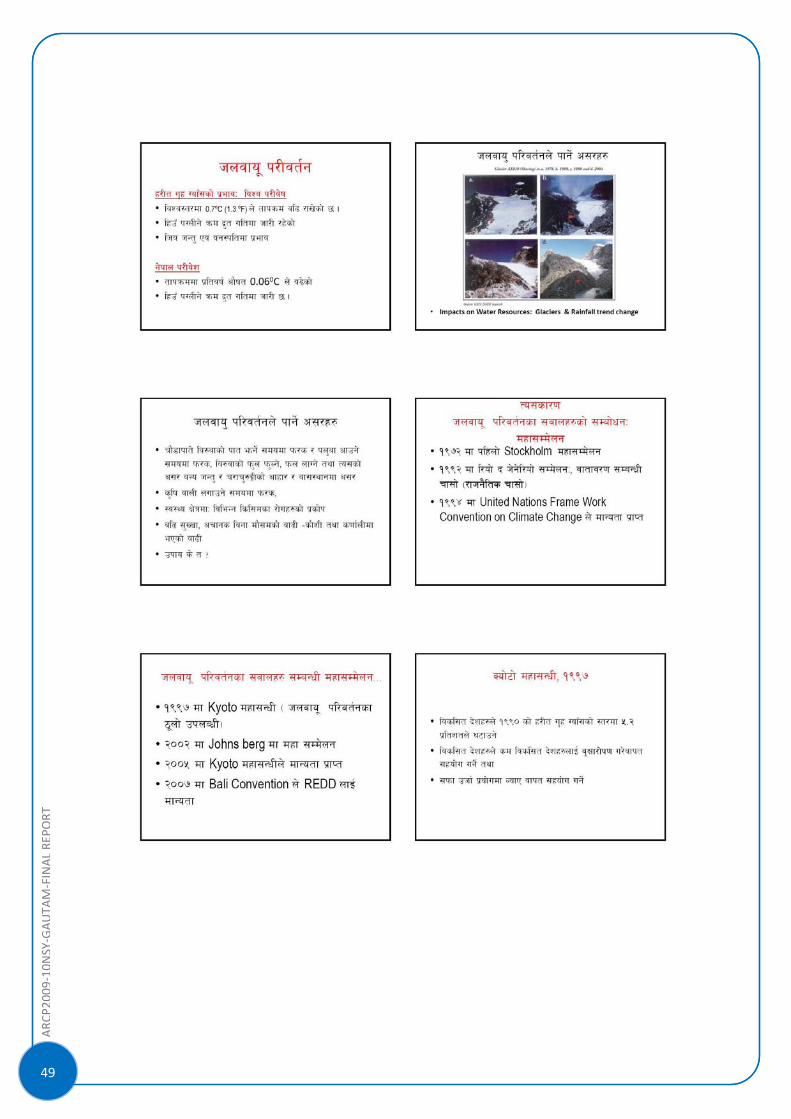
ARC
P2009‐10NSY‐GAUTA
M‐FINALRE
PORT
]
49
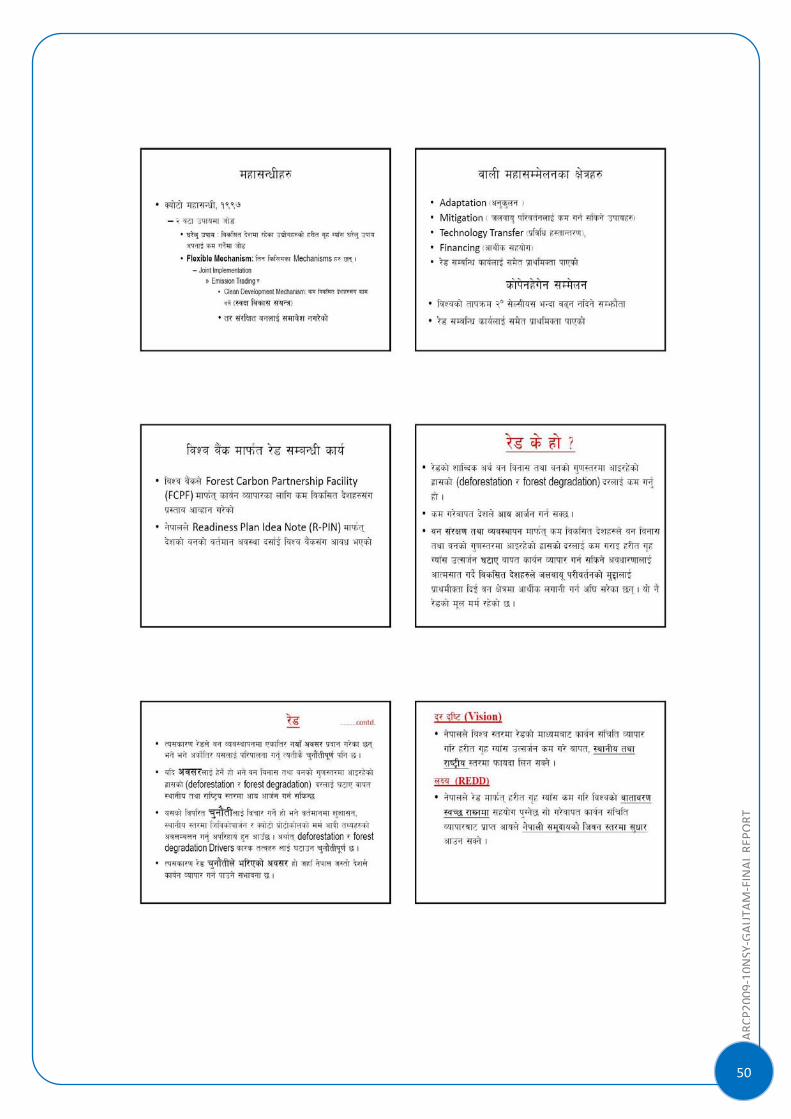
50
ARC
P2009‐10NSY‐GAUTA
M‐FINALRE
PORT
ARC
P2009‐10NSY‐GAUTA
M‐FINALRE
PORT
]
51
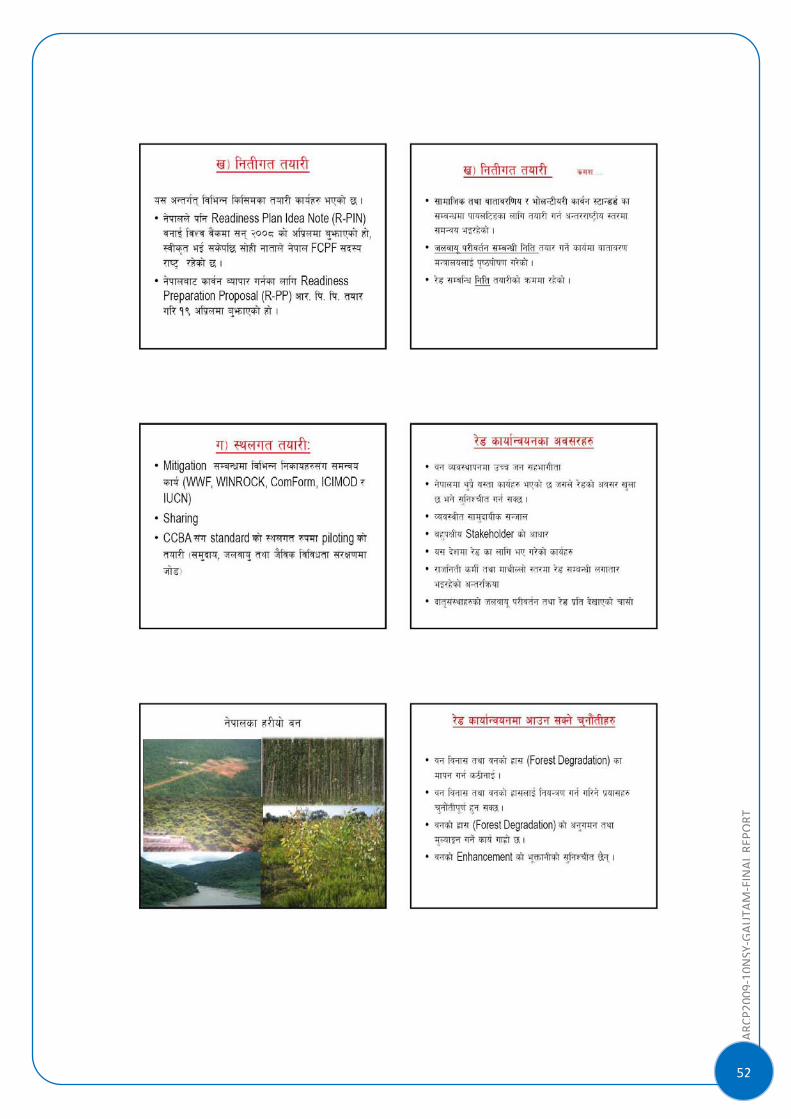
52
ARC
P2009‐10NSY‐GAUTA
M‐FINALRE
PORT
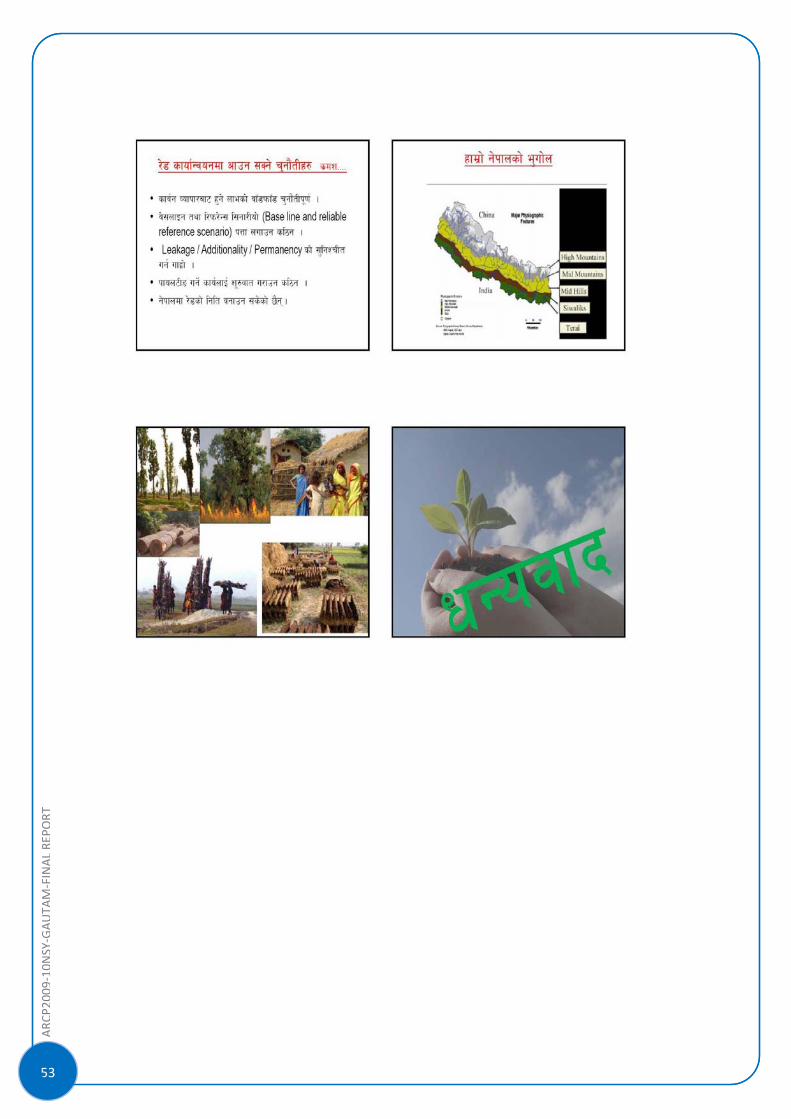
ARC
P2009‐10NSY‐GAUTA
M‐FINALRE
PORT
]
53
54
ARC
P2009‐10NSY‐GAUTA
M‐FINALRE
PORT
ARC
P2009‐10NSY‐GAUTA
M‐FINALRE
PORT
]
55
56
ARC
P2009‐10NSY‐GAUTA
M‐FINALRE
PORT
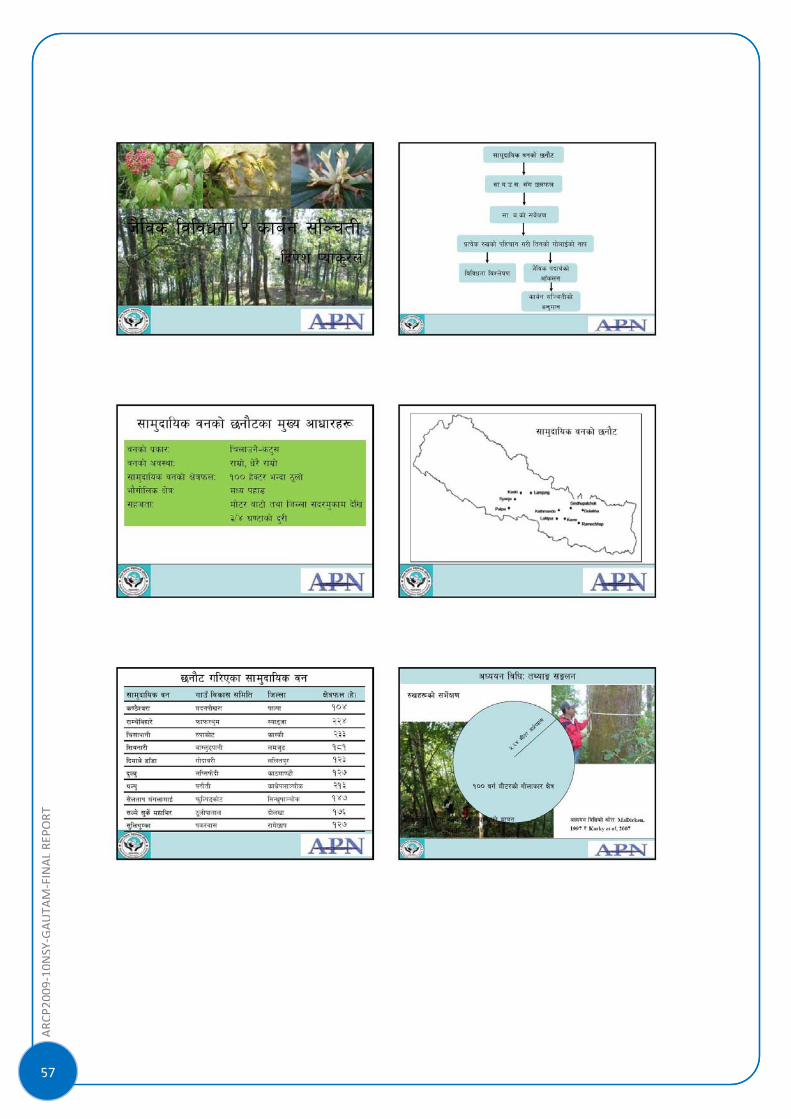
ARC
P2009‐10NSY‐GAUTA
M‐FINALRE
PORT
]
57
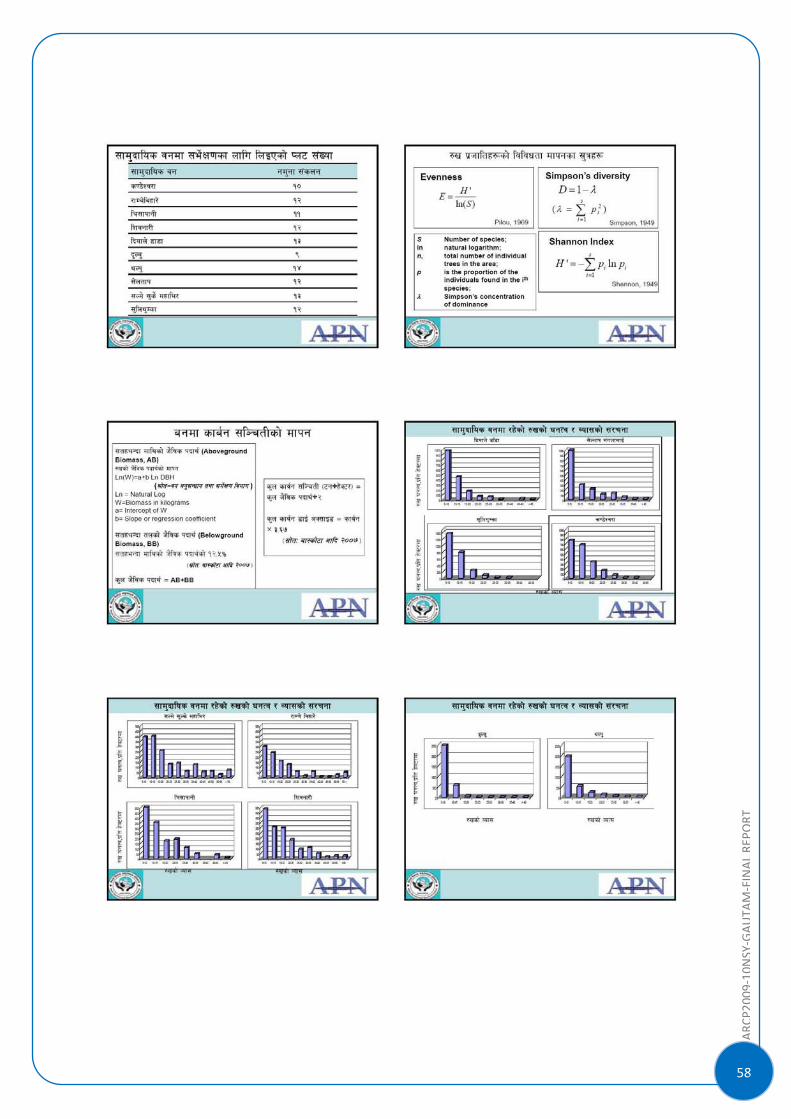
58
ARC
P2009‐10NSY‐GAUTA
M‐FINALRE
PORT
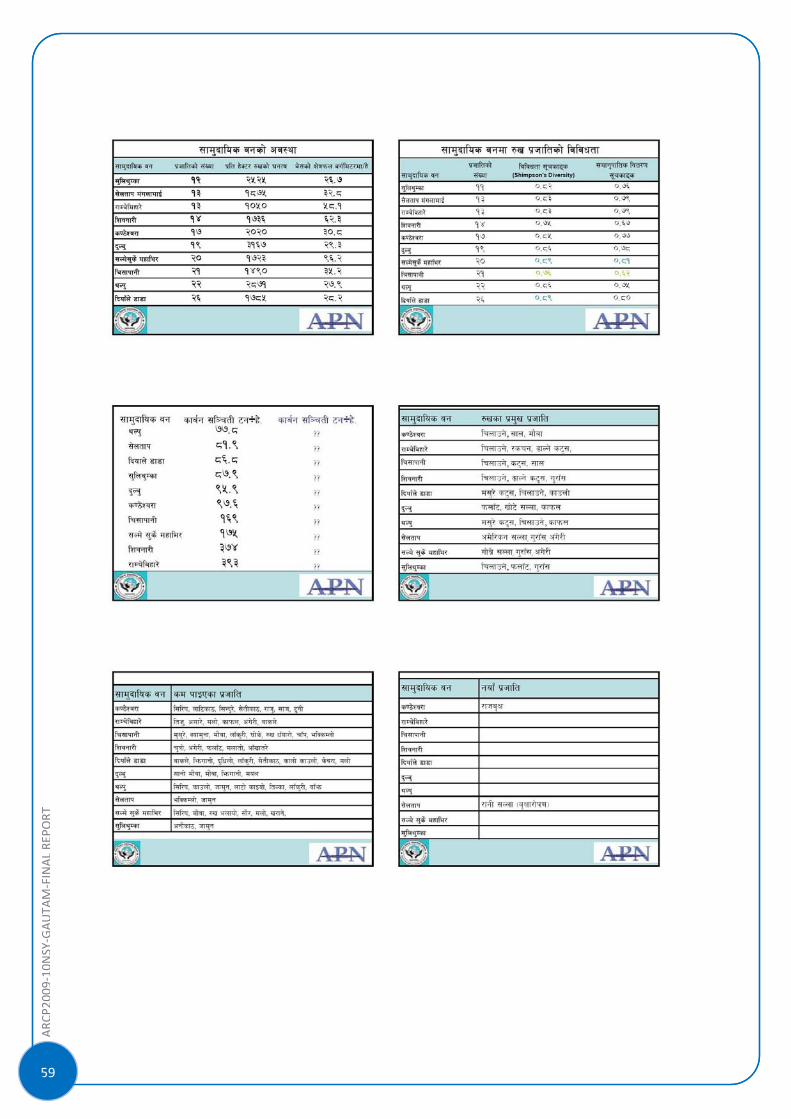
ARC
P2009‐10NSY‐GAUTA
M‐FINALRE
PORT
]
59
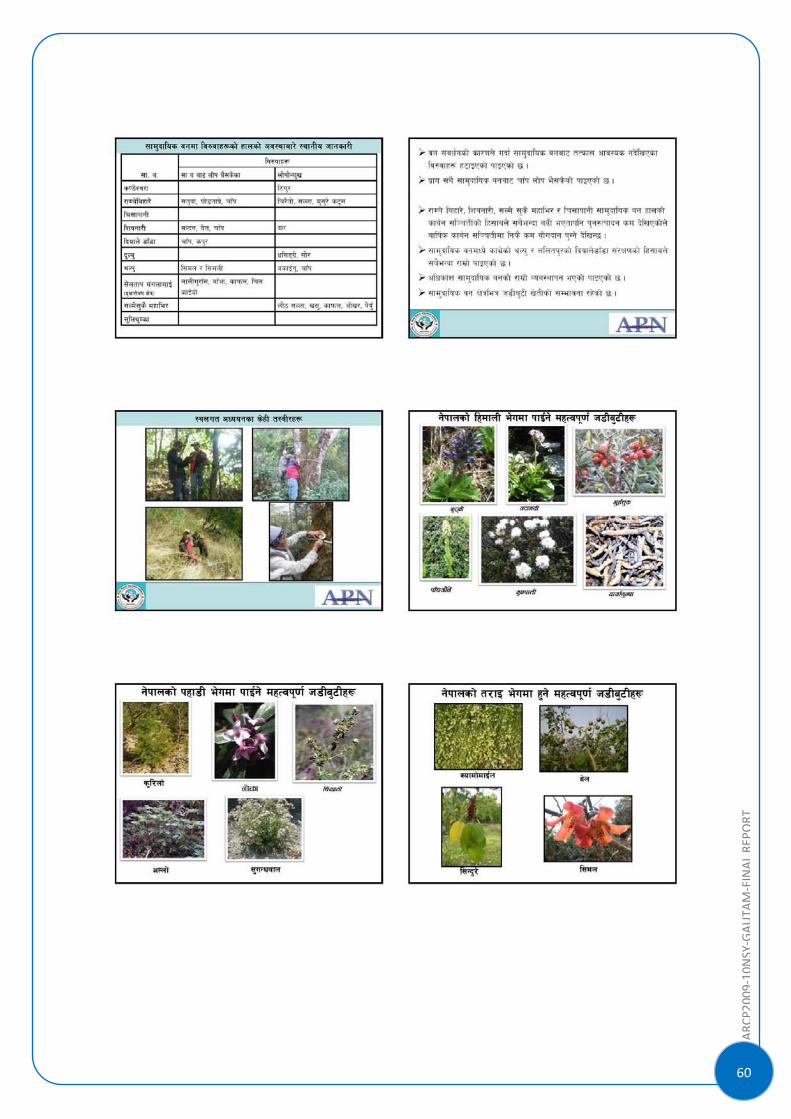
60
ARC
P2009‐10NSY‐GAUTA
M‐FINALRE
PORT
ARC
P2009‐10NSY‐GAUTA
M‐FINALRE
PORT
]
61
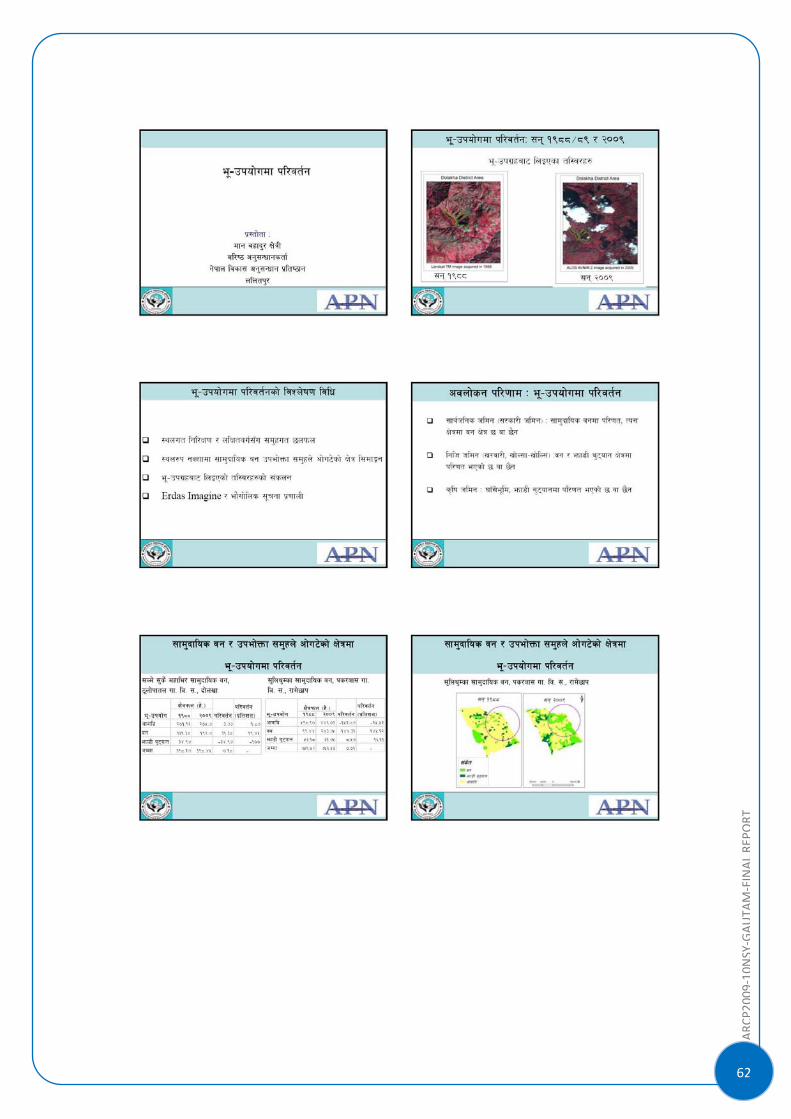
62
ARC
P2009‐10NSY‐GAUTA
M‐FINALRE
PORT
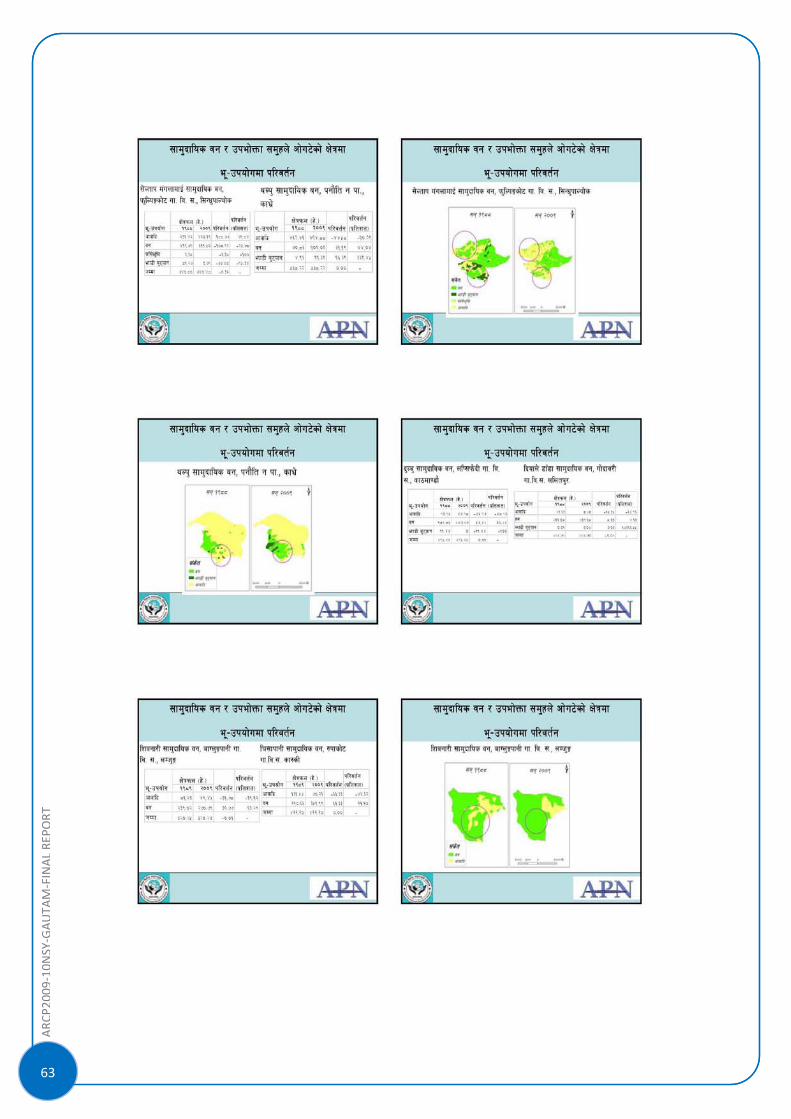
ARC
P2009‐10NSY‐GAUTA
M‐FINALRE
PORT
]
63
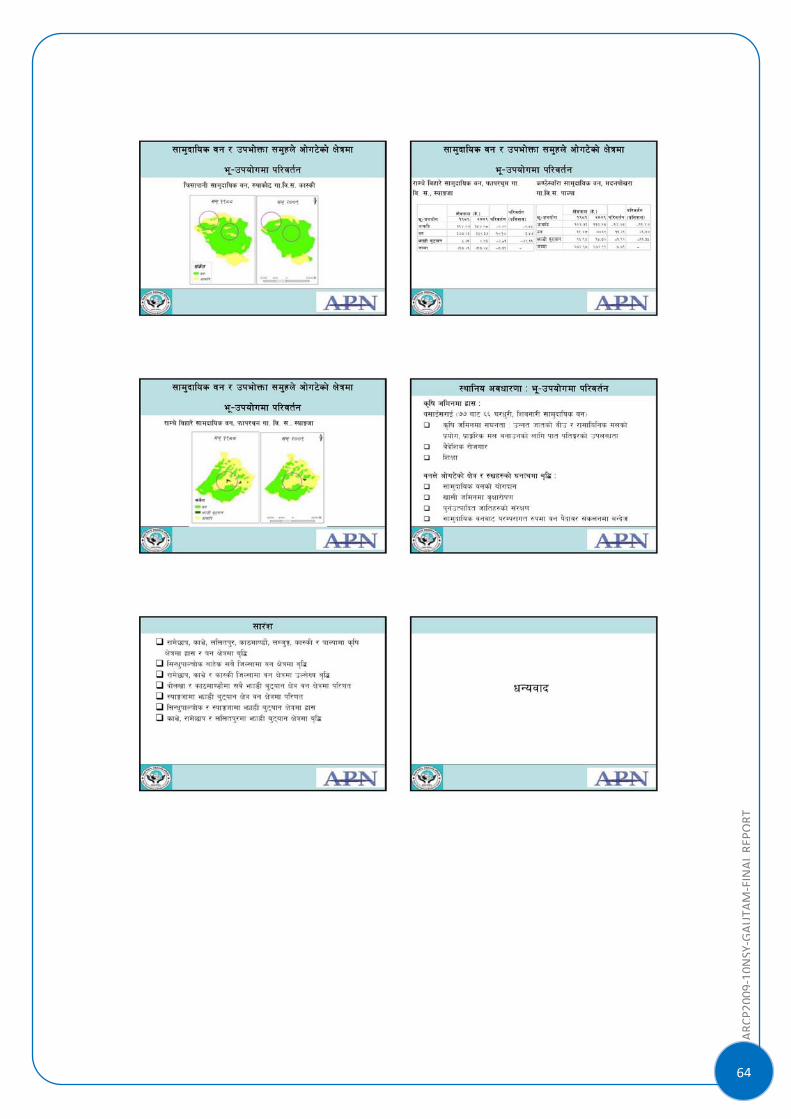
64
ARC
P2009‐10NSY‐GAUTA
M‐FINALRE
PORT
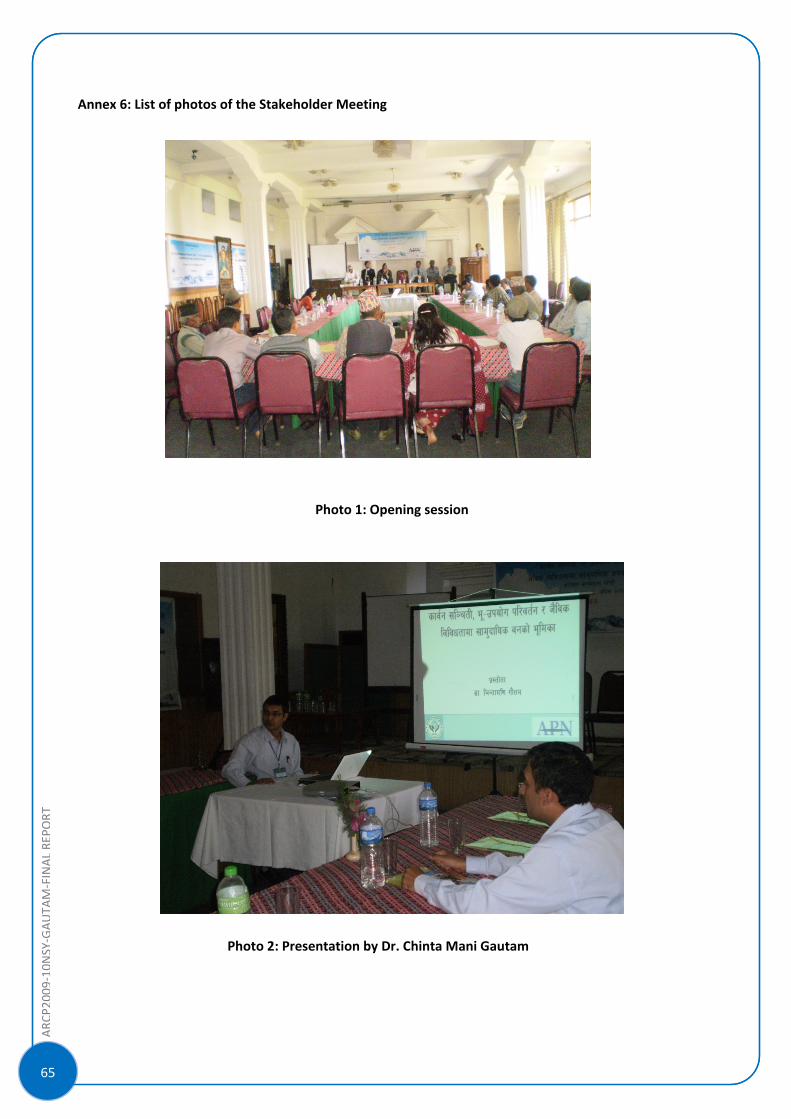
ARC
P2009‐10NSY‐GAUTA
M‐FINALRE
PORT
]
65
Annex 6: List of photos of the Stakeholder Meeting
Photo 1: Opening session
Photo 2: Presentation by Dr. Chinta Mani Gautam
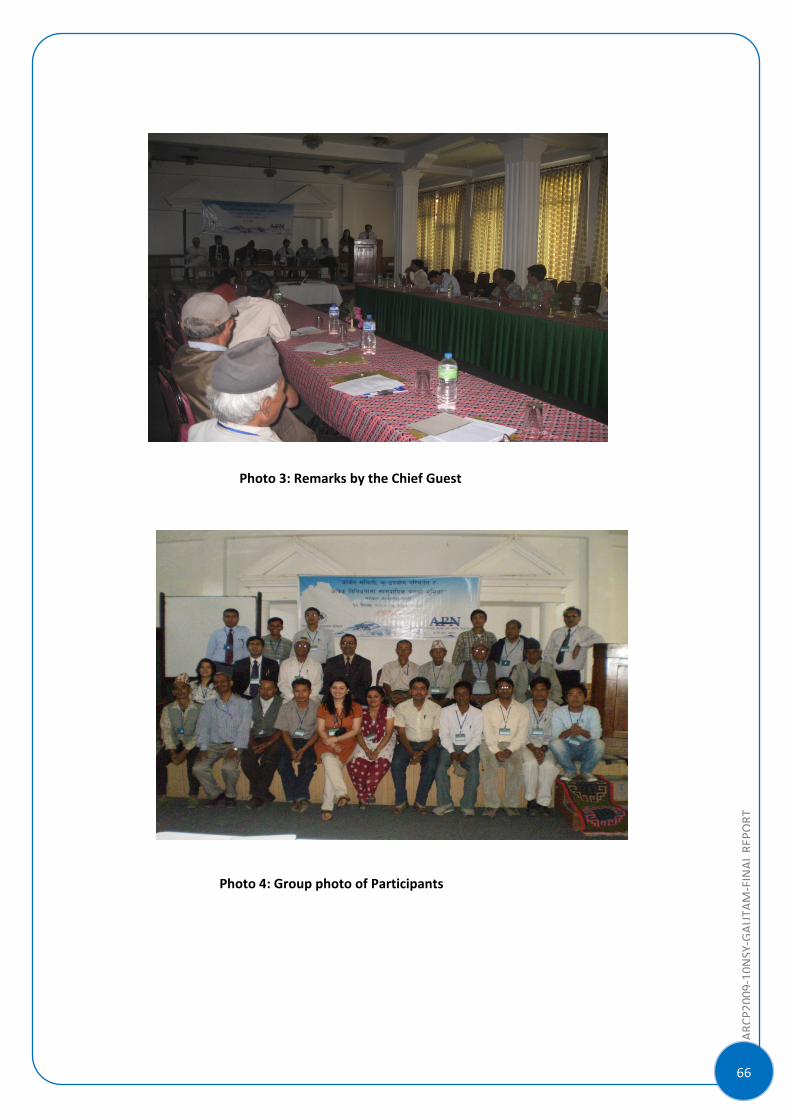
66
ARC
P2009‐10NSY‐GAUTA
M‐FINALRE
PORT
Photo 3: Remarks by the Chief Guest
Photo 4: Group photo of Participants
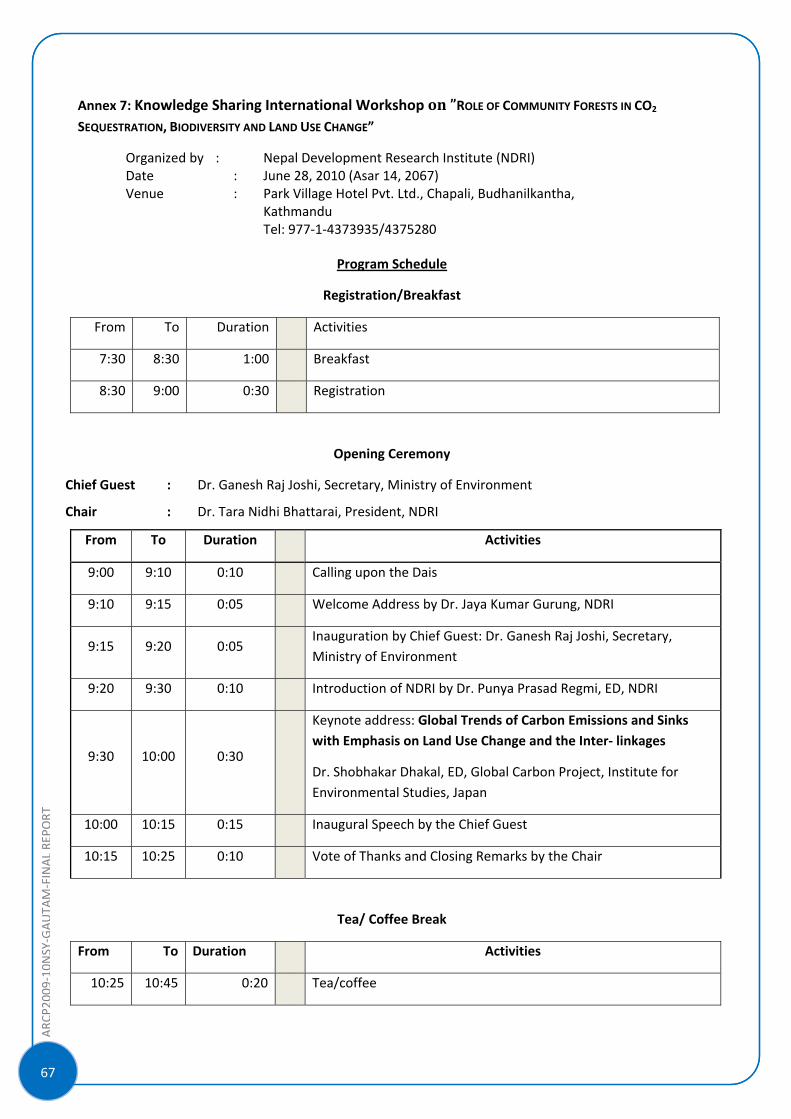
ARC
P2009‐10NSY‐GAUTA
M‐FINALRE
PORT
]
67
Annex 7: Knowledge Sharing International Workshop on ”ROLE OF COMMUNITY FORESTS IN CO2
SEQUESTRATION, BIODIVERSITY AND LAND USE CHANGE”
Organized by : Nepal Development Research Institute (NDRI) Date : June 28, 2010 (Asar 14, 2067) Venue : Park Village Hotel Pvt. Ltd., Chapali, Budhanilkantha, Kathmandu Tel: 977‐1‐4373935/4375280
Program Schedule
Registration/Breakfast
From To Duration Activities
7:30 8:30 1:00 Breakfast
8:30 9:00 0:30 Registration
Opening Ceremony
Chief Guest : Dr. Ganesh Raj Joshi, Secretary, Ministry of Environment
Chair : Dr. Tara Nidhi Bhattarai, President, NDRI
From To Duration Activities
9:00 9:10 0:10 Calling upon the Dais
9:10 9:15 0:05 Welcome Address by Dr. Jaya Kumar Gurung, NDRI
9:15 9:20 0:05
Inauguration by Chief Guest: Dr. Ganesh Raj Joshi, Secretary, Ministry of Environment
9:20 9:30 0:10 Introduction of NDRI by Dr. Punya Prasad Regmi, ED, NDRI
9:30 10:00 0:30
Keynote address: Global Trends of Carbon Emissions and Sinks with Emphasis on Land Use Change and the Inter‐ linkages
Dr. Shobhakar Dhakal, ED, Global Carbon Project, Institute for Environmental Studies, Japan
10:00 10:15 0:15 Inaugural Speech by the Chief Guest
10:15 10:25 0:10 Vote of Thanks and Closing Remarks by the Chair
Tea/ Coffee Break
From To Duration Activities
10:25 10:45 0:20 Tea/coffee
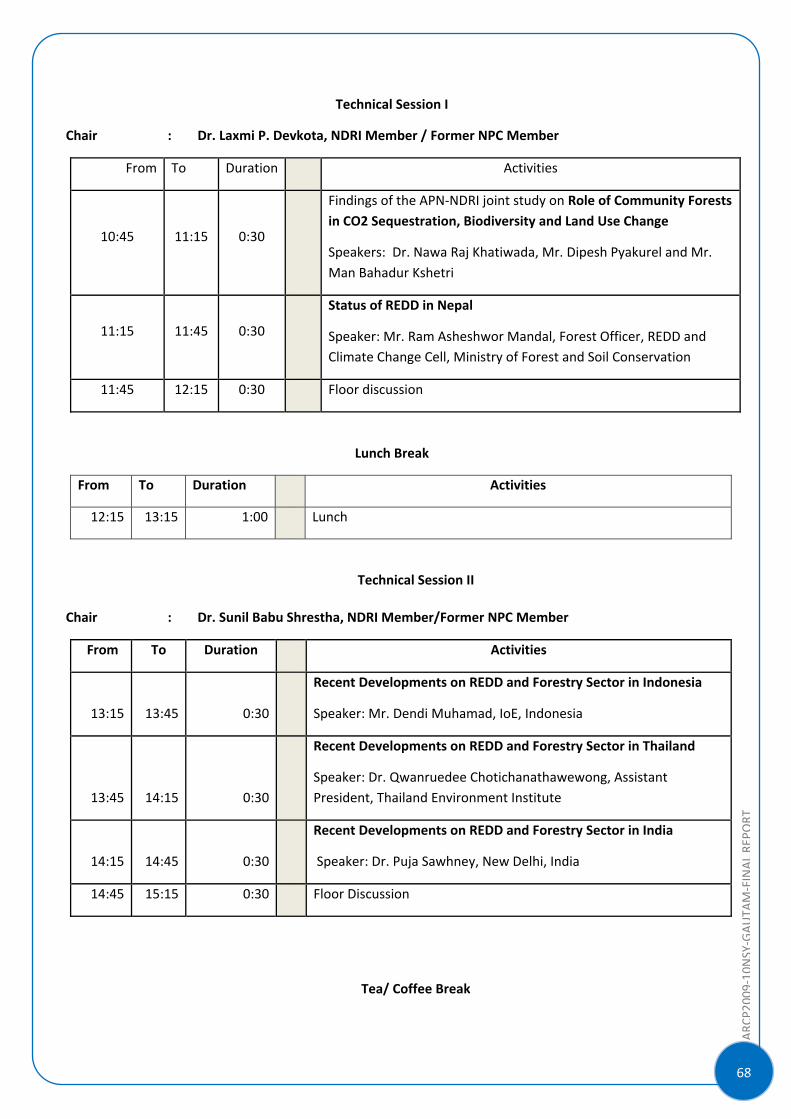
68
ARC
P2009‐10NSY‐GAUTA
M‐FINALRE
PORT
Technical Session I
Chair : Dr. Laxmi P. Devkota, NDRI Member / Former NPC Member
From To Duration Activities
10:45 11:15 0:30
Findings of the APN‐NDRI joint study on Role of Community Forests in CO2 Sequestration, Biodiversity and Land Use Change
Speakers: Dr. Nawa Raj Khatiwada, Mr. Dipesh Pyakurel and Mr. Man Bahadur Kshetri
11:15 11:45 0:30
Status of REDD in Nepal
Speaker: Mr. Ram Asheshwor Mandal, Forest Officer, REDD and Climate Change Cell, Ministry of Forest and Soil Conservation
11:45 12:15 0:30 Floor discussion
Lunch Break
From To Duration Activities
12:15 13:15 1:00 Lunch
Technical Session II
Chair : Dr. Sunil Babu Shrestha, NDRI Member/Former NPC Member
From To Duration Activities
13:15 13:45 0:30
Recent Developments on REDD and Forestry Sector in Indonesia
Speaker: Mr. Dendi Muhamad, IoE, Indonesia
13:45 14:15 0:30
Recent Developments on REDD and Forestry Sector in Thailand
Speaker: Dr. Qwanruedee Chotichanathawewong, Assistant President, Thailand Environment Institute
14:15 14:45 0:30
Recent Developments on REDD and Forestry Sector in India
Speaker: Dr. Puja Sawhney, New Delhi, India
14:45 15:15 0:30 Floor Discussion
Tea/ Coffee Break
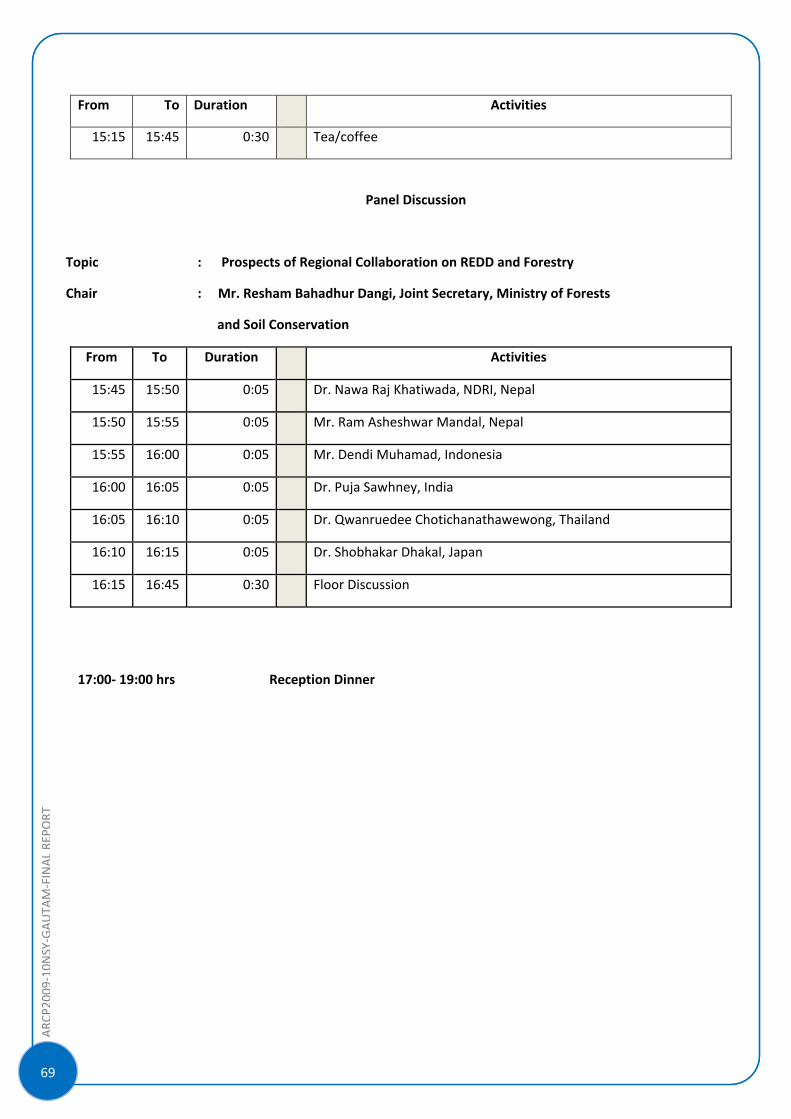
ARC
P2009‐10NSY‐GAUTA
M‐FINALRE
PORT
]
69
From To Duration Activities
15:15 15:45 0:30 Tea/coffee
Panel Discussion
Topic : Prospects of Regional Collaboration on REDD and Forestry
Chair : Mr. Resham Bahadhur Dangi, Joint Secretary, Ministry of Forests
and Soil Conservation
From To Duration Activities
15:45 15:50 0:05 Dr. Nawa Raj Khatiwada, NDRI, Nepal
15:50 15:55 0:05 Mr. Ram Asheshwar Mandal, Nepal
15:55 16:00 0:05 Mr. Dendi Muhamad, Indonesia
16:00 16:05 0:05 Dr. Puja Sawhney, India
16:05 16:10 0:05 Dr. Qwanruedee Chotichanathawewong, Thailand
16:10 16:15 0:05 Dr. Shobhakar Dhakal, Japan
16:15 16:45 0:30 Floor Discussion
17:00‐ 19:00 hrs Reception Dinner
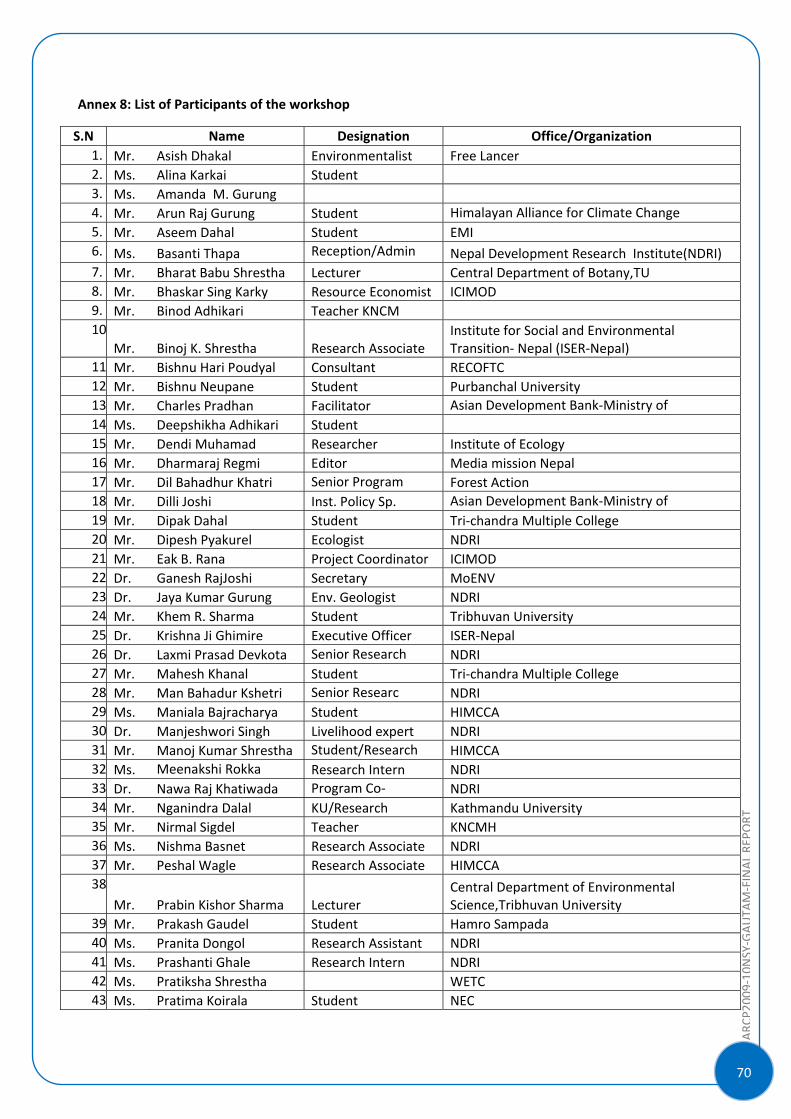
70
ARC
P2009‐10NSY‐GAUTA
M‐FINALRE
PORT
Annex 8: List of Participants of the workshop
S.N Name Designation Office/Organization 1. Mr. Asish Dhakal Environmentalist Free Lancer 2. Ms. Alina Karkai Student 3. Ms. Amanda M. Gurung 4. Mr. Arun Raj Gurung Student Himalayan Alliance for Climate Change 5. Mr. Aseem Dahal Student EMI 6. Ms. Basanti Thapa Reception/Admin Nepal Development Research Institute(NDRI) 7. Mr. Bharat Babu Shrestha Lecturer Central Department of Botany,TU 8. Mr. Bhaskar Sing Karky Resource Economist ICIMOD 9. Mr. Binod Adhikari Teacher KNCM 10
Mr. Binoj K. Shrestha Research Associate Institute for Social and Environmental Transition‐ Nepal (ISER‐Nepal)
11 Mr. Bishnu Hari Poudyal Consultant RECOFTC 12 Mr. Bishnu Neupane Student Purbanchal University 13 Mr. Charles Pradhan Facilitator Asian Development Bank‐Ministry of 14 Ms. Deepshikha Adhikari Student 15 Mr. Dendi Muhamad Researcher Institute of Ecology 16 Mr. Dharmaraj Regmi Editor Media mission Nepal 17 Mr. Dil Bahadhur Khatri Senior Program Forest Action 18 Mr. Dilli Joshi Inst. Policy Sp. Asian Development Bank‐Ministry of 19 Mr. Dipak Dahal Student Tri‐chandra Multiple College 20 Mr. Dipesh Pyakurel Ecologist NDRI 21 Mr. Eak B. Rana Project Coordinator ICIMOD 22 Dr. Ganesh RajJoshi Secretary MoENV 23 Dr. Jaya Kumar Gurung Env. Geologist NDRI 24 Mr. Khem R. Sharma Student Tribhuvan University 25 Dr. Krishna Ji Ghimire Executive Officer ISER‐Nepal 26 Dr. Laxmi Prasad Devkota Senior Research NDRI 27 Mr. Mahesh Khanal Student Tri‐chandra Multiple College 28 Mr. Man Bahadur Kshetri Senior Researc NDRI 29 Ms. Maniala Bajracharya Student HIMCCA 30 Dr. Manjeshwori Singh Livelihood expert NDRI 31 Mr. Manoj Kumar Shrestha Student/Research HIMCCA 32 Ms. Meenakshi Rokka Research Intern NDRI 33 Dr. Nawa Raj Khatiwada Program Co‐ NDRI 34 Mr. Nganindra Dalal KU/Research Kathmandu University 35 Mr. Nirmal Sigdel Teacher KNCMH 36 Ms. Nishma Basnet Research Associate NDRI 37 Mr. Peshal Wagle Research Associate HIMCCA 38
Mr. Prabin Kishor Sharma Lecturer Central Department of Environmental Science,Tribhuvan University
39 Mr. Prakash Gaudel Student Hamro Sampada 40 Ms. Pranita Dongol Research Assistant NDRI 41 Ms. Prashanti Ghale Research Intern NDRI 42 Ms. Pratiksha Shrestha WETC 43 Ms. Pratima Koirala Student NEC
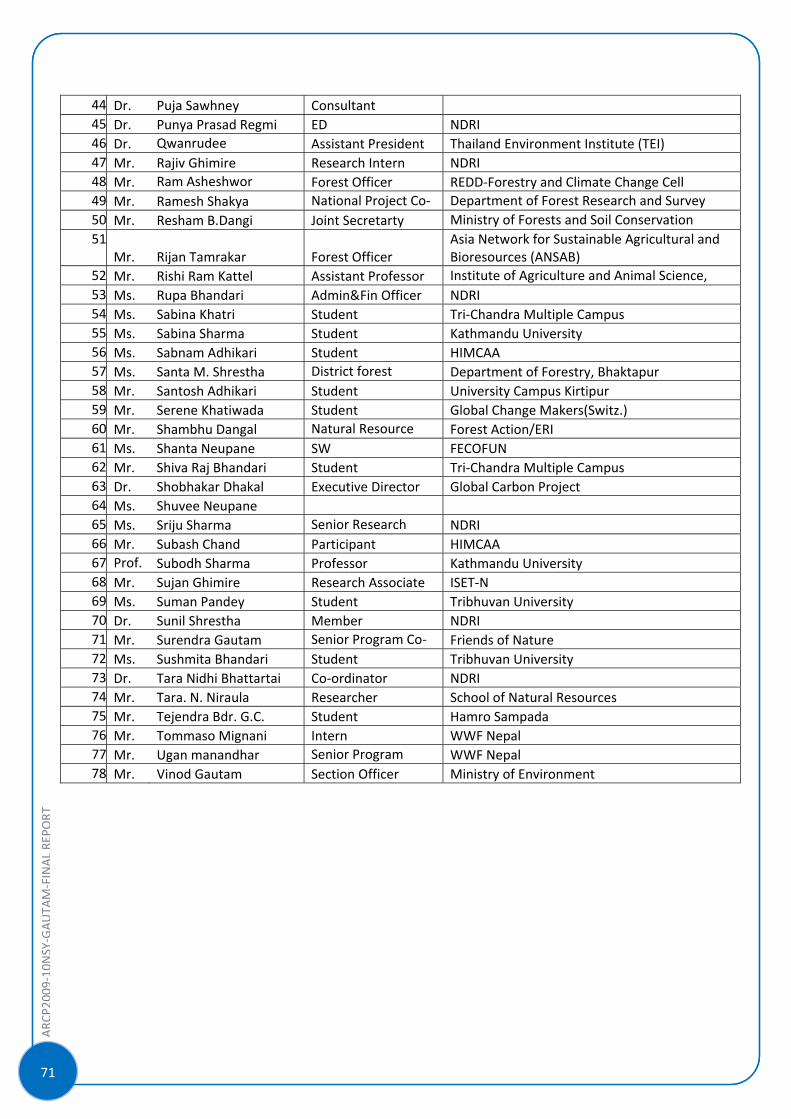
ARC
P2009‐10NSY‐GAUTA
M‐FINALRE
PORT
]
71
44 Dr. Puja Sawhney Consultant 45 Dr. Punya Prasad Regmi ED NDRI 46 Dr. Qwanrudee Assistant President Thailand Environment Institute (TEI) 47 Mr. Rajiv Ghimire Research Intern NDRI 48 Mr. Ram Asheshwor Forest Officer REDD‐Forestry and Climate Change Cell 49 Mr. Ramesh Shakya National Project Co‐ Department of Forest Research and Survey 50 Mr. Resham B.Dangi Joint Secretarty Ministry of Forests and Soil Conservation 51
Mr. Rijan Tamrakar Forest Officer Asia Network for Sustainable Agricultural and Bioresources (ANSAB)
52 Mr. Rishi Ram Kattel Assistant Professor Institute of Agriculture and Animal Science, 53 Ms. Rupa Bhandari Admin&Fin Officer NDRI 54 Ms. Sabina Khatri Student Tri‐Chandra Multiple Campus 55 Ms. Sabina Sharma Student Kathmandu University 56 Ms. Sabnam Adhikari Student HIMCAA 57 Ms. Santa M. Shrestha District forest Department of Forestry, Bhaktapur 58 Mr. Santosh Adhikari Student University Campus Kirtipur 59 Mr. Serene Khatiwada Student Global Change Makers(Switz.) 60 Mr. Shambhu Dangal Natural Resource Forest Action/ERI 61 Ms. Shanta Neupane SW FECOFUN 62 Mr. Shiva Raj Bhandari Student Tri‐Chandra Multiple Campus 63 Dr. Shobhakar Dhakal Executive Director Global Carbon Project 64 Ms. Shuvee Neupane 65 Ms. Sriju Sharma Senior Research NDRI 66 Mr. Subash Chand Participant HIMCAA 67 Prof. Subodh Sharma Professor Kathmandu University 68 Mr. Sujan Ghimire Research Associate ISET‐N 69 Ms. Suman Pandey Student Tribhuvan University 70 Dr. Sunil Shrestha Member NDRI 71 Mr. Surendra Gautam Senior Program Co‐ Friends of Nature 72 Ms. Sushmita Bhandari Student Tribhuvan University 73 Dr. Tara Nidhi Bhattartai Co‐ordinator NDRI 74 Mr. Tara. N. Niraula Researcher School of Natural Resources 75 Mr. Tejendra Bdr. G.C. Student Hamro Sampada 76 Mr. Tommaso Mignani Intern WWF Nepal 77 Mr. Ugan manandhar Senior Program WWF Nepal 78 Mr. Vinod Gautam Section Officer Ministry of Environment
72
ARC
P2009‐10NSY‐GAUTA
M‐FINALRE
PORT
Annex 9: Rappoteur’s Report
Knowledge Sharing International workshop on “Role of Community Forests in CO2 Sequestration biodiversity and Land Use Change”
INAUGURATION CEREMONY
The inaugural ceremony was started with the welcome speech by Dr. Jaya Kumar Gurung, NDRI member. He emphasized on the inability of people to synchronize the synergetic effect of intellectual minds to address the issue of climate change. He added, minds loaded with big complicated ideas overlook simple solutions which will create poor implementation of the programs. He said, this symposium is highly relevant to the emerging issues of climate change and NDRI is a leading initiative for research based strategic approach to the issue of climate change. Also he pointed out some of the unique significances of the location of the workshop like holy place with temple, Shivapuri National Park, residence of many celebrities etc. He called on the intellectuals to rectify the approach to issues about sustainable development and believed that this workshop had incredible potential to give directions for doing so.
After Dr. Gurung’s eloquent and encouraging speech, the program was formally inaugurated by lighting a light on panas by the Chief Guest Dr. Ganesh Raj Joshi, Secretary, Ministry of Environment.
Following the welcome speech, Dr. Ganesh Raj Joshi, Secretary, Ministry of Environment delivered his inaugural speech. Dr. Joshi congratulated NDRI for a wide range of achievements within a short span of time. He said, even though Nepal’s contribution to global carbon emission is very low, its impacts have been felt in various areas such as agriculture and food security, biodiversity, infrastructure and so on. He added, we are experiencing the impact of climate change in various sectors like energy, water, infrastructure, and species, especially in mountain and himalayan areas. The issue of mountain and biodiversity has not been discussed much in international negotiations so in order to change this the government is forming a mountain alliance with similar countries. He shared, cabinet has approved International Ministerial Conference in September. He added, to raise our voice in international level, we have support from ICIMOD to prepare two technical papers. And hopefully, ministers from 40‐50 countries will attend the conference and this will be path making initiative by Nepalese government. As for the CDM, he shared that the two projects of micro hydropower and ICS has implemented. He emphasized on the generation of the scientific paper and quantitative data. He added, government is providing research grant in Universities to generate some basic information. At the end of his speech, he suggested that NDRI should not only diversify the work area but also the professionals from different sectors.
Following the formal inauguration, there was a brief introduction of NDRI’s missions, visions, objectives and activities by Dr. Punya Prasad Regmi, Executive Director of NDRI which clearly showed the remarkable achievements of NDRI within a short span of six years since its establishment in 2004. He said, the mission of NDRI is to provide substantive analytical inputs for policy making on contemporary issues through rigorous research and dissemination of findings. The vision of NDRI is to become a center of excellence for policy research, education and development. Dr. Regmi added, some of the past and present activities conducted by NDRI like
MAPPING of RCIW Roads and Conflict Impact Information – in partnership with World Food Programme (WFP), Nepal.
ARC
P2009‐10NSY‐GAUTA
M‐FINALRE
PORT
]
73
Review and Facilitation of Public Private Partnership (PPP) in the Transport Sector in Nepal ‐ funded by World Bank and implemented jointly by Castalia Strategic Advisors, France and ICRA Management Consulting Services Ltd. (IMaCS), India.
Evaluation of Project on Rainwater Harvesting in Makwanpur ‐ with the financial assistance of Plan Nepal.
Baseline study on Raising Her Voice ‐ supported by OXFAM and in partnership with Women Security Pressure Group (WSPG).
Study on Environmental Change in Rural Asia ‐ with a focus on the Use of Pesticides and its Impact on Health of Nepalese Population ‐ in partnership with the University of Tokyo, Japan.
Climate Change Adaptation in Trans boundary River Basins: The Karnali River Sub‐ Basin, South Asia and the Oldman ‐ submitted to International Development Research Center (IDRC), Canada.
Assessment of Role of Community Forests (CFs) in CO2 Sequestration, Biodiversity, and Land Use Change ‐ with the financial assistance of APN (Asia Pacific Network for Global Change Research), Japan.
Training to Private Sector Health Service Providers on Malaria Prevention and Treatment ‐ in partnership with Population Services International (PSI)/Nepal (Second Phase).
Beneficiary Targeting Study and Pilot ‐ in partnership with UN‐WFP (United Nation ‐World Food Program).
Dr. Shobhakar Dhakal, Executive Director of Global Trends of Carbon Emissions and Sinks with Emphasis on Land Use Change and the Inter‐linkages‐Tsukuba International office, Japan delivered keynote speech and highlighted the global carbon budget and REDD+ regime setting. The presentation was highly informative and comprehensive. He said, despite all the talks, the CO2 emission is still shooting up. From the IPCC projection, he showed the worst scenario due to rising up of the temperature. He added, latest studies showed that despite the financial crisis, the CO2 emission is not decreasing.
He shed light on the aims of the REDD+. ‘+’ sign in REDD+ stands for reducing more carbon. Afforestation, biodiversity issues are incorporated in REDD but surface reflectivity is not much discussed. Brazil and Indonesia will be benefited by 60% from REDD. Also he added some of the case from Nepal about community forestry which is mostly successful in the midhills. He expressed that since Nepal has one of the best practices of forest groups in Nepal, there is significant potential for Nepal to gain from the REDD+ mechanism. Though the forests area is decreasing the biomass or carbon stock are increasing. He shared some issues discussed in the COP15 were the link with the carbon market and the ways to distribute those resources in the country. At the end, he emphasized that REDD+ could be helpful in climate stabilization. Yet it needs to address many other issues as well.
Global Carbon emissions, highlighted by Dr. Shobhakar Dhakal
According to IPCC, the atmospheric CO2 concentration rise from 375ppm to 380ppm in 2008. Annual CO2 growth rate emission in the year 2000‐2008 was 3.4% but in 1990‐2000 was 1% per year.
55% of CO2 emissions in terms of volume is from the developing countries but in terms of per capita income is high in developed countries.
The top emitters of CO2 (>4% of the total) are U.S.A, China, Russian Fed., India and Japan. China, USA and India are responsible for the 50% of the global emission.
Carbon emission from the tropical deforestation is 1.5 PgC/year in the year 2000‐2007. Tropical Africa has low carbon emissions as compared to its deforestation share.
The total CO2 emission from fossil fuel and land use change in 2008 is 8.7 PgC/yr and 1.2 PgC/yr respectively.
In 2008, if 1 ton of the carbon is emitted then 450 kg remains in the atmosphere. But in 1960’s if 1 ton carbon is emitted, 400kg remained in the atmosphere.
74
ARC
P2009‐10NSY‐GAUTA
M‐FINALRE
PORT
Dr. Tara Nidhi Bhattarai, President, NDRI, presented the Chief Guest and the Keynote speaker with token of appreciation. He thanked all the participants, Chief Guest, Guests, Keynote speaker for being part of the workshop in spite of the time constraints. He said, community forest is a successful program and after addition of CO2 sequestration, it would be more important. He thanked the organizers for the involvement of youth in the program as climate change issues might affect the future generations for years to come. And at the end, he requested everyone to make the program a grand success and also mentioned that identification and collaboration of relevant organizations was necessary for further research.
TECHNICAL SESSON I
Chaired by Dr. Laxmi P. Devkota, NDRI member/ Former NPC member.
In the beginning of the session, Dr. Devkota gave a brief introduction of the session and requested the paper presenter to sit in the first row and complete the session within one and half hour.
Presentation 1: Role of Community Forests in CO2 Sequestration, Biodiversity and Land Use Change by Dr. Nawa Raj Khatiwada, Mr. Dipesh Pyakurel and Mr. Man Bahadur Kshetri, Findings of APN/NDRI joint study.
Mr. Dipesh Pyakurel started the presentation with the introduction and the linkage of the community forest with biodiversity. He said, community forestry is an innovative practice in which forest area is handed over to local user groups for the conservation, sustainable use and management of forest and forest resources. He added, as CF is successful in midhills, ten community forest were selected from the ten district of midhills. The selected plots were marked with GPS and spray paint so it will help in further study. He pointed out, monocropping is more prevalent in most of the CFs which resulted in the removal of economically less important tree species. At the end he said, outcomes of the research might be useful for National level policy makers to develop/amend CF policy on landscape level.
Following the presentation on biodiversity, Mr. Kshetri started his presentation in Land Use change. He began his presentation by explaining the methodology for the conversion of the satellite image into land use classification. He highlighted the changes in land use in CFs and its peripheral zones. He said except Sindupalchowk forest area had increased in all other field sites and the reason for that decline was landslide instead of anthropogenic factors. He added the reason for diminishing agricultural land was intensive farming practices, foreign employment, education and migration. He concluded his presentation by emphasizing on the successful implementation and management of CF for the increment of forest area.
Dr. Nawa Raj Khatiwada started his presentation on “CO2 sequestration and future prospects” by sharing his experience of moving from a brown sector to blue and green sector. He said, this project was selected in the global competition and was the second project under the funding of APN. He explained the methodology used in the research for the estimation of carbon deposit. He pointed out, the scope for further research as follows:
• Estimation of carbon sequestration in terai and other development regions. • Estimation of soil carbon deposit. • Lobbying for CF on REDD framework. • Application for funding under various mechanisms • Regional collaboration
ARC
P2009‐10NSY‐GAUTA
M‐FINALRE
PORT
]
75
He also shed some light on climate investment funds and setting up a mechanism like CDM. He said, there should be synergy with REDD and green sector. There is a tremendous opportunity for research, entrepreneurship, employment and involvement. He ended his presentation by acknowledging all the team members, CF users group and department of survey.
Floor was opened for the discussion. Many questions were raised about the methodology. Mr. Pyakurel added the research work followed Mac. Dicken 1997 and species area curve method. One of the participants, Mr. Pravin Kishore Sharma, faculty in CDES asked about sources of data and methods for calculating the land use change. Mr. Kshetri replied that community forests and the peripheral area were chosen for the study and satellite image was used for the calculation. He added, CF is the major factor but due to the migration, the private land was converted into the forests land which increased the forest area and decreased the cultivated land. Mr. Ugan Manadhar, senior program officer, WWF suggested to also mention something about the software used for the study. Dr. Tara Nidhi Bhattrai asked if there is any link between monocropping practices and CF and loss of livelihood in rural community in Nepal. “There is no direct link with livelihood practices, but livelihood practices is changed in the sense that if the open grazing is banned then livelihood practices shifts” he replied.
Presentation 2: Status of REDD in Nepal by Mr. Ram Asheshwor Mandal, Forest Officer, REDD and Climate Change Cell, Ministry of Soil and Forest Conservation.
At the beginning of the presentation, Mr. Mandal gave a brief introduction of the global warming and climate change. He said, though Nepal contributes very less in GHG emission, impacts of Climate Change are serious. Island and mountainous countries are more affected due to warming because of sea level rise, melting glaciers etc. Globally, in 20th century temperature increased by 0.7ºC (1.3 ºF) and in context of Nepal, annual temperature rise by 0.060C. In his presentation, he showed the critical condition of the glaciers in Nepal which are in grave danger of sudden outburst. He highlighted several conventions on climate change that are carried out globally. Nepal submitted Readiness Pin Idea Note (R‐PIN) to the World Bank in15 April, 2008. He also highlighted the institutional mechanism of REDD. There are two types of institutional arrangement: REDD stakeholder forum and Apex body. The function of the apex body is to coordinate with top level and suggest to formulate the national REDD policy and the stakeholder forum serves as the principal outreach and communication platform and is already operational. Community Climate and Biodiversity Alliance has already started and piloted. “If you see the case of community forestry, there is hope for REDD in Nepal. Nepal has been getting the income from the CF and if carbon trade on REDD project is established, there will be more benefits mostly for the deprived group”, he said. He added, REDD project will create a lot of job opportunity, help in combating climate change issues and decrease the deforestation and degradation in Terai. At the end of his presentation, he said, political commitment is needed and necessary changes can be made in legal and institutional aspect as Nepal is preparing new constitution.
Dr. Shovakar opened the forum for discussion asking “Have we done any National forest inventory? What average year or baseline are we taking?” Mr. Ramesh Shakya, National Project Coordinator, Department of Forest Research and Survey (DFRS) replied, the report was published in 1999 and last inventory was done in 1990. The new inventory would be done with a concentration on carbon, biomass and carbon footprint. It would be a five‐year long project. Mr. Resham Dangi, Joint Secretary, Ministry of Forest and Soil Conservation, added, 1994 data was used as a baseline data. Map gives us three parameters but biomass survey and methodology is also necessary. We can use high resolution imagery and extrapolate 1990’s to get a reference level. But there is still argument going on in this matter. One of the participant, Amanda M. Gurung wanted to know about the benefit‐sharing mechanism in REDD and how benefits to
76
ARC
P2009‐10NSY‐GAUTA
M‐FINALRE
PORT
the community would be ensured. Mr. Mandal replied, “If you see the previous data, 22% of the forest is handed over to the community which show establishment of the sharing mechanism. People have already started discussing and conducting many programs to stakeholders”. Mr. Dangi gave some of the options about benefit sharing like establishment of trust fund or CF network but at the same time warned us about the transaction cost which requires a lot of robust plan in mechanism. He apprised, by the end of 2013, we will be able to make an institutional mechanism. From the 30yrs data of glaciers, Prof. Dr. Subodh Sharma, Kathmandu University said, there has been 3m/yr recession of the glacier and 0.9oC rise in temperature in the southern slopes where most glacial are present. He wanted to know about the methods used in calculating the carbon sequestration as it is related to both photosynthesis and respiration. Dr. Bhaskar Singh Karky, Resource Economist, ICIMOD, replied, IPCC (2006) has recommended a guideline which is followed by the ICIMOD, ANSAP, FECOFON for research in carbon sequestration in yearly basis. Dr. Khatiwada wanted to know about the structure of line agency to see the fund flow of project on REDD. Mr. Mandal said, when R‐PP will be approved, fund will be available which might be in the next month. World Bank is funding to launch REDD activities that will support R‐PIN preparation and support from internal funding agency is also available.7.6 million dollars has been proposed for R‐PP. The chair person said we are in a transitional phase and using a lot of energy. So this might open the door for a new era and concluded the session by thanking the presenters. TECHNICAL SESSION II
Chaired by Dr. Sunil Babu Shrestha, NDRI Member/ Former NPC member
At the beginning of the session, Dr. Shrestha gave a brief introduction of the session and requested the presenters to complete the session within the given time limit.
Presentation 3: Recent Development on REDD and Forestry Sector in Indonesia by Mr. Dendi Muhamad, IOE, Indonesia.
Dr. Muhamad mentioned that since Indonesia has the third largest tropical forest in the world but is also the third biggest contributor of Greenhouse gases, the REDD mechanism in Indonesia would be a great opportunity. He added, on May 29, 2009 Indonesia became one of the first countries which produces REDD program national regulations. However, in a nation with a very high rate of deforestation and degradation due to reasons such as commercial timber logging, forestry industries, plantation industries, forest fire, the implementation of REDD mechanism is very challenging. In order to handle these challenges, Indonesia government has provided a framework and a solid legal basis in mitigating CC through REDD, including granting access to accommodate forest communities. It has also made efforts to eradicate intensive illegal logging and prioritized fight against corruption in all sectors. “REDD in Indonesia is following a three phase approach: preparation, readiness and full implementation” said Mr. Muhamad. Currently it is in the readiness phase and the third phase of full implementation will begin in 2013. REDD in Indonesia will be done gradually, with implementation at sub‐national level, which is integrated into national level and sub‐national implementation. Mr. Muhamad added, REDD initiatives are more likely to succeed if they build on the interest of forest communities and indigenous people. He emphasized on the importance of incentives in the form of payment or other benefits for good practices, developing alternative livelihoods, formalizing land tenure and local resource right and intensifying productivity in non‐forest lands. He concluded, it was important to not only burden the forest communities for reducing deforestation but to spread out the pressure across many levels of decision making, interest groups and administration.
ARC
P2009‐10NSY‐GAUTA
M‐FINALRE
PORT
]
77
Mr. Ugan Manadhar, one of the participants asked if the Indonesian government had any plans prepared since the Norwegian government had allocated 2.6 billion dollar to move REDD ahead in Indonesia. To this, Dr. Shovakar answered that Indonesian government is much ahead than any other country in making lawas and regulations and preparatory planning for REDD. Mr. Resham Dangi wanted to know about the ways for addressing the issues by Indonesian government as R‐PP prepared by Indonesia is more technical and safe for indigenous people. Mr. Muhamad replied, many programs are being implemented but some departments are still under the process of establishing a methodology. One of the participants asked Mr. Muhammad to elaborate on the intensive logging eradication program that he mentioned about earlier. Mr. Muhammad said that it was a difficult task that required long preparation. Prior to the regulation, it was hard to even make a case at the court but after it was implemented, cases could be reported and thus, its effectiveness was increased.Even so there are many technical problems and human resource problems. Nevertheless some progress has definitely been seen.
Presentation 4: Recent Developments on REDD and Forestry sector in Thailand by Dr. Qwanruedee Chotichanathawewong, Assistant President, Thailand Environment Institute
Dr. Qwan started her presentation with a brief introduction of the CO2 emission from forest deforestation and degradation. She said, in Thailand, land use change and forestry comes second amongst the major emission sources in 2002. It is expected that forest conservation and reforestation would reduce the net emissions. The major issues regarding deforestation and forest degradation are no clear definition for ‘forest’, lack of data, financial issue, land ownership arguments and lack of awareness of impacts of deforestation and climate change. Major causes for deforestation and degradation have been illegal logging, land use for settlement and agriculture, forest fires, slash and burn practice for land use and ambiguous land registration system that gives rise to land ownership issues even in reserved or protected areas. Approaches such as a financing scheme where carbon credits are bought and sold and local participation at the community level including forest dwellers and ethnic people could encourage forest conservation. She added, currently forest monitoring and forest inventories are being handled by two bodies: the Department of National Park, Wildlife and Plant Conservation (DNP) which is responsible for resources assessment and monitoring within protected area and the Royal Forest Department which is responsible for reserved forests outside. She said that implementation of REDD mechanism could be beneficial to Thailand. Even though there is no official policy for REDD implementation, Thailand’s readiness proposal to the World Bank’s Forest Carbon Partnership Facility (FCPF) has already been approved. Now it will join 36 other developing countries in exploring concepts to implement REDD. She emphasized, to create a suitable environment for REDD implementation, Thailand also requires to come up with a national plan to address the drivers of deforestation in the nation and also clearly define the roles of DNP and RFD and similar other departments. However, the perception of REDD is quite different for indigenous people. They believe that instead of reducing emissions from the sources where they have been produced, REDD addresses global warming in the wrong spots. Dr. Qwan mentioned, database management and in‐depth research regarding greenhouse gas emissions would push Thailand into implementing REDD efficiently. The Joint Graduate School of Energy and Environment (JGSEE) Study has already started studying and collecting database of greenhouse gases emissions across all sector for ONEP. Thai stakeholders see the need for setting up rules to ensure that the community benefits from forest. They are in favor of the fund concept rather than the market mechanism.
78
ARC
P2009‐10NSY‐GAUTA
M‐FINALRE
PORT
Presentation 5: Recent Developments on REDD and Forestry Sector in India by Dr. Puja Sawhney, New Delhi, India.
Dr. Sawhney started her presentation with an introduction of the various forest policies and national legislations in India aimed at conservation and sustainable management of forest. The implementation of progressive policies such as National Forest Policy (1988), JFM resolution (1990), National Environment Policy (2006), Green India mission and so on over the last two decades, has transformed India’s forests into a net sink of CO2. Dr. Sawhney said, although the mechanism of REDD has not been officially implemented in India there is considerable scope of its implementation, considering the extent of India’s forest cover. India’s approach toward the REDD mechanism is more comprehensive and termed as a ‘REDD plus’ approach. India along with a few other countries even demanded the inclusion of forest degradation, conservation of forest and increase in forest cover in the REDD draft text. Dr. Sawhney reiterated Mr. Muhammad’s point about conducting REDD projects at the national and sub‐national level and the importance of incentives to encourage people participation. She also added, communities should not only be given incentives for reducing carbon emission but also rewarded for conservation of forests. Even though India has great potential for REDD, benefit‐sharing from the implementation of REDD + still remains unresolved. For instance, there is still no mechanisms to compensate the forest people whose land were taken away and diverted. Other challenges identified for REDD implementation were corruption, problem of law and order and population pressure and agricultural requirements. One of the issues raised by Dr. Sawhney was the possibility of REDD’s market or fund based financial mechanism to act as a disincentive towards decentralization of forest governance. When Mr. Charles Pradhan asked her to further clarify this, she answered, even though projects like REDD involve the community forests, ownership is not transferred. The government believes that communities are incapable of managing forest on their own and therefore, centralization of forest governance remains intact. She pointed out several conditions that have to be met for the successful implementation of the REDD mechanism in India. Some of them are inclusion of indigenous forest dwellers and local communities in the process, proper utilization of funds, effective mechanisms to correctly assess the monetary value of a forest, availability of funds, transparency and accountability of transactions and capacity building of grassroots institutions to undertake monitoring. In the midst of her presentation, Dr. Sawhney concluded that as Nepal and India are similar not only in terms of forest composition but also in culture and the working system, the collaboration for further research would be beneficial for both parties. Mr. Resham Dangi wanted to know why the Indian government was still so rigid even after the lesson‐learning1984 amendment. “Laws and forestry are good but there is a want to achieve a lot at the same time”, answered Dr. Puja. Dr. Khatiwada requested Dr. Puja to elaborate on development of alternative livelihood. She said, even if we provide good incentives, it is not enough and we need to understand their customs. Sometimes incentives should be in the form of providing training to build skills and earn money. If they migrate to other places, they have to plant trees in the land rather leaving it fallow. “What is the situation of the staff in the organization in which Dr. Quan is involved?” asked Dr. Khatiwada. She replied, TEI works at policy level only like poverty reduction, social awareness, policy for education, waste water etc. Thanking all the presenters, Mr. Shrestha pointed out five challenges throughout the session: Policy, financial investments, capacity building, equity and political commitments. He said that we must protect the forest and embark the mitigation strategies and expand programs like CDM which is gaining popularity.
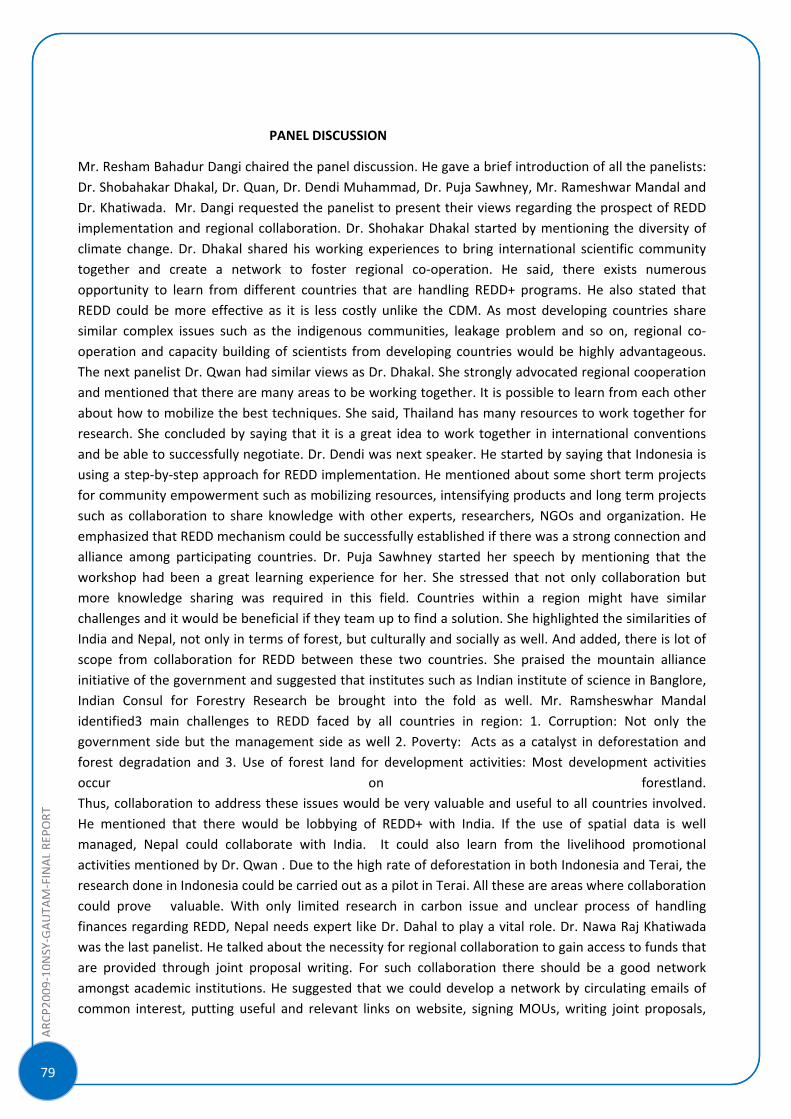
ARC
P2009‐10NSY‐GAUTA
M‐FINALRE
PORT
]
79
PANEL DISCUSSION
Mr. Resham Bahadur Dangi chaired the panel discussion. He gave a brief introduction of all the panelists: Dr. Shobahakar Dhakal, Dr. Quan, Dr. Dendi Muhammad, Dr. Puja Sawhney, Mr. Rameshwar Mandal and Dr. Khatiwada. Mr. Dangi requested the panelist to present their views regarding the prospect of REDD implementation and regional collaboration. Dr. Shohakar Dhakal started by mentioning the diversity of climate change. Dr. Dhakal shared his working experiences to bring international scientific community together and create a network to foster regional co‐operation. He said, there exists numerous opportunity to learn from different countries that are handling REDD+ programs. He also stated that REDD could be more effective as it is less costly unlike the CDM. As most developing countries share similar complex issues such as the indigenous communities, leakage problem and so on, regional co‐operation and capacity building of scientists from developing countries would be highly advantageous. The next panelist Dr. Qwan had similar views as Dr. Dhakal. She strongly advocated regional cooperation and mentioned that there are many areas to be working together. It is possible to learn from each other about how to mobilize the best techniques. She said, Thailand has many resources to work together for research. She concluded by saying that it is a great idea to work together in international conventions and be able to successfully negotiate. Dr. Dendi was next speaker. He started by saying that Indonesia is using a step‐by‐step approach for REDD implementation. He mentioned about some short term projects for community empowerment such as mobilizing resources, intensifying products and long term projects such as collaboration to share knowledge with other experts, researchers, NGOs and organization. He emphasized that REDD mechanism could be successfully established if there was a strong connection and alliance among participating countries. Dr. Puja Sawhney started her speech by mentioning that the workshop had been a great learning experience for her. She stressed that not only collaboration but more knowledge sharing was required in this field. Countries within a region might have similar challenges and it would be beneficial if they team up to find a solution. She highlighted the similarities of India and Nepal, not only in terms of forest, but culturally and socially as well. And added, there is lot of scope from collaboration for REDD between these two countries. She praised the mountain alliance initiative of the government and suggested that institutes such as Indian institute of science in Banglore, Indian Consul for Forestry Research be brought into the fold as well. Mr. Ramsheswhar Mandal identified3 main challenges to REDD faced by all countries in region: 1. Corruption: Not only the government side but the management side as well 2. Poverty: Acts as a catalyst in deforestation and forest degradation and 3. Use of forest land for development activities: Most development activities occur on forestland. Thus, collaboration to address these issues would be very valuable and useful to all countries involved. He mentioned that there would be lobbying of REDD+ with India. If the use of spatial data is well managed, Nepal could collaborate with India. It could also learn from the livelihood promotional activities mentioned by Dr. Qwan . Due to the high rate of deforestation in both Indonesia and Terai, the research done in Indonesia could be carried out as a pilot in Terai. All these are areas where collaboration could prove valuable. With only limited research in carbon issue and unclear process of handling finances regarding REDD, Nepal needs expert like Dr. Dahal to play a vital role. Dr. Nawa Raj Khatiwada was the last panelist. He talked about the necessity for regional collaboration to gain access to funds that are provided through joint proposal writing. For such collaboration there should be a good network amongst academic institutions. He suggested that we could develop a network by circulating emails of common interest, putting useful and relevant links on website, signing MOUs, writing joint proposals,
80
ARC
P2009‐10NSY‐GAUTA
M‐FINALRE
PORT
exchanging researchers and providing feedback to the government regarding scientific issues. After these brief speeches by the six panelists, the floor was opened for questions and further discussion.
Several questions were raised like: What kind of knowledge should be shared? How to institutionalize from policy level to community level? After going to federal system, Nepal will need a new mechanism, so are there any such system? Dr. Eak B Rana from ICIMOD said, South Asia and South East Asia have similar kind of forest standards, indigenous issues, REDD, poverty etc. Countries in Southern Asia are suffering from complex mechanism like CDM. He suggested preparing simple REDD+ mechanism and choosing verifiers from respective countries. Dr. Khatiwada pointed out, the lack of expertise, analytical ability, clear goal and clear objectives hinder implementation of CDM’s already complex methodology. Developing countries need simple rather than technical measurements. Regarding the type of knowledge to be shared, Dr Qwan replied, knowledge in terms of local people, politicians, and reporters should be classified and different channels should be used to reach different groups at different levels. Mr. Dangi added, IPCC people don’t generate knowledge but are still doing well. Knowledge is there but it should be straight forward. Mr. Dendi said, commitment from policy level is needed. Commitment should not be from only the high authority but also from the local level. Dr. Puja highlighted the situation in India. She said that forest is under the control of the state government and there is no co‐ ordination between central, district and local level. Rights of the people need to be addressed.
The program was concluded with the closing speech by the Dr. Regmi. He thanked all distinguished guests, participants and the NDRI team for the successful completion of the program.
ARC
P2009‐10NSY‐GAUTA
M‐FINALRE
PORT
]
81
Annex 10: Presentation slides of the workshop
Page no.
1. Dr. Shovakar Dhakal………………………………………………………………………………….82 2. Mr. Ram Asheshwor Mandal…………………………………………………………………….92 3. Mr. Dipesh Pyakurel………………………………………………………………………………….98 4. Dr. Nawa Raj Khatiwada……………………………………………………………………………101 5. Mr. Man Bahadur Kshetri………………………………………………………………………….104 6. Mr. Dendi Muhamad…………………………………………………………………………………107 7. Dr. Qwanruedee Chotichanathawewong……………………………………….. 112 8. Dr. Puja Shawney………………………………………………………………………………………117
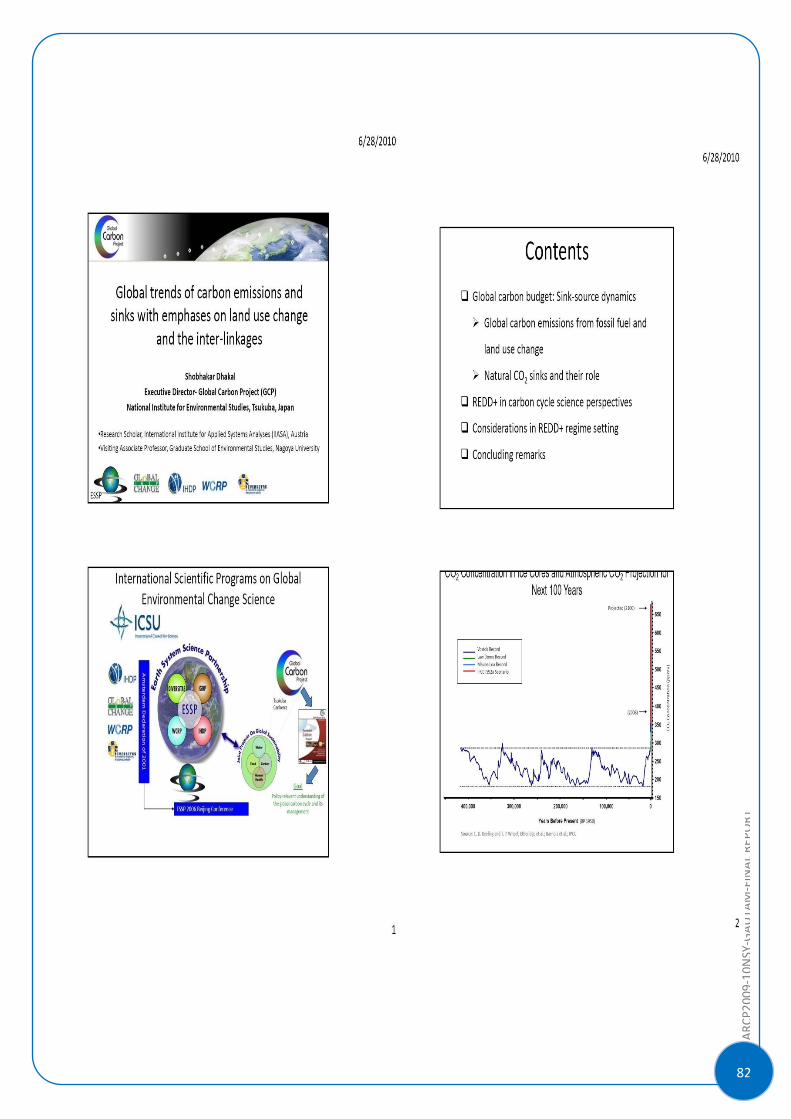
82
ARC
P2009‐10NSY‐GAUTA
M‐FINALRE
PORT
ARC
P2009‐10NSY‐GAUTA
M‐FINALRE
PORT
]
83
84
ARC
P2009‐10NSY‐GAUTA
M‐FINALRE
PORT
ARC
P2009‐10NSY‐GAUTA
M‐FINALRE
PORT
]
85
86
ARC
P2009‐10NSY‐GAUTA
M‐FINALRE
PORT
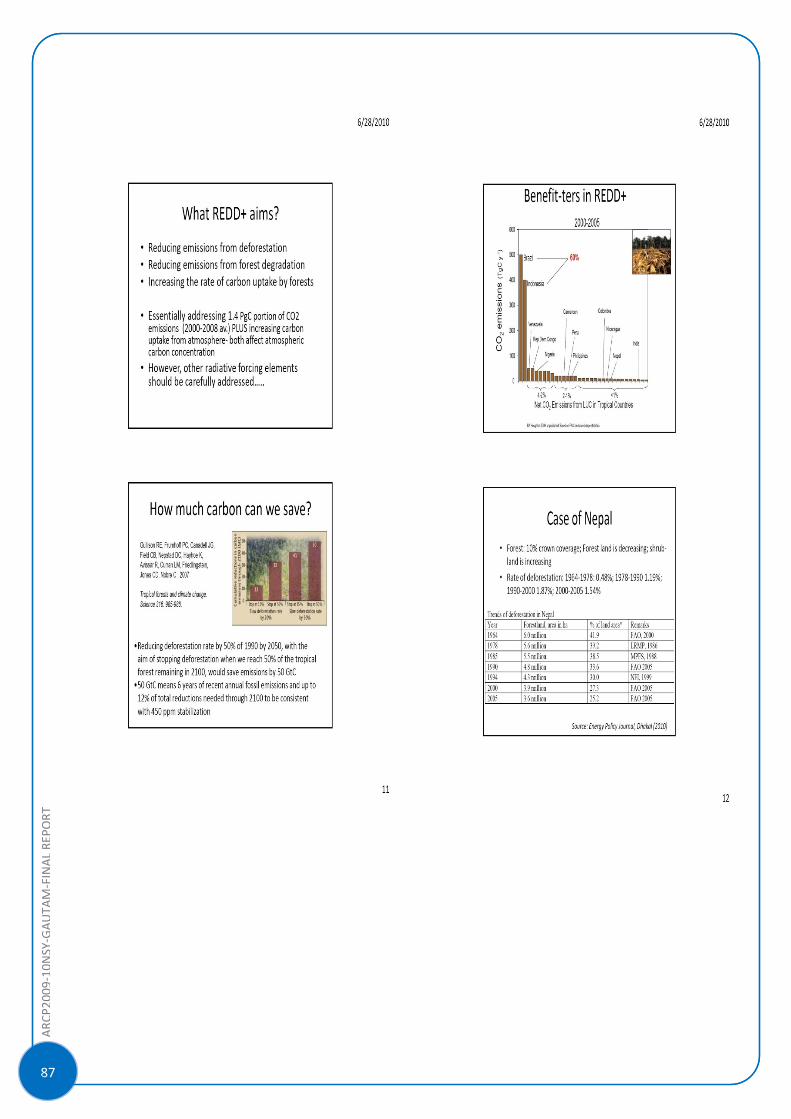
ARC
P2009‐10NSY‐GAUTA
M‐FINALRE
PORT
]
87
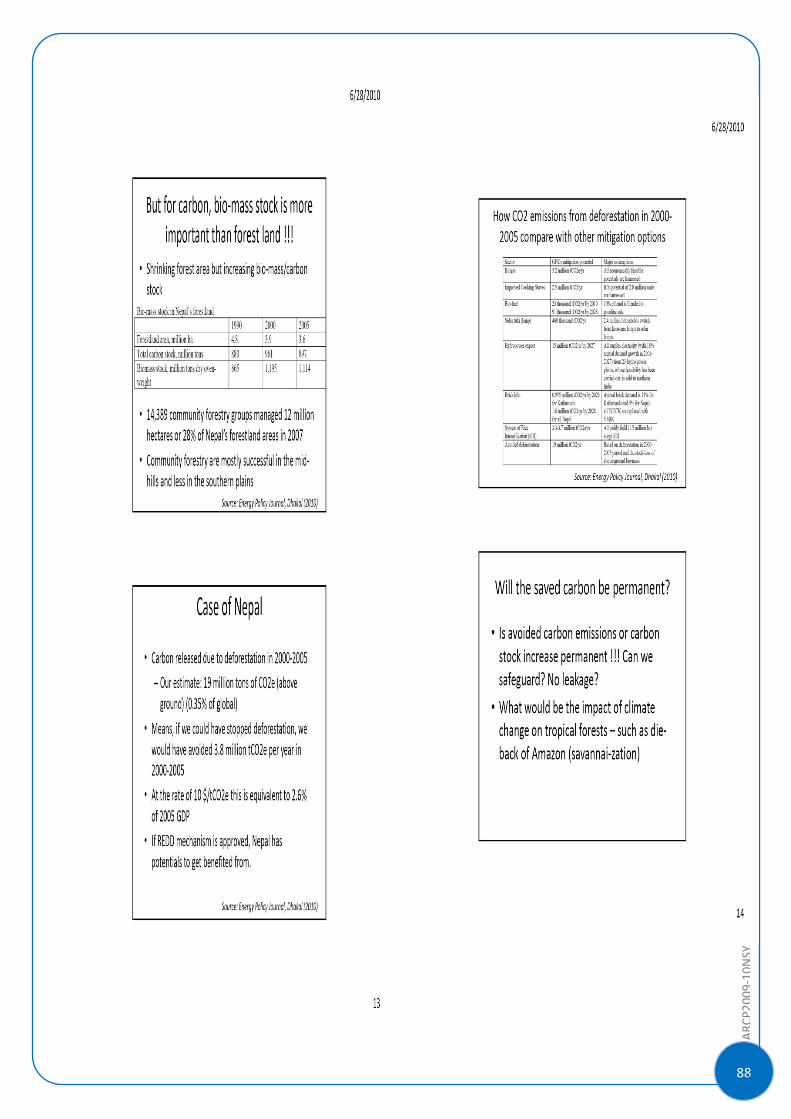
88
ARC
P2009‐10NSY‐GAUTA
M‐FINALRE
PORT
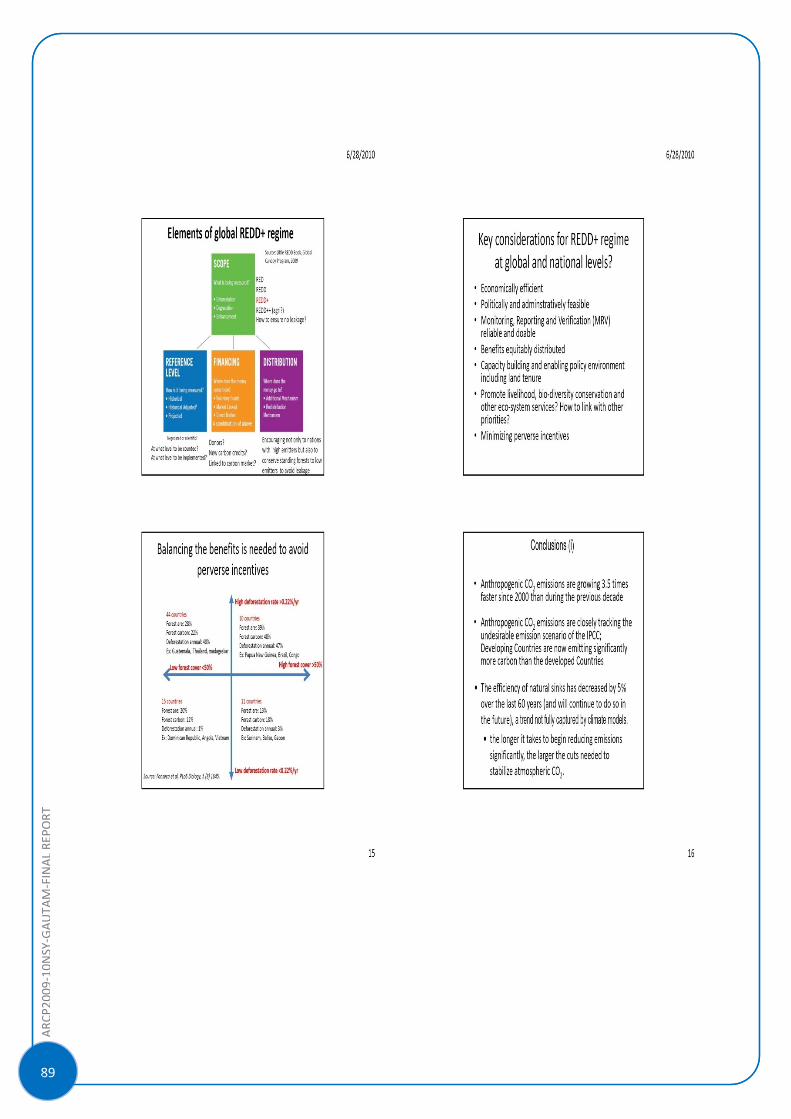
ARC
P2009‐10NSY‐GAUTA
M‐FINALRE
PORT
]
89
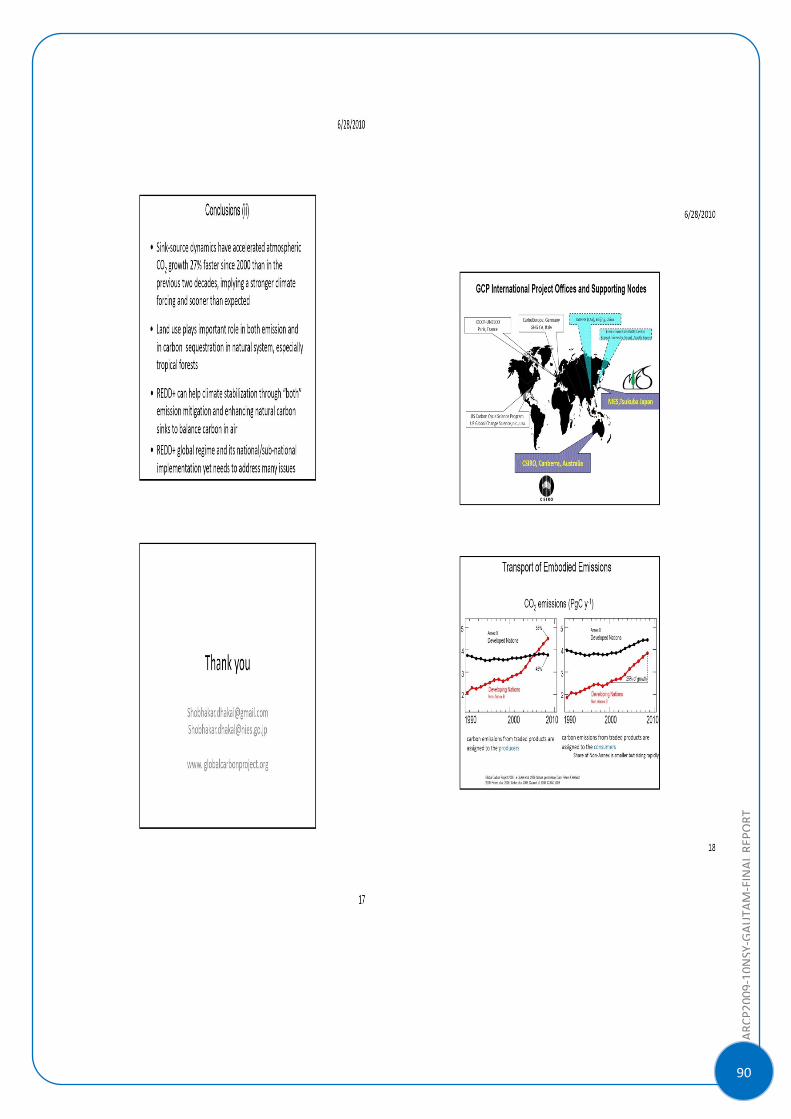
90
ARC
P2009‐10NSY‐GAUTA
M‐FINALRE
PORT
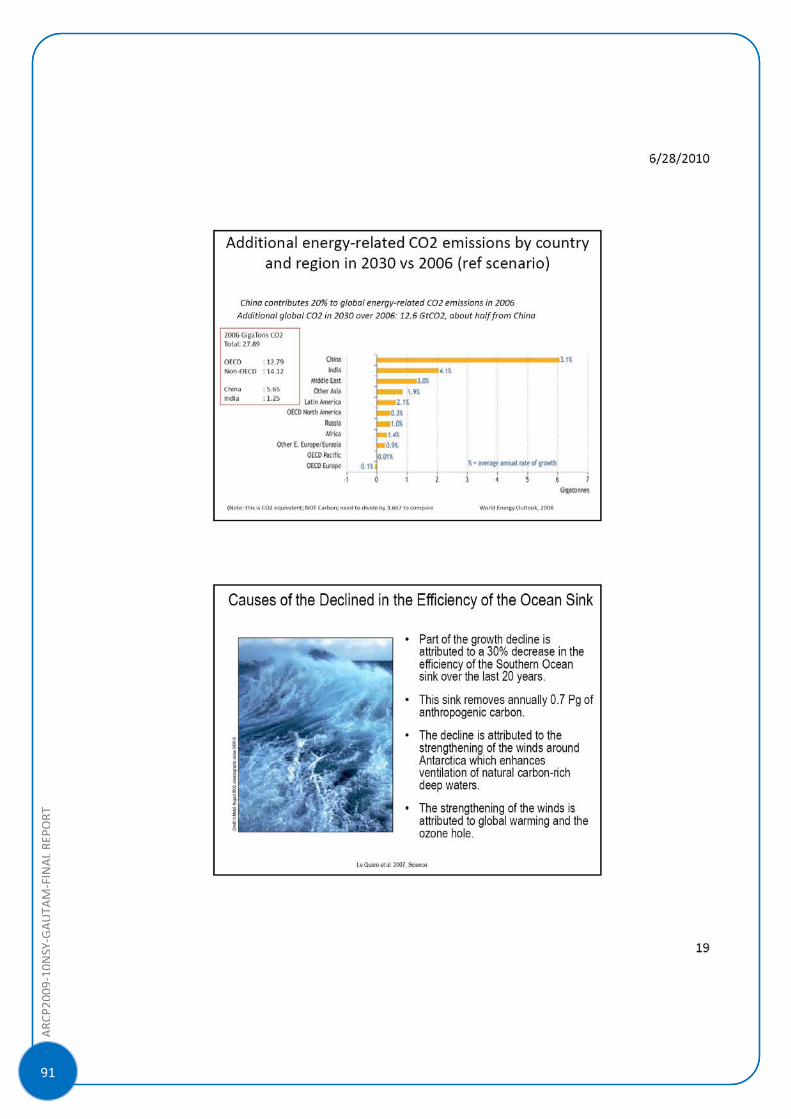
ARC
P2009‐10NSY‐GAUTA
M‐FINALRE
PORT
]
91
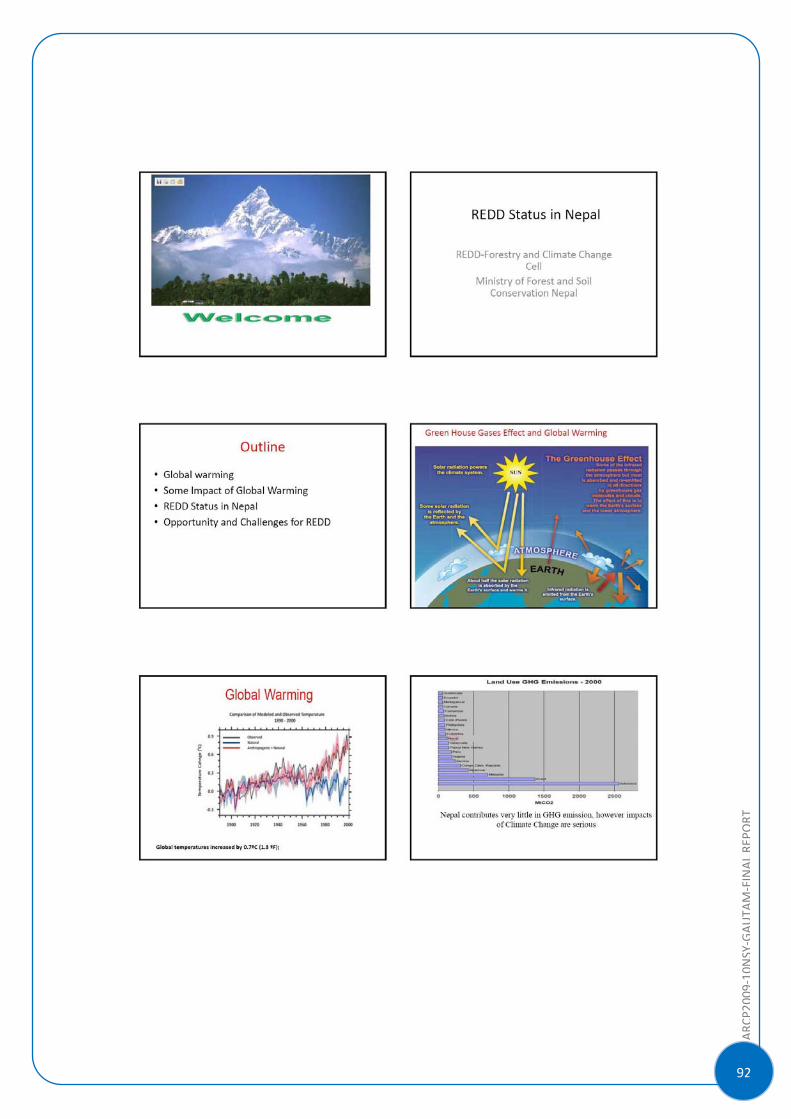
92
ARC
P2009‐10NSY‐GAUTA
M‐FINALRE
PORT
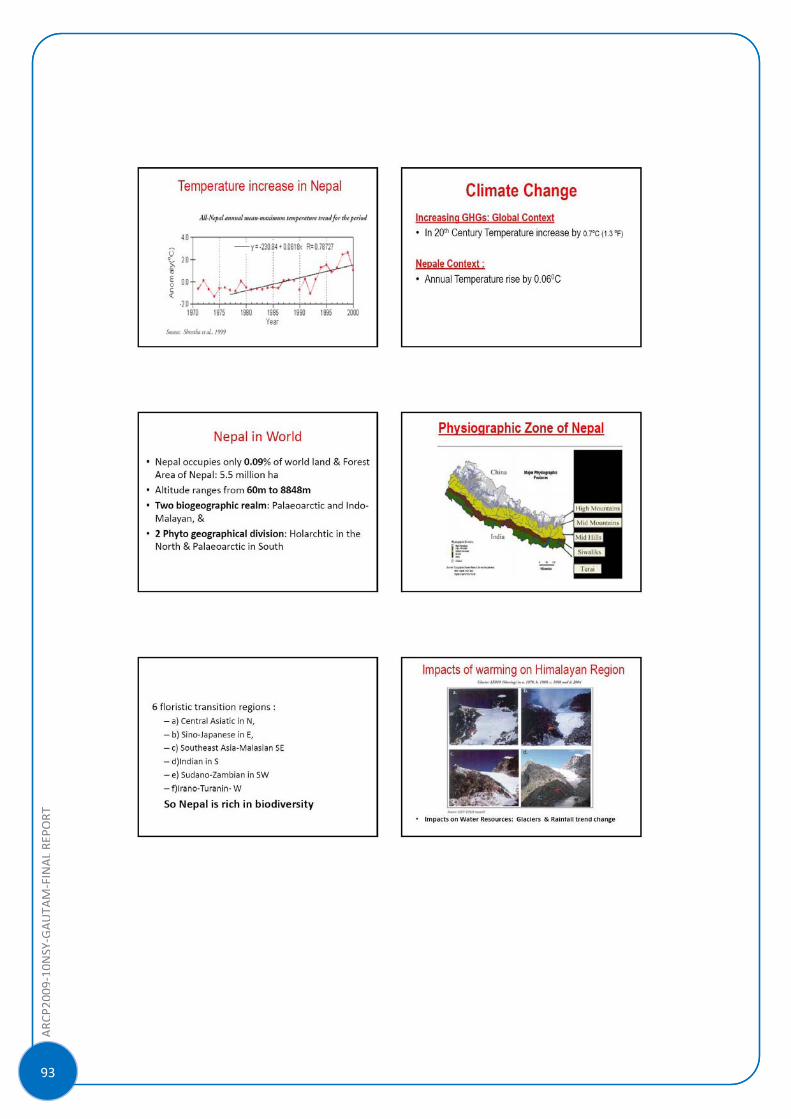
ARC
P2009‐10NSY‐GAUTA
M‐FINALRE
PORT
]
93
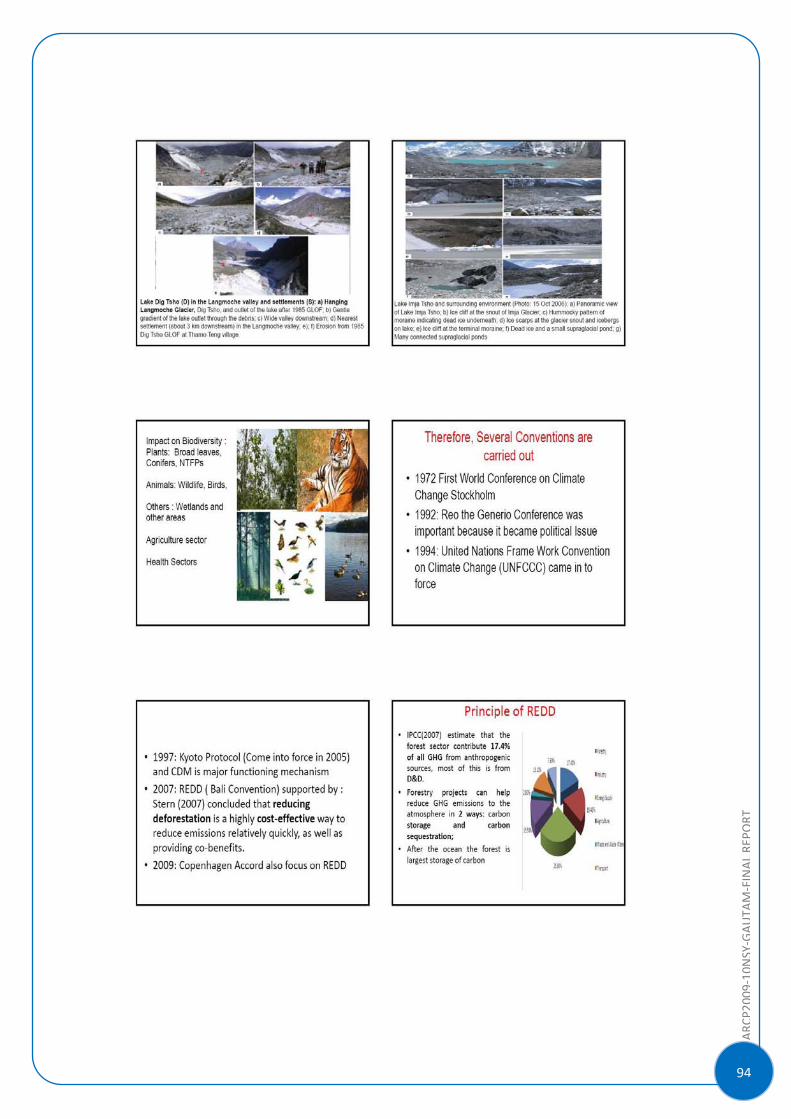
94
ARC
P2009‐10NSY‐GAUTA
M‐FINALRE
PORT
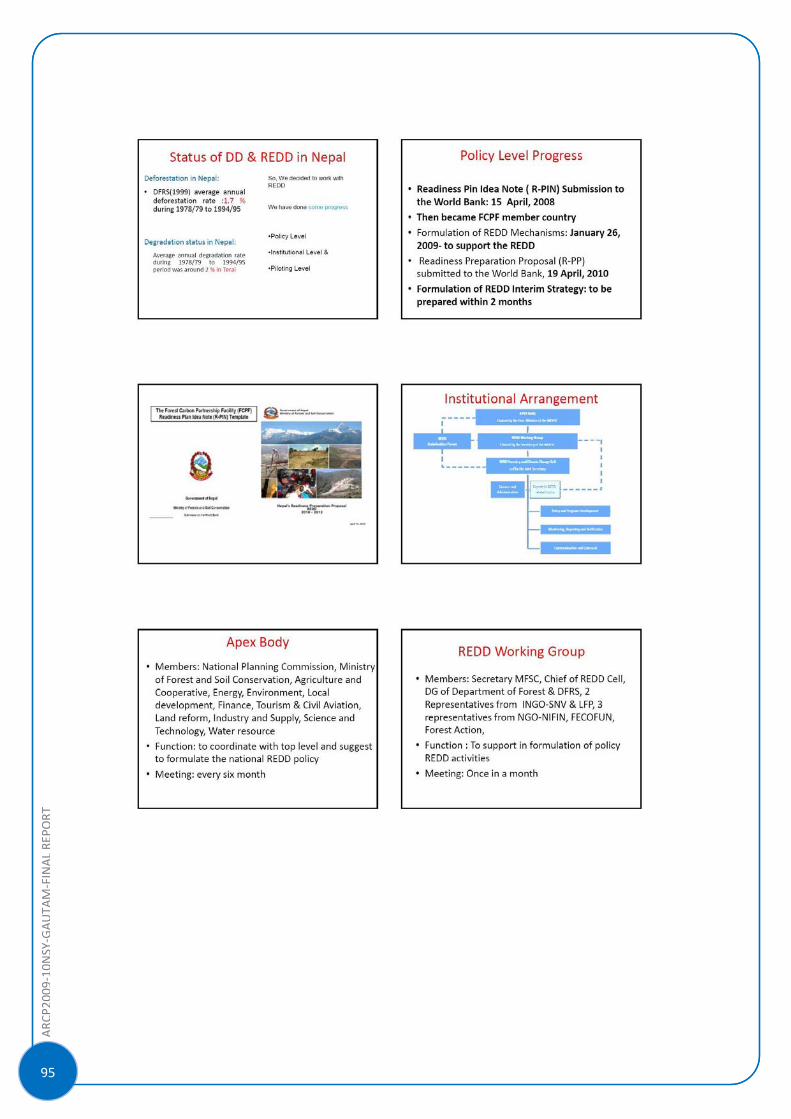
ARC
P2009‐10NSY‐GAUTA
M‐FINALRE
PORT
]
95
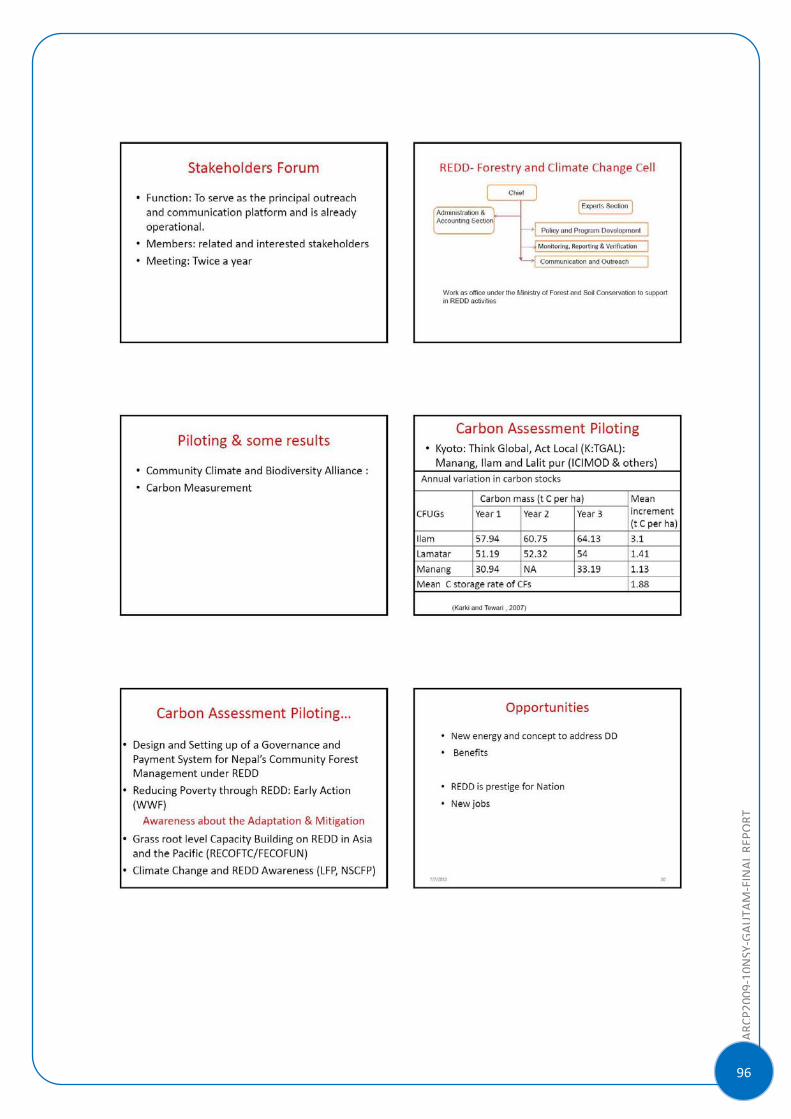
96
ARC
P2009‐10NSY‐GAUTA
M‐FINALRE
PORT
ARC
P2009‐10NSY‐GAUTA
M‐FINALRE
PORT
]
97
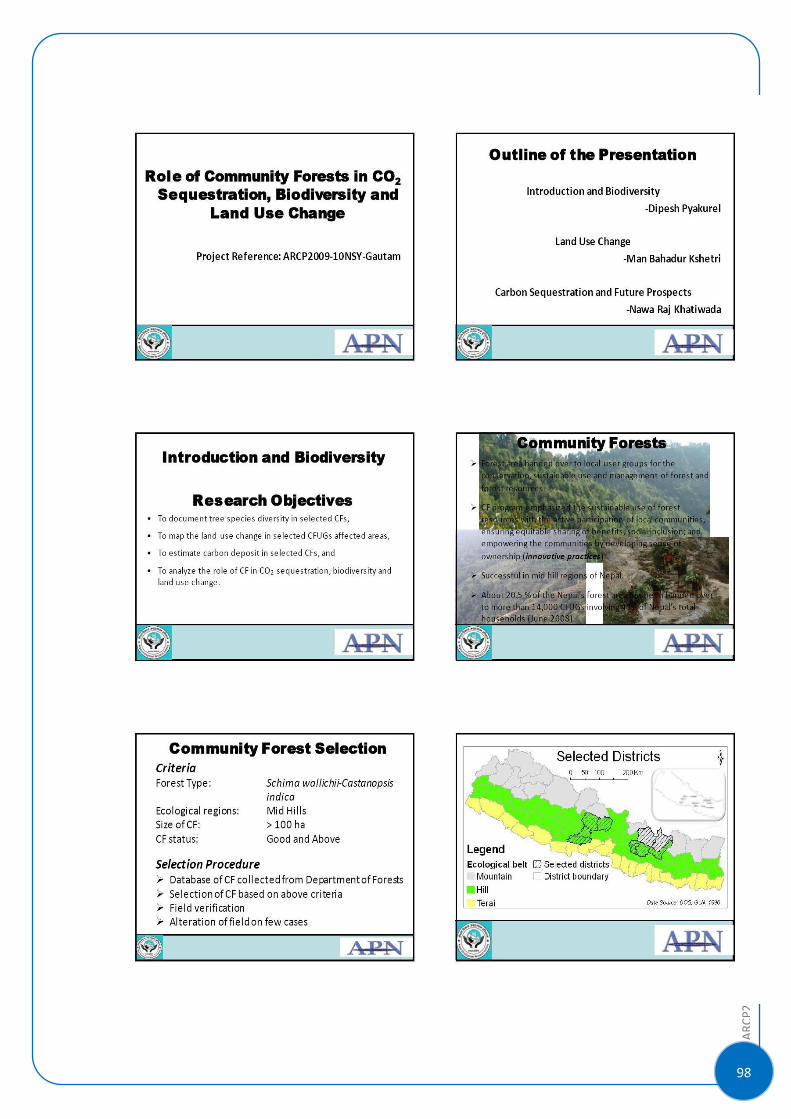
98
ARC
P2009‐10NSY‐GAUTA
M‐FINALRE
PORT
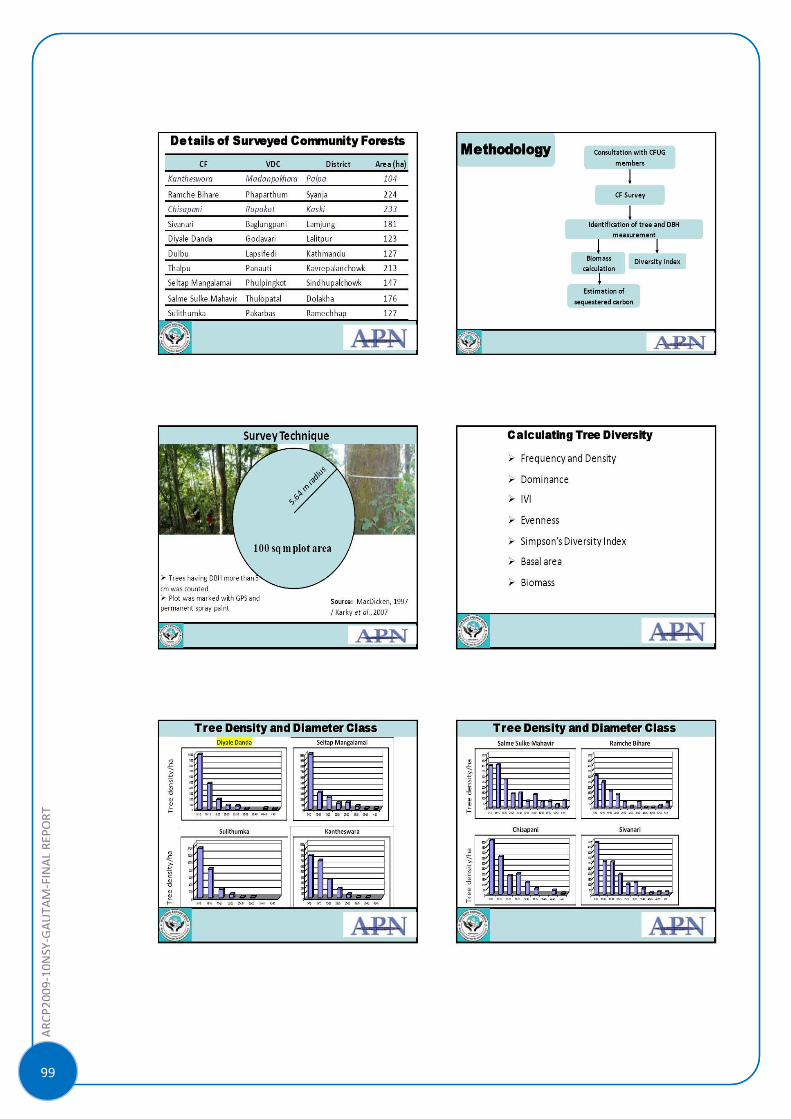
ARC
P2009‐10NSY‐GAUTA
M‐FINALRE
PORT
]
99
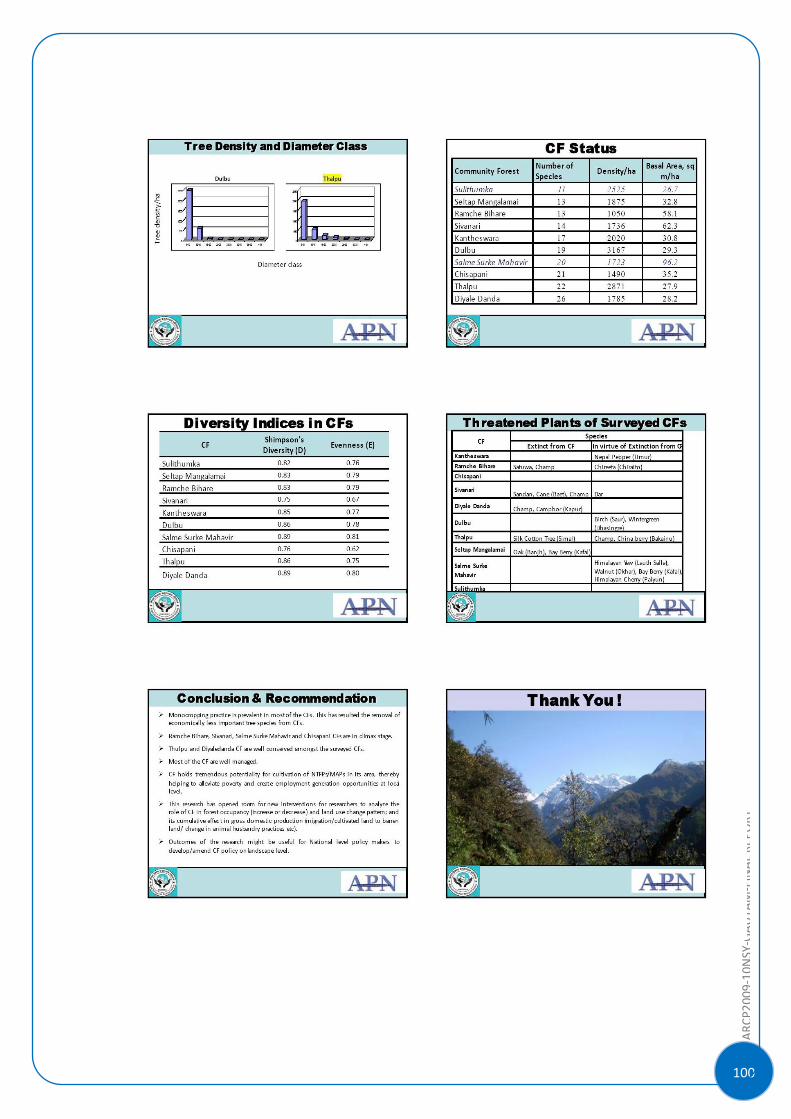
100
ARC
P2009‐10NSY‐GAUTA
M‐FINALRE
PORT
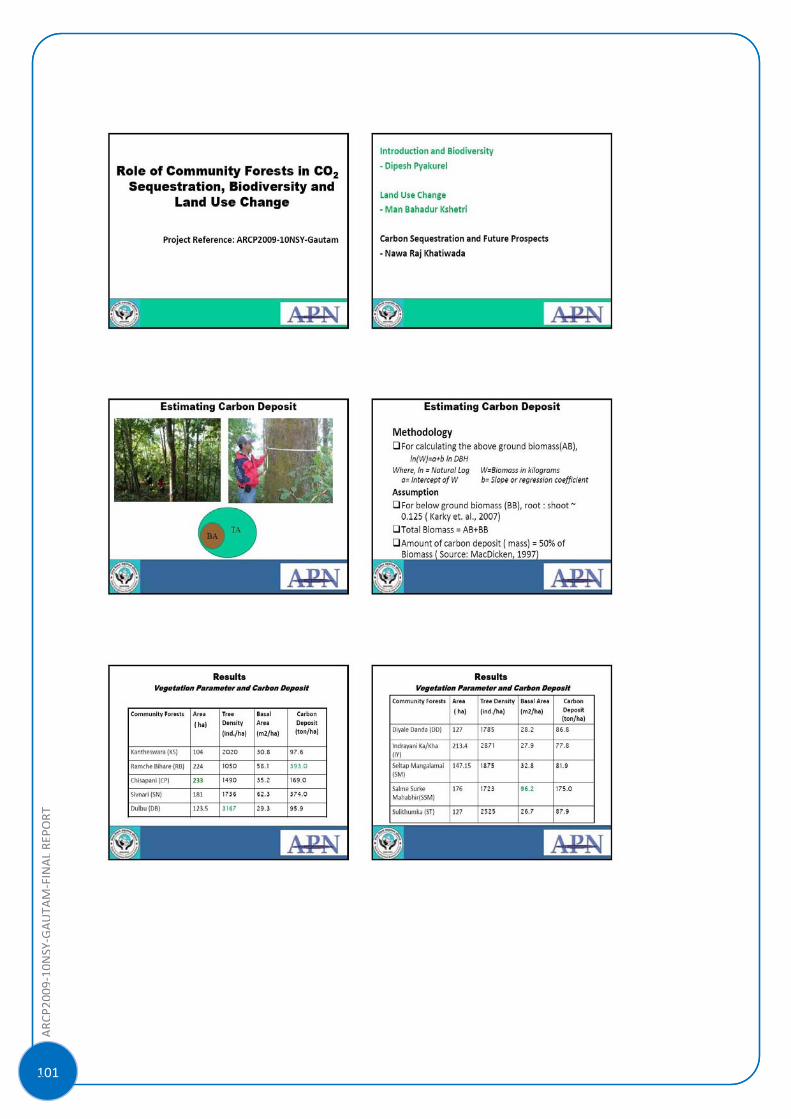
ARC
P2009‐10NSY‐GAUTA
M‐FINALRE
PORT
]
101
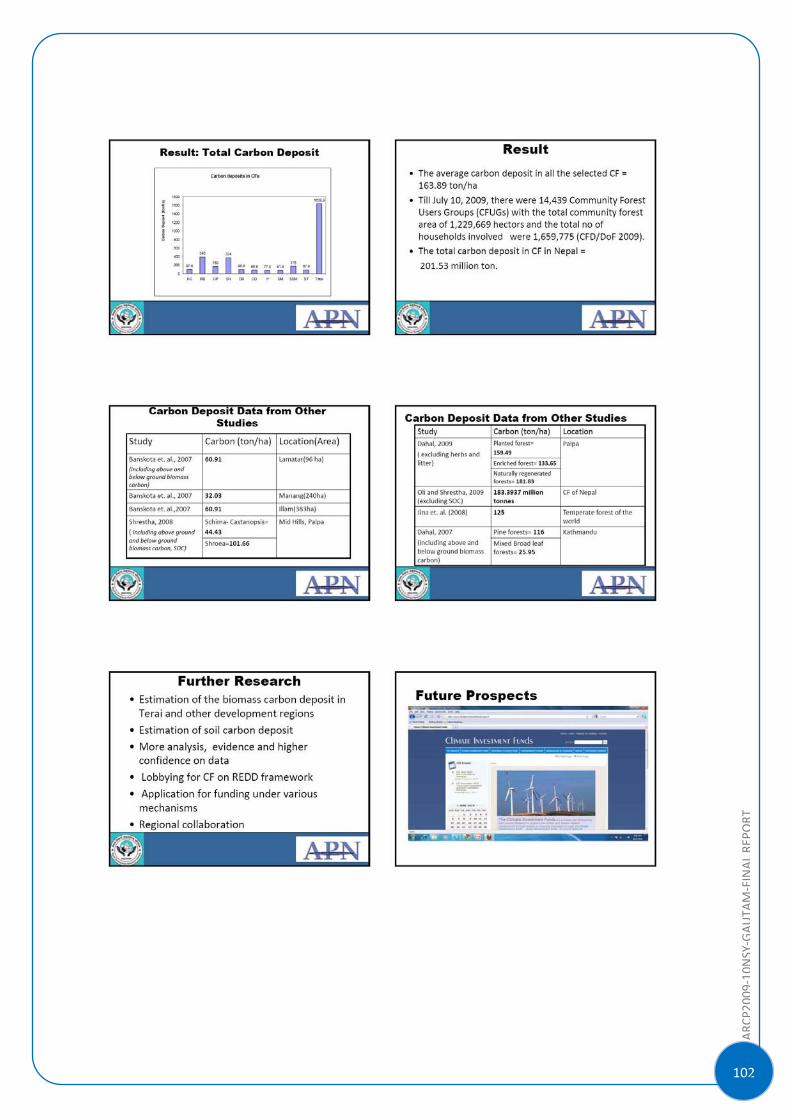
102
ARC
P2009‐10NSY‐GAUTA
M‐FINALRE
PORT
ARC
P2009‐10NSY‐GAUTA
M‐FINALRE
PORT
]
103
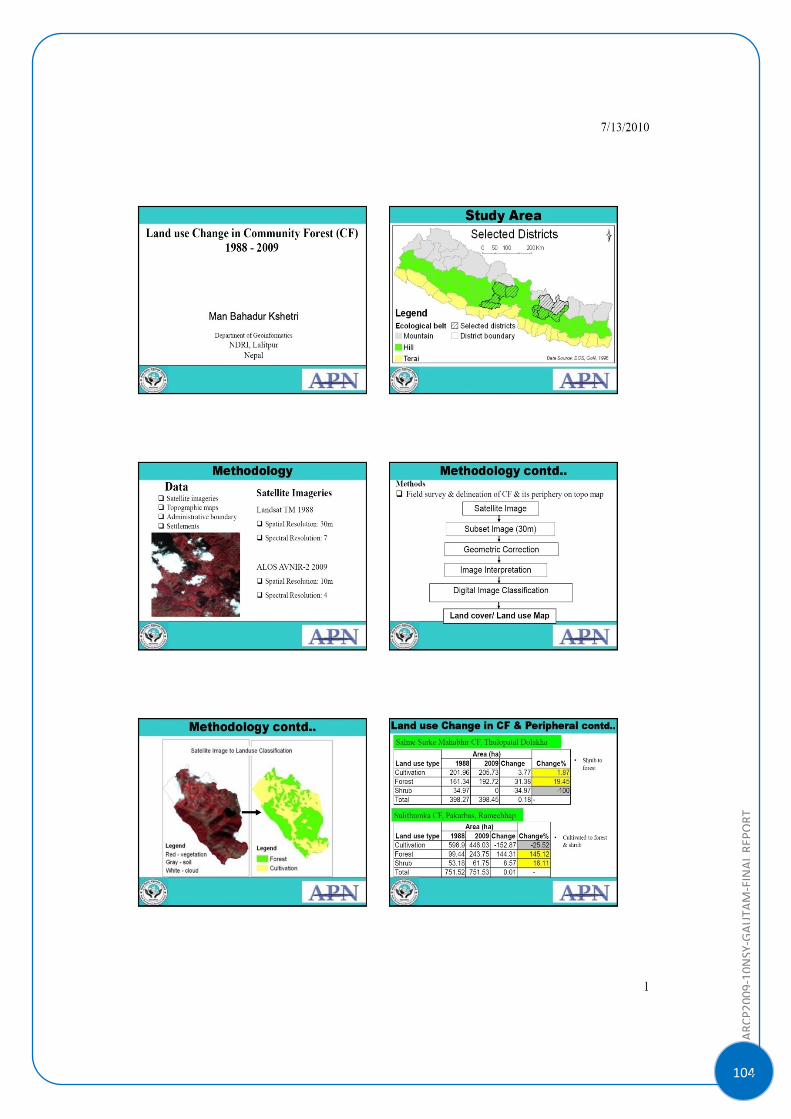
104
ARC
P2009‐10NSY‐GAUTA
M‐FINALRE
PORT
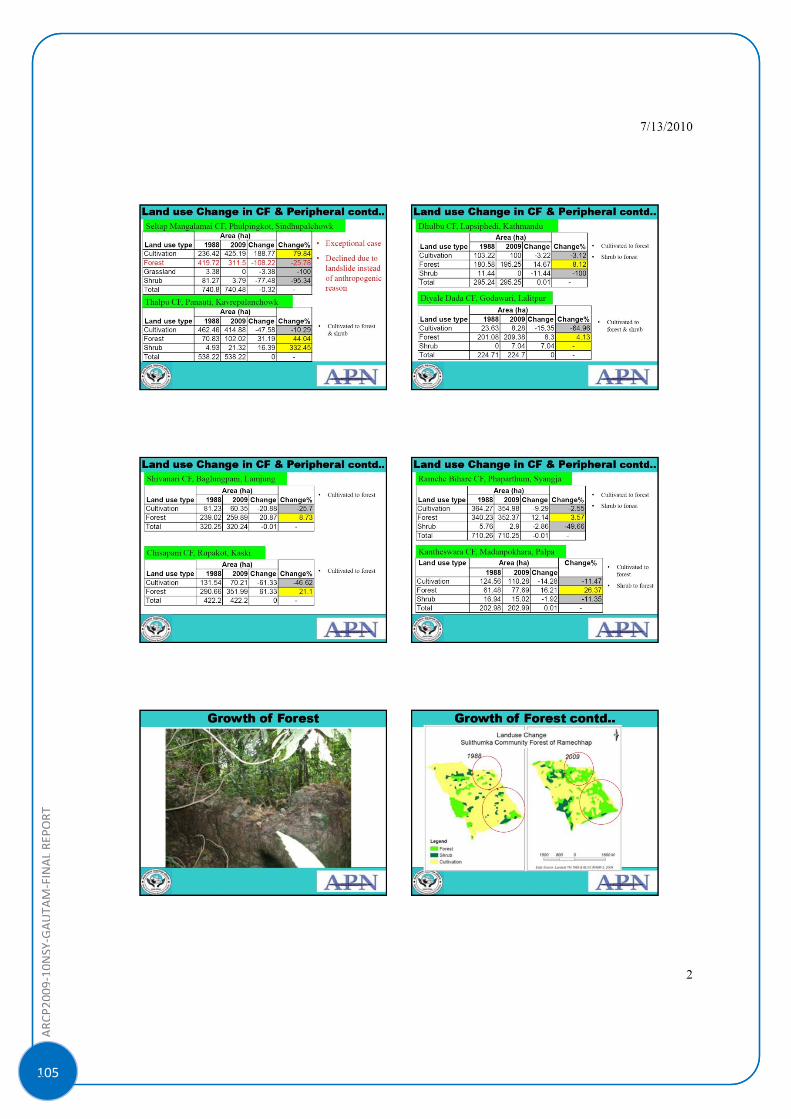
ARC
P2009‐10NSY‐GAUTA
M‐FINALRE
PORT
]
105
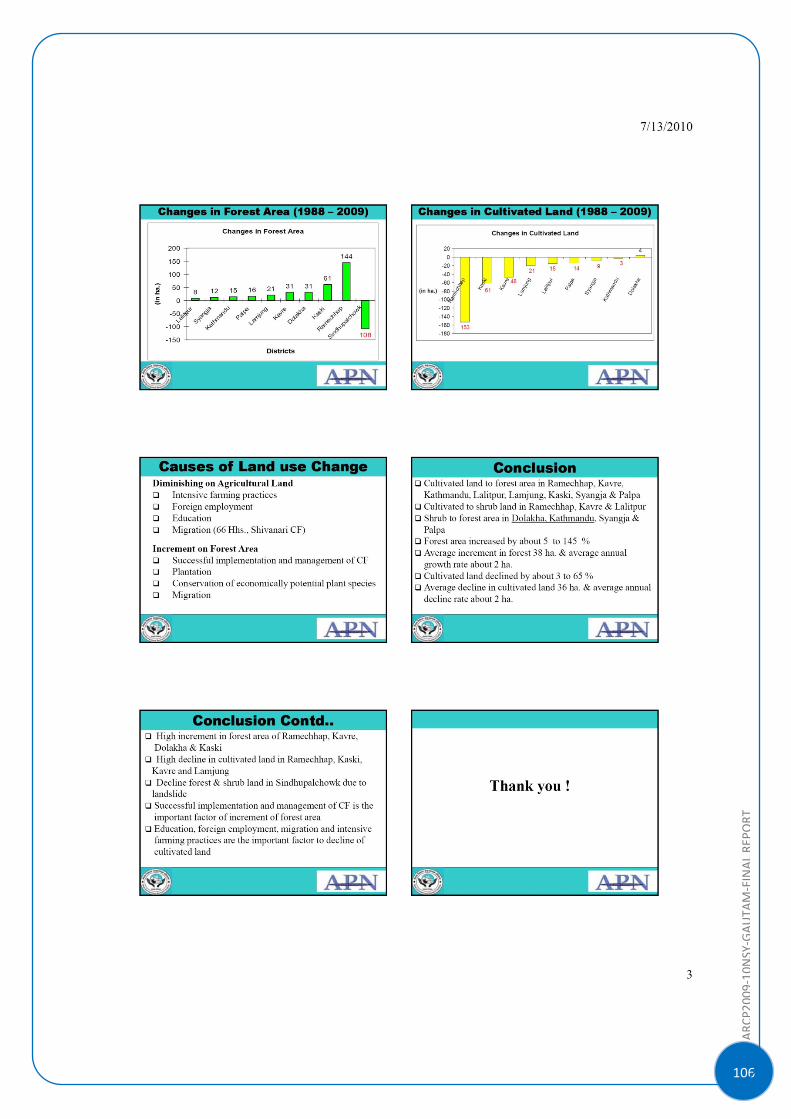
106
ARC
P2009‐10NSY‐GAUTA
M‐FINALRE
PORT
ARC
P2009‐10NSY‐GAUTA
M‐FINALRE
PORT
]
107
108
ARC
P2009‐10NSY‐GAUTA
M‐FINALRE
PORT
ARC
P2009‐10NSY‐GAUTA
M‐FINALRE
PORT
]
109
110
ARC
P2009‐10NSY‐GAUTA
M‐FINALRE
PORT
ARC
P2009‐10NSY‐GAUTA
M‐FINALRE
PORT
]
111
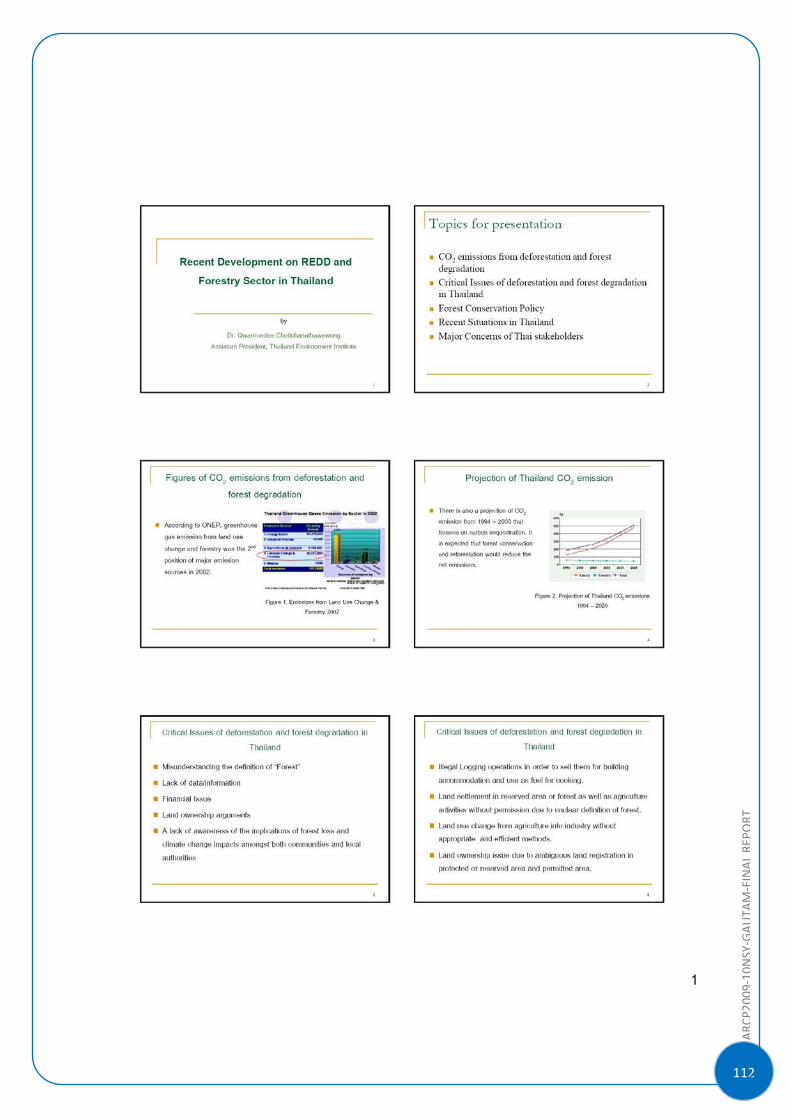
112
ARC
P2009‐10NSY‐GAUTA
M‐FINALRE
PORT
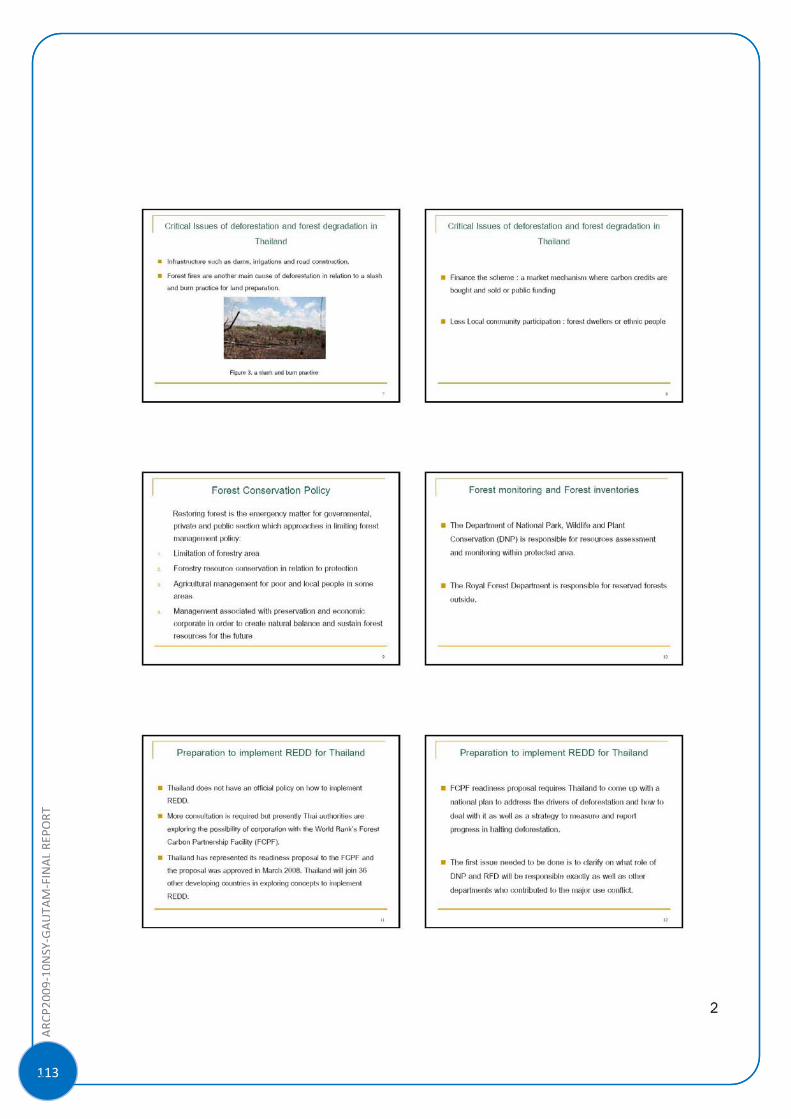
ARC
P2009‐10NSY‐GAUTA
M‐FINALRE
PORT
]
113
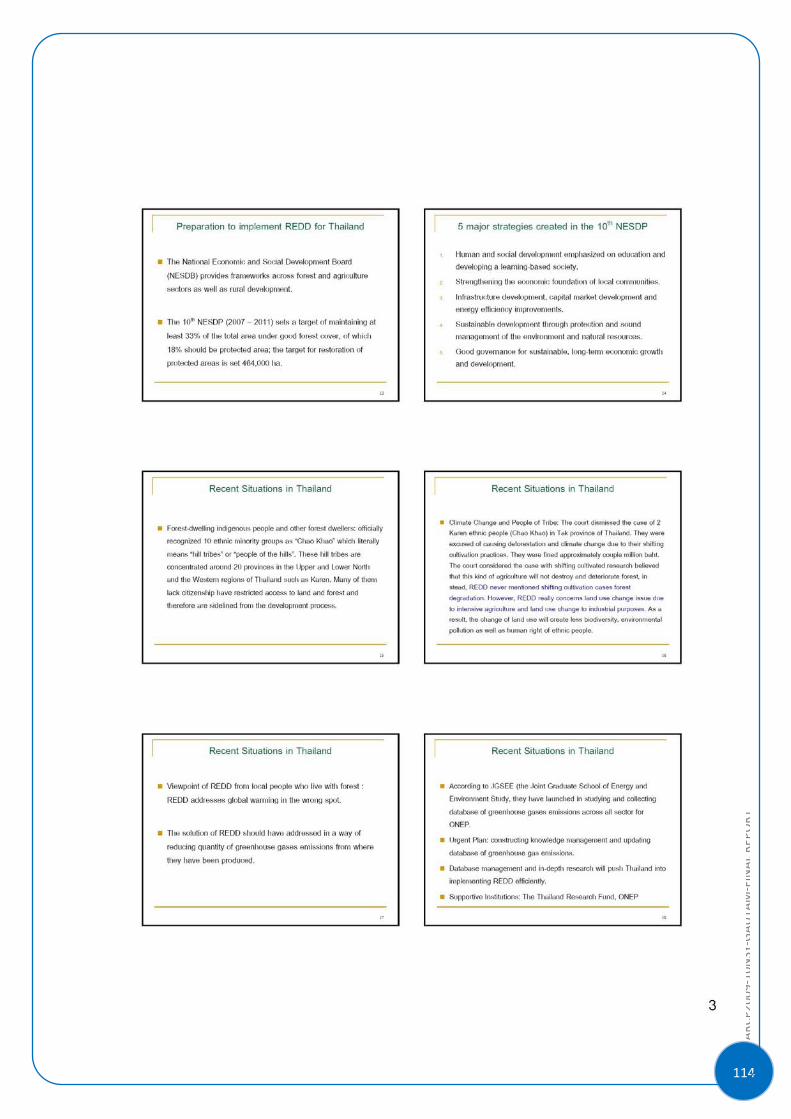
114
ARC
P2009‐10NSY‐GAUTA
M‐FINALRE
PORT
ARC
P2009‐10NSY‐GAUTA
M‐FINALRE
PORT
]
115
116
ARC
P2009‐10NSY‐GAUTA
M‐FINALRE
PORT
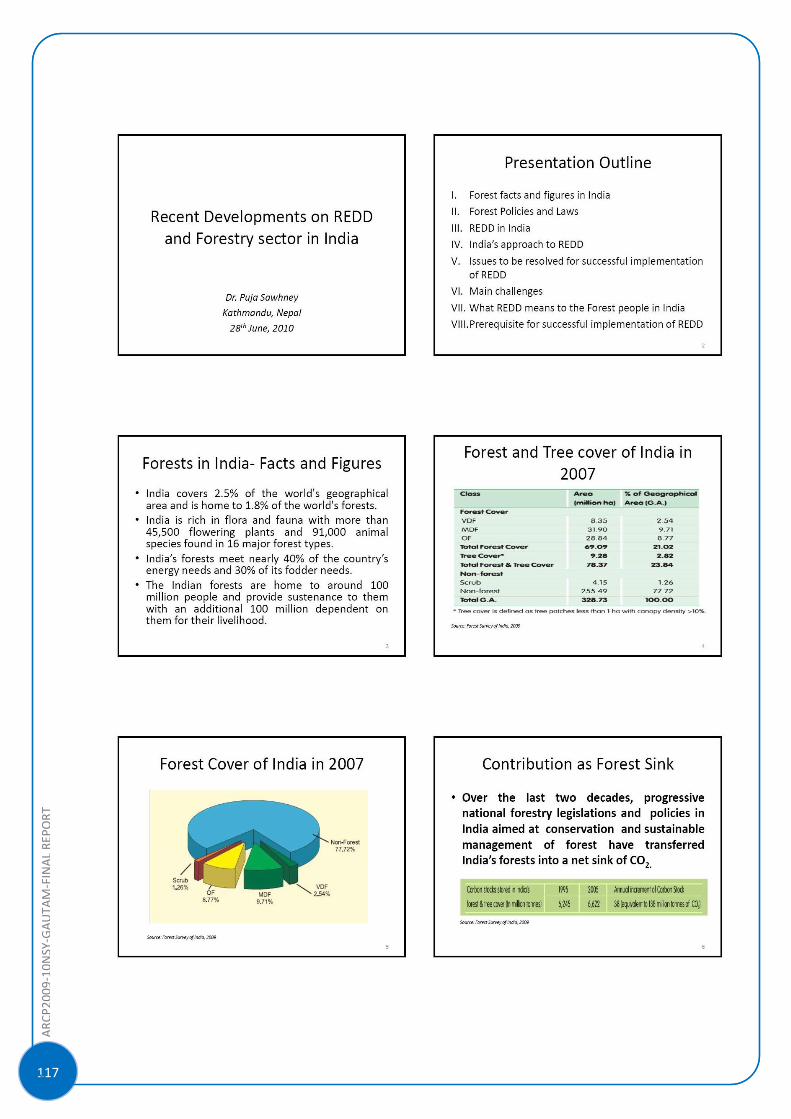
ARC
P2009‐10NSY‐GAUTA
M‐FINALRE
PORT
]
117
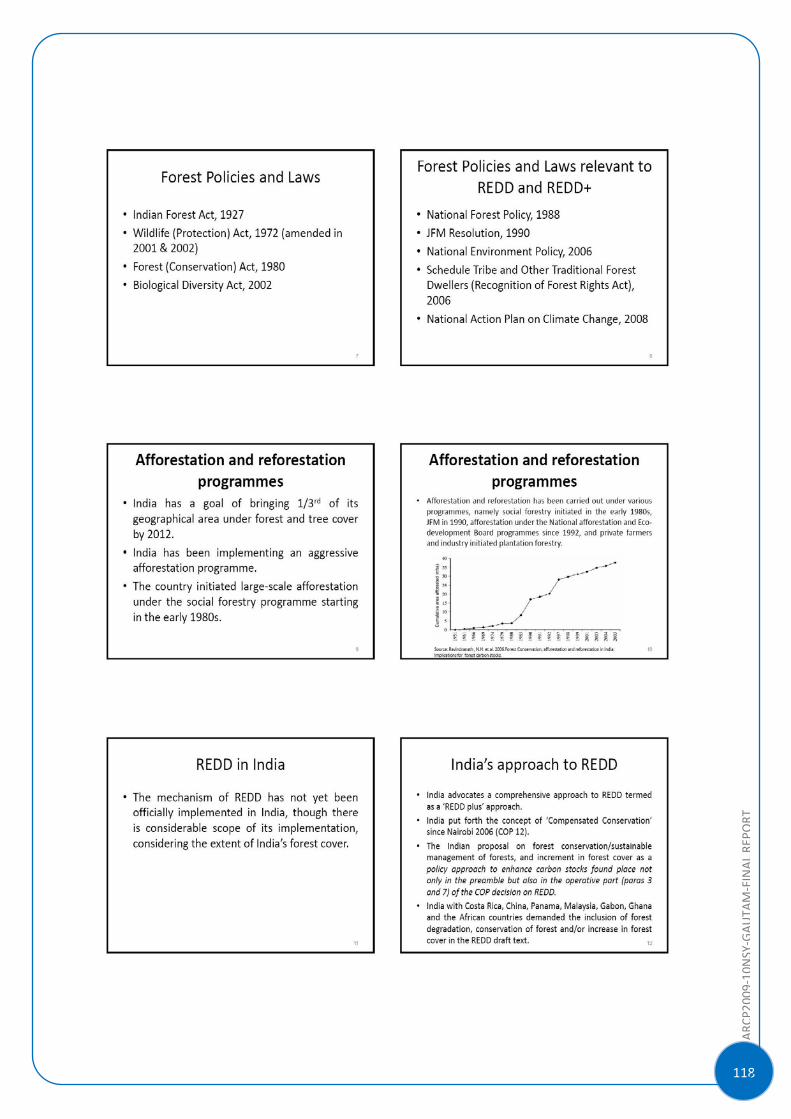
118
ARC
P2009‐10NSY‐GAUTA
M‐FINALRE
PORT
ARC
P2009‐10NSY‐GAUTA
M‐FINALRE
PORT
]
119
120
ARC
P2009‐10NSY‐GAUTA
M‐FINALRE
PORT
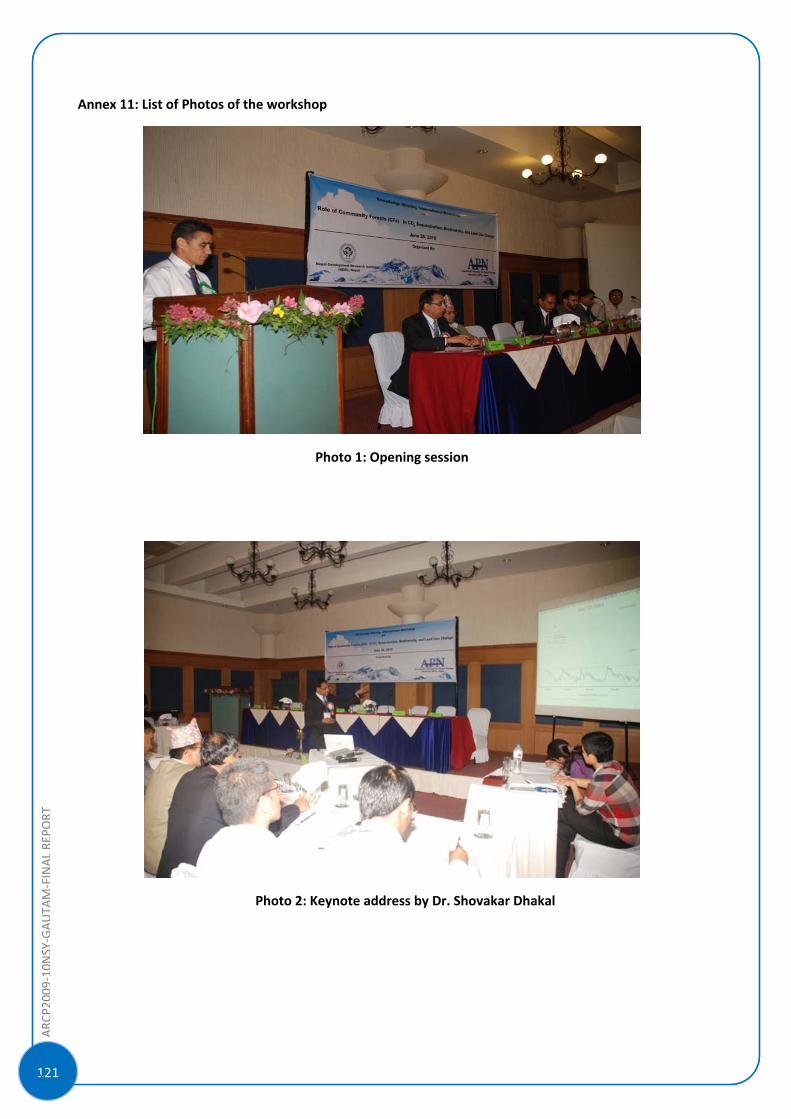
ARC
P2009‐10NSY‐GAUTA
M‐FINALRE
PORT
]
121
Annex 11: List of Photos of the workshop
Photo 1: Opening session
Photo 2: Keynote address by Dr. Shovakar Dhakal
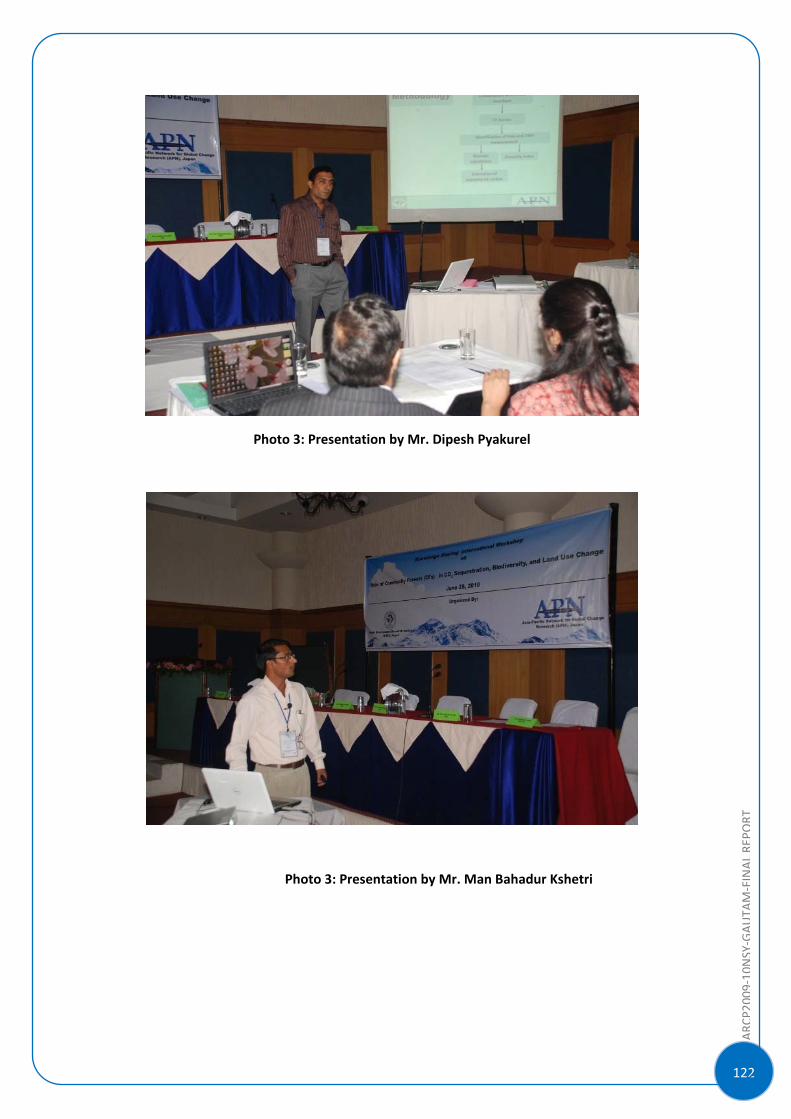
122
ARC
P2009‐10NSY‐GAUTA
M‐FINALRE
PORT
Photo 3: Presentation by Mr. Dipesh Pyakurel
Photo 3: Presentation by Mr. Man Bahadur Kshetri
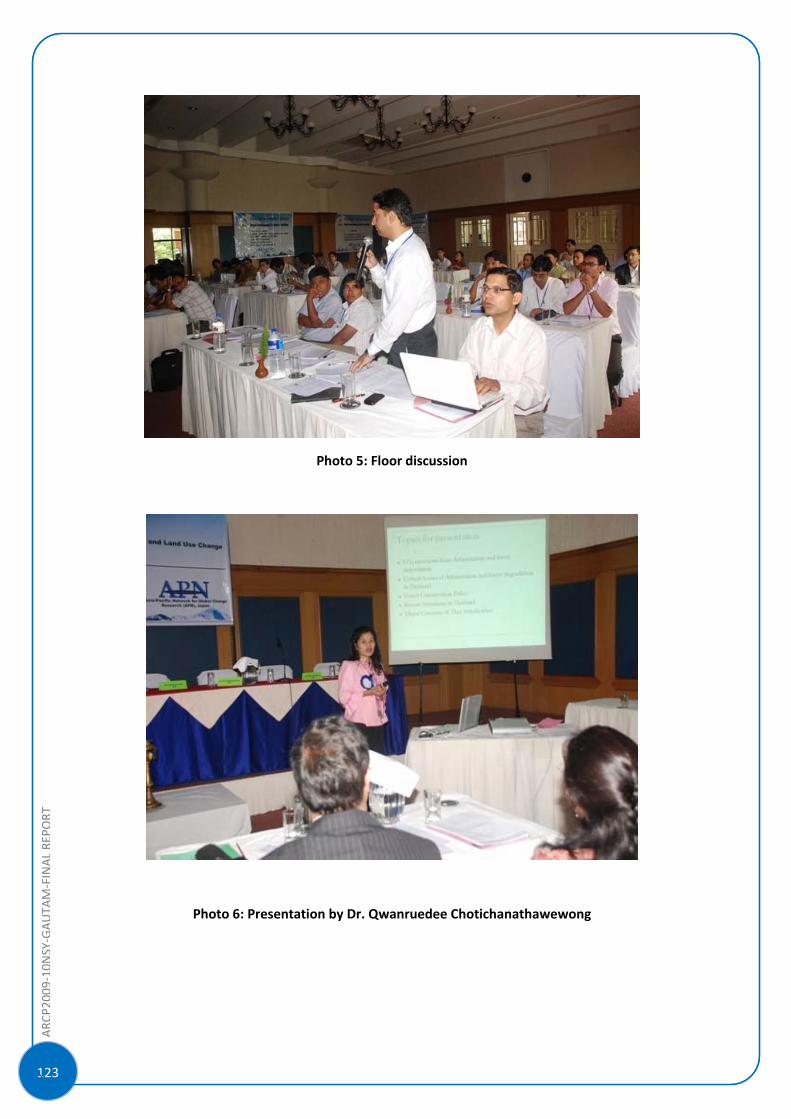
ARC
P2009‐10NSY‐GAUTA
M‐FINALRE
PORT
]
123
Photo 5: Floor discussion
Photo 6: Presentation by Dr. Qwanruedee Chotichanathawewong
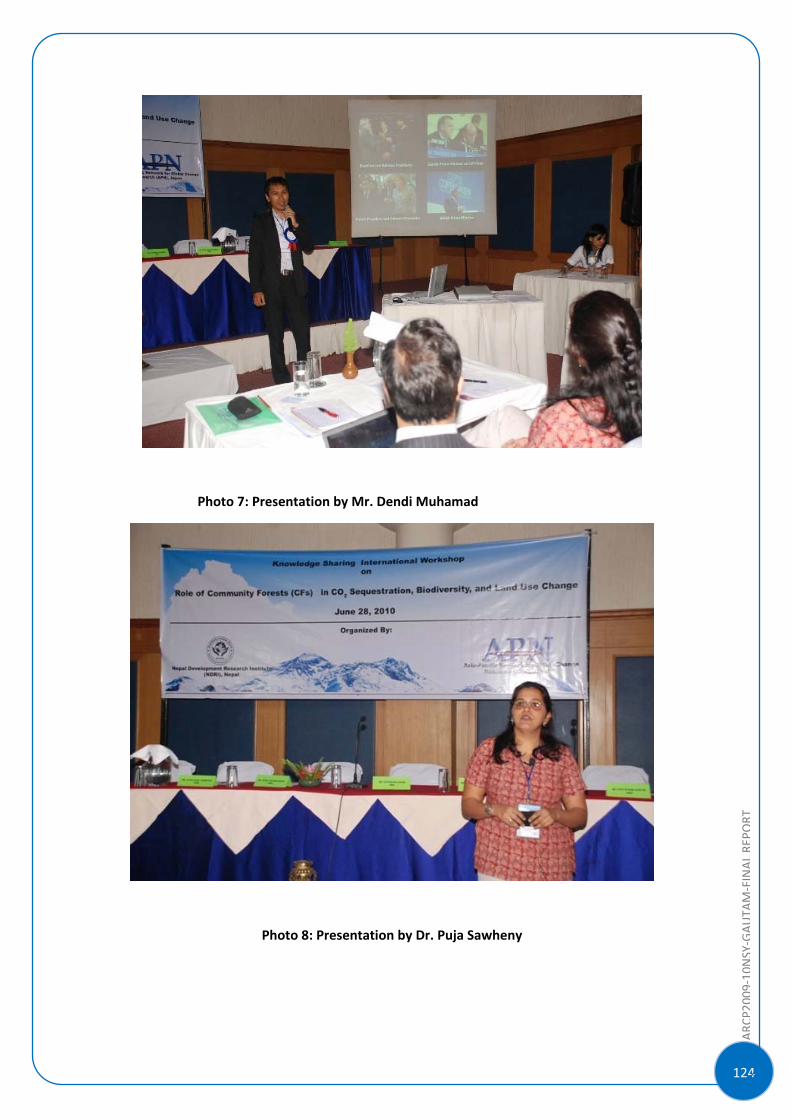
124
ARC
P2009‐10NSY‐GAUTA
M‐FINALRE
PORT
Photo 7: Presentation by Mr. Dendi Muhamad
Photo 8: Presentation by Dr. Puja Sawheny
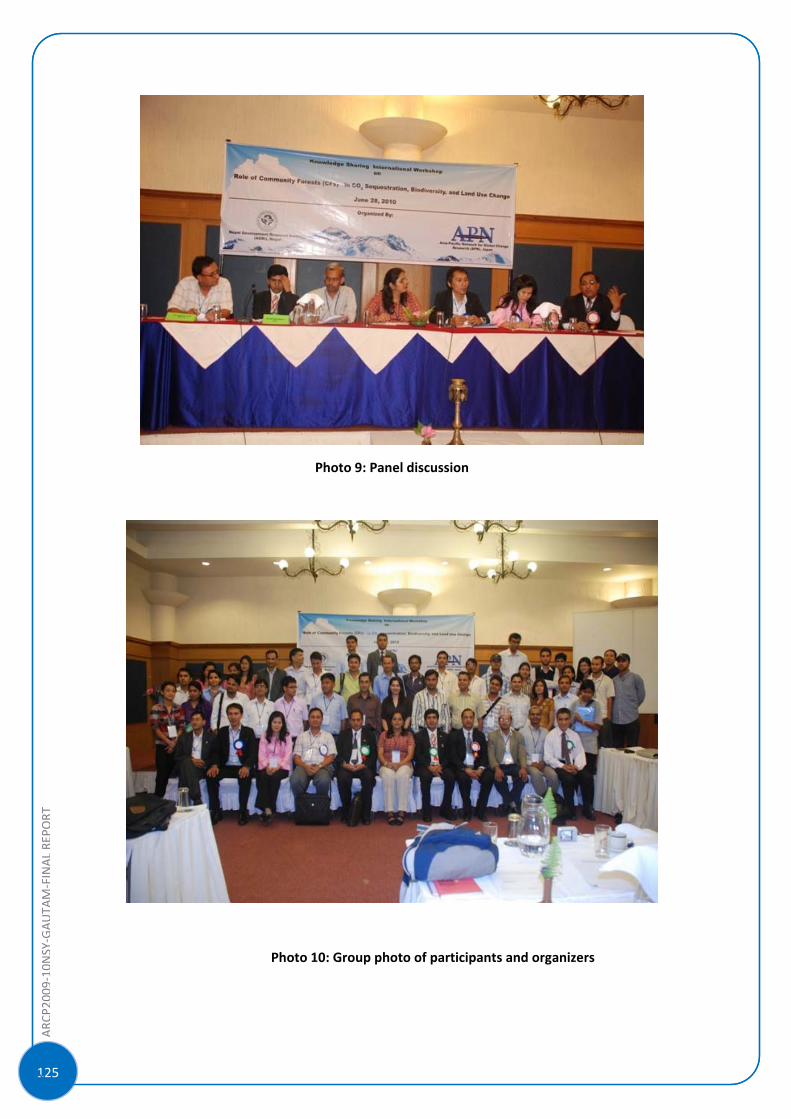
ARC
P2009‐10NSY‐GAUTA
M‐FINALRE
PORT
]
125
Photo 9: Panel discussion
Photo 10: Group photo of participants and organizers
Top Related
Copyright © 2022 FDOKUMEN

