


Bahasa
Halaman
Hukum

Asian Economic and Financial Review, 2014, 4(3):404-415
404
HOW IS THE RISK TOLERANCE OF INDIVIDUAL INVESTORS IN
KYRGYZSTAN?*
Ebru Çağlayan
Department of Econometrics, Marmara University, Goztepe Campus, Kadıkoy, Istanbul, Turkey
Raziahan Abdieva
Department of Economics, Kyrgyzstan-Turkey Manas University, Chyngyz Aytmatov Campus, Djal , Bishkek,
Kyrgyzstan
ABSTRACT
Investment and saving behaviour of individuals are important issues in the economies. Risk
tolerance of investors affects the investment decisions. In Kyrgyzstan, a transition economy, while
the investment resources are high, savings of individuals in financial organizations are low. This
study analyses the risk tolerance of individual investors in Kyrgyzstan and determines the factors
influencing investor types. In the study multinomial logit model is used to determine these factors.
The findings of the study show that men take more risk than women in Kyrgyzstan. When the age
increases people become less risk lover. Having non-wage income increases taking risk and
increases in the rate of investment. The findings also indicate that income has a positive effect on
the risk loving sense.
Keywords: Investment, Investor, Risk tolerance, Multinomial logit.
Jel Codes: GO2, G11, E21.
1. INTRODUCTION
Deviations from rational behaviour are observed when individuals are investing, particularly
deciding at risk. The main reason for this is that some of individual’s biases have an impact on
investment decisions. These biases that can be influencing on investment decisions are loss
aversion, mental accounting, regret aversion, overconfidence, over-optimism, self-control,
anchoring, framing, cognitive dissonance, representativeness, conservatism, social interaction.
Including these biases, willingness to live under good conditions in future and to earn more income
* The study is supported by Kyrgyzstan-Turkey University of Manas. Choice Of Investment Instruments of Kyrgyz People
and Investigation Of Investment Behavior of Kyrgyz People Under The Behavioral Finance Theory, Project No:
2012.SOB.01,2012.
Asian Economic and Financial Review
journal homepage: http://aessweb.com/journal-detail.php?id=5002
Asian Economic and Financial Review, 2014, 4(3):404-415
405
is also forces individuals to invest. In general, willingness of individuals to invest is influenced by
such personal factors as information about investment, age, health status, income, value
judgements, and also such financial factors as to achieve the growth of assets and to gain
permanent income and at last such environmental factors as social and cultural circumstances and
family.
When individual investors are investing, they remain face to face with different investment
instruments, depending on the country where they are located. In this case, investors are trying to
gain income by investing a certain part of their current revenues in various investment instruments.
Each selected investment has certain advantages and weaknesses in terms of security, risk, return
and liquidity. Investment instruments that widely used by individuals can be listed as cash,
currency, bank deposits, gold, real estate, land and securities. When individual investors are taking
a decision on investment instruments they must take different risks. According to their risk
tolerance, investors are divided into three types: risk lover, risk-neutral investor and risk-averse
investor.
Political and economic conditions in Kyrgyzstan in the beginning of transition process are
negatively affected investors' confidence in financial institutions. Because of low confidence in
financial institutions and financial illiteracy the most popular investment instruments among
Kyrgyz people are currency, real estate and deposits. Transformation of free money at the hands of
the people into financial investment instruments of stock exchange, force credit interests down,
activate the economy and at the result it will increase people’s welfare.
The aim of this study is to see how the risk tolerance of individual investors in Kyrgyzstan. For
this aim we analyse the influencing factors on investor types (risk-lover, risk-neutral and risk
averse) of Kyrgyz people who makes investment, by taking on individuals living in the capital city
of the Kyrgyzstan, in Bishkek, using the multinomial logit model. We prepared a questionnaire
which can reveal the biases and factors affecting to the investment decisions of investors. There
were carried out statistical and econometric analyses using the data obtained from this
questionnaire. The most important feature of this study, as we know, is in its implementing for the
first time the econometric analyse of investor behaviours in Kyrgyzstan.
The rest of the paper is organized as follows: The following section is including introduction.
Section 2 introduces financial situation in Kyrgyzstan after 1991 for the purpose of understand the
behaviour of investors. Section 3 presents multinomial logit model which used to estimate the
factors that influence the type of investors. Section 4 and 5 present sampling, data and descriptive
statistics, respectively. Findings of the model for investor types are summarised in Section 6. The
final section provides conclusions.
2. FINANCIAL SITUATION IN KYRGYZSTAN
Kyrgyzstan is transition economy which gained independence in 1991 after the crash of The
Union of Soviet Socialist Republics (USSR). Kyrgyzstan is counted as one of the transition
economies where economic and social crisis was very deep. In the recession of the transition period
Asian Economic and Financial Review, 2014, 4(3):404-415
406
decrease of the production was 50%. The reasons for such deep crisis is can be counted the great
dependence of the Kyrgyz economy on the USSR economy, subvention from the government
budget of the USSR to the budget of former Kyrgyz Soviet Republic was 8-14% to GDP, rapture of
commercial links between members of former Soviet Union countries.
Institutional structure of financial system of Kyrgyzstan consist of 22 commercial banks, 337
microcredit company, 91 microcredit agency, 5 financial company, “Financial Company of Credit
Unions” Corporation, 189 credit unions, 270 exchange bureau, 14 insurance company, 8
investment fund, 1 stock exchange and 2 pension fund (NBKR-National Bank of Kyrgyz Republic,
2012).
Commercial banks play a central role in financial intermediation in Kyrgyzstan in institutional
terms and outperform other financial intermediaries on economic potential (NBKR-National Bank
of Kyrgyz Republic, 2012). Kyrgyz Stock Exchange was organized in 1994. In 2011, two
companies that offer stock service "Kyrgyz Stock Exchange’ and 'Securities Trading System” are
merged and made an agreement for the establishment of a single trade field. In December 1, 2011
in the stock exchange market 77 professional companies were carrying out professional activities.
77. 108 licenses were granted to these people. 24 of them were brokers, 23 were dealers and 29 of
them were carried out asset management activity. In July 10, 2012 trade volume on this stock
exchange had exceeded 2.2 million coms. Total size of 2 deals reached 2.2457 million com
(Mazikina, 2012).
One of the major factors that hinder the development of the stock exchange in Kyrgyzstan is
the lack of information about the market, in other words, the lack of reliable and complete
information about the companies. This led to the less demand for the securities issued by the firms.
Lack of information and transparency reduces the confidence of the people in this investment
instruments. One of the main reasons for being passive the issue of securities in stock exchange is
not understanding the advantages of stock exchange completely and lack of information. Such
situation is the result of state’s fulfilment only the regulatory role, not undertaking inform the
people and activate the stock market adequately. As a result, today, the public are not confident in
the capital market (Luneva, 2011).
3. MULTINOMIAL LOGIT MODEL
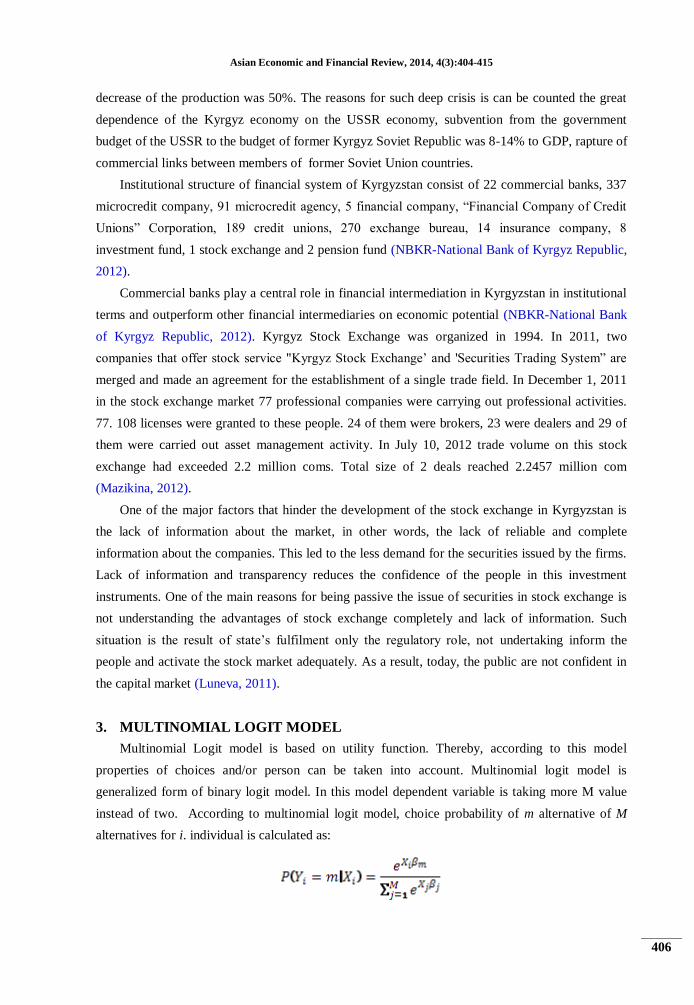
Multinomial Logit model is based on utility function. Thereby, according to this model
properties of choices and/or person can be taken into account. Multinomial logit model is
generalized form of binary logit model. In this model dependent variable is taking more M value
instead of two. According to multinomial logit model, choice probability of m alternative of M
alternatives for i. individual is calculated as:
Asian Economic and Financial Review, 2014, 4(3):404-415
407
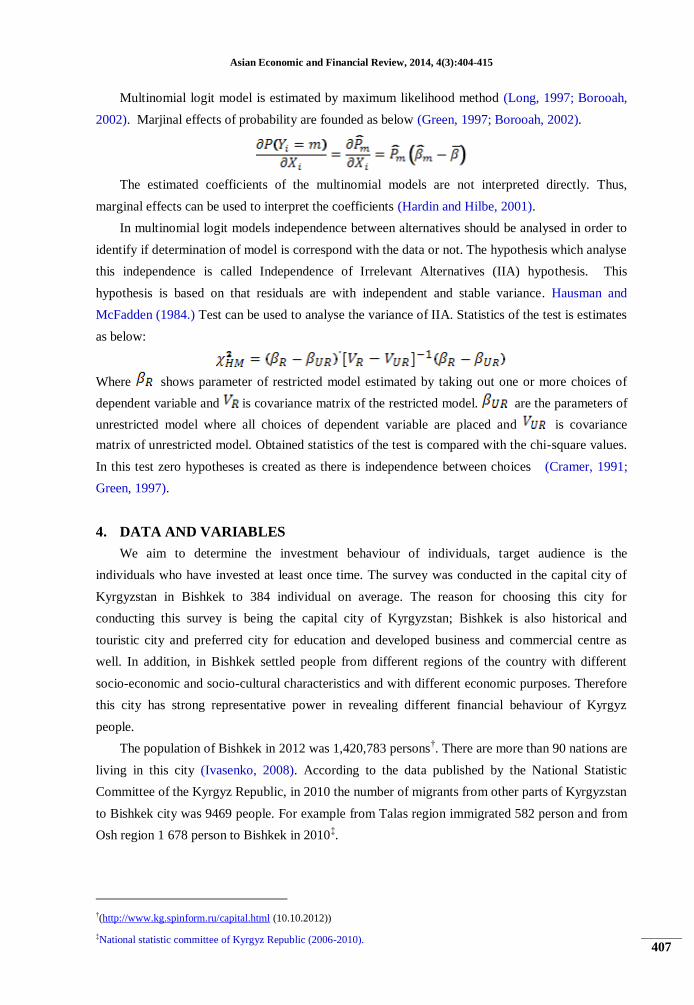
Multinomial logit model is estimated by maximum likelihood method (Long, 1997; Borooah,
2002). Marjinal effects of probability are founded as below (Green, 1997; Borooah, 2002).
The estimated coefficients of the multinomial models are not interpreted directly. Thus,
marginal effects can be used to interpret the coefficients (Hardin and Hilbe, 2001).
In multinomial logit models independence between alternatives should be analysed in order to
identify if determination of model is correspond with the data or not. The hypothesis which analyse
this independence is called Independence of Irrelevant Alternatives (IIA) hypothesis. This
hypothesis is based on that residuals are with independent and stable variance. Hausman and
McFadden (1984.) Test can be used to analyse the variance of IIA. Statistics of the test is estimates
as below:
Where shows parameter of restricted model estimated by taking out one or more choices of
dependent variable and is covariance matrix of the restricted model. are the parameters of
unrestricted model where all choices of dependent variable are placed and is covariance
matrix of unrestricted model. Obtained statistics of the test is compared with the chi-square values.
In this test zero hypotheses is created as there is independence between choices (Cramer, 1991;
Green, 1997).
4. DATA AND VARIABLES
We aim to determine the investment behaviour of individuals, target audience is the
individuals who have invested at least once time. The survey was conducted in the capital city of
Kyrgyzstan in Bishkek to 384 individual on average. The reason for choosing this city for
conducting this survey is being the capital city of Kyrgyzstan; Bishkek is also historical and
touristic city and preferred city for education and developed business and commercial centre as
well. In addition, in Bishkek settled people from different regions of the country with different
socio-economic and socio-cultural characteristics and with different economic purposes. Therefore
this city has strong representative power in revealing different financial behaviour of Kyrgyz
people.
The population of Bishkek in 2012 was 1,420,783 persons†. There are more than 90 nations are
living in this city (Ivasenko, 2008). According to the data published by the National Statistic
Committee of the Kyrgyz Republic, in 2010 the number of migrants from other parts of Kyrgyzstan
to Bishkek city was 9469 people. For example from Talas region immigrated 582 person and from
Osh region 1 678 person to Bishkek in 2010‡.
†(http://www.kg.spinform.ru/capital.html (10.10.2012))
‡National statistic committee of Kyrgyz Republic (2006-2010).
Asian Economic and Financial Review, 2014, 4(3):404-415
408
There are different ways are using when sample size is determines (Yamane, 2010). In this
study confidence interval for population ratio (P) is estimated with this formula: .
Optimum size of population ratio is determined the formula as follows:
Where, is confidence coefficient, d is margin of error and P is ratio of population. There was
made control according to n/N ratio after the calculation of the formula. Sample size calculated
according to the significance level 0.05. As the share of the people who investing in total
population of Bishkek is not known, for the Bishkek city, where the population in 2008 according
to the official reports of the Statistics Committee of Kyrgyz Republic§ was 819 900 person,
different ratios were determined for the size of sample. According to 0.05 margin of error for
P=0,5; P=0,4 and P=0,3 sample size is calculated as n1=384, n2=368, n3=323 respectively.
Maximum questionnaire number that will conducted in this study was determined as 384. Even in
the case of the population size is 1.000.000 person this size of sample can represent the population.
5. DESCRIPTIVE STATISTICS
In this research only individuals who have financial behaviour were analysed. Their answers to
the questionnaire show factors that they pay attention when they are investing. Thus, there were
analysed attitudes and behaviour of individuals when they are choosing an investment instrument.
The questionnaire includes 25 questions and 13 of them are related to the investment behaviour of
individuals.
Analysis of the age ranges of the participants of the survey shows that, 41% of them (163
person) are 29 years old and under, 43.7 % (174 person) are between the ages of 30-45, 12.3% (12
person) between the ages of 46 - 55 and 3 % (12 person) were 55 years and older. As we saw, 84%
(337 person) of the participants’ ages are 45 years and under. 52.3% (208 person) of the
participants are male, 47.7% (190) are female and 70.1% (279 person) are married, 24.4% are (97
person) single, 1.3% are (5 person) divorced, and 4% are (17 person) widow.
Considering the level of education of the respondents 16.3% (65 person) are secondary school
graduates, 11.6% (46 person) are vocational high school graduates, 58% (231 person) are
university graduates, 8.5% (34 person) has master degree and 5.5 % (22 person) had graduated
other doctoral (Ph.D.) and upper degrees. It shows that in our survey had participated people with
all level of education.
The average monthly personal income of individuals participating in the survey shows that
28,6% (114 person) of the participants’ the average monthly personal income is less than 10 000
com, 37.7 % (150 person) the average monthly personal income is between 10 001-20 000 coms,
13.6% (54 person) the average monthly personal income is between 20001 – 30000 coms, 6.5%
§http://www.kg.spinform.ru/capital.html(10.10.2012)
Asian Economic and Financial Review, 2014, 4(3):404-415
409
(26 person) is between 30 001 - 40,000 coms, 6.3% (25 person) between 40,001 - 50,000 coms,
7.3% (29 person) the average monthly personal income is 50001 com and more. In addition,
43.7% (174 people) of the participants has non-wage income, 56.3% (224 people) has not such
kind of income.
6. THE RESULTS OF THE MODEL FOR INVESTOR TYPES
In finance literature investor, according to the types, generally divided into three groups: risk
averse, risk-neutral and risk lover. Risk averse investor do not like to take a risk, therefore between
two different investment instrument with certain yields, he prefer less risky instrument. While
creating a portfolio risk averse investor is trying to minimize the risk and maximize yields by
diversification. So he will be in an effort to optimize the portfolio. In other words, this type of
investor will prefer a higher average income on the same level of risk.
For the risk-neutral investor is not important which investment instrument is chosen, because
such type of investors are not interested in risk. Therefore, these investors are indifferent between
risk and yield. As a result, they take investment decisions mostly based on return expectations. For
the risk lover investors risk premium is always at zero or below zero. This type of investors can
take risks even just for fun.
These three investor types can be identified by looking at the behaviour of investors after
changes in their wealth. While investor’s wealth is increasing his investment to the risky assets
increases too, then it can be said that this investor loves risk. If investor’s wealth increases but the
amount of his investment in risky assets does not change, it can be argued that investor maintains
the current status in the point of risk averse. Finally when the investor's wealth increases, the
investment into risky assets decreases, then it can be concluded that this investor is avoids risk.
There are many factors that effect on investors' risk perception and the process of developing the
behaviour besides wealth. On the average, men are known to have more tendencies to take a risk
than female. Moreover, information, experience and age of investor too are closely associated with
the degree of risk aversion. On the other hand the share of investment amount invested for the
investment instrument in the total wealth of investor too is one of the important factors affecting
the preference.
The categories of dependent variable (INV) used in current study have been formed as:
INV=1, if investor is risk-lover
INV=2, if investor is risk-neutral
INV=3, if investor is risk averse
Explanatory variables used in the estimates are described in Table 1.

Asian Economic and Financial Review, 2014, 4(3):404-415
410
Table-1.Definition of Explanatory Variables
Variable Definition
Age Year
Gender
1 if the person is male
0 if the person is female
Education
1 if the person is graduate secondary school; if not 0
1 if the person is graduate vocational high school; if not 0
1 if the person is graduate university; if not 0
1 if the person is graduate master degree; if not 0
1 if the person has a higher degree of education; if not 0
Rate of investment %
Income Average monthly personal income (com)
Non-wage income 1 if the person has non-wage income; if not 0
Place of residence 1 if the person is lives in his own home; if not 0
1 if the person is lives with parents; if not 0
1 if the person is living in rent house; if not 0
1 if the person is living in other place; if not 0
Types of investment 1 if the person invest in currency; or not 0
1 if the person invest in gold; or not 0
1 if the person invest in com; or not 0
1 if the person invest in land; or not 0
1 if the person invest in bank; or not 0
1 if the person invest in real estate; or not 0
1 if the person invest in stock exchange; or not 0
1 if the person invest in other asset; or not 0
Consultant 1 if the person following the investment professionals advice; or not 0
Number of staff Person
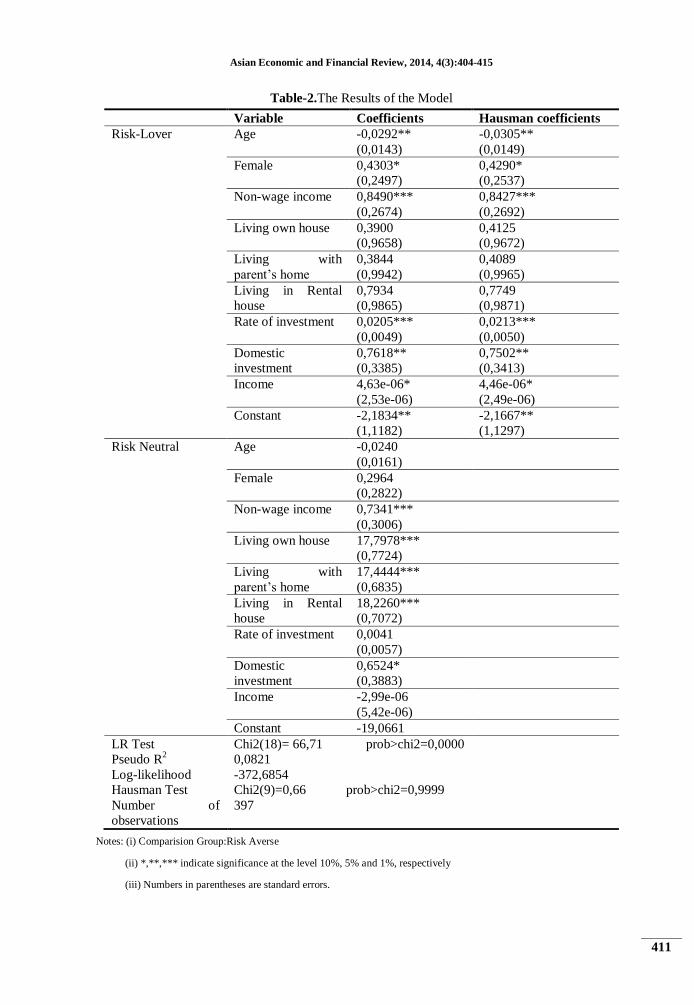
Estimated model in our study summarized in two tables. In the first table the coefficients
estimated from the multinomial logit model and the results of Hausman test are given. Moreover,
at the last column of the table the results of limited model of the Hausman test are given and
examined whether the independence assumption of the irrelevant alternatives is valid. In our study,
Hausman test was applied to all alternatives of the dependent variable in turn, but at the tables the
results for only one alternative are given. The results of other alternatives can be obtained from the
authors.
On the second table within the estimated coefficients of the multinomial logit model the
relative risk ratios (RRR) are given. As it is known coefficients of such models could not be
interpret directly, therefore interpretation of coefficient will be made according to relative risk
ratios. There are seven important factors that effects to investment type according to LR test
results: age, gender, non-wage income, place of residence, rate of investment, domestic investment
and income.
The results of multinomial logit model which analyses the factors on investor types are given
in Table 2. In this table first choice refers to risk-lover investor, second choice to risk-neutral
investor. Risk averse investor was taken as a comparison group.
Asian Economic and Financial Review, 2014, 4(3):404-415
411
Table-2.The Results of the Model
Variable Coefficients Hausman coefficients
Risk-Lover Age -0,0292**
(0,0143)
-0,0305**
(0,0149)
Female 0,4303*
(0,2497)
0,4290*
(0,2537)
Non-wage income 0,8490***
(0,2674)
0,8427***
(0,2692)
Living own house 0,3900
(0,9658)
0,4125
(0,9672)
Living with
parent’s home
0,3844
(0,9942)
0,4089
(0,9965)
Living in Rental
house
0,7934
(0,9865)
0,7749
(0,9871)
Rate of investment 0,0205***
(0,0049)
0,0213***
(0,0050)
Domestic
investment
0,7618**
(0,3385)
0,7502**
(0,3413)
Income 4,63e-06*
(2,53e-06)
4,46e-06*
(2,49e-06)
Constant -2,1834**
(1,1182)
-2,1667**
(1,1297)
Risk Neutral Age -0,0240
(0,0161)
Female 0,2964
(0,2822)
Non-wage income 0,7341***
(0,3006)
Living own house 17,7978***
(0,7724)
Living with
parent’s home
17,4444***
(0,6835)
Living in Rental
house
18,2260***
(0,7072)
Rate of investment 0,0041
(0,0057)
Domestic
investment
0,6524*
(0,3883)
Income -2,99e-06
(5,42e-06)
Constant -19,0661
LR Test
Pseudo R2
Log-likelihood
Hausman Test
Number of
observations
Chi2(18)= 66,71 prob>chi2=0,0000
0,0821
-372,6854
Chi2(9)=0,66 prob>chi2=0,9999
397
Notes: (i) Comparision Group:Risk Averse
(ii) *,**,*** indicate significance at the level 10%, 5% and 1%, respectively
(iii) Numbers in parentheses are standard errors.
Asian Economic and Financial Review, 2014, 4(3):404-415
412
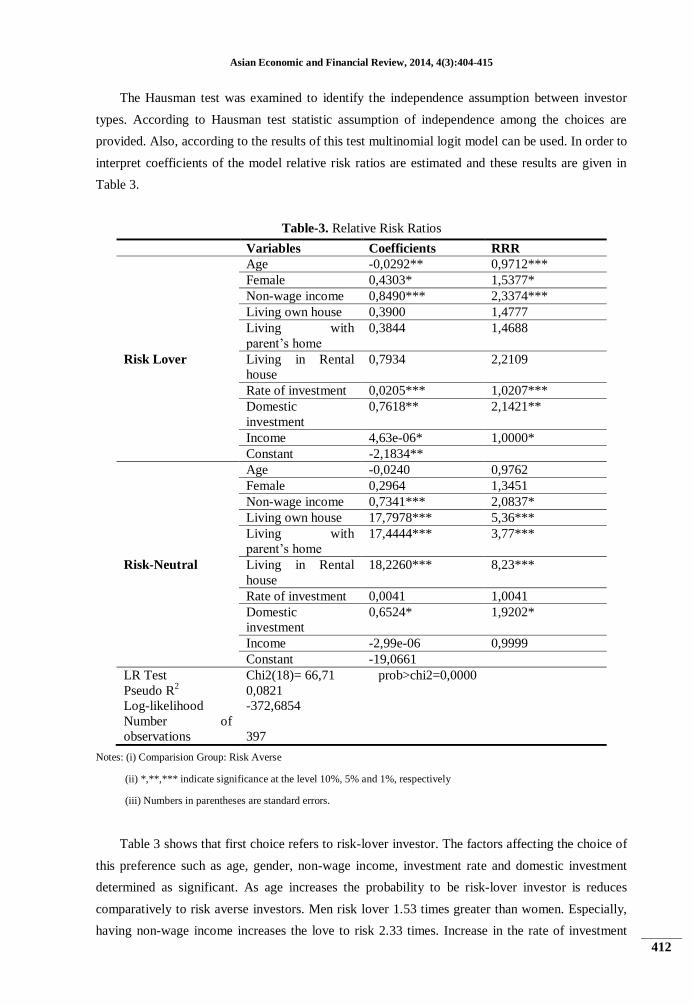
The Hausman test was examined to identify the independence assumption between investor
types. According to Hausman test statistic assumption of independence among the choices are
provided. Also, according to the results of this test multinomial logit model can be used. In order to
interpret coefficients of the model relative risk ratios are estimated and these results are given in
Table 3.
Table-3. Relative Risk Ratios
Variables Coefficients RRR
Risk Lover
Age -0,0292** 0,9712***
Female 0,4303* 1,5377*
Non-wage income 0,8490*** 2,3374***
Living own house 0,3900 1,4777
Living with
parent’s home
0,3844 1,4688
Living in Rental
house
0,7934 2,2109
Rate of investment 0,0205*** 1,0207***
Domestic
investment
0,7618** 2,1421**
Income 4,63e-06* 1,0000*
Constant -2,1834**
Risk-Neutral
Age -0,0240 0,9762
Female 0,2964 1,3451
Non-wage income 0,7341*** 2,0837*
Living own house 17,7978*** 5,36***
Living with
parent’s home
17,4444*** 3,77***
Living in Rental
house
18,2260*** 8,23***
Rate of investment 0,0041 1,0041
Domestic
investment
0,6524* 1,9202*
Income -2,99e-06 0,9999
Constant -19,0661
LR Test
Pseudo R2
Log-likelihood
Number of
observations
Chi2(18)= 66,71 prob>chi2=0,0000
0,0821
-372,6854
397
Notes: (i) Comparision Group: Risk Averse
(ii) *,**,*** indicate significance at the level 10%, 5% and 1%, respectively
(iii) Numbers in parentheses are standard errors.
Table 3 shows that first choice refers to risk-lover investor. The factors affecting the choice of
this preference such as age, gender, non-wage income, investment rate and domestic investment
determined as significant. As age increases the probability to be risk-lover investor is reduces
comparatively to risk averse investors. Men risk lover 1.53 times greater than women. Especially,
having non-wage income increases the love to risk 2.33 times. Increase in the rate of investment
Asian Economic and Financial Review, 2014, 4(3):404-415
413
and income has a positive effect on the risk loving sense, too. Investing in the country is affects
risk-lover investors 2.14 times more than risk-averse investors. In our study, while income and
non-wage income are increases, also being a men increasing the probability to love risk, age
increase (if we see it as the rise of knowledge and experience) decreases the probability to love risk
comparatively to not to love risk.
When the choice of being risk-neutral investor is analysed, it is obvious that non-wage income,
place of residence and domestic investment have significant effect. Place of residence increases the
probability to be risk-neutral investor comparatively to risk-averse investors. Growth of non-wage
income increases the probability to be risk-neutral 2.08 times. Specially to invest in the country
increases the probability to be risk-neutral 1.92 times. Demographic factors as age and gender have
not a significant effect on the probability of being risk-neutral investors.
7. CONCLUSION
Nowadays, Kyrgyz investors mostly prefer different kind of investment instruments which are
cash, currency, land, real estate and bank deposits. While investors with lower income generally
invest in cash and currency, investors with higher income invests in gold, land and real estate.
People prefer keep in hand most of their savings. The most significant reason for this situation is
low confidence in financial institutions and also lack of reliable information. Out of distrust to the
financial institutions as banks and stock exchange and low accessibility to the information’s about
investment instruments and firms, investment instruments such as security and shares are not
popular among the people. This problem might be particularly analysed. Even the holding the
savings at hands is not be seen as a problem as the individual behaviour, when we will take whole
economy, in the economy where there is shortage of financial resources, this evidence would be the
reason of many problems.
In this study we analyse the influencing factors on investor types (risk-lover, risk-neutral and
risk averse) of Kyrgyz investors using the multinomial logit model is to see how the risk tolerance
of them. When investor types are analysed, the findings indicate that the ratios of risk lovers are
increases with the increase of the share of income invested. The ratio of risk-averse are decreases
with the increase of the share of income invested. But, the level of investors who do not love risk at
all is same in each group. Generally, it is evident that while the one’s sense to take risk is increases
the share of income invested is increases too. Particularly, we must to know that, the individuals
who invest the large share of their income, within the loving the risk at same time they are thinking
and knowing about the risk.
In order individuals can invest their savings in stock exchange, government must in the first
stage give broad and systematic information about stock exchange, investment instruments of the
stock exchange, advantages and benefits of this instruments etc. Serious educational and
informative program should be prepared and executed relating this issue. Such programs are
implements in many developing countries as USA, England and Korea. For example, at the result
Asian Economic and Financial Review, 2014, 4(3):404-415
414
of implementation such program in Kazakhstan the activity of stock exchange increased to 60 % in
2009.
To increase the confidence of people in stock exchanges, legislation and legal basis must
developed, also transparency and accessibility of the information about the stock exchange and
firms listed in it must be provided. At the same time, the general situation of the country's economy
is very important for investors. Political and economic crisis that had been held in recent years
would be the reason further reduction investors' confidence. Therefore, the state should take care of
the stability of country's economy in general.
Thus, individuals' investment behaviour and preferences is very important for the country's
economy and for the government. In Kyrgyzstan in the first stage investors’ savings should be
mobilized to the most beneficial for the economy sphere, to the capital market. In the second stage,
government through its regulatory role should prevent abnormalities and crises in the financial
markets and protect investors.
REFERENCES
Borooah, V.K., 2002. Logit and probit ordered and multinomial models. California: Sage
publications.
Cramer, J.S., 1991. The logit model. New York: Edward Arnold.
Green, W.H., 1997. Econometric analysis. New Jersey: Prentice-Hall international.
Hardin, J. and J. Hilbe, 2001. Generalized linear models and extensions. Texas: Stata
press.
Hausman, J.A. and D. McFadden, 1984. Specification tests for the multinomial logit
model. Econometrica, 52(5): 1219-1240.
Ivasenko, L., 2008. Bishkek. Available from
http://www.allkyrgyzstan.com/kyrgyzstan/population/sities-and-
villages/bishkek.htm.
Long, J.S., 1997. Regression models for categorical and limited dependent variables.
California: Sage publications.
Luneva, G., 2011. http://slovo.kg/?p=5773, 10.07.2012, Ты и я – инвесторы.
Пассивные, .Slovo Kırgızstanna gazetesi, 2011, January 11.
Mazikina, Y., 2012. Available from http://www.24kg.org/economics/print:page,1,117238-
za-11-mesyacev-2011-goda-v-kyrgyzstane-obem.html.
National statistic committee of Kyrgyz Republic, 2006-2010. Demographic yearbook of
Kyrgyz republic.
NBKR-National Bank of Kyrgyz Republic, 2012. Report on stability of financial sector of
Kyrgyz Republic, for the first half-year of 2012, publishing house positive,
Bishkek (in Russian)

Asian Economic and Financial Review, 2014, 4(3):404-415
415
Yamane, T., 2010. TemelÖrneklemeYöntemleri. (A. Esin, C. Aydın, E. Gürbüzsel, M.A.
Bakır) LiteratürYayıncılık. Istanbul. Available from
http://www.kg.spinform.ru/capital.html.
Copyright © 2022 FDOKUMEN

