


Bahasa
Halaman
Hukum


1 23
Bulletin of EnvironmentalContamination and Toxicology ISSN 0007-4861Volume 90Number 4 Bull Environ Contam Toxicol (2013)90:465-470DOI 10.1007/s00128-012-0950-y
Arsenic and Mercury in Native AquaticBryophytes: Differences Among Species
Santiago Díaz, Rubén Villares, JesúsLópez & Alejo Carballeira

1 23
Your article is protected by copyright and all
rights are held exclusively by Springer Science
+Business Media New York. This e-offprint is
for personal use only and shall not be self-
archived in electronic repositories. If you
wish to self-archive your work, please use the
accepted author’s version for posting to your
own website or your institution’s repository.
You may further deposit the accepted author’s
version on a funder’s repository at a funder’s
request, provided it is not made publicly
available until 12 months after publication.
Arsenic and Mercury in Native Aquatic Bryophytes:Differences Among Species
Santiago Dıaz • Ruben Villares • Jesus Lopez •
Alejo Carballeira
Received: 28 September 2012 / Accepted: 19 December 2012 / Published online: 30 December 2012
� Springer Science+Business Media New York 2012
Abstract This study investigated the capacities of five
species of aquatic bryophytes to accumulate As and Hg
from their natural habitats in rivers in Galicia (NW Spain).
The distributions of the concentrations of both elements in
all species were skewed to the right, with a higher inci-
dence of extreme values in the As data, which may indicate
a greater degree of contamination by this metalloid. There
were no significant differences in the accumulation of
either of the elements between the different species stud-
ied, which justifies their combined use as biomonitors of
As and Hg, at least in the study area.
Keywords Biomonitoring � Interspecies calibration �Rivers � Galicia
Aquatic bryophytes are considered to be excellent indica-
tors of the presence of a wide range of contaminants
(Zechmeister et al. 2003). These organisms can accumulate
much higher concentrations of elements in their tissues
than the concentrations present in the water where they
develop (Dıaz et al. 2012), thus facilitating detection of
such elements. Although contaminant levels in water may
undergo large temporal variations, bryophytes integrate the
levels of contaminants in water over time (Cesa et al.
2006), and therefore less sampling effort is required.
Moreover, bryophytes only assimilate the bioavailable
fraction from water, which cannot be measured by simple
chemical analysis of water samples. Selection of which
species to use is a key factor in biomonitoring studies.
When single species of native biomonitors are used,
selection of the sampling sites may be greatly restricted by
the presence or absence of the species. To overcome this
problem, several species may be used, although intercali-
bration of the responses of the species to different levels of
contaminants must first be carried out (Lopez and Carbal-
leira 1993; Vuori and Helisten 2010). While intercalibra-
tion studies are relatively common in biomonitoring of
atmospheric contamination with terrestrial mosses (e.g.
Fernandez et al. 2000; Carballeira et al. 2008), the same is
not true for aquatic bryophytes.
The present study investigated the different capacities of
four species of aquatic moss and one species of aquatic
liverwort to accumulate As and Hg from their natural
habitats. For this purpose, data from an extensive sampling
survey of rivers in NW Spain were analysed, exploiting the
presence of more than one species at many of the sampling
sites.
Materials and Methods
The moss species Fontinalis antipyretica Hedw., Platy-
hypnidium riparioides (Hedw.) Dixon, Brachythecium
rivulare Schimp., Fissidens polyphyllus Wilson ex Bruch
S. Dıaz � A. Carballeira
Ecologıa, Departamento de Biologıa Celular y Ecologıa,
Facultad de Biologıa, Universidad de Santiago de Compostela,
15782 Santiago de Compostela, Spain
R. Villares (&)
Ecologıa, Departamento de Biologıa Celular y Ecologıa,
Escuela Politecnica Superior, Universidad
de Santiago de Compostela, 27002 Lugo, Spain
e-mail: [email protected]
J. Lopez
Departamento de Ecologıa y Biologıa Animal, Facultad
de Ciencias, Universidad de Vigo, 36310 Vigo, Spain
123
Bull Environ Contam Toxicol (2013) 90:465–470
DOI 10.1007/s00128-012-0950-y
Author's personal copy

& Schimp., and the liverwort Scapania undulata (L.) Dum
were collected from 218 sampling sites (100 m stretches)
distributed along rivers throughout Galicia (NW Spain).
The total number of samples collected was 424. Sampling
was carried out in summer, and the plants were collected
from depths that ensured that they had not suffered hydric
stress through exposure to the air (Wehr et al. 1983). The
samples were washed in situ with the river water and were
transported to the laboratory in cool boxes. In the labora-
tory, apical segments (2 cm long) were separated from the
plants for analysis (Wells and Brown 1990), to minimize
any possible error due to different accumulation capacities
of different parts of the plants (Wehr et al. 1983). The
apical segments were washed thoroughly with distilled
water prior to analysis. The element concentrations were
determined in extracts obtained from aliquots (300 mg dry
weight) of sample digested with nitric acid in Teflon flasks,
at high pressure and temperature, according to the proce-
dure described by Wehr et al. (1983) and Lopez and
Carballeira (1993). The concentrations of the elements
were determined by atomic fluorescence spectroscopy
(PSA Excalibur for As, and PSA Merlin Plus for Hg). The
limits of detection were 0.16 ng g-1 and 0.10 ng g-1 for
As and Hg, respectively. The analytical quality of the
results was determined by parallel analysis of certified
reference material BCR-61 (P. riparioides) from the
Community Bureau of Reference. The percentages of
recovery were 87 % and 84 % for As and Hg, respectively.
Differences in the capacities of the five species to bio-
accumulate the studied elements were determined by
regression analysis. The hypothesis tested (F-test) was that
different pairs of species had the same capacity for bio-
concentration, i.e. that the value of the slope of the
regression line was 1. The data were transformed (the As
data by logarithmic transformation and the Hg data by
square root transformation) prior to regression analysis, to
satisfy the requirement for normally distributed data. The
regression equations were only calculated when there were
at least 10 pairs of points. As regressions thus established
do not include any independent variables, the regression
models were of type II, and the major axis regression
method was applied (Sokal and Rohlf 1995; Warton et al.
2006). The calculations were carried out with SMATR
software (Warton et al. 2006; Falster et al. 2006).
Results and Discussion
The most abundant species in the study area were the
mosses F. antipyretica and P. riparioides, followed by the
liverwort S. undulata; the mosses B. rivulare and F. poly-
phyllus were relatively scarce.
The mean concentrations of As in the bryophytes were
approximately 2 orders of magnitude greater than those of
Hg (Table 1), which may be expected given that As is
usually found at higher natural concentration in fluvial
waters (Reiman and de Caritat 1998), although aquatic
bryophytes display a higher capacity to bioconcentrate Hg
than to bioconcentrate As (Dıaz et al. 2012). The concen-
trations of As were also more variable, and the overall and
individual coefficients of variation for each species were
always higher for As than for Hg (Table 1). The two most
abundant species (F. antipyretica and P. riparioides) were
those for which the coefficients of variation were highest.
No relationship was observed between the type of litho-
logical substrates in the different river basins and the
Table 1 Descriptive statistics
for As (concentrations in
lg g-1) and Hg (concentrations
in ng g-1) in different species of
aquatic bryophytes in rivers in
Galicia (NW Spain)
n Mean Median Mode S.D. C.V. Max/mode
As
F. antipyretica 171 12.43 5.73 3.31 18.13 145.9 38.67
P. riparioides 138 14.46 6.16 3.78 22.94 158.6 52.30
B. rivulare 23 12.08 6.74 4.13 14.98 124.1 11.30
F. polyphyllus 23 8.37 6.17 3.29 10.70 127.8 12.74
S. undulata 62 11.54 6.87 4.79 13.83 119.8 15.80
Pooled data 417 12.73 6.03 3.35 18.87 148.2 59.01
Hg
F. antipyretica 174 147.2 101.0 61.4 150.6 102.3 11.91
P. riparioides 139 128.7 89.05 73.9 126.9 98.61 9.23
B. rivulare 22 119.0 80.19 61.6 105.8 88.86 5.97
F. polyphyllus 22 225.1 163.0 107 182.6 81.13 5.37
S. undulata 67 139.4 105.7 78.1 120.7 86.54 7.11
Pooled data 424 142.5 96.79 65.9 139.5 97.92 11.09
466 Bull Environ Contam Toxicol (2013) 90:465–470
123
Author's personal copy

F. antipyretica
0
0.01
0.02
0.03
0.04
0.05
0.06
As (µg g-1) As (µg g-1)
Pro
bab
ility P. riparioides
0
0.01
0.02
0.03
0.04
0.05
0.06
-25 25 75 125 175 225 -25 25 75 125 175 225
As (µg g-1) As (µg g-1)
-25 25 75 125 175 225 -25 25 75 125 175 225
As (µg g-1) As (µg g-1)
-25 25 75 125 175 225 -25 25 75 125 175 225
Pro
bab
ility
B. rivulare
0
0.01
0.02
0.03
0.04
Pro
bab
ility F. polyphyllus
0
0.01
0.02
0.03
0.04
0.05
0.06
0.07
Pro
bab
ility
S. undulata
0
0.01
0.02
0.03
0.04
0.05
0.06
Pro
bab
ility pooled data
0
0.01
0.02
0.03
0.04
0.05
0.06
0.07
Pro
bab
ility
F. antipyretica
0
0.001
0.002
0.003
0.004
0.005
Hg (ng g-1)
Pro
bab
ility
.
P. riparioides
0
0.001
0.002
0.003
0.004
0.005
-100 100 300 500 700 900 -100 100 300 500 700 900
Hg (ng g-1)
Hg (ng g-1)-100 100 300 500 700 900 -100 100 300 500 700 900
Hg (ng g-1)
Hg (ng g-1)-100 100 300 500 700 900 -100 100 300 500 700 900
Hg (ng g-1)
Pro
bab
ility
B. rivulare
0
0.001
0.002
0.003
0.004
0.005
Pro
bab
ility F. polyphyllus
0
0.001
0.002
Pro
bab
ility
S. undulata
0
0.001
0.002
0.003
0.004
0.005
Pro
bab
ility pooled data
0
0.001
0.002
0.003
0.004
0.005
Pro
bab
ility
Fig. 1 Kernel smoothing
distributions of the
concentrations of As and Hg
measured in aquatic bryophytes
growing in rivers in Galicia
(NW Spain)
Bull Environ Contam Toxicol (2013) 90:465–470 467
123
Author's personal copy

concentrations of the elements studied, in contrast to
previous reports (Carballeira and Lopez 1997; Samecka-
Cymerman and Kempers 1999; Samecka-Cymerman et al.
2007; Vuori and Helisten 2010).
The kernel smoothing technique provides a better pic-
ture of the distribution of the combined data than classical
frequency histograms, as in the latter the distribution is
very sensitive to the number of classes established and to
the position of the classes along the variable axis (Aboal
et al. 2006). The kernel-smoothing distributions (Fig. 1)
were similar in all cases, and the distributions were skewed
to the right. The modal values observed in these distribu-
tions (Table 1) were similar to the concentrations of As
in F. antipyretica from clean sites, reported by other
studies (Nimis et al. 2002; Culioli et al. 2009; Martınez and
Shu-Nyamboli, 2011), and similar or lower to the con-
centrations of Hg in different species of aquatic bryo-
phytes, also from clean sites (Samecka-Cymerman and
Kempers 1998; Nimis et al. 2002; Cesa et al. 2009).
Therefore, we decided to use the modal values as the ref-
erence levels for establishing the background concentra-
tions of each element. The concentrations of the elements
in the most abundant species were also widely dispersed in
the kernel-smoothing distributions, as reflected by the
coefficient of variation. The distribution of the concentra-
tions of As was skewed further to the right than the dis-
tribution of the concentrations of Hg, indicating that the
extreme concentrations were further from the modal value.
The ratio between the maximum and modal value (Table 1)
was higher for As than for Hg in all species. These findings
may indicate greater contamination by As than by Hg.
The Contamination Factor (CF) can be defined as the
concentration of an element in a sample divided by the
background concentration of the element (Carballeira and
Lopez 1997). As already mentioned, the modal value from
the kernel-smoothing distributions was used as the back-
ground level. To characterize the sampling points in rela-
tion to the CF, the classification proposed by Mouvet
(1986) was applied (Table 2). For As, the CF was below 6
at 82 % of the sampling points, which were therefore
included in the no contamination or suspected contami-
nation categories; one of the other sites was classified as
extremely contaminated. For Hg, 94 % of the sampling
sites fell within the no contamination and suspected con-
tamination classes and none of the sampling sites were
within the two higher classes.
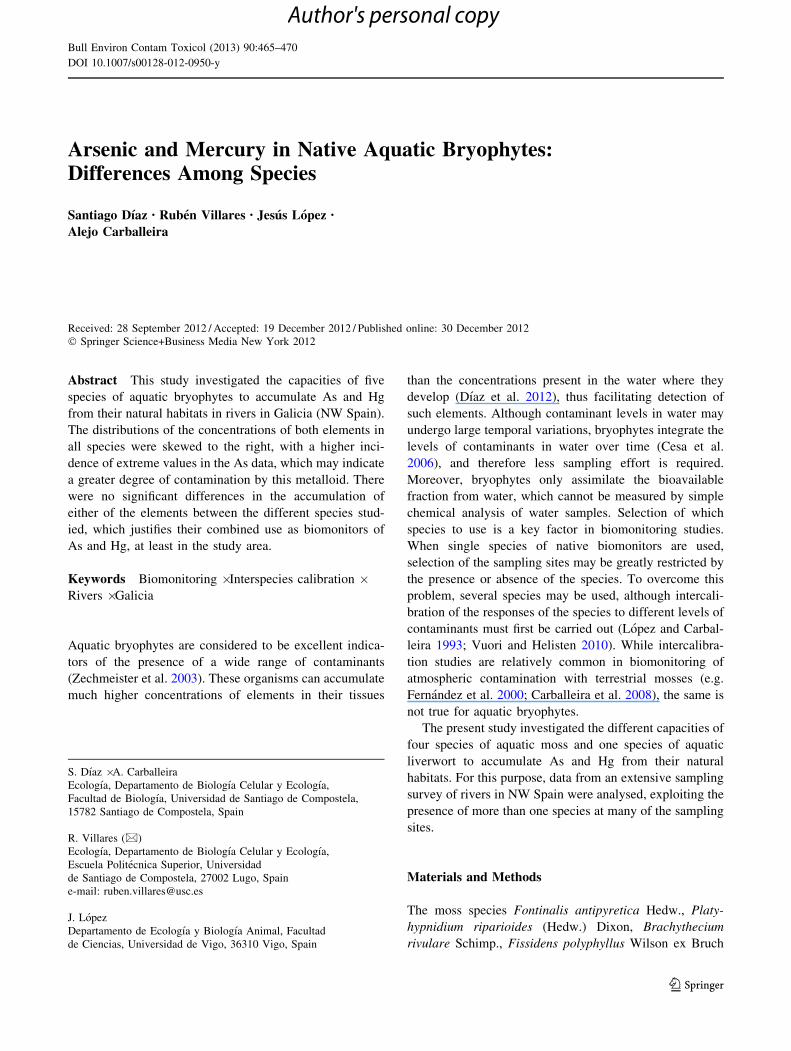
The regressions between pairs of species were highly
significant (almost always at p \ 0.001) for both elements,
except for Hg in B. rivulare and F. antipyretica, which
were not significantly related (Fig. 2). Significant differ-
ences from a line of slope 1 were not observed in any of the
cases (Table 3), indicating that there are no differences in
bioconcentration of As and Hg by the species considered.
Despite the differences in the accumulation capacities of
different aquatic bryophyte species for different metals
reported in other studies (Lopez and Carballeira 1993;
Vuori and Helisten 2010), the combined use of the species
studied appears valid, at least in the study area and for the
elements considered.
These results may be extrapolated to sites with similar
characteristics to those of the study area. The water in
Galician rivers is characterized by a pH close to neutral,
low conductivity and a low level of hardness, as limestone
rocks are scarce (Antelo and Arce 1996). However, dif-
ferent results may be expected in rivers with different
characteristics.
Table 2 Classification of the
sampling sites in relation to the
contamination factor (CF) for
each element, according to the
classification proposed by
Mouvet (1986)
As Hg
n % n %
Extreme contamination 54 \ CF 1 0.24 0 0.00
Serious contamination 18 \ CF \ 54 13 3.12 0 0.00
Moderate contamination 6 \ CF \ 18 60 14.39 27 6.37
Suspected contamination 2 \ CF \ 6 122 29.26 126 29.72
No contamination CF \ 2 221 53.00 271 63.92
468 Bull Environ Contam Toxicol (2013) 90:465–470
123
Author's personal copy

y1 = 1.014y2 + 0.0489
R2 = 0.7419p<0.001
-0.6
-0.1
0.4
0.9
1.4
1.9
F. antipyretica (Log As µg g-1)
P. r
ipar
ioid
es
y1 = 0.8975y2 + 0.2962
R2 = 0.7603p<0.001
-0.5
0
0.5
1
1.5
2
2.5
F. antipyretica (Log As µg g-1)
S. u
nd
ula
ta
y1 = 1.034y2 - 0.0616
R2 =0.7202p<0.001
-0.5
0
0.5
1
1.5
2
F. antipyretica (Log As µg g-1)
F. p
oly
ph
yllu
s
y1 = 1.084y2 - 0.1381
R2 = 0.8074p<0.001
-0.5
0
0.5
1
1.5
2
2.5
F. antipyretica (Log As µg g-1)
B. r
ivu
lare
y1 = 0.9787y2 + 0.1475
R2 = 0.7718p<0.001
-0.5
0
0.5
1
1.5
2
P. ripariodes (Log As µg g-1)
S. u
nd
ula
ta
y1 = 0.9981y2 - 0.1663
R2 = 0.7012p<0.001
-0.5
0
0.5
1
1.5
2
P. ripariodes (Log As µg g-1)
F. p
oly
ph
yllu
s
y1 = 0.9709y2 - 0.1663
R2 = 0.6593p = 0.004
-0.5
0
0.5
1
1.5
P. ripariodes (Log As µg g-1)B
. riv
ula
re
y1 = 1.236y2 - 0.6056
R2 = 0.7981p<0.001
-0.5
0
0.5
1
1.5
2
S. undulata (Log As µg g-1)
F. p
oly
ph
yllu
s
y1 = 0.8814y2 + 0.6355
R2 = 0.3289p<0.001
0
5
10
15
20
25
30
F. antipyretica (sqrt Hg ng g-1)
P. r
ipar
ioid
es
y1 = 0.7671y2 + 0.901
R2 = 0.5315p<0.001
0
5
10
15
20
25
F. antipyretica (sqrt Hg ng g-1)
S. u
nd
ula
ta
y1 = 0.859y2 - 0.0139
R2 = 0.7862p<0.001
0
5
10
15
20
25
F. antipyretica (sqrt Hg ng g-1)
F. p
oly
ph
yllu
sy1 = 2.42y2 - 13.92
R2 = 0.1259p = 0.162
0
5
10
15
20
25
F. antipyretica (sqrt Hg ng g-1)
B. r
ivu
lare
y1 = 0.8866y2 - 0.0235
R2 = 0.5629p<0.001
0
5
10
15
20
25
P. riparioides (sqrt Hg ng g-1)
S. u
nd
ula
ta
y1 = 0.776y2 + 2.434
R2 = 0.6124p<0.001
5
10
15
20
25
P. riparioides (sqrt Hg ng g-1)
F. p
oly
ph
yllu
s
y1 = 1.17y2 - 1.309
R2 = 0.7215p<0.001
0
5
10
15
20
25
30
-0.5 0.5 1.5
-0.6 0.4 1.4 2.4
-0.6 0.4 1.4 2.4-0.5 0.5 1.5 2.5
-0.5 0.5 1.5
-0.5 0.5 1.5 2.5-0.5 0 0.5 1 1.5
-0.5 0 0.5 1 1.5 2
0 10 20 30
0 10 20 30
0 10 20 300 5 10 15 20
0 10 20 305 15 25 35
0 10 20
S. undulata (sqrt Hg ng g-1)
F. p
oly
ph
yllu
s
Fig. 2 Regressions (model II) established between different species of aquatic bryophytes for tissue concentrations of As and Hg. The same
units are used in the x and y axes (concentrations of As subjected to log10 transformation and concentrations of Hg subjected to square root
transformation)
Bull Environ Contam Toxicol (2013) 90:465–470 469
123
Author's personal copy

References
Aboal JR, Real C, Fernandez JA, Carballeira A (2006) Mapping the
results of extensive surveys: the case of atmospheric biomon-
itoring and terrestrial mosses. Sci Total Environ 356:256–274
Antelo JM, Arce F (1996) Caracterısticas fısico-quımicas das augas
superficiais (Physical and chemical characteristics of surface
waters). In: Dıaz-Fierros F (ed) As Augas de Galicia. Consello
da Cultura Galega, Santiago de Compostela, p 350
Carballeira A, Lopez J (1997) Physiological and statistical methods to
identify background levels of metals in aquatic bryophytes:
dependence on lithology. J Environ Qual 26:980–988
Carballeira CB, Aboal JR, Fernandez JA, Carballeira A (2008)
Comparison of the accumulation of elements in two terrestrial
moss species. Atmos Environ 42:4904–4917
Cesa M, Bizzotto A, Ferraro C, Fumagalli F, Nimis PL (2006)
Assessment of intermittent trace element pollution by moss bags.
Environ Pollut 144:886–892
Cesa M, Bizzoto A, Ferraro C, Fumagalli F, Nimis PL (2009)
S.TR.E.A.M., system for trace element assessment with mosses.
An equation to estimate mercury concentration in freshwaters.
Chemosphere 75:858–865
Culioli JL, Fouquoire A, Calendini S, Mori C, Orsini A (2009)
Trophic transfer of arsenic and antimony in a freshwater
ecosystem: a field study. Aquat Toxicol 94:286–293
Dıaz S, Villares R, Carballeira A (2012) Uptake kinetics of As, Hg,
Sb, and Se in the aquatic moss Fontinalis antipyretica Hedw.
Water Air Soil Pollut 223:3409–3423
Falster DS, Warton DI, Wright IJ (2006) SMATR: Standardised
major axis tests and routines, ver 2.0. http://www.bio.mq.edu.au/
ecology/SMATR/. Accessed 27 July 2012
Fernandez JA, Rey A, Carballeira A (2000) An extended study of
heavy metal deposition in Galicia (NW Spain) based on moss
analysis. Sci Total Environ 254:31–44
Lopez J, Carballeira A (1993) Interspecific differences in metal
bioaccumulation and plant-water concentration ratios in five
aquatic bryophytes. Hydrobiologia 263:95–107
Martınez EA, Shu-Nyamboli C (2011) Determination of selected heavy
metal concentrations and distribution in a southwestern stream
using macrophytes. Ecotoxicol Environ Safe 74:1504–1511
Mouvet C (1986) Metaux lourds et mousses aquatiques: synthese
methodologique (Heavy metals and aquatic mosses: methodolog-
ical synthesis). Agence de l’Eau Rhone-Mediterranee-Corse, Metz
Nimis PL, Fumagalli F, Bizzotto A, Codogno M, Skert N (2002)
Bryophytes as indicators of trace metals pollution in the River
Brenta (NE Italy). Sci Total Environ 286:233–242
Reiman C, de Caritat P (1998) Chemical elements in the environment:
factsheets for the geochemist and environmental scientist.
Springer, Berlin
Samecka-Cymerman A, Kempers AJ (1998) Comparison between
natural background concentrations of heavy metals in bryophytes
from the Sudety Mountains and Swiss Alps. Chemosphere 12:
2661–2671
Samecka-Cymerman A, Kempers AJ (1999) Background concentra-
tions of heavy metals in aquatic bryophytes used for biomon-
itoring in basaltic areas (a case study from central France).
Environ Geol 39:117–122
Samecka-Cymerman A, Stankiewicz A, Kolon K, Kempers AJ (2007)
Self-organizing feature map (neural networks) as a tool in
classification of the relations between chemical composition of
aquatic bryophytes and types of streambeds in the Tatra national
park in Poland. Chemosphere 67:954–960
Sokal RR, Rohlf FJ (1995) Biometry: the principles and practice of
statistics in biological research, 3rd edn. W.H Freeman and
Company, New York
Vuori K-M, Helisten H (2010) The use of aquatic mosses in
assessment of metal pollution: appraisal of type-specific back-
ground concentrations and inter-specific differences in metal
accumulation. Hydrobiologia 656:99–106
Warton DI, Wright IJ, Falster DS, Westoby M (2006) Bivariate line-
fitting methods for allometry. Biol Rev 81:259–291
Wehr JD, Empain A, Mouvet C, Say PJ, Whitton BA (1983) Methods
for processing aquatic mosses used as monitors for heavy metals.
Water Res 17:985–992
Wells JM, Brown DH (1990) Ionic control of intracellular and
extracellular Cd uptake by the moss Rhytidiadelphus squarrosus(Hedw.) Warnst. New Phytol 116:541–553
Zechmeister HG, Grodzinska K, Szarek-Lukaszewska G (2003)
Bryophytes. In: Markert BA, Breure AM, Zechmeister HG
(eds) Bioindicators and biomonitors. Elsevier Science Ltd,
London, pp 329–375
Table 3 F-values and the associated significance levels for the dif-
ferences between the pairs of species and a line of slope 1 (see Fig. 2)
n F p
As
F. antipyretica–P. riparioides 116 0.060 0.806
F. antipyretica–B. rivulare 18 0.433 0.520
F. antipyretica–F. polyphyllus 14 0.035 0.854
F. antipyretica–S. undulata 49 1.751 0.192
P. riparioides–B. rivulare 10 0.013 0.910
P. riparioides–F. polyphyllus 15 0.004 0.948
P. riparioides–S. undulata 36 0.053 0.819
S. undulata–F. polyphyllus 13 1.985 0.187
Hg
F. antipyretica–P. riparioides 115 0.887 0.348
F. antipyretica–B. rivulare 17 2.175 0.161
F. antipyretica–F. polyphyllus 17 1.284 0.275
F. antipyretica–S. undulata 53 3.873 0.055
P. riparioides–F. polyphyllus 14 1.245 0.286
P. riparioides–S. undulata 37 0.656 0.423
S. undulata–F. polyphyllus 14 0.769 0.398
470 Bull Environ Contam Toxicol (2013) 90:465–470
123
Author's personal copy
Top Related
Copyright © 2022 FDOKUMEN

