


Bahasa
Halaman
Hukum


http://informahealthcare.com/drtISSN: 1061-186X (print), 1029-2330 (electronic)
J Drug Target, Early Online: 1–13! 2015 Informa UK Ltd. DOI: 10.3109/1061186X.2015.1015537
ORIGINAL ARTICLE
Aprotinin revisited: formulation, characterization, biodistributionand therapeutic potential of new aprotinin microemulsionin acute pancreatitis
H. Yesim Karasulu1, Nevin Oruc2, Neslihan Ustundag-Okur1, Derya _Ilem Ozdemir3, Zeynep Ay Senyigit1,Funda Barbet Yılmaz4, Makbule Asıkoglu2, Hayal Ozkılıc5, Eren Akcicek2, Tamer Guneri1, and Omer Ozutemiz2
1Department of Pharmaceutical Technology, Faculty of Pharmacy, 2Department of Gastroenterology, Faculty of Medicine, 3Department of
Radiopharmacy, Faculty of Pharmacy, 4Department of Pathology, Faculty of Medicine, and 5Department of Nuclear Medicine,
Faculty of Medicine, Ege University, Izmir, Turkey
Abstract
The aim of this study was to develop aprotinin-loaded microemulsion (MA) for intravenousadministration and evaluate the biodistribution and therapeutic potential of developedformulation in acute pancreatitis models in rats. Phase diagrams were constructed to identifymicroemulsion region and the optimal microemulsion was evaluated for physicochemicalproperties and treatment effect in rats, and comparisons made with the solution of aprotinin(SA). To evaluate the biodistribution of the drug by gamma scintigraphy aprotinin wasradiolabeled with 99mTc radionuclide. Mild and severe acute pancreatitis was induced in rats bysubcutaneous injections of cerulein and introductal infusion of 3% sodium taurocholate intothe bile-pancreatic duct, respectively. In addition, serum amylase and pancreatic tissuemyeloperoxidase activities were measured to evaluate the pancreatic damage. According togamma scintigraphy and biodistribution studies, accumulation times and distribution of99mTc-MA and SA were different. While MA was highly uptake by reticuloendothelial system,SA was mostly excreted by kidneys and bladder. Compared with the mild acute pancreatitisgroup, treatment with MA significantly decreased the serum amylase activity and pancreasmyeloperoxidase activity. Furthermore, the protease inhibitor molecule aprotinin hastherapeutic potential in acute pancreatitis. Finally, MA may be suggested as a promisingalternative for treatment of acute pancreatitis.
Keywords
Aprotinin, microemulsion, 99mTc-aprotinin,mild acute pancreatitis, severe acutepancreatitis
History
Received 21 November 2014Revised 16 January 2015Accepted 2 February 2015Published online 4 March 2015
Introduction
Therapeutic peptides and proteins are usually administered
via parenteral route since their poor absorption after oral
administration [1]. Parenteral route is very important for drug
development and delivery research. Parenteral microemul-
sions are valuable drug delivery system, due to their excellent
thermodynamic stability, low viscosity, ease of preparation,
ability to withstand sterilization techniques and potential to
provide sustained release [2,3]. Small particle size may results
in higher blood circulation time which would be useful in
certain cases [2]. In addition, microemulsions are suitable
dosage forms for delivering peptide and protein drugs [1,4,5].
Aprotinin is a monomeric globular polypeptide which
derived from bovine lung tissue. It has a molecular weight of
6512 Dalton and consists of 16 different amino acids arranged
in a chain of 58 amino acid residues. Since aprotinin is a
Kunitz protease inhibitor and has action particularly against
trypsin, chymotrypsin and kallikrein, it is theoretically
attractive molecule in ameliorating the effects of acute
pancreatitis [6,7]. Acute pancreatitis is autodigestion of the
pancreas by activated pancreatic enzymes especially trypsin
within the pancreatic acinar cells [8]. This autodigestion
process leads to profound inflammatory changes both locally
and systemically [9]. Although 80% of the acute pancreatitis
cases have mild course 20% have severe necrotising pancrea-
titis with high mortality rates [10,11]. There is no effective
treatment of acute pancreatitis and current management
options are usually supportive [10]. Experimental studies
are generally focused on anti-inflammatory drugs or mol-
ecules while trials focused on stopping the mechanistic
pathways in acute pancreatitis are quite few [12].
Aprotinin has been used for over three decades as an
intensive care drug for acute pancreatitis and hyperfibrinoly-
tic hemorrhage due to shock of traumatic or septic origin [13].
Although aprotinin therapeutic potential on pancreatitis is
proven experimentally, its clinical therapeutic success is
limited due to low targeting to pancreas [7,14]. Therefore,
in this study, we aimed to formulate aprotinin microemulsion
formulation to improve aprotinin bioavailability in the
pancreas.
Address for correspondence: Hatice Yesim Karasulu, Faculty ofPharmacy, Department of Pharmaceutical Technology, Ege University,35100 Bornova, Izmir, Turkey. Tel: +90 232 3111010/3138. Fax: +90232 3885258. E-mail: [email protected]
Jour
nal o
f D
rug
Tar
getin
g D
ownl
oade
d fr
om in
form
ahea
lthca
re.c
om b
y 78
.167
.183
.188
on
03/0
4/15
For
pers
onal
use
onl
y.

The purpose of this study was to formulate a novel o/w
microemulsion system of aprotinin (MA) for intravenous (i.v.)
administration and to investigate its feasibility for future
practice. For this aim, first, the physicochemical characteris-
tics and stability of microemulsion system were investigated.
Second, aprotinin was radiolabeled with 99mTc and quality
control and stability studies of 99mTc-aprotinin were per-
formed. Then, gamma scintigraphy and biodistribution studies
were performed to evaluate the biodistribution of aprotinin
solution (SA) and MA in rats with acute pancreatitis. Finally,
therapeutic potential of SA and MA for mild and severe forms
of experimental acute pancreatitis were evaluated.
Materials and methods
Materials
Aprotinin, Cremophor EL, cerulein, sodium taurocholate,
stannous chloride (SnCl2�2H2O) and Carregeenan were
purchased from Sigma (Steinheim, Germany) and oleic acid,
isopropanol, sodium hydroxide and sodium dihydrogen phos-
phate were purchased from Merck (Steinheim, Germany).
Glycine was purchased from Eczacibasi (Istanbul, Turkey).
Saline was purchased from Adeka (Istanbul, Turkey) and water
for injection was purchased from Sopharma (Istanbul, Turkey).99mTc was obtained from the Department of Nuclear Medicine
(Ege University, Istanbul, Turkey). All chemicals were used as
analytical grade.
Microemulsion formulation development
Phase diagram construction
Safe and biocompatible non-ionic surfactant (Cremophor EL)
and a co-surfactant (isopropanol) were chosen to form
microemulsions. Pseudoternary phase diagrams of oil, sur-
factant/cosurfactant and saline (0.9% NaCl) were developed
to formulate microemulsion systems for oleic acid (oil phase).
The weight ratio between Cremophor EL and isopropanol was
1:2. The mixtures of oil, surfactant/co-surfactant ranging at a
constant ratio from 5:95 to 95:5 (w/w), were titrated with
saline under constant magnetic stirring at 25 ± 2 �C. The
mixture was observed for transparency. The points from clear
to fuzzy and fuzzy to clear were defined as emulsion and
microemulsion, respectively. Based on the diagram, suitable
concentration of materials was selected. All the experiments
were repeated at least three times. The stability of
microemulsion was evaluated by measuring the turbidity
using a turbidimeter (Lovibond� Water Testing Tintometer�
Group, Dortmund, Germany). Centrifugal methods have been
also employed to subject the system to assess accelerated
stability [15,16]; The microemulsion was subjected to centri-
fugation at 5175� g for 30 min and observed for any phase
separation.
Preparation of aprotinin-loaded microemulsion (MA)
Aprotinin was slowly incorporated into the aqueous phase
under stirring and mixed the other composition of micro-
emulsion. After aprotinin was entirely dissolved in the
microemulsion, the clear microemulsion was obtained. The
final concentration of aprotinin in microemulsion system was
0.2 mg/mL [5000 kallikrein inactivator unit (KIU)]. MA was
filtered by 0.22 mm membrane sterile filter (Minisart,
Sartorius) into a sterile vial under laminar airflow Class II
cabinet (EsCo Class 2 ACIIG34M, Selangor, Malaysia). In
order to verify sterilization, 100 mL of MA was inoculated on
Eosin Methylene Blue and Blood agar mediums and
incubated at 37 �C for 48 h. The results were assessed by
bacteria colony counting. All the measurements were carried
out in triplicate.
Preparation of aprotinin solution (SA)
Two milligrams of aprotinin was dissolved in saline
(0.2 mg/mL). SA was filtered by 0.22 mm membrane sterile
filter (Sartorius) into a sterile vial under laminar airflow Class
II cabinet (EsCo Class 2, Selangor, Malaysia).
Characterization of microemulsions
The microemulsion was analyzed for various physicochemical
attributes. The average droplet size and polydispersity index of
microemulsions with or without aprotinin were measured by
photon correlation spectroscopy (Nano ZS, Malvern
Instruments, Worcestershire, UK). The viscosity values of
microemulsions were measured at 25 ± 2 �C using a viscosim-
eter (ULA spindle, Brookfield, WI). The pHs of the
microemulsions were detected at 25 ± 2 �C using a digital
pH-meter (HI 221, Ontario, Canada). The refractive indexes of
microemulsions were evaluated using a refractometer (Atago
RX-7000, Tokyo, Japan). Conductivity of the microemulsions
was studied at 25 ± 2 �C using a conductometer (Jenway 4071 –
Staffordshire, UK). The phase inversion temperature (PIT) of
the microemulsions with or without aprotinin was measured
using a conductometer [17,18] Experiments were performed in
triplicate for each sample. The osmolality measurements of
water phase with/without aprotinin were based on the freezing-
point method. After calibration of the osmometer (Knauer
Semi, Micro Osmometer, Berlin, Germany) with reference
standards (water and 400 miliosmol NaCl solution), the
osmolality was measured with 0.15 mL of sample [19]. All
the experiments were replicated at least three times. The
protein content of MA was determined using Lowry’s method
[20].
Morphology
The form and superficies morphology of microemulsions
with/without aprotinin were examined by transmission elec-
tron microscopy (TEM, FEI Tecnai G2, Netherlands). A drop
of microemulsion with or without aprotinin was placed on 300
mesh copper grids. Then, they allowed standing for 10 min.
The sample was quickly frozen at liquid nitrogen, followed by
freeze-dried at �55 �C [21]. One drop of 1% osmium
tetrachloride was applied for fixation and allowed to dry for
5 min. All the measurements were carried out in triplicate.
Preparation of 99mTc-aprotinin
Aprotinin was labeled by 99mTc with small modification on
previously described method [22]. Glycine phosphate alkaline
buffer (GPB) was prepared by mixing 1 mL 3.5% sodium
dihydrogen phosphate in 1 mL 1 M NaOH solution, 6 mL
1.5% glycine, 6 mL saline and 9 mL water for injection. Two
2 H. Y. Karasulu et al. J Drug Target, Early Online: 1–13
Jour
nal o
f D
rug
Tar
getin
g D
ownl
oade
d fr
om in
form
ahea
lthca
re.c
om b
y 78
.167
.183
.188
on
03/0
4/15
For
pers
onal
use
onl
y.

milligrams aprotinin was dissolved in 0.6 mL GPB and 400 mL
freshly prepared stannous chloride solution (2 mg
SnCl2 � 2H2O/1 mL of 0.005 M HCl) was added under nitro-
gen atmosphere. The mixture was mixed well and filtered
from a 0.22 mm membrane filter into a vial. Four millicurie
(mCi) 99mTc was used for radiolabeling. After nitrogen
bubbling was observed the solution was allowed to stand for
20 min at room temperature prior to radiochemical analysis.
Quality control and the stability of 99mTc-aprotinin
Radiochemical purity of 99mTc-aprotinin was analyzed by
paper and thin layer chromatography (TLC) studies. Albumin-
impregnated instant thin layer chromatography silica gel
strips (ITLC-SG) were prepared by soaking in 5 mg/mL
bovine serum albumin (BSA) solution for 30 min, then clean
with water, air dried and stored at 4 �C until required [22].
Whatman No:3 papers and albumin-impregnated ITLC-SG
strips were used as stationary phases while acetone and
ammonia/ethanol/water (A/E/W) (1/2/5) were mobile phases.
For radiochemical purity studies, strips were placed into
two developing chambers containing acetone and A/E/W
(1/2/5). After the solvent front reached the end point (0.5 cm
from the bottom), the strips were removed and allowed to
dry. Radioactivity on the strips was detected by an AR-2000
Radio-TLC Scanner (Bioscan Inc., Washington, DC). The
radioactive contaminants were identified as reduced/
hydrolyzed (R/H) 99mTc and free 99mTc-pertechnetate. Free99mTc was determined using Whatman No:3 papers as
stationary phase and acetone as the mobile phase. Reduced/
hydrolyzed (R/H) 99mTc was determined by albumin-impreg-
nated ITLC-SG strips which developed in A/E/W solvent
system. Percentage the radiochemical purity (RP%) of 99mTc-
aprotinin was calculated from the following equation by
subtracting from 100 the sum of measured impurities
percentages.
RP% ¼ 100� Free 99mTc%þ R=H 99mTc%� �
Stability of 99mTc-aprotinin was determined using TLC
studies at room temperature up to 6 h.
Preparation of 99mTc-aprotinin-loaded microemulsion
and solution
Two milligrams of aprotinin was labeled with 99mTc accord-
ing to above studies and loaded into 10 mL of microemulsion
or saline (0.2 mg/mL).
In vivo studies
The experimental protocol was approved by the Local Animal
Ethical Committee of Ege University (Approval No. E.U.
1344-249) according to the Declaration of Helsinki. Female
Wistar albino rats (3–6 months age) weighing 250 ± 20 g were
purchased from the Experimental Animal Center of Ege
University (Turkey). Rats were housed in a room maintained
at 22 ± 1 �C with an alternating 12 h light-dark cycle. Animals
had free access to pellet diet and water ad libitum.
Hemolysis test
The effect of microemulsions on the integrity of erythrocyte
membranes was investigated by in vitro hemolysis assay [23].
The release of hemoglobin from the erythrocytes (RBC) was
used as a measure of toxicity of microemulsions. Briefly, rat
RBC were separated from 20 mL fresh rat blood by centri-
fugation at 2000� g for 15 min and then washed thrice with
20 mL of saline. The purified RBC was resuspended in saline
to obtain 2% (v/v) of RBC suspension. Immediately there-
after, 2.5 mL of the RBC suspension was incubated with
2.5 mL of tested microemulsions (with or without aprotinin)
at 37 �C for 0.5, 1, 2 and 3 h in an incubator shaker and then
centrifuged at 3000� g for 10 min. The percentage of
hemolysis was measured by UV–Vis analysis of the super-
natant at 545 nm absorbance (ABS). Saline was used as the
negative control with 0% hemolysis, and distilled water was
used as the positive control with 100% hemolysis. All the
hemolysis data points were presented as the percentage of the
complete hemolysis. The percent hemolysis caused by the test
sample was calculated according to the following equation
(n¼ 3):
Hemolysis percent %ð Þ ¼ ABSsample � ABSsaline
ABSdistilled water � ABSsaline
� �� 100
Experimental model of pancreatitis with cerulein (mild acute
pancreatitis)
Rats were randomly divided into six experimental groups and
all the groups consisted of seven rats (n¼ 7). An experimental
model of mild acute pancreatitis was created on first three
groups. Mild acute pancreatitis was induced in rats by four
subcutaneous injections of 20 mg/kg cerulein every hour up to
4 h [12]. On the other hand, to create control group, last three
groups was injected with saline instead of cerulein. Mild
acute pancreatitis induced rats (AC1–C3) were treated with MA
or SA (AC1MA, AC2SA) or saline (AC3S) by i.v. injection 1 h
before the first cerulein injection. 5000 KIU aprotinin was
selected as therapeutic dose of pancreatitis according to the
literature [24]. Last three control groups (AS4–S6) were
applied with MA or SA (AS4MA, AS5SA) or saline (AS6S),
respectively, by i.v. injection 1 h before the first saline
injection.
AC1MA: Mild pancreatitis group, rats were treated with MA.
AC2SA: Mild pancreatitis group, rats were treated with SA.
AC3S: Mild pancreatitis group, saline was injected into rats as
control.
AS4MA: Control group, rats were treated with MA.
AS5SA: Control group, rats were treated with SA.
AS6S: Control group, saline was injected into rats as
control.
Experimental model of pancreatitis with sodium taurocholate
(Severe acute pancreatitis)
Rats were randomly divided into six experimental groups and
all the groups consisted of seven rats survived (n¼ 7). Severe
acute pancreatitis was induced by intraductal (ID) infusion of
3% taurocholate in BT1, BT2 and BT3 experimental groups.
Under sterile conditions, a midline laparotomy was performed
and the common biliopancreatic duct was cannulated with
27-gauge needle. The seromuscular layer of duodenum was
punctured 2–3 mm away from the entrance of biliary duct.
The needle was introduced into the duct. The distal
DOI: 10.3109/1061186X.2015.1015537 Aprotinin microemulsion in acute pancreatitis 3
Jour
nal o
f D
rug
Tar
getin
g D
ownl
oade
d fr
om in
form
ahea
lthca
re.c
om b
y 78
.167
.183
.188
on
03/0
4/15
For
pers
onal
use
onl
y.

biliopancreatic duct ligated to avoid reflux of taurocholate
into the duodenum. To prevent leakage of bile salt into the
liver, the bile duct was clamped temporarily near the hepatic
hilum. Sterile 3% sodium taurocholate 0.1 mL/100 g of body
weight was infused slowly. After the infusion completed, the
needle and the ligature were removed, the hepatic hilum was
decamped and the abdominal wound was closed in two layers
[12]. On the other hand, for creating control groups, saline
was applied instead of sodium taurocholate (BS4, BS5 and
BS6). Severe acute pancreatitis induced rats (BT1–T3) were
treated with MA or SA (BT1MA, BT2SA) or saline (BT3S) by
injection into femoral vein. Furthermore, last three control
groups (BS4–S6) were treated with MA, SA (BS4MA, BS5SA) or
saline (BSP6S), respectively, by injecting into the femoral vein.
Experimental groups were as follows:
BT1MA: Severe pancreatitis group, rats were treated with MA.
BT2SA: Severe pancreatitis group, rats were treated with SA.
BT3S: Severe pancreatitis group, saline was injected into rats
as control.
BS4MA: Control group, rats were treated with MA.
BS5SA: Control group, rats were treated with SA.
BS6S: Control group, saline was injected into rats as control.
Air pouch formation
Rats were randomly divided into two experimental groups and
all the groups were consisted of seven rats (n¼ 7). The air
pouch was formed by initial subcutaneous (SC) injection of
20 mL air into back of male Wistar albino rats and injection of
10 mL air every 3 days to sustain its patency (Figure 1) [25].
Six days after the initial injection of air, 2 mL of 1%
carrageenan solved in 0.9% saline was injected into the cavity.
After that, air pouch induced rats (C1–2) were treated with i.v.
injection of MA or SA (C1MA, C2SA). Six hours after
carrageenan injection, the animals were anesthetized with
ether and 1 mL of heparinized saline was given to wash out
the cavity. The pouch cavity was opened and the exudate was
harvested 6 h after injecting carrageenan. Experimental
groups were as follows:
C1MA: Rats were treated with MA.
C2SA: Rats were treated with SA.
Gamma scintigraphy and biodistribution experiments
For gamma scintigraphy and biodistribution experiments
radiolabeled aprotinin-loaded microemulsion and saline
were administered into the tail vein of anesthetized rats
with mild acute pancreatitis (ACMA, ACSA), severe acute
pancreatitis (BTMA, BTSA), air pouch models (CMA, CSA) or
untreated rats. The scintigraphic images were obtained with
a dual head gamma camera (Infinia General Electric, GE
Healthcare, Waukesha, WI) equipped with a low-energy high-
resolution collimator viewing the whole body of rats. After
administration of formulations, serial anterior static images
were taken in a 256� 256 matrix at different time intervals
up to 90 min.
For quantitative evaluation, regions of interest were drawn
around the interested organs and soft tissue of rats. The99mTc-aprotinin uptake was calculated by dividing the average
counts per pixel within the region of target to the average
counts per pixel within the region of background.
After scintigraphy studies, the rats were sacrificed and
biodistribution was determined. Furthermore, results of the
biodistribution studies were compared with healthy (no drug
treated) rats. Samples of interested organs including pancreas,
kidney, spleen, liver and soft tissue were weighed and the
radioactivity was measured using a gamma counter (Sesa
Uniscaller). The results were expressed as the counts per gram
of tissue. The ratio of blood radioactivity to relevant tissue
radioactivity was calculated for each rat.
Assessment of the efficacy of treatment
Rats were isolated to minimize stress and they were
anesthetized with ketamin hydrochloride (50 mg/kg IM) and
xylazine hydrochloride (10 mg/kg IM). They were sacrificed
12 h after cerulein-induced acute edematous pancreatitis
model and 8 h after severe acute pancreatitis model were
created. Blood samples were taken and centrifuged at
3000 rpm for 10 min. Serum samples were separated and
stored in special tubes at �20 �C. Serum amylase activity was
determined by the enzymatic photometric method. The
abdomen of the rats was opened and the pancreatic tissue
was removed. Pancreatic samples were divided into two parts.
One pancreatic tissue was used for the myeloperoxidase
(MPO) activity assays. MPO activity was determined as
previously described [26]. To carry out the assays, pancreas
tissue samples were homogenized in 1 M PBS (pH 7.4) and
centrifuged at 12 000� g for10 min at 4 �C. The supernatant
was assayed for MPO activity with standard ELISA kits
(Hycult HK105). Another part of pancreas tissue was used for
pathological examination.
Histopathological examination
The abdomen of the rats was opened and the pancreatic tissue
was excised. Pancreatic tissues separated for pathological
analysis was immediately inserted into 10% buffered forma-
lin. The tissue samples were subsequently processed with
conventional techniques. Hematoxylin–eosin stained slides
were reviewed under standard light microscope.
Histopathological alterations were assessed by an experi-
enced pathologist blinded to the experimental groups accord-
ing to the Schoenberg grading system in mild acute
pancreatitis groups [27]. Oedema was graded as: 0, no
oedema; 1, interlobular oedema; 2, moderate interlobular and
intra-acinar oedema; and 3, severe interlobular and intra-
acinar oedema. Neutrophil infiltration was graded as: 0, noFigure 1. Air pouch formed rats.
4 H. Y. Karasulu et al. J Drug Target, Early Online: 1–13
Jour
nal o
f D
rug
Tar
getin
g D
ownl
oade
d fr
om in
form
ahea
lthca
re.c
om b
y 78
.167
.183
.188
on
03/0
4/15
For
pers
onal
use
onl
y.

infiltration; 1, minimal infiltration, intravascular margination
of granulocytes in capillaries and post-capillary venules; 2,
moderate infiltration, granulocytes present in the perivascular
tissue; and 3, diffuse infiltration of entire pancreatic gland.
Fatty necrosis was graded between 0 and 3 according to the
extent of necrosis. Total possible maximum score was 9.
Severity of necrotizing pancreatitis was determined by a
scoring system described by Spormann et al. [28] This score
includes the graded assessment of pancreatic edema (0–3),
inflammatory infiltration (0–3), pancreatic necrosis (0, 3, 5
and 7), pancreatic hemorrhage (0, 3, 5 and 7) and extra
pancreatic fatty necrosis (0, 3, 5 and 7) for a possible
maximum score of [27,28].
Statistical data analysis
Statistical analysis was performed using a one-way analysis of
variance (ANOVA) Kruskal–Wallis analysis and Chi-square
to test the difference between the means of MA and SA in vivo
studies. Results were given as mean or median as appropriate.
Data were considered statistically significant at p50.05.
Results and discussion
Preparation of aprotinin-loaded microemulsions
The formulation of parenteral dosage form of lipophilic and
hydrophilic drugs has confirmed to be challenging [29].
Microemulsions are suitable dosage forms for delivering
peptide and protein drugs [4]. O/w microemulsions are
beneficial in the parenteral delivery of drugs. In this study,
o/w microemulsion was developed by titration method using
pseudo-ternary phase diagrams.
The construction of pseudo-ternary phase diagrams was
used to define the composition of the aqueous phase, oil
phase, surfactant and co-surfactant from which the trans-
parent, one-phase microemulsions were formed. Most of the
time, cosurfactant would be beneficial to the formation of
microemulsions by penetrating surfactant monolayer [30].
The pseudo-ternary phase diagrams with various weight
ratios of oleic acid, Cremophor EL, isopropanol and saline
are shown in Figure 2. The HLB value of the formulation
was calculated as 8.5. The transparent microemulsion
region is presented in the shady side of phase diagrams
and the other areas signify for the non-microemulsion
region with an opaque appearance. Once the microemulsion
region was identified, the microemulsion at preferred
component ratios was prepared from gravity center of the
phase diagram. According to these diagrams, it was
considered that the optimum microemulsion contained
9.34% oleic acid, 18% Cremophor EL, 36% isopropanol
and 36.66% saline.
In this study, i.v. injection was suggested as administration
route for MA. Therefore, all the ingredients of the micro-
emulsions were chosen according to biocompatible, non-
irritating, injectable, sterilizable, non-hemolytic characteris-
tics [2]. The choice of the surfactant is not only critical for
the safety of injections but also for the formulation of
microemulsion. Thus, the aim in the formulation of o/w
microemulsion was to have lowest amount of surfactant with a
suitable composition for microemulsion system. Based on
these criteria, Cremophor EL was selected as a surfactant and
as an emulsifier with good in vivo tolerance after parenteral
administration. Previously, it was stated that, in some i.v.
formulations, Cremophor EL was used at high concentrations
such as 40% [31,32]. On the other hand, in this formulation,
Cremophor EL was used as 18% (w/w) concentration.
Similarly, oleic acid has been used safely in the oil phase of
i.v. microemulsions [33].
Figure 2. The pseudo-ternary phase diagramsof oleic acid/Cremophor EL/propanol/saline.The area of the shady side represents thesingle-phase microemulsion region. Point (o)represents ratios of 9.34:54:36.66 for micro-emulsion formulation (oil surfactant/co-surfactant:water).
DOI: 10.3109/1061186X.2015.1015537 Aprotinin microemulsion in acute pancreatitis 5
Jour
nal o
f D
rug
Tar
getin
g D
ownl
oade
d fr
om in
form
ahea
lthca
re.c
om b
y 78
.167
.183
.188
on
03/0
4/15
For
pers
onal
use
onl
y.

According to the turbidity stability studies, microemulsion
did not show any evidence of instability about turbidity.
Furthermore, after 30 min of the centrifugation at 3000 rpm,
the developed microemulsion did not show any phase
separation.
Microemulsion containing 0.2 mg (5000 KIU) of aprotinin
per milliliter of formulation was prepared by dissolving the
appropriate amount of drug in water phase and mixing the
other composition of formulation. After dissolving process,
the clear microemulsion-based formulation was obtained. The
formulations were stored at 25 and 37 �C during 24 h and no
difference was observed.
Sterility is one of the pre-requisites for the parenteral
preparations. Microemulsions are considered as suitable
formulations for sterile filtration. Fort this reason, the
developed microemulsions were easily filtered through
0.2mm sterile filters under sterile conditions. The sterile
microemulsions were kept in sealed sterile vials until the
experiment. The sterility of the developed formulation was
evaluated by bacteria colony counting technique. According
to the sterility studies no growth was observed on the agar
mediums and the formulations were detected to be sterile.
Characterization of microemulsions
The physicochemical parameters of the microemulsions were
listed in Table 1. The average droplet size of microemulsion
without aprotinin was 67.3 ± 0.387 nm. However, in aprotinin-
loaded microemulsion, the average droplet size was
64.55 ± 3.217 nm. The incorporation of aprotinin into micro-
emulsion resulted in a 2.75 nm decrease in the droplet size.
This finding supports a recent study that found the mean
droplet size was decreased after the drug loading [34]. In a
previous study, Washington and Davis [35] described that i.v.
emulsions should have a droplet diameter below 0.5 mm, with
most commercial products being in the range 0.25–0.4 mm. It
can be concluded that aprotinin-loaded microemulsion may
be suitable for i.v. administration since the droplet size is in
these limitations.
The polydispersity value shows the homogeneity of the
droplet size. In all of the formulations, polydispersity values
were smaller than 0.3 and this indicate that the droplet size
had high homogeneity.
The viscosity values of microemulsions with or without
aprotinin were found to be 17.000 ± 0.017 and 14.806 ± 0.032
cP, respectively (Table 1). The results showed that incorpor-
ation of aprotinin into microemulsion significantly increased
the viscosity (p50.05). The relatively low viscosity values
indicated that the microemulsions formulated were composed
of individual spherical droplets or bicontinuous structures and
non-isometric aggregates were present [36]. The low viscosity
of the developed microemulsion ensures ease of syringeability
as well as ease of mixing with i.v. fluids with minimum
mechanical agitation [15].
The acceptable range is pH 2–12 for i.v. and intramuscular
formulations [15]. The average pH of all the microemulsions
ranged from 4.907 ± 0.015 to 5.500 ± 0.010 and the aver-
age refractive indexes of microemulsions ranged from
1.447 ± 0.014 to 1.394 ± 0.005 (Table 1). The incorporation
of aprotinin into microemulsion significantly increased the
pH and the refractive index values (p50.05). The pH of the
microemulsions was appropriate for parenteral delivery of
aprotinin.
The phase systems (o/w or w/o) of the microemulsions
were detected by evaluating the conductivity. The investigated
microemulsion could be divided into w/o and o/w [37,38].
Therefore, electrical conductivity of microemulsion was
determined. The results presented that it has the conductivity
value of 1.155 ± 0.035 mS/cm and identified as o/w system
(Table 1).
Figure 3(a) and (b) show that rising the temperature
induced an increase in the electrical conductivity of M and
MA up to PIT. As it can be seen, first an increase in
conductivity of the microemulsions with temperature was
observed; however; after reaching PIT, abrupt decrease were
determined (Table 1). The results showed that electrical
conductivity and PIT slightly decreased in MA. Similarly,
Figure 3. (a) Change of conductivity of microemulsion with various temperatures and (b) change of conductivity of MA with various temperatures.
Table 1. Characterization of microemulsions in with or without ofaprotinin at 25 ± 2 �C and values are means of three experiments ± SD.
Parameters M MA
pH 4.907 ± 0.015 5.5 ± 0.01Viscosity (cP) 14.806 ± 0.032 17.00 ± 0.017Droplet size (nm) 67.300 ± 0.387 64.55 ± 3.217PDI 0.290 ± 0.005 0.252 ± 0.012Electrical conductivity (mS) 1.155 ± 0.021 0.43 ± 0.02Refractive index 1.447 ± 0.014 1.394 ± 0.005PIT (�C) 50.666 ± 0.577 46.5 ± 0.707
6 H. Y. Karasulu et al. J Drug Target, Early Online: 1–13
Jour
nal o
f D
rug
Tar
getin
g D
ownl
oade
d fr
om in
form
ahea
lthca
re.c
om b
y 78
.167
.183
.188
on
03/0
4/15
For
pers
onal
use
onl
y.

Warisnoicharoen et al. [39] showed that the presence of
electrolytes as aprotinin could lower PIT, which shows the
importance of defining microemulsion phase behavior in the
presence of drug.
The water phase of the parenteral microemulsions should
be formulated by the incorporation of ionic or osmotic agents
as emulsified oil exerts no osmotic effect. Therefore, the
osmolality values of water phase (saline) and 0.2 mg/mL
aprotinin in saline were measured. The osmolality of the
water phase was found to be 307.5 ± 10.606 milliosmol/kg.
The water phase of the microemulsion was found iso-osmotic.
Cellular damage does not occur when endothelial cells
contact an iso-osmotic solution [40].
The Lowry method is a sensitive technique to determine
low concentrations of proteins. Most of the techniques use
universally Bovine Serum Albumin (BSA) as a standard
protein, due to its low cost, high purity and ready availability.
The method is sensitive enough for low protein concentrations
(10mg/mL) and is probably the most widely used protein
assay despite its being only a relative method. Aprotinin
content of the microemulsion was determined according to
the method of Lowry et al. using bovine serum albumin
standard [20]. According to the results, aprotinin concentra-
tion in the microemulsion was found to be between 0.2 and
0.205 mg/mL.
Morphology
TEM analysis presented the circular form and uniform droplet
size of microemulsions (Figure 4a and b). This uniformity
reflects the manufacturing procedures and results in droplets
with a narrow range of sizes. TEM image of microemulsion
and MA showed that the diameters were below 100 nm with
narrow scattering in most of the particles. Moreover, the
particle size which was determined by dynamic light scatter-
ing method was definite by TEM. It was also detected that the
droplet size of MA was smaller than that of microemulsion.
It could be announced that the presence of aprotinin in
microemulsion affected the droplet size. The diameters of the
microemulsion particles observed by TEM were in good
agreement with the particle sizes determined as described
in Table 1.
In vivo evaluation
Hemolysis test of formulation
The ability of any nanoproduct to cause hemolysis after
parenteral delivery is one of the most restrictive properties in
all the pharmaceutical applications. Furthermore, surfactants
are known to cause hemolysis of red blood cells [22].
Therefore, the disruption of erythrocytes is a major barrier
for in vivo application. The hemolytic activity has been
recommended as an indicator for toxicity display in vitro and it
is a simple measurement for estimating the membrane damage
caused by formulations with surfactants or solvents. In these
experiments, the complete hemolysis was clearly observed
with distilled water for positive control at 15 min presenting as
the red clear-diaphanous and no erythrocyte survived at the
bottom of the tube. While the erythrocytes precipitated at the
bottom of the tube for negative control with saline and
different concentration of microemulsion or MA, they redis-
persed after shaking within the 3 h observation. This indicates
that increasing the incubation time led to a negligible change
in the membrane damage induced by formulations. The
hemolysis percent was below 1% and altered insignificantly
with the incubation time (p40.05). Considering that micro-
emulsion would be injected intravenously and would be
diluted by blood, it could be assumed that microemulsions
may be relatively safe carriers for aprotinin in the circulation.
Radiolabeling, quality control and stability of 99mTc-aprotinin
The role of gamma scintigraphy techniques is well established
for designing new drugs, determining the biodistribution of
promising pharmaceuticals [41,42]. 99mTc is one of the most
popular radionuclide for gamma scintigraphy studies with its
versatile chemistry, good photon energy (140 keV) and
suitable half-life (6 h) [43,44]. In this study, a modified
formulation was prepared for radiolabeling of aprotinin with99mTc radionuclide. The radiochemical purity of the modified99mTc-aprotinin formulation described here was determined
Figure 4. Transmission electron microphotographs of (a) microemulsion (the scales bar for image represents 200 nm and 160 000�) and (b) aprotinin-loaded microemulsion (MA; the scale bar for image represents 200 nm and 135 000�).
DOI: 10.3109/1061186X.2015.1015537 Aprotinin microemulsion in acute pancreatitis 7
Jour
nal o
f D
rug
Tar
getin
g D
ownl
oade
d fr
om in
form
ahea
lthca
re.c
om b
y 78
.167
.183
.188
on
03/0
4/15
For
pers
onal
use
onl
y.

by Whatman No: 3 papers, albumin-impregnated ITLC-SG
strips in acetone and A/E/W solvent systems.
Aprotinin was radiolabeled with 99mTc previously by
Smyth and Tsopelas and Schaadt et al. [22,45]. Although the
authors used different radiolabeling and quality control
procedures both the formulations were found to have good
labeling yield and stability.
Smyth and Tsopelas [22] prepared aprotinin ready to use
cold kits which contained aprotinin, stannous chloride, tetra
sodium pyrophosphate (PYP), glycine and sodium di-hydro-
gen phosphate. The authors concluded the presence of excess
PYP ions played an important role in stabilizing stannous and
reduced technetium in the alkaline environment of the cold kit
minimizing the formation of insoluble hydroxides. According
to quality control studies, 99mTc-aprotinin labeling yield was
found to be 98.1 ± 0.2% and 97.6 ± 0.5% at 0.4 and 4 h post-
labeling.
In this study, 99mTc-aprotinin was prepared with small
modification on previously described method in the absence
of PYP. According to quality control studies, 99mTc-aprotinin
labeling yield was found slightly poor than Smyth and
Tsopelas’s [22] method for later hours. These results can be
explained by the positive effect of PYP on stability of the
complex.
Researchers improved some quality control methods
previously to assess the impurities in 99mTc-aprotinin using
different stationary and mobile phases such as Whatman
No:1/Methylethylketone (MEK), ITLC-SG/MEK etc
[22,45,46].
In this study, radiochemical purity and stability of the
product were evaluated successfully by chromatographic
studies as described previously [22]. The chromatographic
studies indicated that 99mTc-aprotinin is stable up to 6 h
at room temperature (Figure 5). Radiolabeling yield was
found as 95.430 ± 0.946, 96.160 ± 1.235, 93.853 ± 0.745,
95.150 ± 0.870, 91.617 ± 1.602, 93.913 ± 1.879 and
90.180 ± 2.320% at 0, 1, 2, 3, 4, 5 and 6 h post-labeling,
respectively.
Experimental model of mild and severe acute pancreatitis
Gamma scintigraphy and biodistribution studies. In prelimin-
ary experiments, MA and SA biodistribution were evaluated by
gamma scintigraphy at 5, 15, 30, 60 and 120 min in healthy
rats (data not shown). Effective dosage and timing of
biodistrubution were determined from preliminary studies.
Then, in vivo behavior of 99mTc-aprotinin was assessed in the
different pancreatitis models induced in rats.
Mild pancreatitis. According to the gamma scintigraphy
studies, 99mTc-aprotinin-loaded microemulsion (AC1MA) and
saline (AC2SA) formulations show different in vivo behavior in
the body. Figure 6 shows the gamma scintigrams of mild
acute pancreatitis induced rats 90 min after administration of
AC1MA and AC2SA. As expected, while 99mTc-aprotinin-
loaded saline (AC2SA) has higher uptake in the kidney, 99mTc-
aprotinin-loaded microemulsion (AC1MA) has higher uptake
in the spleen and liver (Table 2). In mild pancreatitis, 99mTc-
aprotinin-loaded microemulsion has slower distribution speed
compared to 99mTc-aprotinin-loaded saline since it reaches
lower radioactivity in tissues at 90 min. Besides, its excretion
by kidneys is less, more stable blood and tissue levels might
be expected and in vivo maintenance time would be longer.
According to the biodistrubution studies for this pancrea-
titis group, 99mTc-aprotinin-loaded microemulsion uptake
Figure 6. Scintigrams of 99mTc-aprotinin-loaded microemulsion andsaline for mild acute pancreatitis, severe acute pancreatitis and air pouchmodels at 90th min (L: Liver, S: Spleen, B: Bladder, K: Kidney).Figure 5. Stability of the 99mTc-aprotinin.
8 H. Y. Karasulu et al. J Drug Target, Early Online: 1–13
Jour
nal o
f D
rug
Tar
getin
g D
ownl
oade
d fr
om in
form
ahea
lthca
re.c
om b
y 78
.167
.183
.188
on
03/0
4/15
For
pers
onal
use
onl
y.

ratios were found 1.201, 6.023 and 0.373 for liver, kidney and
pancreas, respectively. On the other hand, the highest uptake
ratio of 99mTc-aprotinin-loaded saline administered rats was
found in kidneys (53.314). The differences for the uptake
ratios were found to be statistically different (p50.05). In this
group, the uptake of 99mTc-aprotinin-loaded saline (AC2SA) in
spleen, liver and pancreas was much lower.
Severe pancreatitis. Scintigrams and uptake ratios of 99mTc-
aprotinin-loaded microemulsion (BT1MA) and saline (BT2SA)
administered rats with severe acute pancreatitis model are
shown in Figure 6 and Table 2, respectively. Gamma
scintigraphy studies indicate that 99mTc-aprotinin-loaded
saline show two times higher uptake than 99mTc-aprotinin-
loaded microemulsion in kidneys. The radioactivity rates for
both the experimental groups at 90 min were lower in organs
compared to mild pancreatitis model. Taurocholate-induced
pancreatitis model is severe form of pancreatitis and usually
accompanied by circulatory failure and fluid loss. This might
be explanation for slower biodistribution of both the formu-
lations in that model. According to the biodistribution studies
after the i.v. administration of 99mTc-aprotinin-loaded micro-
emulsion; the uptake ratios of 99mTc-aprotinin in liver, kidney
and pancreas were found 1.493, 0.601 and 1.436 at 90th min,
respectively. On the other hand, the highest uptake ratio of99mTc-aprotinin-loaded saline administered rats was found to
be in kidneys (26.600). The differences for the uptake ratios
were found to be statistically different (p50.05). For
achievement of passive targeting, colloidal drug delivery
systems (such as micelles, microemulsions, nanoemulsions,
etc.) have to circulate in blood for longer periods and their
size determines their biological fate. Polymeric micelles
smaller than 5 nm and 5–10 nm were easily eliminated
through the renal glomeruli, whereas the larger micelles
with the size range of 50–100 nm were removed by the liver
and spleen [47]. As it was expected, the results of the
scintigraphy and biodistribution studies showed that, i.v.
administration of 99mTc-aprotinin-loaded microemulsion,
with droplet size of 64.550 ± 3.217 nm, has high uptake in
liver and spleen while 99mTc-aprotinin-loaded saline distrib-
uted mostly in kidneys and bladder.
Natural protease inhibitors are present in the circulation
and play an important role in limiting tissue damage [48].
However, they remain insufficient when the protease activity
increases as in acute pancreatitis. Decreased levels of
circulating protease inhibitors and the delayed clearance of
serum protease-inhibitor complexes by the mononuclear
phagocyte system (MPS) have been associated with the
more severe forms of pancreatitis [48,49]. The increased
uptake of 99mTc-aprotinin in liver and spleen might show
increased clearance of aprotinin and trypsin complexes by
MPS. On the other hand, decreased clearance of MA by
kidney guaranties high levels of aprotinin in the pancreas as
well as circulation and decreased aprotinin nephrotoxicity.
Therefore, new developed microemulsion of aprotinin might
supply a protease inhibitor activity with high bioavailability.
In conclusion, the results of scintigraphic and biodistribu-
tion studies showed that, in vivo behavior of 99mTc-aprotinin-
loaded microemulsion and saline are different. While99mTc-aprotinin-loaded saline has higher uptake in the
kidney, 99mTc-aprotinin-loaded microemulsion has higher
uptake in spleen and liver.
The assessment of the efficacy of treatment of mild and
severe acute pancreatitis
To confirm the successful induction of pancreatitis, pancre-
atic histopathology scores and serum amylase levels and
tissue MPO levels were measured in all the experimental
models (Tables 3 and 4). Compared with the untreated group,
serum amylase activity, pancreatic MPO activity and
histopathologic scores in the mild and severe acute pancrea-
titis significantly increased after the induction of pancreatitis
in groups AC3S and BT3S (Tables 3 and 4).
Table 2. 99mTc-Aprotinin uptake ratio in related organs for mild acute pancreatitis, severe acute pancreatitis and air pouch models at 90th min.
Formulations Heart Lung Spleen Liver Kidney
AC1MA 11.663 ± 2.5 8.356 ± 1.8 14.223 ± 4.5 13.155 ± 5.2 6.721 ± 0.32AC2SA 22.307 ± 16.9 10.808 ± 11.9 19.784 ± 7.9 30.268 ± 16.4 47.052 ± 0BT1MA 3.639 ± 2.7 3.792 ± 3.5 6.652 ± 5.4 5.943 ± 5.0 6.812 ± 3.2BT2SA 5.086 ± 2.1 4.191 ± 2.1 6.198 ± 2.4 6.123 ± 0 12.052 ± 3.4C1MA 28.942 ± 8.928 9.653 ± 8.874 44.392 ± 6.888 41.118 ± 5.191 23.963 ± 17.027C2SA 10.780 ± 4.682 6.727 ± 2.150 8.504 ± 2.261 15.176 ± 5.499 47.379 ± 10.365
Table 3. The results of the mild acute pancreatitis treatment efficacy ofaprotinin in rat groups (n¼ 7).
Groups Amylase (U/L) MPO (ng/dL)Histopathological score
(median, range)
AC1MA 3542.1 ± 699.8 973.6 ± 876.9 4 (2–6)AC2SA 4037 ± 2017.8 1094.3 ± 840.5 4 (0–6)AC3S 8313.8 ± 3800.1 1256.5 ± 666.9 6 (3–7)AS4MA 1620.9 ± 325.1 70.3 ± 20.4 0 (0–3)AS5SA 1447.4 ± 285.8 44.1 ± 24.9 0 (0–0)AS6S 1613.1 ± 355.6 52.2 ± 63.9 0 (0–0)
Table 4. The results of the severe acute pancreatitis treatment efficacy ofaprotinin in rat groups (n¼ 7).
Groups Amylase (U/L) MPO (ng/dL)Histopathological score
(median, range)
BT1MA 7063.6 ± 4860.4 1000.3 ± 755.5 3 (0–15)BT2SA 8214.4 ± 4712 1373.7 ± 842.1 8 (2–9)BT3S 9221.0 ± 4909.2 1494.1 ± 980.8 6 (3–17)BS4MA 2758.6 ± 452.7 406.8 ± 755 0 (0–1)BS5SA 2845.3 ± 457.4 240.4 ± 291 1 (0–6)BS6S 3707 ± 1895.3 306.4 ± 260.5 2 (0–2)
DOI: 10.3109/1061186X.2015.1015537 Aprotinin microemulsion in acute pancreatitis 9
Jour
nal o
f D
rug
Tar
getin
g D
ownl
oade
d fr
om in
form
ahea
lthca
re.c
om b
y 78
.167
.183
.188
on
03/0
4/15
For
pers
onal
use
onl
y.

Mild pancreatitis. In cerulein-induced mild pancreatitis
model, MA significantly decreased serum amylase levels.
Serum amylase activity was 3542.1 ± 699.8 U/L in AC1MA
group whereas amylase activity in AC3S untreated group
was 8313.8 ± 3800.1 U/L (p50.05; Table 4). Similarly, SA
decreased serum amylase activity in cerulein-induced acute
pancreatitis to less extend 4037 ± 2017.7 (p50.05). MA
suppressed pancreatic MPO activity from 1256.5 ± 666.9 to
973.6 ± 876.9 ng/mL, however the differences between
AC1MA and AC2SA pancreatic MPO activity were not
significant.
Severe pancreatitis. In taurocholate-induced severe acute
pancreatitis model, serum amylase levels of BT1MA, BT2SA
and BT3S were significantly higher compared to control
groups (p50.05; Table 4). Both MA and SA treatment
decreased serum amylase activity but the difference was not
significant in that model of pancreatitis (p40.05). In group
BT1MA, formulation suppressed the MPO in severe form
of the pancreatitis compared to BT3 but the differences were
not significant.
In addition to pancreatic proteases, activated leukocytes
play an important role in the pathogenesis of acute pancrea-
titis [50]. MPO activity was evaluated in both cerulein and
bile pancreatic-duct obstruction with sodium taurocholate-
induced models. MPO activity, which is accepted as an
indicator of neutrophil infiltration, was decreased in the
pancreatic tissue of the pancreatitis group treated with MA
than that of the non-treated groups (AC3S, BT3S; Tables 3
and 4).
According to the obtained results, aprotinin was able to
ameliorate inflammation of pancreatitis in both models.
Air pouch models
Gamma scintigraphy and biodistribution studies of air pouch
formation. The results of biodistribution studies in air pouch
inflammation model showed that i.v. administration of 99mTc-
aprotinin-loaded microemulsion had high uptake in liver and
spleen while 99mTc-aprotinin-loaded saline distributed mostly
in kidneys and bladder. The scintigrams of rats 90 min after
application of 99mTc-aprotinin-loaded microemulsion and
saline are shown in Figure 6. According to the gamma
scintigraphy studies, 99mTc-aprotinin uptake ratios are shown
in Table 2.
After the i.v. administration of 99mTc-aprotinin-loaded
microemulsion in air pouch formed rats, the uptake results in
liver, kidney, pancreas and exudate were 1.901, 11.639, 0.472
and 0.027 ± 0.021, respectively. On the other hand, the uptake
results in liver, kidney, pancreas and exudate in air pouch
formed rats administered 99mTc-aprotinin-loaded saline
were 0.818, 75.847, 0.335 and 0.007 ± 0.006, respectively at
90 min.
Previously, acute carrageenan-induced air pouch inflam-
mation was successfully used as sham inflammation model in
rats [25]. In this study, air pouch model was created to
investigate whether 99mTc-aprotinin-loaded microemulsion
was uptaken by sham inflammation or pancreas. The results
showed that the uptake of 99mTc-aprotinin-loaded microemul-
sion in an exudate was five times lower in this sham
inflammation group than pancreas. Moreover, the uptake in
pancreas was higher in 99mTc-aprotinin-loaded microemul-
sion than 99mTc-aprotinin-loaded saline in rats with air pouch
model. Therefore, it can be concluded that aprotinin-loaded
microemulsions may be suggested as promising formulations
for targeting to pancreas but not the inflammation. Here,
carrageen-induced inflammation was served as inflammatory
focus poor in protease activity compared to pancreatic
inflammation rich in protease activity. This new MA has
affinity to tissues rich in proteases.
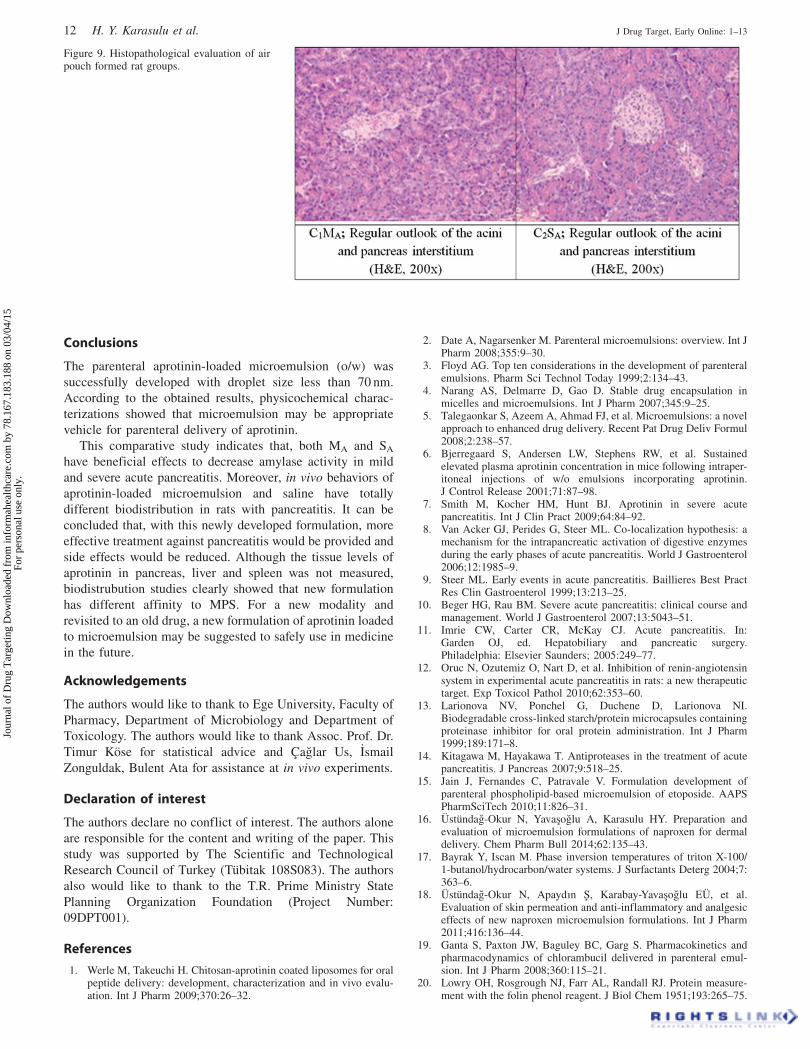
Histopathological evaluation of pancreas
Histological examination of pancreas sections from mild and
severe acute pancreatitis group revealed tissue damage
characterized by edema, fat necrosis, hemorrhage, neutro-
philic infiltration and pancreatic tissue necrosis. The results of
histopathological evaluation of the pancreases were shown in
Figures 7–9.
In cerulein-induced mild acute pancreatitis model, histo-
pathological scores were not significant different between
AC1MA, AC2SA and AC3S groups. Cerulein-induced model of
acute pancreatitis represents mild form of acute pancreatitis
and usually ameliorates spontaneously by supportive treat-
ment [50]. The histopathological scores were similar between
MA and SA treated or untreated cerulein-induced pancreatitis
groups. This form of mild pancreatitis may not need treatment
with further drugs even aprotinin although both forms of
aprotinin has treatment effect.
In group BT1MA, formulation suppressed the histopatho-
logical median score in severe form of the pancreatitis
compared to BT3S but the differences were not significant. In
previous trials, intravenously applied commercial formulation
of aprotinin did not show a significant effect on acute
pancreatitis. However, higher i.v. dosages reduced mortality
related to acute pancreatitis in elderly [51,52]. In mild
pancreatitis groups, no mortality was observed. On the other
hand, in taurocholate-induced severe pancreatitis mortality
rates of BT1MA, BT2SA and BT3S were 6, 12 and 19%,
respectively.
The hypothesis that there is local microcirculatory failure
in pancreatitis led to the examination of intra-arterial
administration to increase local tissue levels by targeted
administration intra-arterial infusion of aprotinin decreased
serum amylase levels and improved clinical symptoms.
Relevant to that aprotinin-loaded microemulsion decreased
serum amylase levels and improved mortality in groups. The
histopathological damage was also improved to some extent
[53]. Moreover, MA has favorable bioavailability as demon-
strated by biodistrubution studies.
In addition, aprotinin-loaded microemulsion (MA) was
applied to control groups (AS5SA and BS4MA) and the
median histopathological score was determined 0 and 1,
respectively. It is known that some drugs or formulations are
listed in the etiological factors of acute pancreatitis [54] For
this reason, the effects of MA and SA in rats without
pancreatitis were determined and compared. The results
showed that the aprotinin-loaded microemulsion does not
lead any pancreatic damage itself and it may be considered
as safe.
10 H. Y. Karasulu et al. J Drug Target, Early Online: 1–13
Jour
nal o
f D
rug
Tar
getin
g D
ownl
oade
d fr
om in
form
ahea
lthca
re.c
om b
y 78
.167
.183
.188
on
03/0
4/15
For
pers
onal
use
onl
y.

Figure 7. Histopathological evaluation of rat groups for mild acute pancreatitis model.
Figure 8. Histopathological evaluation of rat groups for severe acute pancreatitis model.
DOI: 10.3109/1061186X.2015.1015537 Aprotinin microemulsion in acute pancreatitis 11
Jour
nal o
f D
rug
Tar
getin
g D
ownl
oade
d fr
om in
form
ahea
lthca
re.c
om b
y 78
.167
.183
.188
on
03/0
4/15
For
pers
onal
use
onl
y.
Conclusions
The parenteral aprotinin-loaded microemulsion (o/w) was
successfully developed with droplet size less than 70 nm.
According to the obtained results, physicochemical charac-
terizations showed that microemulsion may be appropriate
vehicle for parenteral delivery of aprotinin.
This comparative study indicates that, both MA and SA
have beneficial effects to decrease amylase activity in mild
and severe acute pancreatitis. Moreover, in vivo behaviors of
aprotinin-loaded microemulsion and saline have totally
different biodistribution in rats with pancreatitis. It can be
concluded that, with this newly developed formulation, more
effective treatment against pancreatitis would be provided and
side effects would be reduced. Although the tissue levels of
aprotinin in pancreas, liver and spleen was not measured,
biodistrubution studies clearly showed that new formulation
has different affinity to MPS. For a new modality and
revisited to an old drug, a new formulation of aprotinin loaded
to microemulsion may be suggested to safely use in medicine
in the future.
Acknowledgements
The authors would like to thank to Ege University, Faculty of
Pharmacy, Department of Microbiology and Department of
Toxicology. The authors would like to thank Assoc. Prof. Dr.
Timur Kose for statistical advice and Caglar Us, _Ismail
Zonguldak, Bulent Ata for assistance at in vivo experiments.
Declaration of interest
The authors declare no conflict of interest. The authors alone
are responsible for the content and writing of the paper. This
study was supported by The Scientific and Technological
Research Council of Turkey (Tubitak 108S083). The authors
also would like to thank to the T.R. Prime Ministry State
Planning Organization Foundation (Project Number:
09DPT001).
References
1. Werle M, Takeuchi H. Chitosan-aprotinin coated liposomes for oralpeptide delivery: development, characterization and in vivo evalu-ation. Int J Pharm 2009;370:26–32.
2. Date A, Nagarsenker M. Parenteral microemulsions: overview. Int JPharm 2008;355:9–30.
3. Floyd AG. Top ten considerations in the development of parenteralemulsions. Pharm Sci Technol Today 1999;2:134–43.
4. Narang AS, Delmarre D, Gao D. Stable drug encapsulation inmicelles and microemulsions. Int J Pharm 2007;345:9–25.
5. Talegaonkar S, Azeem A, Ahmad FJ, et al. Microemulsions: a novelapproach to enhanced drug delivery. Recent Pat Drug Deliv Formul2008;2:238–57.
6. Bjerregaard S, Andersen LW, Stephens RW, et al. Sustainedelevated plasma aprotinin concentration in mice following intraper-itoneal injections of w/o emulsions incorporating aprotinin.J Control Release 2001;71:87–98.
7. Smith M, Kocher HM, Hunt BJ. Aprotinin in severe acutepancreatitis. Int J Clin Pract 2009;64:84–92.
8. Van Acker GJ, Perides G, Steer ML. Co-localization hypothesis: amechanism for the intrapancreatic activation of digestive enzymesduring the early phases of acute pancreatitis. World J Gastroenterol2006;12:1985–9.
9. Steer ML. Early events in acute pancreatitis. Baillieres Best PractRes Clin Gastroenterol 1999;13:213–25.
10. Beger HG, Rau BM. Severe acute pancreatitis: clinical course andmanagement. World J Gastroenterol 2007;13:5043–51.
11. Imrie CW, Carter CR, McKay CJ. Acute pancreatitis. In:Garden OJ, ed. Hepatobiliary and pancreatic surgery.Philadelphia: Elsevier Saunders; 2005:249–77.
12. Oruc N, Ozutemiz O, Nart D, et al. Inhibition of renin-angiotensinsystem in experimental acute pancreatitis in rats: a new therapeutictarget. Exp Toxicol Pathol 2010;62:353–60.
13. Larionova NV, Ponchel G, Duchene D, Larionova NI.Biodegradable cross-linked starch/protein microcapsules containingproteinase inhibitor for oral protein administration. Int J Pharm1999;189:171–8.
14. Kitagawa M, Hayakawa T. Antiproteases in the treatment of acutepancreatitis. J Pancreas 2007;9:518–25.
15. Jain J, Fernandes C, Patravale V. Formulation development ofparenteral phospholipid-based microemulsion of etoposide. AAPSPharmSciTech 2010;11:826–31.
16. Ustundag-Okur N, Yavasoglu A, Karasulu HY. Preparation andevaluation of microemulsion formulations of naproxen for dermaldelivery. Chem Pharm Bull 2014;62:135–43.
17. Bayrak Y, Iscan M. Phase inversion temperatures of triton X-100/1-butanol/hydrocarbon/water systems. J Surfactants Deterg 2004;7:363–6.
18. Ustundag-Okur N, Apaydın S, Karabay-Yavasoglu EU, et al.Evaluation of skin permeation and anti-inflammatory and analgesiceffects of new naproxen microemulsion formulations. Int J Pharm2011;416:136–44.
19. Ganta S, Paxton JW, Baguley BC, Garg S. Pharmacokinetics andpharmacodynamics of chlorambucil delivered in parenteral emul-sion. Int J Pharm 2008;360:115–21.
20. Lowry OH, Rosgrough NJ, Farr AL, Randall RJ. Protein measure-ment with the folin phenol reagent. J Biol Chem 1951;193:265–75.
Figure 9. Histopathological evaluation of airpouch formed rat groups.
12 H. Y. Karasulu et al. J Drug Target, Early Online: 1–13
Jour
nal o
f D
rug
Tar
getin
g D
ownl
oade
d fr
om in
form
ahea
lthca
re.c
om b
y 78
.167
.183
.188
on
03/0
4/15
For
pers
onal
use
onl
y.

21. Kang BK, Chon SK, Kim SH, et al. Controlled release ofpaclitaxel from microemulsion containing PLGA and evaluationof anti-tumor activity in vitro and in vivo. Int J Pharm 2004;286:147–56.
22. Smyth DR, Tsopelas C. An improved 99mTc- aprotinin kitformulation: quality control analysis of radiotracer stability andcold kit shelf life. Nucl Med Biol 2005;32:885–9.
23. Nornoo AO, Osborne DW, Chow DSL. Cremophor-free intrave-neous microemulsions for paclitaxel I: formulation, cytotoxicityand hemolysis. Int J Pharm 2008;349:108–16.
24. Garcia-Szabo RR, Malik AB. Pancreatitis-induced increase in lungvascular permeability: protective effect of Trasylol. Am Rev RespirDis 1984;129:580–3.
25. Buluc M, Gurdal H, Melli M. Effect of misoprostol and indometh-acin on cyclooxygenase induction and eicosanoid production incarrageenan-induced air pouch inflammation in rats. ProstaglandinsOther Lipid Mediat 2002;70:227–39.
26. Roelofs JJ, Rouschop KM, Leemans JC, et al. Tissue-typeplasminogen activator modulates inflammatory responses andrenal function in ischemia reperfusion injury. J Am Soc Nephrol2006;17:131–40.
27. Schoenberg MH, Buchler M, Gaspar M, et al. Oxygen free radicalsin acute pancreatitis of the rat. Gut 1990;31:1138–43.
28. Spormann H, Sokolowski A, Letko G. Effect temporary ischemiaupon development and histological patterns of acute pancreatitis inthe rat. Pathol Res Pract 1989;184:507–13.
29. Jha SK, Dey S, Karki R. Microemulsions – potential carrierfor improved drug delivery. Asian J Biomed Pharm Sci 2011;1:5–9.
30. Yao J, Wang D, Zhang X, et al. Development of docetaxel self-microemulsifying drug delivery system (SMEDDS) for parenteraldelivery: preparation, characterization and in vivo evaluation. AsianJ Pharm Sci 2012;7:18–27.
31. Ren X, Svirskis D, Alany RG, et al. In-situ phase transition frommicroemulsion to liquid crystal with the potential of prolongedparenteral drug delivery. Int J Pharm 2012;431:130–7.
32. Strickley R. Solubilizing excipients in oral and injectable formu-lation. Pharm Res 2004;21:201–30.
33. Junping W, Takayama K, Nagai T, Maitani Y. Pharmacokineticsand antitumor effects of vincristine carried by microemulsionscomposed of PEG-lipid, oleic acid, vitamin E and cholesterol. Int JPharm 2003;251:13–21.
34. Cui J, Yu B, Zhao Y, et al. Enhancement of oral absorption ofcurcumin by self-microemulsifying drug delivery systems. Int JPharm 2009;371:148–55.
35. Washington C, Davis SS. The production of parenteral feedingemulsions by microfluidizer. Int J Pharm 1988;44:169–76.
36. Djordjevic L, Primorac M, Stupar M, Krajisnik D. Characterizationof caprylocaproyl macrogolglycerides based microemulsion drugdelivery vehicles for an amphiphilic drug. Int J Pharm 2004;271:11–19.
37. Peltola S, Saarinen-Savolainen P, Kiesvaara J, et al.Microemulsions for topical delivery of estradiol. Int J Pharm2003;254:99–107.
38. Yue Y, San-Ming L, Li-Min Y, et al. Physicochemical propertiesand evaluation of microemulsion systems for transdermal deliveryof meloxicam. Chem Res Chinese U 2007;23:81–6.
39. Warisnoicharoen W, Lansley AB, Lawrence MJ. Nonionic oil-in-water microemulsions: the effect of oil type on phase behavior. Int JPharm 2000;198:7–27.
40. Stranz M, Kastango ES. A review of pH and osmolarity. Int JPharm Compound 2002;6:216–20.
41. Bhatnagara A, Hustinxa R, Alav A. Nuclear imaging methods fornon-invasive drug monitoring. Adv Drug Deliv Rev 2000;41:41–54.
42. Teran M, Savio E, Paolino A, Frier M. Usage of radiopharmaceu-ticals in the development of pharmaceutical drug delivery systems:validation of (99mTc)DTPA and (99mTc) ECD. Eur J PharmBiopharm 2004;57:347–52.
43. Burke MD, Staton JS, Viskers AW, et al. A novel method toradiolabel gastric retentive formulations for gamma scintigraphyassessment. Pharm Res 2007;24:695–704.
44. Wilding IR, Coupe AJ, Davis SS. The role of gamma scintigraphyin oral drug delivery. Adv Drug Deliv Rev 1991;7:87–117.
45. Schaadt BK, Hendel HW, Gimsing P, et al. 99mTc-aprotininscintigraphy in amliodosis. J Nucl Med 2003;44:177–83.
46. Rustom R, Grime S, Maltby P, et al. A new method to measurerenal tubular degradation of small filtered proteins in man usingradiolabelled aprotinin (Trasylol). Clin Sci 1992;83:289–94.
47. Kedar U, Phutane P, Shidhaye S, Kadam V. Advances inpolymeric micelles for drug delivery and tumor targeting.Nanomed–Nanotechnol 2010;6:714–29.
48. Chen CC, Wang SS, Lee FY. Action of antiproteases on theinflammatory response in acute pancreatitis. J Pancreas 2007;8:488–94.
49. Lasson A, Ohlsson K. Protease inhibitors in acute human pancrea-titis. Correlation between biochemical changes and clinical course.Scand J Gastroenterol 1984;19:779–86.
50. Heinrich S, Schafer M, Rousson V, Clavien PA. Evidence-basedtreatment of acute pancreatitis: a look at established paradigms.Ann Surg 2006;243:154–68.
51. Trapnell JE, Rigby CC, Talbot CH, Duncan EHL. A controlled trialof Trasylol in the treatment of acute pancreatitis. Br J Surg 1974;61:177–82.
52. Trapnell JE, Talbot CH, Capper WM. Trasylol in acute pancreatitis.Am J Dig Dis 1967;12:409–12.
53. Soleto Saez E, Sanmartin P, Ruiperez S, et al. Treatment of acutepancreatitis by intra-arterial injection of Trasylol. Int Surg 1971;55:299–306.
54. Urbanek K, Vinklerova I, Krystynık O, Prochazka V. Acutepancreatitis induced by drugs. In: Rodrigo L, ed. Acute pancreatitis.Rijeka, Croatia: In Tech; 2012:17–34.
DOI: 10.3109/1061186X.2015.1015537 Aprotinin microemulsion in acute pancreatitis 13
Jour
nal o
f D
rug
Tar
getin
g D
ownl
oade
d fr
om in
form
ahea
lthca
re.c
om b
y 78
.167
.183
.188
on
03/0
4/15
For
pers
onal
use
onl
y.
Top Related
Copyright © 2022 FDOKUMEN

