


Bahasa
Halaman
Hukum


“This presentation contains general information regarding the business and strategies of BK Brasil Operações e Assessoria a Restaurantes
S.A. and its controlled companies (“BK”). The information contained herein is in summarized form and does not purport to be complete. Due
to this fact, one cannot rely in its completeness or accuracy and no representations or warranties, implicit or explicit, is made concerning as
to the completeness or accuracy of the information contained herein.
This presentation contains forward-looking statements, which involves risks and uncertainties and should not be construed as a guarantee
of future performance. Investors should be aware that such forward-looking statements may be affected by current or future facts or
expectations regarding our industry, our market share, our reputation, business, financial situation and perspectives. Although we believe
that the forward-looking statements and estimates are based in reasonable assumptions, they are subject to several risks and uncertainties
and were made only based on information currently available to us, and, therefore, we cannot guarantee future results.
The above mentioned considerations are not exhaustive and other risks and uncertainties may cause results that may be substantially
different from those contained in the forward-looking statements. Due to the abovementioned uncertainties, no investment decision
should be made relying only on these forward-looking statements. This presentation should not be construed as recommendation to
potential investors.”


162
639
801
661 950
1,393 1,784
2,348
61 86 134 211 288
9.2% 9.1% 9.6% 11.8% 12.3%
2014 2015 2016 2017 2018
NET REVENUES ADJUSTED EBITDA ADJUSTED EBITDA MARGIN
• Burger King opened its first restaurant in Brazil in 2004, and currently has more than 793 restaurants in the country(1) (3)
• 20-year Master franchisee with exclusive rights to develop and manage Burger King and Popeyes brands in Brazil
• Significant market share gains since 2011
• 2nd player in burger and 3rd largest QSR in number of restaurants
• Largest restaurant operator in the country
• Market leader in brand preference on target segment (2)
• Clear growth and expansion opportunities
• Elected best Burger King LatAmfranchisee in 2017
• First Popeyes openings in Brazil Owned restaurants Franchisees
RESTAURANTS (1) (3)
OVERVIEW
FINANCIAL HIGHLIGHTS
GEOGRAPHIC FOOTPRINT (1) (3)
SOURCE: Ipsos Brasil/ BK Brasil / Note: 1. As of December 20182-4º Quarter of 2018: Burger King has achieved 37% of consumers preference for Fast Food brand within 18 to 34 years old target with significant difference versus 27% of the most important competitor in a online trademark monitoring study conducted by Ipsos at Burger King's request. The study was conducted in October, November and December of 2018 in the metropolitan areas of: SP, RJ, BH, CTB, POA, SAL and BSB, with 815 consumers of fast food in the last 2 months. The results consider 95% of confidence level, and 495 cases in the 18-34 y.o. target. / 3. Does not include dessert centers / 4. Excludes pre-operating expenses, expenses related to M&A, impairment and SOP expenses. / 5. Includes 8 Popeyes restaurants opened in 4Q18
BKBRASIL
SHAREHOLDING STRUCTUREOWNED RESTAURANTS(3)
71
2872
2542
447
64
12
626
4
(5)
(4)
(5)
7.8% 7.5% 4.9% 69.9%9.9%
Others

12 113 190 293419 480 526
639²
127110
123128
112121
171162
139223
313421
531601
697801
2011 2012 2013 2014 2015 2016 2017 2018
BUILDING FOUNDATIONS (2011 – 2013) GAINING SCALE (2014 – 2016) CONTINUOUS IMPROVEMENT (2017 onward)
• Getting the right people on-board
• Net opening of 149 owned restaurants
• Acquisition of 41 restaurants (1 franchisee)
• SAP implementation
• First debenture issuance – R$150 mm
• Net opening of 240 owned restaurants
• Acquisition of 50 restaurants (4 franchisees)
• Expansion to new regions
• Sub-franchisee project
• Enhanced focus on operational efficiency
• Two CRA(1) issuances totaling R$300 mm
• IPO at B3 (Novo Mercado), with a capital increase of R$0.8 billion
• Acquisition of 1 franchisee with 51 restaurants and 20 dessert centers
• New POS platform implemented
• Roll-out of new platforms: mobile app, delivery, self-order kiosks
• Increasing focus on free standing and dessert center openings
• Exclusive right to develop, franchise and operate POPEYES® restaurants in Brazil for 20 years.
Owned restaurants Franchisees
NOTE: 1. CRA is a registered and freely traded debt security / 2. Includes 8 Popeyes restaurants opened in 4Q185

THE RELATIONSHIP WITH RBI/BK CORPORATION IS GUIDED BY THE MASTER FRANCHISEE AND DEVELOPMENT AGREEMENT (“MFDA”)
SUMMARY OF MFDA ECONOMICS KEY MFDA ASPECTS
• Service fee on net sales
BK CORPORATION
BK BRASILLEGACY
FRANCHISEES(Pre 2011)¹
SUB-FRANCHISEES
(Post 2016)
• Royalties on net sales
• Franchise fee per opening
• 20+20-year agreement post-opening (restaurant level)
• Royalties on net sales
• Franchise fee per opening
• Royalties on net sales
• Franchise fee per opening
• Royalties on net sales
• Franchise fee per opening
BKB IS FULLY COMPLIANT WITH THE MFDA
RIGHTS
• A 20-year MFDA agreement with BKC: signed in 2011 and may be extended for another 20 years
• Exclusive right to develop, open and operate Burger King restaurants in Brazil
• Right to manage the advertising fund in Brazil
• Right of establishing required and optional menu items, proving that all Core Menu items are offered at the restaurants and all products / suppliers are approved by BKC
• BKB can operate other brands in Brazil that do not offer hamburger or sandwich as main component of its gross sales
• Target of minimum number of restaurants to build and operate
OBLIGATIONS
SOURCE: BK BrasilNote: 1. Restaurants owned by franchisees that have an agreement with Burger King Corporation pre-2011
6

7

POSITIVE DEMOGRAPHICS AND FAVORABLE
SECTOR DYNAMICS
STRONG BRAND WITH UNIQUE ATTRIBUTES
UNIQUE MANAGEMENT
MODEL AND EXCELLENCE IN
EXECUTION
SIGNIFICANT AVENUES FOR GROWTH AND
EXPANSION IN BRAZIL
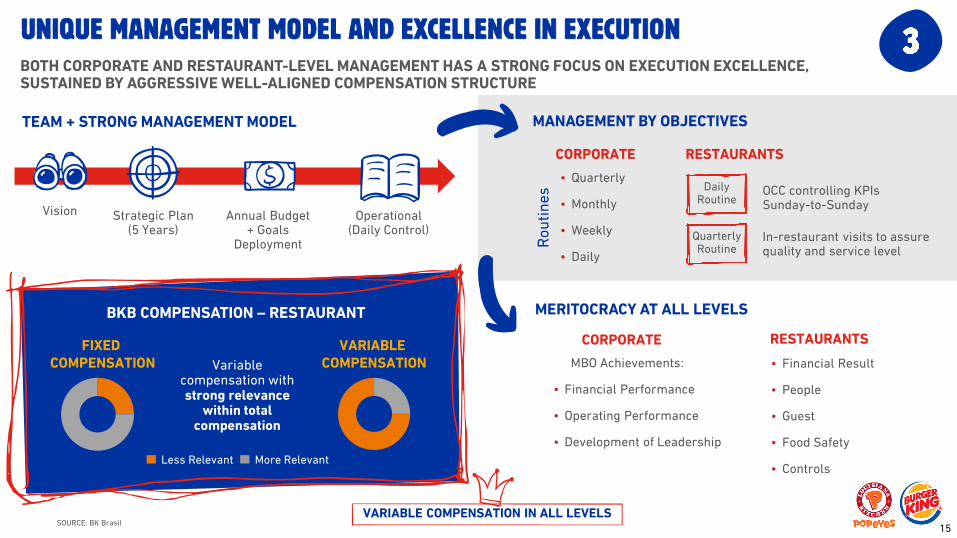
EXPERIENCED MANAGEMENT
TEAM
DEVELOPMENT OF POPEYES IN
BRAZIL
8

DEMOGRAPHIC FACTORSSOCIO-ECONOMIC FACTORS
• ~50% of Brazilians fall within Burger King’s target market (A / B / C1) (1)
• Since 2005, 50 million households entered Burger King’s target market
• Food has become an entertainment and leisure destination
• Increase of female participation in the workforce
• 85% of the Brazilian population lives in urban areas (179 million inhabitants)
• 37 million people live in the country’s ten largest cities
• The hectic urban lifestyle requires city-dwellers to spend more time away from home
• Increasing number of single households should boost out-of- home food expenditure in Brazil
INCREASING NUMBER OF SINGLE HOUSEHOLDS On par with the USA as of 1965 and with
Chile as of 2007
SOURCES: Euromonitor, IBGE, PNAD / Note: 1. Average household income per social class – A: R$20,888; B1: R$9,254; B2: R$4,852; C1: R$2,705; C2: R$1,625; D-E: R$768
Percentage of single households (%)
9
9.1% 9.1% 11.1% 13.1% 15.0%
9.6% 11.0% 14.9% 19.8% 24.3%
25.2%27.4% 28.0% 27.6% 27.8%
1997 2001 2007 2012 2017

11.9%10.1% 9.9%
8.3% 8.1%
Chickenfast food
Burger Fast Food FullService
Total FoodService
R$86bnR$419bn
FOOD SERVICE MARKET SHARE FAST FOOD MARKET SHARE FOOD SERVICE SEGMENT CAGR (2011-17)
BURGER IS ONE OF THE FASTEST-GROWING SEGMENTS IN THE BRAZILIAN FAST FOOD SECTOR
Number of Restaurants in Brazil (2018)
9%91%
Independent Fast Food Chained Fast Food
Chained fast food
represents 63% in the US
BURGER KING IS THE 3RD LARGEST FAST FOOD COMPANY IN BRAZIL, WITH FIRST OPENING IN 2004BRAZILIAN FAST FOOD OUTLETS BY TYPE
THE BRAZILIAN FAST FOOD MARKET IS LARGELY FRAGMENTED AND DOMINATED BY INDEPENDENT PLAYERS
SOURCES: Euromonitor and Geofusion and companies (for number of restaurants in Brazil)
21%
39%
28%5%
7%
Fast food Bars / CoffeesFull-service Self serviceOthers
Burger King Rank in Brazil Fast Food
2013 6th
2017 3rd
10
2,159
968793
559393 351 312
218 15657 8
1992 1979 2004 1952 1981 1999 1988 1993 1989 1975 2018
1%
12%
35%
52%
Chicken fast food Burger
Bakery Others

INDULGENT TASTY FLAME-GRILLEDHAVE IT
YOUR WAYMADE-TO-ORDER FREE
REFILL
AUTHENTIC EXPERIENCE
11

FAST FOOD
C+37%AB
63%
C+39%AB
61%
35 to 4423%
45+18%
15 to 34 59%
35 to 4424%
45+23%
15 to 3454%
Male49%
Female51%
Male52%
Female48%
More AB Social Class¹
Younger(15-34 years)
Democratic
SOURCES: GS&NPD | CREST® Brasil (2018)Note: 1.Average household income per social class – A: R$20,888; B1: R$9,254; B2: R$4,852; C1: R$2,705; C2: R$1,625; D-E: R$768
12

95
95
84
52
33
POSITIVE EVOLUTION OF BRAND PYRAMID – INCREASINGLY POSITIVE AWARENESS LEVEL, WITH ROOM TO INCREASE FREQUENCY
BRAND PYRAMID COMPARISON (%)
Preferred
Trial
ConsidersBra
nd
Aw
are
ne
ss
Awareness
Last Month
2015
91
88
71
31
17
4Q16
92
88
75
35
22
4Q17
95
89
83
46
29+29% +32% +14%
SOURCES: SOURCES: Online trademark monitoring study conducted monthly by Ipsos at Burger King's request, with a sample base of 840 cases, calculated in December 2015, Q4’16, Q4’17 and Q4’18, respondents profile: Men / Women, 18-55 y.o., in the metropolitan areas of São Paulo, Rio de Janeiro, Belo Horizonte, Curitiba, Porto Alegre, Brasília and Salvador with a confidence level of 95%.
13
4Q18

SOURCE: BK Brasil
GENERATE TRAFFIC AND TASTING OF NEW PRODUCTS
REINFORCE FUNCTIONAL PRODUCTS ATTRIBUTES
INCREASE EMOTIONAL ENGAGEMENT WITH THE BRAND THROUGH UNIQUE TERRITORIES
14
Vision
BOTH CORPORATE AND RESTAURANT-LEVEL MANAGEMENT HAS A STRONG FOCUS ON EXECUTION EXCELLENCE, SUSTAINED BY AGGRESSIVE WELL-ALIGNED COMPENSATION STRUCTURE
MBO Achievements:
• Financial Performance
• Operating Performance
• Development of Leadership
• Financial Result
• People
• Guest
• Food Safety
• Controls
CORPORATE RESTAURANTS
VARIABLE COMPENSATION IN ALL LEVELS
Less Relevant More Relevant
Variable compensation with strong relevance
within total compensation
FIXED COMPENSATION
VARIABLE COMPENSATION
MANAGEMENT BY OBJECTIVES
• Quarterly
• Monthly
• Weekly
• Daily
CORPORATE RESTAURANTS
OCC controlling KPIs Sunday-to-Sunday
Daily Routine
In-restaurant visits to assure quality and service level
Quarterly RoutineR
ou
tin
es
MERITOCRACY AT ALL LEVELS
TEAM + STRONG MANAGEMENT MODEL
Strategic Plan (5 Years)
Annual Budget + Goals
Deployment
Operational (Daily Control)
SOURCE: BK Brasil
BKB COMPENSATION – RESTAURANT
15

SPEED OF SERVICE – NPS (%)
OVERALL CLIENT SATISFACTION – NPS (%)
SOURCE: BK Brasil16
32.0% 34.3% 38.7%45.8%
57.3%67.8% 75.9%
2012 2013 2014 2015 2016 2017 2018
5.4% 9.3%19.4%
30.2%45.3%
56.9%64.0%
2012 2013 2014 2015 2016 2017 2018

ORGANIC EXPANSION
IMPROVEMENT IN SSS AND PROFITABILITY, LEVERAGING ON TECHNOLOGY
ADDITIONAL GROWTH OPPORTUNITIES
NEW RESTAURANT OPENINGS
FOCUS ON FREE-STANDING AND DESSERT CENTERS
SUB-FRANCHISEES EXPANSION
6.5%SSS
(2018)
50 bpsEBITDA Mg. Expansion
(2018)
MOBILE APP
SELF-ORDER KIOSKS
DELIVERY
NEW POS AND SALES TABLET
• 162 RESTAURANTS OPERATED BY LEGACY
FRANCHISEES AND SUB-FRANCHISEES
• ACQUISITION OF 51 RESTAURANTS FROM ONE LEGACY FRANCHISEE (IN 2Q18)
FURTHER CONSOLIDATION OF EXISTING FRANCHISEES
ABILITY TO LEVERAGE PLATFORM TO DEVELOP OTHER FOOD CONCEPTS
SELECTIVELY
OPPORTUNITIES IN NEW BRANDS
SOURCE: BK Brasil 17
148356
FREESTANDINGS
DESSERTCENTERS

REV CONSTRUCTION MONITORING
APPROVED POS SUPPLY CHAIN & AGREEMENTS
LAYOUT OF RESTAURANT TRAINING PLATFORM
IN 2016 BKB CREATED THE SUB-FRANCHISE PROJECT IN ORDER TO LEVERAGE ITS ORGANIC EXPANSION
ACTIVE RESTAURANT PORTFOLIO MANAGEMENT
Restaurant not performing well
(i.e. mature restaurants with negative 4-Wall
EBITDA) Established three years ago, the Committee determines
measures to be implemented in order to increase
restaurant’s profitability
• Suitability to sub-franchisee
• Restaurant location
• Profitability evolution
RationaleRestaurant starts performing well
Restaurant continues not
performing well
Sub-franchisee conversion
Restaurant closes
Profitability Committee
SU
B-F
RA
NC
HIS
EE
RATIONALE STRONG CONTROL OF THE FRANCHISEE OPERATION
Increase national footprint – open restaurants in BKB’s non-target markets
Take advantage of fiscal benefits (“SIMPLES”) and operate restaurants that would not meet BKB’s required returns
Accelerate brand awareness in markets where BKB would take longer to reach
SOURCE: BK Brasil18

THE MAIN OBJECTIVE OF TECNOLOGY USAGE IS TO IMPROVE CONSUMER EXPERIENCE IN ALL INTERACTIONS WITH THE BRAND, AND TO ENABLE A BETTER COMPREHENSION OF OUR CLIENT’S WISHES AND BEHAVIOR
SOURCE: BK Brasil
CRM
WI -FI
SELF-ORDER KIOSK
MOBILE APP
SALES TABLET
DELIVERY
CHAT BOT
Builds channel, develops payment methods and helps to understand customer behavior
Improves experience and increases average ticket
Improves experience and collects client data
Develops loyalty program and builds stronger relationship with clients
Improves experience andpromotes friendly interaction
Takes the Burger King experience to client’s house and workplace
Increases digital contact and improves communication
19

WI-FI
+180 restaurants
SOURCE: BK Brasil*Active users: unique users who opened the app at least once on the last 28 days
DELIVERY• +100 restaurants
• Incremental sales
MOBILE APP
Next steps:Roll out to all restaurants;Media investment to support the roll out
• Downloads: +9million• Active users*: +2million
• Digital coupons
SALES TABLET• +400 restaurants
• Higher average ticket
SELF-ORDER KIOSK• +12 restaurants
• Higher average ticket
20

BK APP
Guests are able to order Burger King from anywhere
RESTAURANTS MAP
Map with the location of restaurants nearby
AUTHENTIC EXPERIENCE
Have it your way
PROFITABILITY IMPROVEMENTImproves average ticket
SELF ORDER & PAY
• Feature allows users to order and pay directly through the app
• Guests have more autonomy in the purchase without having to wait in line
MAIN OBJECTIVES
• Improve guest experience
• Communicate new functionalities
• Digitalcouponing
• National roll-out • Enhance CRMwith Big Data
21

22

BEVERAGE OPTIONS: free refill, beer and natural juice
SELF-ORDER KIOSKS in all restaurants
DESSERTS PLATFORM:ice creams, milk shakes and pies
DIGITAL MENU BOARDin all restaurants
CHICKEN SANDWICH PLATFORM developed locally
23

BK BRASIL SIGNED A MASTER FRANCHISE AND DEVELOPMENT AGREEMENT (MFDA) WITH POPEYES® IN BRAZIL, FURTHER SOLIDIFYING ITS LEADING POSITIONING IN THE QSR INDUSTRY IN THE COUNTRY
BURGER KING® Brazil POPEYES®
Significant improvement in brand awareness and preference over past years
More than 793 restaurants in Brazil
2nd largest global chicken QSR brand, with +3,100 restaurants worldwide
Unique brand, with a differentiated product based on a 300-year old culinary tradition
RATIONALE
Chicken is the most consumed protein in Brazil
Leverage on BK Brasil existing capabilities, infrastructure and scale
Attractive opportunity to further optimize capital allocation
Diversification in a profitable, scalable and sizable business
2nd player in Burger and 3rd
largest QSR in number of restaurants
24
More than 8 restaurants in Brazil

SINCE BEING FOUNDED IN 1972 IN NEW ORLEANS, LOUISIANA, POPEYES HAS BROUGHT THE HEART AND SOUL OF LOUISIANA COOKING TO THE WORLD
1972
Founded in New Orleans, Louisiana as “Chicken on the Run”
1976Popeyes begins franchising; opens ~500 locations over the next 10 years
1999
Popeyes surpasses US$1B in system-wide sales for the first time
2008Popeyes name changes to “PopeyesLouisiana Kitchen”
2011
Popeyes opens it 2000th store in Memphis, TN
2017RBI Acquires Popeyes
2018“First POPEYES openings in Brazil”
25

OVER
3,100
26

12 HOURS MARINATED AND HAND BATTERING AND BREADING ARE KEY FACTORS THAT DEMONSTRATE POPEYES COMMITMENT TO QUALITY AND FRESHNESS
CULINARY INTEGRITY BRAND AUTHENTICITYBOLD INNOVATION
• Fresh Prep• 12-hour marination• Hand Battered & Breaded
in restaurant• Proprietary recipe
• Unique Flavor Trends• Special Chicken Cuts• Distinct Sauces & Sides• Differentiated Menu
• Louisiana Heritage• Origin Story Credibility• 7 nations formed a unique
culture
THE POPEYES DIFFERENCE LEADS TO:Taste Preference, Higher Quality Perception & Brand Authenticity
27

45% 46% 47% 46% 48%
41% 40% 39% 39% 38%
14% 14% 14% 14% 14%
2013 2014 2015 2016 2017
Chicken Beef and Veal Pork
28.4 32.6 35.5 39.5 45.554.2
63.671.7 78.9 83.1
0.2 0.2 0.2 0.20.3
0.40.5
0.60.6
0.7
2007 2008 2009 2010 2011 2012 2013 2014 2015 2016
Other Fast Food
Chicken Fast Food
PROTEIN CONSUMPTION BY CATEGORY - BRAZIL(Million of metric tons)
19.5
28.6 32.435.7 39.7
45.854.6
63.872.3 79.5 83.8
17%19.9 20.0 19.5 20.2
FAST FOOD MARKET ESTIMATES - BRAZIL(BRL billion)
CONSUMER TREND KEY MFDA ASPECTS
• More than 90% of consumers intend to increase or maintain Chicken QSR consumption in the future
• Top 3 attributes for Chicken QSR: • Quality of chicken• Taste• Value proposition
• QSR chicken market in Brazil remains considerably underpenetrated vs. other countries
• Currently, there are very few chicken QSR players to serve guest demand
• Mainly concentrated in the Southeast and South regions of Brazil, mostly in Sao Paulo
SOURCE: USDA, Euromonitor, A.T. Kearney28

RIGHTS
• A 20-year MFDA agreement with Popeyes
• Exclusive right to develop, franchise and operate POPEYES® restaurants in Brazil
• Right to manage the advertising fund in Brazil
• Payment of royalties and contribution to marketing fund in line with levels paid for BURGER KING® brand
OBLIGATIONS
• Annual target of minimum number of restaurants to build and operate
• Opening targets will gradually accelerate over the years, achieving a potential of more than 300 restaurants in the first 10 years of contract
29
YEARS OF EXPERIENCE
28
22
15
19
22
18
15
29
BKB & AFFILIATES SINCE
2010
2011
2011
2011
2011
2011
2011
2004
Iuri MirandaCEO
Clayton MalheirosCFO
Rafael Espírito SantoCOO
Ariel GrunkrautCMO
Gustavo FehlbergDevelopment
Márcia BaenaPeople & Management
Fábio AlvesLegal
William GiudiciFranchise
PREVIOUS EXPERIENCE
SOURCE: BK Brasil30

COMMITTEE PERIODICITY OVERVIEW DIRECTORS
Sales Weekly Approval / analysis of sales for new restaurants COO / CMO / Development
Engineering Weekly Approval of project layouts for own and sub-franchises restaurants and remodeling Development
Investments Weekly Approval of new restaurants, both own and sub-franchises, and candidates for sub-franchisees CEO / CFO / COO / Development
Building Weekly Approval of the construction company for new restaurants Development
Projects Monthly Monitoring of the monthly evolution of Capex of projects approved for the year (ex-capex of restaurants) Development
Profitability Monthly Monitoring of restaurants below profitability (following specific PDCAs)CEO / CFO / COO / CMO / Development
Monitoring Monthly Analysis and monitoring of restaurants opened for up to 3 months COO / Development
Auditing Monthly Discussions on corporate governance, statutes, and policies -
G&A Management Monthly Detailed monitoring of the evolution and forecast of corporate G&A All
Compensation Semiannually Discussions on stock-option, promotions and compensation CEO
Cash Flow Monthly Monitoring of current and forecasted cash position, investments, debt amortization schedule, and overall liquidity CFO
BOARD OF DIRECTORS
COMPLIANCE
• Audit committee with external independent auditor
• Bi-annual FCPA compliance and annual audit by big 4 accounting firm
• Anonymous whistleblower channel
• Internal controls and effective monitoring + extension to vendors
GUILHERME LINS“Chairman”
Marcelo Penna
Renato Ribeiro
Bruno Zaremba
Rodrigo Galindo
Marcos Grodetzky
Joshua Kobza
INDEPENDENT
31

32

104 164 159 19530462
53 5363
52
166217 212
258
356
2014 2015 2016 2017 2018
RESTAURANT BREAKDOWN (QUARTERLY)
DESSERT CENTERS BREAKDOWN (QUARTERLY)DESSERT CENTERS BREAKDOWN (ANNUAL)
RESTAURANT BREAKDOWN (ANNUAL)(# of restaurants) (# of restaurants)
(# of dessert centers) (# of dessert centers)
+380 restaurants
+190 dessert centers
Owned FranchiseesSOURCE: BK Brasil33
195 201 243 261 30463 65 37 44
52258 266 280 305356
4Q17 1Q18 2Q18 3Q18 4Q18
235341 382 413 48417
2430 32
32
41
5468 81
115
128
112121
171162
421531
601697
793
2014 2015 2016 2017 2018
MALL FREE STANDING IN LINE FRANCHISEE
293 419 480 526 639
TOTAL OWNED RESTAURANTS
413 413 461 465 484
32 3231 32 3281 8391 97 115171 181 134 142
162697 709 717 736 793
4Q17 1Q18 2Q18 3Q18 4Q18
526 528 583 594 639
TOTAL OWNED RESTAURANTS

61 86134
211
2889.2% 9.1% 9.6%11.8% 12.3%
2014 2015 2016 2017 2018
661 950
1.3931.784
2.3482,9% 5,3%
9,9%13,8%
6,5%
2014 2015 2016 2017 2018
(R$ mm, %) (R$ mm, %)
(R$ mm) (R$ mm)
NET REVENUE AND SAME-STORE SALES GROWTH (ANNUAL) NET REVENUE AND SAME-STORE SALES GROWTH (QUARTERLY)
ADJ. EBITDA(1) AND ADJ. EBITDA MARGIN (QUARTERLY)ADJ. EBITDA(1) AND ADJ. EBITDA MARGIN (ANNUAL)
CAGR14-18: +47.5%
+310bps
SOURCE: BK Brasil1 Excludes pre-operanting expenses related to M&A, impairment and SOP expenses
34
523 483 537 611
718
16,2%10,3%
0,0%8,2% 7,1%
4Q17 1Q18 2Q18 3Q18 4Q18
83
36 49
77
125
15,9%
7,5%9,2%
12,6%
17,5%
4Q17 1Q18 2Q18 3Q18 4Q18

70 264 275
(706)
(324)0.5x
3.1x2.1x
(3.4x)
(1.1x)
2014 2015 2016 2017 2018
(R$ mm, xEBITDA) (R$ mm, xEBITDA)
(R$ mm, %) (R$ mm, %)
NET DEBT AND NET DEBT / ADJ. EBITDA(1) (ANNUAL) NET DEBT AND NET DEBT / ADJ. EBITDA(1) (QUARTERLY)
NET INCOME AND NET MARGIN (QUARTERLY)NET INCOME AND NET MARGIN (ANNUAL)
SOURCE: BK Brasil1 Excludes pre-operanting expenses related to M&A, impairment and SOP expenses
35
(706) (636)
(223) (236) (324)
(3,4x)(2,9x)
(1,0x) (1,0x) (1,1x)
4Q17 1Q18 2Q18 3Q18 4Q18
(35.9) (36.8)
(93.5)
3.8
128.0 -5.4% -3.9%
-6.7%
0.2%5.5%
2014 2015 2016 2017 2018
21,8 8,8 8,6
27,0
83,6 4,2%
1,8% 1,6%
4,4%
11,6%
4Q17 1Q18 2Q18 3Q18 4Q18

(R$ mm)
(R$ mm)
CAPEX (ANNUAL) CAPEX (QUARTERLY)
OPERATING CASH FLOW
ACQUISITION OPENINGS, EQUIPMENT AND OTHERS
SOURCE: BK Brasil
ACQUISITION OPENINGS, EQUIPMENT AND OTHERS
36
69 45 58 89146
404
462
4Q17 1Q18 2Q18 3Q18 4Q18
+111.1%
(R$ mm)
17533947
404
221 198
743
2016 2017 2018
166.5
304.7
61.5
67.2 13.4 (84.1)68.6 11.5
Operating CashFlow 2017
Operationalresult
Net financialresult
Depreciationand
amortization
Interest,charges and
others
Change inworking capital
Change in otherassets /
liabilities
Operating CashFlow 2018

37
SOURCE: BK Brasil39
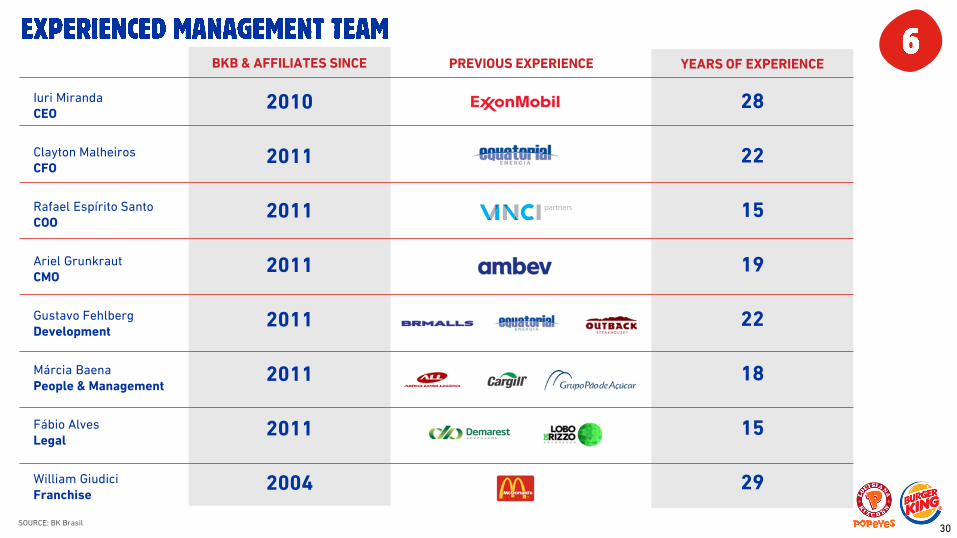
2018 2017 2018 2017ASSETS LIABILITIES AND EQUITY
CURRENT ASSETS CURRENT LIABILITIES
CASH AND CASH EQUIVALENTS 175,0 102,3 LOANS AND FINANCING 161,6 210,0
MARKETABLE SECURITIES 415,6 1.076,4 TRADE PAYABLES 241,2 139,0
TRADE RECEIVABLES, NET 59,6 61,0 PAYROLL AND SOCIAL CHARGES 95,2 69,8
DERIVATIVE FINANCIAL INSTRUMENTS 0,1 0,1 CORPORATE PAYABLES 18,0 14,0
INVENTORIES 81,3 39,7 TAXES PAYABLE 33,8 20,3
RECOVERABLE TAXES 40,4 25,0 DEFERRED REVENUE, NET 9,1 -
ADVANCES PAID 26,6 24,8 DIVIDENDS AND INTEREST ON OWN CAPITAL 26,7 -
OTHER RECEIVABLES 21,1 9,1 OTHER PAYABLES 14,1 19,9
TOTAL CURRENT ASSETS 819,7 1.338,4 TOTAL CURRENT LIABILITIES 599,7 473,0
NON-CURRENT ASSETS NON-CURRENT LIABILITIES
NON-CURRENT INVESTMENTS AT FAIR VALUE 12,4 13,3 LOANS AND FINANCING 117,5 275,7
RECOVERABLE TAXES 15,6 17,3 PROVISION FOR LEGAL CLAIMS 10,7 6,2
JUDICIAL DEPOSITS 30,9 26,6 TAXES PAYABLE 21,8 5,1
LONG-TERM RECEIVABLES 4,6 4,2 DEFERRED INCOME TAX AND SOCIAL CONTRIBUTION 12,5 38,3
PROPERTY AND EQUIPMENT 928,2 699,6 DEFERRED REVENUE, NET 26,4 -
INTANGIBLE ASSETS 714,3 316,1 OTHER PAYABLES 20,1 -
TOTAL NON-CURRENT ASSETS 1.705,9 1.077,1 TOTAL NON-CURRENT LIABILITIES 209,0 325,4
EQUITY
CAPITAL 898,2 895,8
EARNINGS RESERVE 97,6 -
CAPITAL RESERVES AND STOCK OPTIONS PLAN 721,1 915,7
RETAINED EARNINGS/ACCUMULATED LOSSES - (194,4)
TOTAL EQUITY 1.717,0 1.617,2
TOTAL ASSETS 2.525,6 2.415,6 TOTAL LIABILITIES AND EQUITY 2.525,6 2.415,6

40
2018 2017 VAR %NET OPERATING REVENUE 2,348.3 1,783.8 31.6%
GROSS REVENUE FROM SALES 2,541.8 1,917.7 32.5%
GROSS REVENUE FROM SALES DEDUCTIONS (206.1) (148.1) 39.2%
GROSS REVENUE FROM SERVICES 14.3 15.1 -5.1%
GROSS REVENUE FROM SERVICES DEDUCTIONS (1.7) (0.8) 100.0%
COST OF GOOD SOLD (891.3) (687.9) 29.6%
GROSS PROFIT 1,457.0 1,096.0 32.9%
TOTAL SELLING EXPENSES (1,219.7) (935.2) 30.4%
PERSONNEL EXPENSES (404.5) (308.2) 31.2%
ROYALTIES AND MARKETING FUND (215.8) (160.1) 34.8%
EXPENSES WITH OCCUPANCY AND UTILITIES (280.2) (221.9) 26.3%
PRE-OPERATING EXPENSES (9.7) (6.1) 57.7%
DEPRECIATION AND AMORTIZATION (125.1) (110.2) 13.5%
OTHER SELLING EXPENSES (184.4) (128.7) 43.3%
TOTAL GENERAL AND ADMINISTRATIVE EXPENSES (110.5) (95.5) 15.8%
GENERAL AND ADMINISTRATIVE EXPENSES (84.2) (66.4) 26.8%
DEPRECIATION AND AMORTIZATION (8.0) (9.5) -15.5%
EXPENSES WITH MERGER AND ACQUISITIONS (6.7) (2.1) 219.9%
GAIN (LOSS) FROM WRITE-OFF OF PROPERTY, EQUIPMENT AND IMPAIRMENT (7.1) (12.2) -41.9%
GAIN (LOSS) ON CLAIMS 0.0 0.3 -98.7%
COST OF STOCK OPTION PLAN (4.5) (5.5) -18.7%
PROFIT (LOSS) BEFORE FINANCIAL INCOME 126.8 65.3 94.2%
FINANCIAL RESULTS 10.9 (56.3) -
FINANCIAL EXPENSES (44.6) (84.7) -47.3%
FINANCIAL INCOME 55.5 28.4 95.3%
PROFIT (LOSS) BEFORE INCOME TAX AND SOCIAL CONTRIBUTION 137.7 9.0 -
INCOME TAX AND SOCIAL CONTRIBUTION (9.7) (5.2) 85.3%
CURRENT (35.5) - -
DEFERRED 25.8 (5.2) -
NET INCOME FOR THE PERIOD 128.0 3.8 -

1Q16 2Q16 3Q16 4Q16NET OPERATING REVENUE 308.2 325.2 350.9 409.0
GROSS SALES REVENUE 333.8 351.9 380.8 433.5
SALES REVENUE DEDUCTIONS (28.0) (29.8) (32.4) (27.8)
GROSS REVENUE FROM SERVICE RENDERED 2.6 3.2 2.7 3.6
SERVICE REVENUE DEDUCTION (0.2) (0.2) (0.1) (0.3)
COST OF GOOD SOLD (117.8) (125.5) (133.6) (149.4)
GROSS PROFIT 190.5 199.7 217.3 259.6
TOTAL SELLING EXPENSES (182.2) (183.5) (199.8) (210.7)
PERSONNEL EXPENSES (58.9) (62.0) (66.4) (65.6)
ROYALTIES AND MARKETING FUND (30.8) (32.4) (34.1) (38.5)
EXPENSES WITH OCCUPANCY AND UTILITIES (43.9) (36.3) (45.2) (44.6)
PRE-OPERATING EXPENSES (1.2) (1.1) (1.3) (2.6)
DEPRECIATION AND AMORTIZATION (20.1) (24.2) (23.7) (26.2)
OTHER SELLING EXPENSES (27.4) (27.6) (29.1) (33.1)
TOTAL GENERAL AND ADMINISTRATIVE EXPENSES (13.9) (14.8) (18.1) (29.3)
GENERAL AND ADMINISTRATIVE EXPENSES (10.5) (11.2) (14.0) (21.6)
DEPRECIATION AND AMORTIZATION (2.5) (2.5) (2.2) (2.1)
EXPENSES WITH MERGER AND ACQUISITIONS (0.6) (0.7) (0.8) (0.7)
GAIN (LOSS) FROM WRITE-OFF OF PROPERTY, EQUIPMENT AND IMPAIRMENT (0.2) (0.3) (1.0) (4.5)
GAIN (LOSS) ON CLAIMS 0.0 (0.1) (0.0) (0.1)
COST OF STOCK OPTION PLAN - - - (0.3)
PROFIT (LOSS) BEFORE FINANCIAL INCOME (5.6) 1.4 (0.6) 19.7
FINANCIAL RESULTS (18.1) (19.3) (16.9) (46.2)
FINANCIAL EXPENSES (29.2) (35.6) (22.5) (54.8)
FINANCIAL INCOME 11.2 16.2 5.6 8.6
PROFIT (LOSS) BEFORE INCOME TAX AND SOCIAL CONTRIBUTION (23.7) (18.0) (17.5) (26.5)
INCOME TAX AND SOCIAL CONTRIBUTION 1.7 (1.4) (2.2) (5.4)
CURRENT (259.0) (100.0) (1.0) -
DEFERRED 1.7 (1.4) (2.2) (5.4)
NET INCOME (LOSS) (22.1) (19.4) (19.7) (32.0)
SOURCE: BK Brasil41

1Q17 2Q17 3Q17 4Q17NET OPERATING REVENUE 389.9 428.4 443.0 522.5
GROSS SALES REVENUE 421.8 452.1 479.0 564.8
SALES REVENUE DEDUCTIONS (34.4) (27.3) (39.9) (46.5)
GROSS REVENUE FROM SERVICE RENDERED 2.6 3.8 4.2 4.5
SERVICE REVENUE DEDUCTION (0.1) (0.2) (0.3) (0.3)
COST OF GOOD SOLD (150.1) (162.2) (170.0) (205.6)
GROSS PROFIT 239.8 266.2 273.0 316.9
TOTAL SELLING EXPENSES (222.8) (225.2) (236.7) (250.5)
PERSONNEL EXPENSES (76.0) (71.6) (79.5) (81.1)
ROYALTIES AND MARKETING FUND (37.7) (41.7) (42.6) (38.0)
EXPENSES WITH OCCUPANCY AND UTILITIES (53.0) (54.5) (55.3) (59.2)
PRE-OPERATING EXPENSES (0.5) (1.0) (1.3) (3.3)
DEPRECIATION AND AMORTIZATION (23.6) (24.4) (27.9) (34.3)
OTHER SELLING EXPENSES (31.9) (32.0) (30.1) (34.6)
TOTAL GENERAL AND ADMINISTRATIVE EXPENSES (19.2) (18.0) (22.4) (35.8)
GENERAL AND ADMINISTRATIVE EXPENSES (16.4) (14.3) (14.9) (20.7)
DEPRECIATION AND AMORTIZATION (1.8) (1.7) (3.9) (2.2)
EXPENSES WITH MERGER AND ACQUISITIONS (0.4) (0.3) (0.8) (0.7)
GAIN (LOSS) FROM WRITE-OFF OF PROPERTY, EQUIPMENT AND IMPAIRMENT (0.8) (1.7) (0.4) (9.4)
GAIN (LOSS) ON CLAIMS 0.2 - 0.1 0.0
COST OF STOCK OPTION PLAN - - (2.6) (2.9)
PROFIT (LOSS) BEFORE FINANCIAL INCOME (2.2) 23.1 13.9 30.6
FINANCIAL RESULTS (15.8) (14.6) (18.7) (7.2)
FINANCIAL EXPENSES (24.0) (18.6) (27.0) (15.1)
FINANCIAL INCOME 8.2 4.1 8.3 7.9
PROFIT (LOSS) BEFORE INCOME TAX AND SOCIAL CONTRIBUTION (18.1) 8.5 (4.8) 23.4
INCOME TAX AND SOCIAL CONTRIBUTION (1.9) (1.6) (0.1) (1.6)
CURRENT - - - -
DEFERRED (1.9) (1.6) (0.1) (1.6)
NET INCOME (LOSS) (20.0) 6.9 (4.9) 21.8
SOURCE: BK Brasil42

1Q18 2Q18 3Q18 4Q18NET OPERATING REVENUE 482.5 536.9 610.9 718.1
GROSS SALES REVENUE 523.3 578.7 662.9 776.9
SALES REVENUE DEDUCTIONS (43.7) (45.0) (55.1) (62.3)
GROSS REVENUE FROM SERVICE RENDERED 3.3 3.5 3.5 4.1
SERVICE REVENUE DEDUCTION (0.4) (0.4) (0.4) (0.5)
COST OF GOOD SOLD (185.2) (205.2) (228.4) (272.5)
GROSS PROFIT 297.3 331.6 382.5 445.6
TOTAL SELLING EXPENSES (265.8) (292.7) (316.3) (344.9)
PERSONNEL EXPENSES (89.7) (100.4) (105.5) (108.9)
ROYALTIES AND MARKETING FUND (45.3) (47.5) (57.3) (65.6)
EXPENSES WITH OCCUPANCY AND UTILITIES (64.0) (64.3) (72.7) (79.3)
PRE-OPERATING EXPENSES (0.9) (0.7) (2.5) (5.6)
DEPRECIATION AND AMORTIZATION (27.7) (31.6) (31.3) (34.5)
OTHER SELLING EXPENSES (38.2) (48.1) (47.1) (51.1)
TOTAL GENERAL AND ADMINISTRATIVE EXPENSES (28.6) (27.1) (26.6) (28.2)
GENERAL AND ADMINISTRATIVE EXPENSES (23.7) (21.8) (23.3) (15.4)
DEPRECIATION AND AMORTIZATION (1.9) (2.1) (2.0) (2.1)
EXPENSES WITH MERGER AND ACQUISITIONS (0.9) (1.6) (0.6) (3.6)
GAIN (LOSS) FROM WRITE-OFF OF PROPERTY, EQUIPMENT AND IMPAIRMENT (1.1) (0.5) 0.4 (6.0)
COST OF STOCK OPTION PLAN (1.1) (1.1) (1.1) (1.1)
PROFIT (LOSS) BEFORE FINANCIAL INCOME 2.9 11.9 39.6 72.5
FINANCIAL RESULTS 8.0 (2.5) 2.3 3.0
FINANCIAL EXPENSES (11.6) (13.2) (9.4) (10.5)
FINANCIAL INCOME 19.6 10.7 11.7 13.5
PROFIT (LOSS) BEFORE INCOME TAX AND SOCIAL CONTRIBUTION 10.9 9.4 42.0 75.5
INCOME TAX AND SOCIAL CONTRIBUTION (2.1) (0.8) (14.9) 8.1
CURRENT (1.4) (0.1) (13.0) (21.0)
DEFERRED (0.6) (0.8) (1.9) 29.1
NET INCOME (LOSS) 8.8 8.6 27.0 83.6
SOURCE: BK Brasil43

2018 2017CASH FLOW FROM OPERATING ACTIVITIES 304.7 166.5
CASH GENERATED BY OPERATING ACTIVITIES 321.8 263.8
EARNINGS (LOSS) BEFORE INCOME TAX AND SOCIAL CONTRIBUTION 137.7 9.0
DEPRECIATION AND AMORTIZATION OF PROPERTY AND EQUIPMENT AND INTANGIBLE ASSETS 133.1 119.7
INTEREST, CHARGES, EXCHANGE DIFFERENCES AND MONETARY VARIATIONS (7.6) 67.4
OTHERS 58.5 67.6
CHANGES IN ASSETS AND LIABILITIES
TRADE RECEIVABLES,NET 8.5 (27.3)
INVENTORIES (39.4) (8.9)
RECOVERABLE TAXES (12.0) (2.0)
ADVANCES PAID (1.5) (16.1)
TRADE AND RENTAL PAYABLES 96.6 58.6
PAYROLL AND SOCIAL CHARGES (10.1) (11.1)
PAYMENT OF INTEREST ON LOANS AND FINANCINGS (30.8) (68.2)
OTHERS CHANGES IN ASSETS AND LIABILITIES (28.4) (22.3)
NET CASH USED IN INVESTING ACTIVITIES 6.0 (1,208.4)
PURCHASES OF PROPERTY AND EQUIPMENT (321.4) (172.2)
PURCHASES OF INTANGIBLE ASSETS (17.5) (25.6)
CONSIDERATION PAID ON THE ACQUISITION OF INVESTMENTS (360.9) -
INVESTMENT IN MARKETABLE SECURITIES (722.9) (1,304.9)
REDEMPTION OF MARKETABLE SECURITIES 1,428.7 294.4
NET CASH USED IN FINANCING ACTIVITIES (238.1) 887.3
CAPITAL CONTRIBUTED IN THE PERIOD 2.4 890.1
SHARE PREMIUM INCREASE, NET OF ISSUANCE COSTS - 178.8
SHARES ISSUANCE COSTS (4.7) (48.6)
PAYMENT OF LOANS AND FINANCINGS (PRINCIPAL) (235.7) (121.3)
PAYMENT OF CONTINGENT CONSIDERATION AND PAYABLES FOR ACQUISITION OF SUBSIDIARIES - (11.6)
INCREASE (DECREASE) IN CASH AND CASH EQUIVALENTS 72.6 (154.6)
OPENING BALANCE OF CASH AND CASH EQUIVALENTS 102.3 256.9
CLOSING BALANCE OF CASH AND CASH EQUIVALENTS 175.0 102.3 SOURCE: BK Brasil44

EBITDA AND ADJUSTED EBITDA¹
NET DEBT AND LEVERAGE
SOURCE: BK Brasil Note: 1- Adjusted EBITDA is a non-accounting measure adopted by the Company, which corresponds to EBITDA adjusted by pre-operating expenses, expenses with mergers and acquisitions mergers, and other expenses, which the Company’sManagement believes are not part of the normal course of business and/or distort any analysis of the Company’s operating performance, including: (i) write-off of property and equipment (damages, obsolescence, gain (loss) from asset divestment andimpairment); and (ii) costs with the stock option plan)
45
EBITDA - R$ MILLION 4Q18 4Q17 VAR % 3Q18 VAR % 2018 2017 VAR %NET INCOME FOR THE PERIOD 83.6 21.8 283.2% 27.0 209.4% 128.0 3.8 -
(+) FINANCIAL INCOME (LOSS) (3.0) 7.2 - (2.3) 29.0% (10.9) 56.3 -
(+) DEPRECIATION AND AMORTIZATION 36.6 36.4 0.4% 33.3 9.8% 133.1 119.7 11.2%
(+/-) INCOME TAX AND SOCIAL CONTRIBUTION (8.1) 1.6 - 14.9 - 9.7 5.2 85.3%
EBITDA 109.0 67.0 62.7% 72.9 49.6% 260.0 185.0 40.5%
EBITDA MARGIN 15.2% 12.8% 240bps 11.9% 330bps 11.1% 10.4% 70bps
(+) OTHERS EXPENSES* 6.0 9.4 -35.6% (0.4) - 7.1 11.9 -40.4%
(+) COST OF STOCK OPTION PLAN 1.1 2.9 -61.7% 1.1 -0.1% 4.5 5.5 -18.7%
(+) MERGE AND ACQUISITION EXPENSES 3.6 0.7 453.4% 0.6 464.5% 6.7 2.1 219.9%
(+) PRE-OPERATING EXPENSES 5.6 3.3 68.4% 2.5 126.9% 9.7 6.1 57.7%
ADJUSTED EBITDA 125.4 83.3 50.6% 76.7 63.4% 288.0 210.7 36.7%
ADJUSTED EBITDA MARGIN 17.5% 15.9% 160bps 12.6% 490bps 12.3% 11.8% 50bps
*Include write-off of property and equipment (damages, obsolescence, gain (loss) from asset divestment and impairment).
1
NET DEBT - R$ MILLION DEC/18 DEC/17 VAR % SEP/18 VAR %LOANS AND FINANCINGS 279.1 485.7 -42.5% 409.9 -31.9%
CURRENT 161.6 210.0 -23.1% 278.9 -42.1%
NON-CURRENT 117.5 275.7 -57.4% 131.1 -10.3%
CASH AND CASH QUIVALENTS AND MARKETABLE SECURITIES 602.9 1,192.0 -49.4% 646.2 -6.7%
CASH AND CASH EQUIVALENTS AND MARKETABLE SECURITIES (CURRENT) 590.6 1,178.7 -49.9% 633.4 -6.8%
MARKETABLE SECURITIES (NON-CURRENT) 12.4 13.3 -7.0% 12.8 -3.4%
NET DEBT (323.8) (706.3) -54.2% (236.3) 37.0%
ADJUSTED EBITDA (12M) 288.0 210.7 36.7% 245.9 17.1%
NET DEBT/ TOTAL ADJUSTED EBITDA (12M) (1.1x) (3.4x) 2.2x (1.0x) (0.2x)
Top Related
Copyright © 2022 FDOKUMEN

