


Bahasa
Halaman
Hukum

Applying Quality Function Deployment forthe Design of a Next-GenerationManufacturing Simulation Game*
AKSHAY KUMAR and ASHRAF W. LABIBManufacturing Division, Department of Mechanical Aerospace and Manufacturing Engineering,University of Manchester Institute of Science and Technology (UMIST), Manchester M60 1QD, UK.E-mail: [email protected]
Simulation games have grown in use as a training and education tool over the last fifty years. Thispaper examines the requirements of next-generation manufacturing methods and ascertains targetdesign values for a novel simulation game that illustrates issues of next-generation manufacturing.Quality function deployment (QFD) is a powerful tool for translating customer requirements intotarget design values of engineering characteristics. This paper uses QFD to obtain designparameters for the novel game. Identified key paradigm and system elements of next generationmanufacturing are used as the customer requirements or `Whats' in the QFD analysis. Engineeringcharacteristics of games are used as the `Hows'. Linear regression and multi-attribute value theorywith linear programming is used to translate the voice of the customer into optimum target designcharacteristics.
INTRODUCTION
SIMULATION GAMES use simulations, as thename suggests, but it generally refers to activitieswhere simulations are used for the primary objec-tive of learning. More specifically, Greenblat saysthat the term game is applied to simulations thatprogress dependant on the players' decisions in thepast and where the environment and the activitiesof participants have the characteristics of the game[1]. The three characteristics of simulation gamesare [2]:
1. Simulation games always reflect reality.2. A simulation game is embodied in the form of
social communication.3. Simulation games require evaluation of reality
together with self-evaluation and reflection.
While case studies also aim to provide an experi-ence with reality, the uniqueness of simulationgames is the incorporation of the time element.Simulations imitate the passage of time and theparticipants have to adapt and respond to theresults of their past decisions.
PSYCHOLOGY OF EXPERIENTIALLEARNING
The use of simulation games began to spreadafter the Second World War, notably to teachbusiness management. The most popular of theearly games was `Top Management Decision
Simulation', a board game developed by the Amer-ican Management Association in 1956 [3]. Theinitial reason for using games was that it hadenormous motivational advantages as it made thelearning process more enriching and fun.
The notion of experiential learning is based ontheories of cognitive and developmental psycho-logy. SchoÈn has defined experimental learning as `aconception of reflection in action' [4]. Experimen-tal learning helps develop skills that can be putdirectly into action. American psychologist Lewindeveloped this notion further when his experiment,on seeing how theory and practice can be inte-grated in a learning environment, revealed thatlearning was best facilitated in an environmentwhere there was dialectic tension and conflictbetween immediate, concrete experience (i.e. real-ity) and analytic detachment (i.e. formation ofabstract concepts and generalisations) [4]. In thefifties, French developmental psychologist, JeanPiaget's theory that proposed, intelligence is devel-oped by experience and an individual's interactionwith their environment rather than being an innatecharacteristic, was groundbreaking, as it chal-lenged conventional theories in developmentalpsychology. He also stated that play and imitationwere two important tasks that developed a child'sintellectual capabilities. This last idea of imitationand play was one of the early driving forces forsimulation games to be used in education [4].
In 1984, a psychologist by the name of Kolbsuggested the notion of learning being a `processwhereby knowledge is created by the transforma-tion of experience' [4]. According to Kolb, learningwas a four-stage cycle where each stage was a* Accepted 5 May 2004.
787
Int. J. Engng Ed. Vol. 20, No. 5, pp. 787±800, 2004 0949-149X/91 $3.00+0.00Printed in Great Britain. # 2004 TEMPUS Publications.
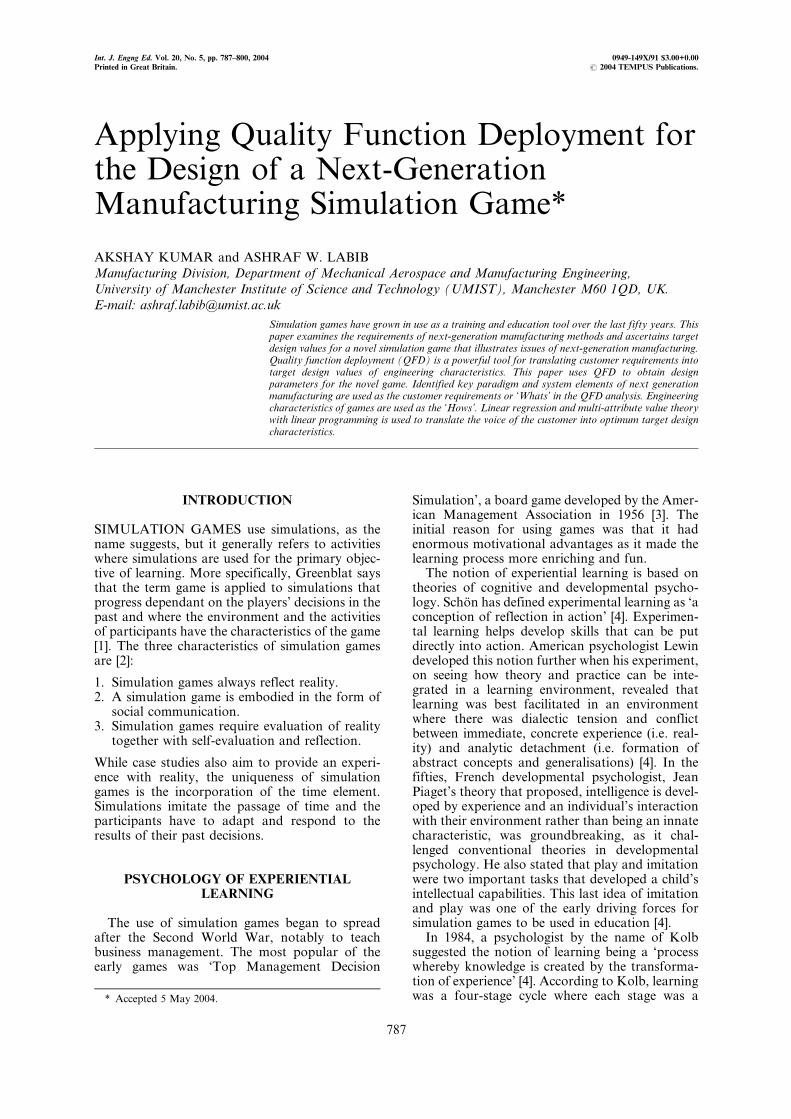
learning mode (Fig. 1). Learning to be completehas to go through these four modes. The first stageis defined as concrete experience that involvesincidents that happen to us or involve us. Thesecond stage is reflective observation where weprocess what is happening to us. The third stage,involves developing, reflecting and storing abstractideas about the outcomes and this stage has beendefined as abstract conceptualisation. The finalstage, namely the experimental stage helps theindividual to draw on the ideas stored during theabstract conceptualisation stage along with theindividual's skill set to face anticipated situations.
These theories are instrumental in providing ascientific explanation for the old quip `learning bydoing'. These also reaffirm the need for a learningtool like simulation games that allows the learnersto experiment as well as get an idea of how thingsreally work in an engineering context as today it isa common occurrence for decision makers to getcaught up and carried away by buzz words withoutunderstanding the functional implications of thesenew management techniques.
REVIEW OF EXISTING GAMES
According to a UNESCO report in 2000, thenumber of simulation games used as learning toolshas doubled over recent years [3]. The UnitedStates, United Kingdom and Finnish organisationsare the most active users of simulation games aslearning and process improvement tools. Todaythese simulation games are available in differentmedia, namely, manual role-playing, computer-assisted and computerised.
A manual role-playing simulation game is gener-ally a board game. It comprises a board with a fewpieces that help the participants track their posi-tion and status with respect to a particular time.The game has a facilitator who generally follows agame script. The facilitator may at times introduceproblems and surprises to encourage group parti-cipation and problem solving by bringing about adisturbance in the game flow. A good example ofthis type of simulation games is the Ogel RowetÐThe Federal Mogul Business GameÐa manufac-turing planning and control game developed atFederal Mogul, with the objective of teachingparticipants how planning tools are integratedwith the organisation of the manufacturing activity[5].
A computer-assisted role playing game, is gener-ally a role-playing game with a script, but, where acomputer is used to simulate the consequences ofdecisions made and to identify the participant'sperformance. The advent of computing technologyhas made this a very popular gaming media as therole-playing scripts allow these games to be flexiblein their domain of applications. A typical exampleof this is the Chain Game developed at WaaginenUniversity, Netherlands, that uses the Internet toallow players from all over the world to participatein gaming sessions that introduce them to theissues of supply chain management in the foodindustry [6].
A computerised game on the other hand is acomputer-based simulation that runs the script ofthe game, introduces problems and calculates theconsequences of decisions made. Basically, thecomputer provides the complete gaming environ-ment. An example of this is the Enterprise game, a
Fig. 1. Kolb's learning model.
A. Kumar and A. Labib788
virtual reality simulation game being developed bySIMLAB, a simulation game research departmentat the Helsinki University of Technology. Thisgame is being developed for employees of largeorganisations to understand how manufacturingprocesses are integrated in order to improve onoverall performance. This game has been usedsuccessfully by ABB Industry Oy to increaseindividual knowledge on concepts of integrationof the entire business function and to learn aboutthe complex dynamics of products [7]. It should bementioned though that there are many othercomputerised games that use less sophisticatedvisualisation technologies while providing acomplete computerised gaming environment, yetthese employ sophisticated game architectures andgenerally have longer lead times relative to compu-ter-assisted and manual role-playing games. More-over a computerised simulation game cannot beeasily adapted in problem content to suit a specificorganisations' training needs.
NEXT-GENERATION PARADIGMS
Rapid pace of change in the nature of manu-facturing processes and systems coupled withdynamic business and socio-cultural environmentshas emphasised the need for developing a formalvisioning methodology to predict the set of rules orparadigms that dictate the mindset in the futuregeneration of manufacturing activities, in theUnited Kingdom and the global context. This isespecially important in the design of the manu-facturing simulation game as the objectives of thegame are to meet the needs of next-generationmanufacturing enterprises as well as to introducehigher education students to methods andconcepts that will be of importance for nextgeneration manufacturing.
Paradigm 1: A holistic model-drivenmanufacturing system
The Manufacturing Systems IntegrationResearch Institute at Loughborough University,UK developed the holistic model. This approachrequires the manufacturing enterprise to be consid-ered simultaneously as a whole [8].
Pandya et al. [9] have outlined certain methodol-ogies that can achieve these objectives:
1. The order fulfilment process that makes manu-facturing enterprises customer-driven and flex-ible in terms of volume and variety in a highlydynamic market.
2. The marketing process that transforms informa-tion from customers, competitors and marketsinto market requirements in order to assist inbetter foresight of change in market behaviour.
3. The technology management process that trans-forms data from research and competitors intotechnology and process knowledge therebycreates an innovative and responsive climate.
Also stress is laid on optimising the innovativeprocess and this involves modelling tools to beused for strategic planning and design of activ-ities. Moreover these tools are to use know-ledge-specific to the organisation to enhancetheir validity.
4. The support fulfilment process that transformsthe need for support and services into a productthat continues to meet customer demands.
Paradigm 2: Parnaby's millennium approachDuring the last two decades high capital invest-
ment has led to automating out the human factorin manufacturing without bringing conspicuousimprovements in productivity due to addedcomplexity and lack of strategic adaptation totechnology. However this paradigm has also seenthe development of cross-functional organisationaldesign and control, move towards lean manufac-ture and emphasis on team-oriented change andimprovement. To overcome the shortcomings andexploit the current potential, Parnaby [10] hassuggested:
1. Simultaneous engineering involving simulta-neous consideration of all aspects of businessesin project and product development.
2. Effective management of innovations and pro-ject development.
3. Operational competencies such as maintenanceand supply chain management are as importantas development competencies such as softwaredecision systems and control systems.
4. Training and development of all employees withemphasis on techniques such as job rotationand teamwork along with developing theirtechnical and management skills.
5. Developing hard-to-copy competencies andarticulating accumulated knowledge specific tothe organisation.
6. Reducing complexity by avoiding over-engineer-ing of products and developing generic modularhardware, software and system designs. Thiswould further encourage flexibility and reducecapital costs.
Paradigm 3: Post mass production paradigmThe post mass production paradigm is a notion
developed by Tomiyama. It is `a system of eco-nomic activity capable of encouraging and sustain-ing economic growth without depending on massproduction and mass consumption' [11]. Hestudied the advances of manufacturing technolo-gies namely miniaturisation and ultra precision ofproducts and technologies, importance of homo-genised management and control systems likequality control and identifies the `evils' of massproduction with regard to environmental damageand limited natural resources, wasteful innovationand complexity as well as trade frictions due thedecreasing absorptive capacity of products indeveloped markets.
Hitomi [12] stressed that manufacturing has to
Applying Quality Function Deployment for Design 789
be more human centred, environmental consciousand responsive to markets. In order to realise theseobjectives the suggested techniques are:
1. Greater consideration to life cycle analysis indesign of products and emphasis on reclaimingand recycling artefacts, the costs of which are tobe included in the product itself.
2. Knowledge-intensive engineering whereby exist-ing knowledge is formalised and new know-ledge is gained at various stages of operationalactivity such as marketing, design, production,maintenance, reclamation, reuse, recycling anddiscarding. This is seen as key for organ-isational survival as this knowledge at variousstages of the product life cycle could be used togenerate more value addition by improving thelife span and reliability of products as well asaiding in product innovation.
3. Human-centred organisational systems promot-ing teamwork, flexible working and quality ofworking life as well as focused and integratedtraining and development of employees.
Paradigm 4: Ultimate manufacturingWah [13] addresses issues of rapid change in
technology, market globalisation and corporatesocial responsibility. Innovation rather thanproductivity is seen as the main driver of growth
in the manufacturing sector. Cost effectiveness byreducing lead times and efficient management ofresearch, is also stressed, as flow of informationrather than materials is seen as the key to survivalin the future. In order to achieve this, the need forintegration of human and technological systems isimportant while addressing broader social issues ofdistribution in the global context. In order torealise these objectives the following are suggested[13]:
1. Improved customer responsiveness by develop-ing better logistic management technologies,obtaining real time knowledge from customersand customers' customers, low cost design ofproducts capable of reaching the marketquickly and the use of virtual managementtechnologies to reduce the uncertainty of theenvironment in which organisations operate.
2. Stress on global responsiveness by globalisingthe organisations' economy and dispersingresearch and development geographically, inorder to tap knowledge from all resources.
3. Improving plant and equipment responsivenessby minimising assets to meet existing demand,using leased and reconfigurable equipment tomaintain flexibility, introduction of new tech-nologies such as micro-machining and biotech-nology, application of simulation techniques to
Table 1. Description of sub-criteria of different paradigms
A. Kumar and A. Labib790
reduce uncertainty and elimination of expensivejigs and fixtures.
4. Improve human responsiveness by having atrained and multidisciplinary workforce whoare creative and, by enhanced human machineinterfaces, can promote human technical inte-gration.
Paradigm 5: Intelligent manufacturing systemsThe intelligent manufacturing systems (IMS)
paradigm, stresses co-operation. This is a radical
shift from the focus of the present economic systemthat encourages healthy competition. The rationalebehind this is that co-operation will help normalisecompetition and at the same time address issues ofwasteful new product development and encouragemore responsible use of natural resources. Know-ledge and its efficient management is also anotherkey factor this paradigm highlights [14]. In orderto realise these objectives the enabling methodol-ogies being studied by the IMS Consortium [15] atpresent are:
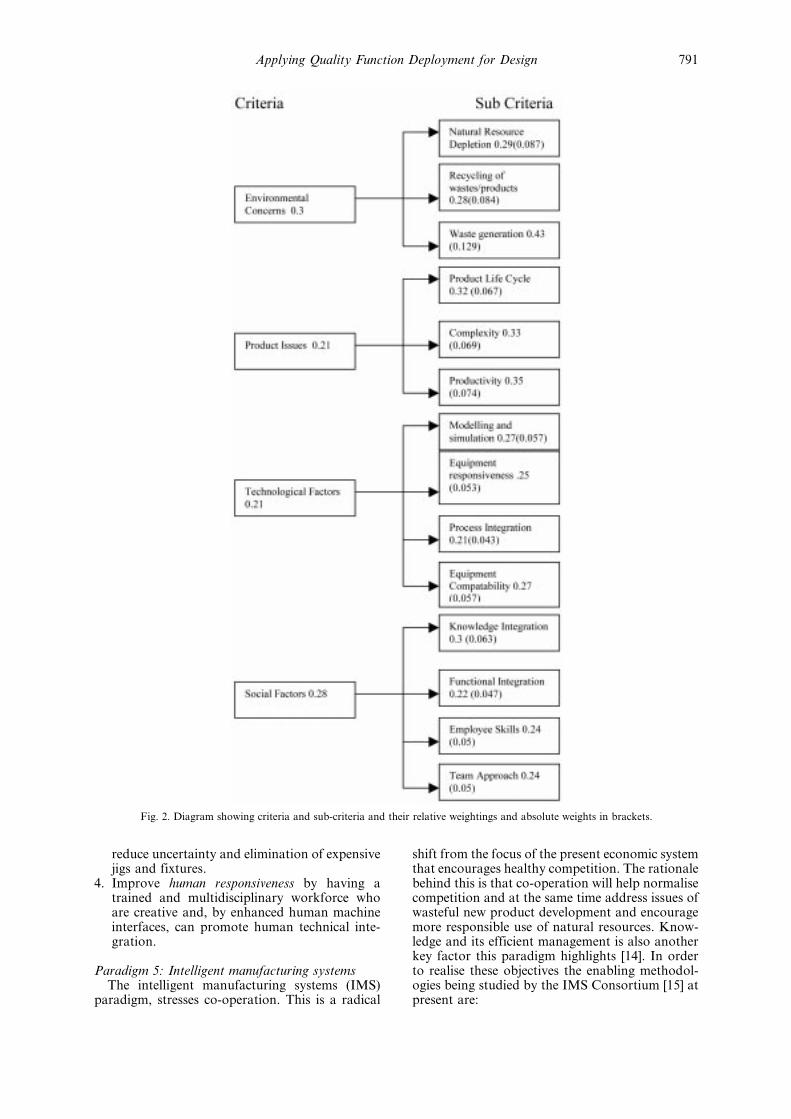
Fig. 2. Diagram showing criteria and sub-criteria and their relative weightings and absolute weights in brackets.
Applying Quality Function Deployment for Design 791
1. Stress on product life cycle issues that emphas-ise optimum use of energy and materials, recycl-ability and reuse.
2. Development of clean and energy-efficientmanufacturing processes, improvement inautonomy and flexibility of products andequipment as well as systemised technologicalinnovation.
3. Increased use of strategy, planning and designtools like simulation and quality functiondeployment.
4. Collaborative research and development andformalisation of organisational knowledge inorder to promote an environment of co-opera-tion in the global economic context.
5. Improved image of manufacturing in theworkforce by encouraging human centredorganisational systems promoting teamwork,flexible working and quality of working life aswell as focused and integrated training anddevelopment of employees.
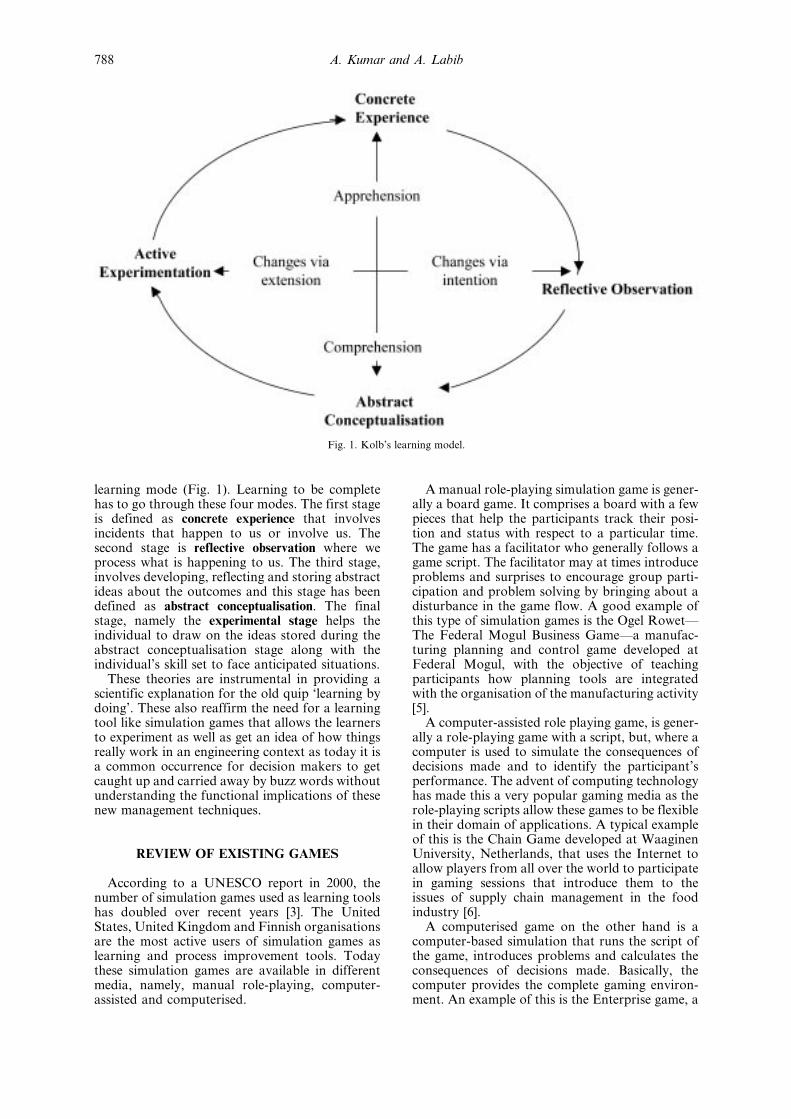
Table 1 shows the main elements of next-genera-tion manufacturing paradigms that were identifiedfrom the literature.
Reviewing previous and ongoing work onmanufacturing paradigms was critical for deter-mining training requirements for leaders of next-generation manufacture. A survey of engineersfrom industry and master level manufacturingstudents, the two target customer groups of thisgame, were carried out in order to identify
elements of these paradigms considered crucial innext-generation manufacture. It should bementioned that all the respondents had partici-pated in sessions of Federal Mogul's BusinessGame conducted at UMIST, within a fortnightbefore the survey was conducted. The relativeimportance of the factors to dominate the next-generation manufacturing paradigm obtainedfrom the survey are shown in Fig. 2.
THE FIRST HOUSE OF QUALITYDIAGRAM
Quality function deployment (QFD) was devel-oped in Japan by Akao in 1972 as a way of matchingcustomer attributes or preferences against engineer-ing characteristics with the objective of systemati-cally translating the `voice of customer' through thestages of product planning, engineering and processdesign into a comprehensively specified productwith defined engineering characteristics, processplans and process parameters [16, 17].
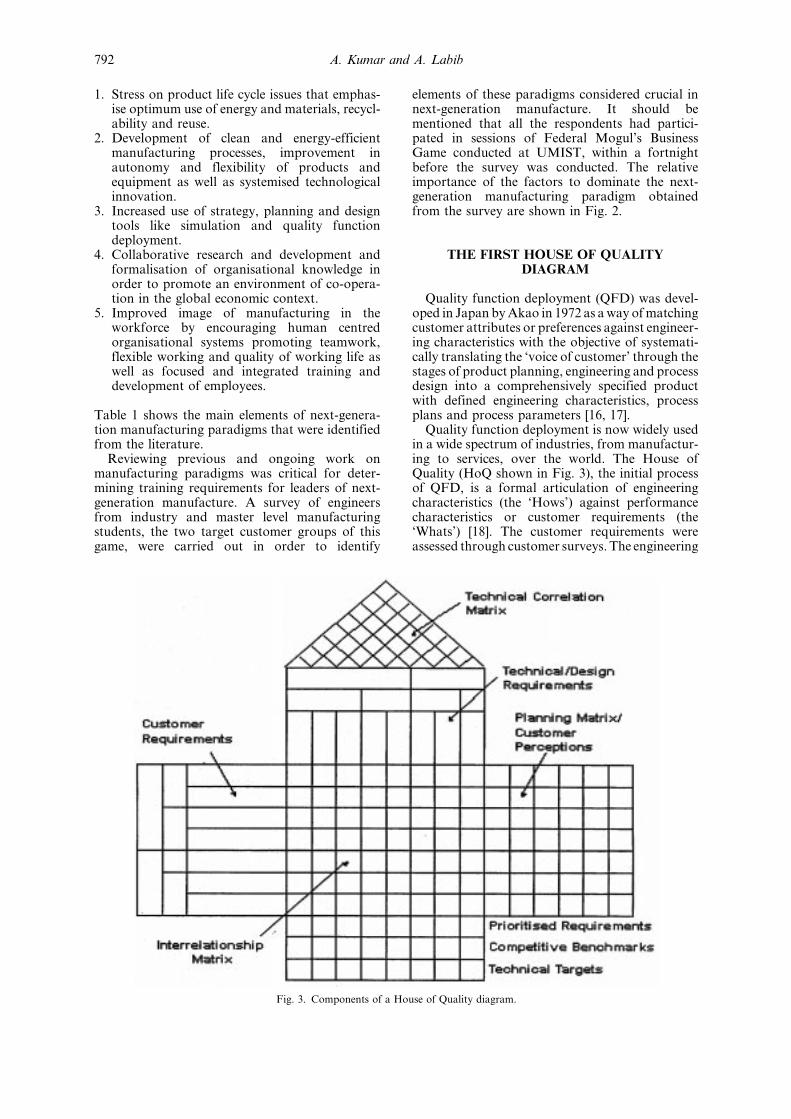
Quality function deployment is now widely usedin a wide spectrum of industries, from manufactur-ing to services, over the world. The House ofQuality (HoQ shown in Fig. 3), the initial processof QFD, is a formal articulation of engineeringcharacteristics (the `Hows') against performancecharacteristics or customer requirements (the`Whats') [18]. The customer requirements wereassessed through customer surveys. The engineering
Fig. 3. Components of a House of Quality diagram.
A. Kumar and A. Labib792
characteristics include various factors that influ-ence the performance characteristics. These werehard to quantify and hence a subjective user-defined scale was used. A relationship matrix isestablished to show the relationships between vari-ous engineering characteristics and performancecharacteristics. Finally there is a triangularmatrix that contains the information on trade-offs between the different engineering characteris-tics. This can be continued to process planning andactivity planning by making the `Hows' from onestage into the `Whats' of the next [19].
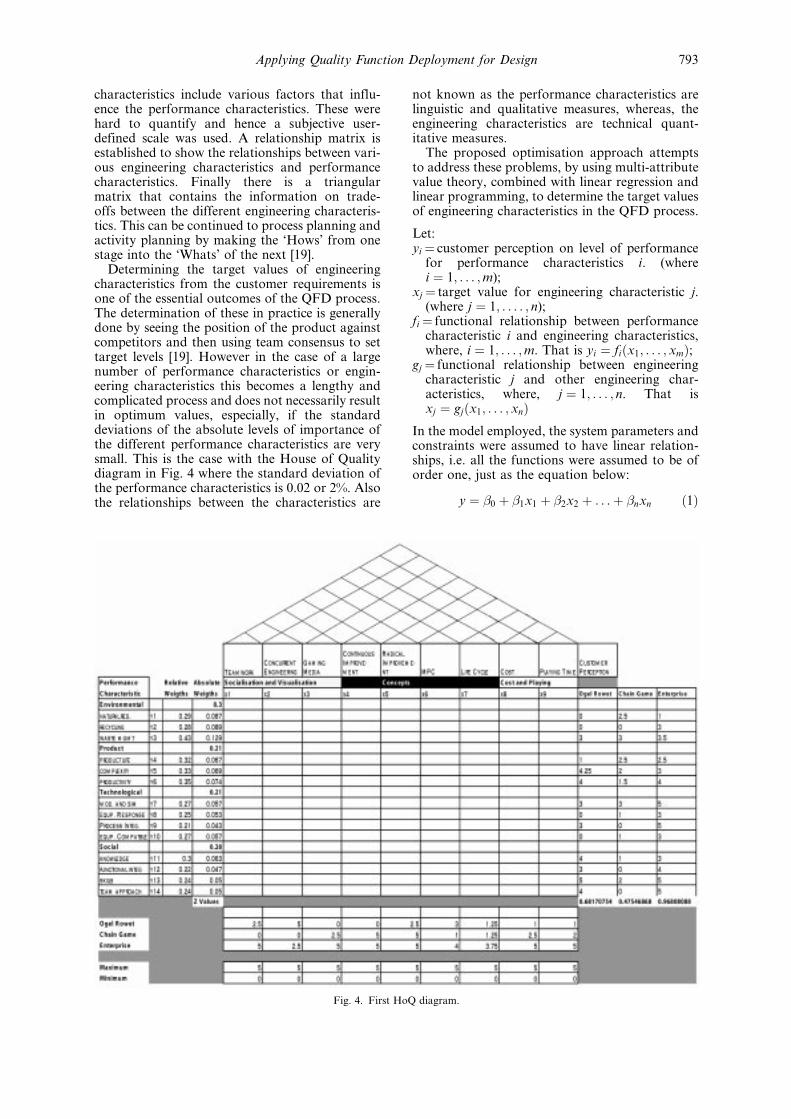
Determining the target values of engineeringcharacteristics from the customer requirements isone of the essential outcomes of the QFD process.The determination of these in practice is generallydone by seeing the position of the product againstcompetitors and then using team consensus to settarget levels [19]. However in the case of a largenumber of performance characteristics or engin-eering characteristics this becomes a lengthy andcomplicated process and does not necessarily resultin optimum values, especially, if the standarddeviations of the absolute levels of importance ofthe different performance characteristics are verysmall. This is the case with the House of Qualitydiagram in Fig. 4 where the standard deviation ofthe performance characteristics is 0.02 or 2%. Alsothe relationships between the characteristics are
not known as the performance characteristics arelinguistic and qualitative measures, whereas, theengineering characteristics are technical quant-itative measures.
The proposed optimisation approach attemptsto address these problems, by using multi-attributevalue theory, combined with linear regression andlinear programming, to determine the target valuesof engineering characteristics in the QFD process.
Let:yi � customer perception on level of performance
for performance characteristics i. (wherei � 1; . . . ;m);
xj � target value for engineering characteristic j.(where j � 1; : . . . ; n);
fi � functional relationship between performancecharacteristic i and engineering characteristics,where, i � 1; . . . ;m. That is yi � fi�x1; . . . ; xm�;
gj � functional relationship between engineeringcharacteristic j and other engineering char-acteristics, where, j � 1; . . . ; n. That isxj � gj�x1; . . . ; xn�
In the model employed, the system parameters andconstraints were assumed to have linear relation-ships, i.e. all the functions were assumed to be oforder one, just as the equation below:
y � �0 � �1x1 � �2x2 � . . .� �nxn �1�
Fig. 4. First HoQ diagram.
Applying Quality Function Deployment for Design 793
Hence, in accordance with this assumption, thelinear regression method is used to determinethe linear functional relationships, i.e. determinethe values of �0; . . . ; �n. This was done for the kthobservation for each set of data. The detailedmethod is outlined in Freund and Minton [20].
Once the linear relationships were computedusing a simple programme on Mathlab, linearmulti-attribute value (MAV) theory was used todefine the crisp objectives. This provides thesimplest way for modelling customer preferencesfor multiple performance characteristics withdifferent weights [21].
Thus, the additive MAV function was used toobtain the overall level of customer satisfaction Z:
Z�y1; . . . ; ym� �Xm
i�1
wi Vi�yi� �2�
Here Vi�yi� is the individual value function forperformance characteristic i and wi is the weightof performance characteristic i. The individualvalue function is scaled in such a way thatVi�loweryi� � 0 and Vi�upperyi� � 1, representingthe lowest and highest possible values of y. Since yvalues are in a scale from 0 to 5, this conditioncould be simplified to:
Vi�yi� � 0:2yi
After the equation for Z was assessed, the problemcould be simplified into a conventional linearprogram as below:
. Objectives. Find target values x1; x2; . . . ; xn,which maximise overall customer satisfactionfor Z�y1; . . . ; ym�.
. Constraints. Subject to: yi � fi�x1; . . . ; xm�;xj � gj�x1; . . . ; xn�.
It is imperative to note that Z is a function of y thatin turn is a function of x. This represents a simplelinear programming problem that can be solvedusing the solver on Microsoft Excel or otheroptimisers such as Lindo. Also it is important to
specify the maximum and minimum values for allxj. The values used for this model were taken fromthe House of Quality diagram figure.
The full linear formulation is thus generatedusing Microsoft Excel. The results of the Zvalues for the four games are listed in Table 2and the target engineering characteristics are inTable 3.
DISCUSSION OF THE RESULTS
The target customer satisfaction level for theproposed design, the Z value, is approximatelyequal to 0.85 or 85%. This is lower than thecustomer satisfaction level obtained for the Enter-prise Game, which is 0.96 or 96%. In this case ofthe Enterprise Game, the target design parametersas apparent from Tables 2 and 3, make for a designthat will fill the gap in the market for a manufac-turing training game. Moreover other resourceconstraints made a virtual environment option anunattractive route.
The scale used for socialisation and visualisationfactors 3 translate into a value of approximately2.5 in teamwork into a game where two teamscompete against each other as opposed to a gamewhere every participant plays individually (a valueof 0) or a game where more than three teamscompete against each other at a time (a value of5). Also a value of approximately 2.5 in concurrentengineering refers to a game where half the deci-sions required to be made in a game involves cross-functional project teams as opposed to no cross-functional decision making (a value of 0) andcross-functional decision making in every decision(a value of 5).
The scale for gaming media used was a value of5 for a completely computerised game where thefacilitators function is incorporated into the gamepackage, or a value of 2.5 for a computer-assistedgame where computers assist visualisation, intro-duce problems to the participants and calculateperformance but at the same time the wholelearning process is carried out in the presence ofa facilitator who at his or her discretion canintroduce additional problems and discuss thelearning objectives that were illustrated by thegame. A value of 0 on the other hand was givento manual role-playing games. The target designvalue for the game indicates that customers prefera computer assisted role-playing game. One of the
Table 2. Z values for the games
Game Z Value
Ogel Rowet 0.681708Chain Game 0.475469The Enterprise Game 0.968081Target Game 0.849282
Table 3. Results of the linear programme formulation: the computed target values of the engineering characteristics for the new game
TeamworkConcurrentEngineering
GamingMedia
ContinuousImprovement
RadicalImprovement
ManufacturingPlanning &
Control Life Cycle CostPlayingTime
Socialisation and Visualisation Concepts Cost andPlaying
Factors
x1 x2 x3 x4 x5 x6 x7 x8 x92.5286042 2.5230933 2.5055108 3.3212783 4.1624762 2.6727455 2.0853035 2.8330675 2.6712735
A. Kumar and A. Labib794
reasons cited by some survey respondents werethat the human facilitator interaction was essentialfor summing up the issues illustrated and toremove any ambiguity about the rules of the game.
Cost target value was 2.8 and this was consistentwith the scale where manual role playing gameswere given values between 0 to 1.5 depending oncomplexity and other factors, computer-assistedwere given between 1.5 to 3 and computerisedgame got between 3 and 5. Also, a playing timeof 2.67 translates into a game that is 9 hours long.
The concepts section in Table 3 show fourpossible areas that any next-generation manufac-turing game must concentrate on. Next-generationmanufacturing will face issues of manufacturingplanning and control, life cycle analysis, continu-ous improvement and radical improvement as itneeds to optimise and reduce waste in order tosurvive competition and dynamic business envir-onments. However these four areas themselvesencompass various business processes and func-tions and hence it became imperative to study next-generation systems in order to identify `a groupor combination of interrelated and interactingelements forming a collective entity' [22] of issuesthat the game needs to illustrate.
Literature on next-generation manufacturingsystems generally stresses the importance of flex-ibility of technologies and organisational struc-tures, autonomy and waste reduction [22±4].Hence three manufacturing systems that were feltto withstand these challenges, namely, flexiblemanufacturing systems, reconfigurable manufac-turing systems and holonic manufacturing systems,are discussed.
NEXT-GENERATION MANUFACTURINGSYSTEMS
Flexible manufacturing systemsSlack et al. [25] have defined flexible manufac-
turing systems (FMS) as a `computer controlledconfiguration of semi-independent workstationsconnected by automated material handling andmachine loading facilities'. This system startedgaining popularity in the early 90s. The componentparts of a Flexible Manufacturing System are NCworkstations, automated material handling,robotic loading and unloading facilities and acentral computer control system that controlsand coordinates the individual parts, productionplanning, and flow of material and informationthrough the system. Hence FMS integrates manytechnologies into one self-contained system thatcan produce a wide variety of similar products insmall batches without changeover delays. FMScan easily accommodate changes in design ofproducts. This system thus has the overall impactof reducing lead-time, design costs, machineryoperating time, product quality as well as reduc-tion in personnel. However, high capital costsand floor space requirements are a few of the
disadvantages of this system [23]. The costs bene-fits of this system are realised in its long-termapplication over several product life cycles. Manycompanies in competitive environments haveadopted this system and it is expected that thissystem of manufacture will continue to be appliedin manufacturing well into this century.
Reconfigurable manufacturing systemsReconfigurable manufacturing systems (RMS)
are defined as `a system with adaptable, integratedequipment, processes and systems that can bereadily reconfigured for a wide range of customerrequirements for products, features and services'[24]. The component parts of RMS are NCmachines with reconfigurable machine tools andcontrols in an open architecture environment thatcan accommodate technology upgrades. Thesegenerally include machinery made up of individualmodules that can be combined together to formdifferent types of machinery within a short periodof time hence facilitating rapid changeover. The`plug and play' nature of the modules is facilitatedby standard power interfaces (electric units),mechanical interfaces (like gearbox drives) andsoftware components (like control networks).This allows the machines to be customised tomeet the ever-changing customer demands. Inspite of this the machines can maintain highprecision by using sensors for diagnosing andself-tuning.
This proposed system has many benefits overflexible manufacturing systems as it can accom-modate technology upgrades within the system dueto its open architecture characteristic as well asproducing a wider range of products that do nothave similar components or are not very similar.However, disadvantages with this system are thatthe high degree of flexibility leaves problems withproduct quality that arises out of human ormaterial rigidities. Also modularity of the systemmakes it highly capital intensive and costly withbenefits that are gained in the long term [23].
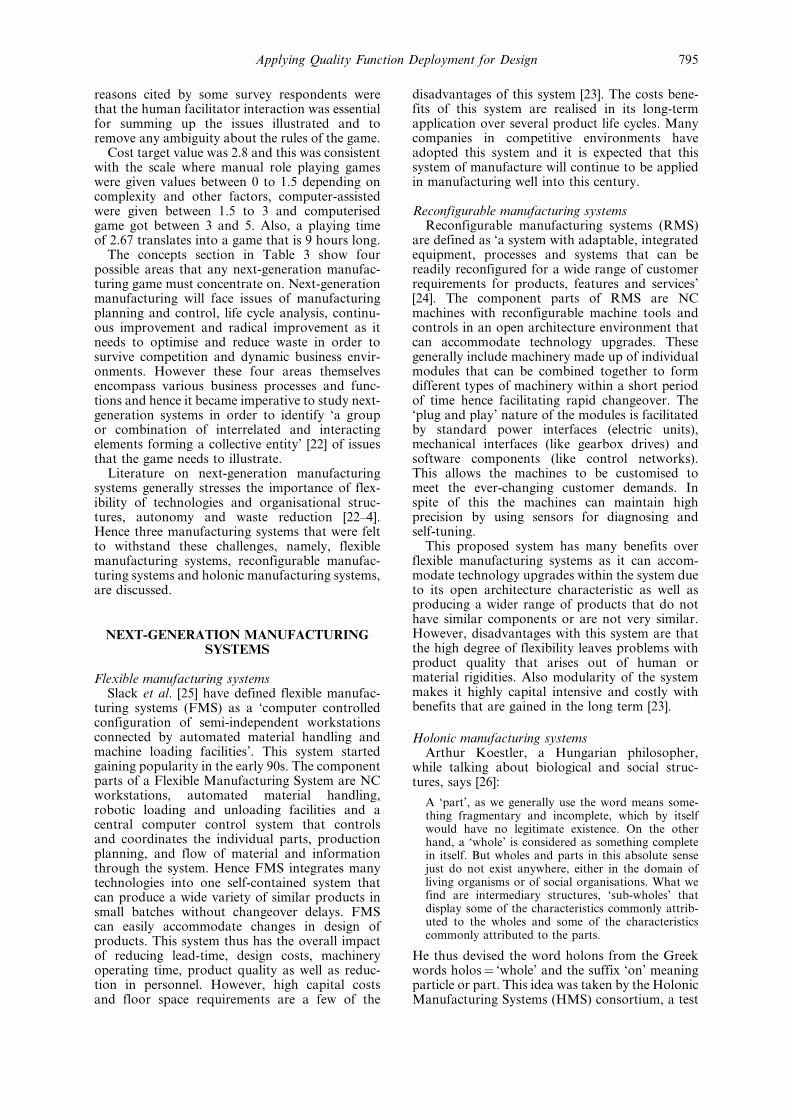
Holonic manufacturing systemsArthur Koestler, a Hungarian philosopher,
while talking about biological and social struc-tures, says [26]:
A `part', as we generally use the word means some-thing fragmentary and incomplete, which by itselfwould have no legitimate existence. On the otherhand, a `whole' is considered as something completein itself. But wholes and parts in this absolute sensejust do not exist anywhere, either in the domain ofliving organisms or of social organisations. What wefind are intermediary structures, `sub-wholes' thatdisplay some of the characteristics commonly attrib-uted to the wholes and some of the characteristicscommonly attributed to the parts.
He thus devised the word holons from the Greekwords holos� `whole' and the suffix `on' meaningparticle or part. This idea was taken by the HolonicManufacturing Systems (HMS) consortium, a test
Applying Quality Function Deployment for Design 795
case under the Intelligent Manufacturing SystemsResearch program in 1994 to define a holonicmanufacturing system where a holon is `an auton-omous and co-operative building block of a manu-facturing system for transforming, transporting,storing and validating information and physicalobjects' whereas a holarchy is defined as a systemof holons that co-operate to achieve a goal orobjective' [22]. The central theme to this proposedmanufacturing system is co-operation betweenholons that stresses the need of efficient uses ofresources and decision-making autonomy ofholons. This makes the system highly resilient toexternal disturbances and highly adaptable. Thestructure of HMS is built around three basicholons namely:
1. Resource holon that comprises of the physicalparts like production resources of a manufac-turing system. This provides production capa-city and functionality to the surroundingholons to drive production.
2. Product holon that contains the product andprocess knowledge to assure correct making ofthe product. This provides information to theother holons.
3. Order holon that is responsible for performingthe assigned work correctly and on time.
These three holons are responsible for strategic,operational and enabling processes within theorganisation. The three holons interact by exchan-ging information. The resource and product holoncommunicate process knowledge, product andorder holons communicate production knowledgewhile resource and order holons communicateexecution information (Fig. 5).
Aggregated holons are defined as a set of relatedholons that are clustered together and form abigger holon with its own identity. Therefore anaggregation hierarchy is formed that is open endedat the top and bottom. This enables a holisticapproach to manufacturing.
The benefits to this system are that it can beapplied to almost any manufacturing setting unlike
RMS and FMS that can be applied to manufactur-ing where there is a high variety of products withsmall batch volumes. This system is highly adap-tive to change due to organised information flowbut more research needs to be done into matterslike integration of holons and methods to reducelead times and changeover times.
THE SECOND HOUSE OF QUALITYDIAGRAM
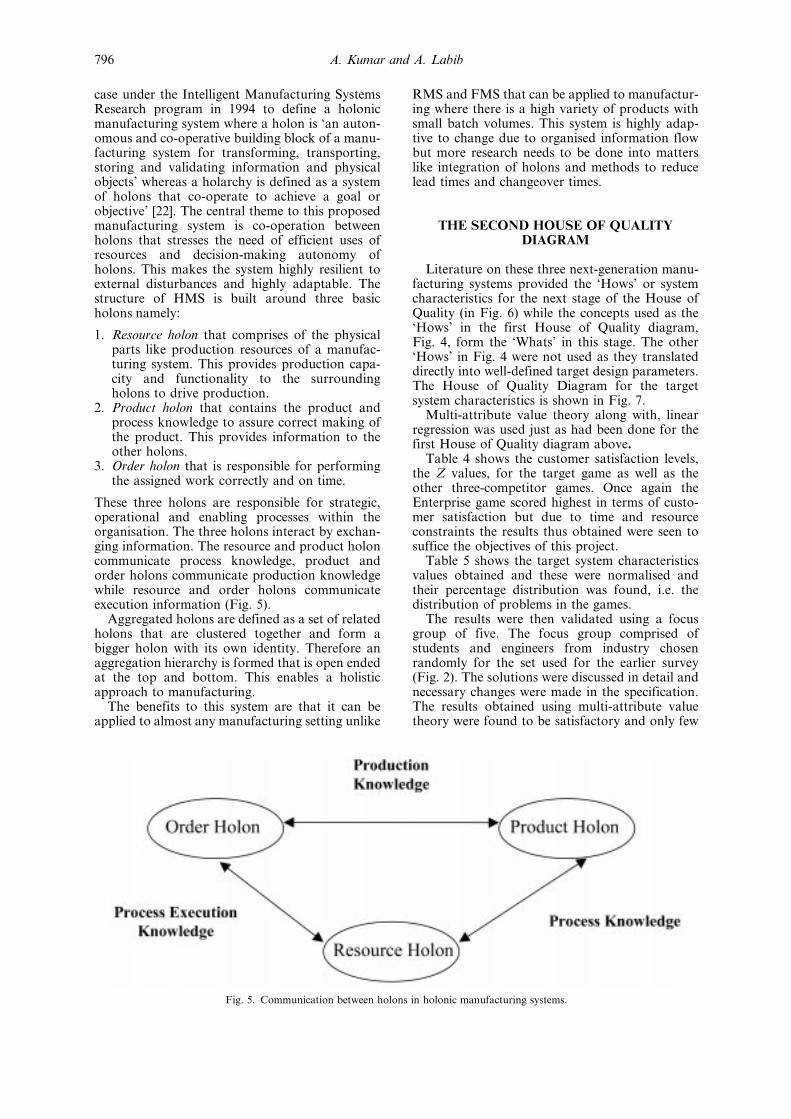
Literature on these three next-generation manu-facturing systems provided the `Hows' or systemcharacteristics for the next stage of the House ofQuality (in Fig. 6) while the concepts used as the`Hows' in the first House of Quality diagram,Fig. 4, form the `Whats' in this stage. The other`Hows' in Fig. 4 were not used as they translateddirectly into well-defined target design parameters.The House of Quality Diagram for the targetsystem characteristics is shown in Fig. 7.
Multi-attribute value theory along with, linearregression was used just as had been done for thefirst House of Quality diagram above.
Table 4 shows the customer satisfaction levels,the Z values, for the target game as well as theother three-competitor games. Once again theEnterprise game scored highest in terms of custo-mer satisfaction but due to time and resourceconstraints the results thus obtained were seen tosuffice the objectives of this project.
Table 5 shows the target system characteristicsvalues obtained and these were normalised andtheir percentage distribution was found, i.e. thedistribution of problems in the games.
The results were then validated using a focusgroup of five. The focus group comprised ofstudents and engineers from industry chosenrandomly for the set used for the earlier survey(Fig. 2). The solutions were discussed in detail andnecessary changes were made in the specification.The results obtained using multi-attribute valuetheory were found to be satisfactory and only few
Fig. 5. Communication between holons in holonic manufacturing systems.
A. Kumar and A. Labib796
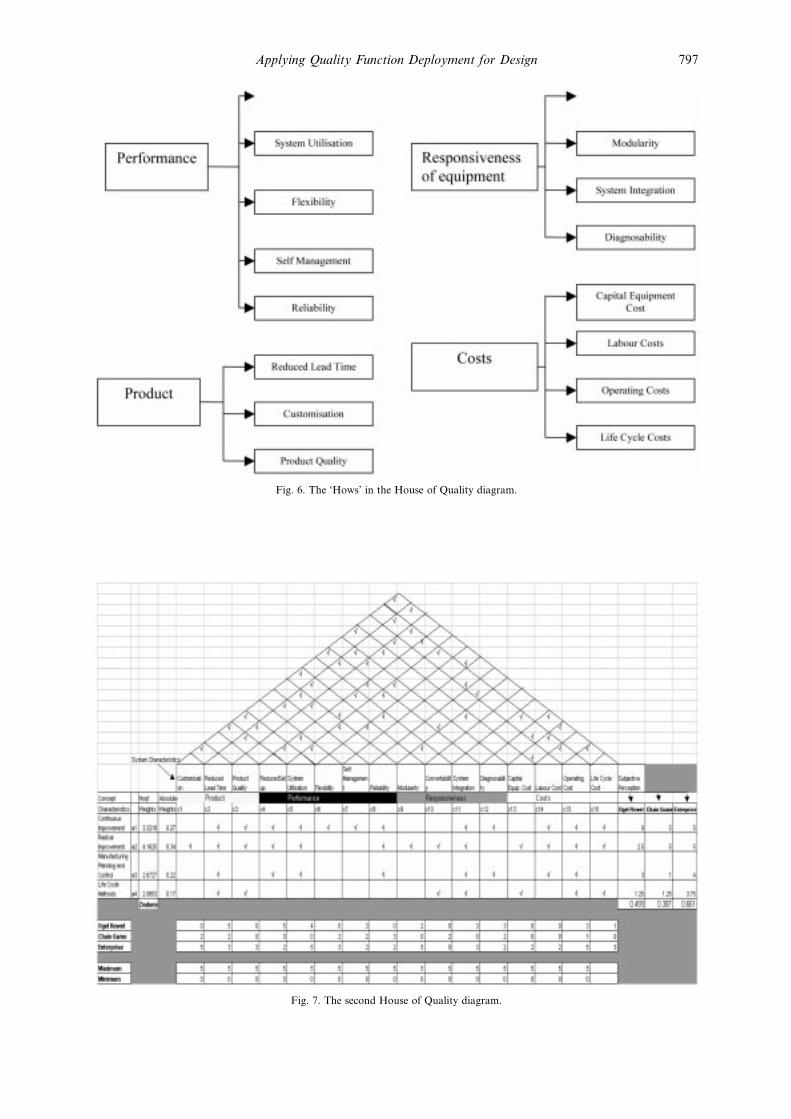
Fig. 7. The second House of Quality diagram.
Fig. 6. The `Hows' in the House of Quality diagram.
Applying Quality Function Deployment for Design 797
minor alterations had to be made to the playingtime in order to reduce the training session to oneworking day and hence the gaming time for thegame for industry was reduced to 7.5 hours. Inorder to keep this design task restricted to onegame for both industry and education, it wassuggested that the game source code have a modu-lar structure where modules could be removedfrom the game in order to reduce the number ofproblems that need to be addressed by the partici-pants, thereby reducing the length of the trainingsession.
SUMMARY OF THE DESIGNSPECIFICATIONS FOR THE NOVEL GAME
. Gaming media: computer-assisted role playing.
. Teamwork: two teams competing against eachother.
. Concurrent engineering: medium level of con-currency in decision-making. In other words atleast half the decisions should require variousfunctions to co-operate in decision-making.
. Modular structure of the game program code.
. Concepts and issues to address: distributions inbrackets (in descending order):± reduce product lead time (10.875%)± optimise operating costs (9.787%)± equipment and system utilisation (9.785%)± equipment modularity (7.621%)± reduce set-up time of equipment (7.621%)
± customisation of products (7.613)%± self-management of production inputs
(7.611%)± equipment diagnosability (maintenance
issues) (7.591%)± equipment and system integration (6.518%)± equipment reliability (5.441%)± equipment and process flexibility (5.434%)± life cycle costs (4.347%)± product quality (3.255%)± capital equipment costs (2.173%)± equipment convertibility (2.173%)± labour costs (2.157%)
. Costs: medium level hence costs should be opti-mised as far as possible for a computer-assistedsimulation game.
. Playing time: 9 hours for the educational gameand 7.5 hours for the industrial version.
CONCLUSION
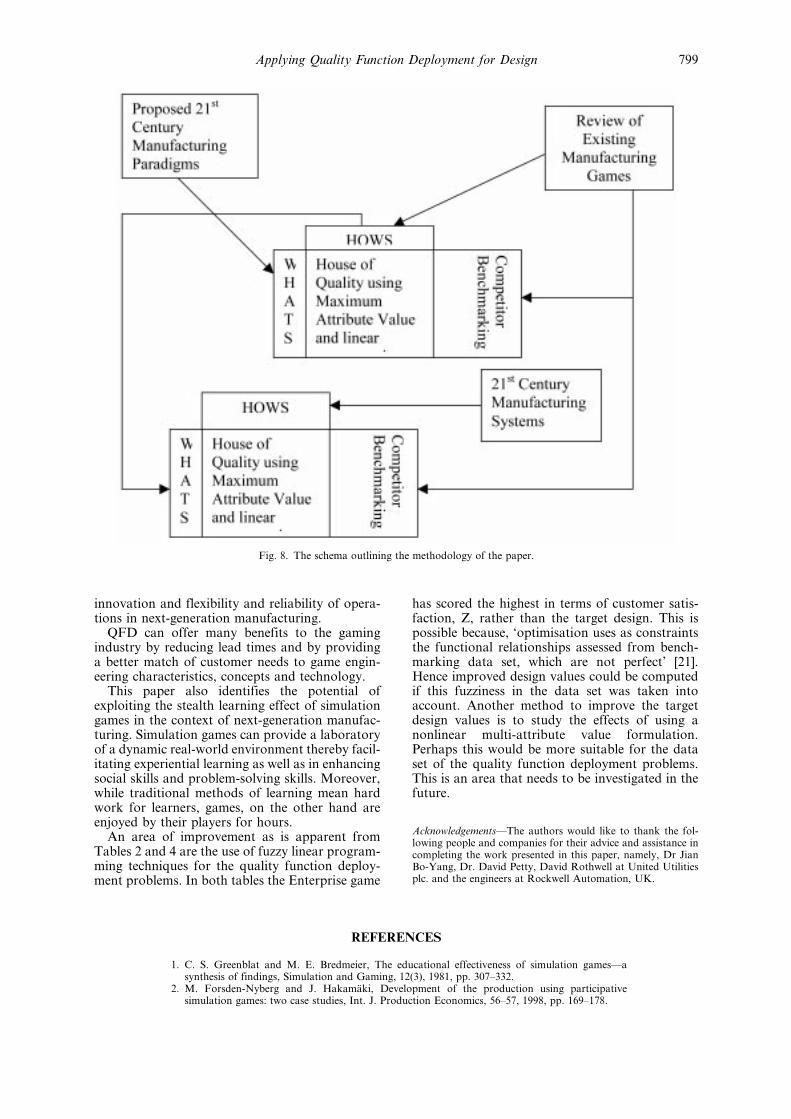
Figure 8 outlines the methodology employed bythis project to achieve the objectives of ascertain-ing design parameters for a simulation game thatillustrates issues that are likely to be faced bytwenty-first-century manufacturing.
Quality functional deployment provided an effi-cient tool for translating the customers' voice intotarget engineering characteristics for a traininggame for next-generation manufacturing leaders.This paper successfully used subjective scalesrather than engineering quantity scales for the`Hows' in the House of Quality and obtainedtarget-engineering characteristics for the newgame. The summary of the result below gives afairly satisfactory description of what students andcorporate engineers feel are the design require-ments of a next-generation manufacturing game.This was confirmed as only a few minor alterationshad to be made at the validation stage. The resultsalso reiterate the emphasis on faster product
Table 4. Z values for the games at thesystems level
Game Z Value
Ogel Rowet 0.493Chain Game 0.387The Enterprise Game 0.661Target Game 0.612
Table 5. The computed target values of the system characteristics the novel game must illustrate, using linear programming,showing the calculated distribution and ranking of the system issues
SystemCharacteristics Variables
ComputedResults
RelativeWeights
Distributionin %. Rankings
Customisation x1 2.3334296 0.076125 7.613 6Reduced Lead Time x2 3.3334936 0.1087507 10.875 1Product Quality x3 0.9977019 0.0325487 3.255 13ReducedSet up x4 2.336094 0.0762119 7.621 5System Utilisation x5 2.9992797 0.0978474 9.785 3Flexibility x6 1.6658122 0.0543449 5.434 11Self Management x7 2.3330437 0.0761124 7.611 7Reliability x8 1.6678653 0.0544119 5.441 10Modularity x9 2.3361544 0.0762139 7.621 4Convertability x10 0.6648289 0.0216891 2.169 15System Integration x11 1.997994 0.0651819 6.518 9Diagnosability x12 2.3270013 0.0759153 7.591 8Capital Equip. Cost x13 0.6660372 0.0217286 2.173 14Labour Cost x14 0.6613142 0.0215745 2.157 16Operating Cost x15 3.0000153 0.0978714 9.787 2Life Cycle Cost x16 1.3325493 0.0434726 4.347 12
A. Kumar and A. Labib798
innovation and flexibility and reliability of opera-tions in next-generation manufacturing.
QFD can offer many benefits to the gamingindustry by reducing lead times and by providinga better match of customer needs to game engin-eering characteristics, concepts and technology.
This paper also identifies the potential ofexploiting the stealth learning effect of simulationgames in the context of next-generation manufac-turing. Simulation games can provide a laboratoryof a dynamic real-world environment thereby facil-itating experiential learning as well as in enhancingsocial skills and problem-solving skills. Moreover,while traditional methods of learning mean hardwork for learners, games, on the other hand areenjoyed by their players for hours.
An area of improvement as is apparent fromTables 2 and 4 are the use of fuzzy linear program-ming techniques for the quality function deploy-ment problems. In both tables the Enterprise game
has scored the highest in terms of customer satis-faction, Z, rather than the target design. This ispossible because, `optimisation uses as constraintsthe functional relationships assessed from bench-marking data set, which are not perfect' [21].Hence improved design values could be computedif this fuzziness in the data set was taken intoaccount. Another method to improve the targetdesign values is to study the effects of using anonlinear multi-attribute value formulation.Perhaps this would be more suitable for the dataset of the quality function deployment problems.This is an area that needs to be investigated in thefuture.
AcknowledgementsÐThe authors would like to thank the fol-lowing people and companies for their advice and assistance incompleting the work presented in this paper, namely, Dr JianBo-Yang, Dr. David Petty, David Rothwell at United Utilitiesplc. and the engineers at Rockwell Automation, UK.
REFERENCES
1. C. S. Greenblat and M. E. Bredmeier, The educational effectiveness of simulation gamesÐasynthesis of findings, Simulation and Gaming, 12(3), 1981, pp. 307±332.
2. M. Forsden-Nyberg and J. HakamaÈki, Development of the production using participativesimulation games: two case studies, Int. J. Production Economics, 56±57, 1998, pp. 169±178.
Fig. 8. The schema outlining the methodology of the paper.
Applying Quality Function Deployment for Design 799
3. A. Lopez, Pretending for real: Simulation Games are gaining popularity as educational tools infields ranging from humanitarian action to business management and accident prevention (1999).http://www.unesco.org/courier/1999_04/uk/apprend/txt1.html
4. H. Haapasalo and J. Hyvonnen, Simulating business and operations managementÐa learningenvironment for the electronics industry, Int. J. Production Economics, 73(3), 2000, pp. 261±272.
5. D. J. Petty, S. Hooker and K. D. Barber, The federal mogul business game: the development andapplication of an educational aid for planning and control, Int. J. Eng. Educ., 17(6), 2001,pp. 546±557.
6. G. V. Hofstede, M. Kramer, S. Meijer and J. A. Wijdemans, Chain game for distributed trainingand negotiation, Games in Production Management, Proc. IFIP Conf., Madrid, Spain, 2±4 July,2001.
7. R. Smeds, T. Takala, M. Grohn, J. Ikaheimonen, J. Jalkanen, H., Kervinen, S. Lukkanen, M.Neiminen and S. Virtanen, SIMLAB-A Virtual Environment for Organisations (1999).http://www.enable.evitech.fi/enable99/papaers/smeds/smeds.html
8. R. H. Weston, The importance of holistic driven manufacturing systems, Proc. Instn. ofMechanical Engineers, Part B, J. Engineering Manufacture, 212(B1), pp. 29±44, 1997.
9. K. Pandya, A. Karlsson, S. Sega and A. Carrie, Towards the manufacturing paradigm of thefuture, Int. J. Operations and Production Management, 17(5), 1997, pp. 502±521.
10. J. Parnaby, Making the millennium, Manufacturing Engineer, 76(3), 1997, pp. 109±112.11. T. Tomiyama, A manufacturing paradigm towards the 21st century, Integrated Computer Aided
Engineering, 4, 1997, pp. 159±178.12. K. Hitomi, Manufacturing excellence for 21st century production, Technovation, 16(1), 1996,
pp. 33±50.13. L. Wah, Ultimate manufacturing, Management Review, 14, 1999, pp. 1±7.14. H. Yoshikawa, Manufacturing and the 21st century-intelligent manufacturing systems and the
renaissance of the manufacturing industry, Technological Forecasting and Social Change, 49,1995, pp. 194±213.
15. Intelligent Manufacturing Systems Group, http://www.ims.org/16. Y. Akao, Quality Function Deployment: Integrating Customer Requirements into Product Design,
Productivity Press, Cambridge, Mass. (1990).17. J. L. Bossert, Quality Function Deployment: A Practitioner's Approach, American Society for
Quality, Milwaukee, USA (1990).18. Y. Kathawala and J. Motwani, Implementing quality function deployment: a systems approach,
The TQM Magazine, 6(6), 1994, pp. 31±37.19. J. R. Hauser and D. Clausing, The House of Quality, Harvard Business Review, 66(3), 1988,
pp. 63±73.20. R. J. Freund and P. D. Minton, Regression Methods: A Tool for Data Analysis, Marcel Dekker,
New York (1979).21. A. Dhingra, G. Evans, K. J. Kim and H. Moskowitz, Fuzzy multicriteria models for quality
functional deployment, European J. Operational Research, 121, 2000, pp. 504±518.22. A. U. Alvi and A. W. Labib, Selecting next-generation manufacturing paradigmsÐan analytic
hierarchy process based criticality analysis, Proc. Instn. of Mechanical Engineers, Part B, Journalof Engineering Manufacture, 215, 2001, pp. 1773±1786.
23. T. Sueyoshi and J. Shang, A unified framework for the selection of a Flexible ManufacturingSystem, European J. Operation Research, 85(2), 1995, pp. 297±315.
24. Y. Koren, U. Heisel, F. Jovanne, T. Moriawaki, G. Pritshow, G. Ulsoy and H. van Brussel,Reconfigurable manufacturing systems, Annals of the CIRP, 48(2), 1999, pp. 1±14.
25. N. Slack, S. Chambers and R. Johnston, Operations Management, Financial Times±Prentice-Hall(2001).
26. A. Koestler, The Ghost in the Machine, Danube Edition, Hutchinson of London (1967).27. Akshay Kumar is studying for a Masters of Engineering degree in Engineering Manufacture and
Management at UMIST, UK.
Ashraf W. Labib is currently a Senior Lecturer (Associate Professor) in the Department ofMechanical Aerospace and Manufacturing Engineering at UMIST. Prior to his appoint-ment at UMIST, he was a Rockwell Fellow for World Class Maintenance at the Universityof Birmingham. His current research interests are Asset Management, Intelligent manu-facturing Systems and Multiple Criteria Decision-Making Systems. He received the 1999and 2000 `Highly Commended' Awards from the Literati club, MCB Press (publisher of 140journals) for two published papers on Multiple Criteria Decision Making and AssetManagement. He holds a Ph.D., M.Sc., MBA, and B.Sc. He is a Member of IEEE and aFellow of IEE.
A. Kumar and A. Labib800
Top Related
Copyright © 2022 FDOKUMEN

