


Bahasa
Halaman
Hukum


Application of ZnO Nanoparticles EM Wave Detector Prepared by Sol-gel and Self-Combustion Techniques
Noorhana Yahya1, Hanita Daud1, Nurulhuda Ali Tajuddin2, Hasnah Mohd Daud1, Afza Shafie1 and Poppy Puspitasari2
1Fundamental and Applied Sciences Department, Universiti Teknologi PETRONAS 31750 Bandar Seri Iskandar, Tronoh, Perak, Malaysia
2Electrical and Electronic Engineering Department, Universiti Teknologi PETRONAS 31750 Bandar Seri Iskandar,Tronoh, Perak, Malaysia
Keywords: Zinc oxide, sol-gel technique, self-combustion technique Abstract. Zinc oxide (ZnO) has found many important applications such as optoelectronic devices, sensors and varistors. The challenging part however is synthesizing ZnO nanoparticles and its utilisation as EM detectors. Sol-gel and self-combustion techniques were chosen in this study due to the ability to produce single phase and nano-size samples. The starting mixture consists of 10 grams of zinc (II) nitrate, Zn(NO3)2.6H2O salt which was dissolved in 50 mL of nitric acid, HNO3.The solution was stirred at 250 rpm continuously for 1 day. The mixture was then gradually heated for every 15 minutes until it combusted at 110oC for the self-combustion technique. For the sol-gel technique, the dissolved mixture was heated at 40oC, 50oC, 60oC and 70oC until the gelatine was formed. After the drying process, the as-prepared samples were annealed at 100oC and 200 oC for 1 hour for each technique. Characterizations were performed by using X-Ray Diffraction (XRD), Raman Spectra and Scanning Electron Microscopy (SEM).The XRD analysis showed a major peak of [101] plane at 2Ө for the self-combustion technique and the sol-gel technique. Raman results for the samples prepared via sol-gel and self-combustion techniques had shown the major peak of ZnO that is located at the Raman shifts of 437.67 cm-1. Using the Scherrer equation, single crystal nano particle of ZnO was successfully obtained in the range of 38.49 nm to 50.70 nm for the sample prepared via the sol gel technique. By the self-combustion technique, the average dimension of the as-prepared sample is in the range of 34-49 nm. Further heat treatment resulted in a major change of the Raman shift corresponding to the single phase ZnO nano particles. The best samples were used as electromagnetic (EM) detectors. The EM detectors are polymer based composite which were prepared using a casting technique. Introduction
Zinc oxide is a unique and very useful material to date. Zinc oxide has a stable wurtzite structure with a lattice spacing a = 0.325 nm and c = 0.521 nm [1]. Various ZnO nanostructures with different morphologies such as nanorods [2,3], nanotubes [4], nanosphere [5], nanoneedles [6] etc have been reported. These nanostructures have been fabricated with different methods such as hydrothermal [1,7,8], precipitation [9], sol-gel [5,6,10], simple thermal sublimation [11], self-combustion [12], vapour liquid solid [3,13], double jet precipitation [14], polymerized complex method [15], polyol method [16] etc. Zinc oxide nanostructure materials can be used for devices like solar cells, sensors, detectors and energy generators [7] and other transparent conducting oxides [17]. ZnO has optically excellent properties such as a wide band gap (3.37 eV) [1,4,18] and a large exciton binding energy (60 meV) at room temperature [1,4]. ZnO has electrical properties and a
Journal of Nano Research Vol. 11 (2010) pp 25-34Online available since 2010/May/04 at www.scientific.net© (2010) Trans Tech Publications, Switzerlanddoi:10.4028/www.scientific.net/JNanoR.11.25
All rights reserved. No part of contents of this paper may be reproduced or transmitted in any form or by any means without the written permission of TTP,www.ttp.net. (ID: 203.135.190.8-07/03/12,11:10:28)

band gap energy similar to TiO2 and it has been reported sometimes to be more efficient than TiO2
[5]. The lowest resistivity, 0.2 Ωm, was obtained for pure ZnO after annealing in Ar [10]. In addition, ZnO is on the borderline between a semiconductor and an ionic material [12]. The chemical reduction of crystal yields oxygen vacancies which act as donors and current voltage characterization of ZnO single crystals at 77 K [19]. This would be the basis of our intention of using ZnO particles as EM detectors. This paper reports novel synthesis techniques, sol-gel and self combustion and their physical characterization. Both the sol-gel and the self-combustion are powerful methods for tailoring transition metal oxides for detection applications [5]. The ZnO nanoparticles are used as electromagnetic (EM) detectors. Experimental procedures Synthesis of ZnO anoparticles. ZnO nanoparticles were prepared by employing two techniques, which are the sol-gel and self-combustion techniques. This process began with dissolving zinc nitrate, Zn(NO3)2.6H2O salt into 65% concentrated nitric acid, HNO3 solution for each technique. Both solutions were stirred for 1 day to form a homogeneous sol. For sol-gel, the homogenized sol solution was then heated up at 40oC, 50oC, 60oC and 70oC until the gelatin was formed. Meanwhile, the homogenized sol solution was also heated until it combusted at 110oC for the self-combustion technique. Both samples were dried in an oven at 110oC for 24 hours. The dried samples were crushed for 1 hour to obtain fine particles. After the crushing process, the green powders were annealed at 100oC, 200oC, 300oC and 400oC [21] for 1 hour for both techniques. Synthesis of EM detector ( Polyvinyl Alcohol + as-prepared ZnO). The starting mixture consists of 3.6 g of PVA powder which was dissolved in 160 mL of deionizer water. The solution was manually stirred at 60oC until the PVA powder was dissolved. The thick solution was divided into two parts, the first part consists of pure PVA and the second part consists of PVA + ZnO (sol-gel powder, annealed at 300oC). All the samples were placed in a petri dish. Later, the samples were dried under a spotlight for about 12 hours. The dried polymers were cut into rectangular shape with the size of 6.5 cm x 2.5 cm. The average thickness of the samples is approximately 0.04 mm. Characterization of Particles. The samples were then characterized by X-Ray Diffraction (XRD), Raman Spectra and Scanning Electron Microscopy (SEM). Characterization of zinc oxide is to obtain information about its crystallinity and morphology [12]. The energy dispersive technique was used to give the elementary analysis of the ZnO annealed powder. The electromagnetic detection set up was published elsewhere [20]. Results and discussion X-Ray Diffractions (XRD). Figure 1 and Figure 2 show the XRD patterns of the as-prepared ZnO samples that were prepared by sol-gel and self combustion techniques, respectively. All peaks appeared are matched with a standard card, for each of the samples at annealed 100oC, 200oC, 300oC and 400oC by using both techniques (Table 1).
26 Journal of Nano Research Vol. 11

Table 1. Standard Card of Zinc Oxide.
Sample Standard Card ZnO SG(100°C) SS-NNNN 72-0627 ZnO SG(200°C) SS-NNNN 89-0511 ZnO SG(300°C) SS-NNNN 65-3411 ZnO SG(400°C) SS-NNNN 79-2205 ZnO SC(100°C) SS-NNNN 89-1397 ZnO SC(200°C) SS-NNNN 79-2205 ZnO SC(300°C) SS-NNNN 89-0511 ZnO SC(400°C) SS-NNNN 89-0510
The samples prepared by the sol-gel method show the [101] major peak at 2θ of 9.33o, 36.29o and 36.27o, 36.29o which was annealed at 100oC, 200oC, 300oC and 400oC, respectively. Meanwhile for the self-combustion method, the [101] major peak was observed at 2θ of 36.18o, 36.26o, 36.29o and 36.27o for samples that were annealed at 100oC, 200oC, 300oC and 400oC, respectively. This result is consistent with other research done [12]. By applying the Scherrer equation [12,14], which is given in Equation [1], the average crystallite size can be obtained:
ϑβλ
cos89.0
=D (1)
where: λ is the X-ray wavelength, θ is the Bragg diffraction angle, β is the peak width at half-maximum.
The average crystallite size of the ZnO samples that were prepared via the sol-gel method annealed at 100oC and 200oC are 38.49 nm and 50.70 nm respectively. But when the annealing temperature increased to 300oC, there was a slight decrease in the crystal size (Table 1). For the self-combustion technique, the average crystallite size is 34.58 nm for a sample annealed at 100oC and 48.63 nm for a sample annealed at 200oC (Table 1). Referring to the Full Width Half Maximum (FWHM) values, it is obvious that all of the as- prepared samples exhibit larger values indicating smaller particle size.
Journal of Nano Research Vol. 11 27

Figure 1. XRD patterns of as-synthesized zinc oxide samples with a major peak [101] (a) zinc oxide standard; and samples prepared via sol gel technique that were annealed at (b) 400oC and (c) 300oC (c) 200 oC and (d) 100oC.
Figure 2. XRD patterns of as-synthesized zinc oxide samples with a major peak [101]; (a) zinc oxide standard; and samples prepared via the self combustion technique that were annealed at (b) 400oC and (c) 300oC (d) 200oC(e) 100oC.
28 Journal of Nano Research Vol. 11
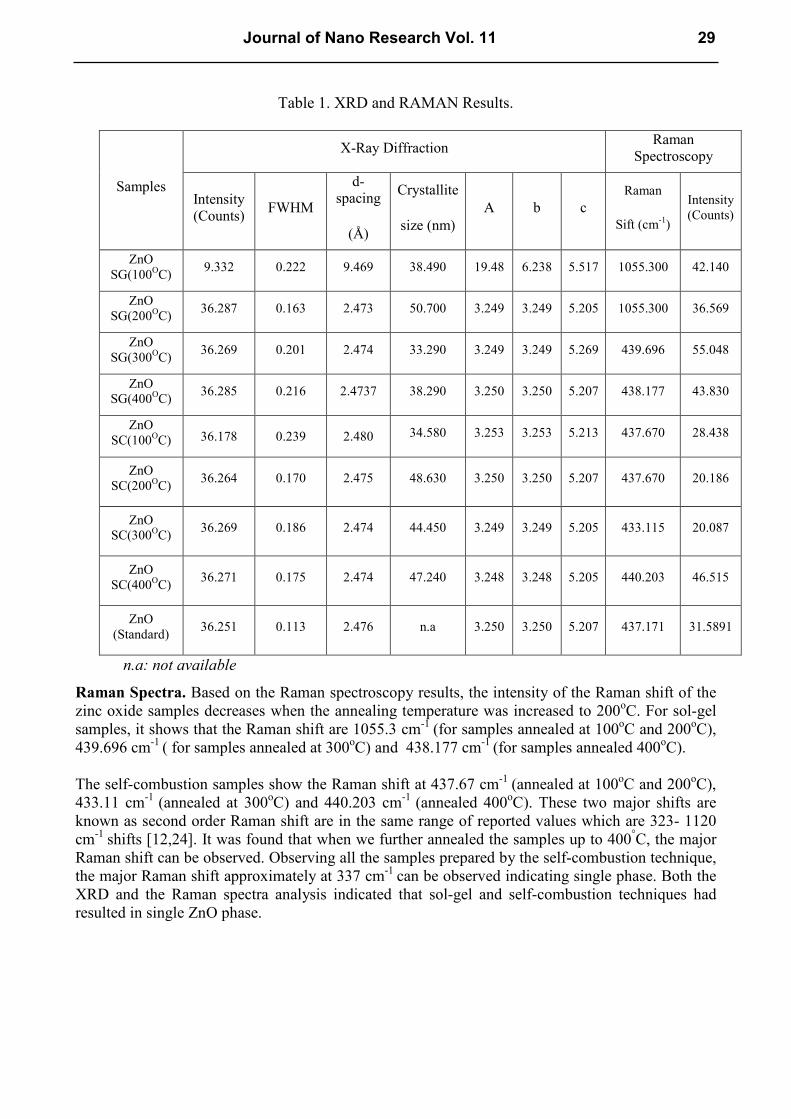
Table 1. XRD and RAMAN Results.
Samples
X-Ray Diffraction Raman Spectroscopy
Intensity (Counts) FWHM
d-spacing
(Å)
Crystallite
size (nm) A b c
Raman
Sift (cm-1)
Intensity (Counts)
ZnO SG(100OC) 9.332 0.222 9.469 38.490 19.48 6.238 5.517 1055.300 42.140
ZnO SG(200OC) 36.287 0.163 2.473 50.700 3.249 3.249 5.205 1055.300 36.569
ZnO SG(300OC) 36.269 0.201 2.474 33.290 3.249 3.249 5.269 439.696 55.048
ZnO SG(400OC) 36.285 0.216 2.4737 38.290 3.250 3.250 5.207 438.177 43.830
ZnO SC(100OC) 36.178 0.239 2.480 34.580 3.253 3.253 5.213 437.670 28.438
ZnO SC(200OC) 36.264 0.170 2.475 48.630 3.250 3.250 5.207 437.670 20.186
ZnO SC(300OC) 36.269 0.186 2.474 44.450 3.249 3.249 5.205 433.115 20.087
ZnO SC(400OC) 36.271 0.175 2.474 47.240 3.248 3.248 5.205 440.203 46.515
ZnO (Standard) 36.251 0.113 2.476 n.a 3.250 3.250 5.207 437.171 31.5891
n.a: not available
Raman Spectra. Based on the Raman spectroscopy results, the intensity of the Raman shift of the zinc oxide samples decreases when the annealing temperature was increased to 200oC. For sol-gel samples, it shows that the Raman shift are 1055.3 cm-1 (for samples annealed at 100oC and 200oC),
439.696 cm-1 ( for samples annealed at 300oC) and 438.177 cm-1 (for samples annealed 400oC). The self-combustion samples show the Raman shift at 437.67 cm-1 (annealed at 100oC and 200oC), 433.11 cm-1 (annealed at 300oC) and 440.203 cm-1 (annealed 400oC). These two major shifts are known as second order Raman shift are in the same range of reported values which are 323- 1120 cm-1 shifts [12,24]. It was found that when we further annealed the samples up to 400°C, the major Raman shift can be observed. Observing all the samples prepared by the self-combustion technique, the major Raman shift approximately at 337 cm-1 can be observed indicating single phase. Both the XRD and the Raman spectra analysis indicated that sol-gel and self-combustion techniques had resulted in single ZnO phase.
Journal of Nano Research Vol. 11 29
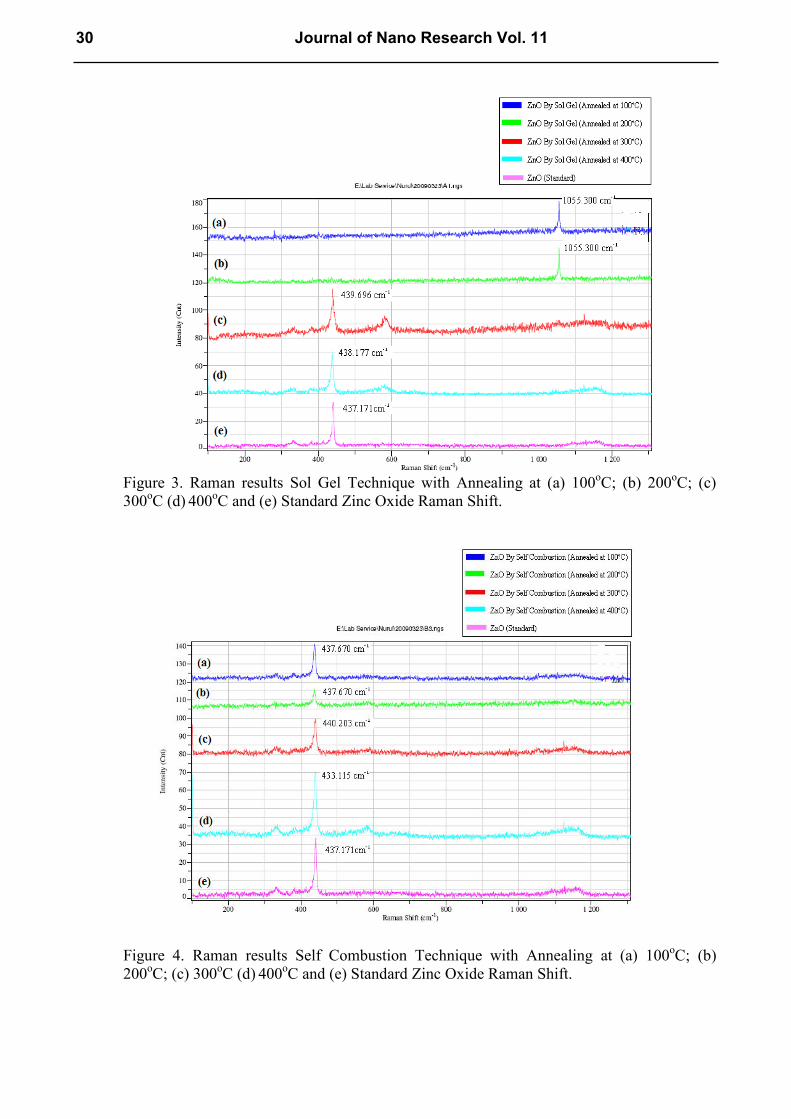
Figure 3. Raman results Sol Gel Technique with Annealing at (a) 100oC; (b) 200oC; (c) 300oC (d) 400oC and (e) Standard Zinc Oxide Raman Shift.
Figure 4. Raman results Self Combustion Technique with Annealing at (a) 100oC; (b) 200oC; (c) 300oC (d) 400oC and (e) Standard Zinc Oxide Raman Shift.
30 Journal of Nano Research Vol. 11

Scanning Electron Microscope (SEM) Results. The SEM images show that the two different synthesis methods had resulted in different morphologies despite the single phase structure. By using the sol-gel technique, ZnO flakes were observed. On the other hand, the ZnO rods morphology was observed when the samples were prepared using the self combustion technique. Generally increasing annealing temperature would result in increasing the grain size [22,23].
Figure 5. SEM morphology of nanorods at two different magnifications (annealing at 200oC) by using the Sol-Gel technique.
Figure 6. SEM morphology of nanorods at two different magnifications (annealing at 200oC) by using self combustion.
Energy Dispersive X-Ray (EDX) Results. This technique is used to study the elemental properties of the ZnO samples. Energy dispersive X-ray gives an elemental analysis or analysis of a sample. Referring to the periodic table, the weight of zinc is 80.34% and oxygen is 19.65%. Referring to Table 2, samples that were prepared using the sol-gel (100oC) method gives a closer weight percent and atomic percent to the theoretical value.
Journal of Nano Research Vol. 11 31
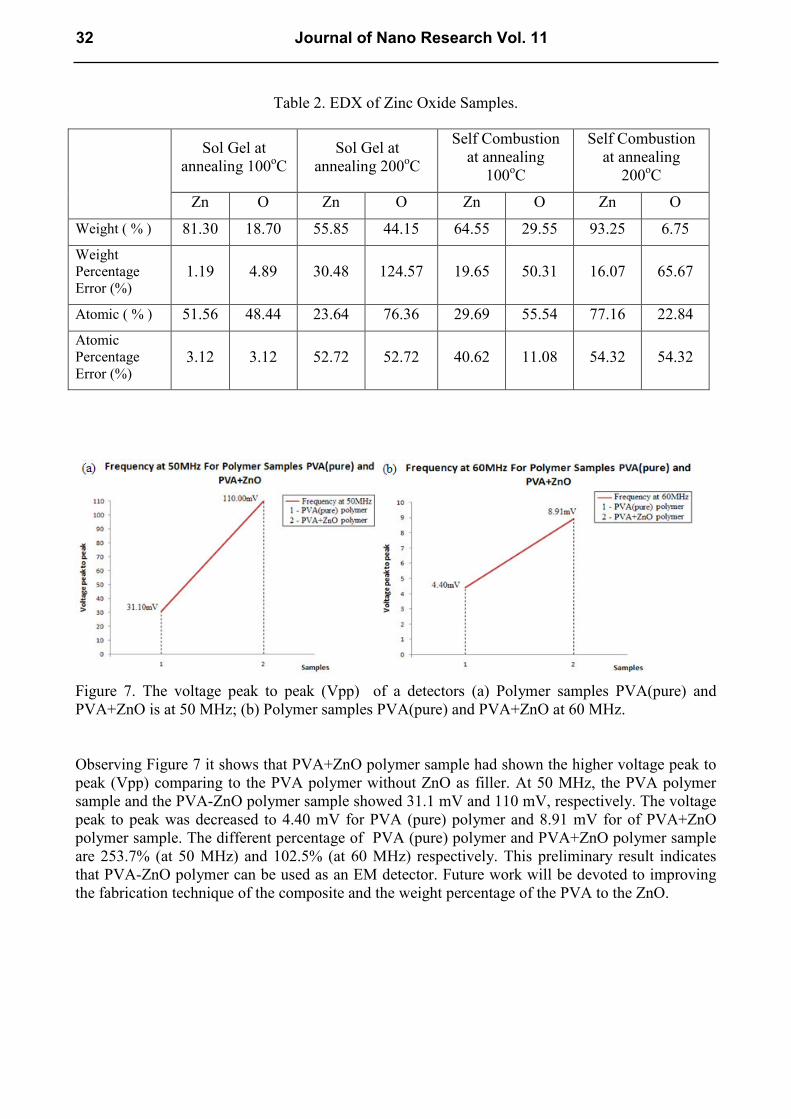
Table 2. EDX of Zinc Oxide Samples.
Sol Gel at annealing 100oC
Sol Gel at annealing 200oC
Self Combustion at annealing
100oC
Self Combustion at annealing
200oC
Zn O Zn O Zn O Zn O
Weight ( % ) 81.30 18.70 55.85 44.15 64.55 29.55 93.25 6.75
Weight Percentage Error (%)
1.19 4.89 30.48 124.57 19.65 50.31 16.07 65.67
Atomic ( % ) 51.56 48.44 23.64 76.36 29.69 55.54 77.16 22.84
Atomic Percentage Error (%)
3.12 3.12 52.72 52.72 40.62 11.08 54.32 54.32
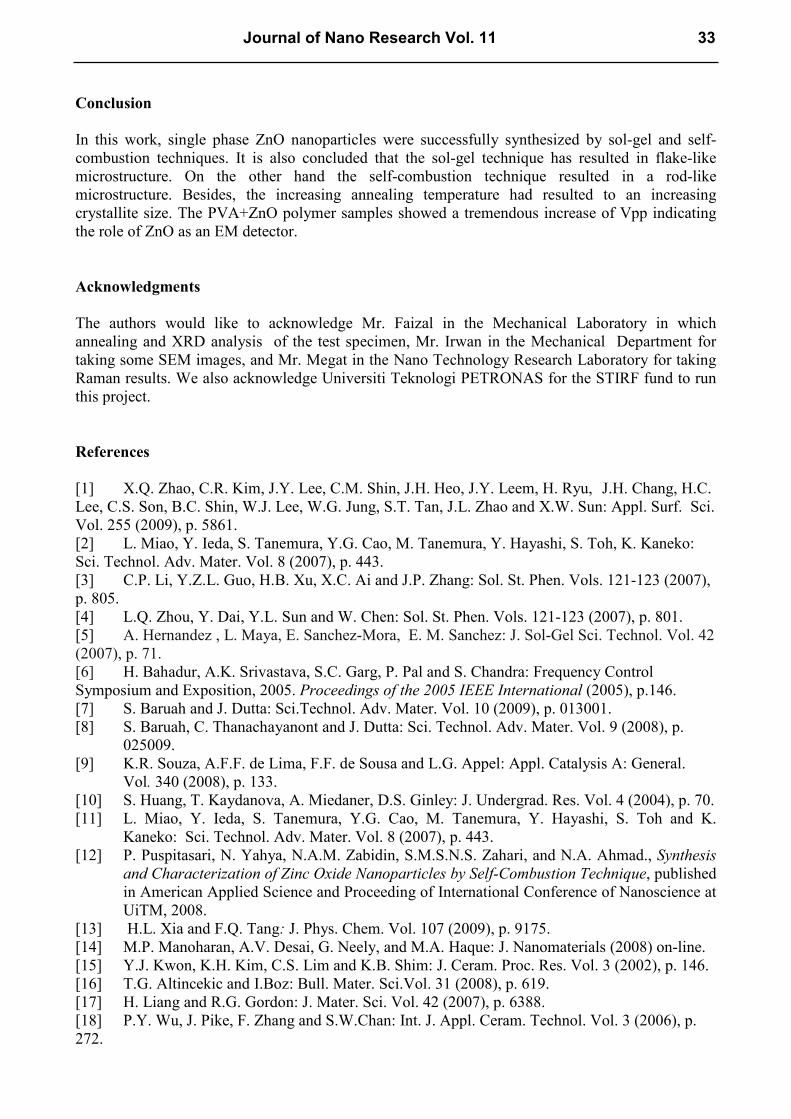
Figure 7. The voltage peak to peak (Vpp) of a detectors (a) Polymer samples PVA(pure) and PVA+ZnO is at 50 MHz; (b) Polymer samples PVA(pure) and PVA+ZnO at 60 MHz.
Observing Figure 7 it shows that PVA+ZnO polymer sample had shown the higher voltage peak to peak (Vpp) comparing to the PVA polymer without ZnO as filler. At 50 MHz, the PVA polymer sample and the PVA-ZnO polymer sample showed 31.1 mV and 110 mV, respectively. The voltage peak to peak was decreased to 4.40 mV for PVA (pure) polymer and 8.91 mV for of PVA+ZnO polymer sample. The different percentage of PVA (pure) polymer and PVA+ZnO polymer sample are 253.7% (at 50 MHz) and 102.5% (at 60 MHz) respectively. This preliminary result indicates that PVA-ZnO polymer can be used as an EM detector. Future work will be devoted to improving the fabrication technique of the composite and the weight percentage of the PVA to the ZnO.
32 Journal of Nano Research Vol. 11
Conclusion
In this work, single phase ZnO nanoparticles were successfully synthesized by sol-gel and self-combustion techniques. It is also concluded that the sol-gel technique has resulted in flake-like microstructure. On the other hand the self-combustion technique resulted in a rod-like microstructure. Besides, the increasing annealing temperature had resulted to an increasing crystallite size. The PVA+ZnO polymer samples showed a tremendous increase of Vpp indicating the role of ZnO as an EM detector. Acknowledgments The authors would like to acknowledge Mr. Faizal in the Mechanical Laboratory in which annealing and XRD analysis of the test specimen, Mr. Irwan in the Mechanical Department for taking some SEM images, and Mr. Megat in the Nano Technology Research Laboratory for taking Raman results. We also acknowledge Universiti Teknologi PETRONAS for the STIRF fund to run this project. References [1] X.Q. Zhao, C.R. Kim, J.Y. Lee, C.M. Shin, J.H. Heo, J.Y. Leem, H. Ryu, J.H. Chang, H.C. Lee, C.S. Son, B.C. Shin, W.J. Lee, W.G. Jung, S.T. Tan, J.L. Zhao and X.W. Sun: Appl. Surf. Sci. Vol. 255 (2009), p. 5861. [2] L. Miao, Y. Ieda, S. Tanemura, Y.G. Cao, M. Tanemura, Y. Hayashi, S. Toh, K. Kaneko: Sci. Technol. Adv. Mater. Vol. 8 (2007), p. 443. [3] C.P. Li, Y.Z.L. Guo, H.B. Xu, X.C. Ai and J.P. Zhang: Sol. St. Phen. Vols. 121-123 (2007), p. 805. [4] L.Q. Zhou, Y. Dai, Y.L. Sun and W. Chen: Sol. St. Phen. Vols. 121-123 (2007), p. 801. [5] A. Hernandez , L. Maya, E. Sanchez-Mora, E. M. Sanchez: J. Sol-Gel Sci. Technol. Vol. 42 (2007), p. 71. [6] H. Bahadur, A.K. Srivastava, S.C. Garg, P. Pal and S. Chandra: Frequency Control Symposium and Exposition, 2005. Proceedings of the 2005 IEEE International (2005), p.146. [7] S. Baruah and J. Dutta: Sci.Technol. Adv. Mater. Vol. 10 (2009), p. 013001. [8] S. Baruah, C. Thanachayanont and J. Dutta: Sci. Technol. Adv. Mater. Vol. 9 (2008), p.
025009. [9] K.R. Souza, A.F.F. de Lima, F.F. de Sousa and L.G. Appel: Appl. Catalysis A: General.
Vol. 340 (2008), p. 133. [10] S. Huang, T. Kaydanova, A. Miedaner, D.S. Ginley: J. Undergrad. Res. Vol. 4 (2004), p. 70. [11] L. Miao, Y. Ieda, S. Tanemura, Y.G. Cao, M. Tanemura, Y. Hayashi, S. Toh and K. Kaneko: Sci. Technol. Adv. Mater. Vol. 8 (2007), p. 443. [12] P. Puspitasari, N. Yahya, N.A.M. Zabidin, S.M.S.N.S. Zahari, and N.A. Ahmad., Synthesis
and Characterization of Zinc Oxide "anoparticles by Self-Combustion Technique, published in American Applied Science and Proceeding of International Conference of Nanoscience at UiTM, 2008.
[13] H.L. Xia and F.Q. Tang: J. Phys. Chem. Vol. 107 (2009), p. 9175. [14] M.P. Manoharan, A.V. Desai, G. Neely, and M.A. Haque: J. Nanomaterials (2008) on-line. [15] Y.J. Kwon, K.H. Kim, C.S. Lim and K.B. Shim: J. Ceram. Proc. Res. Vol. 3 (2002), p. 146. [16] T.G. Altincekic and I.Boz: Bull. Mater. Sci.Vol. 31 (2008), p. 619. [17] H. Liang and R.G. Gordon: J. Mater. Sci. Vol. 42 (2007), p. 6388. [18] P.Y. Wu, J. Pike, F. Zhang and S.W.Chan: Int. J. Appl. Ceram. Technol. Vol. 3 (2006), p. 272.
Journal of Nano Research Vol. 11 33

[19] D.K. Jain and J.C.Garg., Electrical Conductivity of Zinc Oxide at High Fields, Dept. Physics, University of Rajasthan, Jaipur, (1979). [20] N. Yahya, A.S.M.N. Aripin, A.A. Aziz, H. Daud, H.M.Zaid, L.K.Pah and N. Maarof: Am. J. Eng. Appl. Sci. Vol. 1 (2008), p. 53. [21] V. Noack and A. Eychmuller: Chemistry of Mater. Vol. 14 (2002), p. 1411. [22] H. D. Reitz, S. Kumar, X.Bi, and N. Kambe, Zinc Oxide Particles, United States Patent, (2008). [23] Z. Fan and J.G. Lu: J. Nanosci. Nanotechnol. Vol. 5 (2005), p. 1561. [24] A. Khan., Synthesis, Characterization and Luminescence Properties of Zinc Oxide
"anostructure, PhD thesis, Ohio University, 2006.
34 Journal of Nano Research Vol. 11
Journal of Nano Research Vol. 11 10.4028/www.scientific.net/JNanoR.11
Application of ZnO Nanoparticles EM Wave Detector Prepared by Sol-Gel and Self-Combustion Techniques
10.4028/www.scientific.net/JNanoR.11.25 DOI References[3] C.P. Li, Y.Z.L. Guo, H.B. Xu, X.C. Ai and J.P. Zhang: Sol. St. Phen. Vols. 121-123(2007), p. 805.doi:10.4028/www.scientific.net/SSP.121-123.805
[5] A. Hernandez, L. Maya, E. Sanchez-Mora, E. M. Sanchez: J. Sol-Gel Sci. Technol. Vol.
42 (2007), p. 71.
doi:10.1007/s10971-006-1521-7
[7] S. Baruah and J. Dutta: Sci.Technol. Adv. Mater. Vol. 10 (2009), p. 013001.
doi:10.1088/1468-6996/10/1/013001
[8] S. Baruah, C. Thanachayanont and J. Dutta: Sci. Technol. Adv. Mater. Vol. 9 (2008), p.
025009.
doi:10.1088/1468-6996/9/2/025009
[9] K.R. Souza, A.F.F. de Lima, F.F. de Sousa and L.G. Appel: Appl. Catalysis A: General.
Vol. 340 (2008), p. 133.
doi:10.1016/j.apcata.2008.02.006
[14] M.P. Manoharan, A.V. Desai, G. Neely, and M.A. Haque: J. Nanomaterials (2008) on-
line.
doi:10.1155/2008/849745
[16] T.G. Altincekic and I.Boz: Bull. Mater. Sci.Vol. 31 (2008), p. 619.
doi:10.1007/s12034-008-0098-x
[18] P.Y. Wu, J. Pike, F. Zhang and S.W.Chan: Int. J. Appl. Ceram. Technol. Vol. 3 (2006),
p. 272.
doi:10.1111/j.1744-7402.2006.02091.x
[20] N. Yahya, A.S.M.N. Aripin, A.A. Aziz, H. Daud, H.M.Zaid, L.K.Pah and N. Maarof: Am.
J. Eng. Appl. Sci. Vol. 1 (2008), p. 53.

doi:10.3844/ajeassp.2008.53.56
[21] V. Noack and A. Eychmuller: Chemistry of Mater. Vol. 14 (2002), p. 1411.
doi:10.1021/cm011262i
[22] H. D. Reitz, S. Kumar, X.Bi, and N. Kambe, Zinc Oxide Particles, United States Patent,
(2008).
doi:10.1080/00032710701792612
[23] Z. Fan and J.G. Lu: J. Nanosci. Nanotechnol. Vol. 5 (2005), p. 1561.
doi:10.1166/jnn.2005.182
Copyright © 2022 FDOKUMEN

