


Bahasa
Halaman
Hukum


Application of CarboSOIL model to predict the effects of climate change on soil organic
carbon stocks in agro-silvo-pastoral Mediterranean management systems
Miriam Muñoz-Rojas , Luca Doro, Luigi Ledda, and Rosa Francaviglia
M ED_SoilResearch Group

CarboSOIL, a new component of the Agroecological Decision Support System
MicroLEIS
MicroLEIS DSS
Land degradation risk
Land suitabili
ty
Land capabilit
y
Carbon sequestra
tion capacity
CarboSOIL: a land evaluation tool for soil C assessment

MicroLEIS DSS
Land degradation risk
Land suitabilit
y
Land capability
Carbon sequestrat
ion capacity
Climate regulation
Soil structure
Soil fertility
Water holding capacity
Infiltration capacity
Water use efficiency
Soil biological health
CarboSOIL: a land evaluation tool for soil C assessment

CarboSOIL: a land evaluation tool for soil C assessment
SoilN, pH, CECTexture
Bulk densityWater Holding
Capacity
Land use15 land use
types
ClimateWinter
TemperatureSummer
temperatureAnnual
Rainfall
SiteElevationSlope
CarboSOIL

CarboSOIL model diagram
SOIL ORGANIC CARBON0-25, 25-50, 50-75 cmOU
TPUT
S
Incorporation of residues
Mineralisation
Aereation
Nutrient availabili
tyBiological activity
Accumulation / loss Respiration
SOIL
PROCESS
ES
CLIMATETJJA PPT
LAND USELULC
SITEELEV
SLOP
SERO
DRAI
SOIL
FCAP SAND CLAY PHWA NITROCEXC BULKIN
PUT
FACTOR
S
TDJF
Source: Muñoz-Rojas, 2012
CarboSOIL: a land evaluation tool for soil C assessment

CarboSOIL structureVariables CarboSOIL 25
CarboSOIL 50
CarboSOIL 75
Coef Coef CoefIntercept 774.69 1085.65 1150.92
ClimatePRPT 0.003 0.000 0.000TDJF 1.430 0.615 0.637TJJA -0.930 -0.687 0.067
SiteELEV 0.000 0.003 0.001SLOP 0.004 0.005 0.001DRAIad - - -df -2.078 -1.502 -0.210ex 1.887 -2.391 -4.076SEROne - - -se -0.997 -0.883 -0.403re -0.159 0.449 -0.466ge -0.333 1.216 -0.879
SoilNITRO 1.934 26.309 6.063PHWA 0.837 0.072 1.039CEXC -0.009 0.000 0.029SAND 0.803 1.056 1.161CLAY -1.192 -1.597 -1.687BULK -493.990 -686.455 -746.993FCAP 0.018 -0.068 0.002
Variables
CarboSOIL 25
CarboSOIL 50
CarboSOIL 75
Coef Coef Coef
Intercept 774.69 1085.65 1150.92Land use
LULCot - - -nr 1.169 -0.527 -0.469pr -1.483 0.858 -0.580vn -0.210 -3.229 -1.816fr -1.009 -0.525 1.068ol 1.481 -0.232 -0.313cm -0.371 -1.068 -2.222af -0.051 -1.627 -0.063bf -0.335 -2.405 0.029cf 0.284 -1.367 0.697mf 6.329 -1.377 0.982gr 1.511 0.409 -0.526sc 1.358 -0.635 -2.021wd 1.396 -3.398 1.334sm -2.465 -3.064 -3.576
y = a+ b1x1+b2x2+b3x3+ ---+bnxn
y= SOC ; a= Intercept; b= variables; x= coefficients
CarboSOIL: a land evaluation tool for soil C assessment

Study area
Mean altitude -285 m
Climate- warm temperate with dry and hot summer.• Mean annual rainfall of 623 mm (range 367–811)
• Mean annual temperature 15.0°C (13.8–16.4)
Soil type - Haplic Endoleptic Cambisols, Dystric (WRB)
Potential native vegetation - Cork oak forest (Quercus suber L.), converted to managed land with pastures and vineyards in recent years
North-eastern Sardinia (Italy)
40°46’N, 9°10’E

Land use transformation
Study area
Six land uses with different levels of cropping intensification were compared:
Tilled vineyards (TV)
No-tilled grassed vineyards (GV)
Hay crop (HC): oats, Italian ryegrass and annual clovers or vetch for 5 years and intercropped by spontaneous herbaceous vegetation in the 6th year
Pasture (PA): 5 years of spontaneous herbaceous vegetation, and 1 year of intercropping with oats, Italian ryegrass and annual clovers or vetch cultivated as a hay crop
Cork oak forest (CO)
Semi-natural systems (SN): natural re-vegetation of former vineyards (scrublands, Mediterranean maquis and Helichrysum meadows)

Land use transformation
From left to right clockwise: no-tilled grassed vineyard (GV),
grazed hay crop under oats land cover (HC), semi-natural systems with scrubs and Mediterranean maquis (SN), grazed pasture with
spontaneous vegetation (PA).
Study area

CarboSOIL application in agro-silvo-pastoral Mediterranean management systems
Input data• Climate (actual and future)
• Site• Soil• Land use
Model test and validation• Measured values vs. Predicted values
Scenario analysis• Actual scenario• Climate change scenarios

Input data: variables description and sources
VARIABLE TYPE
VARIABLE NAME CODE UNIT SOURCE AND REFERENCE
Dependent variable
Soil Organic C SOCC Mg/ha University of SassariFrancaviglia et al.
(2012;2014)Climate Total
precipitationPRPT mm
CRA elaborations from baseline data and GCMs
Winter Temperature
TDJF oC
Summer Temperature
TJJA oC
Site Elevation ELEV m University of SassariSlope SLOP %Drainage DRAI -
Field surveys and lab analyses
Francaviglia et al. (2012;2014)
Soil Erosion SERO -Soil Nitrogen NITRO g/100g
pH PHWA -Cation Exchange Capacity
CEXC meq/100g
Sand SAND g/100gClay CLAY g/100gBulk density BULK g/ccField capacity FCAP g/100g
Land use Land use/land cover
LULC - Field surveys
Input dataModel
test and validati
on
Scenario analysis
CarboSOIL application in agro-silvo-pastoral Mediterranean management systems

Input data: climate change scenarios
Global Climate Models
• GISS (Goddard Institute of Space Studies, USA)
• HadCM3 (Met Office, Hadley Centre, UK)
Climate Change
Horizons• 2010-2039 (2020)
• 2040-2069 (2050)
• 2070-2099 (2080)
IPCC Models
• A2 (high population growth, slow economic and energetic development)
• B2 (more emphasis on sustainability and efficient technologies
Input dataModel
test and validati
on
Scenario analysis
CarboSOIL application in agro-silvo-pastoral Mediterranean management systems

Input dataModel
test and validati
on
Model applicat
ionAssessment of the model performance and comparison between measured and simulated values
n
iii SO
nRMSE
1
2)(1
n
1i
2i
n
1i
2ii
)OO(
)OS(1EF
where Oi and Si are observed and simulated SOC at ith value, Ō is the mean of the observed data and n is the number of the paired values. The lowest possible value of RMSE is zero, indicating that there is no difference between simulated and observed data.
CarboSOIL application in agro-silvo-pastoral Mediterranean management systems
EF compares simulations and observations on an average level, and can range from - to 1, with the best performance at EF=1.

Input dataModel
test and validati
on
Model applicat
iony = 0.777x + 5.4985
R² = 0.9774; RM SE = 8.42; EF = 0.63
0
20
40
60
80
100
0 20 40 60 80 100
predicted SO
C (Mg/ha)
m easured SOC (M g/ha)
y = 0.8215x + 3.7392R² = 0.9902; RM SE = 5.07; EF = 0.98
0
20
40
60
80
100
0 20 40 60 80 100
predicted SO
C (Mg/ha)
m easured SOC (M g/ha)
y = 0.9702x + 1.4942R² = 0.7621; RM SE = 5.88; EF = 0.93
0
20
40
60
80
100
0 20 40 60 80 100
predicted SO
C (Mg/ha)
m easured SOC (M g/ha)
0-25 cm measured SD=14.12
25-50 cm measured SD=19.53
50-75 cm measured SD=11.09
Regression coefficients are significant at p<0.001 and R2 are high, the standard deviation of the measured values is higher than RMSE, and EF is very close to the optimum value.
CarboSOIL application in agro-silvo-pastoral Mediterranean management systems

Input dataModel
test and validati
on
Model applicat
ion
0.0%1.0%2.0%3.0%4.0%
TV GV HC PA CO SN
GISS 2020 A250-7525-500-25
0.0%1.0%2.0%3.0%4.0%5.0%
TV GV HC PA CO SN
GISS 2020 B250-7525-500-25
0.0%
1.0%
2.0%
3.0%
TV GV HC PA CO SN
Hadley 2020 A250-7525-500-25
-1.0%
0.0%
1.0%
2.0%
3.0%
TV GV HC PA CO SN
Hadley 2020 B2 50-7525-500-25
CarboSOIL model predicted an overall increase of SOC stocks in the 2020 climate scenarios in all the soil sections, with the higher increases in the 50-75 cm section, and the smaller in the 25-50 cm soil section.
CarboSOIL application in agro-silvo-pastoral Mediterranean management systems

Input dataModel
test and validati
on
Model applicat
ion
A SOC decrease is instead expected in the 2050 and 2080 scenarios in the 25-50 cm soil section, more marked in the vineyards in comparison with the other land uses.
-1.0%0.0%1.0%2.0%3.0%4.0%
TV GV HC PA CO SN
GISS 2050 A250-7525-500-25
-2.0%-1.0%0.0%1.0%2.0%3.0%
TV GV HC PA CO SN
GISS 2050 B250-7525-500-25
-2.0%
0.0%
2.0%
4.0%
6.0%
TV GV HC PA CO SN
Hadley 2050 A250-7525-500-25
-2.0%
0.0%
2.0%
4.0%
6.0%
TV GV HC PA CO SN
Hadley 2050 B250-7525-500-25
CarboSOIL application in agro-silvo-pastoral Mediterranean management systems

Input dataModel
test and validati
on
Model applicat
ion
-4.0%-2.0%0.0%2.0%4.0%6.0%8.0%
TV GV HC PA CO SN
GISS 2080 A250-7525-500-25
-2.0%
0.0%
2.0%
4.0%
6.0%
TV GV HC PA CO SN
GISS 2080 B250-7525-500-25
-5.0%
0.0%
5.0%
10.0%
TV GV HC PA CO SN
Hadley 2080 A250-7525-500-25
-2.0%
0.0%
2.0%
4.0%
6.0%
TV GV HC PA CO SN
Hadley 2080 B250-7525-500-25
Oppositely, SOC increases are still expected in the 0-25 cm section and to a more extent in the 50-75 cm section, particularly evident in the vineyards.
CarboSOIL application in agro-silvo-pastoral Mediterranean management systems
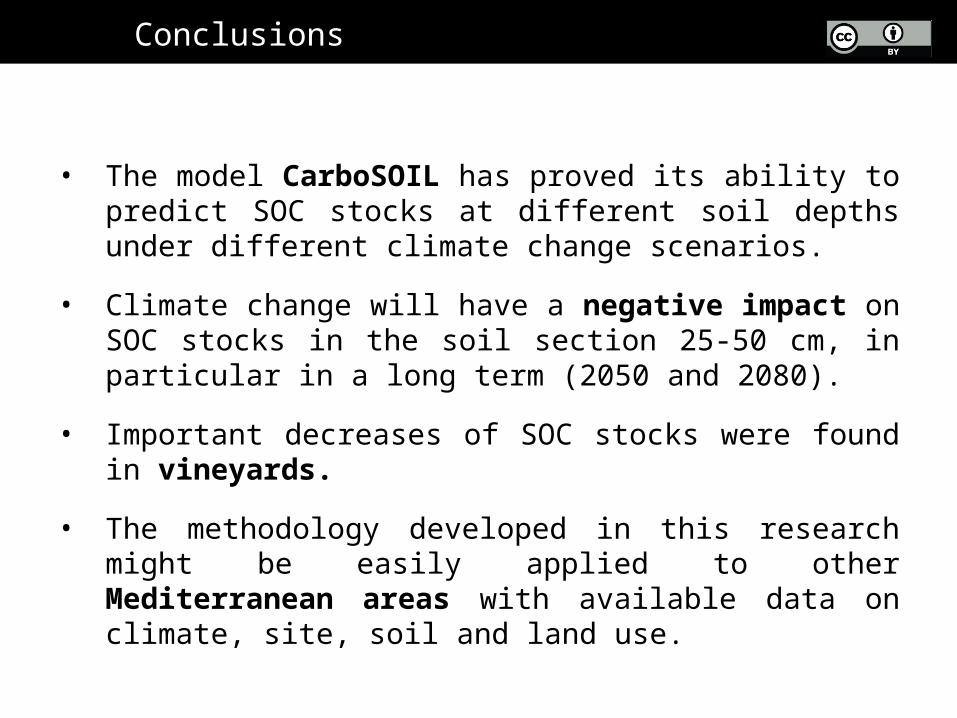
• The model CarboSOIL has proved its ability to predict SOC stocks at different soil depths under different climate change scenarios.
• Climate change will have a negative impact on SOC stocks in the soil section 25-50 cm, in particular in a long term (2050 and 2080).
• Important decreases of SOC stocks were found in vineyards.
• The methodology developed in this research might be easily applied to other Mediterranean areas with available data on climate, site, soil and land use.
Conclusions

Miriam Muñoz-Rojas , Luca Doro, Luigi Ledda, and Rosa Francaviglia
M ED_SoilResearch Group
Thank you!
Top Related
Copyright © 2022 FDOKUMEN

