Biomedical Applications in Tropical Pasture and Agro-pastoral ...
178
Biomedical Applications in Tropical Pastureand Agro-pastoral Research Maria Cristina Amezquita
-
Upload
khangminh22 -
Category
Documents
-
view
3 -
download
0
Transcript of Biomedical Applications in Tropical Pasture and Agro-pastoral ...
Biomedical Applications in Tropical Pasture and Agro-pastoral
Research
Maria Cristina Amezquita
Promotoren: Prof. dr. ir. Leendert 't Mannetje Hoogleraar in de Graslandkunde
Prof. dr. Paul van der Laan Hoogleraar in Statistiek Technische Universiteit Eindhoven
Co-promotor: Dr. ir. L. Rob Verdooren Universitair Hoofddocent Statistische Proeftechniek
Samenstelling Promotiecommissie: Prof. dr. R. Schulze-Kraft (Universitat Hohenheim, Duitsland)
Prof. dr. J. Grasman (Wageningen Universiteit) Dr. ir. J. B. Schiere (Wageningen Universiteit) Dr. ir. A. Elgersma (Wageningen Universiteit)
^10 OS k2C\, r i q
Biometrical Applications in Tropical Pasture and Agro-pastoral
Research
Maria Cristina Amezquita
Proefschrift
ter verkrijging van de graad van doctor op gezag van de Rector Magnificus van Wageningen Universiteit Prof. dr. ir. L. Speelman, in het openbaar te verdedigen op woensdag 7 maart 2001 des namiddags om vier uur in de Aula
b o o » O '-\
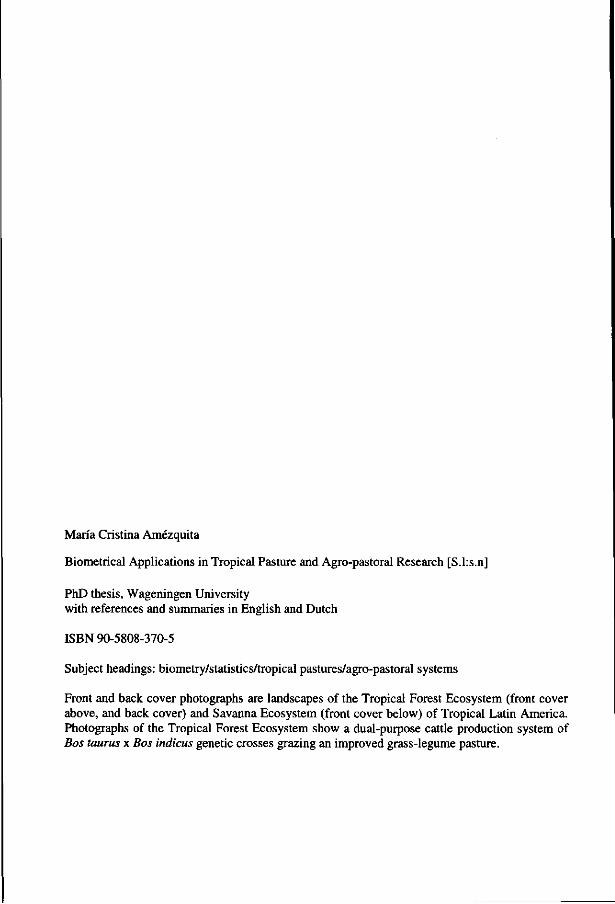
Maria Cristina Amezquita
Biometrical Applications in Tropical Pasture and Agro-pastoral Research [S.lrs.n]
PhD thesis, Wageningen University
with references and summaries in English and Dutch
ISBN 90-5808-370-5
Subject headings: biometry/statistics/tropical pastures/agro-pastoral systems
Front and back cover photographs are landscapes of the Tropical Forest Ecosystem (front cover above, and back cover) and Savanna Ecosystem (front cover below) of Tropical Latin America. Photographs of the Tropical Forest Ecosystem show a dual-purpose cattle production system of Bos taurus x Bos indicus genetic crosses grazing an improved grass-legume pasture.
/ J A J o f ? ^ , ^ ^
Propositions
1. The biometrician plays a role of vital importance in the successful achievement of the objectives of agricultural research: improvement of agricultural technology, methodology for research conduct and improved scientific information for future decision-making. This thesis.
2. The search for balance between theory and field work, and a permanent and fruitful biometrician-researcher communication are key elements of success of an agricultural research project. It is important to keep in mind that "it is better to have an approximate solution to the right problem than to have an exact solution to the wrong one". Mosteller, F. andTukey, J. W., 1988. Frederick Hosteller and John W. Tukey: A Conversation. Moderated by Francis J. Anscombe. Statistical Science, Vol. 3, No.l, 136-144. This thesis.
3. Change-over designs have proven useful for the short-term evaluation of milk production of dual-purpose production systems in the Latin American tropics. Amezquita, M. C, 1993. Diseho y Andlisis de Ensayos para Evaluacion de Pasturas en Fincas. In: Argel, P.; Durdn, C. V. and Franco, L.H., (eds.). Planeacion y Conduccion de Ensayos de Evaluacion de Gramlneas y Leguminosas Forrajeras en Fincas. Documento de Trabajo No. 133. 23-37. Centro lnternacional de Agricultura Tropical (C1AT) y Red lnternacional de Evaluacion de Pasturas Tropicales (RIEPT). 340 pp. Lascano, C. E.; Avila, P.; Amezquita, M. C. and Ramirez, G., 1997. Fuentes de variacion en la Produccion y Composicion de leche de vacas en un sistema de pastoreo secuencial. In: Lascano, C.E. and Holmann, F. (eds.). Conceptos y Metodologias de Investigacion en Fincas con Sistemas de Produccion Animal de Doble Proposito. 3-14. CIAT-TROPILECHE. Book series ISBN 958-9439-93-4, 285 pp. This thesis.
4. The power of on-farm experimentation lies in its extrapolation capacity, as it uses the farm, a random factor, to test on real grounds research results obtained at the experimental station as well as new ideas, resources or management options. Lascano, C. E. and Holmann, F. (eds.), 1997. Conceptos y Metodologias de Investigacion en Fincas con Sistemas de Produccion Animal de Doble Proposito. CIAT-TROPILECHE. Book series ISBN 958-9439-93-4, 285 pp. This thesis.
5. The search for sustainable development, i.e., "the right balance between economic benefit, eco-efficiency and social welfare" (Republic of Colombia's 1991 Constitution) has become a basic principle for research on tropical pastures and agro-pastoral systems in Tropical Latin America in the last two decades. Toledo, J. M., 1985. Pasture development for cattle production in the major ecosystems of the tropical American lowlands. Proceedings of the XV International Grasslands Congress. 74-81. Kyoto, Japan. Zeigler, R.S. and Toledo, J.M., 1993. Developing sustainable agricultural production systems for the acid soil savannas of Latin America. In: Paoletti, M.G.; Napier, T; Ferro, O.; Stinner, B. and Stinner, D. (eds.). Socioeconomic and policy issues for sustainable farming systems. 103-116. Coop. Amicizia sre. Padova, Italia.
The U.S.A. recommendation to the Colombian Government is to control cocaine production by applying the fungus Fusarium oxysporum f. sp. erythroxyli. The television declaration of the Colombian Minister of the Environment in Bogota, Colombia, August 2000, stating that this practice can cause serious environmental problems, is right.
Development is associated with means and variances. Developed countries have high (income/capita) means with relatively small or medium variation; developing countries, such as some Latin American countries, have medium means with very high variation; and poorly developed countries have low means with extremely high variation. The high variation causes social unrest. " Madagascar Agricultural Research Mission". World Bank Report. Antananarivo, 1990.
The success and happiness of a woman today can be achieved through balance between the needs of her mind (intellectual challenges), her heart (love, art, sharing) and her body (physical activity). The secret lies in accepting our imperfections, being content with life and always thankful to God.
Propositions belonging to the PhD thesis of Maria Cristina Amezquita, Biometrical Applications in Tropical Pasture and Agro-pastoral Research. Wageningen, 7 March 2001.
Biometrical Applications in Tropical Pasture and Agro-pastoral Research
Abstract
"Biometrical Applications in Tropical Pasture and Agro-pastoral Research" illustrates, through selected Case Studies, the contribution of Biometry to pasture and agro-pastoral research in Tropical Latin America (TLA) in the last two decades. Its contribution is represented in research concepts, methodology, and practical research results that help increase land and animal productivity, human welfare, and efficient conservation and management of natural resources.
The selected Case Studies were conducted in various countries of TLA, on the two major ecosystems of the lowland tropics: the Savanna Ecosystem, with 250 million ha, and the Tropical Forest Ecosystem, with 44 million ha. Each Case Study was part of the research agenda and strategy of CIAT (Centro Internacional de Agricultura Tropical, or International Centre for Tropical Agriculture, based in Cali, Colombia), the RIEPT (Red Internacional de Evaluation de Pasturas Tropicales, or International Network for Tropical Pastures Evaluation), the Agro-pastoral Research Network for the Savanna Ecosystem of Tropical America, and pasture and agro-pastoral research programs from Latin American National Agricultural Research and Development Institutions. Each Case Study aimed at solving concrete research problems of pasture and agro-pastoral research in TLA and has been published in relevant scientific media, especially in those addressing needs of Latin American researchers.
The different Case Studies (presented in chapters 3 to 9) show a "gradient" in research scale: — from controlled, small-plot, multilocational agronomic research conducted at the Experiment Station to characterise and evaluate a large number of forage grass and legume ecotypes, to medium-size grazing experiments conducted to evaluate a smaller number of pastures (grass-alone or grass-legume associations) both at the Experiment Station and at the farm, ending with agro-pastoral experiments aimed at integrating research findings from the two previous research phases into economically attractive pasture-crop production systems—. Chapter 2 is of a conceptual nature. It summarises the role of Biometry in pasture and agro-pastoral research. The last chapter (chapter 10) deals with organisation and resources of Biometry Units in Latin American Agricultural Research Institutions and offers practical recommendations concerning the desired role of the biometrician as a true partner in research teams.
Chapter 3 illustrates the selection process for promising forage grass and legume ecotypes and identifies promising material. Chapter 4 defines "adaptation niches" for an important pasture cultivar identified as promising by the previous case study: the legume Stylosanth.es guianensis 184. Chapter 5 presents concepts and methods for the planning, design and analysis of grazing experiments, with emphasis on continuous designs for evaluating beef production. Chapters 6 and 7 present concepts, methods and research solutions concerning the design and analysis of milk and dual-purpose production experiments using Bos taurus and Bos taurus x Bos indicus cows, of different genetic levels, both at the Experiment Station and at the farm. Chapters 8 and 9 discuss concepts, methodology and research results concerning the planning, design and analysis of agro-pastoral experiments for the Savanna Ecosystem of TLA.
Biometrical Applications in Tropical Pasture and Agro-pastoral Research
Acknowledgements
To Professor Dr. Paul van der Laan, of Eindhoven University of Technology, and to Professor Dr. Leendert 't Mannetje and Dr. Rob Verdooren, of Wageningen University, for encouraging me and for supervising the completion of this dissertation.
To the memory of my very dear friends and colleagues Dr. Gustavo Nores, CIAT's former Director General, and Dr. Jose M. Toledo, former Leader of CIAT's Tropical Pastures Program, who offered me the institutional support and motivation to undertake this challenge.
To my dear friends and colleagues Dr. Aart van Schoonhoven, CIAT's Director for Research in Genetic Resources, and Dr. Carlos E. Lascano, Leader of CIAT's Tropical Forages Project.
To my colleagues and friends from CIAT and the National Agricultural Research Institutions of Latin America, co-authors on various chapters of this dissertation.
To Mr. Jan Weijenberg, Principal Agriculturist, World Bank, Washington, and Mission Leader of the Madagascar Agricultural Research Mission and Mali Agricultural Research Mission, under whose leadership I had the privilege to work and contribute as a Consultant in the area of "Research Quality".
To Benjamfn, Juan David and Viviana, who always let me "dream what I dared to dream, go where I wanted to go and be what I wanted to be".
1 thank you all.
Biometrical Applications in Tropical Pasture and Agro-pastoral Research
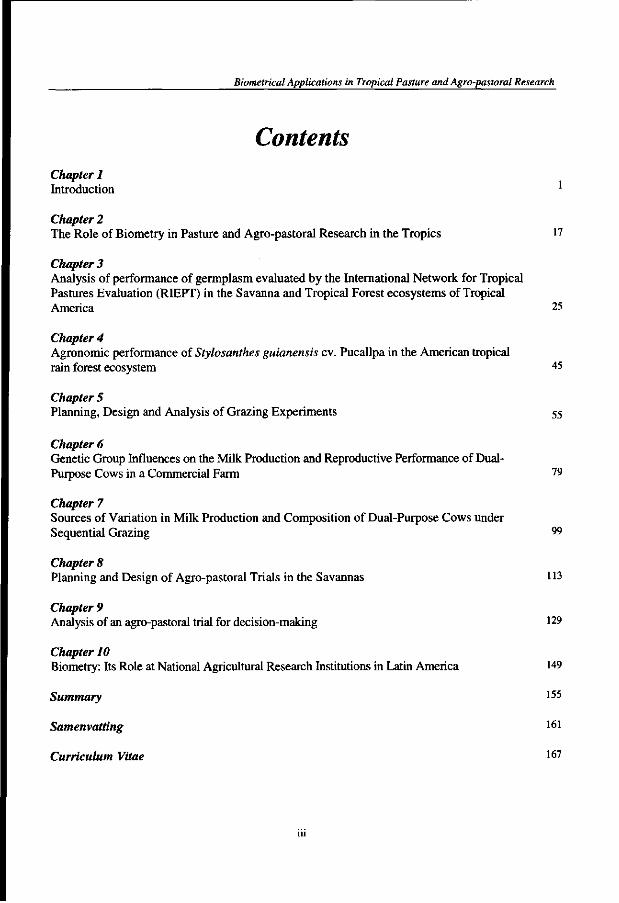
Contents Chapter 1 Introduction
Chapter 2 The Role of Biometry in Pasture and Agro-pastoral Research in the Tropics 17
Chapter 3 Analysis of performance of germplasm evaluated by the International Network for Tropical Pastures Evaluation (RIEPT) in the Savanna and Tropical Forest ecosystems of Tropical America 25
Chapter 4 Agronomic performance of Stylosanthes guianensis cv. Pucallpa in the American tropical rain forest ecosystem 4 5
Chapter 5 Planning, Design and Analysis of Grazing Experiments 55
Chapter 6 Genetic Group Influences on the Milk Production and Reproductive Performance of Dual-Purpose Cows in a Commercial Farm 79
Chapter 7 Sources of Variation in Milk Production and Composition of Dual-Purpose Cows under Sequential Grazing 99
Chapter 8 Planning and Design of Agro-pastoral Trials in the Savannas 113
Chapter 9 Analysis of an agro-pastoral trial for decision-making I29
Chapter 10
Biometry: Its Role at National Agricultural Research Institutions in Latin America 149
Summary I55
Samenvatting 161
Curriculum Vitae i 6 7

Biometrical Applications in Tropical Pasture and Agro-pastoral Research
Introduction
Chapter 1
Introduction Maria Cristina Amezquita
Goal of this Dissertation
The goal of this dissertation is to illustrate, through selected Case Studies, the contribution of Biometry to pasture and agro-pastoral research in Tropical Latin America (TLA) in the last two decades. Its contribution is represented in research concepts, research methodology, and practical research results, aimed at increasing land and animal productivity, improved human welfare, and efficient conservation and management of the natural resource base of our continent.
The selected Case Studies were conducted in various countries of Latin America (LA), on the two major ecosystems of lowland TLA: the Savanna Ecosystem, with 250 million ha, and the Tropical Forest Ecosystem, with 44 million ha, representing 14.8% and 2.6%, respectively, of the total continental area of TLA. Each Case Study was part of the research agenda and strategy of CIAT (Centro Internacional de Agricultura Tropical, or International Centre for Tropical Agriculture, based in Cali, Colombia), the RIEPT1 (Red Internacional de Evaluation de Pasturas Tropicales, or International Network for Tropical Pastures Evaluation), the Agro-pastoral Research Network for the Savanna Ecosystem of Tropical America2, and pasture and agro-pastoral research programs from Latin American National Agricultural Research and Development Institutions (NARDI's).
Although statistical methods used are well-known methods, the various Case Studies have produced concepts, methodology and research results that represented practical and timely solutions to the existing problems of pasture and agro-pastoral research in TLA's lowlands.
1 RIEPT is a multi-institutional research network co-ordinated by CIAT with participation of all LA tropical pastures research programs, which combined international and national efforts to screen germplasm, evaluate pastures in successive research phases, and achieve important economies of scale by efficient exchange of knowledge and technology (Toledo, 1985). It was in operation between 1979 and 1994.
2 The "Agro-pastoral Research Network for the Savanna Ecosystem of Tropical America" is a new research network, formed in 1995 and co-ordinated by CIAT, combining national and international efforts and financial support from research institutions working on agro-pastoral research in TLA's savannas. Member countries include Bolivia, Brazil, Colombia, Guyana and Venezuela. Its objective is the integration of pastures and crops best adapted to acid and infertile savanna soils into economically attractive and environmentally sustainable agro-pastoral production systems (Sarkarung and Zeigler, 1989; Toledo et al., 1989; Zeigler and Toledo, 1993).
Biometrical Applications in Tropical Pasture and Agro-pastoral Research
Each Case Study has been published in relevant scientific media, especially in those addressing needs of LA researchers. The different Case Studies are applications of Biometry, carried out by a biometrician, aimed at solving concrete research problems of pasture and agro-pastoral research in TLA.
The definitions of Biometry and biometrician follow:
Biometry is the science that applies mathematics, statistics and statistical computing, to the description, analysis and understanding of live processes, random by nature. Biometry is, in summary, the application of the quantitative thinking to a better understanding of nature.
A biometrician is a statistician, mathematician or biologist, who besides having good knowledge on quantitative methods and tools applicable to the study of live processes, has also a clear understanding of the biological problem under consideration, balance between theory and field work, genuine interest to learn from other disciplines, and good communication with the biological research community. His or her success lies on the complementarity between these principles.
The different Case Studies (presented in chapters 3 to 9) were selected to show a "gradient" in research scale: —from controlled, small-plot, multilocational agronomic research conducted at the Experiment Station to characterise and evaluate a large number of forage grass and legume ecotypes, to medium-size grazing experiments conducted to evaluate a smaller number of pastures (grass-alone or grass-legume associations) both at the Experiment Station and at the farm, ending with agro-pastoral experiments aimed at integrating research findings from the two previous research phases into economically attractive pasture-crop production systems—. The Case Studies are organised according to successive research phases of pasture and agro-pastoral research for TLA. They are grouped, therefore, in three main research topics: (1) Agronomic characterisation, evaluation and selection of forage germplasm (chapters 3 and 4); (2) Grazing experiments for beef and dual-purpose cattle production (chapters 5, 6 and 7); and (3) Methodological aspects of agro-pastoral research (chapters 8 and 9). Each illustrates a real research problem that has been solved by applying biometrical rationale and methods.
Chapter 2 is of a conceptual nature. It summarises the role of Biometry in pasture and agro-pastoral research.
The last chapter (chapter 10) deals with organisation and resources of Biometry Units and groups in LA Agricultural Research Institutions and offers practical recommendations concerning the desired role of the biometrician as a partner in research teams.
As a frame of reference, and for a better understanding of this dissertation, a background on TLA during the last two decades is now given: resources, development statistics, pasture and agro-pastoral research needs, strategies and impact.
Introduction
Background
Tropical Latin America: Population, Land Resources, Agricultural and Livestock Production.
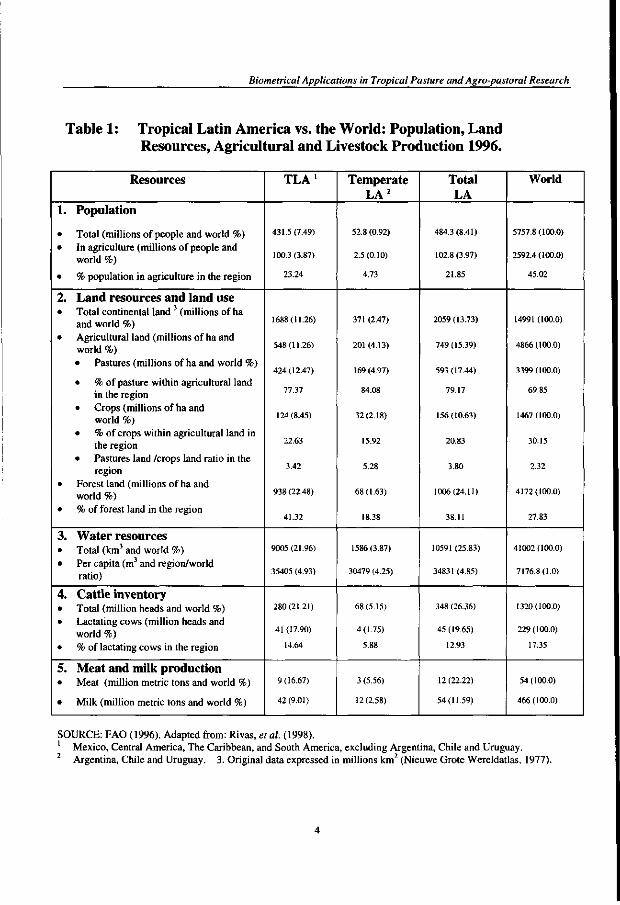
TLA comprises Mexico, Central America, The Caribbean, and South America, excluding Argentina, Chile and Uruguay. It covers 1688 million ha representing 11.26% of the world continental area, and houses 431.5 million people representing 7.49% of the total world population (FAO, 1996). Its agricultural land is represented by 548 million ha corresponding to 32.46% of its territory and to 11.26% of the world agricultural land. Out of its 431.5 million inhabitants, 100.3 millions (23.24%) are farmers, who live from agricultural and livestock production activities. They represent 3.87% of the world population in agriculture. Agricultural land includes crop, pasture (both native and introduced pastures) and agro-pastoral land. Pasture and agro-pastoral land represent 77.37% of total agricultural land, while crops cover the remaining 22.63%, with a pastures/crop land ratio of 3.42, higher than the world ratio, of 2.32 (FAO, 1996; Table 1).
Forest land is not considered part of TLA's agricultural land. It covers 41.32% of its territory —a very high proportion compared with the world proportion in forest land (27.83%)— and represents 22.48% of the world forest area. Consequently, water renewable resources in the region are generous, representing 21.96% of the world water resources, a similar proportion to that corresponding to forest resources. Water resources per capita in TLA (35405 m3) are almost 5 times the corresponding world average, of 7176 m3 (FAO, 1996; Table 1).
TLA holds 21.21% of the world's cattle inventory and 17.90% of the world's inventory of lactating cows (FAO, 1996). The latter represents 14.64% of the total cattle inventory in the region, a value close to the world proportion of lactating cows (17.35%). However, soil and pasture quality in the predominant pasture and agro-pastoral land in the region are low (Toledo, 1985). Levels of meat and milk production in the region (of 9 and 42 million metric tons, respectively) are relatively low compared to world averages, representing 16.67% and 9.01%, respectively, of the total world production of meat and milk (FAO, 1996; Table 1).
Extensive grazing systems for beef cattle on native savanna grasslands with low productivity are predominant in the Savanna Ecosystem. Semi-intensive grazing systems for dual-purpose cattle are predominant in the Tropical Forest Ecosystem. The latter accounts for 78% of the meat and 41% of the milk produced in TLA. In these production systems, the largest source of animal nutrition comes from native or introduced grass pastures, which often present limited quantities and quality of biomass, especially during the dry season, both in savannas and semi-evergreen tropical forest. As a result, recovered milk production in dual-purpose systems (2 to 4 litres/cow per day) and reproductive efficiency (50%-60%) of the herds are low (Lascano et al., 1997).
Biometrical Applications in Tropical Pasture and Agro-pastoral Research
Table 1: Tropical Latin America vs. the World: Population, Land Resources, Agricultural and Livestock Production 1996.
Resources
1. Population
• Total (millions of people and world %) • In agriculture (millions of people and
world %)
• % population in agriculture in the region
2. Land resources and land use • Total continental land 3 (millions of ha
and world %) • Agricultural land (millions of ha and
world %) • Pastures (millions of ha and world %)
• % of pasture within agricultural land in the region
• Crops (millions of ha and world %)
• % of crops within agricultural land in the region
• Pastures land /crops land ratio in the region
• Forest land (millions of ha and world %)
• % of forest land in the region
3. Water resources • Total (km3 and world %) • Per capita (m3 and region/world
ratio)
4. Cattle inventory • Total (million heads and world %) • Lactating cows (million heads and
world %) • % of lactating cows in the region
5. Meat and milk production • Meat (million metric tons and world %)
• Milk (million metric tons and world %)
TLA1
431.5(7.49)
100.3 (3.87)
23.24
1688(11.26)
548(11.26)
424(12.47)
77.37
124(8.45)
22.63
3.42
938 (22.48)
41.32
9005(21.96)
35405 (4.93)
280(21.21)
41 (17.90)
14.64
9(16.67)
42(9.01)
Temperate LA2
52.8 (0.92)
2.5(0.10)
4.73
371 (2.47)
201 (4.13)
169(4.97)
84.08
32(2.18)
15.92
5.28
68(1.63)
18.38
1586(3.87)
30479 (4.25)
68(5.15)
4(1.75)
5.88
3 (5.56)
12(2.58)
Total LA
484.3 (8.41)
102.8(3.97)
21.85
2059(13.73)
749(15.39)
593(17.44)
79.17
156(10.63)
20.83
3.80
1006(24.11)
38.11
10591 (25.83)
34831(4.85)
348 (26.36)
45(19.65)
12.93
12(22.22)
54(11.59)
World
5757.8 (100.0)
2592.4(100.0)
45.02
14991 (100.0)
4866(100.0)
3399(100.0)
69.85
1467 (100.0)
30.15
2.32
4172(100.0)
27.83
41002(100.0)
7176.8(1.0)
1320(100.0)
229(100.0)
17.35
54(100.0)
466(100.0)
SOURCE: FAO (1996). Adapted from: Rivas, etal. (1998). 1 Mexico, Central America, The Caribbean, and South America, excluding Argentina, Chile and Uruguay. 2 Argentina, Chile and Uruguay. 3. Original data expressed in millions km2 (Nieuwe Grote Wereldatlas, 1977).
Introduction
The relatively low cost of the beef and milk produced from such systems has led them to become important components in the diet of most tropical Latin Americans (Toledo, 1985). Beef consumption in TLA ranges from 7 to 38 kg/capita/year, while in other tropical regions of the world it ranges from 0.7 to 2.6 kg/capita/year (Southeast Asia) and from 3.6 to 9.6 kg/capita/year (tropical Africa) (Valdes and Nores, 1979). The proportion of a family expenditure in milk and meat is high in most LA cities, even among the poor, ranging from 12.4%-26.0% for beef and from 7.0%-13.0% for milk and dairy products in the lowest income quartile (Rubinstein and Nores, 1980). High income elasticity for beef and dairy products throughout LA at all income levels has been documented (Sanint et ai, 1984). Increase in supply of meat and milk will benefit the poor (Toledo, 1985). However, as a result of population and income growth in the last two decades, demand for beef and milk has been growing at a higher rate than supply, causing an increase in consumer prices which affected the welfare and nutrition of the poor and an increase in imports of dairy products. Beef and milk in TLA have important socio-economic significance. Price increases cause increased inflation rates and social unrest (Toledo, 1985).
Pasture and agro-pastoral land, as well as meat and milk production, are concentrated in four countries: Brazil, Mexico, Colombia and Venezuela. They together hold 76% of the pasture and agro-pastoral land, 84% of total cattle inventory, 85% and 83%, respectively, of meat and milk production of TLA (Rivas et al., 1998). The two major ecosystems where meat and milk is produced are the Savanna Ecosystem (250 million ha, 243 of them in the above countries), and the Tropical Forest Ecosystem (with near to 44 million ha, almost all in those four countries) (Vera etal, 1993).
In summary, according to FAO (1996), TLA holds 7.49% of the world's population, 11.26% of the world's continental area, 12.47% of the world's pasture and agro-pastoral land, 22.48% and 21.96%, respectively, of the world's forest and water resources. The region is still underpopulated compared to world average. Its availability of agricultural land is still balanced with its agricultural population. The magnitude of its natural resources, specially forest and water, the high proportion of pasture and agro-pastoral land available in the region, together with the region's potential to increase its production levels, both in volume and value, constitute the basis for its socio-economic importance. The relatively low actual levels of meat and milk production, in spite of the high proportion of available pasture and agro-pastoral land, constitute a challenge for TLA's countries. They need to increase economic development, employment rates and human welfare through increasing pasture and agro-pastoral systems productivity of meat and milk to become competitive both in local and export markets.
Latin America economic development in the last two decades
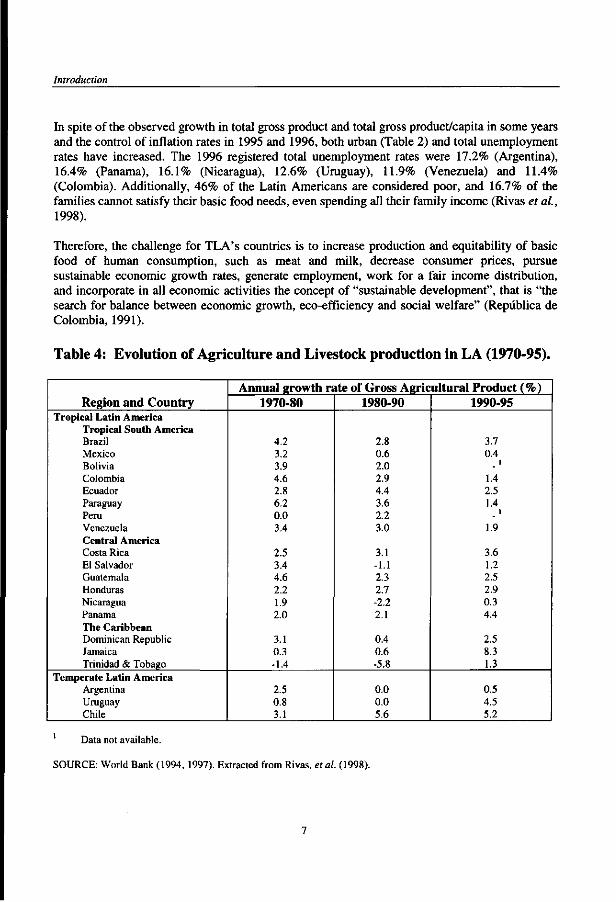
Table 2 shows annual growth rates of four basic indicators of economic development during 1980-1996: gross product, gross product/capita, urban unemployment and inflation. Table 3 shows mean annual growth of the gross product/capita in LA as compared to industrialised countries during a 34-year period (1960-1994). Table 4 shows the annual growth rate of the gross agricultural product per country, both for TLA and temperate LA during a 25-year period (1970-1995).

Biometrical Applications in Tropical Pasture and Agro-pastoral Research
LA's economic development in the last two decades does not show a clear trend. The region is in a transformation process, presenting very low (or negative) annual growth rates of the gross product and gross product/capita in 1980-1990, followed by a recovery period that reached its peak in 1994, followed in turn by a drastic decline in 1995 (Table 2). During the mid 90's LA emerged as a region of important economic growth only exceeded by East Asia and the Pacific Block (Rivas et al., 1998). When compared to industrialised countries, LA shows similar annual growth rates for the gross product/capita during the period 1960-1981, followed, however, by a much lower (negative) growth rates during 1982-1990, and a recovery period during 1991-1994 (IDB, 1997; Table 3). Economic growth is expected to increase in the beginning of the new millennium (World Bank, 1997). Evolution of annual growth rates of the gross agricultural product in a 25-year period, 1970-1995, varies notably between TLA countries. Most of them show a decrease in annual growth rates in time, with exception of Brazil, Costa Rica, Honduras, Panama and Jamaica (Table 4). It is important to emphasise that meat and milk production generates approximately 20% of the agricultural product of TLA countries (Rivas et al., 1998).
Table 2: Latin America Economic Development in the last two decades: Basic Indicators 1980-1996.
Period
1980-1989 1990 1991 1992 1993 1994 1995 1996
Annual growth rates {%) Total Gross
Product 0.9 ' -0.3 3.2 2.6 3.8 5.3 0.3 3.4
Total Gross Product Urban per capita unemployment
- i . r 6.22
-2.2 5.8 1.3 5.8 0.8 6.2 2.0 6.2 3.5 6.3 -1.3 7.1 1.7 8.0
Inflation
388.4 ' 1209.7 200.8 420.8 887.4 337.4 25.6 19.3
SOURCE: CEPAL (1996). Extracted from Rivas, et al. (1998). 1 Correspond to the average of annual rates for the period 1980-1989. 2 Corresponds to 1980 rate.
Table 3: Growth of the gross product per capita in Latin America as compared to industrialised countries 1960-1994.
Region
Latin America Industrialised countries
Annual growth rate (%) 1960-71
3.0 3.1
1972-81 1982-90 2.1 -0.8 2.0 2.7
1991-94 1.8
0.7
SOURCE: IDB (1997).
Introduction
In spite of the observed growth in total gross product and total gross product/capita in some years and the control of inflation rates in 1995 and 1996, both urban (Table 2) and total unemployment rates have increased. The 1996 registered total unemployment rates were 17.2% (Argentina), 16.4% (Panama), 16.1% (Nicaragua), 12.6% (Uruguay), 11.9% (Venezuela) and 11.4% (Colombia). Additionally, 46% of the Latin Americans are considered poor, and 16.7% of the families cannot satisfy their basic food needs, even spending all their family income (Rivas et al., 1998).
Therefore, the challenge for TLA's countries is to increase production and equitability of basic food of human consumption, such as meat and milk, decrease consumer prices, pursue sustainable economic growth rates, generate employment, work for a fair income distribution, and incorporate in all economic activities the concept of "sustainable development", that is "the search for balance between economic growth, eco-efficiency and social welfare" (Repiiblica de Colombia, 1991).
Table 4: Evolution of Agriculture and Livestock production in LA (1970-95).
Region and Country Tropical Latin America
Tropical South America Brazil Mexico Bolivia Colombia Ecuador Paraguay Peru Venezuela Central America Costa Rica El Salvador Guatemala Honduras Nicaragua Panama The Caribbean Dominican Republic Jamaica Trinidad & Tobago
Temperate Latin America Argentina Uruguay Chile
Annual growth rate of Gross Agricultural Product (%) 1970-80
4.2 3.2 3.9 4.6 2.8 6.2 0.0 3.4
2.5 3.4 4.6 2.2 1.9 2.0
3.1 0.3 -1.4
2.5 0.8 3.1
1980-90
2.8 0.6 2.0 2.9 4.4 3.6 2.2 3.0
3.1 -1.1 2.3 2.7 -2.2 2.1
0.4 0.6 -5.8
0.0 0.0 5.6
1990-95
3.7 0.4
I
1.4 2.5 1.4
I
1.9
3.6 1.2 2.5 2.9 0.3 4.4
2.5 8.3 1.3
0.5 4.5 5.2
Data not available.
SOURCE: World Bank (1994, 1997). Extracted from Rivas, et al. (1998).
Biometrical Applications in Tropical Pasture and Agro-pastoral Research
Constraints to improved and sustainable meat and milk production.
Major constraints to pasture and agro-pastoral systems development in TLA's lowlands, and therefore, to improved and sustainable meat and milk production, are: (a) the predominance of acid and infertile soils where native grasslands of low nutritional quality occur, causing these vast land resources to be under-utilised; (b) the lack of adaptation to these acid and infertile soils, or lack of tolerance to biotic stresses, of commercial cultivars of tropical pastures selected in other continents; (c) the high diversity in ecosystems, farming systems and germplasm/parasite interactions which requires different kinds of adapted pastures and crops playing several roles at the farm level; (d) lack of efficient and sustainable use of existing or improved animal genetics; (e) lack of use of improved management practices at the farm, in terms of farm administration, pasture and animal management; (f) high fluctuations in the product-input price ratio (the product's price refers to price of meat and milk, and the input price refers to prices of land, labour, fertilisers, seeds, mineral salt, drugs, machinery, etc); (g) limited country infrastructure and difficult access to markets for meat and milk products (CIAT, 1976-1996; Toledo, 1985; Quinones, 1995).
Pasture and Agro-pastoral Research in Tropical Latin America: Strategy and Impact (1980-1999).
International and national research in tropical pasture and agro-pastoral systems for TLA in the last 30 years has been led by CIAT and by the National Agricultural Research and Development Institutions (NARDI's) from each country. They led a demand-driven problem-solving research agenda, aimed at increased land and animal productivity, improved socio-economic conditions of the population, especially the poor, improved human welfare, and efficient conservation, management and use of the natural resource base of our continent (CIAT 1976-1996; Toledo et al., 1989; Zeigler and Toledo, 1993; Thomas, 1999). Research strategy is based on the following principles: (1) germplasm base development; (2) low-input technology; (3) use of improved pasture and agro-pastoral technology in farm systems; and (4) networking approach (Toledo, 1985). Research has focussed on the two major ecosystems of TLA: Savanna and Tropical Forest.
To solve the wide and heterogeneous range of land production and environmental problems of these ecosystems, there was a need to widen the genetic base of species identified as promising and also explore the production potential of new unknown species. Research for each ecosystem followed successive stages: germplasm collection, creation and maintenance of germplasm banks, germplasm evaluation and selection (for edaphic and biotic adaptation, agronomic production, compatibility and productivity in grass-legume associations, performance under grazing, beef and milk production potential, and finally, evaluation under commercial production in pasture farms and agro-pastoral systems). The final research product being a new improved cultivar together with its improved management technology, or a new improved production system, adopted by farmers. Once an improved cultivar was released for commercial use, socio-
Introduction
economic research was (and is at present) carried out to quantify the adoption rate and beneficial impact of the new technology (CIAT 1976-1996; CIAT 1994 and 1997-1999).
Network approach
The International Network for Tropical Pastures Evaluation (RIEPT)
National and international tropical pasture research programs formed in 1979 the RIEPT, a multi-institutional, inter-disciplinary, co-operative research network to screen germplasm, evaluate pastures in successive research phases, and achieve important economies of scale by efficient exchange of knowledge and technology. This new approach combined basic and applied research through a clearly defined strategy to solve the complex physical, biological and socioeconomic problems of cattle production in TLA (Toledo, 1985). The RIEPT was co-ordinated by CIAT, who was responsible for research leadership and information management. All TLA countries participated in this research Network. RIEPT was in operation between 1979 and 1994.
RIEPT was designed to evaluate, in a wide range of environments, a wide range of forage grass and legume material, initially for their adaptation and biomass production, through its Regional Trials A (adaptation evaluation) and B (biomass production evaluation), followed by evaluations on their animal production potential when associated in grass-legume pastures under grazing, through its Regional Trials C (grazing pressure evaluation) and D (meat and milk production evaluation). The RIEPT trials covered all major ecosystems of the American tropics, namely the isothermic well-drained savannas, the isohyperthermic well-drained savannas, the poorly drained savannas, the tropical humid forests, and the seasonal tropical forests (Cochrane, 1982; Cochrane et al., 1985). Regional Trials A and B were designed as a series of agronomic small-plot multilocational experiments, with the same experimental design per location, established to independently evaluate grass and legume ecotypes in a wide range of locations within the five different ecosystems of TLA described before, in two contrasting seasonal periods (maximum and minimum rainfall conditions). Regional Trials C and D were designed as a series of grazing trials established across multiple locations within the major ecosystems, with different experimental design per location, to respond to specific needs of the region and animal production systems.
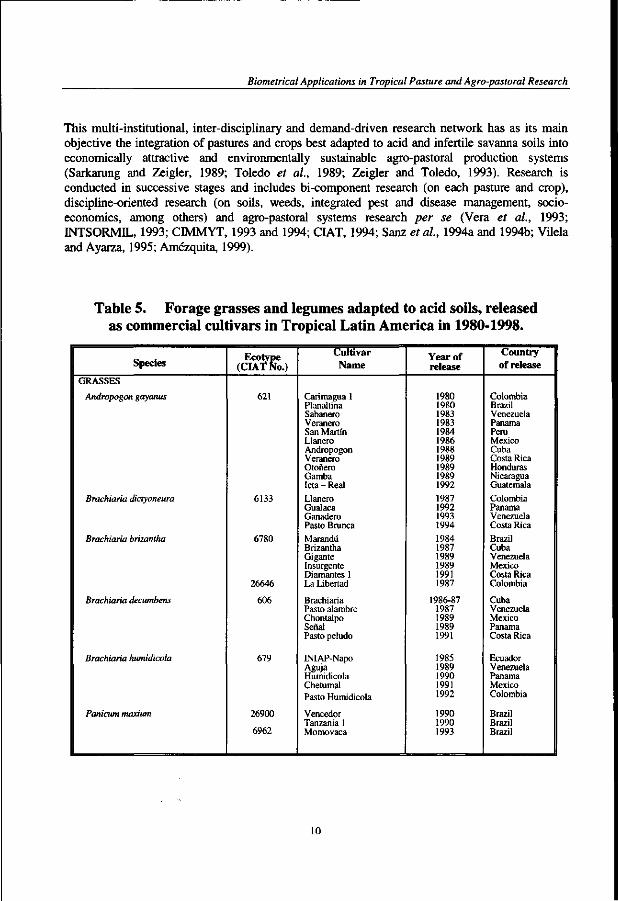
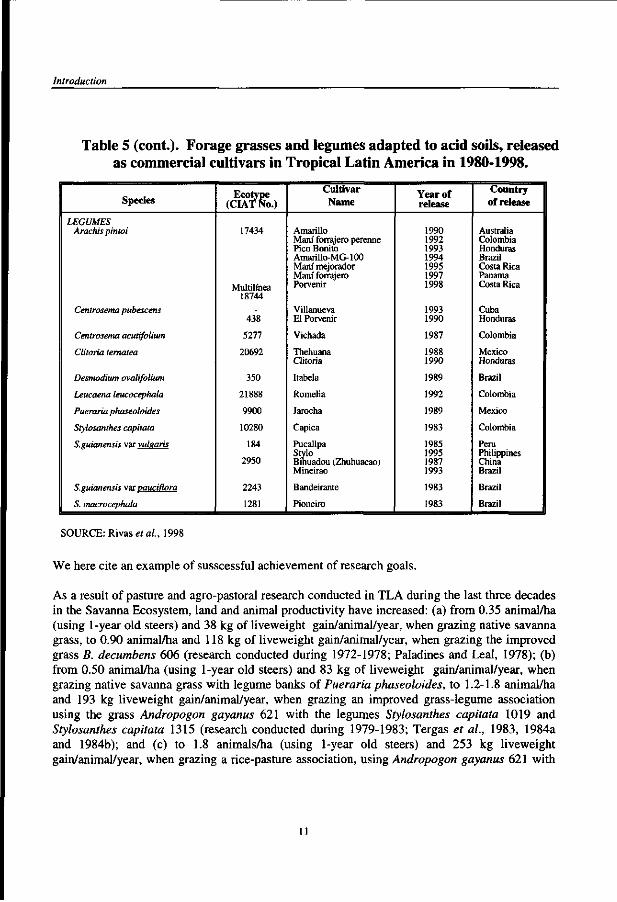
Table 5 shows the list of improved cultivars of forage grasses and legumes released as commercial cultivars in the last two decades (period 1980-1998) as a result of RIEPT research. They have been adopted for commercial use by the various countries.
The Agro-pastoral Research Network for the Savanna Ecosystem
A new research network was formed in 1995, "The Agro-pastoral Research Network for the Savanna Ecosystem of Tropical America", also combining national and international efforts and financial support from research institutions working on agro-pastoral research in savannas. Member institutions included the NARDI's from Bolivia, Brazil, Colombia, Guyana and Venezuela, and CIAT.
Biometrical Applications in Tropical Pasture and Agro-pastoral Research
This multi-institutional, inter-disciplinary and demand-driven research network has as its main objective the integration of pastures and crops best adapted to acid and infertile savanna soils into economically attractive and environmentally sustainable agro-pastoral production systems (Sarkarung and Zeigler, 1989; Toledo et al, 1989; Zeigler and Toledo, 1993). Research is conducted in successive stages and includes bi-component research (on each pasture and crop), discipline-oriented research (on soils, weeds, integrated pest and disease management, socioeconomics, among others) and agro-pastoral systems research per se (Vera et al., 1993; INTSORMIL, 1993; CTMMYT, 1993 and 1994; CIAT, 1994; Sanz et al., 1994a and 1994b; Vilela and Ayarza, 1995; Amezquita, 1999).
Table 5. Forage grasses and legumes adapted to acid soils, released as commercial cultivars in Tropical Latin America in 1980-1998.
Species
GRASSES
Andropogon gayanus
Brachiaria dictyoneura
Brachiaria brizantha
Brachiaria decumbens
Brachiaria humidicola
Panicum maxium
Ecotype (CIATNo.)
621
6133
6780
26646
606
679
26900
6962
Cultivar Name
Carimagua 1 Planaltina Sabanero Veranero San Martin Llanero Andropogon Veranero Otonero Gamba Icta - Real Llanero Glial aca Ganadero Pasto Brunca
Marandu Brizantha Gigante Insurgente Diamantes 1 La Libertad
Brachiaria Pasto alambre Chontalpo Senal Pasto peludo
INIAP-Napo Aguja Humidicola Chetumal Pasto Humidicola
Vencedor Tanzania 1 Momovaca
Year of release
1980 1980 1983 1983 1984 1986 1988 1989 1989 1989 1992 1987 1992 1993 1994
1984 1987 1989 1989 1991 1987
1986-87 1987 1989 1989 1991
1985 1989 1990 1991 1992
1990 1990 1993
Country of release
Colombia Brazil Venezuela Panama Peru Mexico Cuba Costa Rica Honduras Nicaragua Guatemala Colombia Panama Venezuela Costa Rica
Brazil Cuba Venezuela Mexico Costa Rica Colombia
Cuba Venezuela Mexico Panama Costa Rica
Ecuador Venezuela Panama Mexico Colombia
Brazil Brazil Brazil
10
Introduction
Table 5 (cont). Forage grasses and legumes adapted to acid soils, released as commercial cultivars in Tropical Latin America in 1980-1998.
Species
LEGUMES Arachis pintoi
Centrosema pubescens
Centrosema acutifolium
Clitoria ternatea
Desmodium ovalifolium
Leucaena leucocephala
Pueraria phaseoloides
Stylosanthes capitata
S.euianensis var vulearis
S.puianensis var pauciflora
S. macrocephala
Ecotype (CIATNo.)
17434
Multili'nea 18744
438
5277
20692
350
21888
9900
10280
184
2950
2243
1281
Cultivar Name
Amarillo Mani forrajero perenne Pico Bonito Amarillo-MG-100 Manf mejorador Mani forrajero Porvenir
Villanueva El Porvenir
Vichada
Thehuana Clitoria
Itabela
Romelia
Jarocha
Capica
Pucallpa Stylo Binuadou (Zhuhuacao) Mineirao
Bandeirante
Pioneiro
Year of release
1990 1992 1993 1994 1995 1997 1998
1993 1990
1987
1988 1990
1989
1992
1989
1983
1985 1995 1987 1993
1983
1983
Country of release
Australia Colombia Honduras Brazil Costa Rica Panama Costa Rica
Cuba Honduras
Colombia
Mexico Honduras
Brazil
Colombia
Mexico
Colombia
Peru Philippines China Brazil
Brazil
Brazil
SOURCE: Rivas era/., 1998
We here cite an example of susscessful achievement of research goals.
As a result of pasture and agro-pastoral research conducted in TLA during the last three decades in the Savanna Ecosystem, land and animal productivity have increased: (a) from 0.35 animal/ha (using 1-year old steers) and 38 kg of liveweight gain/animal/year, when grazing native savanna grass, to 0.90 animal/ha and 118 kg of liveweight gain/animal/year, when grazing the improved grass B. decumbens 606 (research conducted during 1972-1978; Paladines and Leal, 1978); (b) from 0.50 animal/ha (using 1-year old steers) and 83 kg of liveweight gain/animal/year, when grazing native savanna grass with legume banks of Pueraria phaseoloides, to 1.2-1.8 animal/ha and 193 kg liveweight gain/animal/year, when grazing an improved grass-legume association using the grass Andropogon gayanus 621 with the legumes Stylosanthes capitata 1019 and Stylosanthes capitata 1315 (research conducted during 1979-1983; Tergas et al., 1983, 1984a and 1984b); and (c) to 1.8 animals/ha (using 1-year old steers) and 253 kg liveweight gain/animal/year, when grazing a rice-pasture association, using Andropogon gayanus 621 with
11
Biometrical Applications in Tropical Pasture and Agro-pastoral Research
Stylosanthes capitata 1019 and Stylosanthes capitata 1315 (pasture) associated with the upland rice line Oryzica Sabana 6 (Sanz et al., 1994a and 1994b). These improved forage grasses and legumes, adapted to acid soils, have been released as commercial cultivars in TLA (Table 5). The legume accessions Stylosanthes capitata 1019 and 1315 were evaluated by the case study presented in chapter 3 and belong to the species 5. capitata, defined as the legume species with best adaptation to the Savanna Ecosystem (chapter 3).
These significant increases in animal and land productivity through time have led to improved farmer's income thus contributing to improved human welfare and sustainable use of the natural resource base of our continent.
Outline of this Dissertation
As explained earlier, this dissertation is composed of a selected group of Case Studies conducted in the last two decades to solve the existing problems in tropical pasture and agro-pastoral systems in TLA's major ecosystems: Savanna and Tropical Forest.
The Case Studies (chapters 3-9) are presented according to successive research phases of pasture and agro-pastoral research for TLA. They are grouped, therefore, in three main research topics: (1) Agronomic characterisation, evaluation and selection of forage germplasm (chapters 3 and 4); (2) Grazing experiments for beef and dual-purpose cattle production (chapters 5, 6 and 7); and (3) Methodological aspects of agro-pastoral research (chapters 8 and 9).
Chapter 2 is of conceptual nature. It summarises the role of Biometry in pasture and agro-pastoral research.
The last chapter (chapter 10) deals with organisation and resources of Biometry Units and groups in LA Agricultural Research Institutions and offers practical recommendations concerning the desired role of the biometrician as a partner in research teams.
A brief outline of each Case Study, by research topic, follows.
Agronomic characterisation, evaluation and selection of forage germplasm (chapters 3-4).
Chapters 3 and 4 present biometrical concepts, methods and research results obtained through the analysis of agronomic performance of pasture genotypes in multilocational trials across multiple countries in TLA. The International Network for Tropical Pastures Evaluation (RIEPT) generated the information source for these two case studies, including data from 1979 to 1992 and experimental sites from Mexico to southern Brazil. Chapter 3 shows the selection process for promising forage grass and legume ecotypes both for the Savanna and Tropical Forest ecosystems. Promising materials identified by this study are presented. Chapter 4 illustrates the identification of "adaptation niches" for one important pasture cultivar identified as promising by the previous case study: the legume Stylosanthes guianensis 184, released in Peru as cultivar 'Pucallpa' in 1985 and in the Philippines as cultivar 'Stylo' in 1995 (Table 5).
12
Introduction
Grazing Experiments for Beef and Dual-purpose cattle Production in the Tropics (chapters 5, 6 and 7).
Chapters 5,6 and 7 present biometrical concepts, methodology and research results for the planning, design, and analysis of grazing experiments. Chapter 5 presents concepts and methods for the planning, design and analysis of grazing experiments, with emphasis on continuous designs for evaluating beef production. Chapters 6 and 7 present concepts, methods and research results concerning the design and analysis of milk and dual-purpose production experiments with Bos taunts and Bos taurus x Bos indicus cows, of different genetic levels, both at the Experiment Station and at the farm. Chapter 6 presents a single-farm case study. A dual-purpose production commercial farm was selected to evaluate the effect of "genetic group" on milk and meat production, and to identify sources of variation affecting milk and meat production under farm-management conditions. Animal and farm production records collected and monitored by this farm were used for the analysis. Chapter 7 identifies sources of variation on milk production of cows from two genetic groups, using information produced by 15 controlled experiments (sequential grazing trials) conducted between 1992 and 1995 at the Experiment Station, each designed under a Multiple (3x3) Latin Square Change-Over Design.
Methodological Aspects of Agro-pastoral Research in the Tropics (chapters 8 and 9).
Chapters 8 and 9 discuss concepts, methodology and research results concerning the planning, design and analysis of agro-pastoral experiments for the Savanna Ecosystem of TLA. They offer practical recommendations to be implemented within the "Agro-pastoral Research Network for the Savannas".
References
Amezquita, M. C , 1999. Planeacion y Diseno de Ensayos Agropastoriles. In: Guimaraes, E.P.; Sanz, J.I.; Rao, I.M.; Amezquita, M.C. and Amezquita, E. (eds.). Sistemas Agropastoriles en Sabanas Tropicales de America Latina. 65-77. Centro Internacional de Agriculture Tropical (CIAT) and Empresa Brasileira de Pesquisa Agropecuaria (EMBRAPA). ISBN 958-694-010-1, 313 pp.
CEPAL, 1996. Balance preliminar de la economia de la America Latina y El Caribe. No. 598. Santiago de Chile, Chile.
CIAT (Centro Internacional de Agricultura Tropical), 1976-1996. Tropical Pastures Program Annual Reports. Cali, Colombia.
CIAT (Centro Internacional de Agricultura Tropical), 1994 and 1997-1999. Tropical Lowlands Program Annual Report 1994, 147-159, and Annual Reports 1997 to 1999. Cali, Colombia.
CIMMYT (Centro Internacional de Mejoramiento de Maiz y Trigo), 1993 and 1994. Annual Reports. Mexico City, Mexico.
13
Biometrical Applications in Tropical Pasture and Agro-pastoral Research
Cochrane, T.T., 1982. Caracterizacion agroecologica para el desarrollo de pasturas en suelos acidos de America Tropical. In: J.M. Toledo, (ed.). Manual para la Evaluacion Agronomica. Red Internacional de Evaluacion de Pastos Tropicales (RIEPT). 23-44. CIAT. Book series CIAT 07SG-1(82), 170 pp.
Cochrane, T. T.; Sanchez, L. G.; Acevedo, L. G.; Porras, J. A.; and Garver, C. L., 1985. Land in tropical America (La tierra en America tropical; A terra na America tropical). Centro Internacional de Agriculture Tropical (CIAT). Cali, Colombia, and Empresa Brasileira de Pesquisa Agropecuaria (EMBRAPA), Brasilia, Brazil. Vol.1, 146 pp.; vol.2,444 pp.; vol.3,104 pp.
FAO, 1996. Food balance sheets. Rome, Italy.
IDB, 1997. Progreso Economico y Social en America Latina. Washington, D.C., U.S.A.
INTSORMIL (International Sorghum and Millet Program, CIAT-based regional project), 1993. Annual Report. Cali, Colombia.
Lascano, C. E.; Avila, P.; Amezquita, M. C. and Ramirez, G., 1997. Fuentes de variation en la Produccion y Composition de leche de vacas en un sistema de pastoreo secuencial. In: Lascano, C.E. and Holmann, F. (eds.). Conceptos y Metodologias de Investigation en Fincas con Sistemas de Produccion Animal de Doble Proposito. 3-14. CIAT-TROPILECHE. Book series ISBN 958-9439-93-4, 285 pp.
Nieuwe Grote Wereldatlas, 1977. 169-171. Elsevier. Amsterdam, the Netherlands. 248 pp.
Paladines, O. and Leal, J. A., 1978. Pasture management and productivity in the Eastern Plains of Colombia. In: Sanchez, P. A. and Tergas, L. E. (eds.). Pasture production in acid soils of the tropics: Proceedings of a seminar held at CIAT, Cali, Colombia, April 17-21, 1978. 311-325. Series 03 EG-5. Beef Program, Centro Internacional de Agriculture Tropical (CIAT). Cali, Colombia.
Quifiones, B., 1995. Livestock Retailing in Latin America: Colombian Case Study. In: Proceedings, WAAP/KSAS (World Annual Animal Production International Symposium) on "Supply of Livestock Products to Rapidly Expanding Urban Populations". 240-261. Seoul, Korea.
Repiiblicade Colombia, 1991. Constitution Nacional de 1991. Bogota, Colombia.
Rivas, L.; Pachico, D.; Sere, C. and Garcia, J., 1998. Evolution y perspectivas de la ganaderia vacuna en America Latina Tropical en un contexto mundial. Proyecto de Evaluacion de Impacto. CIAT. Cali, Colombia.
Rubinstein, E. de and Nores, G. A., 1980. Gasto en carne de res y productos lacteos por estrato de ingreso en doce ciudades de America Latina. CIAT. Cali, Colombia.
Sanint, L. R.; Rivas, L.; Duque, M. C. and Sere, C , 1984. Food consumption patterns in Colombia: a cross sectional analysis 1981. Paper presented at the Internal Workshop of Agricultural Centers on Selected Economic Research Issues in Latin America. CIAT. Cali, Colombia.
Sanz, J.I.; Zeigler, R.S.; Sarkarung, S.; Molina, D.L. and Rivera, M., 1994a. Pasture establishment with rice. CIAT. Cali, Colombia.
14
Introduction
Sanz, J.I.; Zeigler, R.S.; Sarkarung, S.; Molina, D.L.; and Rivera, M., 1994b. Recuperation of degrading pastures with rice and rice-pasture leys. CIAT. Cali, Colombia.
Sarkarung, S. and Zeigler, R.S. 1989. Developing rice varieties for sustainable cropping systems for high acid upland soils of tropical America. In: International Symposium on Rice Production on Acid Soils of the Tropics: Achievements and Challenges. Kandi, Sri Lanka.
Tergas, L. E.; Paladines, O.; Kleinheisterkamp, I.; and Velasquez, J., 1983. Productividad animal de praderas naturales con pastoreo complementario en Pueraria phaseoloides en los Llanos Orientales de Colombia. Prod. Anim. Trop. (Dominican Rep.) 8(3): 203-211.
Tergas, L. E.; Paladines, O.; Kleinheisterkamp, I.; and Velasquez, J., 1984a. Productividad animal de Brachiaria decumbens sola y con pastoreo complementario en Pueraria phaseoloides en los Llanos Orientales de Colombia. Prod. Anim. Trop. (Dominican Rep.) 9(1): 1-13.
Tergas, L. E.; Paladines, O.; Kleinheisterkamp, I.; and Velasquez, J., 1984b. El potential de production animal de cuatro asociaciones de Andropogon gayanus Kunth en los Llanos Orientales de Colombia. Prod. Anim. Trop. (Dominican Rep.) 9(3): 176-186.
Thomas, R., 1999. Preface. In: Guimaraes, E.P.; Sanz, J.I.; Rao, I.M.; Amezquita, M.C. and Amezquita, E. (eds.). Sistemas Agropastoriles en Sabanas Tropicales de America Latina. Centro Internacional de Agriculture Tropical (CIAT) and Empresa Brasileira de Pesquisa Agropecuaria (EMBRAPA). ISBN 958-694-010-1, 313 pp.
Toledo, J. M, 1985. Pasture development for cattle production in the major ecosystems of the tropical American lowlands. Proceedings of the XV International Grasslands Congress. 74-81. Kyoto, Japan.
Toledo, J.M.; Sere, C; and Loker, W., 1989. Pasture-crop technologies for acid soil savannas and rain forests of tropical America. In: Symposium Proceedings "Innovation in Resource Management". World Bank. Washington, D.C., U.S.A.
Valdes, A. and Nores, G. A., 1979. Growth Potential of the beef sector in Latin America - survey of issues and policies. IV World Conference of Animal Production. Buenos Aires, Argentina.
Vera, R.; Sanz, J.I.; Hoyos, P.; Molina, D.L.; Rivera, M. and Moya, M.C, 1993. Pasture establishment and recuperation with undersown rice on the acid soil savannas of South America. CIAT. Cali, Colombia.
Vilela, L.; and Ayarza, M., 1995. Rotacao de Culturas Anuais com Pastagens nos Cerrados. Paper presented at the IV Annual Meeting of the Agro-pastoral Network for the Savannas. Santa Cruz, Bolivia.
World Bank, 1994. World Development Report. Washington, D.C., U.S.A.
World Bank, 1997. World Development Report. Washington, D.C., U.S.A.
15

Biometrical Applications in Tropical Pasture and Agro-pastoral Research
Zeigler, R.S. and Toledo, J.M., 1993. Developing sustainable agricultural production systems for the acid soil savannas of Latin America. In: Paoletti, M.G.; Napier, T.; Ferro, O.; Stinner, B. and Stinner, D. (eds.). Socio-economic and policy issues for sustainable farming systems. 103-116. Coop. Amicizia sre. Padova, Italia.
16
The Role of Biometry in Pasture and Agro-pastoral Research in the Tropics
Chapter 2
The Role of Biometry in Pasture and Agro-pastoral Research
in the Tropics1
Maria Cristina Amezquita
The special nature of tropical pasture and agro-pastoral research in the American tropics should be recognised. Traditional agricultural research is carried out with short-cycle crops in small and medium-size plots to obtain the final product: the harvest. In contrast, research on tropical pastures and agro-pastoral systems is much more complex and long term. It involves perennial crops whose final products go beyond the harvest; it deals with numerous components and their interactions over space and time; it pursues as main goals an increased land and animal productivity, increased human welfare, and a sustainably conserved, managed and used natural resource base. Components of pasture and agro-pastoral systems include: a) the soil; b) sub-components such as grasses, legumes, weeds and crops; c) animals, such as young steers for weight-gain experiments, dairy cows for milk production experiments, dual-purpose cows for beef and milk production experiments, and reproductive herds for a combined assessment of the cow-calf performance over time, both beef-production herds and dual-purpose production herds; and d) management practices for the soil, pastures, crops and animals. Research is truly multidisciplinary. It must be conducted in successive stages of different scale, both at the Experiment Station under controlled conditions, and at the farm level under commercial management conditions, to guarantee an efficient and adequate selection of promising material and improved management practices with high potential of adoption by farmers (Mannetje and Jones, 2000). The immediate beneficiaries of pasture and agro-pastoral research are small- and medium-size farmers. Farm size varies with ecosystem and animal production system (from 4-10 ha farm in small dual-purpose production systems in the semi-evergreen seasonal forest ecosystem, from 20-200 ha farm in medium-size dual-purpose production systems in the humid tropical forest ecosystem, and from 300 to over 1000 ha farm in extensive beef production systems in the savanna ecosystem) (Toledo, 1985; CIAT, 1989-1996).
Adapted from: Proceedings, Colombian Statistics Symposium 1993. "Design of Experiments". June 7-11, Bogota, Colombia. Head, Biometry Unit, Centra Internacional de Agriculture Tropical (CIAT). Cali, Colombia.
17
Biometrical Applications in Tropical Pasture and Agro-pastoral Research
Because the final products of a pasture are milk, meat and other animal products, the pasture researcher must always search for complementarity between small-plot agronomic trials and medium- and large-scale grazing experiments. Furthermore, research findings on small-scale agro-pastoral experiments should be tested through medium- and large-scale grazing experiments under commercial agro-pastoral production systems. Field experiments also provide data as inputs for modelling and can serve to validate modelling results (Rickert et al, 2000)
Under the evaluation scheme used by CIAT's former Tropical Pastures Program, by CIAT's Tropical Forages Project (CIAT, 1989-1996; CIAT, 1997-1999) and by other tropical pasture research institutions, germplasm of potential new grass or legume cultivars is first subjected to small-plot agronomic trials to evaluate adaptation to edaphic, climatic, and biotic conditions and to determine biomass production potential. Selected accessions are then assembled in grass-legume associations that are evaluated under medium-size grazing experiments to study their compatibility and persistence under animal pressure. Promising associations are then evaluated in large-scale grazing trials to measure animal productivity, expressed as weight gain of young steers, milk production capacity of a dairy herd, reproductive performance of breeding herds, or beef and milk production of dual-purpose cattle under commercial production systems (Lascano and Holmann, 1997; Schulze-Kraft and Mannetje, 2000; Bransby and McLaurin, 2000).
Small-plot agronomic experiments involve the characterisation, evaluation and selection of several research components (grasses, legumes and crops) in terms of desired agronomic characteristics. A wide range of replicated experimental designs is used, both complete and incomplete block designs (Verdooren, 1998) conducted both at a single location or experimental site, and across multiple locations representing the range of variability of the impact region. The effect of one or more experimental factors on a group of genotypes can be studied under replicated factorials. Given the perennial nature of the pasture components, response variables should be evaluated throughout the most relevant seasons of the year, preferably for periods longer than one year (Jones et al, 1995). These evaluations can be considered as repeated measurements over time and analysed as such (Amezquita, 1982). Statistical analyses may also involve fitting response curves for each genotype by season, and multivariate comparisons of regression parameters among genotypes. Regression parameter estimates can be used as summarised indicators of genotype performance during the experimental period (Toledo et al, 1983).
Multinational agronomic trials constitute the most important method of testing genotype adaptation and performance across a range of contrasting environments (IRTP, 1978-1980 and 1982-1984; Kauffman et al, 1982; Toledo, 1985; Cuevas-Perez et al, 1989; Amezquita et al, 1990; Amezquita et al, 1991). Relevant statistical analyses include a wide range of multivariate methods, especially classification and reduction-of-dimensionality techniques (Perkins, 1972; Patterson etal, 1978; Amezquita et al, 1990; Amezquita et al, 1991).
Additional sources of variation on pasture response should be considered when designing experiments for evaluating pastures under grazing. Sources of variability include "soil", "year", "season within year", "pasture quality over time", and "animal variability" associated with sex, age,
The Role of Biometry in Pasture and Agro-pastoral Research in the Tropics
animal genetics, origin, and nutritional condition, among other factors (Mannetje et al., 1976; Haydock, 1984; Amezquita, 1986; Mendoza and Lascano, 1986; Paladines, 1986; Vaccaro, 1986).
Research results obtained at the Experiment Station need to be tested on real grounds at the farm level. On-farm experimentation, therefore, provides a much wider extrapolation capacity of research results. Under some circumstances, a single farm can be selected to conduct a specific case study to test one or more hypotheses (Amezquita and Lema, 1997). But in most cases, on-farm experimentation is carried out when there is a need for a wider extrapolation of research results. In this case, a set of farms representative of the animal production system of interest and covering the existing variability in environmental and management conditions of the region under study are selected and used as replications. The farm, a random factor, then provides a very realistic way of testing and verifying research findings from early research stages carried out under controlled conditions (Borel etal., 1982; Henao, 1986; Lascano and Ferguson, 1990).
Experiments with dairy and dual-purpose cattle constitute a research area where the use of change-over designs is economically efficient. Given the high cost of experimental animals, especially of dual-purpose cows, these designs are useful, as they require fewer experimental units to obtain similar levels of significance when compared with continuous designs (Lucas, 1976; Martinez Garza, 1983; Amezquita, 1993).
Large-scale grazing experiments with commercial breeding herds are conducted to evaluate reproductive efficiency and beef production capacity of cattle under different pasture and management treatments, both at the experiment station and at the farm level. Their results are oriented towards direct adoption by producers (Vera, 1982). However, given the complex nature of response variables measured in this type of research —both continuous and categorical for evaluating the cow, calf, cow-calf unit, and herd performance over time— the use of sophisticated statistical methods for data analysis is required (Bransby and McLaurin, 2000). This stage of research also serves to study the effect of long term practical use under grazing on persistence and performance of new pasture cultivars (Jones et al., 1995). Therefore, vegetation measurements, particularly botanical composition (Whalley and Hardy, 2000), biomass production (Mannetje, 2000) and plant population dynamics (Hay et al, 2000), are necessary to understand changes in pasture and animal production performance.
Agro-pastoral research is conducted in those agro-ecosystems of Tropical America where the pasture-crop association has a clear potential for increasing land productivity, social welfare, and soil conservation and improvement. An example of these agro-ecosystems is the Savanna Ecosystem of Tropical America, which covers 250 million ha in Bolivia, Brazil, Colombia, Guyana and Venezuela. Agro-pastoral research in this ecosystem aims to integrate the pastures and crops best adapted to acid and infertile savanna soils into economically attractive production systems (Sarkarung and Zeigler, 1989; Toledo et al., 1989; Zeigler and Toledo, 1993). This type of research is conducted in successive stages and includes bi-component research (i.e., research on each pasture and crop), discipline-oriented research (i.e., research on soils, weeds, integrated pest and disease management, socio-economics, among others) and agro-pastoral systems research per se (Vera et
19
Biometrical Applications in Tropical Pasture and Agro-pastoral Research
al, 1993; INTSORMIL, 1993; CIMMYT, 1993 and 1994; CIAT, 1994; Sanz et al., 1994a and 1994b; Vilela and Ayarza, 1995; Amezquita, 1999)
Because research on pasture and agro-pastoral systems in the tropics is complex, heterogeneous, multidisciplinary, and long term, it is extremely challenging for biometricians. The role of the biometrician focuses on contributing, as a member of research teams, to the planning, design, data analysis and interpretation of results, of the various experimental projects within each research phase. The search for a practical and timely solution to the immense research needs of our ecosystems, the search for balance between theory and field work, and a permanent and fruitful biometrician-researcher communication are key elements of success. It is important to keep in mind that it is better to "provide a useful and biologically sound solution to a relevant problem" than to "provide a theoretically elegant solution to an irrelevant problem". This reflection is inspired in the words of Professor John W. Tukey: "... real problems deserve realistic attention. Which implies, it is better to have an approximate solution to the right problem than to have an exact solution to the wrong one"; "...that the use of techniques is not confined to the instances that are covered by theory...if you had to have theory to cover every application, very few techniques would ever get used." (Mosteller and Tukey, 1988).
The final product of tropical pasture and agro-pastoral research in lowland tropical America is increased animal and land productivity, improved human welfare, and efficient conservation, management and use of the natural resource base of our continent (Toledo et al., 1989; Zeigler and Toledo, 1993; Thomas, 1999). Contributing to these goals is the aim of a biometrician member of research teams in our tropical environments.
References
Amezquita, M. C, 1982. Recopilacion, Procesamiento y Analisis de Information. In: J.M. Toledo, (ed.). Manual para la Evaluation Agronomica. Red International de Evaluation de Pastos Tropicales (RIEPT). 117-125. CIAT. Book series CIAT 07SG-1(82), 170 pp.
Amezquita, M. C, 1986. Consideraciones sobre Planeacion, Diseno y Analisis de Experimentos de Pastoreo. In: Lascano, C. E. and Pizarro, E. A. (eds.). Evaluation de pasturas con animales. Alternativas Metodologicas. 13-42. CIAT. Book series ISBN 84-8280-154-6, 292 pp.
Amezquita, M. C, 1993. Diseno y Analisis de Ensayos para Evaluation de Pasturas en Fincas. In: Argel, P.; Duran, C. V. and Franco, L.H., (eds.). Planeacion y Conduction de Ensayos de Evaluation de Gramineas y Leguminosas Forrajeras en Fincas. Documento de Trabajo No. 133. 23-37. Centro International de Agriculture Tropical (CIAT) y Red International de Evaluation de Pasturas Tropicales (RIEPT). 340 pp.
Amezquita, M. C, 1999. Planeacion y Diseno de Ensayos Agropastoriles. In: Guimaraes, E.P.; Sanz, J.I.; Rao, I.M.; Amezquita, M.C. and Amezquita, E. (eds.). Sistemas Agropastoriles en Sabanas Tropicales de America Latina. 65-77. Centro International de Agricultura Tropical (CIAT) and Empresa Brasileira de Pesquisa Agropecuaria (EMBRAPA). ISBN 958-694-010-1, 313 pp.
20
The Role of Biometry in Pasture and Agro-pastoral Research in the Tropics
Amezquita, M.C. and Lema, G., 1997. Analisis del efecto del grupo genetico sobre la production de leche y comportamiento reproductive en una finca de doble proposito. In: Lascano, C. E. and Holmann, F. (eds.). Conceptos y Metodologias de Investigacion en Fincas con Sistemas de Production Animal de Doble Proposito. 80-92. CLAT-TROPILECHE. Book series ISBN 958-9439-93-4. 285 pp.
Amezquita, M. C ; Pizarro, E. A. and Toledo, J. M., 1990. Range of Adaptation of Andropogon gayanus. In: Toledo, J.M. (ed.). Andropogon gayanus Kunth: A grass for tropical acid soils. 37-64. CIAT. Book series ISBN 84-89206-79-1, 406 pp.
Amezquita, M. C ; Toledo, J. M. and Keller-Grein, G., 1991. Agronomic performance of Stylosanthes guianensis cv. Pucallpa in the American Tropical rain forest ecosystem. Tropical Grasslands, Volume 25, 262-267.
Borel, R.; Ruiz, M.; Pezo, D. and Ruiz, A., 1982. Un enfoque metodologico para el desarrollo y evaluation de alternativas de production pecuaria para el pequeno productor. In: H. H. Li Pun and H. Zandstra (eds.). Informe del II Taller de Trabajo sobre Sistemas de Production Animal Tropical. 41-82. Centra International de Investigacion para el Desarrollo (CIID). Bogota, Colombia.
Bransby, D. and McLaurin, A., 2000. Designing animal production studies. In: Mannetje, L. 't and Jones, R. M. (eds.). Field and Laboratory Methods for Grassland and Animal Production Research. 327-352. CAB International, Wallingford, U.K.
CIAT (Centra International de Agriculture Tropical), 1989-1996. Tropical Pastures Program Annual Reports. Cali, Colombia.
CIAT (Centra International de Agriculture Tropical), 1994. Tropical Lowlands Program Annual Report. 147-159. Cali, Colombia.
CIAT (Centra International de Agriculture Tropical), 1997-1999. Tropical Lowlands Program Annual Reports. Cali, Colombia.
CIMMYT (Centra International de Mejoramiento de Mafz y Trigo), 1993 and 1994. Annual Reports. Mexico City, Mexico.
Cuevas-Perez, F.; Amezquita, M. C. and Rosero, M. J., 1989. A Methodology for evaluating a Location as a Selection Site for an International Plant Breeding Program. Euphytica 43: 165-172. Kluwer Academic Publisher. Printed in the Netherlands.
Hay, M.; Jones, R. M. and Orr, D. M., 2000. Plant population dynamics of grasslands. In: Mannetje, L. 't and Jones, R. M (eds.). Field and Laboratory Methods for Grassland and Animal Production Research. 125-149. CAB International, Wallingford, U.K.
Haydock, K. P., 1984. Consequences arising when the design of a grazing trial is not ideal. In: Blight, G. W. (ed.). Experimental design in cattle research when resources are limiting. Proceedings of the Australian Society of Animal Production, 15: 52-54.
21
Biometrical Applications in Tropical Pasture and Agro-pastoral Research
Henao, J., 1986. Evaluation de Alternativas Tecnologicas en fincas de pequenos productores: Evaluation biologica. In: Quijandria, B.; Li Pun, H. H. and Borel, R. (eds.). Informe de la IV Reunion de Trabajo sobre Sistemas de Production Animal. 8-39. Centro International de Investigation para el Desarrollo (CUD). Bogota, Colombia
INTSORMIL (International Sorghum and Millet Program, CIAT-based regional project). 1993. Annual Report. Cali, Colombia.
IRTP (International Rice Testing Program), 1978-1980 and 1982-1984. Annual Reports. IRRI, Manila, Philippines.
Jones, R. M.; Jones, R. J. and McDonald, C. K., 1995. Some advantages of long-term grazing trials, with particular reference to changes in botanical composition. Australian Journal of Experimental Agriculture 35, 1029-1038.
Kauffman, H.E.; Rosero, M. J. and Carangal, V.R., 1982. International Networks. In: Rice Research Strategies for the Future. 503-525. International Rice Research Institute (IRRI), Manila, Philippines.
Lascano, C. E. and Ferguson, J. E., 1990. Problemas especificos de la investigation con pasturas en fincas. Centro International de Agriculture Tropical (CIAT). Cali, Colombia.
Lascano, C. E. and Holmann, F. (eds.), 1997. Conceptos y Metodologias de Investigation en Fincas con Sistemas de Production Animal de Doble Proposito. CIAT-TROPILECHE. Book series ISBN 958-9439-93-4, 285 pp.
Lucas, H. L., 1976. Design in animal science research. Institute of Statistics, University of North Carolina, N.C., U.S.A.
Mannetje, L. 't, 2000. Measuring quantity of grassland vegetation. In: Mannetje, L. 't and Jones, R.M. (eds.). Field and Laboratory Methods for Grassland and Animal Production Research. 151-177. CAB International, Wallingford, U.K.
Mannetje, L. 't and Jones, R.M. (eds.), 2000. Field and Laboratory Methods for Grassland and Animal Production Research. CAB International, Wallingford, U.K.
Mannetje, L.'t; Jones, R. J. and Stobbs, T. H., 1976. Pasture evaluation by grazing experiments. In: Shaw, N. H. and Bryan, W. W. (eds.). Tropical pasture research: Principles and methods. Bulletin 51. 194-234. Commonwealth Bureau of Pastures and Field Crops, Commonwealth Agricultural Bureaux (CAB), Hurley, England.
Martinez Garza, A., 1983. Diseno de experimentos con animales. Vol. 1, Num. 2. Chapingo, Mexico.
Mendoza, P. and Lascano, C. E., 1986. Mediciones de la pasture en ensayos de pastoreo. In: Lascano, C. E. and Pizarro, E. A. (eds.). Evaluation de pastures con animales. Alternativas Metodologicas. 143-166. CIAT. Book series ISBN 84-8280-154-6, 292 pp.
22
The Role of Biometry in Pasture and Agro-pastoral Research in the Tropics
Mosteller, F. and Tukey, J. W., 1988. Frederick Mosteller and John W. Tukey: A Conversation. Moderated by Francis J. Anscombe. Statistical Science, Vol. 3, No. 1, 136-144.
Paladines, O., 1986. Mediciones de respuesta animal en ensayos de pastoreo: ganancia de peso. In: Lascano, C. E. and Pizarro, E. A. (eds.). Evaluacion de pastures con animales. Alternativas Metodologicas. 99-26. CIAT. Book series ISBN 84-8280-154-6, 292 pp.
Patterson, J. G.; Goodchild, N. A. and Boyd, W. J. R., 1978. Classifying environments for sampling purposes, using a principal component analysis of climatic data. Agric. Meteorol. 19(4): 349-362.
Perkins, J. M., 1972. The principal components analysis of genotype-environmental interactions and physical measures of the environment. Heredity 29: 339-356.
Rickert, K.G.; Stuth, J. and McKeon G.M., 2000. Modelling grassland and animal production systems. In: Mannetje, L. 't and Jones, R.M. (eds.). Field and Laboratory Methods for Grassland and Animal Production Research. 29-65. CAB International, Wallingford, U.K.
Sanz, J.I.; Zeigler, R.S.; Sarkarung; S.; Molina, D.L. and Rivera, M., 1994a. Pasture establishment with rice. CIAT. Cali, Colombia.
Sanz, J.I.; Zeigler, R.S.; Sarkarung, S.; Molina, D.L.; and Rivera, M., 1994b. Recuperation of degrading pastures with rice and rice-pasture leys. CIAT. Cali, Colombia.
Sarkarung, S. and Zeigler, R.S. 1989. Developing rice varieties for sustainable cropping systems for high acid upland soils of tropical America. In: International Symposium on Rice Production on Acid Soils of the Tropics: Achievements and Challenges. Kandi, Sri Lanka.
Schulze-Kraft, R. and Mannetje, L. 't, 2000. Evaluation of species and cultivars. In: Mannetje, L. 't and Jones, R.M. (eds.). Field and Laboratory Methods for Grassland and Animal Production Research. 179-204. CAB International, Wallingford, U.K.
Thomas, R., 1999. Preface. In: Guimaraes, E.P.; Sanz, J.I.; Rao, I.M.; Amezquita, M.C. and Amezquita, E. (eds.). Sistemas Agropastoriles en Sabanas Tropicales de America Latina. Centro Internacional de Agricultura Tropical (CIAT) and Empresa Brasileira de Pesquisa Agropecuaria (EMBRAPA). ISBN 958-694-010-1, 313 pp.
Toledo, J. M., 1985. Pasture development for cattle production in the major ecosystems of the tropical American lowlands. Proceedings of the XV International Grasslands Congress. 74-81. Kyoto, Japan.
Toledo, J. M.; Amezquita, M. C. and Pizarro, E. A., 1983. Analisis del comportamiento del germoplasma evaluado por la Red Internacional de Evaluacion de Pasturas Tropicales (RJEPT) en los ecosistemas de Sabana y Bosque Tropical de America. In: Pizarro, E. A. (ed.). Red Internacional de Evaluacion de Pasturas Tropicales. 429-447. CIAT. Book series ISSN 0120-4882, 460 pp.
23
Biometrical Applications in Tropical Pasture and Agro-pastoral Research
Toledo, J.M.; Sere, C. and Loker, W., 1989. Pasture-crop technologies for acid soil savannas and rain forests of tropical America. In: Symposium Proceedings "Innovation in Resource Management". World Bank, Washington, D.C., U.S.A.
Vaccaro, L., 1986. Medidas de la respuesta animal en ensayos de pastoreo: vacas lecheras y de doble proposito. In: Lascano, C. E. and Pizarro, E. A. (eds.). Evaluacion de pasturas con animates. Alternativas Metodologicas. 127-142. CIAT. Book series ISBN 84-8280-154-6, 292 pp.
Vera, R., 1982. Evaluacion de sistemas de cria con pasturas mejoradas. Documento interno. Centro Internacional de Agricultura Tropical (CIAT). Cali, Colombia.
Vera, R.; Sanz, J.I.; Hoyos, P.; Molina, D.L.; Rivera, M. and Moya, M.C., 1993. Pasture establishment and recuperation with undersown rice on the acid soil savannas of South America. CIAT. Cali, Colombia.
Verdooren, Rob. 1998. Applications and Analysis of Alpha Designs. Lecture given at the Humboldt University in Berlin (Germany) on 2 July 1998: "Sommertagung der AG Landwirtschaftliches Versuchswesen anlasslich des 65. Geburttages von Herrn Prof. Dr. sc. Erhard Thomas an der Landwirtschaftlich- Gartnerischen Fakultat der Humboldt Universitat zu Berlin, 273. Juli 1998".
Vilela, L. and Ayarza, M., 1995. Rotacao de Culturas Anuais com Pastagens nos Cerrados. Paper presented at the IV Annual Meeting of the Agro-pastoral Research Network for the Savannas. Santa Cruz, Bolivia.
Whalley, R.D.B. and Hardy, M.B., 2000. Measuring botanical composition of grasslands. In: Mannetje, L. 't and Jones, R. M., (eds.). Field and Laboratory Methods for Grassland and Animal Production Research. 67-102. CAB International, Wallingford, U.K.
Zeigler, R.S. and Toledo, J.M., 1993. Developing sustainable agricultural production systems for the acid soil savannas of Latin America. In: Paoletti, M.G.; Napier, T.; Ferro, O.; Stinner, B. and Stinner, D. (eds.). Socio-economic and policy issues for sustainable farming systems. 103-116. Coop. Amicizia sre. Padova, Italia.
24

Analysis of performance of germplasm evaluated by the International Network for Tropical Pastures Evaluation (RIEPT) in the Savanna and Tropical Forest ecosystems of Tropical America
Chapter 3
Analysis of performance of germplasm evaluated by the International Network for
Tropical Pastures Evaluation (RIEPT) in the Savanna and Tropical Forest ecosystems
of Tropical America1
Jose M. Toledo , M.C. Amezquita andE.A. Pizarro
Introduction
The International Network for Tropical Pastures Evaluation (RIEPT) has as its principal objective the evaluation of new alternatives of forage germplasm, previously selected for their tolerance to acid and infertile soils, at multiple locations, in the most important ecosystems at the agricultural frontier of tropical America.
Adapted from: Pizarro, E. A. (ed.), 1983. Red Internacional de Evaluation de Pasturas Tropicales. 429-447.
CIAT. Book series ISSN 0120-4882, 460 pp. Agronomist and Leader of the Tropical Pastures Program.
Head Biometry Section, Data Services Unit.
Agronomist, Regional Trials, Tropical Pastures Program. Centra Internacional de Agriculture Tropical (CIAT). Cali, Colombia.
25

Biometrical Applications in Tropical Pasture and Agro-pastoral Research
Cochrane (1982) classified the ecosystems in Tropical America as follows:
a) Well-drained isohyperthermic savannas (Colombian and Venezuelan plains, together with the well-drained parts of the Roraima and Amapa savannas in Brazil, and the Rupununi savanna in Guyana), with a total potential evapotranspiration during the rainy period (TPER) between 901 and 1060 mm., an average monthly temperature during the rainy period (AMTR) above 23.5°C, and up to 8-month rainy season.
b) Well-drained isothermic savannas (mainly the Brazilian Cerrados), with a TPER between 901 and 1060 mm., an AMTR lower than 23.5°C, and up to 8-month rainy season.
c) Poorly drained savannas (Casanare in Colombia, Apure in Venezuela, and "El Pantanal" in Mato Grosso, Brazil), with a TPER between 901 and 1060 mm., and poor drainage because of topographical and edaphic reasons.
d) Tropical semi-evergreen seasonal forest (Bolivian Amazonia, southern Peruvian Amazonia, and the majority of the Brazilian Amazonia), with a TPER between 1061 and 1300 mm., an AMTR higher than 23.5°C, and from 8 to 9 months of rain.
e) Tropical rain forest (Colombian Amazonia, Ecuadorian Amazonia, north-western areas of the Brazilian Amazonia, and northern Peruvian Amazonia), with a TPER greater than 1300 mm., an AMTR higher than 23.5°C, and more than 9 months of rain.
Cochrane and Jones (1981) had also subdivided the region into these ecosystems, grouping types of vegetation from the different land systems and relating them with climatic parameters indicating the "energy usable by plants for their growth and production".
Between 1979 and 1982, the RIEPT established a series of multilocational trials to evaluate, in small plots, adaptation (Regional Trials A) and agronomic productivity (Regional Trials B) of grass and legume ecotypes in the different ecosystems mentioned. These trials followed a uniform methodology under a common experimental design (Toledo and Schultze-Kraft, 1982) that allows a combined statistical analysis across locations, within and across ecosystems (Amezquita, 1982). Regional Trials B, in particular, were designed under an Split-Plot Design, with 4 replications per location, with the ecotype assigned to the main plot and ecotype's cutting age (3, 6, 9 and 12 weeks after a uniform cutting) assigned to the subplot.
Materials and Methods
For the combined statistical analysis by ecosystem, data generated by the Regional Trials B (RTB) -where dry matter production of each ecotype during the maximum and minimum rainfall periods was measured - were used. The analyses were carried out independently for the two ecosystems considered (isohyperthermic savanna and tropical forest), separating grasses and legumes in each case because of their different productivity potential. Tables 1 and 2 show the locations and ecotypes considered for the combined analysis, both for the isohyperthermic savanna and tropical forest ecosystems.
26
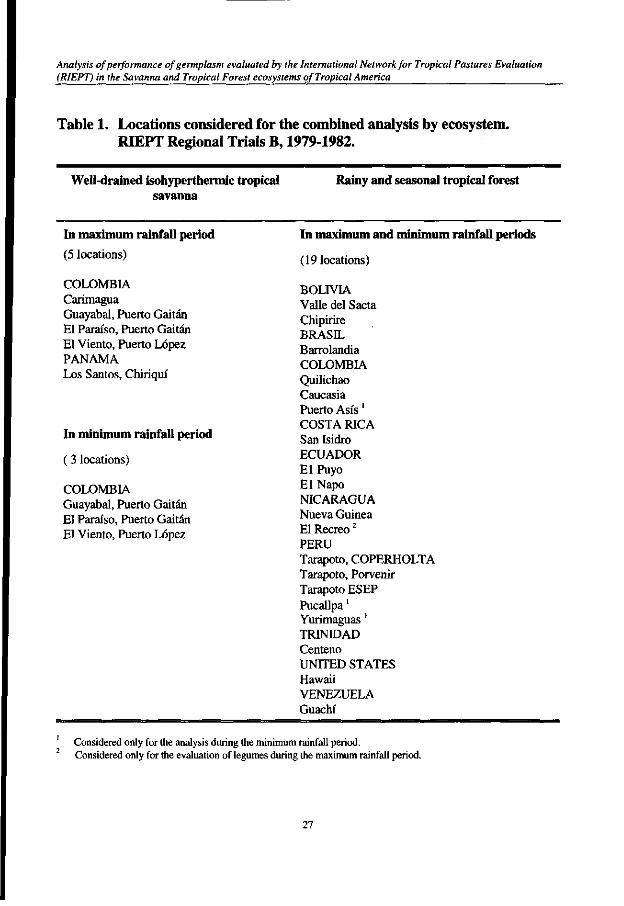
Analysis of performance of germplasm evaluated by the International Network for Tropical Pastures Evaluation (RIEPT) in the Savanna and Tropical Forest ecosystems of Tropical America
Table 1. Locations considered for the combined analysis by ecosystem. RIEPT Regional Trials B, 1979-1982.
Well-drained isohyperthermic tropical savanna
Rainy and seasonal tropical forest
In maximum rainfall period
(5 locations)
COLOMBIA Carimagua Guayabal, Puerto Gaitan El Paraiso, Puerto Gaitan El Viento, Puerto Lopez PANAMA Los Santos, Chiriqui
In minimum rainfall period
(3 locations)
COLOMBIA Guayabal, Puerto Gaitan El Paraiso, Puerto Gaitan El Viento, Puerto Lopez
In maximum and minimum rainfall periods
(19 locations)
BOLIVIA Valle del Sacta Chipirire BRASIL Barrolandia COLOMBIA Quilichao Caucasia Puerto Asis' COSTA RICA San Isidro ECUADOR El Puyo El Napo NICARAGUA Nueva Guinea El Recreo2
PERU Tarapoto, COPERHOLTA Tarapoto, Porvenir Tarapoto ESEP Pucallpa' Yurimaguas' TRINIDAD Centeno UNITED STATES Hawaii VENEZUELA Guachf
Considered only for the analysis during the minimum rainfall period. Considered only for the evaluation of legumes during the maximum rainfall period.
27
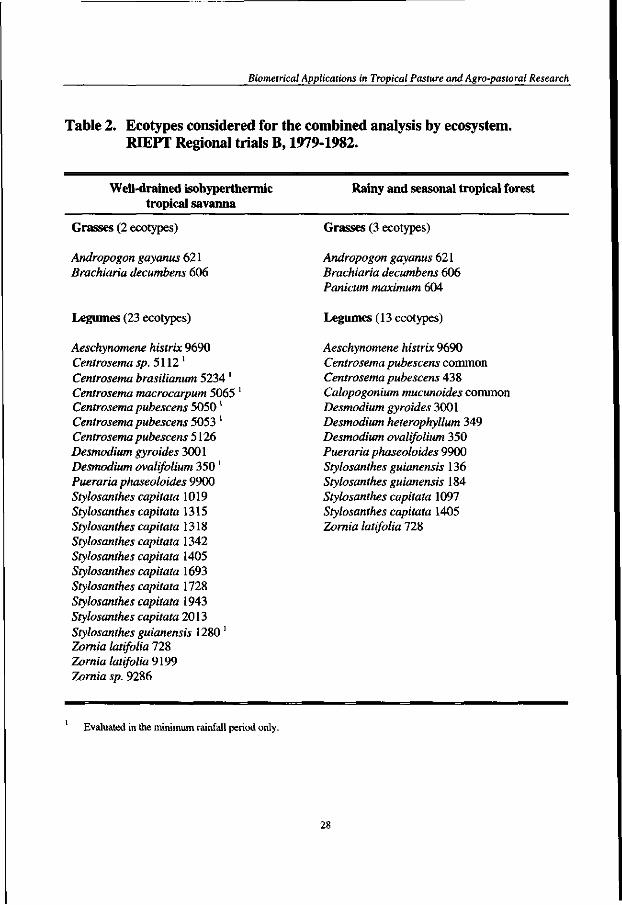
Biometrical Applications in Tropical Pasture and Agro-pastoral Research
Table 2. Ecotypes considered for the combined analysis by ecosystem. RIEPT Regional trials B, 1979-1982.
Well-drained isohyperthermic tropical savanna
Rainy and seasonal tropical forest
Grasses (2 ecotypes)
Andropogon gayanus 621 Brachiaria decumbens 606
Grasses (3 ecotypes)
Andropogon gayanus 621 Brachiaria decumbens 606 Panicum maximum 604
Legumes (23 ecotypes)
Aeschynomene histrix 9690 Centrosema sp. 5112 ' Centrosema brasilianum 5234' Centrosema macrocarpum 5065 Centrosema pubescens 5050' Centrosema pubescens 5053 ' Centrosema pubescens 5126 Desmodium gyroides 3001 Desmodium ovalifolium 350 ' Pueraria phaseoloides 9900 Stylosanthes capitata 1019 Stylosanthes capitata 1315 Stylosanthes capitata 1318 Stylosanthes capitata 1342 Stylosanthes capitata 1405 Stylosanthes capitata 1693 Stylosanthes capitata 1728 Stylosanthes capitata 1943 Stylosanthes capitata 2013 Stylosanthes guianensis 1280' Zomia latifolia 728 Zonn'a /a«/o//'a 9199 Zornia sp. 9286
Legumes (13 ecotypes)
Aeschynomene histrix 9690 Centrosema pubescens common Centrosema pubescens 438 Calopogonium mucunoides common Desmodium gyroides 3001 Desmodium heterophyllum 349 Desmodium ovalifolium 350 Pueraria phaseoloides 9900 Stylosanthes guianensis 136 Stylosanthes guianensis 184 Stylosanthes capitata 1097 Stylosanthes capitata 1405 Zornia latifolia 728
Evaluated in the minimum rainfall period only.
28
Analysis of performance ofgermplasm evaluated by the International Network for Tropical Pastures Evaluation (RIEPT) in the Savanna and Tropical Forest ecosystems of Tropical America
The statistical analysis followed the methodology described below: a) Analysis of variance for the comparison of locations and ecotypes in terms of their productivity
and a test of ecotype x location interaction, according to the following model. Yijk = u + Li + Rj (Li) + Ek + (L x E)ik + error [1]
where: Yyk = accumulated dry matter production at 12 weeks of regrowth (kg DM/ha) of
ecotype k in replication j of location i. u = overall mean effect. U = effect of location i. Rj (Lj) = effect of replication j within location i. Ek = effect of ecotype k. (L x E)ik = effect of location x ecotype interaction.
Given the RIEPT's mandate to evaluate performance of the specific set of genotypes and locations, for the testing of hypotheses it was assumed that both "location" and "ecotype" were fixed effects. These analyses, therefore, are only valid for the group of ecotypes and locations evaluated (Mcintosh, 1982).
b) Evaluation of the ecotypes' adaptability through the range of selected locations. For this analysis, the method suggested by Eberhart and Russell (1966) was followed, through which ecotypes or crop varieties are selected according to their sensitivity to changes in the environment. They define adaptability as "the relative response of a genotype to changes in the environment's quality". They assume a linear relationship between the ecotype response and an Environmental Index (EI), and define the slope (b) of that regression and its standard error (St,) as indicators of the ecotype adaptability. Each location represents an environment with different conditions of soil, climate, biotic factors (for example, pests, diseases, weeds) and management factors (establishment, cutting techniques, errors in sampling, among others). The EI, calculated as the mean response of the genotypes in that environment, minus the overall mean response for the ecosystem, is the expression of the environment quality.
The value of EI can be expressed as: EI = DMPi - DMPg [2] where: DMPi = Location mean of dry matter production at 12 weeks of regrowth (kg DM/ha). DMPg = Overall mean of dry matter production at 12 weeks of regrowth (kg DM/ha) over all
locations within the ecosystem.
This EI assumes that the best sensor of the environment's quality is the productivity of the ecotypes tested, and indicates how superior or inferior a location is with regard to the mean productivity of the ecosystem. EI represents the "productivity potential" of each location in a relative manner.
The method was modified for the purpose of this analysis, by eliminating the dependency between yield of the ecotype that is evaluated and the EI, through the exclusion of the specific ecotype under evaluation in the calculation of the EI.
29
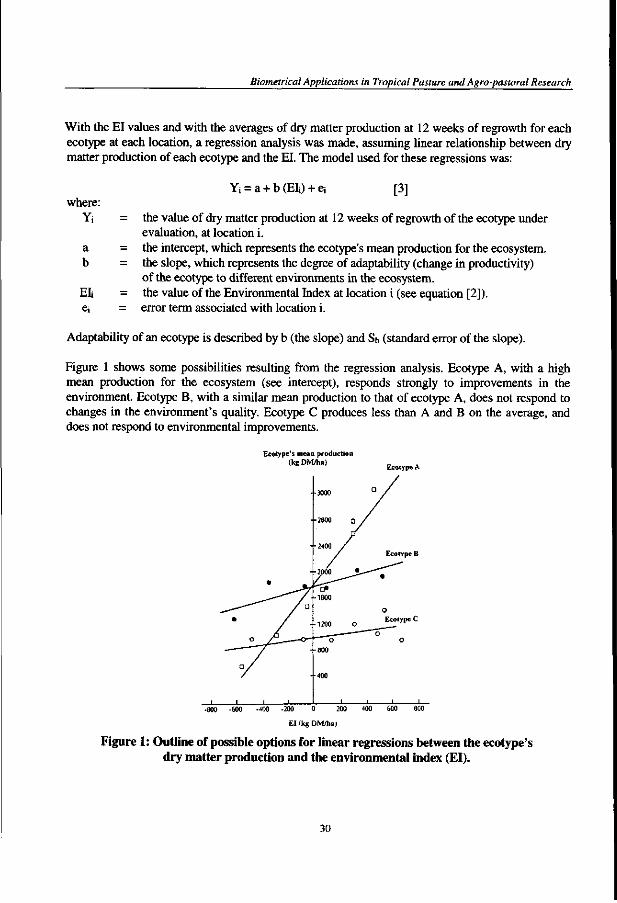
Biometrical Applications in Tropical Pasture and Agro-pastoral Research
With the EI values and with the averages of dry matter production at 12 weeks of regrowth for each ecotype at each location, a regression analysis was made, assuming linear relationship between dry matter production of each ecotype and the EI. The model used for these regressions was:
where: Yi
a b
Eli e;
Yi = a + b(EIi) + e i [3]
the value of dry matter production at 12 weeks of regrowth of the ecotype under evaluation, at location i. the intercept, which represents the ecotype's mean production for the ecosystem. the slope, which represents the degree of adaptability (change in productivity) of the ecotype to different environments in the ecosystem. the value of the Environmental Index at location i (see equation [2]). error term associated with location i.
Adaptability of an ecotype is described by b (the slope) and Sb (standard error of the slope).
Figure 1 shows some possibilities resulting from the regression analysis. Ecotype A, with a high mean production for the ecosystem (see intercept), responds strongly to improvements in the environment. Ecotype B, with a similar mean production to that of ecotype A, does not respond to changes in the environment's quality. Ecotype C produces less than A and B on the average, and does not respond to environmental improvements.
Ecotype's meat (kg DM
•
• o ^^_
1 1 1
/
product ion / ha )
•3000
-2000
-2400
-2000
•1800
•1200
"o •800
•400
a /
• .
o
Ecotype A
a /
Ecotype B
•
o Ecotype C
O
o
1 1 1
-800 -600 -400 -200 200 400 600 800
EI I kg DM/hal
Figure 1: Outline of possible options for linear regressions between the ecotype's dry matter production and the environmental index (£1).
30
Analysis of performance ofgermplasm evaluated by the International Network for Tropical Pastures Evaluation (RIEPT) in the Savanna and Tropical Forest ecosystems of Tropical America
c) With the results obtained from the previously described analyses, ecotypes were graphically classified according to their productivity in the ecosystem, a, and to their adaptability, b , separately, for max imum and minimum rainfall evaluation periods (Figures 2 and 3). This classification allowed visualising the relative productivity and adaptability of the ecotypes in the ecosystem in relation to the average productivity of all the ecotypes considered, and with regard to the "reference level" of adaptability of an ecotype, represented by b = 1.
d) Finally, an analysis of variance was carried out to compare the ecotypes' productivity across ecosystems, using those ecotypes evaluated in both, isohyperthermic tropical savanna and tropical forests, using the following model:
Yijrk = n+Ai+Lj(A,)+Rr(Lj, Ai)+Ek+(Ai x Ek)+ Lj x E k (Ai)+«rror [4]
where, Yijrk = dry matter production (kg DM/ha) at 12 weeks of regrowth
of ecotype k, in replication r, within location j , of ecosystem i. (x = overall mean effect. Ai = effect of ecosystem i L j (Ai) = effect of location j within ecosystem i. R r (Lj, Ai) = effect of replication r within location j of ecosystem i. Ek = effect of ecotype k. Ai x Ek = effect of ecotype x ecosystem interaction. Lj x Ek (Ai) = effect of ecotype x location interaction within ecosystem i.
Results and Discussion
Results from the statistical analyses carried out are presented initially for the well-drained isohyperthermic tropical savanna ecosystem and afterwards for the tropical forest ecosystem. Finally, performance of ecotypes common to both ecosystems is analysed.
Well-drained isohyperthermic savanna
Tables 1 and 2, respectively, show the locations and ecotypes that were considered in the analysis of this ecosystem.
The results of the analysis of variance for dry matter production (kg DM/ha at 12 weeks of regrowth), for grass and legume ecotypes evaluated in this ecosystem, are found in Table 3 . In it, significant (0.01 < p < 0.05) or highly significant effects (p < 0.01) of " location",."ecotype", and "ecotype x location" interaction, both for grasses and legumes, were found for dry matter production during the max imum rainfall period. This result confirms the existence of differences in environmental quality among locations, differences in productivity among ecotypes, and a different performance of the ecotypes across the range of locations, justifying an adaptability study of the various genotypes for the maximum rainfall period.
31

Biometrical Applications in Tropical Pasture and Agro-pastoral Research
Table 3. Analysis of variance for grass and legume production (kg DM/ha at 12 weeks of regrowth) in the well-drained isohyperthermic savanna.
Sources of variation
GRASSES Location Rep. (location) Ecotype Location x ecotype Error
Corrected total Mean CV (%)
LEGUMES Location Rep. (location) Ecotype Location x ecotype Error
Corrected total Mean CV (%)
Period of maximum rainfall
df
3 1
8 1 3 8
23 2793
21
4 10 15 2
60 150
239 1868
35
F
7.5*
15.2** 16.2**
45.4**
16.4** 3 g**
Period of minimum rainfall
df
2 6 1 2 6
17 276 26
2 6
22 44 132
206 127 69
F
2.2 ns
10.4* 9.8*
7.3 ns
20. r* 3.8"
Out of the 5 experimental locations listed in Table 1, one was excluded from the ANOVA (Guayabal, Puerto Gaitan, Colombia), as grass ecotypes did not germinate due to problems not related to the experiment. Out of the 23 ecotypes listed in Table 2, only 16 were evaluated during maximum rainfall, as indicated in the Table.
** Significant effect with p < 0.01; * Significant effect with 0.01 < p < 0.05; ns: non-significant effect.
In the minimum rainfall period, even though the analyses of variance for both, legumes and grasses, show significant effects (for grasses) and highly significant effects (for legumes) for "ecotype", and for the "ecotype x location" interaction, they did not show statistical differences among locations: their mean productivity was equally low at all locations considered. This result invalidates any adaptability analysis for the ecotypes during the minimum rainfall period.
32
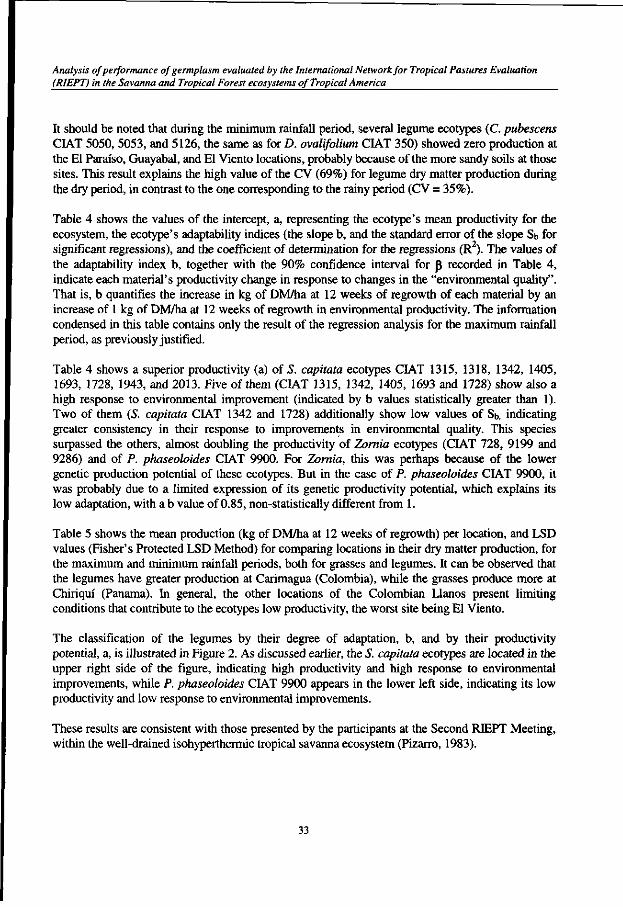
Analysis of performance of germplasm evaluated by the International Network for Tropical Pastures Evaluation (RIEPT) in the Savanna and Tropical Forest ecosystems of Tropical America
It should be noted that during the minimum rainfall period, several legume ecotypes (C. pubescens CIAT 5050, 5053, and 5126, the same as for D. ovalifolium CIAT 350) showed zero production at the El Paraiso, Guayabal, and El Viento locations, probably because of the more sandy soils at those sites. This result explains the high value of the CV (69%) for legume dry matter production during the dry period, in contrast to the one corresponding to the rainy period (CV = 35%).
Table 4 shows the values of the intercept, a, representing the ecotype's mean productivity for the ecosystem, the ecotype's adaptability indices (the slope b, and the standard error of the slope Sb for significant regressions), and the coefficient of determination for the regressions (R ). The values of the adaptability index b, together with the 90% confidence interval for p recorded in Table 4, indicate each material's productivity change in response to changes in the "environmental quality". That is, b quantifies the increase in kg of DM/ha at 12 weeks of regrowth of each material by an increase of 1 kg of DM/ha at 12 weeks of regrowth in environmental productivity. The information condensed in this table contains only the result of the regression analysis for the maximum rainfall period, as previously justified.
Table 4 shows a superior productivity (a) of S. capitata ecotypes CIAT 1315, 1318, 1342, 1405, 1693, 1728, 1943, and 2013. Five of them (CIAT 1315, 1342, 1405, 1693 and 1728) show also a high response to environmental improvement (indicated by b values statistically greater than 1). Two of them (5. capitata CIAT 1342 and 1728) additionally show low values of Sb, indicating greater consistency in their response to improvements in environmental quality. This species surpassed the others, almost doubling the productivity of Zornia ecotypes (CIAT 728, 9199 and 9286) and of P. phaseoloides CIAT 9900. For Zornia, this was perhaps because of the lower genetic production potential of these ecotypes. But in the case of P. phaseoloides CIAT 9900, it was probably due to a limited expression of its genetic productivity potential, which explains its low adaptation, with a b value of 0.85, non-statistically different from 1.
Table 5 shows the mean production (kg of DM/ha at 12 weeks of regrowth) per location, and LSD values (Fisher's Protected LSD Method) for comparing locations in their dry matter production, for the maximum and minimum rainfall periods, both for grasses and legumes. It can be observed that the legumes have greater production at Carimagua (Colombia), while the grasses produce more at Chiriqui (Panama). In general, the other locations of the Colombian Llanos present limiting conditions that contribute to the ecotypes low productivity, the worst site being El Viento.
The classification of the legumes by their degree of adaptation, b, and by their productivity potential, a, is illustrated in Figure 2. As discussed earlier, the S. capitata ecotypes are located in the upper right side of the figure, indicating high productivity and high response to environmental improvements, while P. phaseoloides CIAT 9900 appears in the lower left side, indicating its low productivity and low response to environmental improvements.
These results are consistent with those presented by the participants at the Second RIEPT Meeting, within the well-drained isohyperthermic tropical savanna ecosystem (Pizarro, 1983).
33
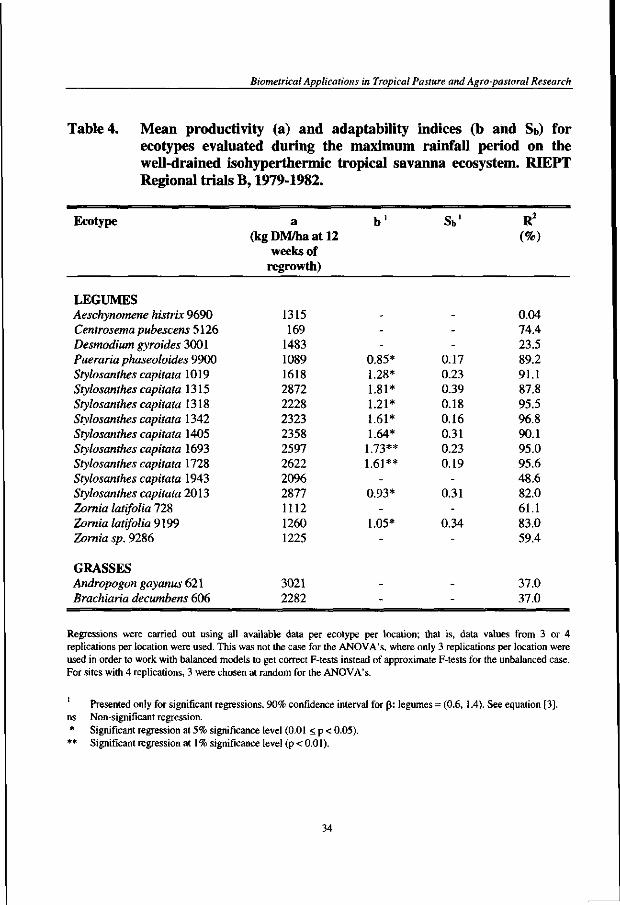
Biometrical Applications in Tropical Pasture and Agro-pastoral Research
Table 4. Mean productivity (a) and adaptability indices (b and Sb) for ecotypes evaluated during the maximum rainfall period on the well-drained isohyperthermic tropical savanna ecosystem. RIEPT Regional trials B, 1979-1982.
Ecotype
LEGUMES Aeschynomene histrix 9690 Centrosema pubescens 5126 Desmodium gyroides 3001 Pueraria phaseoloides 9900 Stylosanthes capitata 1019 Stylosanthes capitata 1315 Stylosanthes capitata 1318 Stylosanthes capitata 1342 Stylosanthes capitata 1405 Stylosanthes capitata 1693 Stylosanthes capitata 1728 Stylosanthes capitata 1943 Stylosanthes capitata 2013 Zornia latifolia 728 Zornia latifolia 9199 Zornia sp. 9286
GRASSES Andropogon gayanus 621 Brachiaria decumbens 606
a (kg DM/ha at 12
weeks of regrowth)
1315 169
1483 1089 1618 2872 2228 2323 2358 2597 2622 2096 2877 1112 1260 1225
3021 2282
b '
---
0.85* 1.28* 1.81* 1.21* 1.61* 1.64* j "73** 1.61**
-0.93*
-1.05*
-
--
sb '
---
0.17 0.23 0.39 0.18 0.16 0.31 0.23 0.19
-0.31
-0.34
-
--
R2
(%)
0.04 74.4 23.5 89.2 91.1 87.8 95.5 96.8 90.1 95.0 95.6 48.6 82.0 61.1 83.0 59.4
37.0 37.0
Regressions were carried out using all available data per ecotype per location; that is, data values from 3 or 4 replications per location were used. This was not the case for the ANOVA's, where only 3 replications per location were used in order to work with balanced models to get correct F-tests instead of approximate F-tests for the unbalanced case. For sites with 4 replications, 3 were chosen at random for the ANOVA's.
Presented only for significant regressions. 90% confidence interval for p: legumes = Non-significant regression. Significant regression at 5% significance level (0.01 < p < 0.05). Significant regression at 1 % significance level (p < 0.01).
(0.6, 1.4). See equation [3],
34
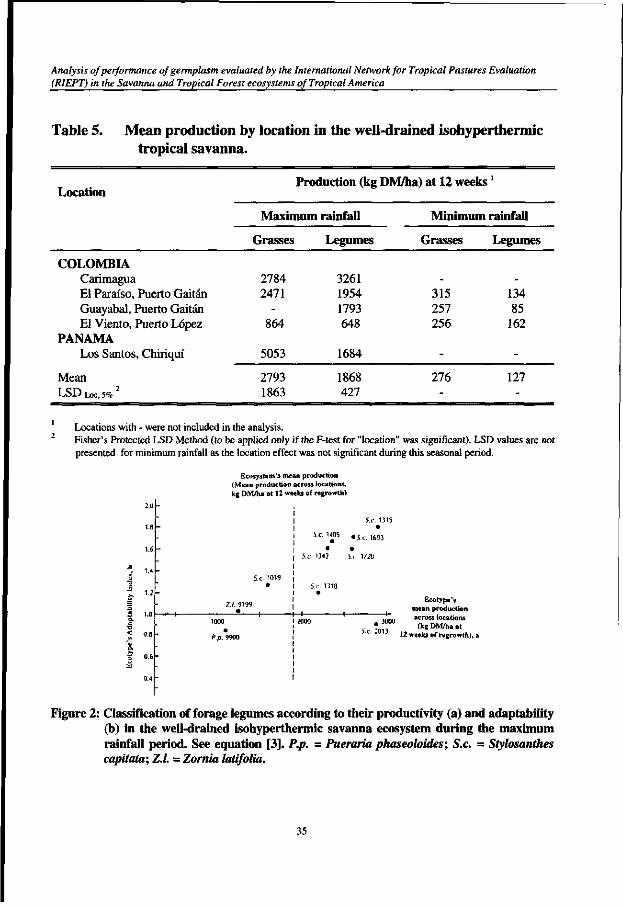
Analysis of performance of germplasm evaluated by the International Network for Tropical Pastures Evaluation (RIEPT) in the Savanna and Tropical Forest ecosystems of Tropical America
Table 5. Mean production by location in the well-drained isohyperthermic tropical savanna.
Location Production (kg DM/ha) at 12 weeks '
Maximum rainfall Minimum rainfall
Grasses Legumes Grasses Legumes
COLOMBIA Carimagua El Paraiso, Puerto Gaitan Guayabal, Puerto Gaitan El Viento, Puerto Lopez
PANAMA Los Santos, Chiriqui
Mean LSD Loc, 5%
2784 2471
-864
5053
2793 1863
3261 1954 1793 648
1684
1868 427
-315 257 256
-
276 -
-134 85 162
-
127 -
Locations with - were not included in the analysis. Fisher's Protected LSD Method (to be applied only if the F-test for "location" was significant). LSD values are not presented for minimum rainfall as the location effect was not significant during this seasonal period.
Ecosystem's mean production (Mean production across locations, kg DM/ha at 12 weeks of regrowth)
— I 1000
P.p. 9900
5c. 1315
• S t . 1693
S i . 1721!
# 3000
S.c. 2013
Ecotype's mean production across locations (kg DM/ha at
12 weeks of regrowth), a
Figure 2: Classification of forage legumes according to their productivity (a) and adaptability (b) in the well-drained isohyperthermic savanna ecosystem during the maximum rainfall period. See equation [3]. P.p. = Pueraria phaseoloides; S.c. = Stylosanthes capitata; Z.l. = Zornia latifolia.
35
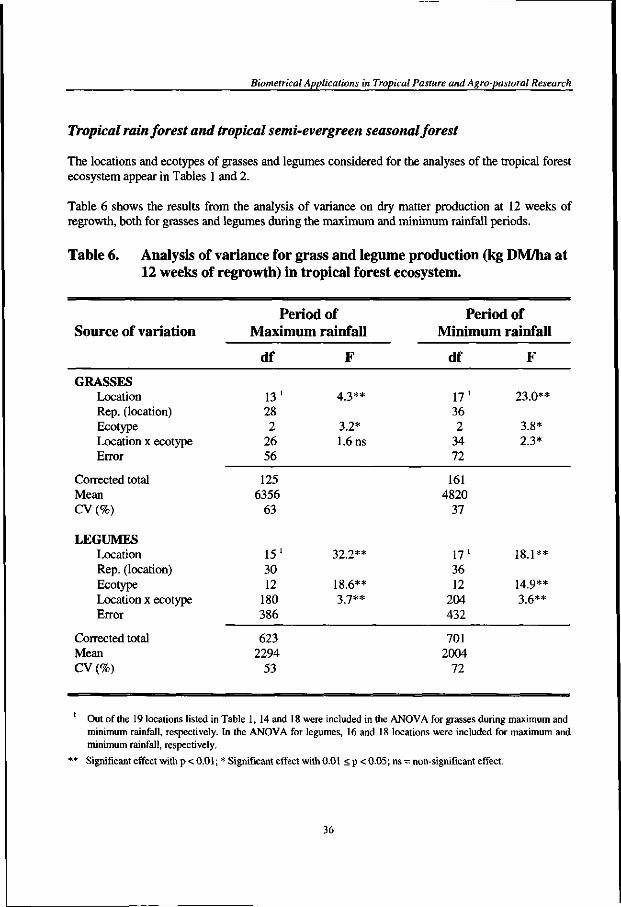
Biometrical Applications in Tropical Pasture and Agro-pastoral Research
Tropical rainforest and tropical semi-evergreen seasonal forest
The locations and ecotypes of grasses and legumes considered for the analyses of the tropical forest ecosystem appear in Tables 1 and 2.
Table 6 shows the results from the analysis of variance on dry matter production at 12 weeks of regrowth, both for grasses and legumes during the maximum and minimum rainfall periods.
Table 6. Analysis of variance for grass and legume production (kg DM/ha at 12 weeks of regrowth) in tropical forest ecosystem.
Source of variation
GRASSES Location Rep. (location) Ecotype Location x ecotype Error
Corrected total Mean CV (%)
LEGUMES Location Rep. (location) Ecotype Location x ecotype Error
Corrected total Mean CV (%)
Period of Maximum rainfall
df
13 ' 28 2
26 56
125 6356
63
15' 30 12
180 386
623 2294
53
F
4 3**
3.2* 1.6 ns
32.2**
18.6** 3 7**
Period of Minimum rainfall
df
17' 36 2
34 72
161 4820
37
17' 36 12
204 432
701 2004
72
F
23.0**
3.8* 2.3*
18.1**
14 9** 3.6**
Out of the 19 locations listed in Table 1, 14 and 18 were included in the ANOVA for grasses during maximum and minimum rainfall, respectively. In the ANOVA for legumes, 16 and 18 locations were included for maximum and minimum rainfall, respectively.
** Significant effect with p < 0.01; * Significant effect with 0.01 < p < 0.05; ns = non-significant effect.
36

Analysis of performance of germplasm evaluated by the International Network for Tropical Pastures Evaluation (RIEPT) in the Savanna and Tropical Forest ecosystems of Tropical America
The analysis of grasses in both periods detected significant differences (0.01 < p < 0.05) among ecotypes (A. gay anus CIAT 621, B. decumbens CIAT 606, and P. maximum CIAT 604) and highly significant differences among locations (p < 0.01). However, the ecotype x location interaction did not turn-out significant during the maximum rainfall period, indicating a consistent relative performance of the grasses across different locations during this season. The legumes, on the other hand, exhibited significant differences (p < 0.01) during both periods among locations, among ecotypes and a significant ecotype x location interaction, thus demonstrating a greater specificity than the grasses in their performance through the ecosystem.
In the Tropical Forest ecosystem, where climatic differences are less extreme between the maximum and minimum rainfall periods than in the isohyperthermic savanna ecosystem, forage plants can maintain their growth throughout the year. The reduction in productivity between the maximum rainfall period and the minimum rainfall one is 24.2%, for grasses and 12.6% for legumes (Table 6), there being individual cases where production during the minimum rainfall period was superior to that of the maximum rainfall period. This fact is probably due to lesser radiation and greater incidence of pests and diseases in the rainy period than in the dry period, a phenomenon that contrasts strongly with what happens on savannas (Table 3).
Table 7 records mean production values of legume and grass ecotypes, a, their adaptability indices (the slope b, and the standard error of the slope, Sb for significant regressions), and the coefficient of determination for each regression, R , for the maximum and minimum rainfall periods.
As can be expected, a higher productivity of grasses is observed, with A. gayanus CIAT 621 standing out. Of the legumes, the most productive are 5. guianensis CIAT 136 and 184, with production over 3000 kg DM/ha at 12 weeks of regrowth, and A. histrix CIAT 9690 and Z. latifolia CIAT 728, with production close to 3000 kg DM/ha.
When comparing ecotype's mean production between the maximum and minimum rainfall periods, a high degree of consistency in their performance (r = 0.88) is observed. The most productive ones during the rainy period are also the most productive in the dry period, and the same thing happens with the least productive ecotypes. This result indicates that climatic conditions during the minimum rainfall period are not so extreme as to alter their ranking in production.
37
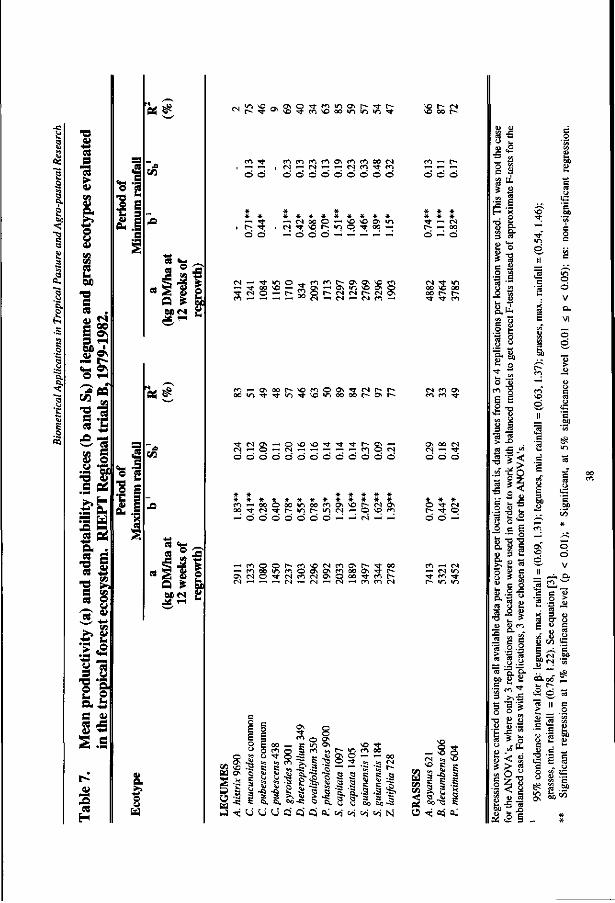
2 00
5
a s
mm
> VI
a o u 0) Cfl t »
2 0X1 -a c « « ! s
I
as
O i - l
a 3 M 5 v O
"O o f
^ 2 5 •3 s
C en
« s
3 u
C 4)
IS
P f i #
co
as^
so
e u
<Ni—• N <- • - M m Tt rn 0 0 0 0 0 0 0 * 0 0
f ^ ? i N OO O — *o Is- >n
— o © © ~
(n 1— r-
© © ©
Tt ~ CS r- i—• oo o ~ ©
<N — TJ-—- TJ- CO "3" (N O
3 £2 S ~ U od
o o o o o o o o o o o o o
co — o o © o o m c o c o o \ v o r ^ c 4 ^
" — ' m © o t ^ c « - > * o < N c * ' ) O N r - - ^ r c o O N C N O ^ - c N r « - i e v » 0 \ O o o ^ m r - -
Tt o o -"
<n — c i —' CN *n •*t co •«* r - >T) m
t3 'tS 4) 4) l~
ll'ltt-llt Ci. C C oo oo -S O O Cj Q Ci ft! c/j to "i vi Ni
a -a
8 <2
§ a
« s
1 £ "S Si c £
.2 c
8 §
O
II
i i i g
§ e
• * * - •
o <L>
e e S T3
1 .2 a -s .•"
* 2
a rt qi
co ° S
— S ^
o d v
o d
r<i —
d
•2 .8 b -2
CT\ VO
r> II
m
o o V
2 -a u
X 3 u
1 | . 2 | | | « "S. o. oo » £
3 >> - _ = S '?
°% •c I ' 3 1> . M .
s < a .2 § 8 en ^- c S S -2
os £ §
2" <o" o , i i
M r s
a i c e S:
4) TJ w

Analysis of performance ofgermplasm evaluated by the International Network for Tropical Pastures Evaluation (RIEPT) in the Savanna and Tropical Forest ecosystems of Tropical America
All regressions, with the exception of those for A. histrix CIAT 9690 and C. pubescens CIAT 438 in the dry period, turned-out significant. The b values tend to be higher as the mean productivity (a) achieved by the ecotype is greater (r = 0.91 for maximum rainfall, and r = 0.86 for minimum rainfall). In particular, S. guianensis CIAT 136 and 184, whose production level is the highest, are the ecotypes that present higher b values in both periods; on the contrary, the materials with less productivity (D. heterophyllum CIAT 349, C. pubescens common) present relatively low b values.
This fact suggests, once again, that in this type of germplasm, adaptability and productivity are usually positively related. When a material is adapted, it is capable of expressing its productivity potential better, and this makes it, in its turn, more sensitive to changes in environmental quality. On the other hand, the least adapted ecotypes face soil, climatic, or biotic limitations that tend to impede the complete expression of their productivity potential, making them less sensitive to changes in environmental quality. Figure 3 illustrates (with more data than Figure 2) the high degree of correlation between a, mean productivity of the ecotype in the ecosystem, and b, adaptability index. The correlation coefficients were, as presented earlier, r = 0.91 for the maximum rainfall period and r = 0.86 for the minimum rainfall period, both highly significant.
Figure 3 classifies legumes for their productivity (a) and adaptability (b) during maximum and minimum rainfall periods in forest ecosystems, using the same method of quadrants. In agreement with what was mentioned earlier, S. guianensis CIAT 136 and 184 ecotypes are the ones with the highest productivity and high response to environmental changes in maximum and minimum rainfall periods. Z latifolia CIAT 728 and S. capitata CIAT 1097 are legumes with an intermediate performance. The latter maintains its productivity in the two seasons and increases its response to the environment in the dry period. Z latifolia CIAT 728 shows higher productivity during the rainy period and lower productivity in the dry period, with a limited response to environmental improvements during the latter period. P. phaseoloides CIAT 9900, D. ovalifolium CIAT 350, C. pubescens CIAT 438, and C. pubescens common are materials found in the lower left quadrant during maximum and minimum rainfall, with productivity lower than the average and a low response to environmental changes. The case of D. ovalifolium CIAT 350 should be isolated here: it constantly kept its production around the average during the two periods, showing a low response to environmental changes.
Combined analysis of ecotypes common to the tropical savanna and tropical forest ecosystems
In order to obtain information on the performance of the ecotypes tested by the RIEPT, not only within each larger ecosystem but also across the two major ecosystems considered (isohyperthermic tropical savanna and tropical forest), dry matter production (kg/ha at 12 weeks of regrowth) was analysed for two grass ecotypes (A. gay anus CIAT 621 and B. decumbens CIAT 606) and six legumes (A. histrix CIAT 9690, D. gyroides CIAT 3001, P. phaseoloides CIAT 9900, S. capitata 1405, D. ovalifolium CIAT 350, and Z latifolia CIAT 728), each tested in experimental locations of both ecosystems.
The analysis on grasses indicates (Table 8) that the mean productivity of the two ecosystems differs (0.01 < p < 0.05) both in the maximum and in the minimum rainfall periods; in the latter period
39
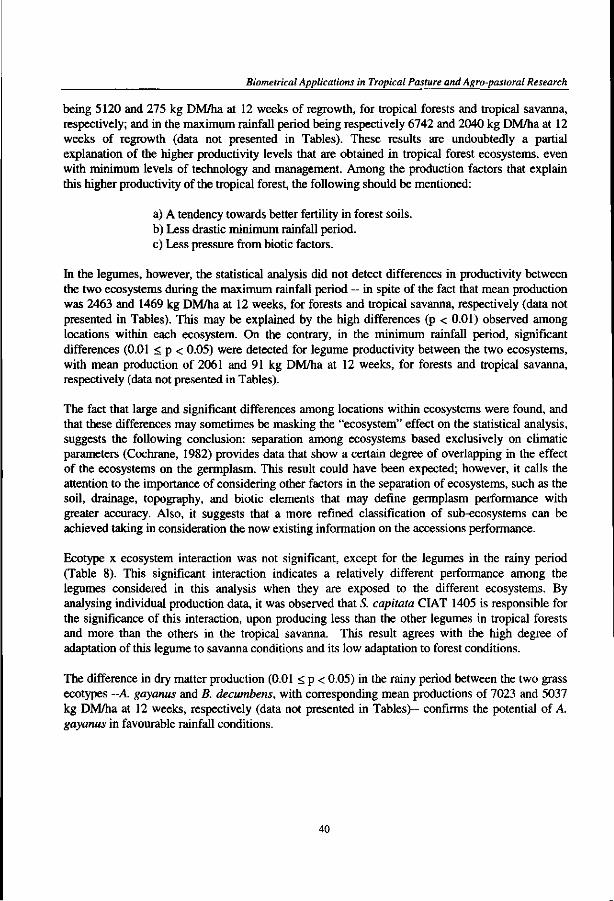
Biometrical Applications in Tropical Pasture and Agro-pastoral Research
being 5120 and 275 kg DM/ha at 12 weeks of regrowth, for tropical forests and tropical savanna, respectively; and in the maximum rainfall period being respectively 6742 and 2040 kg DM/ha at 12 weeks of regrowth (data not presented in Tables). These results are undoubtedly a partial explanation of the higher productivity levels that are obtained in tropical forest ecosystems, even with minimum levels of technology and management. Among the production factors that explain this higher productivity of the tropical forest, the following should be mentioned:
a) A tendency towards better fertility in forest soils. b) Less drastic minimum rainfall period. c) Less pressure from biotic factors.
In the legumes, however, the statistical analysis did not detect differences in productivity between the two ecosystems during the maximum rainfall period — in spite of the fact that mean production was 2463 and 1469 kg DM/ha at 12 weeks, for forests and tropical savanna, respectively (data not presented in Tables). This may be explained by the high differences (p < 0.01) observed among locations within each ecosystem. On the contrary, in the minimum rainfall period, significant differences (0.01 £ p < 0.05) were detected for legume productivity between the two ecosystems, with mean production of 2061 and 91 kg DM/ha at 12 weeks, for forests and tropical savanna, respectively (data not presented in Tables).
The fact that large and significant differences among locations within ecosystems were found, and that these differences may sometimes be masking the "ecosystem" effect on the statistical analysis, suggests the following conclusion: separation among ecosystems based exclusively on climatic parameters (Cochrane, 1982) provides data that show a certain degree of overlapping in the effect of the ecosystems on the germplasm. This result could have been expected; however, it calls the attention to the importance of considering other factors in the separation of ecosystems, such as the soil, drainage, topography, and biotic elements that may define germplasm performance with greater accuracy. Also, it suggests that a more refined classification of sub-ecosystems can be achieved taking in consideration the now existing information on the accessions performance.
Ecotype x ecosystem interaction was not significant, except for the legumes in the rainy period (Table 8). This significant interaction indicates a relatively different performance among the legumes considered in this analysis when they are exposed to the different ecosystems. By analysing individual production data, it was observed that 5. capitata CIAT 1405 is responsible for the significance of this interaction, upon producing less than the other legumes in tropical forests and more than the others in the tropical savanna. This result agrees with the high degree of adaptation of this legume to savanna conditions and its low adaptation to forest conditions.
The difference in dry matter production (0.01 < p < 0.05) in the rainy period between the two grass ecotypes —A. gayanus and B. decumbens, with corresponding mean productions of 7023 and 5037 kg DM/ha at 12 weeks, respectively (data not presented in Tables)— confirms the potential of A gayanus in favourable rainfall conditions.
40
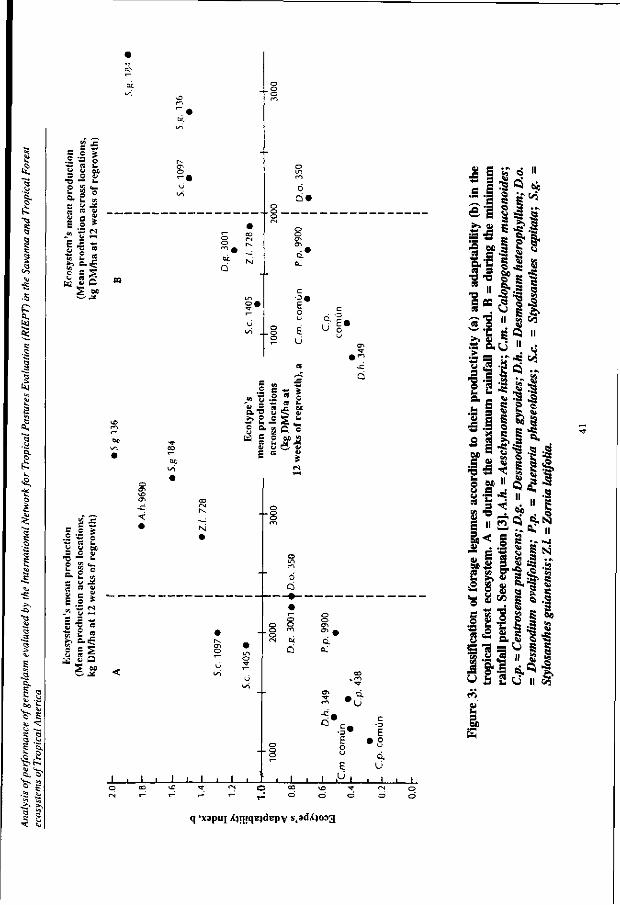
c c
•n o a.
(fi E
c
c
o t f l
o
c o ".5 s c u a c « ?
c
u. o
c<
, a •h s w
j :
°» ^ _ _o
0
! •
E u
0
•n .2 <*
> i g O g b
« i £.S?J2
-c
N
K
.11
" 8 0.
0 _J i L
g ii a 1
J=§ a S.!f 8 S s s i « .S
q 'xapuj AjijiqBjdEpv s^diCjoag
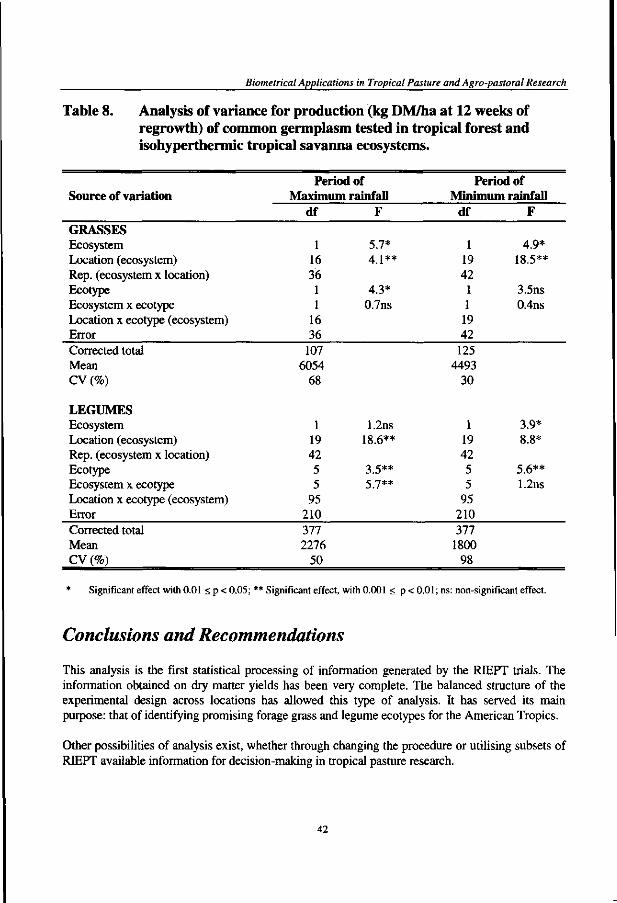
Biometrical Applications in Tropical Pasture and Agro-pastoral Research
Table 8. Analysis of variance for production (kg DM/ha at 12 weeks of regrowth) of common germplasm tested in tropical forest and isohyperthermic tropical savanna ecosystems.
Source of variation
GRASSES Ecosystem Location (ecosystem) Rep. (ecosystem x location) Ecotype Ecosystem x ecotype Location x ecotype (ecosystem) Error Corrected total Mean CV (%)
LEGUMES Ecosystem Location (ecosystem) Rep. (ecosystem x location) Ecotype Ecosystem x ecotype Location x ecotype (ecosystem) Error Corrected total Mean CV (%)
Period of Maximum rainfall
df
1 16 36 1 1
16 36
107 6054
68
1 19 42 5 5
95 210 377 2276
50
F
5.7* 4 J**
4.3* 0.7ns
1.2ns 18.6**
3.5** 5.7**
Period of Minimum rainfall
df
1 19 42 1 1 19 42 125
4493 30
1 19 42 5 5
95 210 377
1800 98
F
4.9* 18.5**
3.5ns 0.4ns
3.9* 8.8*
5.6** 1.2ns
Significant effect with 0.01 < p < 0.05; ** Significant effect, with 0.001 < p < 0.01; ns: non-significant effect.
Conclusions and Recommendations
This analysis is the first statistical processing of information generated by the RTEPT trials. The information obtained on dry matter yields has been very complete. The balanced structure of the experimental design across locations has allowed this type of analysis. It has served its main purpose: that of identifying promising forage grass and legume ecotypes for the American Tropics.
Other possibilities of analysis exist, whether through changing the procedure or utilising subsets of RIEPT available information for decision-making in tropical pasture research.
42
Analysis of performance of germplasm evaluated by the International Network for Tropical Pastures Evaluation (RIEPT) in the Savanna and Tropical Forest ecosystems of Tropical America
Chapter 4 of this dissertation illustrates the use of information generated by RIEPT trials for finding niches of adaptation of highly promising materials identified by this first analysis. In particular, the legume ecotype Stylosanthes guianensis CIAT 184 is characterised in terms of its range of adaptation across the Tropical Forest ecosystem.
Results achieved up to now indicate that a high correlation exists between adaptability and productivity of an ecotype. They suggest that ecotypes with a high capacity to respond to changes in environmental quality usually manifest high productivity. Expressed in another way, ecotypes not facing soil, climatic, or biotic limitations can better express their genetic production potential than those facing restrictions, which would lead them to behave uniformly at their lowest level.
Results from the analysis on well-drained isohyperthermic tropical savannas define S. capitata as the legume species with best adaptation to that ecosystem, its most productive accessions being the following: CIAT 1315, 1318, 1342, 1405, 1693, and 1728. Among the grasses, A. gayanus CIAT 621 and B. decumbens CIAT 606 were highly productive and showed good adaptation. These materials should be advanced to RIEPT grazing trials (Regional Trials C and Regional Trials D).
Results from the analysis on the tropical forest ecosystem identified S. guianensis CIAT 136 and 184 as legumes with high productivity and adaptability. Also Z latifolia CIAT 728, S. capitata 1097, and D. ovalifolium CIAT 350 scored highly. These materials should be advanced to grazing trials.
The analysis of variance with materials common to both ecosystems (isohyperthermic savannas and tropical forest) shows a significant higher productivity, both in grasses and legumes, in the tropical forest ecosystem, except for the case of legumes during the maximum rainfall season, where no significant difference in productivity between the two ecosystems was detected.
The larger differences in productivity among locations than among ecosystems, point-out the need to separate ecosystems by using other parameters besides climatic ones, which will help explain germplasm performance more accurately.
References
Amezquita, M. C , 1982. Recopilacion, procesamiento y analisis de la information. In: Toledo, J. M. (ed.). Manual para la evaluation agronomica. 117-125. Book series CIAT 07SG-1(82). Red International de Evaluation de Pastos Tropicales (RIEPT) and Centra International de Agriculture Tropical (CIAT). Cali, Colombia.
Cochrane, T.T., 1982. Caracterizacion agroecologica para el desarrollo de pastures en suelos acidos de America Tropical. In: J.M. Toledo, (ed.). Manual para la evaluation agronomica, Red International de Evaluation de Pastos Tropicales (RIEPT). 23^4. CIAT. Cali, Colombia.
Cochrane, T. T. and Jones, P. G., 1981. Savannas, forests and wet season potential evapotranspiration in tropical South America. Trop. Agric. (Trinidad) 58(3): 185-190.
43
Biometrical Applications in Tropical Pasture and Agro-pastoral Research
Eberhart, S. A. and Russell, W. A., 1966. Stability parameters for comparing varieties. Crop Science 1: 135-140.
Mcintosh, M. S., 1982. Analysis of combined experiments. Scientific article no. A-3167. 153-155. Agronomy Department, University of Maryland, College Park, MD., U.S.A.
Pizarro, E. A. (ed.), 1983. Red Internacional de Evaluacion de Pasturas Tropicales. CIAT. Book series ISSN 012(M882,460 pp.
Toledo, J. M. and Schultze-Kraft, R., 1982. Metodologia para la evaluacion agronomica de pastos tropicales. In: Toledo, J. M. (ed.). Manual para la evaluacion agronomica. 91-110. Book series CIAT 07SG-1(82). Red Internacional de Evaluacion de Pastos Tropicales (RIEPT) and Centre Internacional de Agriculture Tropical (CIAT). Cali, Colombia.
44

Agronomic performance of Stvlosanthes euianensis cv. Pucallpa in the American Tropical Rain Forest ecosystem
Chapter 4
Agronomic performance of Stylosanthes guianensis cv. Pucallpa in the American tropical rainforest ecosystem1
M.C. Amezquita2, J.M. Toledo1 and G.Keller-Grein4
Introduction
Stylosanthes guianensis is a tropical forage legume originated from South America. Several commercial cultivars which were released in Australia, viz. Schofield, Cook, Endeavour, and Graham, when reintroduced into tropical America in the 1950's, were very heavily attacked by the fungus anthracnose (Colletotrichum gloesporiodes).
As a result of the initial multilocational trials of the REEPT (International Network for Tropical Pastures Evaluation), 5. guianensis CIAT 184 was selected as a promising line for the humid tropics in South America. Although this material is susceptible to anthracnose under savanna conditions, it is not in the humid tropics. Lenne and Ordonez (1988) found that antagonistic bacteria on leaf surfaces, common in the humid tropical environments, hindered the spread of anthracnose. In addition, Lenne, Pizarro and Toledo (1985) found that due to the small change in temperature between day arid night, a characteristic of the humid tropics, the infection caused by anthracnose in S. guianensis CIAT 184 remained latent and non-systemic.
Between 1979 and 1984 S. guianensis CIAT 184 was evaluated in plot trials in many locations and under grazing in Peru. As a result, rVITA (Instituto Veterinario de Investigaciones Tropicales y de Altura) and EMIPA (Instituto Nacional de Investigation y Promotion Agropecuaria del Peru) released this line as cultivar Pucallpa in January 1985. Later grazing trials conducted in producers' fields demonstrated the ease of establishment of this cultivar and its value for animal production in both weight gain and milk production (CIAT 1989; 1990).
Adapted from the article published in: Tropical Grasslands (1991) Volume 25, 262-267. Head Biometry Unit; Leader Tropical Pastures Program; and Agronomist Tropical Pastures Program. Centro Internacional de Agricultura Tropical (CIAT). Cali, Colombia.
45
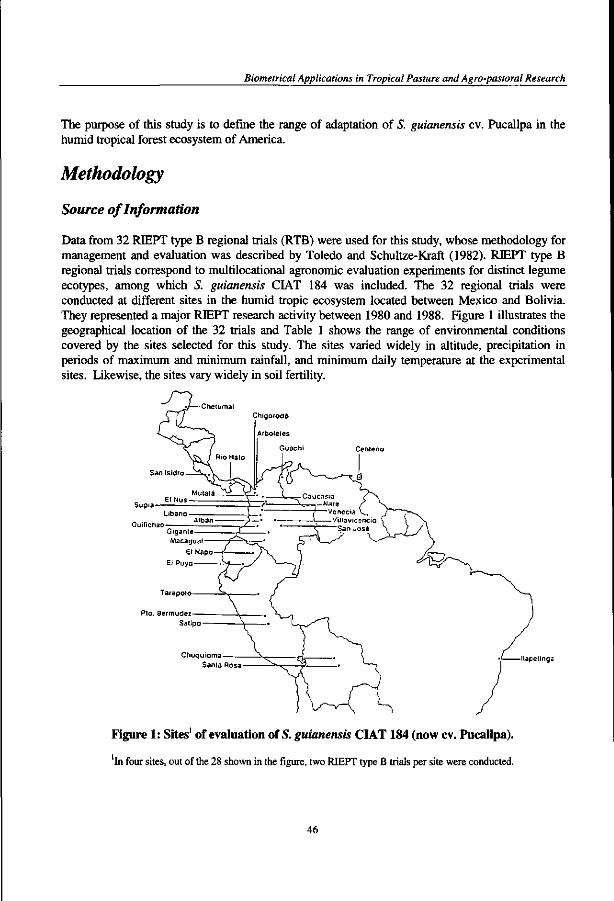
Biometrical Applications in Tropical Pasture and Agro-pastoral Research
The purpose of this study is to define the range of adaptation of S. guianensis cv. Pucallpa in the humid tropical forest ecosystem of America.
Methodology
Source of Information
Data from 32 RIEPT type B regional trials (RTB) were used for this study, whose methodology for management and evaluation was described by Toledo and Schultze-Kraft (1982). RIEPT type B regional trials correspond to multilocational agronomic evaluation experiments for distinct legume ecotypes, among which 5. guianensis CIAT 184 was included. The 32 regional trials were conducted at different sites in the humid tropic ecosystem located between Mexico and Bolivia. They represented a major RIEPT research activity between 1980 and 1988. Figure 1 illustrates the geographical location of the 32 trials and Table 1 shows the range of environmental conditions covered by the sites selected for this study. The sites varied widely in altitude, precipitation in periods of maximum and minimum rainfall, and minimum daily temperature at the experimental sites. Likewise, the sites vary widely in soil fertility.
Supia
Tarapoto
Plo. Bermudez
Salipo
Chuquioma Santa Rosa
llapetinga
Figure 1: Sites' of evaluation of S. guianensis CIAT 184 (now cv. Pucallpa).
In four sites, out of the 28 shown in the figure, two RIEPT type B trials per site were conducted.
46
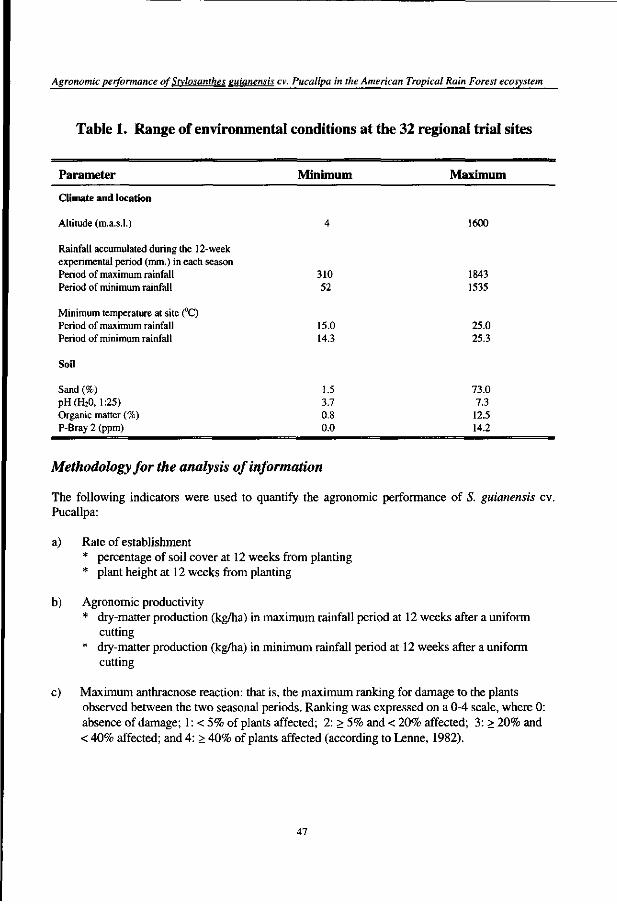
Agronomic performance of Stvlosanthes puianensis cv. Pucallpa in the American Tropical Rain Forest ecosystem
Table 1. Range of environmental conditions at the 32 regional trial sites
Parameter Minimum Maximum
Climate and location
Altitude (m.a.s.l.)
Rainfall accumulated during the 12-week experimental period (mm.) in each season Period of maximum rainfall Period of minimum rainfall
Minimum temperature at site (°C) Period of maximum rainfall Period of minimum rainfall
310 52
15.0 14.3
1600
1843 1535
25.0 25.3
SoU
Sand (%) PH(H20, 1:25) Organic matter (%) P-Bray 2 (ppm)
1.5 3.7 0.8 0.0
73.0 7.3 12.5 14.2
Methodology for the analysis of information
The following indicators were used to quantify the agronomic performance of S. guianensis cv. Pucallpa:
a) Rate of establishment * percentage of soil cover at 12 weeks from planting * plant height at 12 weeks from planting
b) Agronomic productivity * dry-matter production (kg/ha) in maximum rainfall period at 12 weeks after a uniform
cutting * dry-matter production (kg/ha) in minimum rainfall period at 12 weeks after a uniform
cutting
c) Maximum anthracnose reaction: that is, the maximum ranking for damage to the plants observed between the two seasonal periods. Ranking was expressed on a 0-4 scale, where 0: absence of damage; 1: < 5% of plants affected; 2: > 5% and < 20% affected; 3: > 20% and < 40% affected; and 4: > 40% of plants affected (according to Lenne, 1982).
47
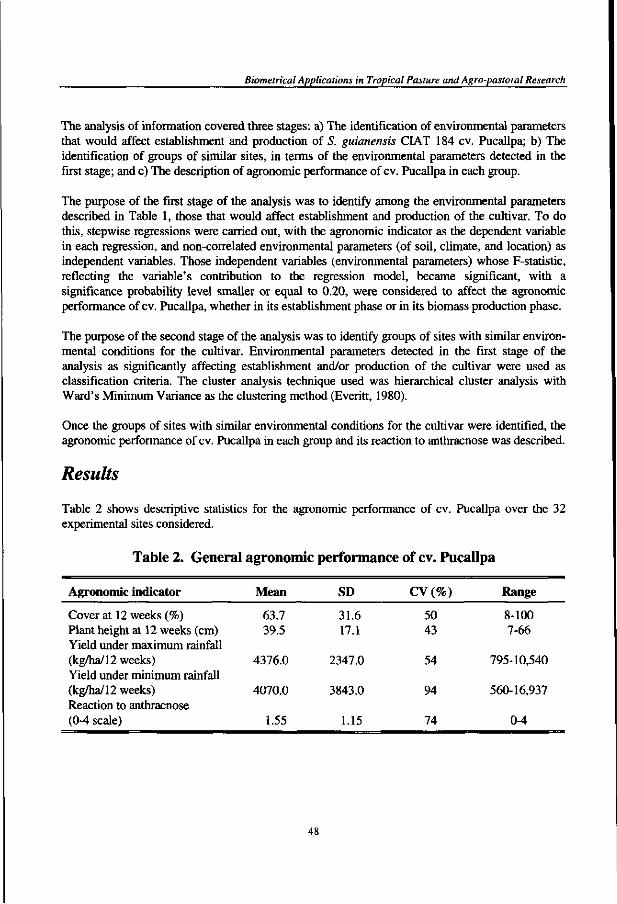
Biometrical Applications in Tropical Pasture and Agro-pastoral Research
The analysis of information covered three stages: a) The identification of environmental parameters that would affect establishment and production of S. guianensis CIAT 184 cv. Pucallpa; b) The identification of groups of similar sites, in terms of the environmental parameters detected in the first stage; and c) The description of agronomic performance of cv. Pucallpa in each group.
The purpose of the first stage of the analysis was to identify among the environmental parameters described in Table 1, those that would affect establishment and production of the cultivar. To do this, stepwise regressions were carried out, with the agronomic indicator as the dependent variable in each regression, and non-correlated environmental parameters (of soil, climate, and location) as independent variables. Those independent variables (environmental parameters) whose F-statistic, reflecting the variable's contribution to the regression model, became significant, with a significance probability level smaller or equal to 0.20, were considered to affect the agronomic performance of cv. Pucallpa, whether in its establishment phase or in its biomass production phase.
The purpose of the second stage of the analysis was to identify groups of sites with similar environmental conditions for the cultivar. Environmental parameters detected in the first stage of the analysis as significantly affecting establishment and/or production of the cultivar were used as classification criteria. The cluster analysis technique used was hierarchical cluster analysis with Ward's Minimum Variance as the clustering method (Everitt, 1980).
Once the groups of sites with similar environmental conditions for the cultivar were identified, the agronomic performance of cv. Pucallpa in each group and its reaction to anthracnose was described.
Results
Table 2 shows descriptive statistics for the agronomic performance of cv. Pucallpa over the 32 experimental sites considered.
Table 2. General agronomic performance of cv. Pucallpa
Agronomic indicator
Cover at 12 weeks (%) Plant height at 12 weeks (cm) Yield under maximum rainfall (kg/ha/12 weeks) Yield under minimum rainfall (kg/ha/12 weeks) Reaction to anthracnose (0-4 scale)
Mean
63.7 39.5
4376.0
4070.0
1.55
SD
31.6 17.1
2347.0
3843.0
1.15
CV (%)
50 43
54
94
74
Range
8-100 7-66
795-10,540
560-16,937
0-4
48
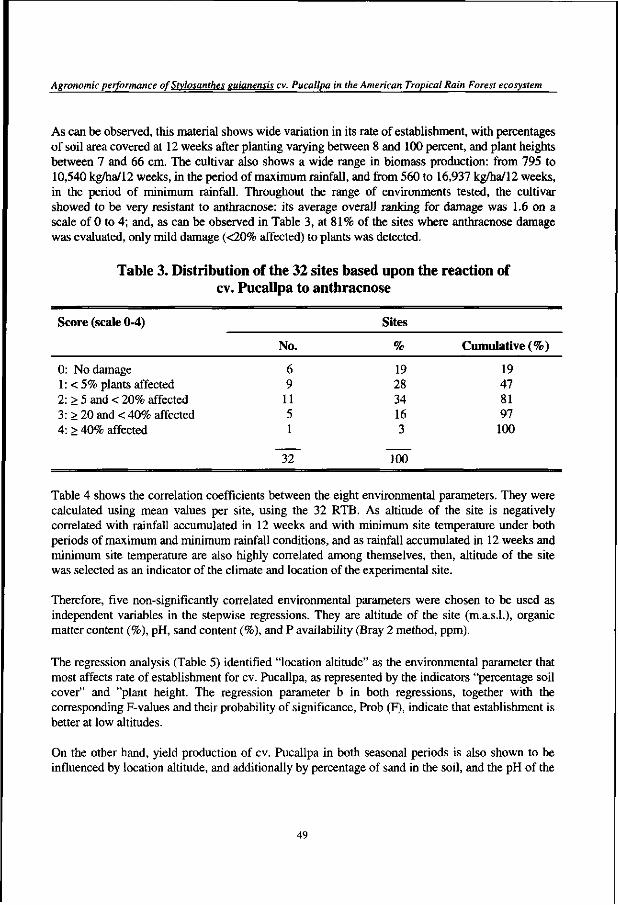
Agronomic performance of Stvlosanthes euianensis cv. Pucallpa in the American Tropical Rain Forest ecosystem
As can be observed, this material shows wide variation in its rate of establishment, with percentages of soil area covered at 12 weeks after planting varying between 8 and 100 percent, and plant heights between 7 and 66 cm. The cultivar also shows a wide range in biomass production: from 795 to 10,540 kg/ha/12 weeks, in the period of maximum rainfall, and from 560 to 16,937 kg/ha/12 weeks, in the period of minimum rainfall. Throughout the range of environments tested, the cultivar showed to be very resistant to anthracnose: its average overall ranking for damage was 1.6 on a scale of 0 to 4; and, as can be observed in Table 3, at 81% of the sites where anthracnose damage was evaluated, only mild damage (<20% affected) to plants was detected.
Table 3. Distribution of the 32 sites based upon the reaction of cv. Pucallpa to anthracnose
Score (scale 0-4) Sites
0: No damage 1: < 5% plants affected 2: > 5 and < 20% affected 3: > 20 and < 40% affected 4: > 40% affected
No.
6 9 11 5 1
32
%
19 28 34 16 3
100
Cumulative (%)
19 47 81 97 100
Table 4 shows the correlation coefficients between the eight environmental parameters. They were calculated using mean values per site, using the 32 RTB. As altitude of the site is negatively correlated with rainfall accumulated in 12 weeks and with minimum site temperature under both periods of maximum and minimum rainfall conditions, and as rainfall accumulated in 12 weeks and minimum site temperature are also highly correlated among themselves, then, altitude of the site was selected as an indicator of the climate and location of the experimental site.
Therefore, five non-significantly correlated environmental parameters were chosen to be used as independent variables in the stepwise regressions. They are altitude of the site (m.a.s.l.), organic matter content (%), pH, sand content (%), and P availability (Bray 2 method, ppm).
The regression analysis (Table 5) identified "location altitude" as the environmental parameter that most affects rate of establishment for cv. Pucallpa, as represented by the indicators "percentage soil cover" and "plant height. The regression parameter b in both regressions, together with the corresponding F-values and their probability of significance, Prob (F), indicate that establishment is better at low altitudes.
On the other hand, yield production of cv. Pucallpa in both seasonal periods is also shown to be influenced by location altitude, and additionally by percentage of sand in the soil, and the pH of the
49
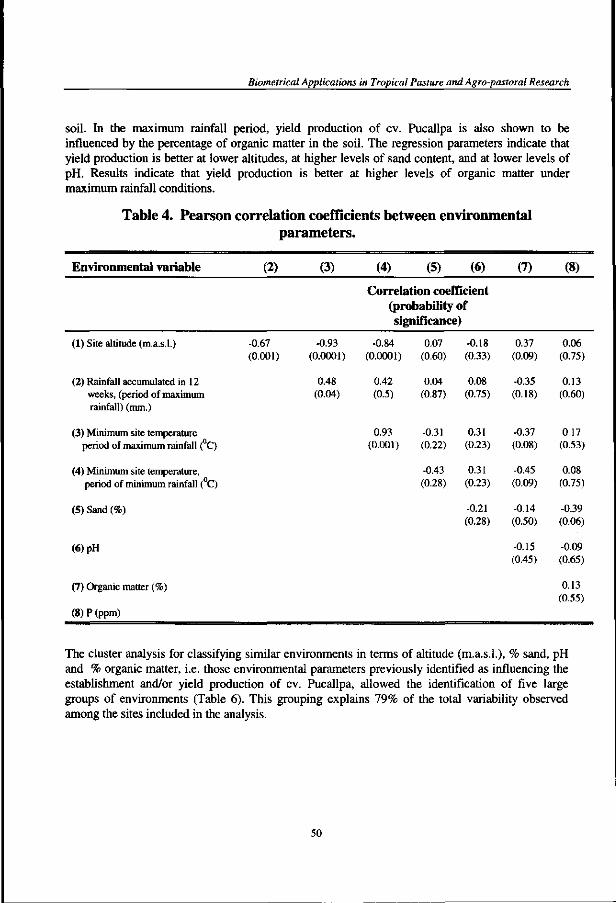
Biometrical Applications in Tropical Pasture and Agro-pastoral Research
soil. In the maximum rainfall period, yield production of cv. Pucallpa is also shown to be influenced by the percentage of organic matter in the soil. The regression parameters indicate that yield production is better at lower altitudes, at higher levels of sand content, and at lower levels of pH. Results indicate that yield production is better at higher levels of organic matter under maximum rainfall conditions.
Table 4. Pearson correlation coefficients between environmental parameters.
Environmental variable
(1) Site altitude (m.a.s.l.)
(2) Rainfall accumulated in 12 weeks, (period of maximum rainfall) (mm.)
(3) Minimum site temperature period of maximum rainfall ( C)
(4) Minimum site temperature, period of minimum rainfall (°C)
(5) Sand (%)
(6)pH
(7) Organic matter (%)
(8)P(ppm)
(2)
-0.67 (0.001)
(3)
-0.93 (0.0001)
0.48 (0.04)
(4) (5) (6)
Correlation coefficient (probability of significance)
-0.84 (0.0001)
0.42 (0.5)
0.93 (0.001)
0.07 (0.60)
0.04 (0.87)
-0.31 (0.22)
-0.43 (0.28)
-0.18 (0.33)
0.08 (0.75)
0.31 (0.23)
0.31 (0.23)
-0.21 (0.28)
(7)
0.37 (0.09)
-0.35 (0.18)
-0.37 (0.08)
-0.45 (0.09)
-0.14 (0.50)
-0.15 (0.45)
(8)
0.06 (0.75)
0.13 (0.60)
0.17 (0.53)
0.08 (0.75)
-0.39 (0.06)
-0.09 (0.65)
0.13 (0.55)
The cluster analysis for classifying similar environments in terms of altitude (m.a.s.l.), % sand, pH and % organic matter, i.e. those environmental parameters previously identified as influencing the establishment and/or yield production of cv. Pucallpa, allowed the identification of five large groups of environments (Table 6). This grouping explains 79% of the total variability observed among the sites included in the analysis.
50
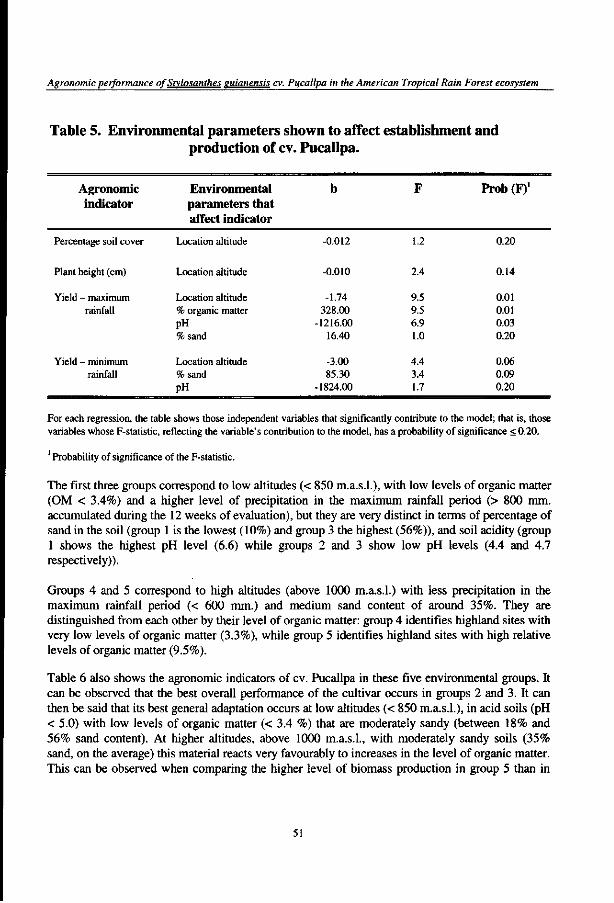
Agronomic performance of Srvlosanthes euianensis cv. Pifcallpa in the American Tropical Rain Forest ecosystem
Table 5. Environmental parameters shown to affect establishment and production of cv. Pucallpa.
Agronomic indicator
Percentage soil cover
Plant height (cm)
Yield - maximum rainfall
Yield - minimum rainfall
Environmental parameters that affect indicator
Location altitude
Location altitude
Location altitude % organic matter pH %sand
Location altitude % sand PH
b
-0.012
-0.010
-1.74 328.00
-1216.00 16.40
-3.00 85.30
-1824.00
F
1.2
2.4
9.5 9.5 6.9 1.0
4.4 3.4 1.7
Prob(F)'
0.20
0.14
0.01 0.01 0.03 0.20
0.06 0.09 0.20
For each regression, the table shows those independent variables that significantly contribute to the model; that is, those variables whose F-statistic, reflecting the variable's contribution to the model, has a probability of significance < 0.20.
Probability of significance of the F-statistic.
The first three groups correspond to low altitudes (< 850 m.a.s.l.), with low levels of organic matter (OM < 3.4%) and a higher level of precipitation in the maximum rainfall period (> 800 mm. accumulated during the 12 weeks of evaluation), but they are very distinct in terms of percentage of sand in the soil (group 1 is the lowest (10%) and group 3 the highest (56%)), and soil acidity (group 1 shows the highest pH level (6.6) while groups 2 and 3 show low pH levels (4.4 and 4.7 respectively)).
Groups 4 and 5 correspond to high altitudes (above 1000 m.a.s.l.) with less precipitation in the maximum rainfall period (< 600 mm.) and medium sand content of around 35%. They are distinguished from each other by their level of organic matter: group 4 identifies highland sites with very low levels of organic matter (3.3%), while group 5 identifies highland sites with high relative levels of organic matter (9.5%).
Table 6 also shows the agronomic indicators of cv. Pucallpa in these five environmental groups. It can be observed that the best overall performance of the cultivar occurs in groups 2 and 3. It can then be said that its best general adaptation occurs at low altitudes (< 850 m.a.s.l.), in acid soils (pH < 5.0) with low levels of organic matter (< 3.4 %) that are moderately sandy (between 18% and 56% sand content). At higher altitudes, above 1000 m.a.s.l., with moderately sandy soils (35% sand, on the average) this material reacts very favourably to increases in the level of organic matter. This can be observed when comparing the higher level of biomass production in group 5 than in
51
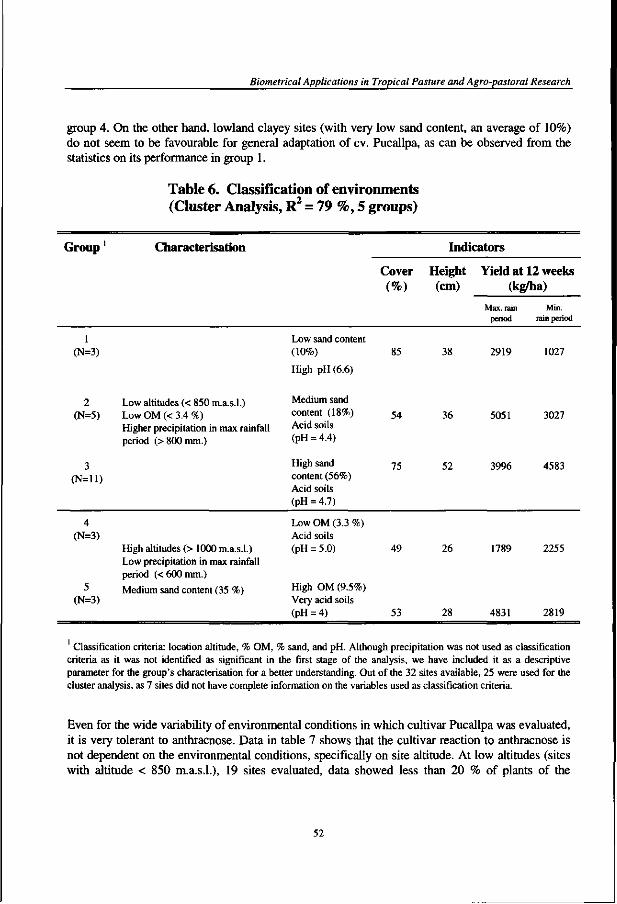
Biometrical Applications in Tropical Pasture and Agro-pastoral Research
group 4. On the other hand, lowland clayey sites (with very low sand content, an average of 10%) do not seem to be favourable for general adaptation of cv. Pucallpa, as can be observed from the statistics on its performance in group 1.
Table 6. Classification of environments (Cluster Analysis, R = 79 %, 5 groups)
Group' Characterisation Indicators
Cover Height Yield at 12 weeks (%) (cm) (kg/ha)
Max. rain Min. period rain period
1 (N=3)
2 (N=5)
3 (N=ll)
4 (N=3)
5 (N=3)
Low altitudes (< 850 m.a.s.l.) Low OM (< 3.4 %) Higher precipitation in max rainfall period (> 800 mm.)
High altitudes (> 1000 m.a.s.l.) Low precipitation in max rainfall period (< 600 mm.)
Medium sand content (35 %)
Low sand content (10%)
High pH (6.6)
Medium sand
content (18%) Acid soils (pH = 4.4)
High sand content (56%) Acid soils (pH = 4.7)
Low OM (3.3 %) Acid soils (pH = 5.0)
High OM(9.5%) Very acid soils (pH = 4)
85
54
75
49
53
38 2919 1027
36 5051 3027
52 3996 4583
26 1789 2255
28 4831 2819
Classification criteria: location altitude, % OM, % sand, and pH. Although precipitation was not used as classification criteria as it was not identified as significant in the first stage of the analysis, we have included it as a descriptive parameter for the group's characterisation for a better understanding. Out of the 32 sites available, 25 were used for the cluster analysis, as 7 sites did not have complete information on the variables used as classification criteria.
Even for the wide variability of environmental conditions in which cultivar Pucallpa was evaluated, it is very tolerant to anthracnose. Data in table 7 shows that the cultivar reaction to anthracnose is not dependent on the environmental conditions, specifically on site altitude. At low altitudes (sites with altitude < 850 m.a.s.l.), 19 sites evaluated, data showed less than 20 % of plants of the
52
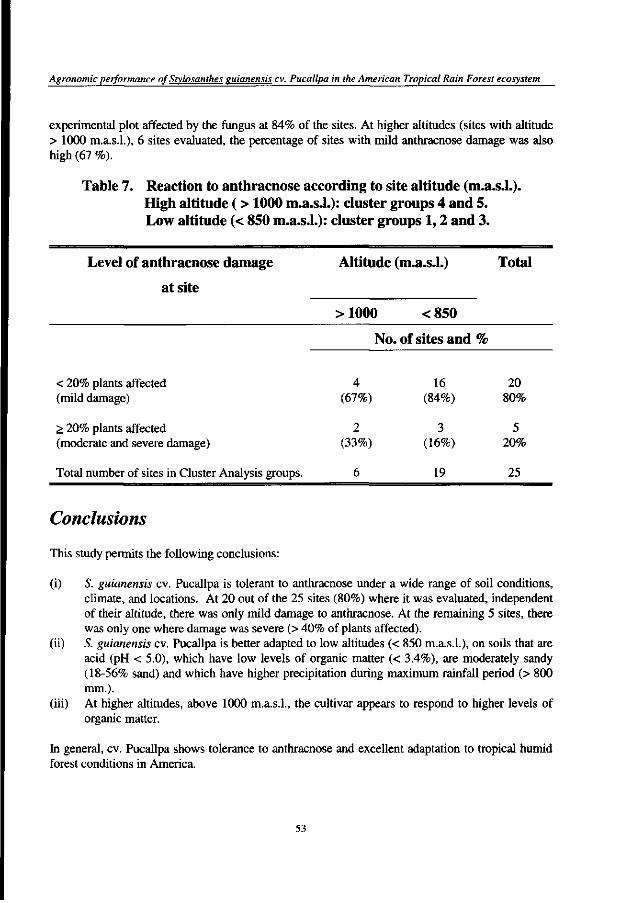
Agronomic performance of Stvlosanthes euianensis cv. Pucallpa in the American Tropical Rain Forest ecosystem
experimental plot affected by the fungus at 84% of the sites. At higher altitudes (sites with altitude > 1000 m.a.s.l.), 6 sites evaluated, the percentage of sites with mild anthracnose damage was also high (67 %).
Table 7. Reaction to anthracnose according to site altitude (m.a.s.l.). High altitude (> 1000 m.a.s.l.): cluster groups 4 and 5. Low altitude (< 850 m.a.s.l.): cluster groups 1,2 and 3.
Level of anthracnose damage Altitude (m.a.s.l.) Total
at site
> 1000 < 850
No. of sites and %
< 20% plants affected 4 16 20 (mild damage) (67%) (84%) 80%
> 20% plants affected 2 3 5 (moderate and severe damage) (33%) (16%) 20%
Total number of sites in Cluster Analysis groups. 6 19 25
Conclusions
This study permits the following conclusions:
(i) S. guianensis cv. Pucallpa is tolerant to anthracnose under a wide range of soil conditions, climate, and locations. At 20 out of the 25 sites (80%) where it was evaluated, independent of their altitude, there was only mild damage to anthracnose. At the remaining 5 sites, there was only one where damage was severe (> 40% of plants affected).
(ii) S. guianensis cv. Pucallpa is better adapted to low altitudes (< 850 m.a.s.l.), on soils that are acid (pH < 5.0), which have low levels of organic matter (< 3.4%), are moderately sandy (18-56% sand) and which have higher precipitation during maximum rainfall period (> 800 mm.).
(iii) At higher altitudes, above 1000 m.a.s.l., the cultivar appears to respond to higher levels of organic matter.
In general, cv. Pucallpa shows tolerance to anthracnose and excellent adaptation to tropical humid forest conditions in America.
53
Biometrical Applications in Tropical Pasture and Agro-pastoral Research
References
CIAT, 1989. Informe Anual Programa de Pastos Tropicales. Documento de Trabajo No. 59. CIAT. Cali, Colombia.
CIAT, 1990. Informe Anual Programa de Pastos Tropicales. Documento de Trabajo No. 69. CIAT. Cali, Colombia.
Everitt, B.S., 1980. Cluster Analysis. 2nd Edn., Heineman. London, U.K.
Lenne, J.M., 1982. Evaluacion de enfermedades en pastos tropicales en el area de actuation. In: Toledo, J.M. (ed.). Manual para la Evaluacion Agronomica. Red Internacional de Evaluacion de Pastos Tropicales. 45-55. CIAT. Cali, Colombia.
Lenne, J.M., Pizarro, E.A. and Toledo, J.M., 1985. Importance of diseases as constraints to pasture legume adaptation in the Tropical American lowlands. Proceedings of the XV International Grassland Congress. 810-812. Kyoto, Japan.
Lenne, J.M., and Ordonez, J.H., 1988. The importance of the diseases in pasture establishment and potential control strategies. Reunion del Comite Asesor de la Red Internacional de Evaluacion de Pastos Tropicales (RIEPT). Mexico City, Mexico.
Toledo, J.M. and Schultze-Kraft, R., 1982. Metodologia para la evaluacion agronomica de pastos tropicales. In: Toledo, J.M. (ed.). Manual para la evaluacion agronomica. Red Internacional de Evaluacion de Pastos Tropicales (RIEPT). 91-110. CIAT. Cali, Colombia.
54
Planning, Design and Analysis of Grazing Experiments
Chapter 5
Planning, Design and Analysis of Grazing Experiments1
2
Maria Cristina Amezquita
Introduction
Because the final products of a tropical pasture are chiefly milk, beef and animal sub-products, the pasture researcher working in tropical ecosystems should recognise that agronomic trials under cutting, without influence of the animal, and grazing trials are complementary. It is difficult to assign an economic value to forage as a final product, because the market that absorbs it is very limited; cases of hay, grass for silage or grass for cutting are cited as exceptions. As a result, although the forage agronomist will indicate that ecotype A is more adaptable, more persistent, and higher yielding in terms of dry-matter production than ecotype B, these results are not transferable to the cattle farmer until they have been verified by means of grazing experiments. In these experiments, forage yield and quality are expressed in terms of a defined animal product (kg of beef, milk, or both, per animal or per unit of area) over a defined time interval, under given management options, particularly stocking rate.
The evaluation of a pasture in terms of its animal product is complex because, on the one hand, a "standard animal" that can be used as an instrument of measurement does not exist and, on the other hand, the quantity and quality of forage offered influence the persistence of the pasture that the animal is grazing, and this in turn, influences the quantity and quality of the animal product. Therefore, the careful planning and design of grazing trials, including choice of animals and adequate management of the pasture-animal relationship, will allow the pasture to freely express its productivity potential all through the experimental period, which, in turn, will lead to estimates of animal production that are more accurate and comparable among treatments.
The objective of this chapter is to review the sequence of decisions that a pasture researcher working in tropical ecosystems should make when planning and designing a grazing trial, and the precautions that should be taken to make a correct analysis of data and generalisation of results.
Adapted from the article published in Spanish in: Lascano, C. E. and Pizarro, E. A. (eds.), 1986. Evaluation de pasturas con animales. Alternativas Metodologicas, 13-42. CIAT. Book series ISBN 84-8280-154-6, 292 pp. Head, Biometry Unit, Centro International de Agriculture Tropical (CIAT). Cali, Colombia.
55
Biometrical Applications in Tropical Pasture and Agro-pastoral Research
The Planning Stage
Experiments under grazing are long and costly and therefore should not be used to test hypotheses that could be studied in another context. Before beginning a grazing experiment, it is important to keep in mind the previous steps of evaluation and selection to which the germplasm should have been submitted, in order not to introduce additional variability into the trial nor bias into the interpretation of results.
According to the pasture evaluation outline that the International Network for Tropical Pastures Evaluation (RIEPT) follows, pastures that enter the evaluation stage where weight gain is measured (Regional Trials D, RTD) include grasses and legumes that have demonstrated adaptability to regional soil and climate conditions and resistance to pests and diseases. They should also possess an adequate level of dry-matter production, characteristics which were already evaluated in the Regional Trials A and B (Toledo, 1982). In later evaluations (Regional Trials C, RTC), they have demonstrated their compatibility in grass-legume associations, and their resistance to animal trampling under different pasture management practices, in experiments on small plots (Paladines and Lascano, 1983). In the Regional Trials D, the best pastures are finally evaluated on large plots and under distinct grazing management practices, whether as associations or monocrops, and compared with the best local check with regard to their beef or milk production (Toledo, 1982).
Grazing trials are not easy to modify once they have begun and errors in the planning stage can turn-out to be very costly in terms of time, money, and loss of information. Therefore, it is advisable to dedicate sufficient thought and time to the planning phase.
Establishing an experimental plan
It is recommended that an experimental plan be written in which the objectives of the experiment are established, together with the desired area of generalisation of results; the experimental design chosen, response variables, a field plan for the trial drawn up, costs (of seed, pasture establishment and labour), trial implementation plan and, finally, the methodology of data collection and statistical analysis. This document should also explain the antecedents, which gave rise to the project's conception and its expected products.
The research program's philosophy
According to Mannetje et al. (1976), grazing trials can be grouped in two classes: those that evaluate pastures; and those that evaluate the effect of management practices on a pasture.
If the research program's philosophy is to modify the existing structure of animal production by applying more efficient management practices, then the type of experimentation is of the second kind and would compare animal productivity of existing pastures under diverse improved management practices vs. practices used in the region. Management practices include pasture establishment methods, use of fertilisers, grazing systems (continuous or rotational),
56
Planning, Design and Analysis of Grazing Experiments
complementary supplementation, levels of stocking rate or grazing pressure, among others. An example of this kind of experimentation is that conducted between 1972 and 1977 by CIAT's Tropical Pastures Program at Carimagua Experiment Station, on the Eastern Plains of Colombia (Colombian Llanos) during the initial stages of research. Productivity of native savannas under distinct management practices was studied: with or without burning, under several levels of stocking rate, under two grazing systems (continuous and rotational), and with or without supplementation (Paladines and Leal, 1978).
If, however, the goal of the research program is to modify the existing structure of animal production by introducing improved pastures, then the experimentation involves three main objectives: • To determine the best management practice for the local pasture and for the improved ones; • To compare local pastures with improved ones, each under its best management practice; and • To develop the most optimal integration of the different pastures into a sustainable grazing
system.
Selecting experimental factors and their levels
The research program's philosophy should be taken into account when selecting the experimental factors and their levels. In this process the following aspects should be considered:
• The relevance of experimental factors with regard to the objectives of the research program, the area to where the results are to be generalised, and the objectives of the trial.
• The range of coverage of factor levels, their representation of the population of levels and their capacity to allow the pasture to express a differential response. For example, in an experiment designed to study the effect of stocking rate on beef production with Brachiaria decumbens in a particular environment, it would be insufficient to choose 1.0, 1.5, and 2.0 animals/ha as stocking rate levels, knowing that this species supports, in other similar environments, up to 3 animals/ha. Those levels of stocking rate would not be representative of the population of stocking rate levels biologically possible for B. decumbens and would diminish the trial's generalisation capacity, with the risk of not detecting statistical differences among stocking rate treatments.
• The control treatment depends on the trial's objective. If the objective is to modify the existing animal production system by introducing improved management practices the control will be the local management practice in the region. If the objective is to modify the existing animal production system through the introduction of improved pastures, the control will be the best local pasture with its best local management.
• Should management practices, when they are not treatments of a grazing trial, be applied uniformly in all experimental pastures? In theory, yes, to avoid possible confounding of effects of treatment with those of management practices; however, on occasions, it is neither practical
57
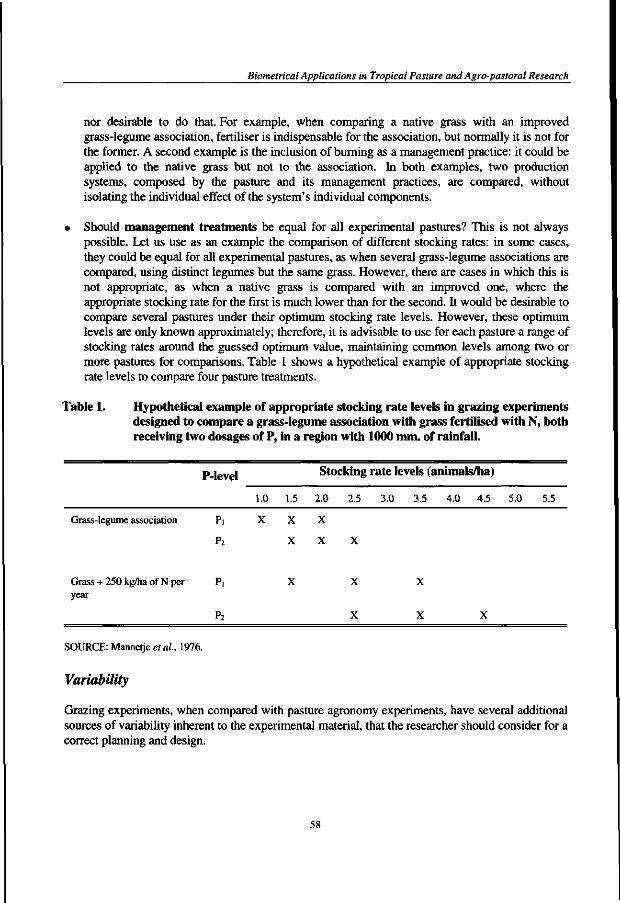
Biometrical Applications in Tropical Pasture and Agro-pastoral Research
nor desirable to do that. For example, when comparing a native grass with an improved grass-legume association, fertiliser is indispensable for the association, but normally it is not for the former. A second example is the inclusion of burning as a management practice: it could be applied to the native grass but not to the association. In both examples, two production systems, composed by the pasture and its management practices, are compared, without isolating the individual effect of the system's individual components.
• Should management treatments be equal for all experimental pastures? This is not always possible. Let us use as an example the comparison of different stocking rates: in some cases, they could be equal for all experimental pastures, as when several grass-legume associations are compared, using distinct legumes but the same grass. However, there are cases in which this is not appropriate, as when a native grass is compared with an improved one, where the appropriate stocking rate for the first is much lower than for the second. It would be desirable to compare several pastures under their optimum stocking rate levels. However, these optimum levels are only known approximately; therefore, it is advisable to use for each pasture a range of stocking rates around the guessed optimum value, maintaining common levels among two or more pastures for comparisons. Table 1 shows a hypothetical example of appropriate stocking rate levels to compare four pasture treatments.
Table 1. Hypothetical example of appropriate stocking rate levels in grazing experiments designed to compare a grass-legume association with grass fertilised with N, both receiving two dosages of P, in a region with 1000 mm. of rainfall.
P-level Stocking rate levels (animals/ha)
1.0 1.5 2.0 2.5 3.0 3.5 4.0 4.5 5.0 5.5
Grass-legume association Pi X X X
P2 X X X
Grass+ 250 kg/ha of N per P, X X X year
P2 X X X
SOURCE: Mannetje etal., 1976.
Variability
Grazing experiments, when compared with pasture agronomy experiments, have several additional sources of variability inherent to the experimental material, that the researcher should consider for a correct planning and design.
58
Planning, Design and Analysis of Grazing Experiments
Additional variability is related to the following characteristics of grazing experiments:
Long-term nature: In a grazing experiment, treatments applied to the pasture, animal or both, can have long-term consequences that need to be measured over the long term. The effect of a treatment is therefore influenced by the year's climatic conditions, by season within the year and, year x treatment and season x treatment interactions can often be expected.
Size of the experimental unit: Grazing trials require larger areas than pasture agronomy trials, because the size of the experimental unit should be large enough to support the number of animals required to accurately estimate animal production. There is experimental evidence that variability of response variable increases with the experimental unit size. This factor is, therefore, an important source of variation in grazing trials.
Animal variability: Breed, sex, age, nutritional condition, among others, impose an additional variability on the pasture-animal relationship, resulting in differential responses to treatments.
In general, when planning a grazing trial, it is necessary to consider five main sources of variation:
Land variability. This refers to variability present in the area to where results are to be generalised, in relation to: a) altitude, topography, slope, drainage, water retention capacity; b) soil physical characteristics (texture variables) and c) soil chemical characteristics (pH, percentages of Al, Ca, and Mg saturation, and available P and K). Based on this information, the researcher decides on the number and spatial distribution of field replications to guarantee that they will be representative of the variability of the area of interest.
Climate variability. There is experimental evidence that pasture production, in terms of both forage and animal product, varies notably with season and year of evaluation (Tergas et al., 1983, 1984a and 1984b; Table 2). This fact implies that the climatic variability of an area should be analysed within the year and between years. Variability within the year, that is, seasonal variability, will determine the number of periodic evaluations of pasture attributes and the time interval between them during the year. Variability between years will indicate whether time replications are needed.
In summary, if an area presents marked seasons and high variation within seasons and between successive years, then, to quantify pasture response over a period of time, it is necessary to conduct, as a minimum, as many periodic evaluations as there are different seasonal periods. Additionally, an experiment should be maintained for 3 or 4 years at least, to allow the pasture to express its production potential in the range of climatic variability between years, and because botanical changes can occur over time (Jones et al., 1995). Finally, the higher the variability between years, the more desirable it is to establish time-replications. For example, let us consider a researcher who needs to evaluate a collection of pasture germplasm material for 3 years, and is willing to conduct a 3-year pasture experiment using one time-replication with four replications in space. It would be more advisable to use two time-replications, each with two replications in space. This can be done by establishing one time-replication with two replications in space on the first year, and a second
59
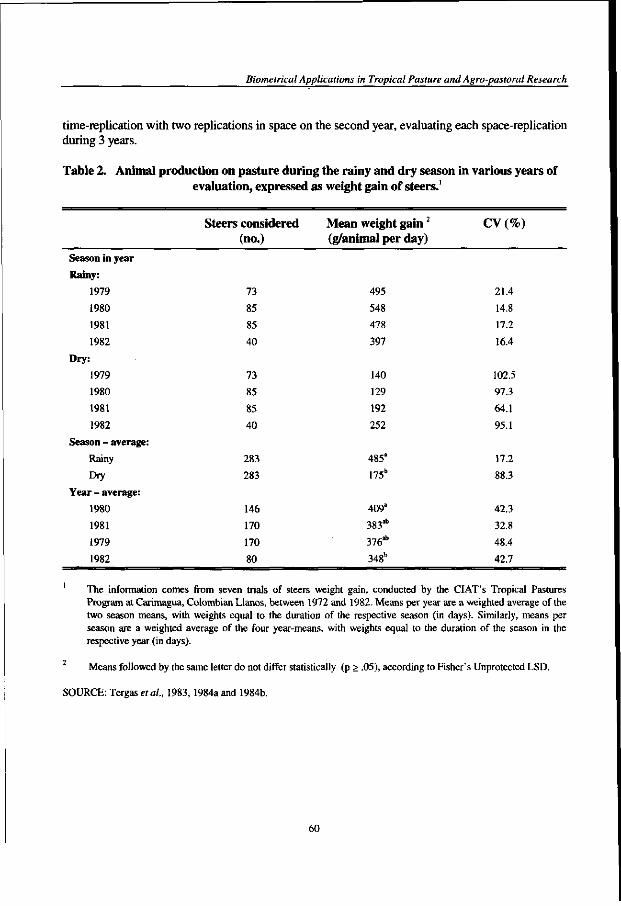
Biometrical Applications in Tropical Pasture and Agro-pastoral Research
time-replication with two replications in space on the second year, evaluating each space-replication during 3 years.
Table 2. Animal production on pasture during the rainy and dry season in various years of evaluation, expressed as weight gain of steers.1
Season in year
Rainy:
1979
1980
1981
1982
Dry:
1979
1980
1981
1982
Season - average:
Rainy
Dry
Year - average:
1980
1981
1979
1982
Steers considered (no.)
73
85
85
40
73
85
85
40
283
283
146
170
170
80
Mean weight gain2
(g/animal per day)
495
548
478
397
140
129
192
252
485a
175b
409a
383ab
376ab
348b
CV(%)
21.4
14.8
17.2
16.4
102.5
97.3
64.1
95.1
17.2
88.3
42.3
32.8
48.4
42.7
The information comes from seven trials of steers weight gain, conducted by the CIAT's Tropical Pastures Program at Carimagua, Colombian Llanos, between 1972 and 1982. Means per year are a weighted average of the two season means, with weights equal to the duration of the respective season (in days). Similarly, means per season are a weighted average of the four year-means, with weights equal to the duration of the season in the respective year (in days).
Means followed by the same letter do not differ statistically (p > .05), according to Fisher's Unprotected LSD.
SOURCE: Tergasefa/., 1983, 1984a and 1984b.
60

Planning, Design and Analysis of Grazing Experiments
Pasture variability. One or several pastures may constitute the experimental material of a trial. The principal sources of pasture variability are:
• Its nature. A monocrop, an association, a native community such as savanna, "closed" pasture or "torourco" {Paspalum conjugation or buffalo grass) show a different magnitude of variability in their response (CIAT, 1983).
• The degree of compatibility of an association is determined by competition between its components for water, light and nutrients, and by their differential response to grazing. For example, the association Andropogon gayanus-Stylosanthes capitata presents greater variability in their biomass production than the association B. decumbens-Pueraria phaseoloides (CIAT, 1983).
Animal variability. In grazing trials, the animal plays the role of the principal measuring instrument of pasture productivity. It is therefore very important to make an adequate selection of the kind of experimental animals that should be used, remembering that they should be representative of the animal population of the area under study.
Variability in animal response depends on the animal breed, genetic cross, level of genetic advance, sex, age, final use of cattle (dairy, beef, dual-purpose) and stress conditions to which the animal may be subjected. Wilson (1975) discussed variability in some animal production parameters compared with variability in crop production parameters in England. His data, summarised in Table 3, indicate that the magnitude of CV's for crop production variables is about 20%, whereas for animal production variables it surpasses 30% in some cases, particularly with adult 2-year-old and 3-year-old steers, where CV's of 39% and 42% were registered, respectively, for weight gain.
Another source of variation in animal response is breed purity. Table 4 shows variation in weight at weaning and at 18 months and in interval between births, in pure Brahman cattle of a commercial herd at Montenegro Ranch, Antioquia, Colombia. Table 5 presents similar data for zebu x Creole crosses on Venezuelan and Brazilian cattle farms (Amezquita and Rojas, 1985).
Data show higher levels of animal productivity in the pure breeds than in the crossbreeds with however, similar levels of variability. This suggests that animal production of a pasture could be limited by animal potential, which is not desirable; and, on the other hand, that using cross breeds as experimental animals, representative for the locally occurring animals, is acceptable in terms of levels of animal variability.
Finally, environmental or management stress imposed to the animal is another source of variation in animal response. Table 6 shows variability in weight gain per day of zebu x Creole cross heifers, under three stocking rate treatments, and in rainy and dry periods. The data show a CV of 20% in stress-free conditions (rainy period with medium and low stocking rates), but very high CV's -between 39% and 197%- under stress conditions (dry period or high stocking rates). Also, the herd's health condition is another cause of stress that can cause variability in animal response.
61

Biometrical Applications in Tropical Pasture and Agro-pastoral Research
Table 3. Variability in animal vs. crop production variables.
Crop or animal production variable Mean SD CV (%)
Crop' (t/ha)
Wheat
Barley
Potato
Beet
Cattle2
Weight gain in steers; 15 months, stabling (kg/ha per year)
Weight gain in steers; 2-years old, grazing (kg/ha per year)
Weight in steers; 3-years old, grazing (kg/ha per year)
Weight of calves; In dairy herds (kg/ha)
Weight gain, 1 year-old steers (range of CV)
4.46
3.67
1.59
1.95
0.81
0.69
0.33
0.43
18.2
18.8
20.8
22.1
2169
480
426
459
505
180
138
23.3
39.2
42.3
30.1
19.2 - 22.5
The original data were expressed in hundredweight per acre. Beef cattle is Friesian; dairy cows are Jersey. The original data were expressed in pounds/acre per year. Data from 43 trials. SOURCE: Wilson, 1975.
Table 4. Variability in animal production parameters in a pure Brahman breed in a commercial cattle farm, "Montenegro Ranch", Antioquia, Colombia, 1970-1982'.
Parameter N Mean SD CV(%)
Weaning weight of steers (kg)
Weaning weight of heifers (kg)
Weight of steers at 18 months (kg)
Weight of heifers at 18 months (kg)
Interval between births (months)
Interval between 8 and 9 birth (months)
1201
1247
171
231
2226
15
226.7
203.5
332.1
277.8
14.0
13.0
31.0
39.7
58.4
37.2
3.5
1.3
13.7
19.5
17.6
13.4
25.0
10.0
Study conducted by the CIAT's Biometrics Unit in support to the Fondo Ganadero de Antioquia, Colombia. The calculation of intervals between births included cows between the 2nd and 10th birth. In this case, N corresponds to the number of intervals between successive births for the various cows, and not the number of cows. Information on intervals between births was recorded on a number of 22 cows.
62
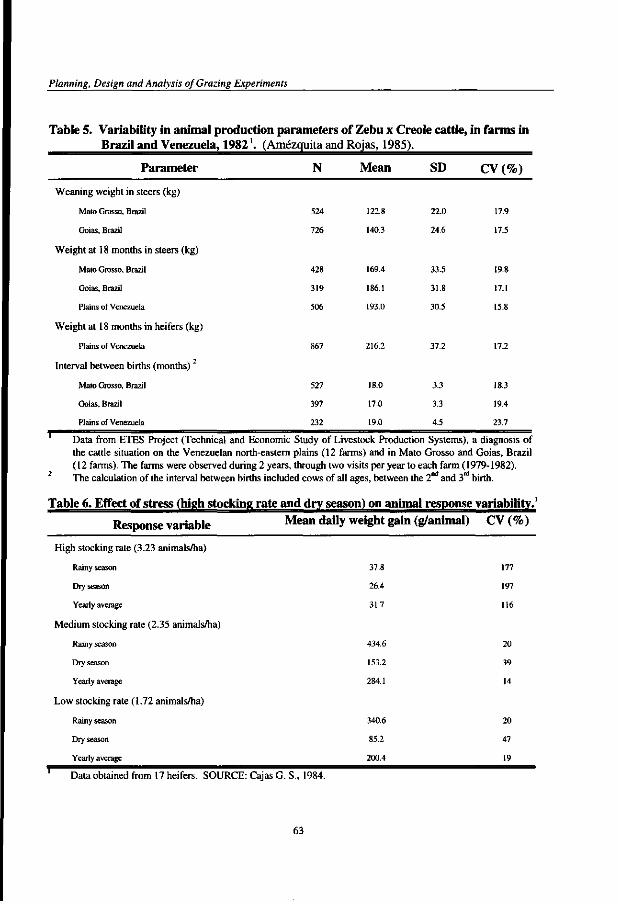
Planning, Design and Analysis of Grazing Experiments
Table 5. Variability in animal production parameters of Zebu x Creole cattle, in farms in Brazil and Venezuela, 1982'. (Amezquita and Rojas, 1985).
Parameter N Mean SD CV (%)
Weaning weight in steers (kg)
Mato Grosso, Brazil
Goias, Brazil
Weight at 18 months in steers (kg)
Mato Grosso, Brazil
Goias, Brazil
Plains of Venezuela
Weight at 18 months in heifers (kg)
Plains of Venezuela
Interval between births (months)
Mato Grosso, Brazil
Goias, Brazil
Plains of Venezuela
524
726
428
319
506
122.8
140.3
169.4
186.1
193.0
22.0
24.6
33.5
31.8
30.5
17.9
17.5
19.8
17.1
15.8
867 37.2 17.2
527
397
232
18.0
17.0
19.0
3.3
3.3
4.5
18.3
19.4
23.7
Data from ETES Project (Technical and Economic Study of Livestock Production Systems), a diagnosis of the cattle situation on the Venezuelan north-eastern plains (12 farms) and in Mato Grosso and Goias, Brazil (12 farms). The farms were observed during 2 years, through two visits per year to each farm (1979-1982). The calculation of the interval between births included cows of all ages, between the 2 and 3 birth.
Table 6. Effect of stress (high stocking rate and dry season) on animal response variability.'
Response variable Mean daily weight gain (g/animal) CV (%)
High stocking rate (3.23 animals/ha)
Rainy season
Dry season
Yearly average
Medium stocking rate (2.35 animals/ha)
Rainy season
Dry season
Yearly average
Low stocking rate (1.72 animals/ha)
Rainy season
Dry season
Yearly average
37.8
26.4
31.7
434.6
153.2
284.1
340.6
85.2
200.4
177
197
116
20
39
14
20
47
19
Data obtained from 17 heifers. SOURCE: Cajas G. S., 1984.
63
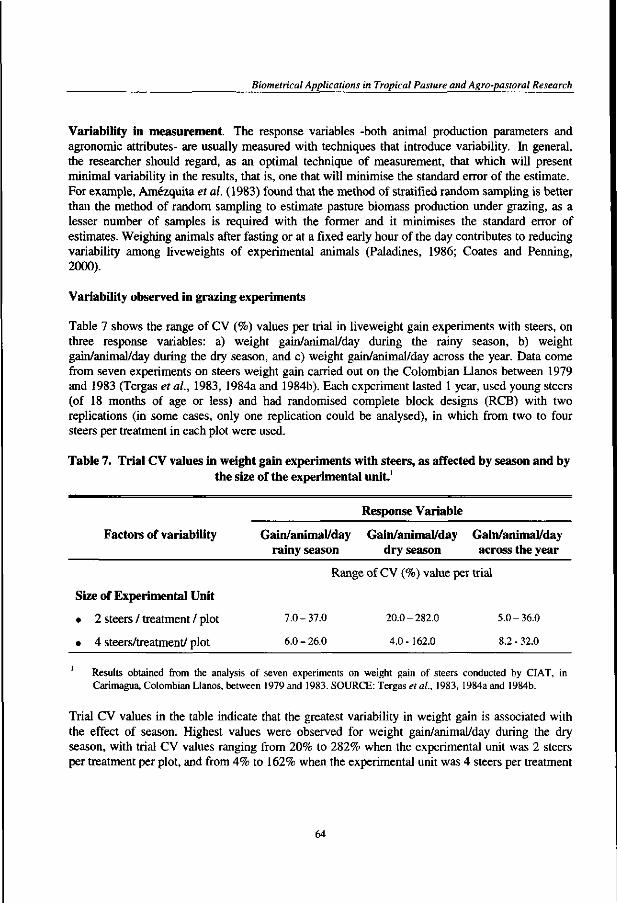
Biometrical Applications in Tropical Pasture and Agro-pastoral Research
Variability in measurement. The response variables -both animal production parameters and agronomic attributes- are usually measured with techniques that introduce variability. In general, the researcher should regard, as an optimal technique of measurement, that which will present minimal variability in the results, that is, one that will minimise the standard error of the estimate. For example, Amezquita et al. (1983) found that the method of stratified random sampling is better than the method of random sampling to estimate pasture biomass production under grazing, as a lesser number of samples is required with the former and it minimises the standard error of estimates. Weighing animals after fasting or at a fixed early hour of the day contributes to reducing variability among liveweights of experimental animals (Paladines, 1986; Coates and Penning, 2000).
Variability observed in grazing experiments
Table 7 shows the range of CV (%) values per trial in liveweight gain experiments with steers, on three response variables: a) weight gain/animal/day during the rainy season, b) weight gain/animal/day during the dry season, and c) weight gain/animal/day across the year. Data come from seven experiments on steers weight gain carried out on the Colombian Llanos between 1979 and 1983 (Tergas et al, 1983, 1984a and 1984b). Each experiment lasted 1 year, used young steers (of 18 months of age or less) and had randomised complete block designs (RCB) with two replications (in some cases, only one replication could be analysed), in which from two to four steers per treatment in each plot were used.
Table 7. Trial CV values in weight gain experiments with steers, as affected by season and by the size of the experimental unit.'
Factors of variability
Size of Experimental Unit
• 2 steers / treatment / plot
• 4 steers/treatment/ plot
Response Variable
Gain/animal/day Gain/animal/day Gain/animal/day rainy season dry season across the year
Range of CV (%) value per trial
7.0-37.0 20.0-282.0 5.0-36.0
6.0-26.0 4.0-162.0 8.2-32.0
Results obtained from the analysis of seven experiments on weight gain of steers conducted by CIAT, in Carimagua, Colombian Llanos, between 1979 and 1983. SOURCE: Tergas et al, 1983, 1984a and 1984b.
Trial CV values in the table indicate that the greatest variability in weight gain is associated with the effect of season. Highest values were observed for weight gain/animal/day during the dry season, with trial CV values ranging from 20% to 282% when the experimental unit was 2 steers per treatment per plot, and from 4% to 162% when the experimental unit was 4 steers per treatment
64
Planning, Design and Analysis of Grazing Experiments
per plot. On the contrary, the corresponding ranges in trial CV for weight gain/animal/day during the rainy season were smaller. These results indicate the need to seriously consider weight gain evaluations during the dry season given the limited availability and high cost of experimental animals. A second factor of variability in a weight gain trial is the experimental unit size. Greater variability per trial was observed when 2 steers were used. An increment to 4 steers per treatment per plot showed a reduction in the range of trial CV, but would require twice the experimental area, leading to increased variation due to site factors (Mannetje et al., 1976).
Response variables
Animal production variables are the most important response variables in a grazing experiment, because they allow pasture production to be finally quantified. However, to understand the pasture-animal system and to explain the results obtained in the experiment, agronomic data on pasture production must be taken. It is necessary to emphasise the importance of measuring only those response variables for which hypotheses have been formulated.
In weight gain experiments, whose experimental unit is a homogeneous group of steers or heifers of the beef-producing breed adapted to the region, response variables include:
• Pasture stocking rate capacity, which is the number of animals (using a pre-defined animal, in terms of age and weight) per unit of surface area that each treatment supports, in each replication, during a given period of time;
• Weight gain per hectare; weight gain per animal; body condition (by subjective evaluation, when there are no weighing scales: thin, slightly fat, fat, very fat);
• Time required to achieve a certain weight (for example, slaughter weight); and • Carcass yield, i.e. the weight of the slaughtered animal after the viscera, head, tail, and hide
have been removed.
In reproductive performance experiments, the experimental unit is a genetically homogeneous herd of cows of distinct age categories -for example, from 3-year-old cows pregnant for the first time to 9-year-old cows- in representative proportions of a normal herd (Vera, 1982; Coates and Penning, 2000). Response variables include:
For steers or heifers: • Weight at birth; at 4 months; at weaning; at 12,18,24, and at maturity; • Mortality rate of calves until 2 months old, and until 12 months old.
For heifers: • Pregnancy rate; and weight and age at first conception.
For cows: • Body weight, adjusted to a given physiological state; weight at conception; pregnancy rate;
abortion rate; birth rate; weaning rate; rate of re-conception in lactating cows; interval between births; age and weight of culled cows; and rate of replacement of cows.
65
Biometrical Applications in Tropical Pasture and Agro-pastoral Research
In milk production experiments, whose experimental unit is a homogeneous herd of dairy cows, with or without their calves, of the breed adapted to the region, response variables include:
• Kilograms of milk/cow per day; kilograms of milk /cow per lactation, length of lactation, and percentage of fat, in addition to other milk quality response variables (Stobbs and Sandland, 1972; Coates and Penning, 2000).
Mendoza and Lascano (1986) discussed forage production response variables. Paladines (1986) and Vaccaro (1986) discussed animal production response variables. Mannetje et al. (1976) also dealt with aspects related to measuring pastures and animals in grazing experiments.
The Design Stage
To design a grazing experiment, the researcher should consider the following aspects: delimitation of the area to where the results are to be generalised; variability in terms of land, climate, pasture, animals available, and measurement techniques; experimental factors that should be studied and their levels; and response variables that will be measured. The decisions to be made are: • Total duration of the experiment; • Number of field replications; • Nature of the experimental unit: if it is the herd and its associated paddock, then the researcher
should decide how many and what kind of animals will be used per experimental unit; if it is the animal, then the researcher should decide on the most appropriate type of animal to be used as experimental unit, and how many animals are required per treatment;
• Number of replications in time; • Number and dates of periodic evaluations during the year; • Management practices that are applied to the pastures (which do not constitute treatments) and
appropriate measuring techniques to estimate the distinct response variables with minimal variability; and finally,
• Experimental design that will be applied.
On many occasions the pasture researcher faces serious limitations in seed availability, suitable land, high costs of pasture establishment, and limited resources for the trial. Therefore, an adequate number of replications is difficult to achieve in practice. In the opinion of some researchers (GRI, 1961; Lucas, 1976; Mannetje et al., 1976; Haydock, 1984) the following can be affirmed:
In trials whose objective it is to study the pasture for its animal production, where the experimental unit is the herd and its associated paddock, it is acceptable to use two field replications located in such a way that they will be representative of contrasting conditions of the area under study. The minimum number of animals per experimental unit is three to four young steers in weight gain experiments and five to six cows in milk production experiments. The paddock size should be the minimum area needed to obtain production results with the required number of animals as experimental unit. The use of at least two replications in time is useful when variation between years is very large. However, faced with limited resources, the researcher chooses a single replication in time and obtains estimates of annual production during several consecutive years,
66
Planning, Design and Analysis of Grazing Experiments
using different groups of animals each year. The minimum length of a grazing experiment should be 3 years and, according to climatic conditions and the pasture persistence, it is desirable that it be prolonged for as long as 5 years, or even 15 years (Jones et ai, 1995; Mannetje and Jones, 1990). It is advisable to define, ahead of time, an objective criterion for trial termination; for example, an experiment studying a grass-legume association can be declared concluded when the legume has disappeared from a certain percentage of the experimental area.
In trials whose objective it is to study the response of the animal to pasture treatments, the experimental unit is one animal. In this case, field replications are not required unless one wishes to study the effect of site as another experimental factor. It is considered that the minimum number of animals (replications) per treatment is ten (Mannetje et al., 1976).
Experimental design in grazing experiments
Continuous versus Change-Over Designs
Experimental designs with animals are of two types: continuous and change-over. A continuous design is that where an animal, once assigned to a treatment, remains in that treatment until the end of the experiment. A change-over design is one in which an animal receives two or more treatments in sequence. Change-over designs play a very important role in experiments with animals because they require fewer animals than continuous designs. This characteristic makes them very attractive for on-farm research. That is, they permit more treatments without increasing the number of animals. They are largely used in nutritional and metabolic studies and in dietary trials for lactating cows (Lucas, 1976; Stobbs and Sandland, 1972). The group of cows receives a series of different experimental diets at specified intervals to eliminate the residual effect of the previous treatment. Change-over designs, however, are useful only if the results obtained during these short measurement periods are valid. Their extrapolation capacity to a given population of cows depends on the correct selection of experimental periods and experimental animals. Experimental periods should be chosen to represent contrasting conditions for animal performance, such as contrasting seasons or cow's lactating stages. Experimental animals should be selected to represent the breeds, genetic groups and production level of the target population.
Continuous and change-over designs differ in three basic aspects (Lucas, 1976):
• Estimation of treatment effects. A continuous design estimates a long-term effect of the treatment, whereas a change-over design estimates a short-term effect. Therefore, the treatment effect estimated by each design can be different.
• Estimation of the experimental error. In continuous designs, the experimental error includes variability between animals receiving the same treatment within a replication. In change-over designs, being the animal a complete replication of treatments and periods, variability between animals receiving the same treatment within a replication does not exist. Therefore, the magnitude of experimental error is greater in continuous designs than in change-over designs.
67
Biometrical Applications in Tropical Pasture and Agro-pastoral Research
• Capacity to control fluctuations in animal performance over time. In continuous designs, the animals are exposed to all treatments simultaneously and, as a result, any bias in the pattern of animal performance over time affects all treatments alike. In contrast, in change-over designs, animals are exposed to treatments at different times, and the animal response to each treatment may be confounded with the biases in the time-related pattern of performance.
Lucas (1976) discussed the most frequently used change-over (or cross-over) designs: Complete Blocks change-over (or Simple Reversible), Balanced Complete Blocks change-over (or Balanced Simple Reversible), Latin Square change-over designs and others. Amezquita (1993) describes the characteristics and practical use of some of these designs for evaluating milk production on the farm.
Non-replicated Experiments
A grazing experiment whose objective it is to evaluate a pasture for its animal production is non-replicated when it has a single replication in space. It does not matter how many animals it may use per treatment, although this should not be less than three.
A non-replicated experiment has the following limitations: a) A valid estimate of experimental error cannot be obtained as the error term, in this case, includes variability between animals within treatments for the specific site where the single replication was located; and b) Results are site-specific, and therefore, cannot be generalised to a wider area.
Non-replicated experiments are useful: a) during the initial stages of development of a research program; b) under limited seed availability; c) in exploratory trials aimed at identifying experimental factor levels; and d) when resources are limited or the experiment is too large and costly, as is the case of experiments with reproductive herds. Two reproductive performance experiments can be cited as example, both conducted by CIAT, at Carimagua Experiment Station, Eastern Savannas of Colombia. The first, called "Herd Systems" (Stonaker et al., 1984) compared over the years 1972 to 1977, the reproductive performance of zebu x Creole herds grazing native savanna vs. improved pastures (Melinis minutiflora) with or without a supplement of urea + molasses, and with or without seasonal mating. The experiment was established in a single replication using 25 cows per treatment. The second experiment, called "Breeding Herds Management Systems" (CIAT, 1979 to 1983), studied six treatments: two pastures (native savanna vs. native savanna + legume) and three mating periods of different length, using a single replication and 55 cows per treatment.
Statistical Analysis Considerations
Is the design orthogonal! An example of an orthogonal design is one in which each possible combination of factors is present the same number of times and treatments are equally replicated. For example, an experiment that studies two pastures with two levels of P-fertilisation, and three different levels of stocking rate for each pasture x P-level combination, as shown in Table 1, has a
68
Planning, Design and Analysis of Grazing Experiments ,
non-orthogonal design, because not all possible combinations of pasture x P-level x stocking rate level occur.
An orthogonal design is submitted to a conventional analysis of variance. This is not valid for non-orthogonal designs. However, other alternatives for analysis are suggested, for example: • To consider the orthogonal portion of the design: pasture 1 with P-levels Pi and P2, with
stocking rates of 1.5 and 2.0 animals/ha, in the example shown on Table 1. • To use analysis of variance for unbalanced designs, calculating sums of squares adjusted by the
number of observations per cell (Harvey, 1964, which has been incorporated in the SAS software under the GLM procedure).
• To adjust regression curves of animal production vs. stocking rate for each pasture x P-level combination (Table 1) and statistically compare regression parameters. This analysis can be carried out when factor levels are on a continuous scale, as stocking rates.
Problems when analysing weight gain experiments in the tropical savanna ecosystem
When analysing weight gain grazing experiments in tropical savanna conditions, the researcher faces several problems. We will refer to some common ones and discuss possible solutions:
High variability in weight gain during the dry season. Because of the high variability observed in weight gain among animals receiving the same treatment during the dry season, the factor season should not be included in the analysis of variance as a source of variation, because the assumption of homogeneity of variance between treatments would be violated. It is suggested to conduct independent analyses of variance of daily weight gain/animal in the rainy season and daily weight gain/animal in the year, and estimate season effect by difference.
Method of estimating weight gain per animal. In weight gain trials, animals are normally weighed periodically during the experimental period. The experimenter should test if differences exist between growth curves of the animals proceeding from each treatment and if there are significant differences among weight gains in the period considered. Two alternative analysis exist: a) to quantify weight gain per animal per day by weight differences, that is, (final weight - initial weight)/(days of grazing); or b) to quantify it through the slope of a linear regression of weight over steer age (in days), accepting the assumption of linearity for young steers (from 12 to 18 months of age). The second alternative is preferred, as it uses the whole information on periodic weighing, diminishing the importance of possible measurement errors in the initial or final weight, and allows growth curves per animal be obtained and compared statistically.
Table 8 compares the two methods using data from 17 young heifers weighed monthly between April and August 1983, at Carimagua, in the rainy season. The two methods show a high correlation (r = 0.993). Variability present in both methods is similar, around 25% of CV, but the gains estimated by regression always turned-out to be superior to the estimates obtained by difference of weights because in this case, the growth curves showed a slight downward concavity.
69
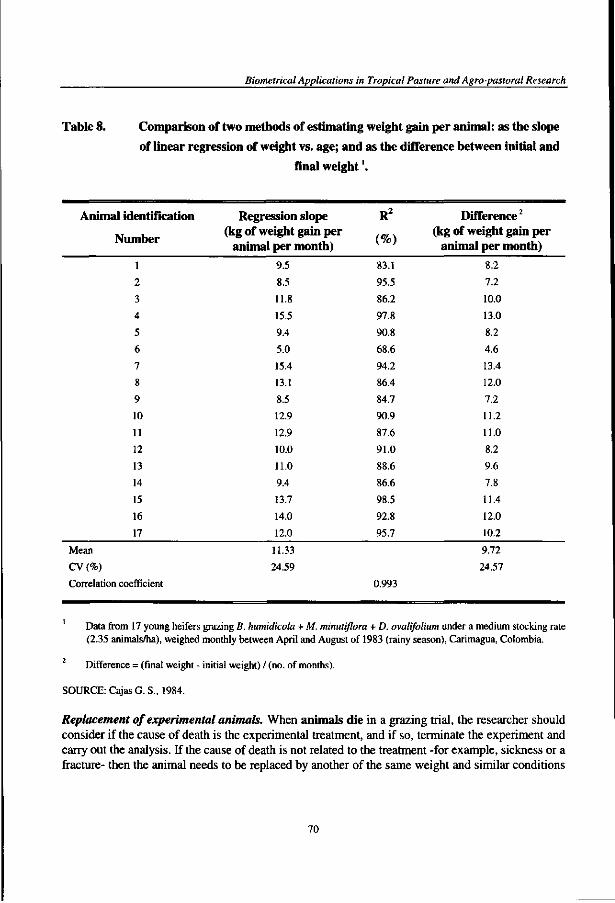
Biometrical Applications in Tropical Pasture and Agro-pastoral Research
Table 8. Comparison of two methods of estimating weight gain per animal: as the slope
of linear regression of weight vs. age; and as the difference between initial and
final weight'.
Animal identification
Number
l
2
3
4
5
6
7
8
9
10
11
12
13
14
15
16
17
Mean
CV (%)
Correlation coefficient
Regression slope (kg of weight gain per
animal per month) 9.5
8.5
11.8
15.5
9.4
5.0
15.4
13.1
8.5
12.9
12.9
10.0
11.0
9.4
13.7
14.0
12.0
11.33
24.59
R2
(%)
83.1
95.5
86.2
97.8
90.8
68.6
94.2
86.4
84.7
90.9
87.6
91.0
88.6
86.6
98.5
92.8
95.7
0.993
Difference2
(kg of weight gain per animal per month)
8.2
7.2
10.0
13.0
8.2
4.6
13.4
12.0
7.2
11.2
11.0
8.2
9.6
7.8
11.4
12.0
10.2
9.72
24.57
Data from 17 young heifers grazing B. humidicola + M. minutiflora + D. ovalifolium under a medium stocking rate (2.35 animals/ha), weighed monthly between April and August of 1983 (rainy season), Carimagua, Colombia.
Difference = (final weight - initial weight) / (no. of months).
SOURCE: Cajas G. S., 1984.
Replacement of experimental animals. When animals die in a grazing trial, the researcher should consider if the cause of death is the experimental treatment, and if so, terminate the experiment and carry out the analysis. If the cause of death is not related to the treatment -for example, sickness or a fracture- then the animal needs to be replaced by another of the same weight and similar conditions
70
Planning, Design and Analysis of Grazing Experiments .
in order to maintain the stocking rate. Unless the animal has come into the experiment very early, its data on weight gain should not be considered in the statistical analysis, as its previous origin and its acceptance from the other experimental animals may condition its response to the treatment.
Under Savanna conditions, it is recommended to replace all the group of experimental animals by a new group with similar initial weight and age, at the beginning of each experimental year, which should coincide with the beginning of the dry season. In this way, weight gain will be referred to the same animal type across years, and the stocking rate level will be maintained.
Alternatively, each treatment can start with experimental animals of two (or more) different age groups (for example, weaners and 1-year old). After one year, the then 2-years old are replaced by weaners, thus allowing a longer period on the treatment so that the animals may reach slaughter weight (Mannetje and Jones, 2000).
Additional sources of variation to be included in the analysis of variance. In grazing trials, the animals should be assigned to treatments according to certain characteristics such as initial weight, age, sex, origin, and previous weight gain, to allow homogeneity of variances within treatments. Each of these factors should be considered as additional sources of variation in the analysis of variance in order to reduce experimental error. Lucas (1976) comments that "the reduction in error is small, and considering that each additional restriction imposed on the design results in a loss of degrees of freedom, so scarce in grazing experiments, it is sometimes preferable not to take out this variability". However, experience with grazing trials in the Colombian Llanos shows that the reduction obtained in the Mean Square Error (MSE) is significant. Table 9 illustrates this reduction when the factors "sex" and "animal origin" were included as additional sources of variation in the analyses of variance of two weight gain experiments, both designed to test the effect of a fungal disease in the pasture (presence or absence), and the effect of zinc application to the pasture (with or without application) on weight gain, under the same experimental design — a Split-Plot with 2 replications, where the main plot was presence or absence of the fungal disease in the pasture, and the subplot was zinc application. In the first experiment, that used 89 animals of both sexes, the fact of taking variability caused by "sex" from the error reduced the MSE from 0.1065 to 0.0668, i.e., 37.3 %. In the second experiment, that used 69 animals of the same sex (steers), the inclusion of the factor "animal origin" as a source of variation, reduced the MSE from 0.170 to 0.150, i.e., 11.8%. In both cases, such significant reduction in experimental error allowed the detection of treatment effects with greater accuracy.
Allocation of animals to grazing experiments. "Animals should be selected for uniformity of weight, breed, age and condition. When possible, only one sex should be used in one experiment to avoid bias in terms of differences in growth rates between sexes and because of sexual behaviour. When different breeds or different age groups have to be used, these should be allocated so that each treatment herd has the same composition of breed or age. A common method of minimising variation in weight between animals per treatment is to select a range of animals that constitute the lowest difference between the heaviest and the lightest animal. This group of animals is then divided into as many weight groups as there are replicates, allowing one group at random to each
71
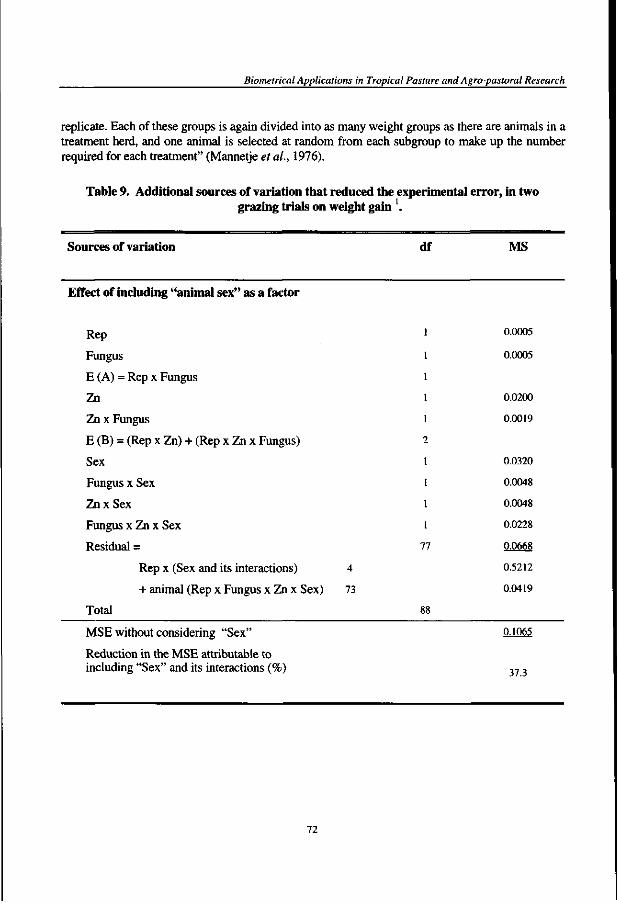
Biometrical Applications in Tropical Pasture and Agro-pastoral Research
replicate. Each of these groups is again divided into as many weight groups as there are animals in a treatment herd, and one animal is selected at random from each subgroup to make up the number required for each treatment" (Mannetje et al., 1976).
Table 9. Additional sources of variation that reduced the experimental error, in two grazing trials on weight gain .
Sources of variation
Effect of including "animal sex" as a factor
Rep
Fungus
E (A) = Rep x Fungus
Zn
Zn x Fungus
E (B) = (Rep x Zn) + (Rep x Zn x Fungus)
Sex
Fungus x Sex
ZnxSex
Fungus x Zn x Sex
Residual =
Rep x (Sex and its interactions) 4
+ animal (Rep x Fungus x Zn x Sex) 73
Total
MSE without considering "Sex"
df
2
77
88
MS
0.0005
0.0005
0.0200
0.0019
0.0320
0.0048
0.0048
0.0228
0.0668
0.5212
0.0419
0.1065
Reduction in the MSE attributable to including "Sex" and its interactions (%) 37.3
72

Planning, Design and Analysis of Grazing Experiments
Table 9 (cont.)
Sources of variation df MS
Effect of including "animal origin" as a factor
Rep
Fungus
E (A) = Rep x Fungus
Zn
Zn x Fungus
E (B) = (Rep x Zn) + ( Rep x Zn x Fungus)
Origin
Fungus x Origin
Zn x Origin
Fungus x Zn x Origin
Residual =
Rep x (Origin and its interactions) 4
+ Animal (Rep x Fungus x Zn x Origin) 53
Total
2
57
68
0.460
0.011
0.079
0.016
0.002
0.050
0.034
0.002
0.150
0.7125
0.1075
MSE without considering "Origin"
Reduction in the MSE attributable to
Including "Origin" and its interactions (%)
0.170
11.8
Rep. = replication; Fungus = presence or absence of the fungal disease in the pasture; Zn = application, or not, of zinc to the pasture; MSE = mean square error.
Conclusions
Grazing trials are costly, lengthy and difficult to modify once begun. Therefore, they are only used for well defined purposes, such as for the final assessment of selected pastures that have succeeded in previous evaluation stages, or for testing grazing management practices, such as stocking rates or
73
Biometrical Applications in Tropical Pasture and Agro-pastoral Research
breed differences, defining precise objectives, appropriate experimental designs, and measuring response variables that are relevant to the hypotheses. It is recommended that an experimental plan is written, setting-out objectives, area of generalisation of results, experimental design, response variables, field plan, costs of seed, pasture establishment, trial implementation, and statistical analysis methodology.
In planning a grazing trial, it is important to consider five main sources of variability: land type, climate (year and season variability), type of pasture, animal factors, and measurement techniques for response variables. Recognising and controlling variability in these factors brings greater accuracy and capacity for generalising experimental results.
How can the accuracy of the experiment, given that variability, be increased? By: • Recognising seasonal and annual variability. If annual variability is very high, then
implementing trials of long duration (from 3 to 5 years) is desirable, changing the group of experimental animals each year in order to obtain independent estimates of animal production between years, except where two age groups are used. The most appropriate time to carry out the change is at the end of the wet season. It is recommended to make evaluations within season, and at the beginning and end of each season.
• Recognising the pastures' own variability, for sampling purposes. • Employing the type and number of animals relevant to trial objectives. • Assigning animals to treatments in balanced groups according to their initial
characteristics, for example, age, sex, weight and origin. • Given the high variability in animal response under conditions of nutritional stress (high
stocking rates, dry season), consider the possibility of: a) increasing the number of animals in high stocking rate treatments, or b) faced with the difficulties of making that increase in the dry season, use annual weight gain and weight gain in the rainy season as response variables for statistical analysis.
A single experimental design appropriate for a network of grazing trials, such as the RIEPT Regional Trials D, does not exist. Depending on the particular ecosystem and animal production system, different experimental designs can be found useful to test the stated hypotheses. In general, continuous designs are appropriate for weight gain and reproductive performance experiments under extensive grazing systems, typical of the tropical savanna ecosystem. Both, continuous and change-over designs, can be used to evaluate dual-purpose production (beef and milk) under semi-intensive production systems, typical of the tropical forest ecosystem: beef production to be evaluated under long-term continuous designs, while milk production to be evaluated under short-term change-over designs. Before selecting the experimental design that will be used, it is wise to analyse differences between continuous and change-over designs with regard to the type of treatment effect that each allows to estimate, to the magnitude of experimental error, and to the capacity of the design to control fluctuations in animal performance in time. Depending on the local conditions, even the same pastures, under the same animal production system, can require different management practices and dimensions for the experimental unit (paddock size, herd size and type of experimental animals).
74
Planning, Design and Analysis of Grazing Experiments
In the analysis of a grazing trial's data, it is important to use the appropriate statistical methodology when the designs are non-replicated or non-orthogonal, and be aware of the experiment limitations in its extrapolation capacity.
References
Amezquita, M. C , 1993. Diseno y Analisis de Ensayos para Evaluacion de Pasturas en Fincas. In: Argel, P.; Duran, C. V. and Franco, L.H., (eds.). Planeacion y Conduction de Ensayos de Evaluacion de Gramfneas y Leguminosas Forrajeras en Fincas. Documento de Trabajo No. 133. 23-37. Centra Internacional de Agriculture Tropical (CIAT) y Red Internacional de Evaluacion de Pasturas Tropicales (PJEPT). 340 pp.
Amezquita, M. C. and Rojas, A., 1985. Metodologfa de procesamiento y analisis estadistico de la information. In: Vera, R. and Sere, C. (eds.). Sistemas de produccion pecuaria extensiva: Brasil, Colombia, Venezuela. Informe final de Proyecto ETES (Estudio Tecnico y Economico de Sistemas de Produccion Pecuaria 1978-1982). 1-30. Centra Internacional de Agricultura Tropical (CIAT). Cali, Colombia.
Amezquita, M. C ; Toledo, J. M.; Giraldo, H.; and Rojas, A., 1983. Numero de muestras a tomar para estimar produccion de forraje bajo pastoreo. Latinamerican Association for Animal Production (ALPA). Memories 1983. 18: 102. (Abstract PF-45.)
Cajas, G. S., 1984. Efecto de la carga en el crecimiento y aparicion del celo en novillas de levante en pastos Brachiaria humidicola, Melinis minutiflora y Desmodium ovalifolium. Thesis. Universidad Nacional de Colombia, Palmira, Colombia. 105 pp.
CIAT (Centra Internacional de Agricultura Tropical), 1979-1983. Tropical Pastures Program Annual Reports.
Coates, D.B. and Penning, P., 2000. Measuring animal performance. In: Mannetje, L.'t and Jones, R.M.(eds.). Field and Laboratory Methods in Grassland and Animal Production Research. 353-401. CAB International, Wallingford, U.K.
GRI (Grassland Research Institute), 1961. Part I: Experimental design and interpretation. In: GRI.Research techniques in use at the Grassland Research Institute. Bulletin 45. 5-23. Commonwealth Bureau of Pastures and Field Crops, Commonwealth Agricultural Bureaux (CAB), Hurley, England.
Harvey, W. R., 1964. Computing procedures for a generalised least-squares analysis program. Paper presented at the Analysis of Variance Conference, Colorado State University, Ft. Collins, Colorado, July 1964. Biometrical Services, Agricultural Research Service, U.S. Department of Agriculture, Beltsville, MD., U.S.A., 50 pp. (Typescript.)
Haydock, K. P., 1984. Consequences arising when the design of a grazing trial is not ideal. In: Blight, G. W. (ed.). Experimental design in cattle research when resources are limiting. Proceedings of the Australian Society of Animal Production, 15: 52-54.
75
Biometrical Applications in Tropical Pasture and Agro-pastoral Research
Jones, R. M; Jones, R. J. and McDonald, C. K., 1995. Some advantages of long-term grazing trials, with particular reference to changes in botanical composition. Australian Journal of Experimental Agriculture 35: 1029-1038.
Lascano, C. E. and Pizarro, E. A. (eds.). Evaluacion de pasturas con animales. Alternativas Metodologicas. CIAT. Book series ISBN 84-8280-154-6, 292 pp.
Lucas, H. L., 1976. Design in animal science research. Institute of Statistics, University of North Carolina, N.C., U.S.A.
Mannetje, L.'t and Jones, R.M., 1990. Pasture and animal productivity of buffel grass with Siratro, lucerne or nitrogen fertilizer. Tropical Grasslands 24: 269-281.
Mannetje, L. 't and Jones, R.M. (eds.), 2000. Field and Laboratory Methods for Grassland and Animal Production Research. CAB International, Wallingford, U.K.
Mannetje, L. 't;Jones, R. J. and Stobbs, T. H., 1976. Pasture evaluation by grazing experiments. In: Shaw, N. H. and Bryan, W. W. (eds.). Tropical pasture research: Principles and methods. Bulletin 51. 194-234. Commonwealth Bureau of Pastures and Field Crops, Commonwealth Agricultural Bureaux (CAB), Hurley, England.
Mendoza, P. and Lascano, C. E., 1986.Mediciones de la pastura en ensayos de pastoreo. In: Lascano, C. E. and Pizarro, E. A. (eds.). Evaluacion de pasturas con animales. Alternativas Metodologicas. 143- 166. CIAT. Book series ISBN 84-8280-154-6, 292 pp.
Paladines, O., 1986. Mediciones de respuesta animal en ensayos de pastoreo: ganancia de peso. In: Lascano, C. E. and Pizarro, E. A. (eds.). Evaluacion de pasturas con animales. Alternativas Metodologicas. 99-26. CIAT. Book series ISBN 84-8280-154-6, 292 pp.
Paladines, O. and Lascano, C. E., 1983. Recomendaciones para evaluar germoplasma bajo pastoreo en pequenos potreros. In: Paladines, O. and Lascano, C. E. (eds.). Germoplasma forrajero bajo pastoreo en pequefias parcelas: Metodologfas de evaluacion. 165-183. Memorias de una reunion de trabajo celebrada en Cali, Colombia, 22-24 septiembre, 1982. Red Internacional de Evaluacion de Pastos Tropicales (RIEPT) and Centro Internacional de Agricultura Tropical (CIAT). Cali, Colombia.
Paladines, O. and Leal, J. A., 1978. Pasture management and productivity in the Eastern Plains of Colombia. In: Sanchez, P. A. and Tergas, L. E. (eds.). Pasture production in acid soils of the tropics: Proceedings of a seminar held at CIAT, Cali, Colombia, April 17-21, 1978. 311-325. Series 03 EG-5. Beef Program, Centro Internacional de Agricultura Tropical (CIAT). Cali, Colombia.
Stobbs, T. H. and Sandland, R. L., 1972. The use of a Latin square change-over design with dairy cows to detect differences in the quality of tropical pastures. Aust. J. Exp. Agric. Anim. Husb. 12: (58) 463-469.
76
Planning, Design and Analysis of Grazing Experiments
Stonaker, H. H.; Raun, N. S.; and Gomez, J., 1984. Beef cow-calf production experiments on the savannas of eastern Colombia: Effects of minerals, early weaning, crossbreeding, urea feeding, and pastures on herd production. Centro Internacional de Agriculture Tropical (OAT), Institute Colombiano Agropecuario (ICA), and Winrock International, Morrilton, AR., U.S.A.
Tergas, L. E.; Paladines, O.; Kleinheisterkamp, I.; and Velasquez, J., 1983. Productividad animal de praderas naturales con pastoreo complementario en Pueraria phaseoloides en los Llanos Orientales de Colombia. Prod. Anim. Trop. (Dominican Rep.) 8(3): 203-211.
Tergas, L. E.; Paladines, O.; Kleinheisterkamp, I.; and Velasquez, J., 1984a. Productividad animal de Brachiaria decumbens sola y con pastoreo complementario en Pueraria phaseoloides en los Llanos Orientales de Colombia. Prod. Anim. Trop. (Dominican Rep.) 9(1): 1-13.
Tergas, L. E.; Paladines, O.; Kleinheisterkamp, I.; and Velasquez, J., 1984b. El potencial de production animal de cuatro asociaciones de Andropogon gayanus Kunth en los Llanos Orientales de Colombia. Prod. Anim. Trop. (Dominican Rep.) 9(3): 176-186.
Toledo, J. M., 1982. Objetivos y organization de la Red Internacional de Evaluacion de Pastos Tropicales. In: Toledo, J. M. (ed.). Manual para la evaluacion agronomica. 13-21. Book series CIAT 07SG-1(82). Red Internacional de Evaluacion de Pastos Tropicales (RIEPT) and Centro Internacional de Agricultura Tropical (CIAT). Cali, Colombia.
Vaccaro, L., 1986. Mediciones de la respuesta animal en ensayos de pastoreo: vacas lecheras y de doble proposito. In: Lascano, C. E. and Pizarro, E. A. (eds.). Evaluacion de pasturas con animales. Alternativas Metodologicas. 127-142. CIAT. Book series ISBN 84-8280-154-6, 292 pp.
Vera, R., 1982. Evaluacion de sistemas de cria con pasturas mejoradas. Documento interno. Centro Internacional de Agricultura Tropical (CIAT). Cali, Colombia.
Wilson, P. N., 1975. General considerations. In: Wilson, P. N. (ed.). Considerations for the design and interpretation of cattle experiments: Proceedings of a symposium on cattle experimentation. British Society of Animal Production. 11-24. Edinburgh, Scotland.
77

Biometrical Applications in Tropical Pasture and Agro-pastoral Research
78
Genetic Group Influences on the Milk Production and Reproductive Performance of Dual-Purpose Cows in a Commercial Farm
Chapter 6
Genetic Group Influences on the Milk Production and Reproductive Performance
of Dual-Purpose Cows in a Commercial Farm1
M. C. Amezquita2 and G. Lema3
Introduction
The development of improved dual-purpose production systems based on tropical pastures opens a promising method for economic milk production in Latin American countries, most of which carry a heavy national deficit of milk and meat products (Sere and Vaccaro, 1984). Dual-purpose cattle, derived from crosses between Bos taurus x Bos indicus with different levels of genetic advance, are the ideal animal types for these production systems.
The B. taurus lineage comes mainly from Holstein or Swiss Brown cattle. Although its milk production potential is high, it is poorly adapted to the environmental stresses and management practices prevailing in tropical areas, hindering its sustainable exploitation. The B. indicus lineage, derived from Brahman, Gyr, Guzera, or Sahival cattle, has a high meat production potential and is adapted to the environmental conditions and management practices of the tropics. Vaccaro (1984, 1986) mentions that, in general, Holstein x Zebu crosses show better productive performance than Swiss Brown x Zebu crosses, and that cows with 50% to 75% B. taurus inheritance are more appropriate for the tropics.
On-farm research on dual-purpose systems in the tropics faces the challenge to identify the optimal combination of pasture and animal genetics for given environment and farm management conditions.
Adapted from the article published in Spanish in: Lascano, C. E. and Holmann, F. (eds.), 1997. Conceptos y Metodologfas de Investigation en Fincas con Sistemas de Production Animal de Doble Proposito. 80-92. CIAT-TROPILECHE. Book series ISBN 958-9439-93-4, 285 pp. Head Biometry Unit, Centro International de Agriculture Tropical (CIAT). Cali, Colombia. Research Associate, Biometry Unit, Centro International de Agriculture Tropical (CIAT). Cali, Colombia.
79
Biometrical Applications in Tropical Pasture and Agro-pastoral Research
One aspect emphasised by the TROPILECHE 4 project is the importance of improving dietary resources as a way of increasing the profitability and efficiency of dual-purpose systems in the tropics (Lascano and Holmann, 1997). However, animal genetics must also be incorporated to comprehensively improve these production systems at the farm level.
Some important aspects for on-farm research with dual-purpose systems need special consideration: 1. Milk production and reproductive performance of dual-purpose cows in tropical farms vary
greatly among individuals of the same genetic group and, in certain cases, this variability is higher than between genetic groups (Vaccaro, 1986).
2. Studies on the identification and prioritisation of sources of variation on milk and meat production of dual-purpose cows at farm level in the Latin-American tropics are scarce.
Therefore, it is necessary to analyse available animal production records of different genetic groups from dual-purpose commercial farms, in order to identify and prioritise sources of variation affecting animal performance under farm management conditions. Results from these analyses will represent valuable support in the planning and conduction of research at farm level. Additionally, they will guide the producer into a more efficient farm management.
The choice of the appropriate commercial farm, or farms, for this purpose is important. The proprietor should perform, on a continuous basis, a careful recording and monitoring of information from each cow in terms of milk production, reproductive performance, and meat production of calves. The proprietor should also periodically evaluate the farm's production efficiency. This requires an estimation over time of both, individual animal production parameters and herd production indices. Additionally, the proprietor should have well-defined criteria to select and discard animals.
Objective of the Study
This study presents the analysis of animal production records from a tropical commercial dual-purpose cattle farm, which, over the years, has improved feed resources and has also placed special emphasis on the genetic improvement of animals. The animal response variables, animal production parameters, and herd performance indices considered in this study are of interest to both researchers and producers.
The study has two main objectives: a) compare several groups of B. taurus x B. indicus cows of different genetic level, in terms of their milk production and reproductive performance under commercial management conditions; and b) identify and prioritise sources of variation affecting dual-purpose animal performance under farm management conditions. The dual-purpose commercial farm selected for this study is representative of a well-managed low-input technology
TROPILECHE is a tropical milk research consortium of Latin-American national research institutions from Peru, Costa Rica, Honduras and Nicaragua, led by CIAT and part of ILRI's System-wide Livestock Program.
80
Genetic Group Influences on the Milk Production and Reproductive Performance of Dual-Purpose Cows in a Commercial Farm
farm (both in pasture quality as in animal genetics) located on relatively poor acid soils, under a bimodal annual precipitation, in the semi-evergreen seasonal forest ecosystem of the Latin-American tropics. The genetic groups are the result of a continued alternate-crossing breeding program using artificial insemination, based on outstanding, pure bred, Red Holstein and Red Brahman bulls.
Analysis of the targeted Farm
General description of the farm and animal management practices
Location, climate, and soils. The farm "Hacienda La Maria", is located in Caloto, Cauca, Colombia, at 1000 m.a.s.l. It has an average temperature of 24°C and a bimodal annual precipitation of 1800 mm. Rains fall between March and June and between September and December. Total farm area is 115 ha, with acid soils of low P and K content.
Of the total farm area, 96 ha are dedicated to dual-purpose cattle production. This area is divided into 30 paddocks planted to improved pastures of grass only or grass associated with legumes. Brachiaria decumbens, alone or with native legumes, predominate in well-drained areas; B. decumbens with Arachis pintoi in small extensions; B. brizantha and B. dictyoneura in medium extensions; B. humidicola in poorly drained lowland areas; and improved Cynodon nlemfuensis in areas with greater relative soil fertility. Four hectares are also planted to maize for silage.
Livestock and genetic improvement program. On average, the herd consists of 200 head of cattle, at a stocking rate of about 2 animals/ha. Animals can be grouped as follows: 110 cows more than 2 years old, 25 heifers between 1 and 2 years old, and 65 male and female calves under 1 year old. All cows are artificially inseminated as described above. The genetic improvement program consists of alternate crosses between both breeds to obtain, in the long run, a herd with a 33% - 67% European genes. As a result of the alternate-crossing breeding scheme, the herd consists of six genetic groups of different B. taurus genetic advance (4/4, 3/4, 5/8, 1/2, 3/8, and 1/4 B. taurus).
Herd selection criteria. Replacement heifers are selected according to the following criteria: weight gain (more than 15 kg/animal per month); structural size (or "frame score", between 5.5 and 8.0, on a scale of 1 to 10, where 1 refers to small-sized animals with a non-balanced structure, and 10 refers to very big well-balanced animals); phenotype according to breed characteristics, pigmentation, and functionality; weight of heifers at service (more than 380 kg, which they usually reach in 2 years).
Males are sold at the age of 1 year or younger, depending on on-farm availability of forage. Animals for sale or slaughter are chosen on the basis of animal production indices and overall farm production. Only those cows with high production potential are kept in the herd. Furthermore, and depending on production objectives and phenotype, breeding animals with the desired genetic characteristics are identified according to production goals proposed for the herd.
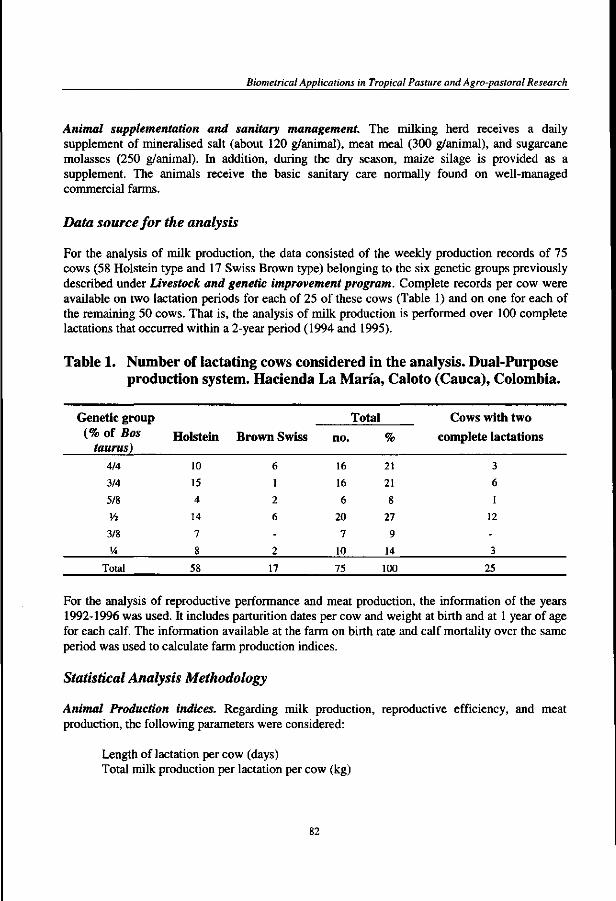
Biometrical Applications in Tropical Pasture and Agro-pastoral Research
Animal supplementation and sanitary management. The milking herd receives a daily supplement of mineralised salt (about 120 g/animal), meat meal (300 g/animal), and sugarcane molasses (250 g/animal). In addition, during the dry season, maize silage is provided as a supplement. The animals receive the basic sanitary care normally found on well-managed commercial farms.
Data source for the analysis
For the analysis of milk production, the data consisted of the weekly production records of 75 cows (58 Holstein type and 17 Swiss Brown type) belonging to the six genetic groups previously described under Livestock and genetic improvement program. Complete records per cow were available on two lactation periods for each of 25 of these cows (Table 1) and on one for each of the remaining 50 cows. That is, the analysis of milk production is performed over 100 complete lactations that occurred within a 2-year period (1994 and 1995).
Table 1. Number of lactating cows considered in the analysis. Dual-Purpose production system. Hacienda La Maria, Caloto (Cauca), Colombia.
Genetic group (% of Bos
taurus) 4/4
3/4
5/8
Vi
3/8
V*
Total
Holstein
10
15
4
14
7
8
58
Brown Swiss
6
1
2
6
-2
17
no.
16
16
6
20
7
10
75
Total
%
21
21
8
27
9
14
100
Cows with two complete lactations
3
6
1
12
-3
25
For the analysis of reproductive performance and meat production, the information of the years 1992-1996 was used. It includes parturition dates per cow and weight at birth and at 1 year of age for each calf. The information available at the farm on birth rate and calf mortality over the same period was used to calculate farm production indices.
Statistical Analysis Methodology
Animal Production indices. Regarding milk production, reproductive efficiency, and meat production, the following parameters were considered:
Length of lactation per cow (days) Total milk production per lactation per cow (kg)
82
Genetic Group Influences on the Milk Production and Reproductive Performance of Dual-Purpose Cows in a Commercial Farm
Daily milk production per lactation per cow (kg) Rate of decline in milk production per lactation per cow (kg/week) Calving interval per cow per birth event (months) Calf weight at birth (kg) Calf weight at one year of age (kg).
The first three parameters (milk production parameters) were calculated on the basis of weekly milk production records per cow, using 100 complete lactations. The rate of decline in milk production per lactation per cow (kg/week) was estimated by fitting lactation curve models for each cow, using three different mathematical models described later in this document. This parameter is a valuable criterion for discarding or selecting cows.
Individual calving intervals per cow per birth event (months) were calculated on the basis of parturition dates, resulting in 186 calving interval values. The analysis on calf birth weight used information on 118 males and 119 females, whereas information on weight was available of a smaller number of calves (28 males and 47 females) at 1 year of age.
Farm production indices. The following farm production indices, estimated by the proprietor, are reported by this study:
1. Herd average of milk production per cow per day (kg). 2. Herd average of calving interval per cow per birth event (months). 3. Distribution of the herd in terms of milk production per lactation per cow within the
different genetic groups. 4. Annual calving rate (%) and calf mortality rate (%).
Fitting of lactation curves
Three mathematical models were used to find the best-fit model for each lactation curve. These models are illustrated in Figure 1 and are described below:
1. Linear:
Y = a -bX
2. Segmented linear:
ai + a2X , if X < Xo Y =
a3-b(X-Xo) , i fX>X0
where, Xo = (a3 - ai) / a2
83
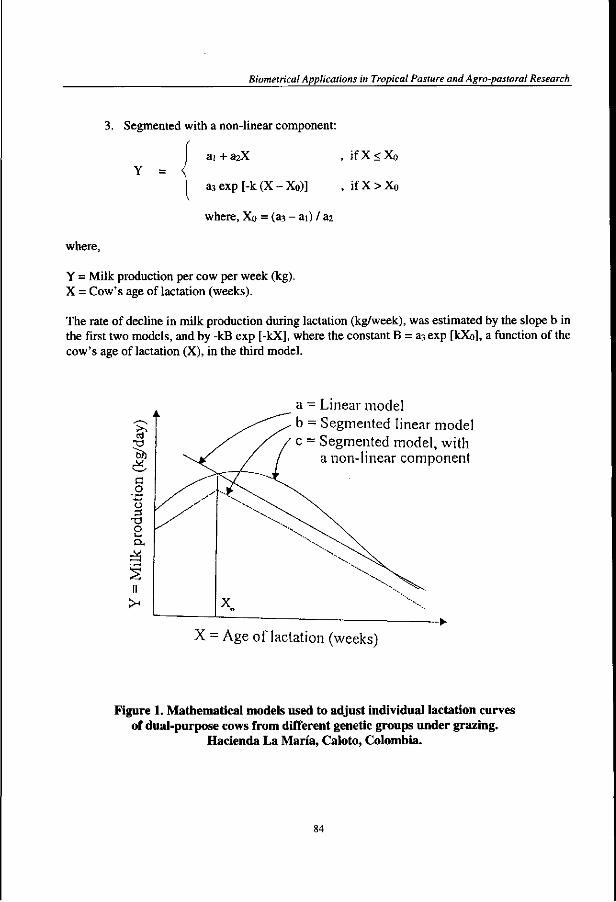
Biometrical Applications in Tropical Pasture and Agro-pastoral Research
Y = <
3. Segmented with a non-linear component:
ai + a2X , if X < X0
a3 exp [-k (X - X0)] , i fX>X0
where, Xo = (a3 - ai) / &i
where,
Y = Milk production per cow per week (kg). X = Cow's age of lactation (weeks).
The rate of decline in milk production during lactation (kg/week), was estimated by the slope b in the first two models, and by -kB exp [-kX], where the constant B = a3 exp [kXo], a function of the cow's age of lactation (X), in the third model.
a = Linear model b = Segmented linear model c = Segmented model, with
a non-linear component
X - Age of lactation (weeks)
Figure 1. Mathematical models used to adjust individual lactation curves of dual-purpose cows from different genetic groups under grazing.
Hacienda La Maria, Caloto, Colombia.
84
Genetic Group Influences on the Milk Production and Reproductive Performance of Dual-Purpose Cows in a Commercial Farm
Correlation matrices were calculated between milk production parameters for all the observations of the herd, and for each genetic group, to detect possible redundancy among production parameters. Also, the correlation between the first and second lactation of the same cow was calculated to decide whether the second lactation should be considered as a sub-sample of the same cow or as an additional, independent observation.
Sources of variability on animal production parameters and their relative importance
The "cow's level of genetic advance" and its "breed" are major sources of variability in milk production parameters and reproductive performance in dual-purpose cows grazing under tropical conditions. Other major sources are the stresses to which animals are subjected: minimum protection against climate; long distances to milking sites; presence of ecto- and endoparasites; neglect by management, especially for nursing calves; and poor quality pastures. The genotypes with higher production potential are most affected by these stress factors.
In dual-purpose cattle farms that have a continuously evolving production, the "year" of evaluation is an important source of variability. In this particular case, the variation among years represents not only climatic and environmental differences, but also the dynamics associated with pasture and animal management improvement. "Calf sex" is an additional source of variation for meat production parameters, such as calf weight at birth and at 1 year of age.
In order to quantify the effect and relative importance of the different sources of variation considered to affect milk production parameters and calving interval under the farm management conditions, an analysis of variance (ANOVA) using the model shown under Results, was used. The corresponding ANOVA model for analysing calf weight at birth and at one year of age also included "sex of the calf and its interactions as additional sources of variation.
The relative importance of the different sources of variation was quantified by the following criteria obtained from the ANOVA results:
1. The F-value associated with the source. The F-value is the ratio between the Mean Square associated with the source of variation (or factor) and the Mean Square of the residual (or error). The higher the F-value associated with the factor, the higher the factor's importance in affecting the specific animal production parameter.
2. The proportion of total variation in the response variable explained by the source, expressed as (Sum of Squares associated with the source / Total Sum of Squares) x 100. The higher this proportion, the higher the factor's importance in affecting the specific animal production parameter.
85
Biometrical Applications in Tropical Pasture and Agro-pastoral Research
Results
Fitting of Lactation Curves
Out of the 100 lactation curves, 61 followed the linear model, with R2 values ranging between 55 and 87%; 9 cases showed good fit in the segmented linear model, with R2 ranging between 50 and 89%; and the 30 remaining cases did not show good fit under any model, with R2 values under 35%. The nine lactation curves that followed the segmented linear model corresponded to cows of genetic groups 4/4, 3/4, and 5/8, that is, to genetic groups with a higher percentage of European lineage. An interesting observation is that, even under conditions of commercial, dual-purpose herd management in the tropics, the production scheme per lactation of cows with a high percentage of B. taurus lineage is similar to that expected in dairy cows in temperate conditions, as presented by Madelena et al. (1979).
Descriptive Statistics
Table 2 shows descriptive statistics for animal production parameters for the herd.
Tables 3 to 7 show descriptive statistics for animal production parameters, by source of variability, indicating the observed effect of the source on animal production. Sources considered include genetic group (Table 3), breed type (Table 4), year (Table 5), sex of calf (Table 6), and animal management practices (Table 7).
Data in Table 3 suggest that length of lactation per cow, total milk production per lactation per cow, and daily milk production per lactation per cow decrease as the percentage of European blood decreases in the cross; that calving intervals are longer for cows with a higher percentage of European blood; and that calf weight at birth and at 1 year of age, seem not to be affected by genetic group. Four, out of the six genetic groups considered in this study (those showing the most contrasting performance) are illustrated in this table.
Data in Table 4 suggest that breed type favours Holstein cows over Brown Swiss in terms of milk production parameters.
Table 5 summarises the Hacienda's production indices for the last 5 years (1992-1996). There was a marked improvement in production over time, associated, as mentioned before, with improved animal and pasture management. The "year" is therefore expected to have a significant effect on animal production parameters.
Data shown in Table 6 suggest that male calves have higher live weights than female calves.
Data shown in Table 7 suggest that inappropriate management practices, reflected in calf death, reduce the length of the lactation period and the cow's total milk production during lactation.
86
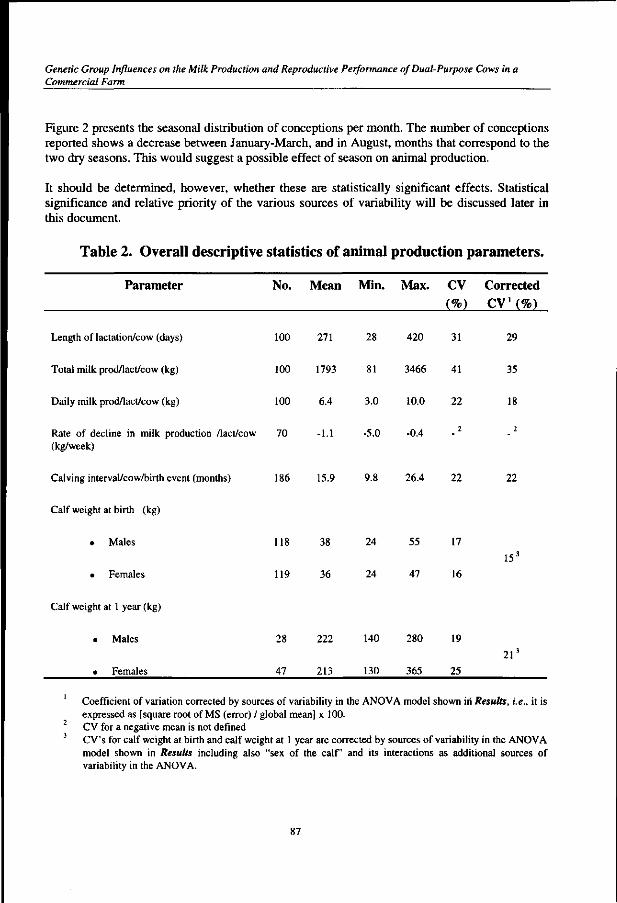
Genetic Group Influences on the Milk Production and Reproductive Performance of Dual-Purpose Cows in a Commercial Farm
Figure 2 presents the seasonal distribution of conceptions per month. The number of conceptions reported shows a decrease between January-March, and in August, months that correspond to the two dry seasons. This would suggest a possible effect of season on animal production.
It should be determined, however, whether these are statistically significant effects. Statistical significance and relative priority of the various sources of variability will be discussed later in this document.
Table 2. Overall descriptive statistics of animal production parameters.
Parameter No. Mean Min. Max. CV Corrected
(%) C V (%)
Length of lactation/cow (days)
Total milk prod/lact/cow (kg)
Daily milk prod/lact/cow (kg)
Rate of decline in milk production /lact/cow 70 (kg/week)
Calving interval/cow/birth event (months) 186 15.9 9.8 26.4 22 22
Calf weight at birth (kg)
. Males 118 38 24 55 17
153
« Females 119 36 24 47 16
Calf weight at 1 year (kg)
. Males 28 222 140 280 19
21 3
« Females 47 213 130 365 25
Coefficient of variation corrected by sources of variability in the ANOVA model shown in Results, i.e., it is expressed as [square root of MS (error) / global mean] x 100. CV for a negative mean is not defined CV's for calf weight at birth and calf weight at 1 year are corrected by sources of variability in the ANOVA model shown in Results including also "sex of the calf and its interactions as additional sources of variability in the ANOVA.
100
100
100
70
271
1793
6.4
-1.1
28
81
3.0
-5.0
420
3466
10.0
-0.4
31
41
22
2
29
35
18
2
87
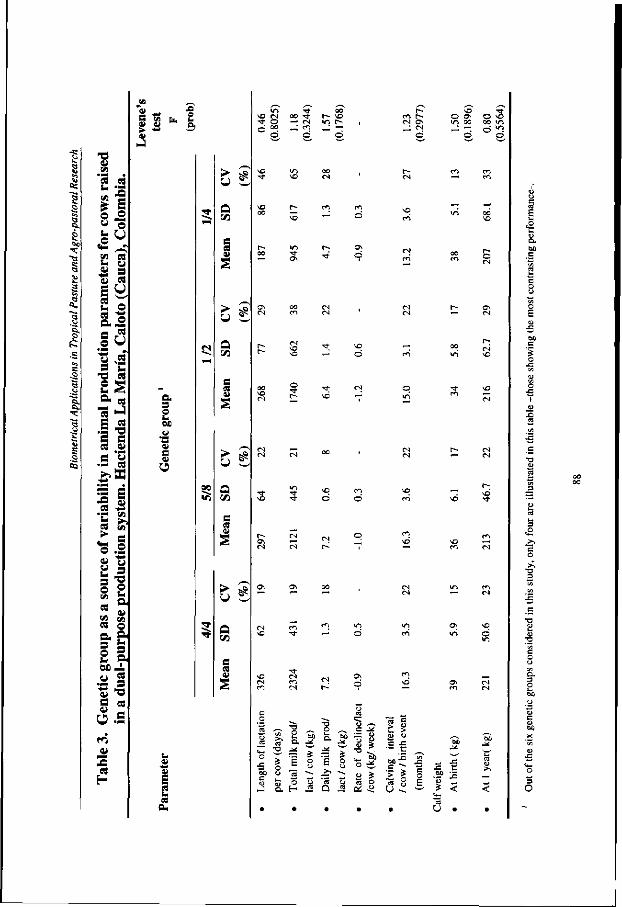
5 to
8
-a
I 5 5
<u
"3 «
* i u "o few
« M ^
y> « « s aj TO
SB
2.-2
"S v2 a C -o « 2£ a es « ^
e e c "« .5 « -*> SC
1 a •r* «» .
3 y © .2 « "5 a "°
« O.
« -O
V it > *•
2
e
O
U
Q
^
Q
i£
Q to
f i V
2 a H
u <u IS E et i . as 0-
>n oo o r i oo ^r r- o r f o — r m r-O oo _; co _; - ;
P. P. P.
t~ r*t r* cs o\ -J f
o
o f\
^
\o o\ 00
—' o
• *
O VO oo »/•> d "1
p.
04 —
~ d
"E 2 M s. 3 s£ ^ — ~* £ 8 E
a h J D 5 a!
"oo
q
c
XJ 1 4 -
ri
J *
=5
*5b
C > <D 4)
c -5 • — i -
<*>f
— <N
— tS
* <
u
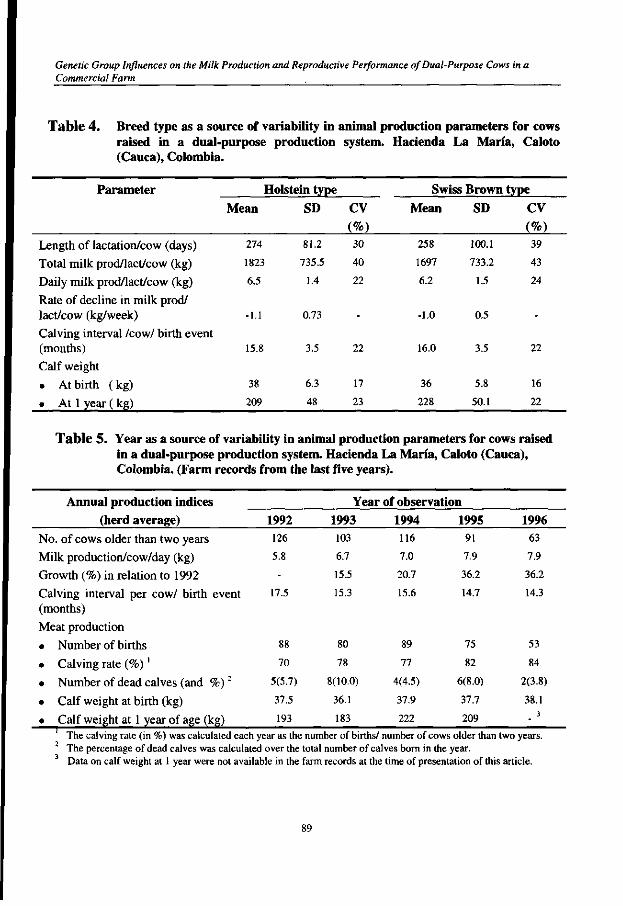
Genetic Group Influences on the Milk Production and Reproductive Performance of Dual-Purpose Cows in a Commercial Farm
Table 4. Breed type as a source of variability in animal production parameters for cows raised in a dual-purpose production system. Hacienda La Maria, Caloto (Cauca), Colombia.
Parameter
Length of lactation/cow (days) Total milk prod/lact/cow (kg) Daily milk prod/lact/cow (kg) Rate of decline in milk prod/ lact/cow (kg/week) Calving interval /cow/ birth event (months) Calf weight • At birth (kg) • At 1 year ( kg)
Holstein type Mean
274
1823
6.5
-1.1
15.8
38
209
SD
81.2
735.5
1.4
0.73
3.5
6.3
48
CV (%) 30
40
22
-
22
17
23
Swiss Brown Mean
258
1697
6.2
-1.0
16.0
36
228
SD
100.1
733.2
1.5
0.5
3.5
5.8
50.1
type CV (%) 39
43
24
-
22
16
22
Table 5. Year as a source of variability in animal production parameters for cows raised in a dual-purpose production system. Hacienda La Maria, Caloto (Cauca), Colombia. (Farm records from the last five years).
Annual production indices (herd average)
No. of cows older than two years Milk production/cow/day (kg) Growth (%) in relation to 1992 Calving interval per cow/ birth event (months) Meat production • Number of births • Calving rate (%)'
• Number of dead calves (and %) 2
• Calf weight at birth (kg)
• Calf weight at 1 year of age (kg)
1992 126
5.8
-17.5
88
70
5(5.7)
37.5
193
Year of observation 1993 103
6.7
15.5
15.3
80
78
8(10.0)
36.1
183
1994 116
7.0
20.7
15.6
89
77
4(4.5)
37.9
222
1995 91
7.9
36.2
14.7
75
82
6(8.0)
37.7
209
1996 63
7.9
36.2
14.3
53
84
2(3.8)
38.1 3
The calving rate (in %) was calculated each year as the number of births/ number of cows older than two years. The percentage of dead calves was calculated over the total number of calves born in the year. Data on calf weight at 1 year were not available in the farm records at the time of presentation of this article.
89
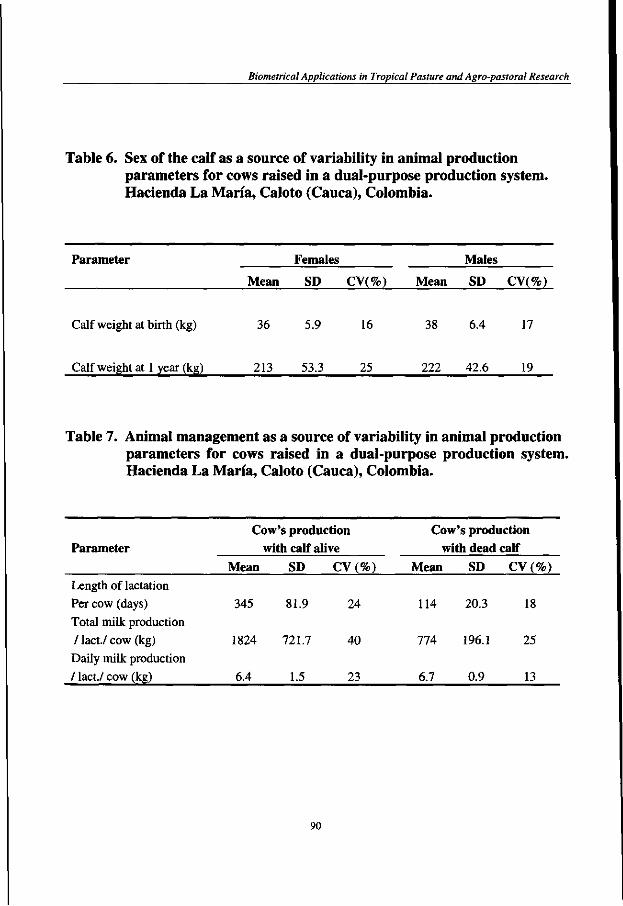
Biometrical Applications in Tropical Pasture and Agro-pastoral Research
Table 6. Sex of the calf as a source of variability in animal production parameters for cows raised in a dual-purpose production system. Hacienda La Maria, Caloto (Cauca), Colombia.
Parameter Females Males
Mean SD CV(%) Mean SD CV(%)
Calf weight at birth (kg) 36 5.9 16 38 6.4 17
Calf weight at 1 year (kg) 213 53.3 25 222 42.6 19
Table 7. Animal management as a source of variability in animal production parameters for cows raised in a dual-purpose production system. Hacienda La Maria, Caloto (Cauca), Colombia.
Parameter Cow's production
with calf alive
Mean SD CV (%)
Cow's production with dead calf
Mean SD CV (%) Length of lactation Per cow (days) 345 81.9 Total milk production / lact./cow (kg) 1824 721.7 Daily milk production / lact./ cow (kg) 6A 1.5
24
40
23
114 20.3
774 196.1
6.7 0.9
18
25
13
90
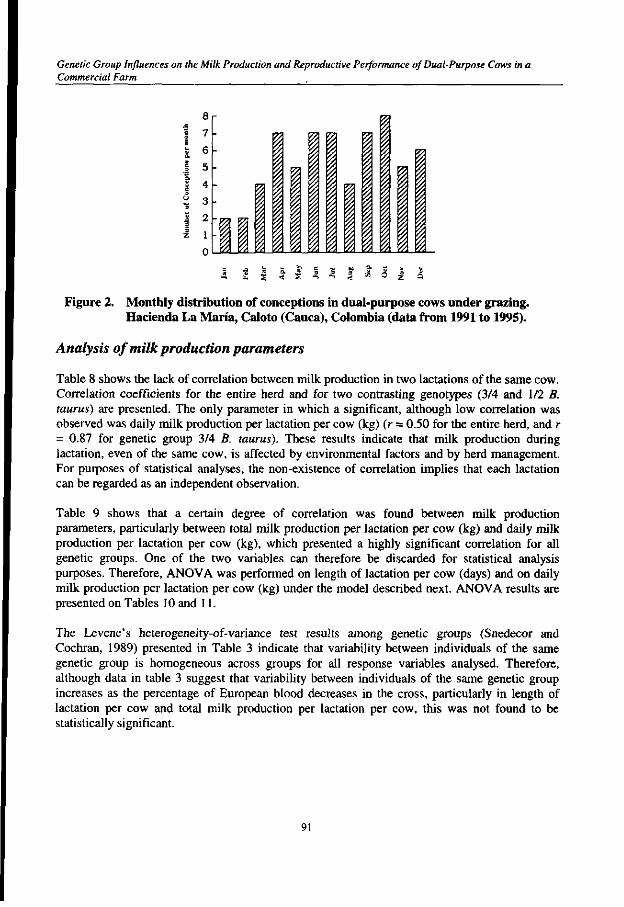
Genetic Group Influences on the Milk Production and Reproductive Performance of Dual-Purpose Cows in a Commercial Farm
ill II Figure 2. Monthly distribution of conceptions in dual-purpose cows under grazing.
Hacienda La Maria, Caloto (Cauca), Colombia (data from 1991 to 1995).
Analysis of milk production parameters
Table 8 shows the lack of correlation between milk production in two lactations of the same cow. Correlation coefficients for the entire herd and for two contrasting genotypes (3/4 and 1/2 B. taurus) are presented. The only parameter in which a significant, although low correlation was observed was daily milk production per lactation per cow (kg) (r = 0.50 for the entire herd, and r = 0.87 for genetic group 3/4 B. taurus). These results indicate that milk production during lactation, even of the same cow, is affected by environmental factors and by herd management. For purposes of statistical analyses, the non-existence of correlation implies that each lactation can be regarded as an independent observation.
Table 9 shows that a certain degree of correlation was found between milk production parameters, particularly between total milk production per lactation per cow (kg) and daily milk production per lactation per cow (kg), which presented a highly significant correlation for all genetic groups. One of the two variables can therefore be discarded for statistical analysis purposes. Therefore, ANOVA was performed on length of lactation per cow (days) and on daily milk production per lactation per cow (kg) under the model described next. ANOVA results are presented on Tables 10 and 11.
The Levene's heterogeneity-of-variance test results among genetic groups (Snedecor and Cochran, 1989) presented in Table 3 indicate that variability between individuals of the same genetic group is homogeneous across groups for all response variables analysed. Therefore, although data in table 3 suggest that variability between individuals of the same genetic group increases as the percentage of European blood decreases in the cross, particularly in length of lactation per cow and total milk production per lactation per cow, this was not found to be statistically significant.
91
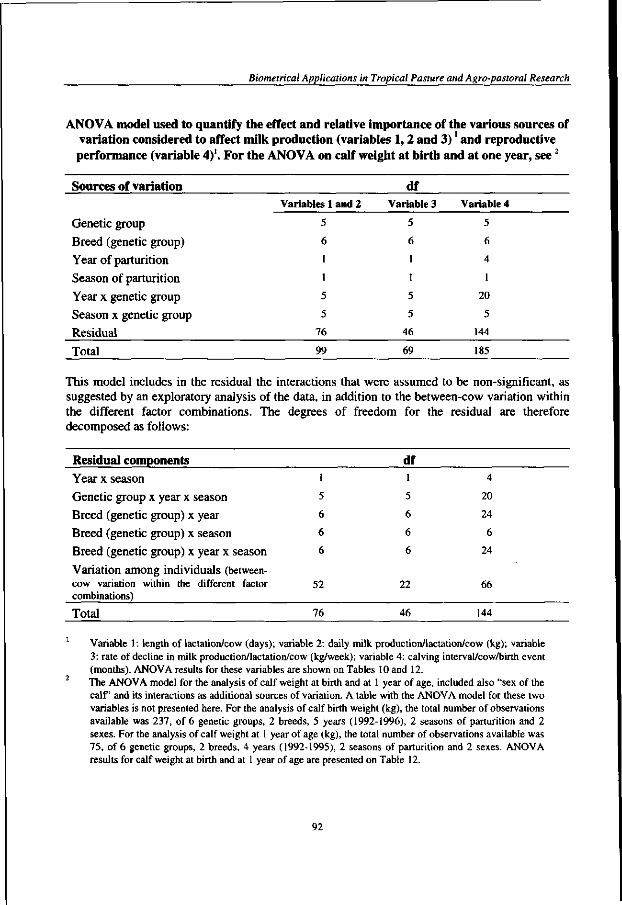
Biometrical Applications in Tropical Pasture and Agro-pastoral Research
ANOVA model used to quantify the effect and relative importance of the various sources of variation considered to affect milk production (variables 1,2 and 3) and reproductive performance (variable 4)'. For the ANOVA on calf weight at birth and at one year, see2
Sources of variation
Genetic group Breed (genetic group) Year of parturition Season of parturition Year x genetic group Season x genetic group Residual Total
Variables 1 and 2
5
6
1
1
5
5
76
99
df Variable 3
5
6
1
1
5
5
46
69
Variable 4
5
6
4
1
20
5
144
185
1
5
6
6
6
1
5
6
6
6
4
20
24
6
24
This model includes in the residual the interactions that were assumed to be non-significant, as suggested by an exploratory analysis of the data, in addition to the between-cow variation within the different factor combinations. The degrees of freedom for the residual are therefore decomposed as follows:
Residual components df Year x season Genetic group x year x season Breed (genetic group) x year Breed (genetic group) x season Breed (genetic group) x year x season Variation among individuals (between-cow variation within the different factor 52 22 66 combinations)
Total 76 46 144
1 Variable 1: length of lactation/cow (days); variable 2: daily milk production/lactation/cow (kg); variable 3: rate of decline in milk production/lactation/cow (kg/week); variable 4: calving interval/cow/birth event (months). ANOVA results for these variables are shown on Tables 10 and 12. The ANOVA model for the analysis of calf weight at birth and at 1 year of age, included also "sex of the calf and its interactions as additional sources of variation. A table with the ANOVA model for these two variables is not presented here. For the analysis of calf birth weight (kg), the total number of observations available was 237, of 6 genetic groups, 2 breeds, 5 years (1992-1996), 2 seasons of parturition and 2 sexes. For the analysis of calf weight at 1 year of age (kg), the total number of observations available was 75, of 6 genetic groups, 2 breeds, 4 years (1992-1995), 2 seasons of parturition and 2 sexes. ANOVA results for calf weight at birth and at 1 year of age are presented on Table 12.
92

Genetic Group Influences on the Milk Production and Reproductive Performance of Dual-Purpose Cows in a Commercial Farm
Table 8. Correlation between milk production in two lactations of the same cow. Cows raised in a dual-purpose production system. Hacienda La Maria, Caloto (Cauca), Colombia.
Parameter
Length of lactation (days)
Total milk prod/lact/cow (kg)
Daily milk prod/lact/cow (kg)
For the overall herd
(n = 25 cows)
0.16 NS
0.20 NS
0.50*
Genotype 3/4
(n = 6 cows)
0.2 NS
-0.25 NS
0.87*
Genotype 1/2
(n = 12 cows)
0.06 NS
-0.14 NS
0.05 NS
NS = non-significant correlation (p > 0.05); significant correlation (0.01 < p < 0.05).
Table 9. Correlation between milk production parameters in a dual-purpose production system. Hacienda La Maria, Caloto (Cauca), Colombia.
Correlated parameters Genetic group'
Herd 4/4 3/4 5/8 1/2 3/8 1/4
(n = 100) (n = 19) (n=22) (n=7) (n=32) (n=7) (n =13)
Total milk prod/lact/cow (kg) vs. 0.60** Length of lactation (days) (0.0001)
0.42 NS 0.42 NS 0.75* 0.53** 0.44NS 0.60* (0.049) (0.0009) (0.03)
Total milk prod/lact/cow (kg) vs. 0.88** Daily milk prod/lact/cow (kg) (0.0001)
0.87** 0.85** 0.88** 0.90** 0.98** 0.83** (0.0001) (0.0001) (0.009) (0.0001) (0.007) (0.0005)
Daily milk prod/lact/cow(kg) vs. 0.40 NS Length of lactation (days)
0.39 NS 0.22 NS 0.54NS 0.47 NS 0.3 INS 0.14 NS
Values in parentheses refer to the probability of significance of the correlation coefficient. NS = non-significant correlation (p > 0.05); * = significant correlation (0.01 < p < 0.05); ** = significant correlation (p < 0.01).
93
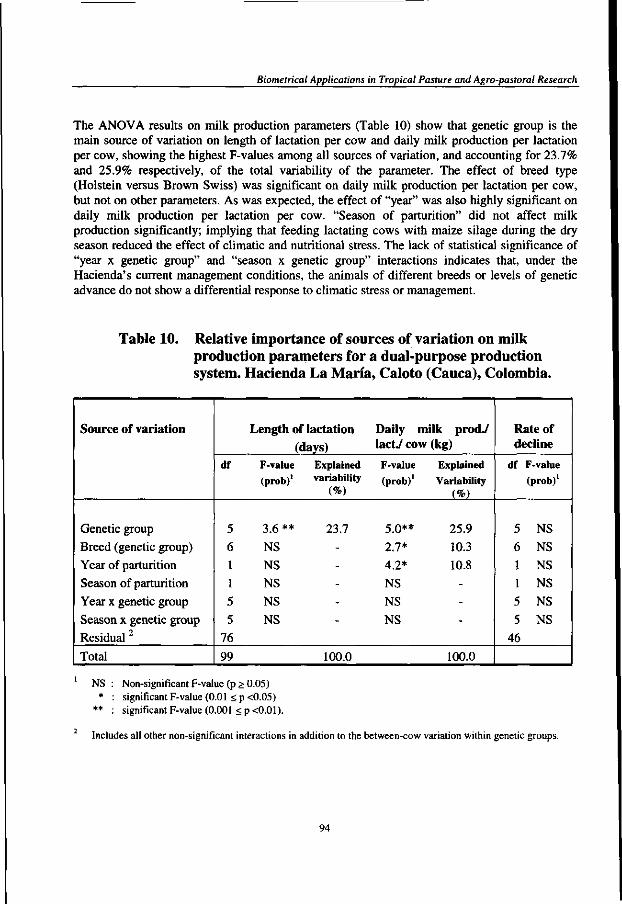
Biometrical Applications in Tropical Pasture and Agro-pastoral Research
The ANOVA results on milk production parameters (Table 10) show that genetic group is the main source of variation on length of lactation per cow and daily milk production per lactation per cow, showing the highest F-values among all sources of variation, and accounting for 23.7% and 25.9% respectively, of the total variability of the parameter. The effect of breed type (Holstein versus Brown Swiss) was significant on daily milk production per lactation per cow, but not on other parameters. As was expected, the effect of "year" was also highly significant on daily milk production per lactation per cow. "Season of parturition" did not affect milk production significantly; implying that feeding lactating cows with maize silage during the dry season reduced the effect of climatic and nutritional stress. The lack of statistical significance of "year x genetic group" and "season x genetic group" interactions indicates that, under the Hacienda's current management conditions, the animals of different breeds or levels of genetic advance do not show a differential response to climatic stress or management.
Table 10. Relative importance of sources of variation on milk production parameters for a dual-purpose production system. Hacienda La Maria, Caloto (Cauca), Colombia.
Source of variation
Genetic group Breed (genetic group) Year of parturition Season of parturition Year x genetic group Season x genetic group Residual 2
Total
df
5 6 1 1 5 5
76
99
Length of lactation (days)
F-value Explained (prob)1 variability
(%)
3.6** 23.7 NS NS NS NS NS
100.0
Daily milk prod./ lacty cow (kg)
F-value
(prob)
5.0** 2.7* 4.2* NS NS NS
Explained
Variability (%)
25.9 10.3 10.8
---
100.0
Rate of decline
df F-value
(prob)1
5 NS 6 NS 1 NS 1 NS 5 NS 5 NS
46
NS : Non-significant F-value (p > 0.05) * : significant F-value (0.01 < p <0.05)
** : significant F-value (0.001 <p<0.01).
Includes all other non-significant interactions in addition to the between-cow variation within genetic groups.
94
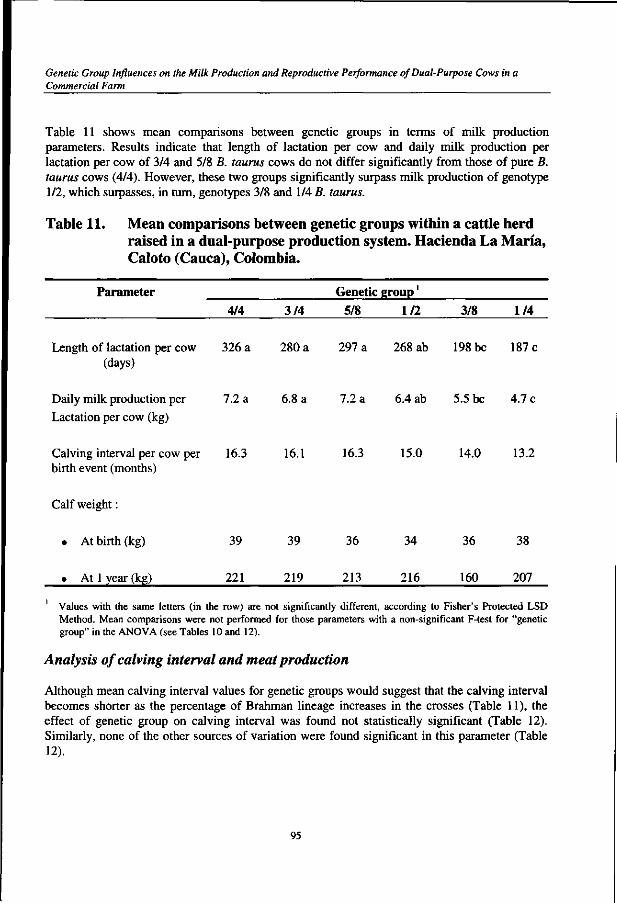
Genetic Group Influences on the Milk Production and Reproductive Performance of Dual-Purpose Cows in a Commercial Farm
Table 11 shows mean comparisons between genetic groups in terms of milk production parameters. Results indicate that length of lactation per cow and daily milk production per lactation per cow of 3/4 and 5/8 B. taurus cows do not differ significantly from those of pure B. taurus cows (4/4). However, these two groups significantly surpass milk production of genotype 1/2, which surpasses, in turn, genotypes 3/8 and 1/4 B. taurus.
Table 11. Mean comparisons between genetic groups within a cattle herd raised in a dual-purpose production system. Hacienda La Maria, Caloto (Cauca), Colombia.
Parameter 4/4 3/4
Genetic group'
5/8 1/2 3/8 1/4
Length of lactation per cow 326 a 280 a 297 a 268 ab 198 be 187 c (days)
Daily milk production per 7.2 a Lactation per cow (kg)
6.8 a 7.2 a 6.4 ab 5.5 be 4.7 c
Calving interval per cow per 16.3 birth event (months)
16.1 16.3 15.0 14.0 13.2
Calf weight:
At birth (kg) 39 39 36 34 36 38
At 1 year (kg) 221 219 213 216 160 207
Values with the same letters (in the row) are not significantly different, according to Fisher's Protected LSD Method. Mean comparisons were not performed for those parameters with a non-significant F-test for "genetic group" in the ANOVA (see Tables 10 and 12).
Analysis of calving interval and meat production
Although mean calving interval values for genetic groups would suggest that the calving interval becomes shorter as the percentage of Brahman lineage increases in the crosses (Table 11), the effect of genetic group on calving interval was found not statistically significant (Table 12). Similarly, none of the other sources of variation were found significant in this parameter (Table 12).
95
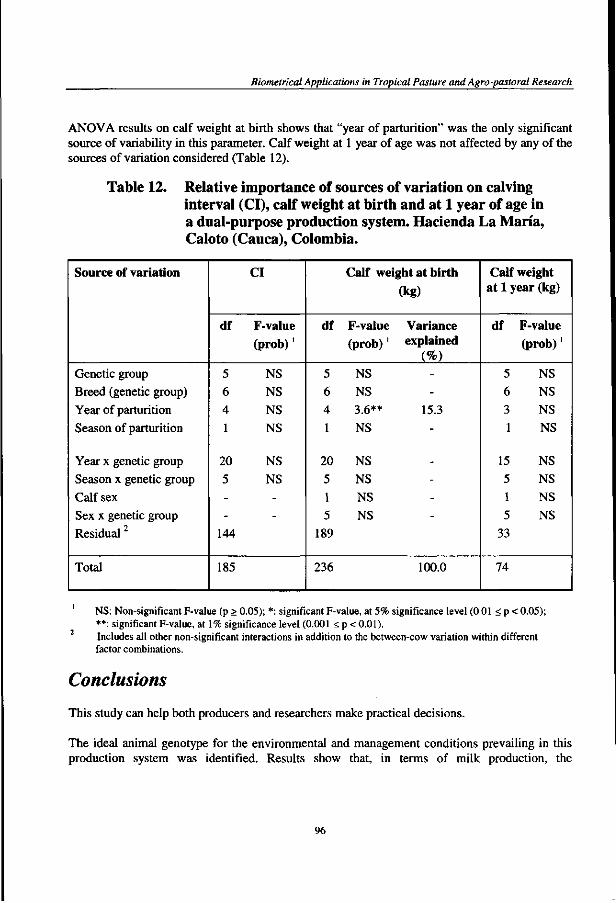
Biometrical Applications in Tropical Pasture and Agro-pastoral Research
ANOVA results on calf weight at birth shows that "year of parturition" was the only significant source of variability in this parameter. Calf weight at 1 year of age was not affected by any of the sources of variation considered (Table 12).
Table 12. Relative importance of sources of variation on calving interval (CI), calf weight at birth and at 1 year of age in a dual-purpose production system. Hacienda La Maria, Caloto (Cauca), Colombia.
Source of variation
Genetic group Breed (genetic group) Year of parturition Season of parturition
Year x genetic group Season x genetic group Calf sex Sex x genetic group Residual2
Total
df
5 6 4 1
20 5 --
144
CI
F-value (prob)'
NS NS NS NS
NS NS --
185
df
5 6 4 1
20 5 1 5
189
236
Calf weight at birth
F-value (prob)'
NS NS 3.6** NS
NS NS NS NS
(kg)
Variance explained
(%) -
-15.3
-
-
---
100.0
Calf weight at 1 year (kg)
df F-value (prob)'
5 NS 6 NS 3 NS 1 NS
15 NS 5 NS 1 NS 5 NS
33
74
NS: Non-significant F-value (p > 0.05); *: significant F-value, at 5% significance level (0.01 < p < 0.05); **: significant F-value, at 1% significance level (0.001 < p < 0.01). Includes all other non-significant interactions in addition to the between-cow variation within different factor combinations.
Conclusions
This study can help both producers and researchers make practical decisions.
The ideal animal genotype for the environmental and management conditions prevailing in this production system was identified. Results show that, in terms of milk production, the
96
Genetic Group Influences on the Milk Production and Reproductive Performance of Dual-Purpose Cows in a Commercial Farm
performance of genetic groups 3/4 and 5/8 B. taurus was statistically similar to that of group 4/4 (pure B. taurus), and significantly surpassed that of genetic groups 1/2, 3/8, and 1/4. In terms of reproductive performance and calf weight, animal genotypes did not differ statistically from each other. Therefore, cows belonging to genetic groups 3/4 or 5/8 B. taurus are shown to be the ideal animal genotype for this type of dual-purpose production system.
The variance-heterogeneity test between genetic groups for animal production parameters did not show (contrary to what data suggest) that the variance among individuals of the same genetic group increased as the percentage of European lineage in the cow decreased. This result has important methodological implications for on-farm research planning, particularly when selecting the number of experimental cows from different genetic groups. Results from this study indicate that an equal number of cows per genetic group can be used, independently of genetic group.
The sources of variation that significantly affected animal production parameters, in order of relative importance, were: (1) "genetic group", accounting for 23.7% and 25.9% respectively, of the total variability in length of lactation per cow and daily milk production per lactation per cow; (2) "year of parturition", accounting for 10.8% of the total variability in daily milk production per lactation per cow, and for 15.3% of the total variability in calf weight at birth; and (3) "breed type", accounting for 10.3% of the total variability in daily milk production per lactation per cow.
This study clearly illustrates the importance, for on-farm research and for farm-management decisions, of recording complete data for each animal, production indices for the herd, and records of animal health, animal management and of supplements provided at the farm level.
The type of records collected by this commercial farm has allowed the identification of the most productive animal genotype for the specific environment and farm management represented by this farm, i.e., well-managed low-input technology farms (both in pasture quality as in animal genetics) located on relatively poor acid soils, under a bimodal annual precipitation, in the semi-evergreen seasonal forest ecosystem of the Latin-American tropics.
Additionally, this study has allowed the identification of sources of variation that affect milk production and reproductive performance of dual-purpose cows in this environment and farm management.
The information produced by the present study is expected to serve researchers in the planning of on-farm experiments, and producers for their decision-making.
References
Lascano, C. E. and Holmann, F. (eds.), 1997. Conceptos y Metodologfas de Investigation en Fincas con Sistemas de Production Animal de Doble Proposito. CIAT-TROPILECHE. Book series ISBN 958-9439-93-4, 285 pp.
97
Biometrical Applications in Tropical Pasture and Agro-pastoral Research
Madelena, F. E.; Martinez, M. L. and Freitas, A. F., 1979. Lactation curves of Holstein-Friesian and Holstein-Friesian x Gyr cows. Animal Prod 29: 101-107.
Sere, C. and Vaccaro, L., 1984. Milk production from dual-purpose systems in tropical Latin America. In: Proceedings of the International Conference on Milk Production in Developing Countries. Edinburgh University, Edinburgh, Scotland.
Snedecor, G. W. and Cochran, W. G., 1989. Statistical Methods, Eighth Edition. 252 and 253. Iowa State University Press. ISBN 0-8138-1561-6. Ames, Iowa, U.S.A.
Vaccaro, L., 1984. El comportamiento de la raza Holstein-Friesan comparada con la Pardo Suizo en cruzamientos con razas nativas en el tropico: Una revision de literatura. Production Animal Tropical, vol 9(2): 93-101.
Vaccaro, L., 1986. Mediciones de la respuesta animal en ensayos de pastoreo: vacas lecheras y de doble proposito. In: Lascano, C. E. and Pizarro, E. A. (eds.), 1986. Evaluation de pasturas con anima-les. Alternativas Metodologicas. 127-142. CIAT. Book series ISBN 84-8280-154-6, 292 pp.
98
Sources of Variation in Milk Production and Composition of Dual-Purpose Cows under Sequential Grazing
Chapter 7
Sources of Variation in Milk Production and Composition of Dual-Purpose Cows
under Sequential Grazing1
C. E. Lascano2, M. C. Amezquita3, P. Avila4 and G. Ramirez4
Introduction
Dual-purpose cattle account for 78% of the meat and 41% of the milk produced in tropical Latin America. In this production system, the largest source of animal nutrition comes from native or introduced grass pastures, which often present limited quantities and quality of feed, especially during the dry season. As a result, milk production (2 to 4 litres/cow per day) and reproductive efficiency (50%-60%) of the herds are low.
Research conducted in tropical America has led to the development of forage grasses and legumes with the potential to increase animal production in grazing systems (Toledo, 1985). Ample documentation indicates that legumes selected for acid soils and associated with grasses help increase milk production by 20% to 30% (Lascano and Avila, 1991). However, the adoption of legumes by farmers in tropical America has been limited.
One way of encouraging farmers to adopt legumes is to demonstrate the advantages of these forages in on-farm trials. Additionally, on-farm experimentation provides a better generalisation to the region of interest than research results obtained at the Experiment Station. This type of evaluation, however, presents methodological challenges, such as limited control over experimental factors, the complex process of obtaining animal response variables, and logistic and operational difficulties.
Adapted from the article published in Spanish in: Lascano, C. E. and Holmann, F. (eds.), 1997. Conceptos y Metodologi'as de Investigation en Fincas con Sistemas de Production Animal de Doble Proposito. 3-14. CIAT-TROPILECHE. Book series ISBN 958-9439-93-4, 285 pp. Leader and Research Assistants, Tropical Forages Project, Centro International de Agriculture Tropical (CIAT). Cali, Colombia. Head, Biometry Unit, Centro International de Agricultura Tropical (CIAT). Cali, Colombia.
99
Biometrical Applications in Tropical Pasture and Agro-pastoral Research
Two types of trial used to test new pastures on farms with dual-purpose cattle are: (1) evaluations of different pastures on different farms, for example, a new pasture is evaluated on farm A, and a traditional pasture on farm B; and (2) evaluations of different pastures in a given order (sequential grazing) on the same farm, using change-over designs, for example, cows rotating from the traditional pasture to the new pasture. In the first type of trial, comparisons between the different pastures may be confounded with the effect of the farm, i.e. of other factors such as soil, climate, cattle breed, and management. Such confounding is avoided when pastures are evaluated in sequence on the same farm. The second type of pasture evaluation has certain advantages, for example, (1) compatibility with dairy cow management, as is the case of rotation through paddocks on the same farm; (2) flexibility in managing grazing of the pastures being evaluated (variable days of occupation and rest according to pasture species or paddock size); and (3) receipt of a quick response in milk production to attributes of the evaluated pastures (quantity and quality of forage on offer). The disadvantages of this second type of trial include: (1) a de-phasing period for animal response measurements, especially milk production; (2) cows require an adjustment period to the evaluated pastures; (3) information on the effect of pastures on reproductive parameters is difficult to obtain; and (4) changes in climate and consequently feed quality may be confounded.
With respect to the above, sequential grazing trials, using change-over designs, may be an option for evaluating new pastures on farms with dual-purpose cattle.
Data on milk production and composition from cows under sequential grazing in different pastures, evaluated under Multiple (3x3) Latin Square Change-Over designs, were analysed to make recommendations on the use of this methodology. This article presents the results of these analyses, highlighting the correlation between several animal response variables. It also identifies sources of variation in milk production and some milk constituents and analyses the effect of the rotation sequence and adjustment period (days) on milk production from different pastures.
Information Source used in the Analysis
In recent years, CIAT's Tropical Forages Project has evaluated milk production potential in both, selected pure grass pastures and grass/legume mixtures. Grazing trials have been conducted under controlled conditions at CIAT's Quilichao experiment station, always applying a Multiple (3x3) Latin Square Change-Over design, using two breeds of cows as "groups": Holstein x Zebu cows and Holstein-type cows (Lascano and Avila, 1991). Characteristics and use of this type of experimental design are discussed by Amezquita (1993).
The data corresponding to daily milk production, milk composition (fat % and urea N) and blood urea N of 15 experiments conducted over a 4-year period (1992-1995) were used for the analysis. The performance of three grass pastures and seven grass/legume pastures was assessed over time. Seven of the 15 trials were conducted during the dry season (water balance < 50 mm. during the 42-day experimental period) and 8 during the wet season (water balance > 50 mm. during the 42-day experimental period).
100
Sources of Variation in Milk Production and Composition of Dual-Purpose Cows under Sequential Grazing
Each of the 15 experiments followed a Multiple (3x3) Latin Square Change-Over Design, with 2 groups of cows (Holstein-type and Holstein x Zebu crosses) in two independent (3x3) Latin Squares. In each Latin Square experiment, 3 different pastures were evaluated using 3 cows grazing the pastures in sequence, during 3 experimental periods of 14 days each (7 days adjustment and 7 days measurement). Cows were hand-milked every day in the morning and afternoon during the experimental periods, including the adjustment and measurement phases.
Therefore, for daily milk production (morning or afternoon production), the number of observations (or data values) per pasture/breed/experiment was 42 (14 days x 3 periods); the number of observations per breed/experiment was 126 (42 observations/pasture x 3 pastures); the number of observations per experiment was 252 (126 observations/breed x 2 breeds) and the total number of observations over the 15 experiments was 3780 (252 observations/experiment x 15 experiments).
For milk composition (in morning or afternoon production), the number of available observations was smaller. Fat % was measured only once per period (on day 7), with a total of 270 observations over the 15 experiments (3 observations/pasture x 3 pastures x 2 breeds x 15 experiments). Milk urea N was measured 3 times per period (on days 1, 4 and 7) and blood urea N was measured 2 times per period (on days 1 and 7), with a total of 810 and 540 observations respectively, over the 15 experiments.
Calves of crossbred cows received residual milk after every milking, regardless of their mothers' age. Once milked, the cows were left to graze and calves were placed in small, legume-based paddocks.
We used a commercial urea kit ("Ames") to analyse milk urea nitrogen (MUN) in the serum of milk samples taken in the morning and afternoon of days 1, 4, and 7 of grazing, in the measurement phase. Fat content was determined in milk samples taken only in the morning and afternoon of the last day of grazing (day 7) in the measurement phase. Blood samples were also taken in the morning and afternoon of days 1 and 7 of the measurement phase to determine urea N (BUN) in the serum.
Sources of Variation considered
The database used in the analysis was structured to separate the following sources of variation in milk production and composition: (1) presence of legumes (Centrosema acutifolium and Stylosanthes guianensis) in the pasture; (2) breed of cows (crossbred and Holstein); (3) lactation stage (first third of lactation vs. second and third); (4) seasonal period in terms of minimum (water balance < 50 mm. during the 42-day experimental period) or maximum (water balance > 50 mm. during the 42-day experimental period) precipitation; and (5) days of grazing during the measurement phase (days 1 to 7). N-fertiliser application to the grass (presence or absence) was considered an additional source of variation on milk urea N.
101
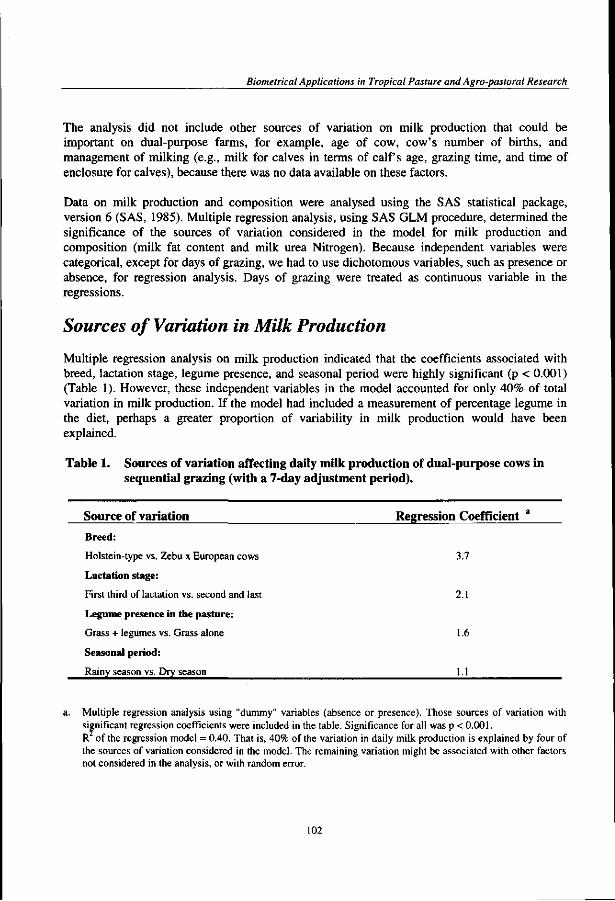
Biometrical Applications in Tropical Pasture and Agro-pastoral Research
The analysis did not include other sources of variation on milk production that could be important on dual-purpose farms, for example, age of cow, cow's number of births, and management of milking (e.g., milk for calves in terms of calf s age, grazing time, and time of enclosure for calves), because there was no data available on these factors.
Data on milk production and composition were analysed using the SAS statistical package, version 6 (SAS, 1985). Multiple regression analysis, using SAS GLM procedure, determined the significance of the sources of variation considered in the model for milk production and composition (milk fat content and milk urea Nitrogen). Because independent variables were categorical, except for days of grazing, we had to use dichotomous variables, such as presence or absence, for regression analysis. Days of grazing were treated as continuous variable in the regressions.
Sources of Variation in Milk Production
Multiple regression analysis on milk production indicated that the coefficients associated with breed, lactation stage, legume presence, and seasonal period were highly significant (p < 0.001) (Table 1). However, these independent variables in the model accounted for only 40% of total variation in milk production. If the model had included a measurement of percentage legume in the diet, perhaps a greater proportion of variability in milk production would have been explained.
Table 1. Sources of variation affecting daily milk production of dual-purpose cows in sequential grazing (with a 7-day adjustment period).
Source of variation Regression Coefficient a
Breed:
Holstein-type vs. Zebu x European cows 3.7
Lactation stage:
First third of lactation vs. second and last 2.1
Legume presence in the pasture:
Grass + legumes vs. Grass alone 1.6
Seasonal period:
Rainy season vs. Dry season \A
Multiple regression analysis using "dummy" variables (absence or presence). Those sources of variation with significant regression coefficients were included in the table. Significance for all was p < 0.001. R of the regression model = 0.40. That is, 40% of the variation in daily milk production is explained by four of the sources of variation considered in the model. The remaining variation might be associated with other factors not considered in the analysis, or with random error.
102
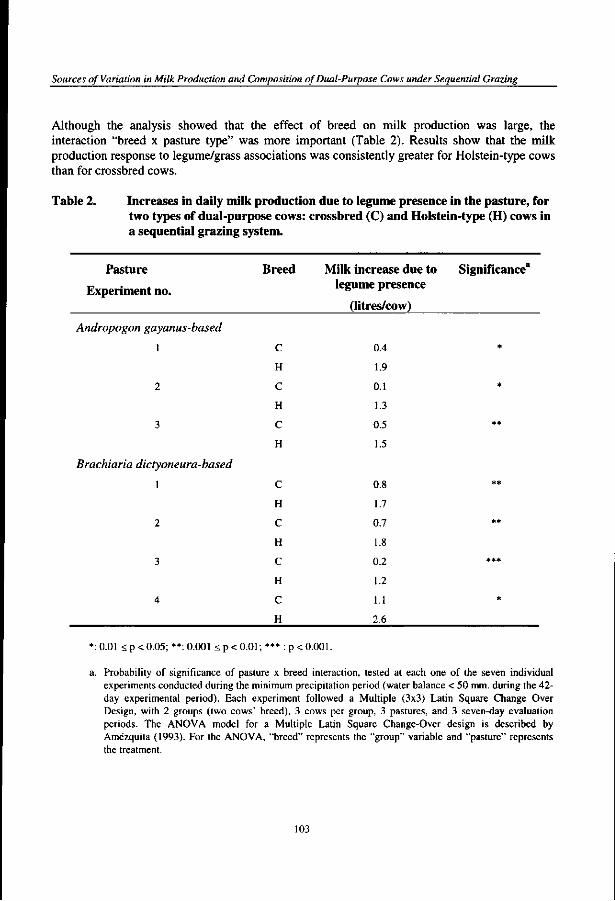
Sources of Variation in Milk Production and Composition of Dual-Purpose Cows under Sequential Grazing
Although the analysis showed that the effect of breed on milk production was large, the interaction "breed x pasture type" was more important (Table 2). Results show that the milk production response to legume/grass associations was consistently greater for Holstein-type cows than for crossbred cows.
Table 2. Increases in daily milk production due to legume presence in the pasture, for two types of dual-purpose cows: crossbred (C) and Holstein-type (H) cows in a sequential grazing system.
Pasture
Experiment no.
Andropogon gayanus
1
2
3
-based
Brachiaria dictyoneura-based
1
2
3
4
Breed
c H
C
H
C
H
C
H
C
H
C
H
C
H
Milk increase due to legume presence
(litres/cow)
0.4
1.9
0.1
1.3
0.5
1.5
0.8
1.7
0.7
1.8
0.2
1.2
1.1
2.6
Significance3
*
*
**
**
**
***
*
*:0.01 < p < 0.05;**: 0.001 < p< 0.01; ***: p < 0.001.
a. Probability of significance of pasture x breed interaction, tested at each one of the seven individual experiments conducted during the minimum precipitation period (water balance < 50 mm. during the 42-day experimental period). Each experiment followed a Multiple (3x3) Latin Square Change Over Design, with 2 groups (two cows' breed), 3 cows per group, 3 pastures, and 3 seven-day evaluation periods. The ANOVA model for a Multiple Latin Square Change-Over design is described by Amezquita (1993). For the ANOVA, "breed" represents the "group" variable and "pasture" represents the treatment.
103

Biometrical Applications in Tropical Pasture and Agro-pastoral Research
The above results suggest that the effect of legume-based pastures on milk production can be better interpreted if the effects of the cows' breed (which affects milk production potential) and cows' physiological condition {i.e., their lactation stage during both dry and rainy seasons) were considered as sources of variation in the experimental design.
Frequency of Milk Measurements
The frequency with which milk is measured in on-farm evaluations of new pastures is important in that it determines the efficient use of human and financial resources, which are usually limited.
Morning and afternoon measurements
The analysis showed a high correlation (r = 0.86, p < 0.0001) between milk measured in the morning and that measured in the afternoon. The latter, however, was approximately, half of the former, according to the linear regression equation that adjusted the data corresponding to the milk produced in the afternoon (Y) with that produced in the morning (X).
Y =-0.03 + 0.46X, R2 = 0.74, (p < 0.0001)
Although few dual-purpose farms practice double milking, the researcher working on this type of farm should estimate the effect of pastures on milk production from morning measurements only, thereby saving time and labour, important considerations when working on farms.
Measurements in terms of days of grazing
The cows in the sequential grazing trials used for this analysis remained 14 days in each test pasture; milk production was measured on the last 7 days (measurement phase).
The multiple regression analysis on milk production indicated that the overall effect of "days of grazing" was not significant (Table 1). However, when performing independent regressions on daily milk production vs. days of grazing by breed and pasture type, it was found that the effect of days of grazing was significant depending on breed and presence of legume in the pasture, as illustrated in Table 3.
Table 3 shows the daily milk production means (litres/cow) per day of grazing (day 1 to 7) and the linear regression parameters (intercept and slope) of mean daily milk production vs. day of grazing in crossbred cows and Holstein-type cows grazing grass-alone or grass-legume pastures. Data show that mean daily milk production of Holstein-type cows is higher than that of crossbred cows, independent of pasture type. However, the rate of decrease in daily milk production through the 7-day period (estimated by the regression slope) is more affected by pasture type than by cattle breed. Daily milk yield for both, Holstein-type and crossbred cows grazing grass/legume pastures, remained stable across days of grazing (indicated by a slope of -0.049 for Holstein-type cows and of -0.042 for crossbred cows, non-significantly different from zero in both cases).
104
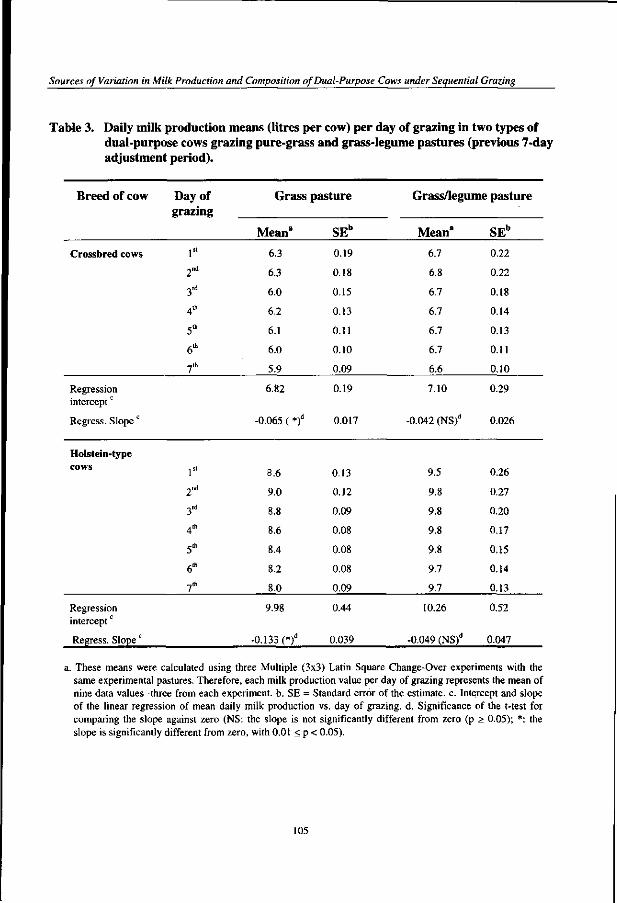
Sources of Variation in Milk Production and Composition of Dual-Purpose Cows under Sequential Grazing
Table 3. Daily milk production means (litres per cow) per day of grazing in two types of dual-purpose cows grazing pure-grass and grass-legume pastures (previous 7-day adjustment period).
Breed of cow
Crossbred cows
Regression interceptc
Regress. Slope c
Holstein-type cows
Regression interceptc
Regress. Slope c
Day of grazing
1st
^nd
3rd
4th
5*
6*
7th
1st
2nd
-,rd
4th
5*
e* 7th
Grass pasture
Mean3
6.3
6.3
6.0
6.2
6.1
6.0
5.9
6.82
-0.065 ( *)d
8.6
9.0
8.8
8.6
8.4
8.2
8.0
9.98
-0.133 (*)d
SEb
0.19
0.18
0.15
0.13
0.11
0.10
0.09
0.19
0.017
0.13
0.12
0.09
0.08
0.08
0.08
0.09
0.44
0.039
Grass/legum
Mean3
6.7
6.8
6.7
6.7
6.7
6.7
6.6
7.10
-0.042 (NS)d
9.5
9.8
9.8
9.8
9.8
9.7
9.7
10.26
-0.049 (NS)d
e pasture
SEb
0.22
0.22
0.18
0.14
0.13
0.11
0.10
0.29
0.026
0.26
0.27
0.20
0.17
0.15
0.14
0.13
0.52
0.047
a. These means were calculated using three Multiple (3x3) Latin Square Change-Over experiments with the same experimental pastures. Therefore, each milk production value per day of grazing represents the mean of nine data values -three from each experiment, b. SE = Standard error of the estimate, c. Intercept and slope of the linear regression of mean daily milk production vs. day of grazing, d. Significance of the t-test for comparing the slope against zero (NS: the slope is not significantly different from zero (p > 0.05); *: the slope is significantly different from zero, with 0.01 < p < 0.05).
105

Biometrical Applications in Tropical Pasture and Agro-pastoral Research
However, when grazing grass-alone pastures, daily milk yield for both breeds decreased significantly with days of grazing (with a slope of -0.133 for Holstein-type cows and of -0.065 for Crossbred cows, both statistically lower than zero). The stable production per cow observed when grazing a grass-legume association supports the benefit of grass-legume pastures for the producer.
These results have methodological implications for on-farm research. They suggest that the frequency of measuring milk production in sequential grazing systems on the farm could be conditioned by pasture type and cattle breed. Milk should be measured more frequently on those farms grazing grass-alone pastures or pastures with limited forage quantity and quality, especially when carrying a high proportion of Holstein-type cows. This, as milk production potential of Holstein-type cows responds strongly to changes in pasture condition. Measurements could be made, for example, at the beginning, middle, and end of grazing, after the adjustment phase. On the other hand, for farms grazing grass-legume pastures (or pastures with high forage quality and quantity), milk production can be measured less frequently, for example at the beginning and end of grazing, after the adjustment phase.
Sources of Variation in Milk Fat Content
Multiple regression analysis on milk fat content measured on the last day of grazing, showed that milk fat % was not affected by legume presence in the pasture or by seasonal period. Only those regression coefficients associated with lactation stage and breed were statistically significant (0.01 < p < 0.05). As expected, milk fat % was lower (0.01 < p < 0.05) in cows in the first third of lactation (3.6%) than in cows in the second and last stages (4.1%), and fat % in the milk of Holstein-type cows (3.8%) was lower (0.01 < p < 0.05) that in crossbred cows (4.0%).
The multiple regression model (not presented in a table) explained only 20% of the total variation in milk fat content (R = 0.20) suggesting that other factors not considered in the analysis are contributing to its variation. These results question the effectiveness of measuring milk fat content of dual-purpose cows in on-farm pasture evaluation trials. This decision would be based largely on the facility to analyse milk fat content and the costs involved.
Sources of Variation in Milk Urea Nitrogen (MUN)
Several researchers have proposed that blood (BUN) or milk urea nitrogen (MUN) could be a good nutritional indicator (Oltner and Wiktorsson, 1983). Specifically, experimental results have shown that BUN or MUN levels reflect the balance of degradable protein and fermentable energy in the rumen (Broderick, 1995). In a commercial farm in Florida, U.S.A., Hammond et al. (1993) demonstrated the usefulness of BUN as a guide for giving protein supplements to beef cows.
We therefore measured MUN and BUN in cows grazing the different experimental tropical pastures. An initial data analysis showed a high correlation (r = 0.98, 0.001 < p < 0.01) between
106
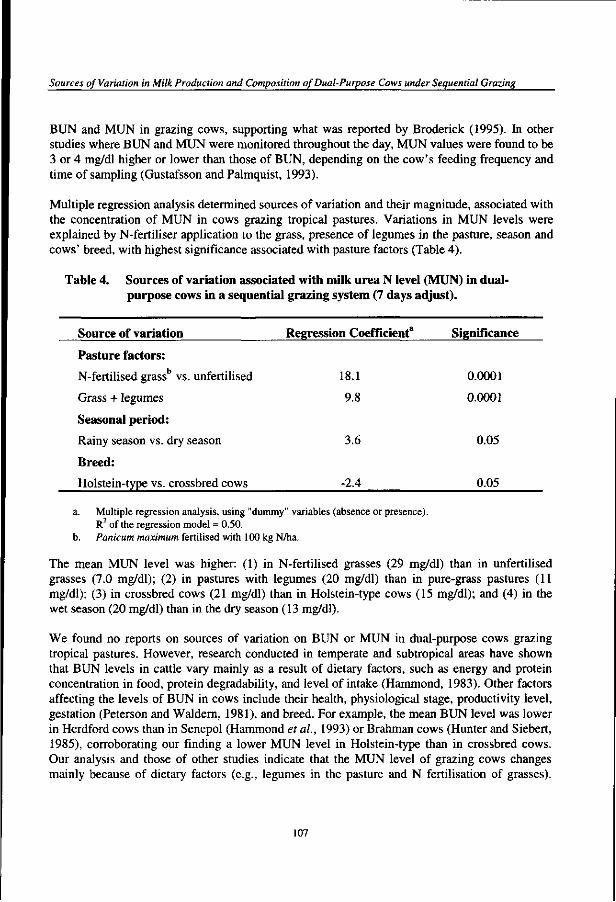
Sources of Variation in Milk Production and Composition of Dual-Purpose Cows under Sequential Grazing
BUN and MUN in grazing cows, supporting what was reported by Broderick (1995). In other studies where BUN and MUN were monitored throughout the day, MUN values were found to be 3 or 4 mg/dl higher or lower than those of BUN, depending on the cow's feeding frequency and time of sampling (Gustafsson and Palmquist, 1993).
Multiple regression analysis determined sources of variation and their magnitude, associated with the concentration of MUN in cows grazing tropical pastures. Variations in MUN levels were explained by N-fertiliser application to the grass, presence of legumes in the pasture, season and cows' breed, with highest significance associated with pasture factors (Table 4).
Table 4. Sources of variation associated with milk urea N level (MUN) in dual-purpose cows in a sequential grazing system (7 days adjust).
Source of variation Regression Coefficient" Significance
Pasture factors:
N-fertilised grassb vs. unfertilised 18.1 0.0001
Grass + legumes 9.8 0.0001
Seasonal period:
Rainy season vs. dry season 3.6 0.05
Breed:
Holstein-type vs. crossbred cows -2.4 0.05
a. Multiple regression analysis, using "dummy" variables (absence or presence). R of the regression model = 0.50.
b. Panicum maximum fertilised with 100 kg N/ha.
The mean MUN level was higher: (1) in N-fertilised grasses (29 mg/dl) than in unfertilised grasses (7.0 mg/dl); (2) in pastures with legumes (20 mg/dl) than in pure-grass pastures (11 mg/dl); (3) in crossbred cows (21 mg/dl) than in Holstein-type cows (15 mg/dl); and (4) in the wet season (20 mg/dl) than in the dry season (13 mg/dl).
We found no reports on sources of variation on BUN or MUN in dual-purpose cows grazing tropical pastures. However, research conducted in temperate and subtropical areas have shown that BUN levels in cattle vary mainly as a result of dietary factors, such as energy and protein concentration in food, protein degradability, and level of intake (Hammond, 1983). Other factors affecting the levels of BUN in cows include their health, physiological stage, productivity level, gestation (Peterson and Waldern, 1981), and breed. For example, the mean BUN level was lower in Herdford cows than in Senepol (Hammond et ai, 1993) or Brahman cows (Hunter and Siebert, 1985), corroborating our finding a lower MUN level in Holstein-type than in crossbred cows. Our analysis and those of other studies indicate that the MUN level of grazing cows changes mainly because of dietary factors (e.g., legumes in the pasture and N fertilisation of grasses).
107
Biometrical Applications in Tropical Pasture and Agro-pastoral Research
However, to use the MUN as a guide for giving supplements to cows in dual-purpose systems or to retrospectively explain the results of feeding trials, the researcher must take into account that the MUN concentration can also vary with breed, climate, lactation stage, and gestation.
Frequency of MUN Measurements
We analysed MUN on days 1, 4, and 7 of grazing. Accordingly, we could establish the degree of association between MUN levels measured on different days. The results showed a high correlation (r = 0.88, p < 0.0001) between the MUN measured on day 7 (last day) of grazing and the MUN measured on day 1 of grazing. The correlation between the MUN levels on days 4 and 7 of grazing was even higher (r = 0.92, p < 0.0001). However, within the MUN range measured for all the trials (4-32 mg/dl), the MUN level on day 1 of grazing was, on the average, 2 mg/dl higher than that on days 4 and 7 of grazing. This suggests that, to have representative values, the MUN should be measured at the beginning (day 1 or 2) and at the end (day 6 or 7) of the measurement phase.
The MUN levels were, on average, 1 mg/dl higher in milk samples taken in the afternoon than in those taken in the morning (data not shown), suggesting that, on farms practising double milking, the MUN should be measured in milk from both morning and afternoon milking. Studies on cows receiving supplements indicate that the most representative level of MUN was obtained either at the milking before the supplements were given or 6 to 7 hours after cows were given the supplements (Gustafsson and Palmquist, 1993). These results could help determine when to measure MUN in dual-purpose farms that milk their cows only once a day and offer supplement.
Effect of Rotation Sequence and Adjustment Period on Milk Production
Our study also attempted to determine whether the rotation sequence of milking cows in the experimental pastures affected milk yields and whether an adjustment period was necessary before measurement.
Effect of rotation sequence
Table 5 shows the differences in daily milk production of Holstein-type cows in terms of pasture type in two rotation sequences: (1) rotation from a grass to grass/legume pasture, and (2) rotation from a grass/legume to a grass. For all experiments, daily milk production decreased consistently by an average of 2 litres per cow when cows were rotated from a grass/legume pasture to a pure-grass pasture. In contrast, when cows were moved from a pure grass to grass/legume pasture, daily milk production increased significantly by an average of 1.25 litres per cow in 10 of 15 experiments and decreased by an average of 0.5 litres per cow in the other five.
108
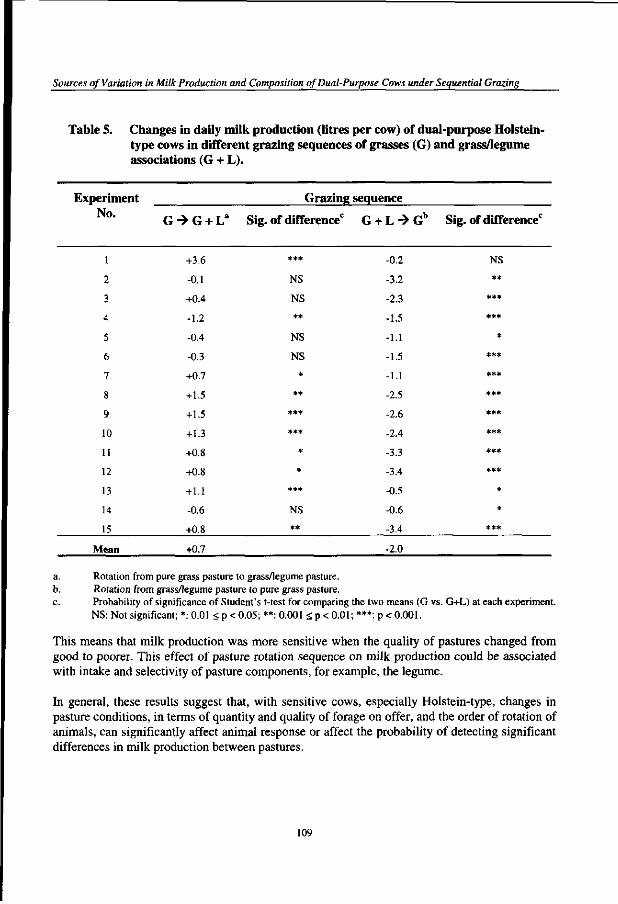
Sources of Variation in Milk Production and Composition of Dual-Purpose Cows under Sequential Grazing
Table 5. Changes in daily milk production (litres per cow) of dual-purpose Holstein-type cows in different grazing sequences of grasses (G) and grass/legume associations (G + L).
Experiment No.
l
2
3
4
5
6
7
8
9
10
11
12
13
14
15
Mean
G -> G + La
+3.6
-0.1
+0.4
-1.2
-0.4
-0.3
+0.7
+1.5
+1.5
+1.3
+0.8
+0.8
+1.1
-0.6
+0.8
+0.7
Sig.
Grazing sequence
of difference0
***
NS
NS
**
NS
NS
*
**
***
***
*
*
***
NS
**
G + L-»Gb
-0.2
-3.2
-2.3
-1.5
-1.1
-1.5
-1.1
-2.5
-2.6
-2.4
-3.3
-3.4
-0.5
-0.6
-3.4
-2.0
Sig. of difference0
NS
**
*** ***
*
*** *** *** *** *** *** *#*
*
* ***
a. Rotation from pure grass pasture to grass/legume pasture. b. Rotation from grass/legume pasture to pure grass pasture. c. Probability of significance of Student's t-test for comparing the two means (G vs. G+L) at each experiment.
NS: Not significant; *: 0.01 < p < 0.05; **: 0.001 < p < 0.01; ***: p < 0.001.
This means that milk production was more sensitive when the quality of pastures changed from good to poorer. This effect of pasture rotation sequence on milk production could be associated with intake and selectivity of pasture components, for example, the legume.
In general, these results suggest that, with sensitive cows, especially Holstein-type, changes in pasture conditions, in terms of quantity and quality of forage on offer, and the order of rotation of animals, can significantly affect animal response or affect the probability of detecting significant differences in milk production between pastures.
109
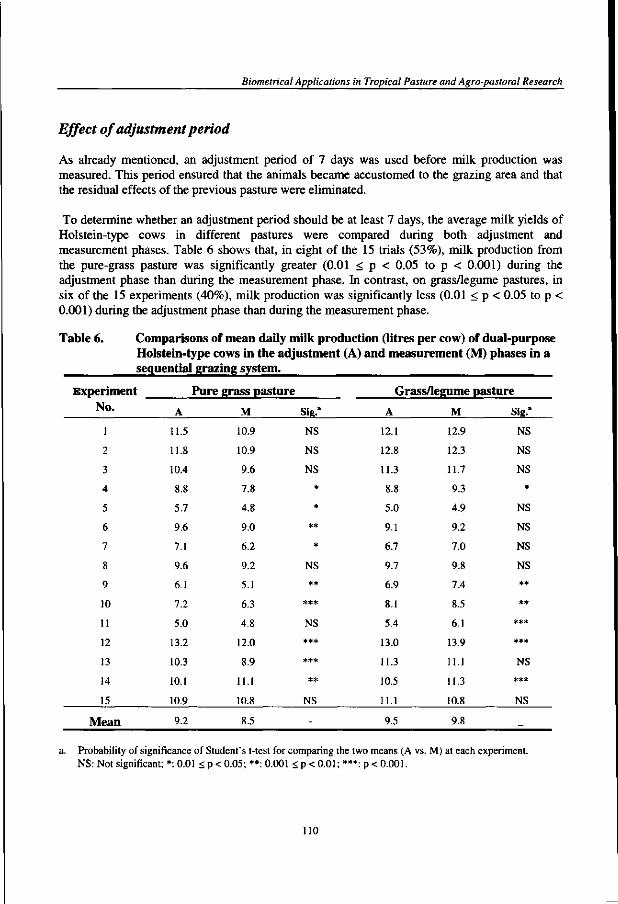
Biometrical Applications in Tropical Pasture and Agro-pastoral Research
Effect of adjustment period
As already mentioned, an adjustment period of 7 days was used before milk production was measured. This period ensured that the animals became accustomed to the grazing area and that the residual effects of the previous pasture were eliminated.
To determine whether an adjustment period should be at least 7 days, the average milk yields of Holstein-type cows in different pastures were compared during both adjustment and measurement phases. Table 6 shows that, in eight of the 15 trials (53%), milk production from the pure-grass pasture was significantly greater (0.01 < p < 0.05 to p < 0.001) during the adjustment phase than during the measurement phase. In contrast, on grass/legume pastures, in six of the 15 experiments (40%), milk production was significantly less (0.01 < p < 0.05 to p < 0.001) during the adjustment phase than during the measurement phase.
Table 6. Comparisons of mean daily milk production (litres per cow) of dual-purpose Holstein-type cows in the adjustment (A) and measurement (M) phases in a sequential grazing system.
Experiment No.
1
2
3
4
5
6
7
8
9
10
11
12
13
14
15
Mean
Pure
A
11.5
11.8
10.4
8.8
5.7
9.6
7.1
9.6
6.1
7.2
5.0
13.2
10.3
10.1
10.9
9.2
grass pasture
M
10.9
10.9
9.6
7.8
4.8
9.0
6.2
9.2
5.1
6.3
4.8
12.0
8.9
11.1
10.8
8.5
Sie."
NS
NS
NS
* *
** *
NS
** ***
NS
*** *** **
NS
-
Grass/legume pasture
A
12.1
12.8
11.3
8.8
5.0
9.1
6.7
9.7
6.9
8.1
5.4
13.0
11.3
10.5
11.1
9.5
M
12.9
12.3
11.7
9.3
4.9
9.2
7.0
9.8
7.4
8.5
6.1
13.9
11.1
11.3
10.8
9.8
Sig."
NS
NS
NS
*
NS
NS
NS
NS
** **
***
*#*
NS
***
NS
_
a. Probability of significance of Student's t-test for comparing the two means (A vs. M) at each experiment. NS: Not significant; *: 0.01 < p < 0.05; **: 0.001 < p < 0.01; ***: p < 0.001.
110
Sources of Variation in Milk Production and Composition of Dual-Purpose Cows under Sequential Grazing
These results suggest that if sequential grazing systems do not have adjustment periods of at least 7 days, milk production could be overestimated in pure-grass pastures and underestimated in the grass-legume associations, masking the true effect of legumes on milk production. For example, in our experiments, had the adjustment period not been included, the average effect of the legume on milk production would have been only 3%. With the inclusion of the adjustment period, legume/grass pastures produced, on the average, 15% more milk than did pure-grass pastures.
Methodological Recommendations
The results of the study led us to make several methodological recommendations for pasture evaluation on dual-purpose farms.
Sources of Variation. Pasture and pasture management factors, and animal effects (breed, and lactation stage of the cow during both rainy and dry seasons) should be considered when analysing and interpreting the milk production and composition records obtained from different pastures in on-farm trials.
Measuring milk production. On-farm research should evaluate the pasture traditionally used by farmers (as a control), together with the new pure-grass pastures and with grass/legume pastures. The farm area planted to the new species will largely depend on (1) available land; (2) available seed; (3) number of milking cows; (4) estimated capacity of new pastures to stock during rainy and dry seasons; and (5) grazing management practices used by fanners, including occupation versus rest periods and adjustment versus measurement areas.
Milk should be measured in the evaluated pastures after a minimum of 7 days of adjustment to the new pasture, particularly when rotating the cows from a pasture with improved forage quality attributes (the grass/legume pasture) to one with limited forage quality attributes (the grass-alone or the farmer's traditional pasture). To let cows enjoy an adjustment phase, the pasture area under evaluation should be divided into equal parts, using, if possible, electric fences to reduce costs.
The frequency of milk measurements depends on the cows' production potential on each farm and on pasture quantity and quality. For cows with intermediate or high production potential (from 5 to 10 litres), milk production should be measured at the beginning, middle, and end of grazing (after adjustment), especially in pastures with limited forage quantity and quality. In cows with low production potential (from 3 to 5 litres), milk should be measured at the beginning and end of grazing (after adjustment), regardless of pasture condition.
Measuring MUN. To strategically design supplementation and make a retrospective interpretation of milk production in different pastures, the level of milk urea nitrogen (MUN) may be measured, at least at the beginning and end of grazing, in individual samples taken at milking and before providing supplements. When analysing MUN data, the researcher should separate the effects of not only pastures and dietary supplements, but also of animal characteristics (breed, lactation stage) and climate.
i l l
Biometrical Applications in Tropical Pasture and Agro-pastoral Research
References
Amezquita, M. C , 1993. Diseno y Analisis de Ensayos para Evaluacion de Pasturas en Fincas. In: Argel, P.; Duran, C. V. and Franco, L.H., (eds.). Planeacion y Conduction de Ensayos de Evaluacion de Gramfneas y Leguminosas Forrajeras en Fincas. Documento de Trabajo No. 133. 23-37. Centre International de Agriculture Tropical (CLAT) y Red International de Evaluacion de Pasturas Tropicales (RIEPT). 340 pp.
Broderick, G. A., 1995. Use of milk urea as an indicator of nitrogen utilisation in the lactating dairy cow. Research Summaries. U.S. Dairy Forage Research Centre. Madison, Wisconsin, U.S.A.
Gustafsson, A. H.; Palmquist, D. L., 1993. Diurnal variation of rumen ammonia, serum urea and milk urea in dairy cows at high and low yields. J. Dairy Sci. 76: 475-484.
Hammond, A. C , 1983. The use of blood urea nitrogen concentration as an indicator of protein status in cattle. Bovine Pract. 18: 114.
Hammond, A. C ; Bowers, E. J.; Kunkle, W. E.; Genho, P. C ; Moore, S. A.; Crosby, C. C ; and Ramsay, R. H., 1993. Use of blood urea nitrogen concentration to determine time and level of protein supplementation in wintering cows. Profess. Anim. Sci. 10: 24-31.
Hunter, R. A.; Siebert, B. D., 1985. Utilisation of low quality roughage by Bos taurus and Bos indicus cattle. 2. The effect of rumen biodegradable nitrogen and sulphur on voluntary intake and rumen characteristics. Br. J. Nutr. 53: 649.
Lascano, C. E.; Avila, P., 1991. Potencial de production de leche en pasturas solas y asociadas con leguminosas adaptadas a suelos acidos. Pasturas Trop. 13: 2-10.
Lascano, C. E. and Holmann, F. (eds.), 1997. Conceptos y Metodologias de Investigation en Fincas con Sistemas de Production Animal de Doble Proposito. CIAT-TROPILECHE. Book series ISBN 958-9439-93-4, 285 pp.
Oltner, R.; Wiktorsson, N. 1983. Urea concentration in milk and blood as influenced by feeding varying amounts of protein and energy to dairy cows. Livestock Prod. 10: 459-467.
Peterson, R. G.; Waldern, D. E., 1981. Repeatability of serum constituents in Holstein-Friesians affected by feeding, age, lactation and pregnancy. J. Dairy Sci. 64: 822.
SAS, 1985. SAS/STATS Guide for personal computers. Version 6. SAS Institute, Inc., Cary, N.C., U.S.A.
Toledo, J. M., 1985. Pasture development for cattle production in the major ecosystems of the tropical American lowlands. In: Proceedings, XV International Grassland Congress. Kyoto, Japan. 74-78.
112
Planning and Design of Agro-pastoral Trials in the Savannas
Chapter 8
Planning and Design of Agro-pastoral Trials in the Savannas1
2
Maria Cristina Amezquita
Introduction
Benefits of agro-pastoral research in the Savannas
Pasture technology with crops (or agro-pastoral systems) for the savannas and tropical rain forests of Latin America contribute to the sustainable rural development of these regions (Goodland,1980; World Resources Institute, 1985; Toledo et a/.,1989; Zeigler and Toledo, 1993).
Research was initially carried out in Laos and southern Asia, in areas of tropical savannas in which forests had been cleared and burned (Thomas and Humphreys, 1970; Shelton and Humphreys, 1972), and, more recently, in the Brazilian Cerrados (Kluthcouski et al., 1991) and the Colombian Savannas (Vera et al., 1986; Vera et al., 1993; CIAT, 1994; CMMYT, 1994; Sanz et al., 1994a and 1994b). Results indicate that associated cropping systems, pasture-crop associations and pasture-crop rotations are viable alternatives and economically attractive solutions to the problems caused by traditional systems, that is, extensive grazing and monocropping of short-cycle crops adapted to acid soils, such as rice, maize, and soybeans.
Adapted from the article published in Spanish in: Guimaraes, E.P.; Sanz, J.I.; Rao, I.M.; Amezquita, M.C. and Amezquita, E. (eds.), 1999. Sistemas Agropastoriles en Sabanas Tropicales de America Latina. 65-77. Centro Internacional de Agricultura Tropical (CIAT) and Empresa Brasileira de Pesquisa Agropecuaria (EMBRAPA). ISBN 958-694-010-1, 313 pp. Head Biometry Unit, Centro Internacional de Agricultura Tropical (CIAT). Cali, Colombia.
113
Biometrical Applications in Tropical Pasture and Agro-pastoral Research
Constraints faced by these traditional systems include: a. The high costs of establishment and maintenance fertilisers required by improved
pastures, which result in poor pasture establishment or deficient maintenance, causing, in turn, degradation of the improved pasture, expressed in weed invasion, reduced biomass productivity and poor quality of feed (Spain and Gualdron, 1991).
b. Soil degradation through continuous mechanised cropping in these fragile ecosystems. Mechanisation causes soil compaction, erosion, loss of soil fertility and weed invasion. In addition, high levels of inputs can affect the delicate balance of the soil's physical and chemical properties and increase pest incidence (CIAT, 1994).
Agro-pastoral systems technology offers (a) the establishment of improved pastures with crops without the high capital investments required for traditional establishment; (b) the renewal of degraded pastures with crops; and (c) the reduction or reversion of soil deterioration by rotating pastures with grain legumes and cereals and by using forage legumes as green manures.
Objectives of agro-pastoral research in the Savannas
Agro-pastoral research for the Tropical American Savannas has two main objectives: (a) to identify germplasm of pasture and crop species adapted and productive under crop-pasture associations or rotations in the savannas, and (b) to identify and apply appropriate management options so that the perennial component (pasture) improves the soil over the long term and the annual components (crops) not only help ensure a fast and economically efficient establishment of the perennial species, but also a short-term economic return to the farmer, thus offering an attractive alternative for the producer (Zeigler and Toledo, 1993).
These goals are attainable because germplasm of forage grasses and legumes adapted to the savanna ecosystem became available through the International Network for Tropical Pastures Evaluation (RIEPT) since 1983 (Toledo et al., 1983; Pizarro, 1983 and 1992) and, more recently, CIAT, CIMMYT and INTSORMIL, together with Latin American National Agricultural Research Institutions developed rice, maize, and sorghum germplasm adapted to the infertile acid soils of the savannas (Sarkarung and Zeigler, 1989; CIMMYT, 1993; INTSORMIL, 1993).
Complexity
Compared with research on pastures alone, agro-pastoral research is more complex as it requires that research conducted on the agro-pastoral system be complemented and adjusted by research on individual components: the soil, one or more short-cycle crops, one or more pastures, the animal herd and the socio-economic conditions of the producer, who is the end-user of this technology. Therefore, agro-pastoral research requires an integrated multidisciplinary team of specialists in soil, crop, pasture, animal, socio-economic and quantitative sciences, such as Biometry and Informatics. Agro-pastoral research requires long-term trials, as it seeks to increase productivity of a system that includes a perennial component (the pasture) by improving the soil over the long term.
114
Planning and Design of Agro-pastoral Trials in the Savannas
Research phases and their objectives, and experiment planning and design for each phase, should be examined in order to define standards that allow the comparison and extrapolation of research results obtained by countries that are members of the Agro-pastoral Research Network for the Savanna Ecosystem of Tropical America3: Bolivia, Brazil, Colombia, Guyana and Venezuela. This chapter discusses these methodological aspects and offers practical recommendations.
Research Phases
Given its multiple-component nature (Fig. 1) agro-pastoral research is structured in phases, either consecutive or simultaneous, conducted at the experiment station or at the farm, as follows:
Phase 1: Component and discipline research, through short-term, independent, controlled experiments on experiment station (or "satellite trials").
Phase 2: Establishment of pastures with crops, on experiment station and on farms. Phase 3: Recovery of pastures with crops, on experiment station and on farms. Phase 4: Pasture-crop rotation, on experiment station and on farms. Phase 5: Validation of technology, in commercial agro-pastoral production systems, on farms.
Component research, on the crop and on the pasture independently, has as main objective, the development of promising germplasm of short-cycle crops and pastures adapted to acid soils, and the identification of appropriate material for use in one of three agro-pastoral production systems for the savannas: pasture-crop associations, pasture-crop rotations, and short-term monocropping.
The planning, design, and implementation of research on the crop component are similar to traditional research in short-cycle crop improvement, but differ in one aspect: in certain research phases, and depending on the research strategy, promising crop lines are evaluated in association with pastures. For example, the CIAT-CORPOICA upland-rice research strategy for agro-pastoral systems (CLAT 1993B-1994A) involves: (a) evaluation of potential rice progenitors in monoculture and in association with pastures; (b) evaluation and selection of promising rice lines under monocropping; (c) evaluation and selection of promising rice lines in association with pastures to select those not reducing significantly their yield in association; and (d) identification of crop management practices beneficial to both components, pasture and crop. On the other hand, CIMMYT's research strategy for developing maize varieties for acid soils (CIMMYT, 1994) conducts the entire process of material evaluation and selection under monocropping. The final product, such as maize variety Sikuani, adapted and productive in acid savanna soils, is released as a component of the agro-pastoral system (CIMMYT, 1994).
The "Agro-pastoral Research Network for the Savanna Ecosystem of Tropical America" was formed in 1995 coordinated by CIAT, combining national and international efforts and financial support from research institutions working on agro-pastoral research in Tropical Latin American savannas. Member countries include Bolivia, Brazil, Colombia, Guyana and Venezuela. Its objective is the integration of pastures and crops adapted to acid and infertile savanna soils into economically attractive and environmentally sustainable agro-pastoral production systems (Sarkarung and Zeigler, 1989; Toledo el al., 1989; Zeigler and Toledo, 1993).
115
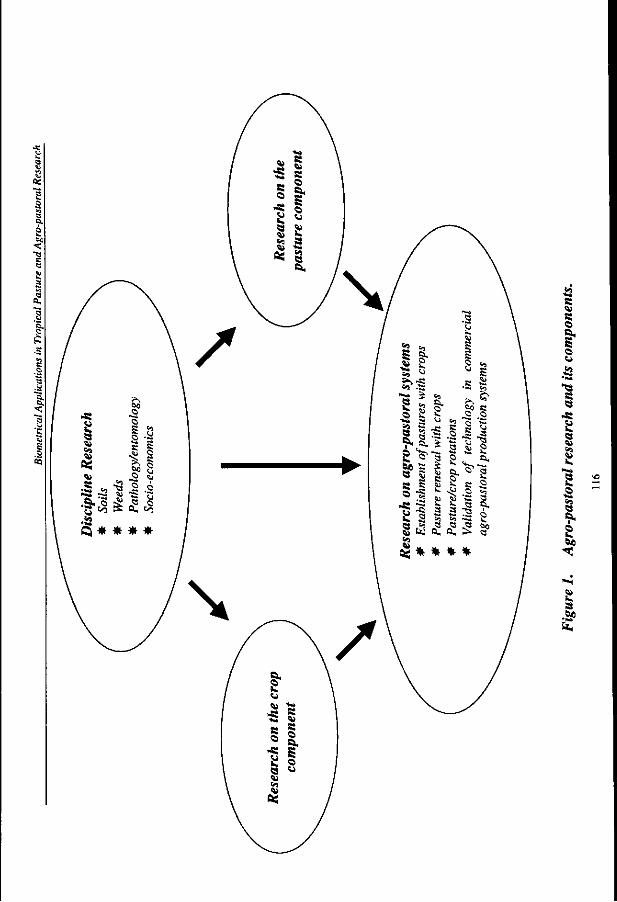
•si
II
s <5
a s
a
Si
2!
I =
2
5t>
S .60
Planning and Design of Agro-pastoral Trials in the Savannas
Under the CIAT-CORPOICA research phases (b) and (c), promising lines of upland rice for agro-pastoral systems have been identified through consecutive evaluation trials using traditional experimental designs: Preliminary Yield Trials (using a randomised complete block design (RCB) with 20-40 lines and 3-4 replicates), Advanced and Regional Trials (RCB design with 5-10 lines and 3-4 replicates), and Commercial Trials (RCB design with 1-2 lines and 2-3 replicates). These trials assess the lines performance in monoculture and in association with pastures, in plots of 25 and 36 m2 respectively, using as control varieties Oryzica Sabana 6 and Guarani Sabana 10, adapted to acid soils (CIAT, 1993B-1994A). Although this particular research strategy is based on RCB designs, the family of Incomplete Block Designs is now recommended for this type of variety trials. These experimental designs, useful in the development and evaluation of new crop lines for agro-pastoral systems, will be discussed later in this chapter, under "Experimental Design".
Research on the pasture component has as main objective the identification of forage grasses and grass-legume associations to be used as components of the different agro-pastoral systems for the savannas. The experimental methodology applied by RIEPT between 1979 and 1994 for the well-drained savanna ecosystem, involving multilocational trials types A, B, C, and D, is an excellent example of how the evaluation, selection, and characterisation of promising germplasm has been carried out (CIAT, 1979-1994; Toledo et al., 1983; Paladines and Lascano, 1983; Pizarro, 1992; Chapters 1, 3 and 4 of this dissertation). Types A and B (agronomic trials) evaluated between 20 to 40 germplasm accessions per trial, in monoculture, in small 6-m plots, using Split-Split-Plot Design. Types C and D (grazing trials) evaluated selected promising grass-legume associations using experimental periods of 1 to 3 years, in medium (1 to 10 ha) and large (20 to 300 ha) plots. Tropical forage grass and legume material adapted to the ecosystem's conditions was selected and later released for commercial use (Chapter 1, Table 5 of this dissertation).
Discipline research (on soils, pathology, entomology and weeds) deals with specific problems affecting crop and pasture in association or rotation. Soil research aims to identify fertilisation and soil management practices that guarantee the sustainability of the agro-pastoral system over the long term. Pathology, entomology and weeds research focus on the management and control of pests, diseases and weeds affecting agro-pastoral systems. Socio-economic research conducts diagnostic, pre- and post-technology adoption and impact studies.
Research on agro-pastoral systems evaluates the best crop and pasture options for pasture-crop associations and rotations resulting from component research, using the best crop and pasture management practices recommended by discipline research. Socio-economic impact can be assessed through complementary research on pre- and post-adoption of technology.
Experimental hypotheses
The main hypotheses of agro-pastoral research for Tropical American Savannas are (Sarkarung and Zeigler, 1989; Zeigler and Toledo, 1993; Sanz et al, 1994a and 1994b).
117
Biometrical Applications in Tropical Pasture and Agro-pastoral Research
Hypothesis 1: Establishment of improved pastures with crops is faster and less costly than traditional pasture establishment in monoculture.
Hypothesis 2: Crop yields are not significantly reduced when the crop is planted in association with pasture.
Hypothesis 3: When planting pastures and crops in association, the minimal fertilisation required by the crop improves soil quality in terms of fertility, structure and organic matter, which is maintained after crop harvest.
Hypothesis 4: A pasture can be renewed by planting an annual crop for harvesting. The pasture is considered renewed when its population density and carrying capacity are equivalent to those at pasture establishment.
Hypothesis 5: The establishment of improved pastures in areas of crop monoculture improves soil quality in terms of fertility, structure and organic matter, over the long term, and enables the area to be used again for crop production.
Hypothesis 6: Alternative systems to crop monoculture, such as crop rotations, pasture-crop associations or rotation, and use of forage or grain legumes as green manures, correct problems of deterioration of soil physics, weed invasion, and increased pest incidence, thus contributing to the system's sustainability.
Experimental Design
Type of Design
Discipline research on soils, pathology, entomology, physiology or weeds, conducted through short term, controlled experiments on the experiment station (or "satellite trials"), use complete, incomplete, or expanded multifactorial designs. The effect of several experimental factors and all their possible interactions need to be determined. The typical case in which expanded factorial designs are used is that of fertilisation trials, using factorial designs (N x P x K x...) + control treatments (positive or negative). When fertiliser levels are of qualitative nature (such as application, or not, of urea, or type of rock phosphate, for example) ANOVA is used to test the effect of the various factors and interactions. When fertiliser levels are of quantitative nature (such as doses of an element applied to the soil) regression analysis is used, fitting quadratic response functions to yield as affected by the different factors. However, a minimum of three levels per factor is required and only two-factor interactions can be tested using quadratic response functions. SAS procedure RSREG can be used for these purposes (SAS, 1989).
Research on the crop component involves the development, testing and selection of new crop lines adapted and productive in association with pastures under savanna conditions. In advanced evaluation stages, with a small number of lines to be tested, a RCB design is useful. However, in early evaluation stages, a RCB design may not be the most efficient design. This is due to the fact that in these early stages, the number of crop lines v to be tested is often larger than the block size k to be used in the experimental field. Further, the number of replications r is often limited to 2 to 4. Therefore, Incomplete Block Designs, with few replications (2 to 4), partially balanced in relation to the required number of replications, with blocks capable of arrangement in complete
118
Planning and Design of Agro-pastoral Trials in the Savannas
replications (i.e., resolvable) are needed. Verdooren (1998) discusses these designs.
Cochran and Cox (1957) offer a number of "Resolvable Partially-balanced Incomplete Block Designs". These include Lattices with v = k , Rectangular Lattices with v = k x (k +1) and Cubic Lattices with v = k . Arrangements with block sizes 3 < k < 13, for a number of varieties between 12 and 100, and with 2 to 4 replications are presented by Clatworthy et al. (1973). However, there are gaps for certain values of v (number of lines to be evaluated). Patterson and Williams (1976) introduced a new class of resolvable Incomplete Block Designs, the so called Alpha-Designs (a-designs) which fill many gaps in the Cochran and Cox tables for v where A; is a divisor of v. An Alpha-Design gives the same Lattice design for v = k2 if k is a prime number (like v = 9, 25, 49, etc.). It gives a less efficient design than the Lattice for v = k2 if k is not a prime number (like v = 16, 36, 64, etc.). Alpha-Designs for use in practice are given by Patterson et al. (1978) and by Rasch et al. (1996). Verdooren (1998) offers an excellent discussion of these designs. He considers that the computer package under Windows of Emlyn Williams and Mike Talbot "ALPHA+ version 2.3" (ALPHA +, 1996) generates the most efficient Alpha-Designs.
For research on agro-pastoral systems, such as pasture establishment with crops, pasture renewal with crops, and pasture-crop associations or rotation trials, conceived to evaluate the components' long-term responses, traditional designs are normally used (RCB's or Split-Plots, replicated in space). Given the long-term nature of research, special attention should be given to selection of experimental factors and their levels, selection of appropriate control treatments, identification of relevant response variables, and understanding of the variability of the experimental material. The latter will help determine the sampling methods needed to adequately characterise and evaluate the agro-pastoral production system under study.
Table 1 summarises methodological characteristics of component and discipline research (phase 1) vs. agro-pastoral systems research (phases 2 to 5).
Experimental factors and control treatments
The experimental factors selected in each phase should be relevant to the production system studied. Their levels should represent feasible management options so that crops and pastures may express differential responses. Traditional practices should always be included as control treatments.
Component and discipline research trials have as main objective the identification of best-performing material and optimal soil and crop management practices. Multiple experimental factors are evaluated (Table 1). Chapter 9 of this dissertation illustrates the analysis of a 5-factor experiment of pasture-upland rice associations, carried out to identify relevant factors and their optimal levels to be used in more advanced research phases.
Once the best-performing material and soil-crop-pasture management practices are identified in phase 1, type of agro-pastoral system is the most important experimental factor in phases 2 to 5.
119
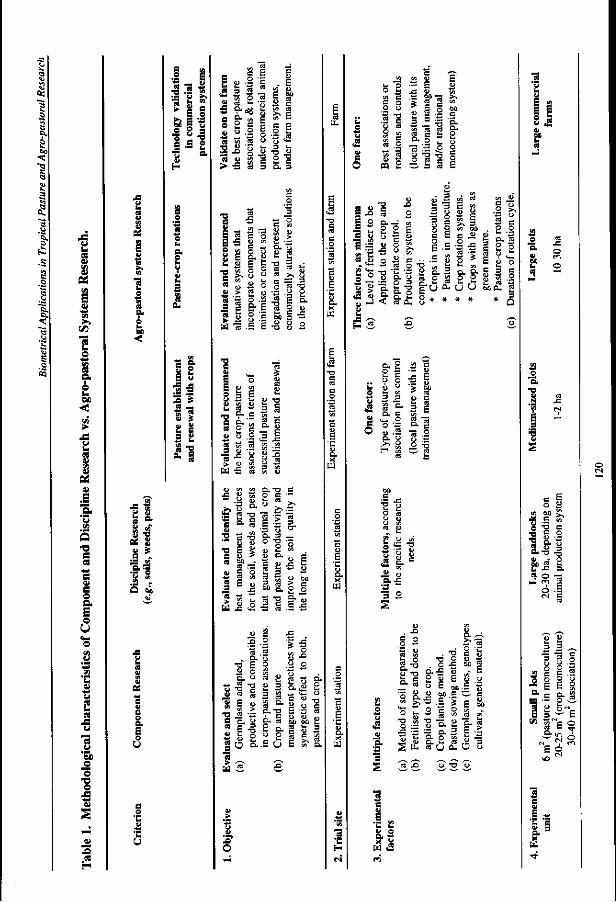
c
£
I S
<
OS
s
s ts
s <u e o a £ o U
u
2 8J
U '5b o "o e
£1
i s
S s 8 t
B- 5
to p
•S <?•$!
™ « o •a £ «>
to CO > * p
3 - ° 3 « o S > £ S3
e t c 3 0 . 3
- i2 S » o J Z
CO
£ oj
>,
c o £• £ o o
o c/3
o t o o
£ •-o. t> U CO •" h •si « > ,
* > g u -a - "3 -o
o o o
e- c BO o ^ ' c w u o
w 4) 02 V C
IS
-S "O 4» it w"
C a i
I o
y
•c
jw e -5
. o. •o E a o D. "
** JS T3 U "O c « 3 <3 - £ w « >
•JS a) 2
w 2
D.T3 ' C
s. | s • g o !
O D (D 00 60 S n h = c ¥ •£
W
U E
o
O J- j ; U
00
o t -
<u CO
'5 •a
-o c cO
D. O o V
J Z
o
_ o
c o
X J
o CO
H o V I
>-* en c
* n s * B S u S .2 v. 3 ~ =3 & «3 C3 « & IS C H O
•2"-2 - a a .S o o nil
3 u u
~ « o "O
* 13 •=
_ - S o. 3 u g . y S o g
J <
g-0 ft. 9 * *
E V)
>-» crt
C
o
a . o
U
CO
Cfl
3 &o o
•S
'1 D. O
<u 3 C CO
c .2 "cO
o <—
Urn
§ 3
>> o c o
o c .2
CO
w « -
e O
O T>
J ! u .B.-S '•5 3 2
§ 2 ' • 3 O eO «
1 g. £ « " S E U 0D
S ; E
0) 73 t -
2 =
C0 ( J OL. O
42
"a.
E7 o « — -1
a
c c o B
S TJ C | g | 0. -0 -o ^ - o M « u.
J m s
6 .5
u g 3 3 I s SI
•S g E
^ E " P P
e s

4)
« 0) G
"a.
4 4) 4)
* w" O
Q si
s o a & o U
00
• a
•c
,2 g
M _o . "5 s
5 o u a. o
Cfl
Ml «* e s> © >^
NJ «n
-_ w *£ « .
E J3
s
4*
B
0-
w £ *
• «
i e v b •e s
§ g BO . 2 .5 o ~° 5
M s 2 E S "° •« £
H E " s s >o a>
_ &
1 I 2 3 en
<U
"TO ja «
c <D E
JS V5
X) B
' t o u u
1 "
8. g. X
a-5 x
= S 5 s
o e o
••S
3 o
TO
"o
E Si
c o
.2 o a o 4>
<*-o
c
1 o
•o o o .
£ 3 IB o ft.
1-
o c
.2 'u o
a
00
1 o 1 £ 5 3 .£ to QQ «J U O . X )
JD u >» o
o <u
£S. 8 u 3 o. & o u u tu -c •w u a a i. u M S
I |i U V u O t« U
55 w O
-s
II & o ~ 60
H 5
o c o
o 15
3
a.
•o c
T3 c B0 c 'S c
'So <u
BO c
g s CO a ts
s 3
B0 !/5
c '3 B0
_ CO
y T3 C
"« o "W3
>.
"o Cfl
Cfl
a> tt 4) P. o U i
a
„ t/3
«-4—i
O V o s
s
«5
^
T3 C CO
a o Urn
u ^ 1 o a o • 9 •5 o h &,
o •o c
"fl o "cfl
>, a.
"^A ID
4>
o C-
>-» c o c3
>-• V B0
a o u y
u 3
T3 O o. CA
C u c o o. E o
a> > -c
c o
« c E l->
<D 00
0) 3
o
E
c a>
•3
8 . | WD «

Biometrical Applications in Tropical Pasture and Agro-pastoral Research
The local production system must always be included as control treatment. For example, in trials assessing the renewal of degraded pastures, the unrenewed pasture is the control. In crop rotation trials, pasture-crop rotation trials, pasture-crop association trials, or trials using forage or grain legumes as green manures to correct soil problems caused by monocropping, the monocropping should be the control. In some cases, a pasture establishment trial with crops may not include a control treatment (Sanz et al., 1994a); under these circumstances, data obtained from the establishment of the local pasture in the same type of soil, seasonal conditions and management practices, should be used as control.
Response variables
Through the different phases of an agro-pastoral research program the researcher measures the response of the soil, crop, pasture and animal under different production systems and management practices. In phase 1, component and discipline research, a large number of variables need to be measured, as an important objective of this phase is to identify those variables that best characterise performance of each component within the agro-pastoral system. In phases 2 to 5, agro-pastoral production systems research, only final production of each component and of the total system are recorded (Table 1).
In general, response variables measured in the initial phase (phase 1), include the following:
7. Soil
Physical characteristics • Texture (initial characterisation) • Aggregate stability (%) • Water conductivity (mm/day) • Apparent density (g/cm ) • Resistance to penetration (kg pressure/cm ) • Soil moisture (%): gravimetric and volumetric Chemical characteristics: N, P, K, S, Mg, Ca, pH, Al, % Al saturation Soil biology: OM (%), potential of mineralised N, earthworm population, mycorrhiza infection (CIAT, 1994).
2. Crop
Establishment • Germination rate (number and % of plants/area), at different times after sowing
2 2 1
• Leaf area (cm /plant, or m of leaf area on a given crop surface/ m of surface covered by the crop)
• Biomass of aerial parts (g/area) • Percentage of weeds / given area • Yield components at different ages of the crop Production: Yield at harvest (kg/ha)
122

Planning and Design of Agro-pastoral Trials in the Savannas
3. Pasture
Establishment Germination rate (number and % of plants/area), at different times after sowing Plant cover (%) / given area
2 2 2
Leaf area (cm /plant, or m of leaf area on a given pasture surface /m of surface covered by the pasture) Biomass of aerial parts (g/m ) Root biomass (g/m2) Botanical composition of pasture, including weeds (%)
Production Forage on offer (total kg of DM/area) Potential stocking rate (no. of animal units/ha) or grazing pressure (kg of animal livewight /kg of biomass on offer)
4. Animal production
Depending on the animal production system under evaluation (heifers, fattening steers, breeding herds, dual-purpose or dairy cows), the response variables measured are: • Stocking rate/ha or grazing pressure • Weight curves of young steers • Weight gain/animal and per ha • Reproductive indices • Milk production and quality, lactation curves. (A more detailed description of animal production variables is given in chapters 5, 6 and 7 of this dissertation).
Variability of experimental material
Appropriate sampling methods as well as number and frequency of evaluations can be determined if variability of pasture and crop, when associated, is known. On some pasture-crop associations, variability in yields of crop and pasture, when associated, is higher than that on the corresponding monoculture (Table 2). Quantifying variability of soil parameters over time is important for determining how reliable forecasts on soil improvement are.
Soil physical properties, for example, compaction, are subject to variability associated with the agro-pastoral system, soil depth and time (Sanz et al., 1994b). Pla (1983) recommends that soil physical properties be assessed at key times for the system, that is, before and after a new component is introduced and, especially, under climatic stress.
Variability in biomass production of an agro-pastoral system is mainly determined by its components' nature (monocultures, crop-pasture associations, or crop-pasture rotations), degree of compatibility between them in the system, and components' growth habit (Vera et al., 1993).
123
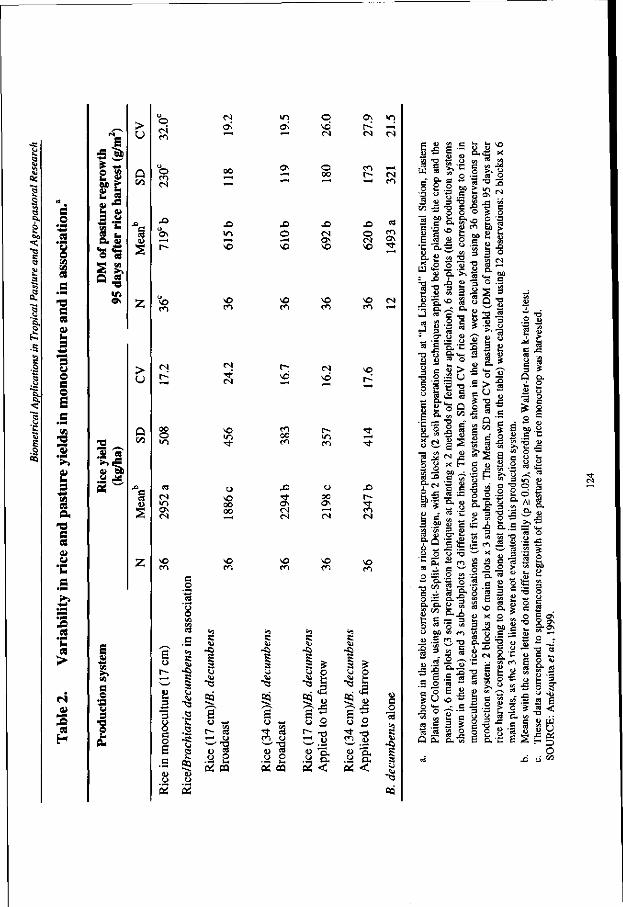
fi
I
C o
o SB
et
e et <u u 9
• * *
u o e o S
2 • P*
S
ca a -o e es eu u
s
c*
8 I
•a
2 *
E 2 >> S O
i
<N en
o en (N
u ON
r-
en
oo o ft
to (S ON
NO
en
ON
NO
NO en
(N
NO
O NO 00 00
NO
en
ON
ON
o
en
r-NO
en 00 en
ON
NO
m
NO
o 00
NO
NO
m
NO
r -m
oo ON
NO
m
c s eN
m - H r~ CM - H rn
X) c3
NO CN m —i
NO
Tien
NO
en
s
u o c o 6
c O
o o
c
R -ft s s
3 .a
S Pa
R •a 5 s
r- a
.a 8 Pi PQ
»5
R • f t
s 3 cj
J>
. c/5 • * ca m o
cj ca
5 2
ftS PQ
15 R ^>
• f t 5 s o
15
R • f t S s o
S9 o
?~ o o
.a £ a: <
S3 «
u o ;£ " en o
.2 &
a; < OJ a:
u c o 13 R %)
• f t
S s
03
§1-
e -
W -S TD C
E § u 5
g- £ •> o
u .- -C T3
» «, * . C " ) -
o >* ) -a a • a -a ;
£ a? < O C3N
(A ~
o 5 o S '•
ca w •J 3
a-
NO 3
O U "* -
s Si
§ ^ u o f ) , C/l X fM o o
- ^ CO
2 -^ 2 8 CO — -
<3 X )
£ 5 b c
so ' to
?-Q ' u _
.2 o
sf •o => c *-o = a. a.
.2 U
I § "S a
« E-
! 3 3 ° •s « -
• ^ Q .
» 3 o .S
S u l SISJ
^ • «
u u o
S o u
X tfc- '—-- o JB •S > c O S -a
J i _ 1 M . | » e o
O u
S a 3 S
Q o. p
w w
s ^ l
CO ^ j
o ^
U 3
•» 3 = "2 o o
3 2
•3 o..S =T
AI g.
, to to * - ^ °3 O
it • ~ Q .
C
E NO
s « o >
a » j
o ao u . 5 ca 3
•il e °
w CO
3 -S Q fl4
— 3 o " 3 J2
g. °
w CO
O.JJ
.s-a
, S 3 J
i -s 0> Zi
8 a
E &.•
' ^ o ' w o
' c 2 O g ON
•O ° ON
s s -4) — - ^
— -o o <u c . . C O cu
is I W H 3 — ° N •s S i s | < CO • •
o E S
Planning and Design of Agro-pastoral Trials in the Savannas
Experimental period: frequency of evaluations
The experimental period depends on the research phase (Table 1) and is short (one crop cycle) in crop component research trials. It is medium term (4-12 months) in pasture establishment and in pasture renewal trials with crops, the experimental period starting with planting the associations (or the crop in the case of pasture renewal) and ending at, or soon after, crop harvest, when the pasture is considered established or renewed (Sanz et al., 1994a, 1994b). In pasture renewal trials, it is important to determine when the pasture should be renewed to ensure good crop yields. One criterion is when the percentage of legume in the pasture decreases up to 20%, to guarantee pasture stability (CIAT, 1994). Pasture-crop rotation trials, by nature, are long term. Depending on the pasture, the associated crop, and site-specific soil characteristics, they should extend from 3 to 5 years (CIAT, 1994; Vilela and Ayarza, 1995).
Recommendations Given the long-term nature of agro-pastoral research, its multiple components, its multidisciplinary nature, and the high number of measurements required for soil, crop, pasture, and animal productivity, the objectives, scope, and methodological needs of component and discipline research must be clearly distinguished from agro-pastoral systems research.
Important aspects to consider when planning agro-pastoral trials include: a clear definition of experimental hypotheses, the appropriate selection of the experimental unit, the appropriate selection of experimental factors and their levels, the identification of control treatments, the selection of response variables that are sensitive to differences between the production systems under study, and an understanding of the spatial and temporal variability of the experimental material (soil, crop, pasture, animal). An understanding of variability of the experimental material will help identify appropriate sampling methods that minimise the number of samples to be taken, both in space and in time.
Considering the advantages of conducting research on agro-pastoral systems under the umbrella of the Agro-pastoral Research Network for the Savanna Ecosystem of Tropical America, the following recommendations are made:
• Conduct phase 1 {component and discipline research) through short-term, independent, controlled experiments at experiment station (satellite trials). Conduct phases 2 to 5 (agro-pastoral system research) at experiment station and on commercial farms.
• Define precise objectives and types of agro-pastoral production system to be studied by trials in phases 2 to 5. Design them to respond to specific needs of the different regions represented by the Agro-pastoral Research Network for the Savannas of Tropical America, avoiding duplication of effort and resources.
• Direct the information flow generated by the Network through an effective communication system to allow the analysis and dissemination of research results.
125
Biometrical Applications in Tropical Pasture and Agro-pastoral Research
References
ALPHA+, 1996. ALPHA+ version 2.3: A program for generating Alpha-Designs and resolvable row-column designs. © CSIRO, Australia and Biomathematics & Statistics Scotland. Melbourne, Australia, and Edinburg, Scotland.
Amezquita, M.C.; Chatel, M.; Guimaraes, E.P.; Ospina, Y. and Silva, J., 1999. Analisis Estadfstico de un Ensayo Exploratorio para la Toma de Decisiones Metodologicas. In: Guimaraes, E.P.; Sanz, J.I.; Rao, I.M.; Amezquita, M.C. and Amezquita, E. (eds.). Sistemas Agropastoriles en Sabanas Tropicales de America Latina. 78-90. Centro Internacional de Agriculture Tropical (CIAT) and Empresa Brasileira de Pesquisa Agropecuaria (EMBRAPA). ISBN 958-694-010-1, 313 pp.
CIAT (Centro Internacional de Agriculture Tropical), 1979-1994. Tropical Pastures Program Annual Reports. Cali, Colombia.
CIAT (Centro Internacional de Agriculture Tropical), 1993B-1994A. Programa de Arroz. Informe Anual de Mejoramiento de Arroz para Suelos Acidos. Cali, Colombia.
CIAT (Centro Internacional de Agriculture Tropical), 1994. Tropical Lowlands Program Annual Report, CULTICORE Project, 147-159. Cali, Colombia.
CIMMYT (Centro Internacional de Mejoramiento de Maiz y Trigo), 1993. Annual Report. Mexico City, Mexico.
CIMMYT (Centro Internacional de Mejoramiento de Maiz y Trigo), 1994. Annual Report. Mexico City, Mexico.
Clatworthy, W. H.; Cameron, J. M. and Speckman, J. A., 1973. Tables of Two-Associate-Class Partially Balanced Designs. National Bureau of Standards, Washington, D.C., U.S.A.
Cochran, W. G. and Cox, G. M., 1957. Experimental Designs, Second Edition. John Wiley & Sons, New York, U.S.A.
Guimaraes, E.P.; Sanz, J.I.; Rao, I.M.; Amezquita, M.C. and Amezquita, E. (eds.), 1999. Sistemas Agropastoriles en Sabanas Tropicales de America Latina. 65-77. Centro Internacional de Agriculture Tropical (CIAT) and Empresa Brasileira de Pesquisa Agropecuaria (EMBRAPA). ISBN 958-694-010-1, 313 pp.
Goodland, R., 1980. Environmental ranking of Amazonian development projects in Brazil. Environ. Conserv. 7: 9-25.
INTSORMIL (International Sorghum and Millet Program, CIAT-based regional project). 1993. Annual Report. Cali, Colombia.
Kluthcouski, J.; Pacheco, A.R.; Teixeira, S. M. and Oliveira, E.T. de, 1991. Renovacao de pastagens de Cerrado com arroz: I. Sistema Barreirao. Documento no. 33. 20 pp. Empresa Brasileira de
126

Planning and Design of Agro-pastoral Trials in the Savannas
Pesquisa Agropecuaria - Centro Nacional de Pesquisa de Arroz e Feijao (EMBRAPA-CNPAF), Goiania, Goias, Brasil.
Paladines, O. and Lascano, C. E., 1983. Recomendaciones para evaluar germoplasma bajo pastoreo en pequenas parcelas. In: Paladines, O. and Lascano, C. E. (eds.). Germoplasma Forrajero bajo Pastoreo en Pequenas Parcelas: Metodologfas de Evaluacion. 165-185. CIAT. Book series ISBN 84-89206-29-5. 186 pp.
Patterson, H. D. and Williams, E. R., 1976. A New Class of Resolvable Incomplete Block Designs. Biometrika 63: 83-92.
Patterson, H. D.; Williams, E. R. and Hunter, E. A., 1978. Block Designs for Variety Trials. J. Agr. Sci. 90: 395-400.
Pizarro, E. A. (ed.), 1983. Red Internacional de Evaluacion de Pastures Tropicales. CIAT. Book series ISSN 0120-4882,460 pp.
Pizarro, E. A., 1992. Red Internacional de Evaluacion de Pastos Tropicales (RIEPT). I Reunion Sabanas, 23-26 November 1992, Brasilia, Brazil.
Pla, S. I., 1983. Metodologfa para la caracterizacion fisica con fines de diagnostico de problemas de manejo y conservation de suelos en condiciones tropicales. Rev. Fac. Agronomia. Alcance No. 32. 90 pp. Maracay, Venezuela.
Rasch, D.; Herrendbrfer, G.; Bock, J.; Victor, N. and Guiard, V., 1996. Verfahrensbibliothek, Versuchsplanung und -auswertung, Band I. R. Oldenbourg Verlag, Miinchen Wien.
Sanz, J.I.; Zeigler, R.S.; Sarkarung, S.; Molina, D.L. and Rivera, M., 1994a. Pasture establishment with rice. CIAT. Cali, Colombia.
Sanz, J.I.; Zeigler, R.S.; Sarkarung, S.; Molina, D.L.; and Rivera, M., 1994b. Recuperation of degrading pastures with rice and rice-pasture leys. CIAT. Cali, Colombia.
Sarkarung, S. and Zeigler, R.S., 1989. Developing rice varieties for sustainable cropping systems for high acid upland soils of tropical America. In: International Symposium on Rice Production on Acid Soils of the Tropics: Achievements and Challenges. Kandi, Sri Lanka.
SAS, 1989. SAS/STAT User's Guide, Volume 1, Version 6, Fourth Edition. ISBN 1-55544-376-1. SAS Institute Inc., Cary, N.C., U.S.A.
Shelton, H.M. and Humhpreys, L.R., 1972. Pasture establishment in upland rice crops at Na Pheng, Central Laos. Tropical Grasslands 6(3): 223-228.
Spain, J.M. and Gualdron, R. 1991. Degradation y rehabilitation de pasturas. In: Lascano C.E. and Spain, J.M. (eds.). Establecimiento y renovation de pasturas. 269-284. CIAT. Cali, Colombia.
127

Biometrical Applications in Tropical Pasture and Agro-pastoral Research
Thomas, R. and Humphreys, L.R. 1970. Pasture improvement at Na Pheng, Central Laos. Tropical Grasslands 4(3): 229-236.
Toledo, J. M ; Amezquita, M. C. and Pizarro, E. A., 1983. Analisis del comportamiento del germoplasma evaluado por la Red Intemacional de Evaluacion de Pasturas Tropicales (RIEPT) en los ecosistemas de Sabana y Bosque Tropical de America. In: Pizarro, E. A. (ed.). Red Intemacional de Evaluacion de Pasturas Tropicales. 429-447. CIAT. Book series ISSN 0120-4882,460 pp.
Toledo, J.M.; Sere, C. and Loker, W., 1989. Pasture-crop technologies for acid soil savannas and rain forests of tropical America. In: Symposium Proceedings "Innovation in Resource Management". World Bank, Washington, D.C., U.S.A.
Vera, R.; Sanz, J.I.; Hoyos, P.; Molina, D.L.; Rivera, M. and Moya, M.C., 1993. Pasture establishment and recuperation with undersown rice on the acid soil savannas of South America. CIAT. Cali, Colombia.
Vera, R.; Sere, C ; and Tergas, L. E., 1986. Development of improved grazing systems in the savannas of tropical America. Proceedings of the 2nd International Rangeland Congress. 107-110. Adelaide, Australia.
Verdooren, Rob. 1998. Applications and Analysis of Alpha Designs. Lecture given at the Humboldt University in Berlin (Germany) on 2 July 1998: "Sommertagung der AG Landwirtschaftliches Versuchswesen anlasslich des 65. Geburttages von Herrn Prof. Dr. sc. Erhard Thomas an der Landwirtschaftlich- Gartnerischen Fakultat der Humboldt Universitat zu Berlin, 273. Juli 1998".
Vilela, L. and Ayarza, M., 1995. Rotacao de Culturas Anuais com Pastagens nos Cerrados. Paper presented at the IV Annual Meeting of the Agro-pastoral Research Network for the Savannas. Santa Cruz, Bolivia.
World Resources Institute, 1985. Tropical Forests: A Call for Action, Part I: The Plan. 49 pp. Washington, D.C., U.S.A.
Zeigler, R.S. and Toledo, J.M., 1993. Developing sustainable agricultural production systems for the acid soil savannas of Latin America. In: Paoletti, M.G.; Napier, T.; Ferro, O.; Stinner, B. and Stinner, D. (eds.). Socio-economic and policy issues for sustainable farming systems. 103-116. Coop. Amicizia sre. Padova, Italia.
128
Analysis of an agro-pastoral trial for decision-making
Chapter 9
Analysis of an agro-pastoral trial for decision-making'
Maria Cristina Amezquita2, Marc Chatel3, Elcio Guimaraes4, James Silva4 and Yolima Ospina"
Introduction
An important objective of a preliminary or exploratory phase of agro-pastoral research is to filter-out external variability to the agro-pastoral system and produce a set of specific recommendations on: (a) The most appropriate management practices for the soil, experimental crops,
pastures and animals, to be considered in the planning and design of more advanced research stages. This includes, for example, the method of soil preparation that should be used, the type and rate of fertilisers that should be applied, the planting system and density that should be adopted for crop and pasture.
(b) A reduced but sufficient group of response variables to be measured to allow the crop and pasture to properly express their response to treatments.
(c) Evaluation periods that allow treatments to show differential responses. (d) The most appropriate techniques for measuring diverse variables related to
soils, crops, pastures, and animals.
This chapter, through the analysis of an exploratory agro-pastoral trial, illustrates the kind of methodological questions that can be answered by exploratory agro-pastoral research experiments. The experiment under study is a 7-month multifactor trial of rice-pasture associations, conducted at "La Libertad" experiment station in the Department of Meta, Eastern Plains of Colombia. The trial was conducted between May and December 1994.
Adapted from the article published in Spanish in: Guimaraes, E.P.; Sanz, J.I.; Rao, I.M.; Amezquita, M.C. and Amezquita, E. (eds.), 1999. Sistemas Agropastoriles en Sabanas Tropicales de America Latina. 78-90. Centro Internacional de Agricultura Tropical (CIAT) and Empresa Brasileira de Pesquisa Agropecuaria (EMBRAPA). ISBN 958-694-010-1, 313 pp. Head Biometry Unit, Centro Internacional de Agricultura Tropical (CIAT). Cali, Colombia. Rice Project, CIRAD-CA / CIAT. Cali, Colombia. Rice Program, CIAT. Cali, Colombia.
129
Biometrical Applications in Tropical Pasture and Agro-pastoral Research
The Trial and its Methodological Objectives
The agro-pastoral trial corresponds to a 5-factor experiment, a (2x3x2x6x3) factorial, where the effect of soil management factors, crop and pasture management factors, and type of crop variety (rice variety, in this case) are evaluated on crop and pasture performance, as well as on soil compaction, under six production systems (four rice-pasture associations and the two monocultures, used as control treatments).
The five experimental factors are:
1. "Previous soil preparation technique", at two levels (with chisel or with mouldboard plough, 2 years before the simultaneous planting of rice and pasture).
2. "Soil preparation technique at planting", at three levels (with chisel, mouldboard plough, or harrow, used when planting rice and pasture).
3. "Method of fertiliser application" at planting, at two levels (in the furrow or broadcast). 4. "Agro-pastoral system", consisting of six different production systems (corresponding
to an augmented factorial (2x2) + 2, with two planting densities of rice (17 and 34 cm between furrows) x two planting systems of the pasture Brachiaria decumbens 606 (in the furrow and broadcast), plus two control treatments (monocropped rice and pasture alone).
5. "Rice line planted": 3 lines were used (Line 2, Line 4, and Oryzica Sabana 6, all selected on the basis of research carried out by Fischer et al. (1994).
The experiment was conducted at "La Libertad" experiment station, Eastern Plains of Colombia, located in an area representative of the well-drained savanna ecosystem of Tropical America. The trial began by planting rice and B. decumbens simultaneously and ended 215 days (almost 7 months) after planting. A Split-Split Plot experimental design was used with two blocks, represented by the two soil preparation techniques applied 2 years before trial initiation (use of chisel or mouldboard plough). Main plots consisted of the six combinations of the (3 x 2) factorial: "soil preparation at planting" (chisel, mouldboard plough, harrow) x "method of fertiliser application at planting" (in the furrow or broadcast). Subplots consisted of six different "agro-pastoral systems" that corresponded to an augmented factorial (2 x 2) + 2, as previously explained. The sub-subplots corresponded to the three rice lines. The total number of treatments per block was 108, giving a total of 216 experimental plots.
Rice response variables recorded were:
1. Number of plants/2 linear meters, at 30, 60 and 90 days after planting (dap). 2. Number of tillers/2 linear meters, at 30, 60 and 90 dap. 3. Total leaf area/10 plants (cm2), at 30, 60 and 90 dap. 4. Total weight, wet basis (g/2 linear meters), at 30,60 and 90 dap. 5. Total dry weight (g/10 plants), at 30,60 and 90 dap. 6. Leaf dry weight (g/10 plants), at 30,60 and 90 dap. 7. Number of panicles, at 90 dap and at rice harvest (at 120 dap).
130
Analysis of an agro-pastoral trial for decision-making
8. Length of panicles (cm), at 90 dap and at rice harvest. 9. Number of full grains/10 panicles, at 90 dap and at rice harvest. 10. Weight of grain (g/ 2 linear meters), at 90 dap and at rice harvest. 11. Dry matter weight (g/ 2 linear meters), at 90 dap and at rice harvest. 12. Yield (kg/ha), at 90 dap and at rice harvest.
Pasture response variables recorded were:
1. Number of plants/2 linear meters, at 60 and 90 dap. 2. Leaf area/10 plants (cm2), at 60 and 90 dap, at rice harvest (120 dap) and during post-
harvest (at 45 and 95 days after rice harvest (dah)). 3. Weight, wet basis (g/2 linear meters), at 60 and 90 dap. 4. Total dry matter (g/10 plants) at 60 and 90 dap, at rice harvest (120 dap) and during
post-harvest (at 45 and 95 dah). 5. Leaf dry matter (g/10 plants) at 60 and 90 dap, at rice harvest (120 dap) and during
post-harvest (at 45 and 95 dah). 6. Total dry matter of regrowth at 45 dah (g/0.5 m2). 7. Total dry matter of regrowth at 95 dah (g/0.5 m2).
The only soil parameter measured, before the trial's initiation and after the end of the trial, was surface soil compaction, expressed as resistanci with the penetrometer at depths between 0 and 60 cm. was surface soil compaction, expressed as resistance to penetration (kg of pressure/cm2)
The agro-pastoral trial aimed to: a) evaluate the effect of each factor on rice and pasture performance and their competitive capacity in association; b) evaluate the effect of each factor on soil compaction; c) identify the optimal level of each experimental factor, in order to use it in more advanced research stages; d) identify the most appropriate response variables to characterise crop and pasture response to treatments; and e) identify the most appropriate evaluation ages to characterise crop and pasture response to treatments.
Statistical Analysis
In order to respond to the trial's methodological objectives, the statistical analysis was carried out with the following objectives and methodology:
(1) Explore the possibility of reducing the original number of crop and pasture response variables to a smaller set of non-correlated ones that could appropriately characterise crop and pasture responses, using the Principal Component Analysis technique. Select an appropriate subset of the resulting Principal Components for this.
The Principal Component Analysis technique, first developed by Pearson (1901) and later expanded by Hotelling (1933), is a multivariate technique
131
Biometrical Applications in Tropical Pasture and Agro-pastoral Research
for detecting linear relationships among several quantitative variables. It is used to reduce the number of variables of a given research problem for resource-efficiency purposes, or as an analytical tool for further analysis, such as regression or clustering. It is also used for summarising data. The use of the Principal Component Analysis technique as a method to reduce the number of variables has been reported in the literature. Patterson et al. (1978) reported its use to reduce the number of climatic variables. Amezquita et al. (1990) illustrate its use to reduce the number of soil variables.
(2) Identify and prioritise the experimental factors that significantly affected rice and pasture performance and their competitive capacity and productivity under association, as well as those that affected soil compaction. In order to test the effect of the various experimental factors on rice and pasture performance, the resulting Principal Components obtained from the analysis performed on crop and pasture response variables at different ages, as described in step (1), were analysed under the ANOVA model presented in Table 1. Factor F-values were used as criterion to prioritise significant factors (with p < 0.05).
(3) Identify the optimal level of each factor found significant in step (2), in order to recommend its use in more advanced stages of agro-pastoral research. The purpose therefore, is to identify the best soil preparation technique (previous planting and at planting), method of fertiliser application at planting, rice planting density, pasture planting system, and the best rice line, for the establishment and management of a rice-pasture agro-pastoral system. The "optimal level" of an experimental factor is that showing the highest mean of crop and/or pasture agronomic response variables (reflecting the productivity of the association), while not showing a significant increase in soil compaction. Mean comparison tests between factor levels, using the Waller-Duncan k-ratio t test (SAS, 1985), were performed for those factors found significant in step (2). Variables analysed were the resulting Principal Components obtained from the analysis performed on crop and pasture response variables at different ages, as described in step (1), and, for better interpretation, those original response variables exhibiting the largest Principal Component score at each resulting Principal Component.
If a given factor level maximises rice, or pasture response at a given age, but not both simultaneously, then it would be necessary to decide which one it is desirable to maximise. This depends on the specific response variable. For example: it is preferable to maximise rice yield (t/ha) at harvest even if the pasture's dry matter production is not the highest.
(4) Identify relevant evaluation ages and criteria to asses a successful establishment of the crop-pasture association.
132
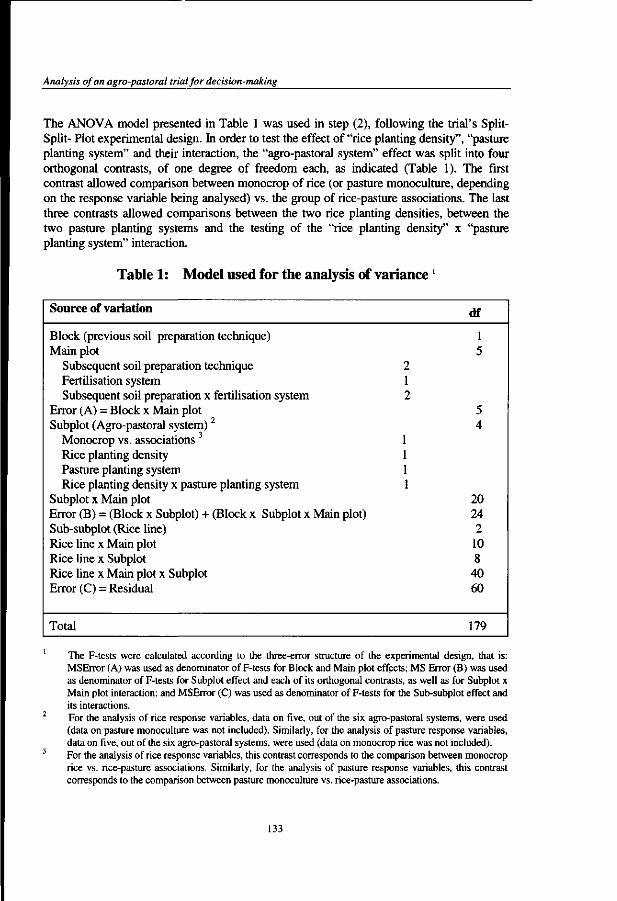
Analysis of an agro-pastoral trial for decision-making
The ANOVA model presented in Table 1 was used in step (2), following the trial's Split-Split- Plot experimental design. In order to test the effect of "rice planting density", "pasture planting system" and their interaction, the "agro-pastoral system" effect was split into four orthogonal contrasts, of one degree of freedom each, as indicated (Table 1). The first contrast allowed comparison between monocrop of rice (or pasture monoculture, depending on the response variable being analysed) vs. the group of rice-pasture associations. The last three contrasts allowed comparisons between the two rice planting densities, between the two pasture planting systems and the testing of the "rice planting density" x "pasture planting system" interaction.
Table 1: Model used for the analysis of variance '
Source of variation
Block (previous soil preparation technique) Main plot
Subsequent soil preparation technique Fertilisation system Subsequent soil preparation x fertilisation system
Error (A) = Block x Main plot Subplot (Agro-pastoral system)2
Monocrop vs. associations Rice planting density Pasture planting system Rice planting density x pasture planting system
Subplot x Main plot Error (B) = (Block x Subplot) + (Block x Subplot x Main plot) Sub-subplot (Rice line) Rice line x Main plot Rice line x Subplot Rice line x Main plot x Subplot Error (C) = Residual
Total
2 1 2
1 1 1 1
df
1 5
5 4
20 24 2 10 8
40 60
179
The F-tests were calculated according to the three-error structure of the experimental design, that is: MSError (A) was used as denominator of F-tests for Block and Main plot effects; MS Error (B) was used as denominator of F-tests for Subplot effect and each of its orthogonal contrasts, as well as for Subplot x Main plot interaction; and MSError (C) was used as denominator of F-tests for the Sub-subplot effect and its interactions. For the analysis of rice response variables, data on five, out of the six agro-pastoral systems, were used (data on pasture monoculture was not included). Similarly, for the analysis of pasture response variables, data on five, out of the six agro-pastoral systems, were used (data on monocrop rice was not included). For the analysis of rice response variables, this contrast corresponds to the comparison between monocrop rice vs. rice-pasture associations. Similarly, for the analysis of pasture response variables, this contrast corresponds to the comparison between pasture monoculture vs. rice-pasture associations.
133
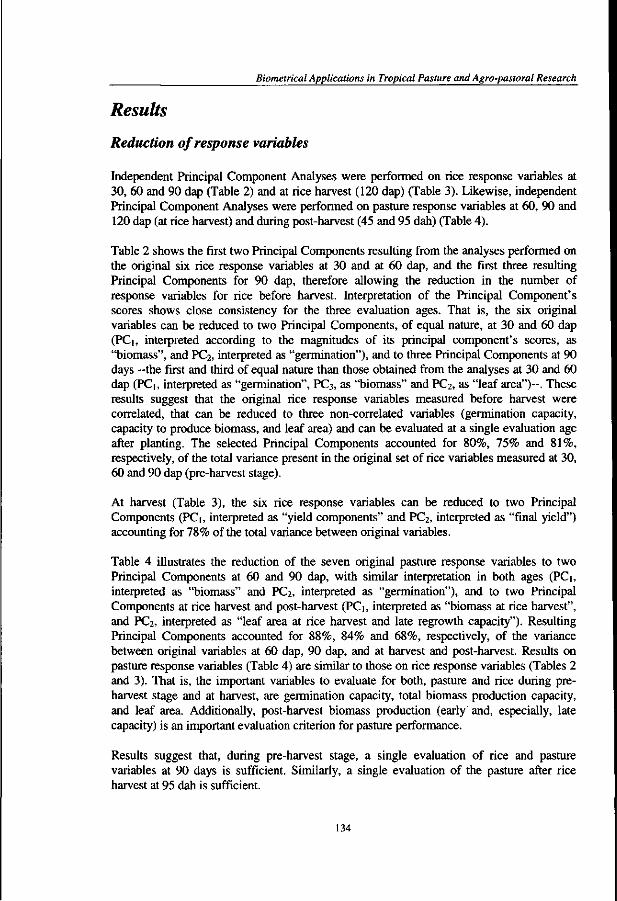
Biometrical Applications in Tropical Pasture and Agro-pastoral Research
Results
Reduction of response variables
Independent Principal Component Analyses were performed on rice response variables at 30, 60 and 90 dap (Table 2) and at rice harvest (120 dap) (Table 3). Likewise, independent Principal Component Analyses were performed on pasture response variables at 60, 90 and 120 dap (at rice harvest) and during post-harvest (45 and 95 dah) (Table 4).
Table 2 shows the first two Principal Components resulting from the analyses performed on the original six rice response variables at 30 and at 60 dap, and the first three resulting Principal Components for 90 dap, therefore allowing the reduction in the number of response variables for rice before harvest. Interpretation of the Principal Component's scores shows close consistency for the three evaluation ages. That is, the six original variables can be reduced to two Principal Components, of equal nature, at 30 and 60 dap (PCi, interpreted according to the magnitudes of its principal component's scores, as "biomass", and PC2, interpreted as "germination"), and to three Principal Components at 90 days -the first and third of equal nature than those obtained from the analyses at 30 and 60 dap (PCi, interpreted as "germination", PC3, as "biomass" and PC2, as "leaf area")—. These results suggest that the original rice response variables measured before harvest were correlated, that can be reduced to three non-correlated variables (germination capacity, capacity to produce biomass, and leaf area) and can be evaluated at a single evaluation age after planting. The selected Principal Components accounted for 80%, 75% and 81%, respectively, of the total variance present in the original set of rice variables measured at 30, 60 and 90 dap (pre-harvest stage).
At harvest (Table 3), the six rice response variables can be reduced to two Principal Components (PQ, interpreted as "yield components" and PC2, interpreted as "final yield") accounting for 78% of the total variance between original variables.
Table 4 illustrates the reduction of the seven original pasture response variables to two Principal Components at 60 and 90 dap, with similar interpretation in both ages (PCi, interpreted as "biomass" and PC2, interpreted as "germination"), and to two Principal Components at rice harvest and post-harvest (PCi, interpreted as "biomass at rice harvest", and PC2, interpreted as "leaf area at rice harvest and late regrowth capacity"). Resulting Principal Components accounted for 88%, 84% and 68%, respectively, of the variance between original variables at 60 dap, 90 dap, and at harvest and post-harvest. Results on pasture response variables (Table 4) are similar to those on rice response variables (Tables 2 and 3). That is, the important variables to evaluate for both, pasture and rice during pre-harvest stage and at harvest, are germination capacity, total biomass production capacity, and leaf area. Additionally, post-harvest biomass production (early and, especially, late capacity) is an important evaluation criterion for pasture performance.
Results suggest that, during pre-harvest stage, a single evaluation of rice and pasture variables at 90 days is sufficient. Similarly, a single evaluation of the pasture after rice harvest at 95 dah is sufficient.
134
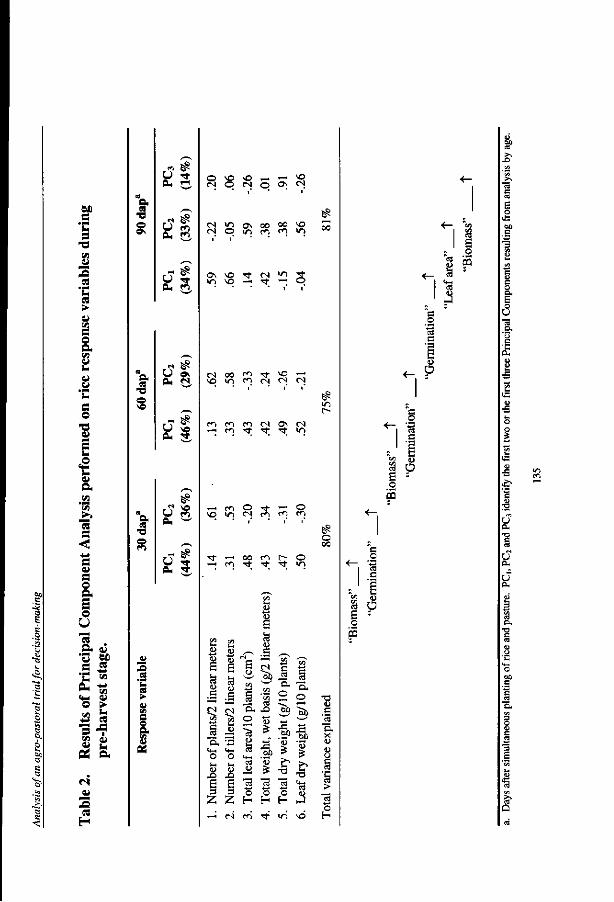
G 'u 3 -a VI
— 3 S a > a> 09 8 O a Vi M
a o •a cv
H i -
a
3
Q.
= "*
as
s < c v S o a. S o U D. a)
*3 BO
"* Vi CM a> o > VI js ** as
73 J? [/> aj
u 0-
u a,
a.
•*
•3 0 \e
- £ U vo BU S
8-o
.fi C3 "E 08 at VI a © a VI
as
o vo vo —1 - H vq N O N O * 1
^ •o o \ 00 00 >o O m n w i n
OS ^O •'i" <N ^n ^£ in c - Tt - O
01 00 " t *o rt
>0 U-) C«"l CJ ^ f^
m n m N 0 \ n - n • * ^ • * m
— r<-> O Tf —' © \D vi cs m ro c*i
TJ- -H 00 t«i r- o ^ n * * * ^1
r-
o 00
I-H
_e 04 c/5
"3. 0 u*
X>
s 3
z - - H
S-H
l 53 0 .a JN C/3
O t H
X) £ 3
z (N
0
§ "S. 0 Ta u S3
4-H cd D
3 0 H r<->
<D
1 W5
'J^
J3
'53 £
"3 0 H • *
"E, 0
S '53
£> T3
"3 0 H m
W5
E. 0
§
'53
> •a 13 ^ VO
T3
'3 "E. 0
s •g >
"c3 0 H
<-
e3
I 13
S o
s
<-
c o
<- '5
a a 6 o S
,6
00
e- -
u •o
«
S.J
o
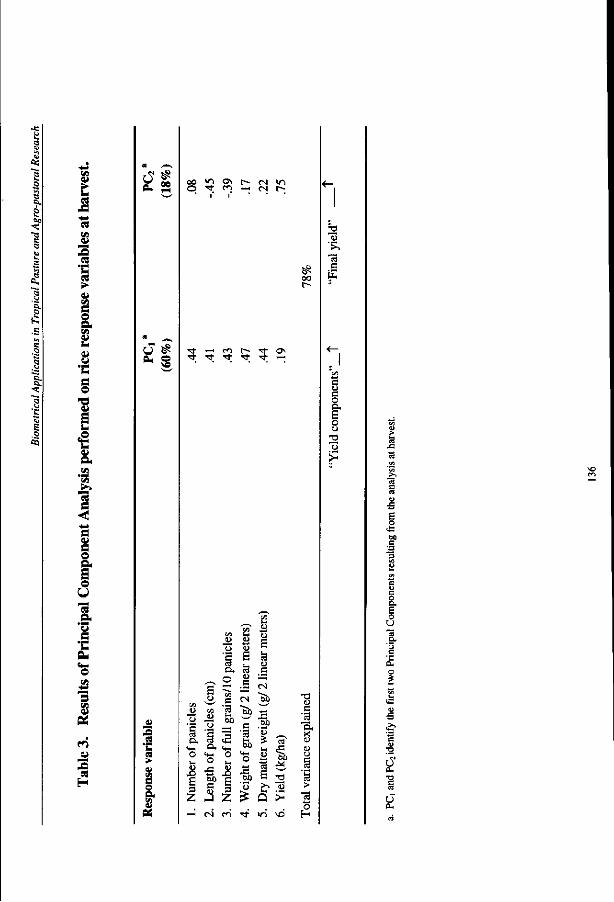
s
I 5
8
«
•c « o a CO 4)
8 •c a o -a cu
s •g a
• PN CO >>
IS S3 <
• * *
C cu e o S o U -a a "3 s •c 0-
3
ft- 8
— 3 2 *C a > s o a.
00 >o ON C"-. CN Vt O t ^ ri M P-
oo r-
<-
2 13
•a c E
•* -H m r- -ri- o\ 4 • * t t 4 — <-
c U c o p.
o U
o t-H
i Z —H
? «5 O
73
o
to a
,3 cs
_u "o
1 £X o ^
'3 00
1 O
1 3
Z en
u y S S3
CN
C •a fas OO
o £ '5
^f
S
c — CN
3& '53
a Q
>/->
'a
vo
• a <o c
3 "a, X
o o
>
o H
u cu
U a.
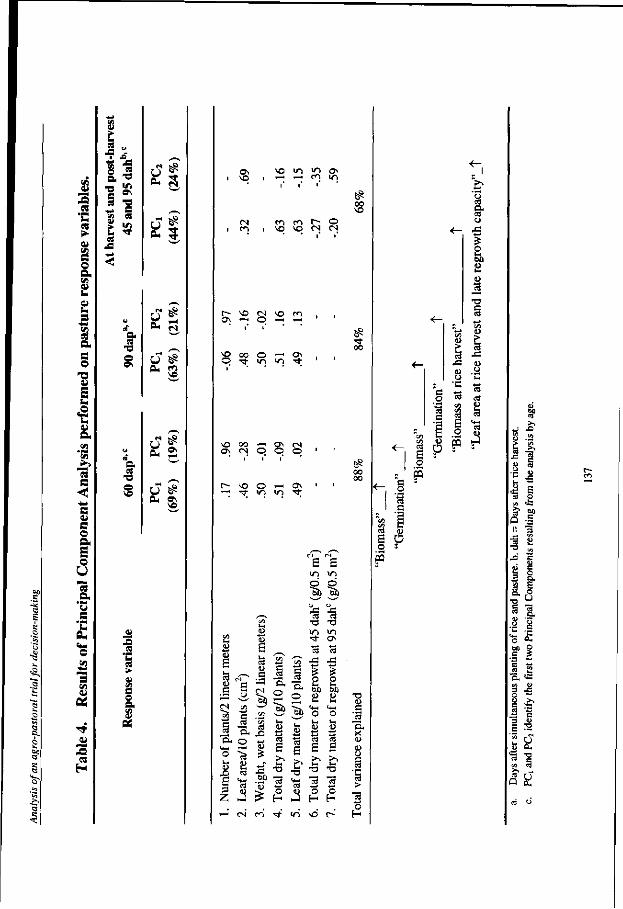
V>
— 3 •c >
ii V
:-S •** w • a l a o
s I 8.1 6 0 •
M S
e s
I1 o
u a l "w e u 0-St-
O VI
•*J 3 vi OS
3 es H
u Cg x:
o
e A
• # *
8 fc
j f J3
in
•e s C9
« e 9\
a. es
o SO
S F5.
* 3.
ft- g
B O
a
2
OS SO
CO
so in <n os ^ - • n i n
<^ ^ C; S \p >p cs cs
t-» SO CS SO CI Os —' p -H - J
SO 00 O ^H OS p ^ in in •*
SO 00 —' OS CN os CN| o O ©
r- so o —i os H ^ i n i n 1 ;
i n i n
~5b "5b
oo SO
0 0
00 00
Cfl l-H O
6 S3 c
s
1 o S~i
0)
1 2
—
_
"a u crt
"S P
S3 03
£ «3 6 S3 u c
CN
^ t/1
xi
St
op
3 £ <N <*->
<si
"Si P
l - i
13 s
• o
3 o
• *
W5
"& P
l - i
o 13 6 > *
03
,2 m
i n
•* 13 J3
o
e O L-l
u 13 6
T3
"3 O i-
VO
i n OS
13
CJ3
a o 1-1
13 6 >> t-i T3
3 O
H r-
0>
"S X
O
"5 > 13
<-.
1 §• o
<- -3 ' &
o 00
a u e3
p ^ C3
I 1 5
a o 13 c
o
oa
Q -S
E o U
E 3 W3
(U
to &
Q
y a-C nj
Id
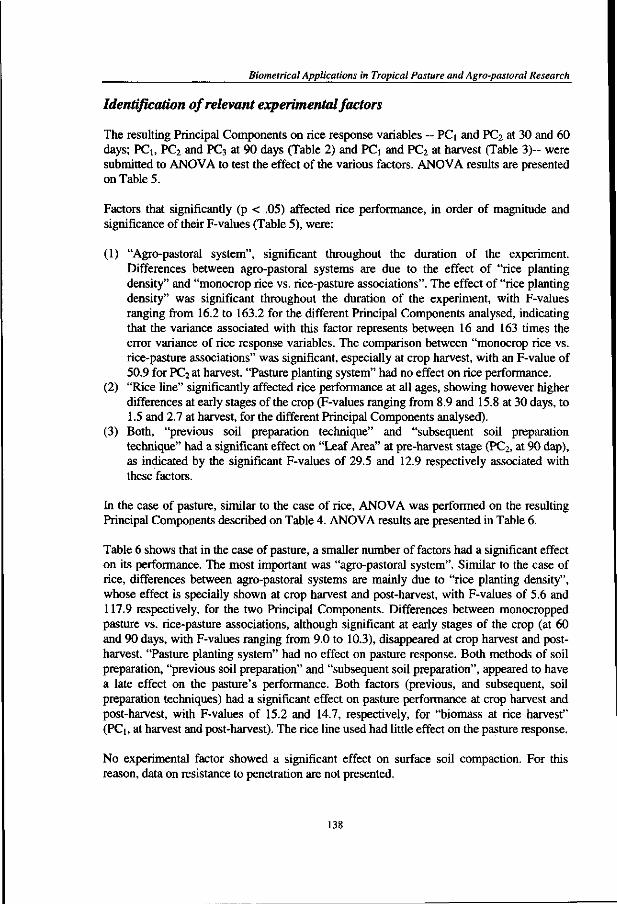
Biometrical Applications in Tropical Pasture and Agro-pastoral Research
Identification of relevant experimental factors
The resulting Principal Components on rice response variables — PQ and PC2 at 30 and 60 days; PQ, PC2 and PC3 at 90 days (Table 2) and PQ and PC2 at harvest (Table 3)- were submitted to ANOVA to test the effect of the various factors. ANOVA results are presented on Table 5.
Factors that significantly (p < .05) affected rice performance, in order of magnitude and significance of their F-values (Table 5), were:
(1) "Agro-pastoral system", significant throughout the duration of the experiment. Differences between agro-pastoral systems are due to the effect of "rice planting density" and "monocrop rice vs. rice-pasture associations". The effect of "rice planting density" was significant throughout the duration of the experiment, with F-values ranging from 16.2 to 163.2 for the different Principal Components analysed, indicating that the variance associated with this factor represents between 16 and 163 times the error variance of rice response variables. The comparison between "monocrop rice vs. rice-pasture associations" was significant, especially at crop harvest, with an F-value of 50.9 for PC2 at harvest. "Pasture planting system" had no effect on rice performance.
(2) "Rice line" significantly affected rice performance at all ages, showing however higher differences at early stages of the crop (F-values ranging from 8.9 and 15.8 at 30 days, to 1.5 and 2.7 at harvest, for the different Principal Components analysed).
(3) Both, "previous soil preparation technique" and "subsequent soil preparation technique" had a significant effect on "Leaf Area" at pre-harvest stage (PC2, at 90 dap), as indicated by the significant F-values of 29.5 and 12.9 respectively associated with these factors.
In the case of pasture, similar to the case of rice, ANOVA was performed on the resulting Principal Components described on Table 4. ANOVA results are presented in Table 6.
Table 6 shows that in the case of pasture, a smaller number of factors had a significant effect on its performance. The most important was "agro-pastoral system". Similar to the case of rice, differences between agro-pastoral systems are mainly due to "rice planting density", whose effect is specially shown at crop harvest and post-harvest, with F-values of 5.6 and 117.9 respectively, for the two Principal Components. Differences between monocropped pasture vs. rice-pasture associations, although significant at early stages of the crop (at 60 and 90 days, with F-values ranging from 9.0 to 10.3), disappeared at crop harvest and post-harvest. "Pasture planting system" had no effect on pasture response. Both methods of soil preparation, "previous soil preparation" and "subsequent soil preparation", appeared to have a late effect on the pasture's performance. Both factors (previous, and subsequent, soil preparation techniques) had a significant effect on pasture performance at crop harvest and post-harvest, with F-values of 15.2 and 14.7, respectively, for "biomass at rice harvest" (PCi, at harvest and post-harvest). The rice line used had little effect on the pasture response.
No experimental factor showed a significant effect on surface soil compaction. For this reason, data on resistance to penetration are not presented.
138
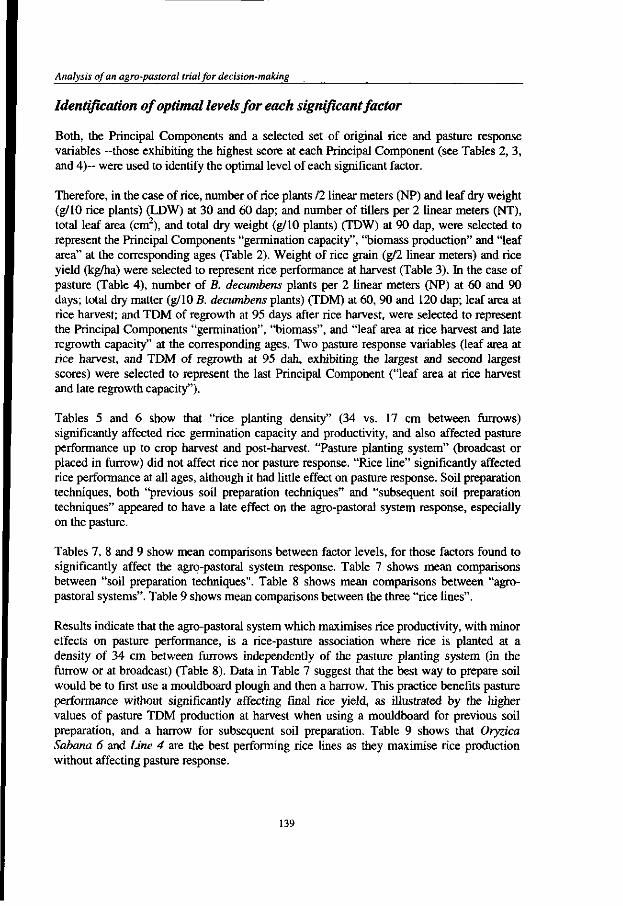
Analysis of an agro-pastoral trial for decision-making
Identification of optimal levels for each significant factor
Both, the Principal Components and a selected set of original rice and pasture response variables —those exhibiting the highest score at each Principal Component (see Tables 2, 3, and 4)~ were used to identify the optimal level of each significant factor.
Therefore, in the case of rice, number of rice plants 12 linear meters (NP) and leaf dry weight (g/10 rice plants) (LDW) at 30 and 60 dap; and number of tillers per 2 linear meters (NT), total leaf area (cm2), and total dry weight (g/10 plants) (TDW) at 90 dap, were selected to represent the Principal Components "germination capacity", "biomass production" and "leaf area" at the corresponding ages (Table 2). Weight of rice grain (g/2 linear meters) and rice yield (kg/ha) were selected to represent rice performance at harvest (Table 3). In the case of pasture (Table 4), number of B. decumbens plants per 2 linear meters (NP) at 60 and 90 days; total dry matter (g/10 B. decumbens plants) (TDM) at 60, 90 and 120 dap; leaf area at rice harvest; and TDM of regrowth at 95 days after rice harvest, were selected to represent the Principal Components "germination", "biomass", and "leaf area at rice harvest and late regrowth capacity" at the corresponding ages. Two pasture response variables (leaf area at rice harvest, and TDM of regrowth at 95 dah, exhibiting the largest and second largest scores) were selected to represent the last Principal Component ("leaf area at rice harvest and late regrowth capacity").
Tables 5 and 6 show that "rice planting density" (34 vs. 17 cm between furrows) significantly affected rice germination capacity and productivity, and also affected pasture performance up to crop harvest and post-harvest. "Pasture planting system" (broadcast or placed in furrow) did not affect rice nor pasture response. "Rice line" significantly affected rice performance at all ages, although it had little effect on pasture response. Soil preparation techniques, both "previous soil preparation techniques" and "subsequent soil preparation techniques" appeared to have a late effect on the agro-pastoral system response, especially on the pasture.
Tables 7, 8 and 9 show mean comparisons between factor levels, for those factors found to significantly affect the agro-pastoral system response. Table 7 shows mean comparisons between "soil preparation techniques". Table 8 shows mean comparisons between "agro-pastoral systems". Table 9 shows mean comparisons between the three "rice lines".
Results indicate that the agro-pastoral system which maximises rice productivity, with minor effects on pasture performance, is a rice-pasture association where rice is planted at a density of 34 cm between furrows independently of the pasture planting system (in the furrow or at broadcast) (Table 8). Data in Table 7 suggest that the best way to prepare soil would be to first use a mouldboard plough and then a harrow. This practice benefits pasture performance without significantly affecting final rice yield, as illustrated by the higher values of pasture TDM production at harvest when using a mouldboard for previous soil preparation, and a harrow for subsequent soil preparation. Table 9 shows that Oryzica Sabana 6 and Line 4 are the best performing rice lines as they maximise rice production without affecting pasture response.
139
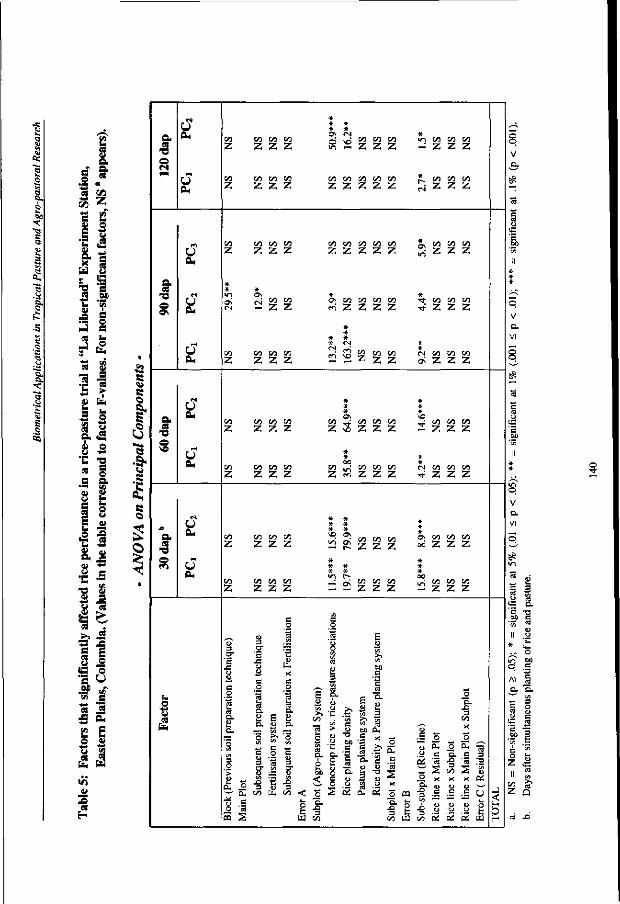
.5
7i **•*
-a s s
.1 u a
s I
« 3
w
a. "9 ©
o 9\
a. « •a o ve
a S8
©
u ft-
u ft.
u ft-
u ft-
u ft-
u ft.
u ft.
u ft.
u a-
u
* * * * * ON (S *
z z z z £ is z z z -; z z z
eo w n la on oo to oo oo ! m co i/)
z z z z z z z z z £ z z z
00 K O) « C / 3 C / 3 O 0 C / 3 & O 1 O) W K l
Z Z Z Z Z Z Z Z Z J - Z Z Z
* * * v i ON * * Q^ ^ C/3 W O; C/3 C/3 {/3 00 ^ W w w <N — 2 2 c * S 2 2 2 2 T t 2 2 2
* * * * * cs *
2 2 2 2 2 ^ Z ^ ; Z o ; 2 2 2
* * * * * * ON NO
z z z z z S z z z 2 z z z
* * 00 *
C/3 W W W 00 , ~ 00 W W (N OO OO 00
z z z z z S z z z ^ Z Z Z
NS
NS
NS
NS
NS
NS
NS
NS
19.7
**
79.9
***
NS
NS
NS
NS
NS
NS
15.8
***
8.9*
**
NS
NS
NS
NS
NS
NS
Blo
ck (P
revi
ous s
oil p
repa
ratio
n te
chni
que)
M
ain P
lot
Subs
eque
nt so
il pr
epar
atio
n te
chni
que
Fert
ilisa
tion
syst
em
Subs
eque
nt so
il pr
epar
atio
n x F
ertil
isat
ion
Err
or A
Su
bplo
t (A
gro-
past
oral
Sys
tem
)
Mon
ocro
p ric
e vs.
rice
-pas
ture
ass
ocia
tions
R
ice p
lant
ing d
ensi
ty
Past
ure p
lant
ing
syst
em
Ric
e den
sity
x P
astu
re pl
anti
ng sy
stem
Su
bplo
t x M
ain P
lot
Err
or B
Su
b-su
bplo
t (R
ice
line)
R
ice l
ine x
Mai
n Plo
t R
ice l
ine x
Subp
lot
Ric
e lin
e x M
ain
Plot
x Su
bplo
t E
rror
C (R
esid
ual)
< H O H
8 3
.2? 5
Z £
Z Q
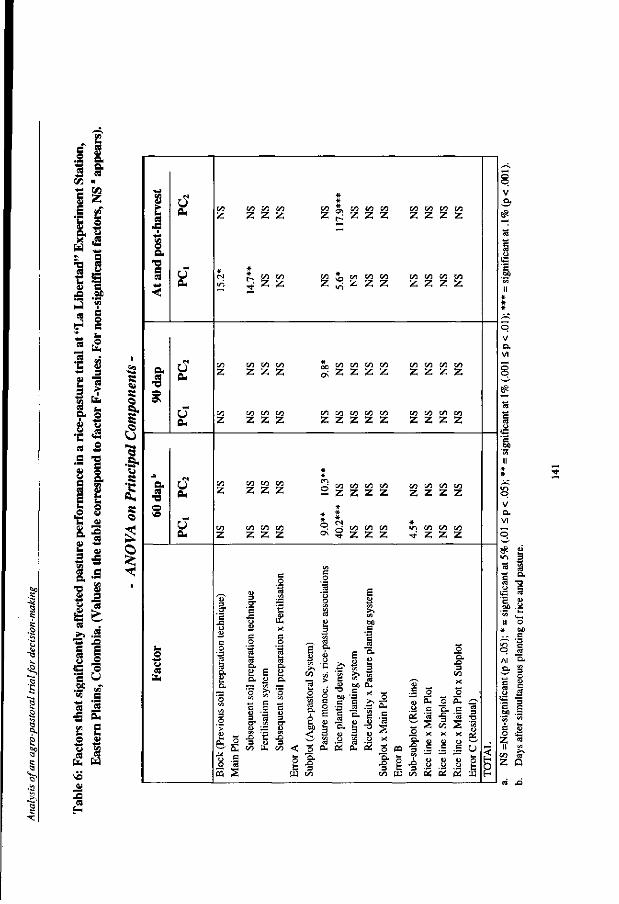
. E I I 3 «
O) <-*
I 2" a. y
II Ol .a hJ
I f ** M
•c • ^
s ** 8 a, o> u s. Cg
e •™ Ol
e
E u o t a
s. 3
"8 01
u IS CS ; • >
• • ^
s !S S M l
te
2 o
b
^o 01
.o es
H
B
S O S
Ol 3
> Est
o u <3 3 T> e « a IS i -
o u Ol
3 0)
£
.£ Ol • ^
<S
K « A
s o
• © u e E £ a>
$ w
-a a s
I •5-e
•E
I
i > u M •
8 a s «
- J !
8-O
•Q
a.
O v e
u
u a.
u a.
u a-
U a.
u
s-o u
# * CO I d « B l M 1 » » ) 7 ! ( « W O l w
Z Z Z Z Z * Z Z Z Z Z Z Z
* * <N S . CO CO CO J , CO CO CO CO CO CO CO
«s $ z z Z ^ Z Z Z Z Z Z Z :
co w w w £ , co co co co »1 B) I f l B l Z Z Z Z ^ Z Z Z Z Z Z Z Z
CO B « [ f l CO CO CO CO CO Cfl W W M
Z Z Z Z Z Z Z Z Z Z Z Z Z
* * E5 2 2 2 j - ; ^ CO CO CO CO CO CO CO
Z Z Z Z S z z z z Z Z Z Z
#
CO c o c o c o ° . X "1 B l Ol lO CO CO 09
Z Z Z Z °> § Z Z Z ^ Z Z Z
Blo
ck (P
revi
ous s
oil p
repa
rati
on te
chni
que)
M
ain P
lot
Subs
eque
nt so
il pr
epar
atio
n tec
hniq
ue
Fert
ilisa
tion s
yste
m
Subs
eque
nt so
il pr
epar
atio
n x F
erti
lisa
tion
E
rror
A
Subp
lot (
Agr
o-pa
stor
al S
yste
m)
Past
ure m
onoc
. vs.
rice
-pas
ture
ass
ocia
tions
R
ice p
lant
ing d
ensi
ty
Past
ure p
lant
ing s
yste
m
Ric
e den
sity
x P
astu
re pl
anti
ng sy
stem
Su
bplo
t x M
ain P
lot
Err
or B
Sub-
subp
lot (
Ric
e lin
e)
Ric
e lin
e x M
ain P
lot
Ric
e lin
e x Su
bplo
t R
ice l
ine x
Mai
n Plo
t x S
ubpl
ot
Err
or C
(Res
idua
l)
<
s Z Q
Biometrical Applications in Tropical Pasture and Agro-pastoral Research
Minimum experimental period to determine successful pasture establishment
When conducting research on crop-pasture associations or on pasture renewal experiments, the pasture establishment period starts with the planting of the association (or the crop, in the case of renewed pastures) and ends when the pasture is established or renewed, that is, when the pasture covers a sufficiently large proportion of the area planted to allow grazing.
Results on the evaluation of monocropped forage grasses and legumes from the International Network for Tropical Pastures Evaluation (RIEPT) show that the best indicator of successful pasture establishment is at least 70% of soil cover at 12 weeks after planting. (Toledo et al., 1983; Amezquita et al., 1990). For associated crop-pasture trials or pasture renewal experiments, however, whether this indicator and age of evaluation are appropriate needs to be ascertained.
Given that none of the pasture response variables recorded at this particular experiment provide information on the amount (or percentage) of area covered by the pasture at a given age, then it is difficult to identify and recommend the most appropriate age for evaluating success in pasture establishment under the present rice-pasture associations. Recorded response variables, such as number of plants/2 linear meters, total leaf area/10 plants (cm2), or total dry matter (g/10 plants) are not sufficient to determine and recommend a minimum experimental period required to evaluate success in pasture establishment.
142
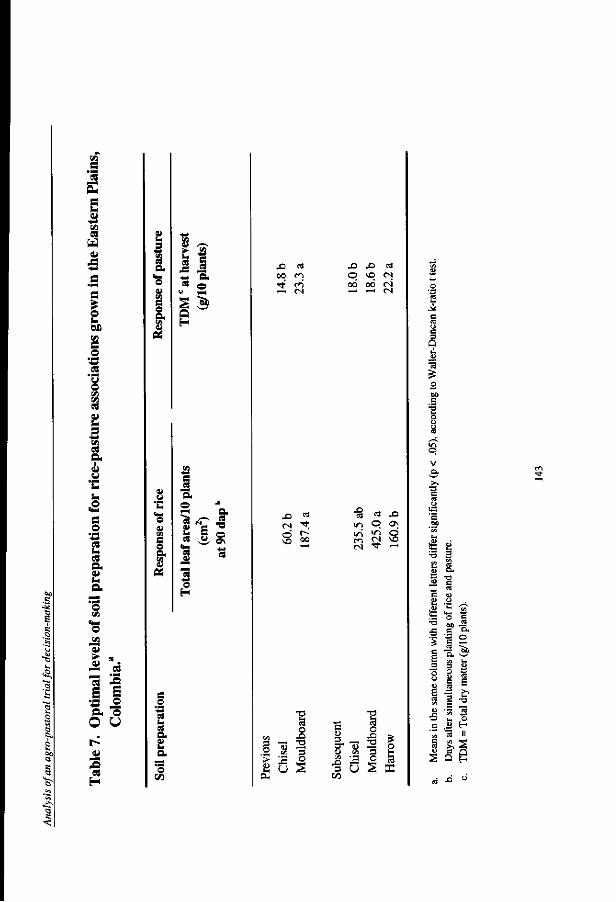
^
in C "3 s c u <u *
a
2 OX)
o « .2 o «S
2J 3
•c s -
.2 s
#o '-3 08 S-93 Q> V !~ a o 'S
5 i ••s .2 Q. O
o u —
H
2 3 3 a
S M
O V
i 8 «
8 -s?
5 1 x ^ <M fi<
« o « 1-H
Q H
e o a. to
3 e a e •"
S B * C8 U
o H
o 0\
s o
a. t> a '8
X I oo • * '
OS
r o r n
X> X) p *o oo oo
a C N
r i - H —I C4
vB oo
•8 C3
O x>
d m « * cs • * —'
1 o
«= £ 3 '—i T3 s « •= . 5 ^ 3
£ u § a.
c 3 _ U t/j
is a 3 U 00
T 3
S3 O
1 3 o s
o § ac
•a .c
£ 3
"o y
e
.s 00
<U
two c
• ,3 C
iS C L c/> 3 O 0> C
3
e * w 1 M
CQ
"5. o
^ S
E
•a
1 o H II
a
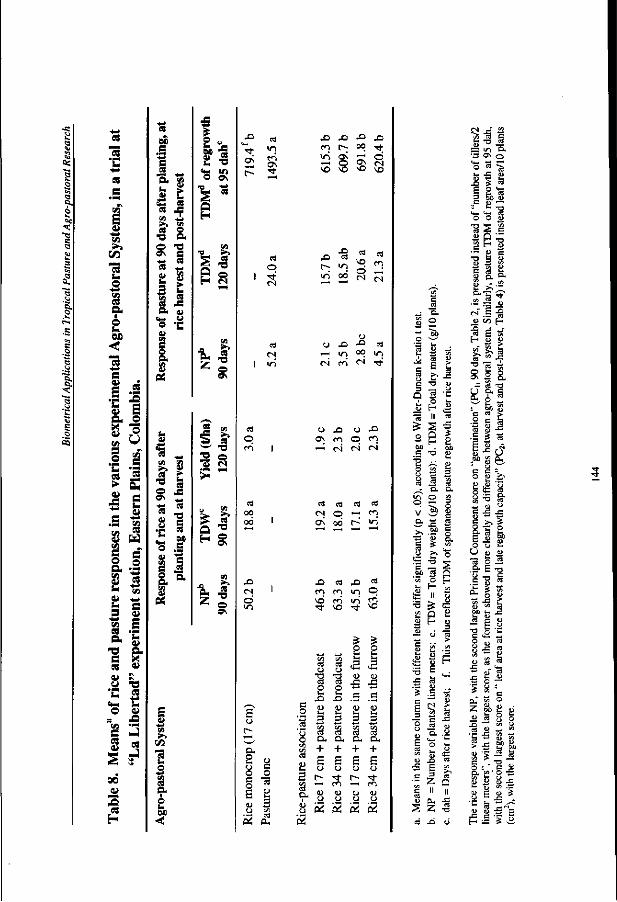
6. S ao
.2
I
as s
§
•o n.
s £
2 g S3 J
C M U
O x
S »
«H V) O Os
§ • Q H
Q o
i !
£ f
8 1 •8 .5 en S
8 "S.
2 o
©
E
"3 u o
wo
• " 03
si a r- 2
03 O
CN
03
© cn I
01 00 00 I
x> CN o
u r-^ y
B ,
?, <> o c o f= « CJ
OS
o c o 13
3 wl 03
O H
X> X> X> JD CO [-; OO Tj-
"•> 2> ^ © ^ o » N »o \o ^o ^o
* "S £ a
" 2 22 CS t-M
CJ XI - 0 OS rn i n * i n CN en <N Tt
O X> O X> ON en O C"! —'• CN CN CN
cd c3 03 03 CN O —; <*">
ffi 00 f - " i
cn en u-> ©.
o rt ctf o o CV5
S 3
1 9 4>
vd •*
cfl 03 O
T3 03 O
X ) <D b H
3
1 0 ,
+ 6 o r-•—i
u o 'oi
en VO
c/5 03 o T3 o3 O
X I O l * 3
1 a, + 6 c_> *fr CO <u o a!
>n
o fci <5 u
XJ ^c <L>
(-. 3
03 a, + £ o r-— <u o 5
en
o ti
a u XJ a u k H
3
03 a, + S o ^r cn 0) o
OJ 04
s 2 — "Bb o ^ a 2 — t- s ^ S = S O fc- -£-C T3 «
Q 3 c
^ S I s e = go . So
8 I S ^ c o.
v .29 g S £ 3 s- .SP g § * w
« -S ° » a a ui o H
S3 H 2 a ^ o T3 * 5J
0} • — — O CO — >
^ " fS ^ u t-1
E
s -S is c i>
1-1 8 I « 2 £--S E o t: M i. s n r. TO
• - Z Q <" I I
§ " J2 ( -S 2 Z -§
•a = ^
£3 -s ^
s in & 'B o\ o o ^
§ g « = p -
o o <u
•8 2 . 1 S D : — fie (D 3 *
£ 3 2
. a l t £ M H
^ I f £ £ -c? s a
- « _T — « T3
b s 2 'c .2 c
1 < *
ST u
ca >
cd
i ^ u u ..
c c = O p >?
£ <a a o S S a-s §• U — "3
its o u S. U u u
•3 S « .& E T3
.1-8 §
j> w a
s I g 1 , 2 ' = 8 ^ 8 - g
ca
ii a ° B 1« u - " b ^ u ^
o a 8 -c t - D <« • —
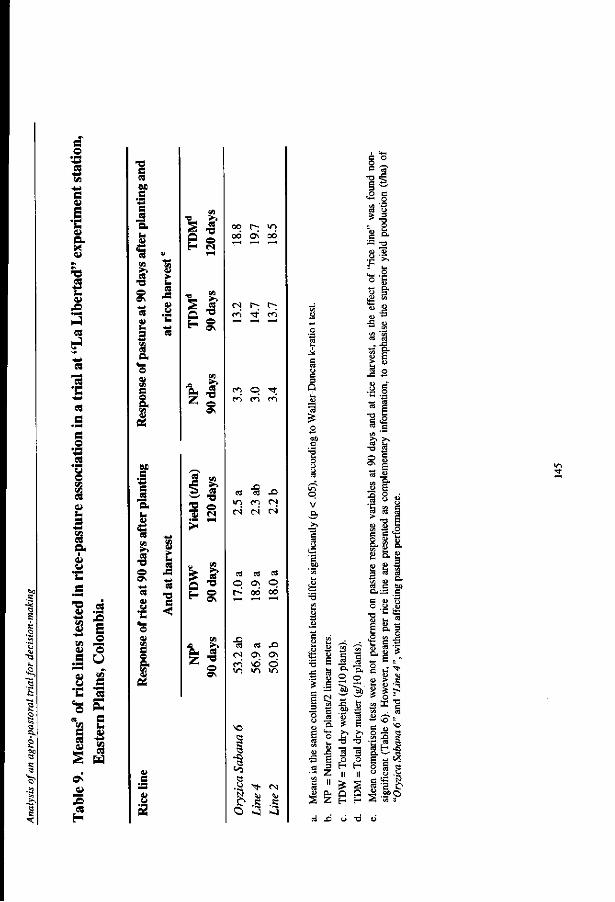
|3
a B
C
'•3
3 a <u E •c a *\ #\ •a 3 S. V
, 0
CS -
CS
"cS "C
cs a
s o
u o Cfl
cs
3 3
u *C a • PM
-a 0> *rf
CJ9 eu
#g
"C CM
O ES
«! s CS
ON
-2 2 CS H
CS
2 E o o U
es S c H
cu CJ9 CS
s M e S3 03
* w ifl
« .a
o v e o
'5 a-
1—I
lb f s
M e
•a _
© A •** 03 « X) V S
•8 -3
o a in v
OS
2 B5
2 ©
©
a- « z - ,
0> B
00 r-; lO 00 0\ 00
CSI t - ; f-; co • * co
co p •<* CO CO CO
X l C3 CS
>o CO
oi oi
x> CN
oi
s v CL
cd ct c3 O ON O r~ oo od
XI 03 t4 X)
CN Os ON
CO vd o m m in
s
O 3
3
2
I
- E o. E o
a a s it
•Kg > P -
; <u °*
: 4> o > y tj>
g E ^ • -g u S i2 « «
•s
S3 a
o ££ 2 u > s
» T3 -3 S h i H O II °
S i 5 * E- 2
- CO
§ s '5 b M O
cs X3 O "D O
Biometrical Applications in Tropical Pasture and Agro-pastoral Research
Conclusions
Results from the present study suggest that:
1. A small-scale, exploratory agro-pastoral trial, conducted early in an agro-pastoral research program, will help eliminate sources of variability in more advanced stages of research. Questions regarding the identification of important experimental factors and levels to be recommended for advanced research stages have been answered by this research study. Also, questions on requirements of resources have been answered, such as variables to be recorded and evaluation ages, thus making the research more cost-efficient.
2. Statistical analyses with methodological objectives play an important role in this preliminary phase of agro-pastoral research as they help focus future research activities.
3. Conclusions regarding the specific objectives of the statistical analysis are:
(a) Experimental factors that significantly affected the competitive capacity and productivity of crops and pastures in association were identified. Also identified were the most appropriate factor levels to be used in advanced research phases. Significant factors, in order of importance, were: a) The type of "Agro-pastoral system", finding that the best agro-pastoral system is a rice-pasture association where rice is planted in rows 34 cm apart independently of the pasture planting system (in the furrow or at broadcast); b) "Rice line", finding that Oryzica Sabana 6 and Line 4 are the best performing rice lines as they maximise rice production without affecting pasture response; c) "Soil preparation techniques", finding that the best way to prepare soil is to use a mouldboard plough as "previous soil preparation technique" and a harrow as "subsequent soil preparation technique". These practices benefit pasture performance in the long term without significantly affecting final rice yield.
(b) Optimal levels of each experimental factor tested, to be recommended for more advanced stages of agro-pastoral research were identified, thus making research more cost-efficient.
(c) The statistical analysis has identified a reduced set of non-correlated response variables, sufficient to quantify and evaluate differences among treatments, thus helping to diminish the use of resources in more advanced stages of agro-pastoral research.
References
Amezquita, M.C.; Pizarro, E. A. and Toledo, J. M, 1990. Range of adaptation of Andropogon gayanus. In: Toledo, J.M. (ed.). Andropogon gayanus Kunth: A grass for tropical acid soils. 37-64. CIAT. Book series ISBN 84-89206-79-1, 406 pp.
Fischer, A. J.; Chatel, M.; Ramirez, H.; Lozano, J. and Guimaraes, E. P., 1994. Components in early competition between upland rice (Oryza sativa) and Brachiaria brizantha. CIAT Annual Report 1994. Cali, Colombia.
146
Analysis of an agro-pastoral trial for decision-making
Guimaraes, E.P.; Sanz, J.I.; Rao, I.M.; Amezquita, M.C. and Amezquita, E. (eds.), 1999. Sistemas Agropastoriles en Sabanas Tropicales de America Latina. Centro Internacional de Agriculture Tropical (CIAT) and Empresa Brasileira de Pesquisa Agropecuaria (EMBRAPA). ISBN 958-694-010-1, 313 pp.
Hotelling, H., 1933. Analysis of a complex of statistical variables into principal components. J. Educ. Psychol. 24: 417-441,498-520.
Patterson, J. G.; Goodchild, N. A. and Boyd, W. J. R., 1978. Classifying environments for sampling purposes, using a principal component analysis of climatic data. Agric. Meteorol. 19(4): 349-362.
Pearson, K., 1901. On lines and planes of closest fit to systems of points in space. Philos. Mag. 6(2): 559-572.
SAS, 1985. SAS User's Guide Statistics, Version 5 Edition. ISBN 0-917382-66-8. SAS Institute Inc., Cary, N.C., U.S.A.
Toledo, J. M.; Amezquita, M. C. and Pizarro, E. A., 1983. Analisis del comportamiento del germoplasma evaluado por la Red Internacional de Evaluacion de Pasturas Tropicales (RIEPT) en los ecosistemas de Sabana y Bosque Tropical de America. In: Pizarro, E. A. (ed.). Red Internacional de Evaluacion de Pasturas Tropicales. 429-447. CIAT. Book series ISSN 0120-4882, 460 pp.
147

Biometrical Applications in Tropical Pasture and Agro-pastoral Research
148

Biometry: Its Role at National Agricultural Research Institutions in Latin America
Chapter 10
Biometry: Its Role at National Agricultural Research Institutions in Latin America'
Maria Cristina Amezquita2
Introduction
Biometricians working in agricultural research organisations in Latin America (LA) face a great challenge in providing a realistic solution to a wide range of problems, making the best use of available methods and hardware/software technology. Modern Biometry was created by Sir R.A. Fisher (1890-1962) to support the needs of agricultural research carried out in temperate zones, to solve the specific problems that British researchers faced at that time. The British, French, Russian and North American biometrics schools have further enhanced the science of Biometry. However, LA countries in the tropical and subtropical zones, face very different needs. Their agricultural research is oriented towards improving human welfare and life quality of low-income people, by increasing land productivity —both in total area planted as in per-unit area— and decreasing production costs of basic human consumption products, such as animal and plant proteins, carbohydrates and fibres. Agricultural research carried out in tropical and subtropical LA face different and site-specific climatic conditions, soil variability, a wide diversity of multiple-cropping systems, a variety of production systems, specific animal breeds, plant species, and plant and animal diseases. The planning, design and analysis of research aimed to increase agricultural production while conserving the natural resource base in tropical America, demand more innovation than just adaptation of techniques used in developed countries.
i Published in: Biometrics Bulletin, 1993. Vol. 10 No. 1, 20-22. This publication is a summary of the Conference offered by the author at the First Meeting of the "International Biometrics Network for Central America, The Caribbean, Colombia and Venezuela", held in Port of Spain, Trinidad, from June 30 to July 3, 1992. Head, Biometry Unit, Centro Internacional de Agriculture Tropical (CIAT). Cali, Colombia.
149
Biometrical Applications in Tropical Pasture and Agro-pastoral Research
The role of Biometry in agricultural research for our tropical and subtropical environments can be summarised as follows. Biometricians should be deeply involved in research partnership with other disciplines: in research planning and design, in presenting new approaches and quantitative methodologies to the problem's solution, in displaying initiative in research data analysis projects that will answer relevant research questions, in the conceptualisation of databases of experimental results, and in providing training to their colleagues from other disciplines in research planning and design, statistical methods and data analysis. They must be encouraged to publish as partners in research teams or individually. Priorities among these functions depend on the institute culture, research needs and biometrician-researcher capacity to interact.
As expressed by Pearce (1983), "... the scientific research process is of a multidisciplinary nature, where minds of different abilities can contribute in endorsing greater generality and applicability of the results. And the biometrician's mind is one of these".
Some agricultural research institutions in LA countries do recognise this role. However, there are factors that negatively affect the full expression of the contribution of Biometry to research —some seem to be common to developed countries, as referred in publications by distinguished British and Belgian biometricians (Finney, 1956; 1978; 1981; Pearce, 1982; Dagnelie, 1982; Preece, 1984; Gower, 1988).
Constraints and Possible Improvements
Institutional organisation and the Biometry Unit
In terms of organisation, agricultural research institutions can be classified as a) centralised research institutions, —with a strong headquarters and regional projects located within the area of mandate— or b) decentralised systems of research centres, with a headquarter responsible for central planning, but each centre being independent in terms of policies, administration of resources and implementation of the research agenda. Most national agricultural research institutions in LA represent examples of the second. EMBRAPA for example, the agricultural research organisation for Brazil, is composed of 31 national centres, each responsible for conducting specific research by agro-ecosystem, by product(s), by discipline(s) or a combination of them (Agricultural Research Centres, 1988, page 109). INTA, the Argentinean National Agricultural Research and Extension Institute, "is organised by national programs responsible for conducting research on main commodities and disciplines: natural resources, crop production, animal production and agricultural economics. It has 15 Regional Centres, 38 experimental stations and 230 extension offices" (Agricultural Research Centres, 1988, page 5). The Dominican Republic agriculture research, coordinated by the Ministry of Agriculture, is conducted through a system of four research centres with geographic mandate: CENDA, CESDA, CEDIA and CIAZA (Agricultural Research Centres, 1988, page 180).
Depending on the institute organisation, the Biometry Unit (a scientific research-support group composed by biometricians and scientific data analysts, formal component of the organigram of an
150
Biometry: Its Role at National Agricultural Research Institutions in Latin America
agricultural research institution) must be strong enough to cope with the needs. The most common situation in LA national institutions is to find a more or less well-provided central Biometry Unit or Group at headquarters, with hardware, software and qualified professionals, leaving regional centres either with one statistician (or "amateur" statistician) and few assistants, or with nobody at all.
Results of a survey conducted by CIAT in 1990, on resources available in the area of Biometry and research data analysis at national agricultural research and development institutions from LA and the Caribbean (Amezquita and Ramirez, 1992), with replies from 17 institutions in 15 countries, show that: a) 15 out of the 17 institutions who replied (88%) had a Biometry Unit or Group at headquarters with a mean size of 7 persons ranging from 1 to 33; 7 of those 15 units (47%) had Ph.D. biometricians, 5 had up to M.Sc. degree (33%) and 3 had B.Sc. level only (20%); b) out of the 15 institutions with a Biometry Unit, only 6 (40%) had additional biometricians in regional centres (with 1 to 3 persons).
For centralised institutions a Biometry Unit at headquarters is useful; however for decentralised institutions, a central Biometry Unit at headquarters with no links with regional centres is not effective: personal communication is difficult; the biometricians are forced to keep contact with researchers by mail, e-mail or telephone; thus causing sometimes an incomplete understanding of the research problem. To function effectively, a multi-skilled team at headquarters with coordinated subgroups at the regional centres is recommended.
Organigram. Reporting lines
For historical reasons, mainly associated with the development of mainframe computing technology in the 60's and 70's, Biometry/data analysis Units, the main users of the institute's computer facilities, have often been made responsible for the provision of computer services to users. This includes provision, administration and control of computer and telecommunication resources as well as users services. There are institutes in which even administrative data processing responsibilities lie within the Biometry Unit. In some institutes, the biometry function may be placed as part of the Computer Centre, the Information Systems Unit or a Data Processing Department, asking the biometricians to report to a computer specialist, who might give higher priority to machine or software performance than to research quality. In others, the biometry function is placed as part of General Support Services, whose head is not required to have an understanding of biological research. These reporting lines can be extremely frustrating for a creative biometrician, who sees his/her profession directly involved with the research process, but finds lack of understanding from the direct superiors. Although the Biometry Unit is an intensive user of the Computer Centre, a clear distinction of objectives, responsibilities, clients, human resources and reporting lines needs to be defined. Results from the survey show that in 7 institutes out of 15 (47%) an independent Biometry Unit performs the biometry function, and in one institute (7%) it is placed within research projects. However, in 6 institutes (40%) it is placed within the Computer Centre or Data Processing Department and in one institute (7%) it is placed within General Support Services. Given its natural involvement with the research process, it is vital for the Biometry Unit to keep close links with research, reporting ideally to the Research Director.
151

Biometrical Applications in Tropical Pasture and Agro-pastoral Research
The Institute's research agenda. Responsibilities assigned to the biometrician
Agricultural research institutions in LA can be commodity-oriented, discipline-oriented or a combination of both. Many of them, as already documented, are responsible for conducting research on a large number of crops and activities of relative priority to the country's economy. The Biometry Unit, if it exists, is normally under funded. A small group of biometricians and scientific data analysts is responsible for providing support to a wide variety of biometrics problems formulated by scientists. Under these circumstances, the biometrician becomes a data processing machine with no time to think and understand the inner complexities of the research problems he/she is faced with. Survey results indicate that at over 80% of the institutions surveyed, the biometrician's main task is statistical programming or routine data analysis support. With limited availability of biometricians at the institute, it would be wiser to select a few areas of research where biometrics support is considered very necessary, and assign those limited human resources to them, encouraging biometricians to engage in collaborative methodological research and relevant research data analysis studies with agricultural scientists.
A lot has been said about the value of information as a decision-making tool. Modern computer technology is now available in many developing countries. The survey shows that national agricultural research institutes in LA have good network and microcomputer versions of statistical and database management software packages. Network or micro SAS or SPSS exist at 60% of the institutions surveyed, all the others have a variety of microcomputer statistical software; ORACLE and SQL/DS are used for research database management at 18% of the institutions surveyed and DBASE at 76% of them; statistical graphics software as a tool for the preliminary analysis of research data is utilised in 76% of the institutions who replied. However, significant portions of scientific information produced for years still remain unanalysed. Perhaps the researchers do not have enough time or the biometricians do not have the initiative. It needs to be emphasised that the analysis of historical research information to help decision-making in research is one of the most important contributions of biometricians. Meta analysis, for example, plays an important role in this context. Every effort should be made to implement this successfully.
Researcher-biometrician communication
The biometrician has to keep all communication channels open; be appreciative of other disciplines and try to be always on the user's side. Good interdisciplinary communication is a key element for success. Misunderstanding and wrong attitudes in the researcher-biometrician communication, contributing to an under-utilisation of mathematicians, statisticians and computers in the research process in the U.K. have been analysed by Finney (1978, 1981). He describes the researcher-biometrician relationship, as "variations of the master-servant attitude". This also happens in our institutions when: a) biometry advice and support are regarded as a service function, and b) when there is a lack of appreciation or experience from the biometrician on devising a suitable solution for the given problem. The researcher then does not look for statistical advice but tells the biometrician to statistically prove (or disprove) the conclusions already drawn in his mind. Preece (1984) presents examples of serious problems in experimental planning and design, data recording, data analysis and reporting in some research institutions in The Caribbean. His recommendations for
152
Biometry: Its Role at National Agricultural Research Institutions in Latin America
improving biometrics expertise in those countries include the strengthening of training programs in applied statistics; to encourage researchers to think and understand the real meaning and biological or environmental implications of statistical assumptions; and finally, to encourage the participation of biometricians in management boards. I agree with his recommendations.
Availability of qualified personnel
LA countries present an enormous heterogeneity in this respect: many offer graduate and post-graduate programs for training research scientists, mathematicians, statisticians and computer scientists; others don't. As reported by University of Sao Paulo (1990), this University offers a Ph.D. degree in Statistics; Ph.D. degrees in System's Engineering or Computer Sciences are available at 7 other universities in Brazil. The Universidad Iberoamericana de Postgrado (1990) lists 10 M.Sc. programs in Statistics or Mathematical Statistics and 22 M.Sc. programs in Systems Engineering/Computer Science offered by LA universities in Argentina, Brazil, Colombia, Mexico and Peru. Recent post-graduate programs include a Specialisation in Statistical Methods, offered by Universidad Veracruzana de Mejico, Mexico; a Master Program in Applied Statistics offered by the Faculty of Agricultural Sciences and the Faculty of Economics at Universidad de Cordoba, Argentina; and a Ph.D. program in Mathematics and Statistics recendy offered by Universidad Nacional de Colombia, in Bogota. Internationally, one can search for statistics related information, such as Academic Statistics, Datamining and Stockmarket, through Internet, at http://www.statoo.com. Links of a statistical nature can be submitted to this website.
Universities in various LA countries offer latest methodologies and technologies. However, a big limitation is the small number of qualified biometricians available to serve the agricultural research sector.
A senior biometrician for a LA agricultural research institution needs to be either a statistician or mathematician by profession with a solid understanding and practical experience in agricultural/biological research, or an experienced agronomist/biologist with solid training in Statistics. Once an institution has a good senior biometrician, he/she should receive full institutional support and motivation to carry out this important research function.
Conclusions
The desired role of the biometrician for LA countries as a true partner in research teams has been described. In order to achieve this goal, specific recommendations are: a) The Biometry Unit should report to the institute's Research Director; b) the biometrician needs to gain credibility among researchers and upper management, based on high quality and excellent teamwork; c) if biometry personnel were scarce it would be wise to concentrate them in areas of higher demand for biometrical support; d) biometricians should be always ready to learn about new innovations in statistical methods and statistical/data management software, about the true nature of the biological problem under concern, and keep a positive and flexible attitude; and e) if the agricultural research sector needs qualified biometricians, they should be offered intellectual challenges and professional
153
Biometrical Applications in Tropical Pasture and Agro-pastoral Research
development opportunities as partners in research teams. This would facilitate to make the best use of the biometrician capacity to contribute for the benefit of agricultural research in our countries.
References
Agricultural Research Centres, 1988. A World Directory of Organisations and Programs. Eighth Edition. Vol 1. 5, 109, 180. Longman. Harlow, Essex, U.K.
Amezquita, M.C. and Ramirez, G., 1992. Resources available in the area of Biometry and research data analysis at National Agricultural Research and Development Institutions from Latin America and The Caribbean. Conference presented at the First Meeting of the International Biometrics Network for Central America, The Caribbean, Colombia and Venezuela, held in Port of Spain, Trinidad, from June 30 to July 3.
Biometrics Bulletin, 1993. Vol. 10, No.l. The Biometric Society. ISSN 8750-0434. Alexandria, VA., U.S.A.
Dagnelie, P., 1982. La Biometrie dans les pays du Tiers Monde. In: Actes de la XI Conference Internationale de Biometrie. Versailles, France.
Finney, D. J., 1956. The Statistician and the planning of field experiments. Journal of the Royal Statistical Society. Al 19: 1-27.
Finney, D. J., 1978. Statistics and Statisticians in Agricultural Research. Journal of Agricultural Sciences. Cambridge. 91:653-659.
Finney, D. J., 1981. The misuse of mathematicians, statisticians and computers in agricultural research. Experimental Agriculture, Vol. 17: 345-353.
Gower, J. C , 1988. Statistics in Agriculture. Journal of the Royal Statistical Society. A 151, Part I, 179-200.
Pearce, S. C , 1982. Biometrical techniques relevant to the third world. In: Actes de la XI Conference Internationale de Biometrie. Versailles, France.
Pearce, S. C , 1983. The Agricultural Field Experiment: A statistical examination of theory and practice. Chichester, England. John Wiley. 335 pp.
Preece, D. A., 1984. The Consultant's Forum. Biometry in the Third World: Science not Ritual. Biometrics 40: 519-523.
University of Sao Paulo, 1990. Catalogo de cursos de Mestrado e Doutorado do Brasil. Sao Paulo, Brazil.
Universidad Iberoamericana de Postgrado, 1990. Catalogo General de Cursos de Postgrado. Salamanca, Espafia.
154
Summary
Summary Agricultural land of Tropical Latin America (TLA) consists of 548 million ha that represent 32.5% of its territory and 11.3% of the world agricultural land. Out of the total TLA's population, of 431.5 million inhabitants, 100.3 millions (23.2%) are farmers, who live from agricultural and livestock production activities. Pasture (both native and introduced) and agro-pastoral land represent 77.4% of total agricultural land, while crops cover the remaining 22.6%, with a pastures/crop land ratio of 3.4, higher than the world ratio, of 2.3. TLA holds 21.2% of the world's cattle inventory and 17.9% of the world's inventory of lactating cows.
However, soil and pasture quality in the predominant pasture and agro-pastoral land in the region are low. Levels of meat and milk production in the region (of 9 and 42 million metric tons, respectively) are relatively low compared to world averages, representing 16.7% and 9.0%, respectively, of the total world production of meat and milk. Extensive grazing systems for beef cattle on native savanna grasslands with low productivity are predominant in the Savanna Ecosystem (250 million ha, representing 14.8% of TLA total continental area). Semi-intensive grazing systems for dual-purpose cattle are predominant in the Tropical Forest Ecosystem (44 million ha, representing 2.6% of TLA total continental area). Dual-purpose cattle production systems account for 78% of the meat and 41% of the milk produced in TLA. In these production systems, the largest source of animal nutrition comes from native or introduced grass pastures, which often present limited quantities and quality of biomass, especially during the dry season. As a result, recovered milk production in dual-purpose systems (2 to 4 litres/cow per day) and reproductive efficiency (50%-60%) of the herds are low.
The relatively low cost of the beef and milk produced from such systems has led them to become important components in the diet of most tropical Latin Americans. Beef consumption in TLA ranges from 7 to 38 kg/capita/year, while in other tropical regions of the world it ranges from 0.7 to 2.6 kg/capita/year (Southeast Asia) and from 3.6 to 9.6 kg/capita/year (tropical Africa). The proportion of a family expenditure in milk and meat is high in most Latin American cities, even among the poor, ranging from 12.4%-26.0% for beef and from 7.0%-13.0% for milk and dairy products in the lowest income quartile. Increase in supply of meat and milk will benefit the poor. Beef and milk in TLA have important socio-economic significance. Price increases cause increased inflation rates and social unrest.
The relatively low actual levels of meat and milk production, in spite of the high proportion of available pasture and agro-pastoral land, constitute a challenge for TLA countries. They need to increase economic development, employment rates and human welfare through increasing pasture and agro-pastoral systems productivity of meat and milk to become competitive both in local and export markets.
Major constraints to pasture and agro-pastoral systems development in TLA's lowlands, and therefore, to improved and sustainable meat and milk production, are: (a) the predominance of acid and infertile soils where native grasslands of low nutritional quality occur, causing these
155
Biometrical Applications in Tropical Pasture and Agro-pastoral Research
vast land resources to be under-utilised; (b) the lack of adaptation to these acid and infertile soils, or lack of tolerance to biotic stresses, of commercial cultivars of tropical pastures selected in other continents; (c) the high diversity in ecosystems, farming systems and germplasm/parasite interactions which requires different kinds of adapted pastures and crops playing several roles at the farm level; (d) lack of efficient and sustainable use of existing or improved animal genetics; (e) lack of use of improved management practices at the farm, in terms of farm administration, pasture and animal management; (f) high fluctuations in the product-input price ratio (the product's price refers to price of meat and milk, and the input's price refers to price of land, labour, fertilisers, seeds, mineral salt, drugs, machinery, etc); (g) limited country infrastructure and difficult access to markets for meat and milk products.
International and national research in tropical pasture and agro-pastoral systems for TLA in the last 30 years has been led by CIAT (Centro Internacional de Agricultura Tropical, or International Centre for Tropical Agriculture, based in Cali, Colombia), and by the National Agricultural Research and Development Institutions (NARDI's) from each country. They led a demand-driven problem-solving research agenda, aimed at increased land and animal productivity, improved socio-economic conditions of the population, especially the poor, improved human welfare, and efficient conservation, management and use of the natural resource base of our continent. Research strategy is based on the following principles: (1) germplasm base development; (2) low-input technology; (3) use of improved pasture and agro-pastoral technology in farm systems; and (4) networking approach. Research has focussed on the two major ecosystems of TLA's lowlands: the Savanna and the Tropical Forest.
The object of this dissertation is to illustrate, through selected Case Studies, the contribution of Biometry to pasture and agro-pastoral research in TLA in the last two decades. Its contribution is represented in research concepts, research methodology, and practical research results, aimed at the above mentioned goals. The selected Case Studies were conducted in various TLA countries, on the above mentioned ecosystems. Each Case Study was part of the research agenda and strategy of CIAT, the RIEPT (Red Internacional de Evaluation de Pasturas Tropicales, or International Network for Tropical Pastures Evaluation), the Agro-pastoral Research Network for the Savanna Ecosystem of Tropical America, or pasture and agro-pastoral research programs from Latin America (LA) NARDI's.
The Case Studies are presented according to the successive research phases of pasture and agro-pastoral research for TLA. They are grouped, therefore, in three main research topics: (1) Agronomic characterisation, evaluation and selection of forage germplasm (chapters 3 and 4); (2) Grazing experiments for beef and dual-purpose cattle production (chapters 5, 6 and 7); and (3) Methodological aspects of agro-pastoral research (chapters 8 and 9). Each illustrates a real research problem that has been solved by applying biometrical rationale and methods. Chapter 2 is of a conceptual nature. It summarises the role of Biometry in pasture and agro-pastoral research. Chapter 10 deals with organisation and resources of Biometry Units and groups in LA Agricultural Research Institutions and offers practical recommendations concerning the desired role of the biometrician as a partner in research teams.
156

Summary
The case study presented in chapter 3 has identified promising forage grass and legume ecotypes for the Savanna and Forest Ecosystems of TLA. Results achieved indicate that a high correlation exists between adaptability and productivity of an ecotype. They suggest that well adapted ecotypes, that is, ecotypes not facing soil, climatic, or biotic limitations, can better express their genetic production potential than those facing restrictions, which would lead them to behave uniformly at their lowest level. Results from the analysis on well-drained isohyperthermic tropical savannas define S. capitata as the legume species with best adaptation to that ecosystem, its most productive accessions being CIAT 1315, 1318, 1342, 1405, 1693, and 1728. Among the grasses, A. gayanus CIAT 621 and B. decumbens CIAT 606 were highly productive and showed good adaptation. Results from the analysis on the tropical forest ecosystem identified S. guianensis CIAT 136 and 184 as legumes with high productivity and adaptability. Also Zornia latifolia CIAT 728, S. capitata 1097, and Desmodium ovalifolium CIAT 350 scored highly. These materials were recommended to be advanced to RIEPT grazing trials evaluation. The analysis of variance with materials common to both ecosystems (isohyperthermic savannas and tropical forest) shows a significantly higher productivity, both in grasses and legumes, in the tropical forest ecosystem, except for the case of legumes during the maximum rainfall season, where no significant difference in productivity between the two ecosystems was detected. The larger differences in productivity among locations than among ecosystems, point-out the need to separate ecosystems by using other parameters besides climatic ones, which will help explain germplasm performance more accurately.
The case study presented in chapter 4 defined the range of adaptation, across the Tropical Forest Ecosystem, of Stylosanthes guianensis CIAT 184, released in 1985 as cv. "Pucallpa" by rVITA (Instituto Veterinario de Investigaciones Tropicales y de Altura) and INIPA (Instituto Nacional de Investigation y Promotion Agropecuaria) in Peru, and in 1995 as cv. "Stylo" in the Philippines. Data from 32 agronomic trials conducted by RIEPT between Mexico and Bolivia were used. The analysis shows that cv. Pucallpa is tolerant to anthracnose under a wide range of soil, climate and locations; the cultivar is better adapted to low altitudes (< 850 m.a.s.l.), on soils that are acid (pH < 5.0), which have low levels of organic matter (< 3.4%), are moderately sandy (18-56% sand), and which receive rainfall accumulated in 12 weeks > 800 mm. At higher altitudes (> 1000 m.a.s.l.), the cultivar appears to respond to higher levels of soil organic matter. In general, cv. Pucallpa shows tolerance to anthracnose and excellent adaptation to humid forest conditions in TLA.
The case study presented in chapter 5 shows that grazing trials are costly, lengthy and difficult to modify once begun. Therefore, they are only used for well defined purposes, such as for the final assessment of selected pastures that have succeeded in previous evaluation stages, or for testing grazing management practices, such as stocking rates or breed differences, defining precise objectives, appropriate experimental designs, and measuring response variables that are relevant to the hypotheses. It is recommended that an experimental plan is written, setting-out objectives, experimental design, experimental unit (paddock size, herd size and type of experimental animals), response variables, field plan, costs of seed, pasture establishment, trial implementation, and statistical analysis methodology. In planning a grazing trial, it is important to consider five main sources of variability: land type, climate (year and season variability), type of pasture, animal factors, and measurement techniques for response variables. Recognising and controlling variability in these factors brings greater accuracy and capacity for generalising experimental results. Before
157
Biometrical Applications in Tropical Pasture and Agro-pastoral Research
selecting the experimental design that will be used, it is wise to analyse differences between continuous and change-over designs with regard to the type of treatment effect that each allows to estimate, to the magnitude of experimental error, and to the capacity of the design to control fluctuations in animal performance in time.
The single-farm case study presented in chapter 6 produced results that are expected to serve researchers in the planning of on-farm experiments, and producers for their decision-making. Results attained by this study include: • The identification of the most productive animal genotype for the specific environment and
farm management represented by this farm. Results show that, in terms of milk production, the performance of genetic groups 3/4 and 5/8 B. taurus was statistically similar to that of group 4/4 (pure B. taurus), and significantly surpassed that of genetic groups 1/2, 3/8, and 1/4. In terms of reproductive performance and calf weight, animal genotypes did not differ statistically from each other. Therefore, cows belonging to genetic groups 3/4 or 5/8 B. taurus are shown to be the ideal animal genotype for this type of dual-purpose production system.
• The identification of sources of variation that significantly affected animal production parameters. In order of relative importance, they were: "genetic group", accounting for 23.7% and 25.9%, respectively, of the total variability in length of lactation per cow and daily milk production per lactation per cow; "year of parturition", accounting for 10.8% of the total variability in daily milk production per lactation per cow, and for 15.3% of the total variability in calf weight at birth; and "breed type", accounting for 10.3% of the total variability in daily milk production per lactation per cow.
This study clearly illustrates the importance, for on-farm research and for farm-management decisions, of recording complete data for each animal, production indices for the herd, and records of animal health, animal management and of supplements provided.
The case study presented in chapter 7 evaluated and prioritised sources of variation in milk production and composition of Holstein and Holstein-Zebu crosses, using data generated by 15 sequential grazing trials, all using a Multiple (3x3) Latin Square Change-Over Design, conducted at CIAT Quilichao Experimental Station between 1992 and 1995. Sources of variation studied were: legume presence in the pasture, cows' breed, lactation stage, seasonal period, and days of grazing. N-fertiliser application to the grass was also considered as source of variation in milk urea N (MUN). The effect of the rotation sequence and adjustment period (days) on milk production were also studied. The results of this study led to the following conclusions and methodological recommendations for future pasture evaluation on dual-purpose farms: • Sources of variation found to significantly affect milk production were, in order of
importance, cow's breed, cow's lactation stage, legume presence in the pasture, and season. Sources of variation on milk composition were N-fertilisation to the grass, presence of legumes in the pasture, season and cow's breed (for MUN), and cow's lactation stage and cow's breed (for fat content).
• When interpreting milk production data obtained from farms with different pastures, animal effects (breed and lactation stage, both in rainy and dry seasons) should be isolated.
158
Summary
• The Multiple Latin Square Change-Over Design has proven useful to test new pastures with dual-purpose cows at the Experiment Station. This design may be a feasible option for testing new pastures with dual-purpose cows at the farm level.
• Milk measurements in evaluated pastures should be made after a minimum of 7 days of adjustment, especially when cows are moved from pastures with better forage attributes (for example, from grass/legume pasture) to a pasture with limited forage attributes (e.g., a grass-only or a traditional pasture).
• To organise the cows' adjustment phase, the pastures under evaluation must be divided into equal parts, using, if possible, electric fences to reduce costs.
• Frequency of milk measurements will depend on the cow's production potential and on the quantity and quality of pasture biomass of each farm. For cows with high or intermediate milk production potential (5 to 10 litres), production should be measured at the beginning, middle, and end of grazing (after the adjustment period), especially in pastures with limited forage quantity and quality (e.g., a grass-only or a traditional pasture). For cows with low milk production potential (3 to 5 litres), production should be measured at the beginning and end of grazing (after the adjustment period), regardless of pasture conditions.
• The strategic design of supplementation and the retrospective interpretation of milk production from different farm pastures may include the measurement of MUN. This measurement should be taken, at least, at the beginning and end of grazing in individual samples taken at milking and before supplements are provided.
The case studies presented in chapters 8 and 9 provide concepts, methodologies, research results and practical recommendations concerning the planning, design, conduction, and analysis of agro-pastoral experiments (pasture-crop associations, pasture-crop rotations and crop rotations) for the Savanna Ecosystem. Compared with research on pastures alone, agro-pastoral research is more complex as it also requires research on individual components: the soil, one or more short-cycle crops, one or more pastures, and the animal herd. This requires that methodological aspects of agro-pastoral trials should be studied in depth: research phases and their objectives; planning and design of experiments to be conducted in each phase; evaluation and data analysis. Thus, standard methodology can be defined, making it possible to share, compare and extrapolate the results obtained by TLA countries (Bolivia, Brazil, Colombia, Guyana and Venezuela) currently conducting research in this area.
Chapter 8 discusses methodological aspects and provides recommendations for agro-pastoral research aimed at testing relevant hypotheses for the well-drained tropical savannas. Different phases of agro-pastoral research are identified. Methodological aspects for the planning and design of trials are discussed (experimental factors, control treatments, experimental unit, type of experimental design, response variables, experimental period). Practical recommendations are offered concerning planning, design and implementation of trials studying the three prevailing types of agro-pastoral systems in the Savanna Ecosystem: pasture-crop associations, pasture-crop rotations and crop rotations.
Results from case study presented in chapter 9 on rice-pasture associations for acid savanna soils allow the following conclusions:
159
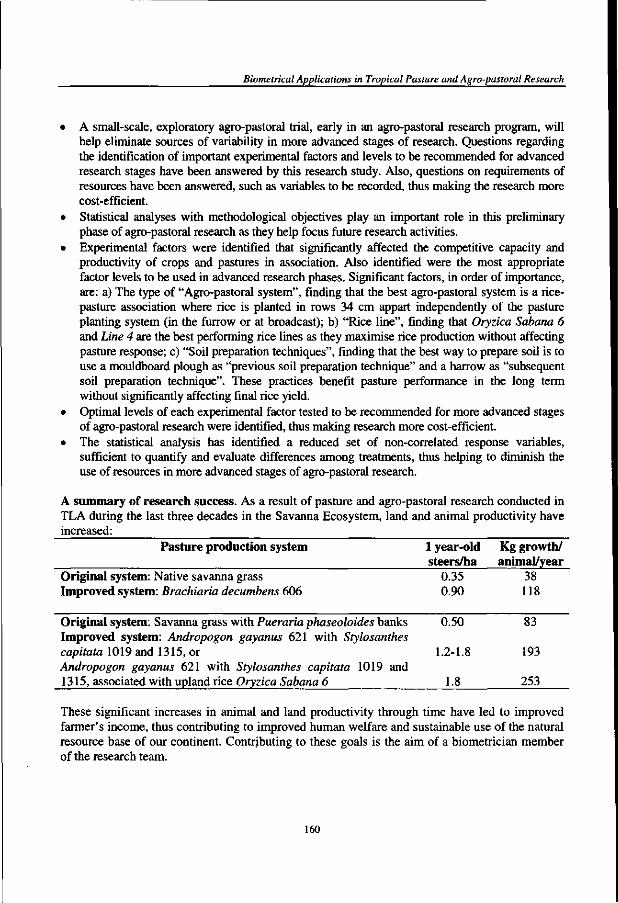
Biometrical Applications in Tropical Pasture and Agro-pastoral Research
• A small-scale, exploratory agro-pastoral trial, early in an agro-pastoral research program, will help eliminate sources of variability in more advanced stages of research. Questions regarding the identification of important experimental factors and levels to be recommended for advanced research stages have been answered by this research study. Also, questions on requirements of resources have been answered, such as variables to be recorded, thus making the research more cost-efficient.
• Statistical analyses with methodological objectives play an important role in this preliminary phase of agro-pastoral research as they help focus future research activities.
• Experimental factors were identified that significantly affected the competitive capacity and productivity of crops and pastures in association. Also identified were the most appropriate factor levels to be used in advanced research phases. Significant factors, in order of importance, are: a) The type of "Agro-pastoral system", finding that the best agro-pastoral system is a rice-pasture association where rice is planted in rows 34 cm appart independently of the pasture planting system (in the furrow or at broadcast); b) "Rice line", finding that Oryzica Sabana 6 and Line 4 are the best performing rice lines as they maximise rice production without affecting pasture response; c) "Soil preparation techniques", finding that the best way to prepare soil is to use a mouldboard plough as "previous soil preparation technique" and a harrow as "subsequent soil preparation technique". These practices benefit pasture performance in the long term without significantly affecting final rice yield.
• Optimal levels of each experimental factor tested to be recommended for more advanced stages of agro-pastoral research were identified, thus making research more cost-efficient.
• The statistical analysis has identified a reduced set of non-correlated response variables, sufficient to quantify and evaluate differences among treatments, thus helping to diminish the use of resources in more advanced stages of agro-pastoral research.
A summary of research success. As a result of pasture and agro-pastoral research conducted in TLA during the last three decades in the Savanna Ecosystem, land and animal productivity have increased:
Pasture production system 1 year-old Kg growth/ steers/ha animal/year
Original system: Native savanna grass 0.35 38 Improved system: Brachiaria decumbens 606 0.90 118
Original system: Savanna grass with Pueraria phaseoloides banks 0.50 83 Improved system: Andropogon gayanus 621 with Stylosanthes capitata 1019 and 1315, or 1.2-1.8 193 Andropogon gayanus 621 with Stylosanthes capitata 1019 and 1315, associated with upland rice Oryzica Sabana 6 L8 253
These significant increases in animal and land productivity through time have led to improved farmer's income, thus contributing to improved human welfare and sustainable use of the natural resource base of our continent. Contributing to these goals is the aim of a biometrician member of the research team.
160

Summary
Samenvatting Tropisch Latijns Amerika (TLA) bestaat voor 32,5 % (548 miljoen ha) uit landbouwgronden, hetgeen overeenkomt met 11,3% van de landbouwgronden in de wereld. Van de totale bevolking van 431,5 miljoen houdt 23,2 % zich bezig met landbouw en veeteelt. Het areaal van inheems en aangelegd grasland en agro-pastoraal land omvat 77,4% van de landbouwgronden, de rest wordt gebruikt voor gewassen. De verhouding grasland/bouwland is 3,4 in vergelijking met 2,3 op wereldschaal. In TLA komt 21,2% van het totale rundvee en 17,9% van het melkvee in de wereld voor. Echter, de bodem, het grasland en agro-pastoraal land in TLA zijn overwegend van lage kwaliteit. Vlees- en melkproductie (respectievelijk 9 and 42 miljoen ton) zijn relatief laag in vergelijking met wereldcijfers (16,7% en 9,0%, respectievelijk). Extensieve beweidingsystemen voor rundvleesvee overwegen in het Savanne Ecosysteem (250 miljoen ha, of 14,8% van het totale landoppervlak van TLA). Semi-intensieve beweidingsystemen voor gecombineerd vlees-melkvee overwegen in het Tropisch Woud Ecosysteem (44 miljoen ha, of 2,6% van het totale landoppervlak van TLA) en produceert 78% van het vlees en 41% van de melk in TLA. De belangrijkste bron van de dierlijke voeding is het inheemse en aangelegd grasland met beperkte hoeveelheden en kwaliteit voer, vooral gedurende het droge seizoen, met als gevolg dat behaalde melkproductie van het gecombineerd vlees-melkvee (2 tot 4 liter/koe per dag) en de vruchtbaarheid van de kuddes (50%-60%) laag zijn.
De relatief lage kosten van rundvlees en melk hebben ertoe geleid dat zij belangrijke componenten van het dieet vormen van de meeste Latijns Amerikanen. Rundvleesconsumptie in TLA varieert van 7 tot 38 kg/hoofd/jaar, in vergelijking met 0,7 tot 2,6 kg/hoofd/jaar in Zuidoost Azie en 3,6 tot 9,6 kg/hoofd/jaar in tropisch Afrika. Het percentage van de gezinsuitgaven voor melk en vlees is hoog in de meeste Latijns Amerikaanse steden, zelfs onder de armen, varierend van 12,4% tot 26,0% voor rundvlees en van 7,0%-13,0% voor melk en zuivelproducten in het laagste inkomens kwartiel. Meer melk en vlees productie zal de arme bevolkingsgroep ten goede komen. Zij zijn van grote sociaal-economische betekenis in TLA. Prijsverhogingen veroorzaken hogere inflatie en sociale onrust.
De relatief lage niveaus van rundvlees- en melkproductie, ondanks het grote percentage aan beschikbaar gras- en agro-pastoraal land vormen een uitdaging voor TLA landen. Zij moeten economische ontwikkeling, werkgelegenheid en welvaart bevorderen door de productiviteit van de veehouderij te verhogen, zodat deze concurrerend wordt op de locale en exportmarkten.
Belangrijke beperkingen van deze productiesystemen in TLA zijn: (a) de overwegend zure en onvruchtbare gronden (b) het gebrek aan aanpassing aan deze zure onvruchtbare gronden en het gebrek aan tolerantie voor biotische stress van de beschikbare rassen van graslandplanten (c) de grote diversiteit in ecosystemen, bedrijfssysteem en plantmateriaal/parasiet interacties van verschillende soorten; (d) onvoldoende efficient en duurzaam gebruik van bestaand of verbeterd genetisch diermateriaal; (e) onvoldoende toepassing van verbeterd management op het bedrijf, zoals bedrijfsadministratie en grasland- en veemanagement; (f) grote fluctuaties in de product-
161
Biometrical Applications in Tropical Pasture and Agro-pastoral Research
input prijsverhouding (g) onvoldoende infrastructuur en moeilijke toegang tot markten voor rundvlees en melk.
Internationaal and nationaal onderzoek in tropisch grasland en agro-pastorale systemen voor TLA in de afgelopen 30 jaren werd geleid door CIAT (Centro Internacional de Agricultura Tropical, gevestigd in Cali, Colombia), en door de Nationale Landbouwkundige Onderzoek- en Ontwikkelingsinstituten van elk land. De onderzoekstrategie is vraag-geleid en probleemgericht, met het doel de productiviteit van het land en het rundvee te verhogen, om de sociaal-economische omstandigheden van de bevolking, speciaal de armen, te verbeteren, alsmede een efficient behoud, management en gebruik van de natuurlijke hulpbronnen van het continent te bevorderen. De onderzoekstrategie is gebaseerd op de volgende principes: (1) ontwikkeling van verbeterd uitgangsmateriaal; (2) low-input technologie; (3) verbeterd grasland en agro-pastorale technologie in bedrijfssysteem en (4) netwerkbenadering.
De opzet van dit proefschrift is om door middel van geselecteerde studies te illustreren wat de bijdrage van biometrie is geweest aan het grasland en agro-pastoraal onderzoek in TLA in de afgelopen 20 jaar. Deze bijdrage bestaat uit onderzoekontwerpen, -methoden en practische resultaten ter ondersteuning van boven omschreven onderzoekstrategie. De geselecteerde studies werden uitgevoerd in verschillende TLA landen.
De studies zijn gegroepeerd in drie hoofdthema's: (1) landbouwkundige beschrijving, evaluatie en selectie van ruwvoederuitgangsmateriaal (hoofdstukken 3 en 4); (2) beweidingproeven voor rundvlees en gecombineerd vlees-melkvee productie (hoofdstukken 5, 6 en 7) en (3) methodologische aspecten van agro-pastoraal onderzoek (hoofdstukken 8 en 9). Elk hoofdstuk illustreert een bestaand onderzoekprobleem, dat opgelost is door de toepassing van biometrische uitgangspunten en methoden. Hoofdstuk 2 is een samenvatting van de rol van de biometrie in het grasland en agro-pastoraal onderzoek Hoofdstuk 10 gaat over de organisatie en faciliteiten van biometrie afdelingen en groepen in TLA landbouwkundige onderzoekinstituten en biedt practische aanbevelingen over de rol van de biometricus als partner in onderzoekgroepen.
Hoofdstuk 3 heeft als belangrijkste doel de identificatie van veelbelovende voedergras en -leguminosen ecotypen. Er was een hoge correlatie tussen aanpassingsvermogen en productiviteit van een ecotype. Goed aangepaste ecotypen, dat wil zeggen, ecotypen die niet worden beperkt door bodem, klimatologische of biotische beperkingen kunnen hun genetische aanleg beter tot expressie brengen dan ecotypen die niet goed zijn aangepast, hetgeen er toe leidt dat die zich uniform aanpassen aan het laagste niveau. Op goed gedraineerde isohyperthermische tropische savannes was Sylosanthes capitata de leguminosensoort met de beste aanpassing aan het ecosysteem. Van de grassen waren Andropogon gayanus CIAT 621 en Brachiaria decumbens CIAT 606 de hoog productieven met goede aanpassing. Voor the tropisch woud ecosysteem had S. guianensis (CIAT 136 and 184) een hoge productiviteit en aanpassingsvermogen. Ook Zornia latifolia CIAT 728, S. capitata 1097, en Desmodium ovalifolium CIAT 350 scoorden hoog. De variantie analyse met accessies die in beide ecosystemen werden getoetst toonde een significant hogere productiviteit voor zowel grassen als leguminosen, in het tropisch woud ecosysteem, behalve voor de leguminosen in het natte seizoen die geen significant verschil vertoonden in de twee ecosystemen.
162
Summary
De grote verschillen in productiviteit tussen locaties van grotere of kleinere grootte dan tussen ecosystemen duiden op de noodzaak om ecosystemen te scheiden door andere dan klimatologische parameters toe te passen, zodat het gedrag van genetisch materiaal nauwkeuriger kan worden verklaard.
Hoofdstuk 4 behandelt de aanpassing in het tropisch woud ecosysteem, van Stylosanthes guianensis CIAT 184 cv. Pucallpa in de vochtige tropen tussen Mexico en Bolivia. Deze cultivar is tolerant tegen anthracnose over een brede variatie in bodem, klimaat en locatie; de cultivar is beter aangepast aan lage hoogten (< 850 m boven zeeniveau), aan zure gronden (pH < 5.0), met lage organische stof gehalten (< 3.4%), die matig zanderig zijn (18-56% zand), en aan regenval over een periode van 12 weken > 800 mm. Op grotere hoogten (> 1000 m boven zeeniveau), blijkt de cultivar positief te reageren op hogere gehalten aan organische stof in de grond.
Hoofdstuk 5 maakt duidelijk dat beweidingproeven duur zijn, lang duren en moeilijk te veranderen zijn nadat ze zijn begonnen. Daarom worden ze alleen toegepast voor duidelijk omschreven doelen, zoals voor de eindfase in de evaluatie van geselecteerde graslanden die eerdere evaluatie fasen hebben doorstaan, of voor het toetsen van beweidingmanagement opties, zoals beweidingdichtheden of veerassen. Hiervoor is het nodig om de doelstellingen precies te definieren, de juiste proefopzetten te gebruiken en variabelen te meten die relevant zijn voor de gestelde hypothesen. Een proefplan moet bevatten: de doelstellingen, het experimentele ontwerp, de experimentele eenheden (perceelsgrootte, omvang van de kudde en het type proefdier), responsie variabelen, plattegrond, zaadkosten, graslandaanleg, proef implementatie, en methode van statistische analyse. In de planning van een beweidingproef is het belangrijk om vijf belangrijke oorzaken van variabiliteit onder ogen te zien: type land, klimaat (jaar en seizoensvariabiliteit), type grasland, dier factoren, en meettechnieken voor responsie variabelen. Het kennen en beheersen van variabiliteit in deze factoren geeft grotere nauwkeurigheid en mogelijkheden om de experimentele resultaten te generaliseren. Voordat het experimentele ontwerp wordt geselecteerd, is het verstandig om verschillen tussen continue en "change-over" ontwerpen te analyseren ten aanzien van de mogelijkheid om voor elk behandelingseffect de grootte van de experimentele fout te schatten en voor de mogelijkheid van het ontwerp om fluctuaties te beheersen in dierlijke productiviteit over tijd.
Hoofdstuk 6 beschrijft ontwerpen van proeven op het bedrijf en dient mede om boeren te helpen bij hun bedrijfsvoering. De resultaten van deze studie zijn onder meer: • het bepalen van het meest productieve genotype dier voor de specifieke omgeving en het
bedrijfsmanagement van het betreffende bedrijf. Resultaten tonen aan dat qua melkproductie genetische groepen 3/4 en 5/8 B. taurus statistisch vergelijkbaar zijn met groep 4/4 (zuivere B. taurus), en significant hoger dan genetische groepen 1/2, 3/8, and 1/4. Voor reproductie en kalfgewicht waren er geen statistische verschillen tussen genotypen. Dus, koeien behorende tot de genetische groepen 3/4 of 5/8 B. taurus behoren tot het ideale genotype voor dit gecombineerde melk-vlees productiesysteem.
• het bepalen van variatiebronnen die een significante invloed hebben op dierlijke productie parameters. In volgorde van relatieve belangrijkheid waren dat "genetische groep", die respectievelijk 23,7% en 25,9% van de totale variabiliteit in lengte van de lactatie per koe en
163
Biometrical Applications in Tropical Pasture and Agro-pastoral Research
dagelijkse melkproductie per lactatie per koe verklaarde; "jaar van afkalven", die 10,8% van de totale variabiliteit in dagelijkse melkproductie per lactatie per koe verklaarde en die 15,3% van de totale variabiliteit in geboortegewicht van het kalf verklaarde en "rassentype", dat 10.3% van de totale variabiliteit in dagelijkse melkproductie per lactatie per koe verklaarde.
• Deze studie toonde duidelijk het belang aan van metingen van volledige gegevens per dier en voor de gehele kudde, met inbegrip van observaties over diergezondheid en voedingsupplementen die verstrekt werden voor onderzoek op het bedrijf en voor de bedrijfsvoering.
Hoofdstuk 7 presenteert het relatieve belang van variatiebronnen in melkproductie en -compositie van twee genetische koetypen: Holstein en Holstein-Zebu kruisingen, aan de hand van 15 beweidingproeven van het multipele (3x3) latijnse vierkant "change-over" ontwerp, uitgevoerd op het CIAT Quilichao proefstation tussen 1992 en 1995. De volgende bronnen van variatie werden bestudeerd: aanwezigheid van een leguminoos in het grasland, veeras, lactatie stadium, seizoen en aantal beweidingdagen. N-kunstmestgebruik aan het gras werd ook meegenomen als bron van variatie in het ureum gehalte van de melk. Het effect van de rotatievolgorde en aanpassingsperiode (dagen) op de melkproductie werd ook bestudeerd. De resultaten van deze studie leidden tot de volgende conclusies en methodologische aanbevelingen voor toekomstige graslandevaluatie op gecombineerde vlees-melk bedrijven: • In volgorde van belangrijkheid waren de gevonden bronnen van variatie die de
melkproductie significant bei'nvloeden koeienras, lactatiestadium, aanwezigheid van een leguminoos in het grasland en seizoen. Bronnen van variatie op melkcompositie bleken te zijn N-kunstmestgift aan het gras, aanwezigheid van een leguminoos in het grasland, seizoen en koeienras (voor het melkureumgehalte), en lactatiestadium en ras (voor vetgehalte).
• Bij het analyseren en interpreteren van melkproductie gegevens van bedrijven met verschillende soorten grasland dienen diereffecten zoals ras en lactatiestadium te worden gei'soleerd.
• Het multiple latijns vierkant "change-over" ontwerp is nuttig gebleken om nieuwe graslanden te toetsen met gecombineerde vlees-melkkoeien op het proefstation en mogelijk op bedrijven in het algemeen.
• Melkproductiemetingen kunnen pas gedaan worden na een aanpassingsperiode van minstens 7 dagen, vooral wanneer de koeien verweid worden van graslanden met betere ruwvoederkwaliteit (bijvoorbeeld gras/leguminosenmengsels) naar graslanden met beperkte ruwvoederkwaliteit (bijvoorbeeld een zuivere gras- of een onverbeterde weide).
• Om de aanpassingsperiode van de koeien te regelen moeten de graslandpercelen worden onderverdeeld in gelijke stukken, liefst met electrische afrasteringen om kosten te besparen.
• Frequentie van melkmetingen zijn afhankelijk van het productiepotentieel van de koe en van de hoeveelheid en kwaliteit van het ruwvoeder. De melkgift van koeien met een hoge of gemiddelde melkproductie (5 tot 10 1 per dag), moet gemeten worden aan het begin, het midden en het einde van de proefperiode, vooral in graslanden met beperkte ruwvoederhoeveelheid en kwaliteit. Voor koeien met een laag melkgiftpotentieel (3 tot 5 1 per dag), dient de productie gemeten te worden bij het begin en het einde van de proefperiode.
164
Summary
• Voor strategische bijvoedering en interpretatie van de melkproductie van verschillende graslandtypen kan het meten van het melkureumgehalte nuttig zijn.
Studies die in hoofdstukken 8 en 9 zijn gepresenteerd geven ideeen, methoden, onderzoeksresultaten en practische aanbevelingen over planning, ontwerp, uitvoering en analyse van agro-pastorale experimenten (grasland-gewas associaties, grasland-gewas rotaties en gewasrotaties) voor het savanne ecosysteem. In vergelijking met onderzoek over grasland alleen is agro-pastoraal onderzoek complexer, omdat het onderzoek aan het agro-pastorale systeem gecomplementeerd met en aangepast moet worden aan de individuele componenten: de bodem, gewassen, typen grasland en de dieren. Daardoor moeten de volgende methodologische aspecten worden onderzocht: onderzoeksfasen en hun, planning en ontwerp van experimenten in elke fase; evaluatie en data analyse. Op deze manier wordt standaard methodologie ontwikkeld die het mogelijk maakt voor TLA landen die deelnemen aan dit type onderzoek (Bolivia, Brazilie, Colombia, Guyana and Venezuela) de resultaten te vergelijken en extrapoleren.
Hoofdstuk 8 gaat over methodologische aspecten en geeft aanbevelingen over agro-pastoraal onderzoek dat tot doel heeft relevante hypothesen te toetsen voor de goed gedraineerde tropische savannes. Verschillende fasen van agro-pastoraal onderzoek worden onderscheiden. Methodologische aspecten voor de planning en het ontwerp van proeven worden besproken (experimentele factoren, controle behandelingen, experimentele eenheden, het soort experimenteel ontwerp, response variabelen, experimentele periode), rekening houdend met variabiliteit die inherent is aan het experimentele materiaal. Practische aanbevelingen worden gegeven voor het agro-pastorale onderzoeknetwerk van het savanne ecosysteem van TLA aangaande planning, ontwerp en implementatie van proeven met betrekking tot grasland-gewas associaties, grasland-gewas rotaties en gewasrotaties.
Resultaten van de studie gepresenteerd in hoofdstuk 9 omtrent rijst-grasland associaties voor zure savanne gronden geven aanleiding tot de volgende conclusies: • Een kleinschalige, explorerende proef in een vroeg stadium van een agro-pastoraal
onderzoekproject helpt om bronnen van variabiliteit te elimineren in de meer gevorderde stadia van onderzoek. Vragen over de identificatie van belangrijke experimentele factoren en hun niveaus worden door deze studie beantwoord. Ook zijn vragen beantwoord over de behoefte aan faciliteiten zoals welke variabelen moeten worden gemeten waardoor het onderzoek meer kostenefficient wordt.
• Statistische analyses met methodologische doelen spelen een belangrijke rol in deze beginfase van agro-pastoraal onderzoek omdat zij de richting van toekomstige onderzoekactiviteiten helpen aangeven.
• Deze studie identificeert experimentele factoren die het concurrerend vermogen en de productiviteit van gewassen en graslanden in associatie significant bei'nvloeden. Ook worden de meest geschikte factomiveaus gei'dentificeerd die gebruikt kunnen worden in meer gevorderde fasen van onderzoek. Significante factoren in volgorde van belangrijkheid zijn: a) het type agro-pastoraal systeem; in het beste rijst-graslandsysteem was de rijst geplant in rijen op 34 cm afstand, onafhankelijk van hoe het grasland werd gezaaid (in rijen of breedwerpig); b) rijsttype; Oryzica sabana 6 en lijn 4 waren de best presterende rijsttypes omdat zij de hoogste
165
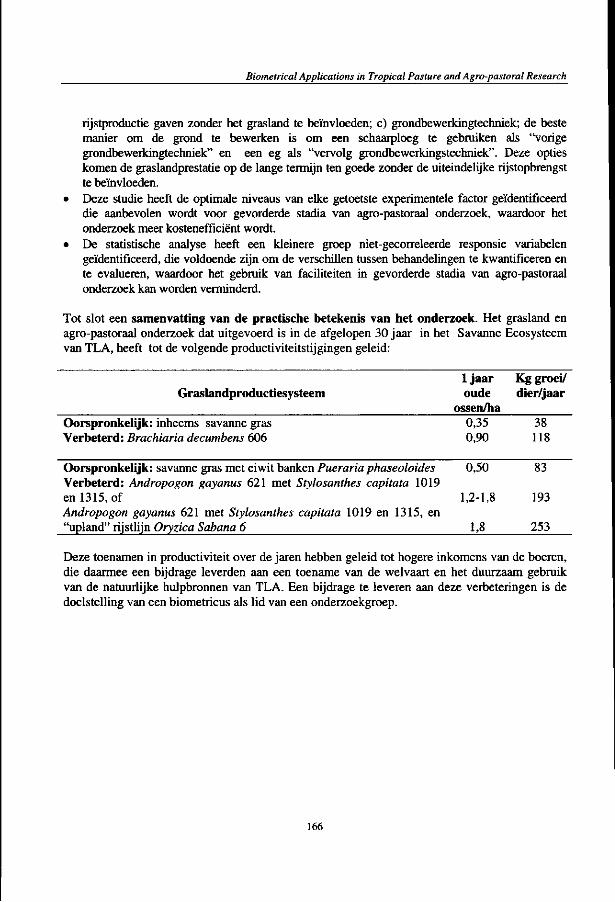
Biometrical Applications in Tropical Pasture and Agro-pastoral Research
rijstproductie gaven zonder het grasland te bei'nvloeden; c) grondbewerkingtechniek; de beste manier om de grond te bewerken is om een schaarploeg te gebruiken als "vorige grondbewerkingtechniek" en een eg als "vervolg grondbewerkingstechniek". Deze opties komen de graslandprestatie op de lange termijn ten goede zonder de uiteindelijke rijstopbrengst te bei'nvloeden.
• Deze studie heeft de optimale niveaus van elke getoetste experimentele factor gei'dentificeerd die aanbevolen wordt voor gevorderde stadia van agro-pastoraal onderzoek, waardoor het onderzoek meer kostenefficient wordt.
• De statistische analyse heeft een kleinere groep niet-gecorreleerde responsie variabelen gei'dentificeerd, die voldoende zijn om de verschillen tussen behandelingen te kwantificeren en te evalueren, waardoor het gebruik van faciliteiten in gevorderde stadia van agro-pastoraal onderzoek kan worden verminderd.
Tot slot een samenvatting van de practische betekenis van het onderzoek. Het grasland en agro-pastoraal onderzoek dat uitgevoerd is in de afgelopen 30 jaar in het Savanne Ecosysteem van TLA, heeft tot de volgende productiviteitstijgingen geleid:
1 jaar Kg groei/ Graslandproductiesysteem oude dier/jaar
ossen/ha Oorspronkelijk: inheems savanne gras 0,35 38 Verbeterd: Brachiaria decumbens 606 0,90 118
Oorspronkelijk: savanne gras met eiwit banken Pueraria phaseoloides 0,50 83 Verbeterd: Andropogon gayanus 621 met Stylosanthes capitata 1019 en 1315, of 1,2-1,8 193 Andropogon gayanus 621 met Stylosanthes capitata 1019 en 1315, en "upland" rijstlijn Oryzica Sabana 6 L8 253
Deze toenamen in productiviteit over de jaren hebben geleid tot hogere inkomens van de boeren, die daarmee een bijdrage leverden aan een toename van de welvaart en het duurzaam gebruik van de natuurlijke hulpbronnen van TLA. Een bijdrage te leveren aan deze verbeteringen is de doelstelling van een biometricus als lid van een onderzoekgroep.
166
Curriculum Vitae
Curriculum Vitae
Maria Cristina Amezquita, Colombian, obtained her degree in Mathematics from Universidad de Los Andes, Bogota, Colombia, and her Diploma in Mathematical Statistics from Cambridge University, Cambridge, United Kingdom, where she completed her thesis work in Biostatistics in the area of Statistical Methods in Animal Behaviour. After her return from the United Kingdom she joined the scientific staff of CLAT (Centro Internacional de Agricultura Tropical, or International Centre for Tropical Agriculture, based in Cali, Colombia) as Associate Researcher, and from 1980 onwards, as Head of the CIAT's Biometry Unit. In 1999 she accepted her present position as Head of the Environment and Habitat Sciences National Program for Colombia, at COLCIENCIAS, Bogota, Colombia.
Through her work as biometrician in international agricultural research, she has provided scientific support to a wide range of research programs, projects and disciplines, inside and outside Tropical Latin America, both in basic and applied research, in plant, animal and environmental sciences, with special emphasis on tropical pasture and agro-pastoral systems.
She has also served as a consultant to international and national agricultural and environmental research institutions and universities in Latin America and Africa. Specific consultancy projects with the World Bank in Africa included the "Madagascar Agricultural Research Mission" (Antananarivo, 1989, 1990) and "Mali Agricultural Research Mission" (Bamako, 1991). Her consultancy work in Latin America included advice to research programs and projects conducted by regional and national agricultural research institutions, such as CATIE (Turrialba, Costa Rica, 1985), EMBRAPA (Brasilia, Brazil, 1988), INTA (Balcarcel, Argentina, 1989) and CORPOICA (Bogota, Colombia, 1996, 1997, 1998), as well as consultancy projects with regional and international research-support organisations, such as PROCIANDINO, PROCITROPICOS, PROCISUR, ECA (1985-1998), ODA-United Kingdom (at INPA, Instituto Nacional de Pesquisa Amaz6nica, Manaus, Brazil, 1996), and IDB (Bogota, Colombia, 1998).
She is member of The International Environmetrics Society (TIES) since its creation, in 1989.
She is married and mother of two children.
167

Biometrical Applications in Tropical Pasture and Agro-pastoral Research
168