


Bahasa
Halaman
Hukum


Anchoring Effect in Real Litigation: An Empirical Study
Yun-chien Chang* Kong-pin Chen**
Chang-Ching Lin*** Yu-sheng Liu****
Abstract This article studies two questions that are debated by theorists but so far have
rarely been examined empirically: First, whether judges in civil law countries tend to make efficient decisions; second, whether in real litigation judges suffer from the anchoring effect. We examine cases regarding compensation by trespassers to landowners for the trespassers’ unlawful use of the land. Judges in Taiwan use the formula “rent=land value*yield rate” to compute the unjust enrichment of the trespasser. In practice, the land value is the pre-filed self-assessed land value that is below market value. Judges have a large room in determining the yield rate. Our research tests whether judges adjust the yield rate to award market rent or judges’ adjudicated rates are influenced by the rates claimed by the plaintiff (the anchor).
Using randomly sampled court cases rendered by the court of the first instance in Taiwan in 2004–2012, we find that most adjudicated rents are lower than market rents; thus, courts arguably have made inefficient decisions. In addition, our structure model reveals that the plaintiff’s claimed yield rate and defendant’s claimed yield rate both have substantial and statistically significant effects on the court-adjudicated yield rate, indicating that judges in Taiwan are subject to the anchoring effect, and that counteracting anchors can be effective.
* Associate Research Professor & Deputy Director of Center for Empirical Legal Studies, Institutum Iurisprudentiae, Academia Sinica, Taiwan. J.S.D., New York University School of Law. Email: [email protected]. Correspondence author. Draft of this paper has been presented at the Cornell-Tel Aviv Empirical Legal Studies Conference held at Tel Aviv University Faculty of Law on May 6–7, 2013; Bonn Law and Economics Workshop held at Bonn University on Oct. 1, 2013; Law and Economics Workshop at the University of Michigan, Ann Arbor on Oct. 17, 2013; and the 2013 Conference for Empirical Legal Studies held at the University of Pennsylvania Law School on Oct. 25–26, 2013. We appreciate the workshop/conference organizers (Talia Fisher, Kristoffel Grechenig, Alexander Morell, JJ Prescott, and David Abrams) for their invites and supports. We thank Yoav Dotan, Ted Eisenberg, Michael Frakes, Valerie Hans, Yoan Hermstrüwer, Tamar Kricheli Katz, Isabel Marcin, Alexander Morell, Niels Petersen, JJ Prescott, Eva Schliephake, Martin Wells, and Omri Yadlin for helpful comments. With due respects, we thank Hon. Carol Lin and Hon. Janssen Yang for kindly sharing their insights with us. We also thank Shiang-Chian Chen, Sonia Chieh-han Chen, Yu-hsiang Cheng, Yichien Chu, Tzu-Yuan Chu, Ming-Chung Lin, and Ming-chia Tsai for research assistance. ** Distinguished Research Fellow and Director, Research Center for Humanities and Social Sciences, Academia Sinica; Executive Director, Center of Institution and Behavior Studies, Academia Sinica; Professor, Department of Economics, National Taiwan University. *** Assistant Research Fellow, Institute of Economics, Academia Sinica. **** Assistant Research Fellow, Commerce Development Research Institute.

Chang, Chen, Lin & Liu
ii
Keywords
Judicial yield rate, anchoring effect, equivalent to rent, compensation, unlawful possession, unjust enrichment, restitution, rental yield rate, self-assessed value

Chang, Chen, Lin & Liu
iii
Table of Contents
I. Introduction ............................................................................................................ 1 II. Taiwan’s Unjust Enrichment Law Regarding Unlawful Possession ..................... 4 III. Hypothesis and Methodology ................................................................................ 6
A. Research Questions ........................................................................................ 6 1. Mimicking the Market ........................................................................... 6 2. Affected by Parties’ Anchor ................................................................... 7
B. Structure Models on Judicial Yield Rate ...................................................... 10 1. Model Specifications ........................................................................... 10 2. Reported Models .................................................................................. 14
C. Hedonic Regression Models on Market Rental Yield Rate ......................... 15 IV. Data ...................................................................................................................... 16
A. Market Rental Yield Rate ............................................................................. 16 B. Judicial Cases ............................................................................................... 18
V. Findings and Discussions .................................................................................... 23 A. Mimicking the Market?................................................................................ 23 B. Anchoring Effects ........................................................................................ 29
VI. Conclusion ........................................................................................................... 32

Chang, Chen, Lin & Liu
1
I. INTRODUCTION
Dora is an absentee landowner. One day, upon return of her year-long oversea
trip, Dora found out that Phil has been placing his logs and gravel on her land without
her consent. In most, if not all, jurisdictions around the world, Dora can request Phil
to remove his things from her land. The more difficult question is whether Phil is
obliged to compensate Dora and how compensation should be calculated. As Dora
had no plan to use the land and Phil’s actions did not cause Dora any actual harm, a
tort claim will not get Dora very far. Instead, Dora should base her claim in unjust
enrichment (or restitution) law. A major distinction between a tort claim and an unjust
enrichment claim is that the plaintiff does not have to demonstrate any harm in the
latter; rather, the plaintiff needs to establish that the defendant has been benefitted at
the expense of the plaintiff without any justifiable cause. Still, how much has Phil
been enriched by using Dora’s land?
The conventional wisdom of law and economics is that courts should “mimic the
market” (Posner 1998). Indeed, several countries have concluded that the unjust
enrichment in this context is equivalent to rent—a hypothetical rent that both parties
would have agreed if they had bargained for it before the land in question was used
unconsensually. For example, in the U.S., according to Restatement (Third) of
Restitution and Unjust Enrichment §40 comment b., defendant’s unjust enrichment
may be identified with ordinary rental value.1 Courts and scholars in Germany also
use “equivalent to rent” as the standard for calculating compensation to landowners.2
The scholarly literature in Germany and the U.S. does not describe in detail how
courts in practice assess the amount of rent, though one could reasonably guess that
the assessment procedure would involve appraisers who use rent value of comparable
land as a basis for the assessment.3 If courts systematically under-assesses
1 See Illustration 3 of §40 for a case that is similar to the vignette about Dora and Phil above. Note also that Reporter’s Note c. of §40 points out that historically, restitution is unavailable for trespass and dispossession discussed in this article. 2 For German court cases, see BGHZ 20, 270; BGHZ 22, 395. For German scholarly literature, see Buck-Heeb (2011: 3559); Sprau (2013: 1302). For introduction to German unjust enrichment law in English, see Krebs (2004) and Dannemann (2009). 3 To be sure, appraisers’ assessments do not always approximate market value. As one of us has empirically demonstrated in the empirical study of eminent domain compensation cases in New York City (Chang 2011), the court-adjudicated property value is often greatly over- or under-assessed.

Chang, Chen, Lin & Liu
2
rent—failing to mimic the market—potential land users might prefer trespassing to
bargaining for a property right to use land, as trespassing saves bargaining costs,
prevents delays, and reduces the paid rent.
This article empirically investigates whether courts in Taiwan have mimicked the
market in determining the rent in unjust enrichment cases, and if not, what drives the
deviation. Our study can be put into the broader context of exploring whether career
judges in a civil-law jurisdiction tend to make efficient decisions. Whether common
law courts tend to make efficient laws is famously contended in Posner (1973) and
discussed in many works in the past several decades (e.g., Priest 1977; Rubin 1977).4
Civil-law courts have less rule-making discretion than their common-law counterparts
do (Arruñada and Andonova 2008a: 86),5 but judges in civil-law countries still have
room to interpret statutes, such as the civil code, and oftentimes have discretion in
determining the outcomes of the cases at hand. We contribute to the debate by
empirically examining the behaviors of judges in Taiwan—career judges in a civil law
country. One of us has conducted empirical studies on this issue in the past. Chang
(2012b) finds out that, opposite to Heller (2008)’s suggestion, courts in Taiwan, in
dealing with co-ownership partition cases, tend to order partition by sale instead of
partition in kind when physically dividing the land renders the post-partition land
parcels fragmentary. In addition, the Civil Code of Taiwan gives courts a large
discretion to determine whether to remove buildings that encroach on the adjacent
land. Chang (2013b) finds that the most significant determinant of the court’s decision
is the size of the encroached part of the neighboring land. A minor infringement tends
to lead to preservation of buildings, while a large-scale trespass often results in
removal. These two case studies suggest that courts in Taiwan are inclined to make
efficiency-minded decisions.6 But one swallow does not a summer make. This article
further explores the judicial behaviors in private law litigation in Taiwan.
Courts in Taiwan compute the annual rent by multiplying owner’s pre-filed
self-assessed land value and an annual real estate rental yield rate (hereinafter “rental
4 In a recent empirical work, Niblett, Posner, and Shleifer (2010) find out that the economic loss rule in tort law, over four decades, does not converge to efficiency. 5 Arruñada and Andonova (2008a) and Arruñada and Andonova (2008b)’s explanation for the limitation on the rule-making power of civil law judges is to protect freedom of contract from being interfered by judges hostile to free market. 6 Arruñada and Andonova (2008a: 121) also argue that removal in the case of minor good-faith encroachment would be inefficient.

Chang, Chen, Lin & Liu
3
yield rate” or simply “rate”). No law or doctrine prescribes how judges set the rental
yield rate (hereinafter the “judicial yield rate”), other than the 10% statutory cap and
the doctrine that judicial yield rate should be no larger than plaintiff’s claimed yield
rate. Self-assessed value is lower than government-assessed market value,7 and the
magnitude of the deviation is assessed and publicized by the government. Our
findings suggest that in calculating rent-equivalent compensation in unjust enrichment
cases, courts in Taiwan do not take market rent as a reference point: In our
econometric models, a higher “(estimated) market yield rate”8 does not lead to a
higher judicial yield rate. There is only weak statistical evidence that a wider gap
between market value and self-assessed value leads to a higher judicial yield rate.
Moreover, most judicial interest rates are lower than market rental yield rates. If
market rent is not the benchmark, how do judges determine the judicial yield rate?
The second part of our empirical inquiry reveals that the judicial yield rate is
greatly influenced by the plaintiff’s claimed rental yield rate (hereinafter “plaintiff’s
claimed rate”)—the anchoring effect. Experimental studies on judges have shown that
judges are subject to the power of anchors (Guthrie, Rachlinski, and Wistrich 2000:
787–794; English and Mussweiler 2001; Wistrich, Guthrie, and Rachlinski 2005:
1286–1293; Guthrie, Rachlinski, and Wistrich 2007: 19–21; Rachlinski, Guthrie, and
Wistrich 2007: 171–173).9 While these authors have teased out the anchoring effect
in neat experimental settings, we extend the study of the anchoring effect to a real
litigation setting.
As we will elaborate below, the unjust enrichment cases studied here are the
ideal setting to examine the anchoring effect of the number proposed by plaintiffs
(and defendants) on the number determined by judges. In short, in these cases, parties
do not make claims—and judges do not adjudicate—based on objective standards that
could be available, such as market value of land and market yield rates of land. 7 We do not have comprehensive data on market value of real estate in Taiwan before 2012 (and no one else does). The market value we refer to here is the government-assessed market value, which is not based on state-of-the-art hedonic regression models and might under-assess market value (Chang 2009). 8 We use hedonic regression models to estimate market yield rate (see Part III.C). For lack of pre-2012 market data, we use market yield rates in December 2012 as a proxy for market yield rates in our research period (see Part IV.A). 9 Specifically, Rachlinski, Guthrie, and Wistrich (2007: 172) study interest rates and find that they are a “largely irrelevant but still influential anchor” for bankruptcy judges. The interest rate they studied, technically speaking, is not exactly the same as the judicial yield rate examined here. Yet it suggests how judges might struggle with determining an annual rate.

Chang, Chen, Lin & Liu
4
Instead, parties and judges provide only casual reasoning. Moreover, the cases are
randomly assigned to one judge or a three-judge panel; in some but not all cases,
defendants provide specific counter claims. These variations enable us to examine the
changes in anchoring effect in different litigation settings.
We find evidence for strong anchoring effect. The larger the difference of
“plaintiff’s claimed rate minus market yield rate,” the larger the difference of “judicial
yield rate minus market yield rate.” Put differently, when plaintiffs over-claim, judges
tend to over-award.10 Consistent with the prediction by the psychology literature,
when the defendants explicitly raise a lower counter claim, the aforementioned
anchoring effect appears to be weakened. There is no statistically significant
difference between a decision by one judge and that by a three-judge panel.
The rest of this article is structured as follows: Part II summarizes the relevant
law in Taiwan. Part III elaborates the two major empirical research questions and lays
out the specifications of our regression models. Part IV summarizes the pertinent data,
including those on the randomly sampled judicial cases from Taiwan and those on
market lease rents and sale prices. Part V reports our findings and discusses the
implications. Part VI concludes.
II. TAIWAN’S UNJUST ENRICHMENT LAW REGARDING UNLAWFUL POSSESSION
In Taiwan, the rent-equivalent compensation is assessed in a unique way. No
appraisers or other real estate experts are engaged in the appraisal. Instead, the judges
handle the assessments by themselves. More specifically, courts in Taiwan employ the
formula RENT=LAND_VALUE*YIELD_RATE to calculate the rent. While this
formula (in the form of LAND_VALUE=RENT/YIELD_RATE), called income
capitalization approach, is used by appraisers to assess the value of commercial
buildings (see, e.g., Huber, Messick, and Pivar 2006: 309–331), we did not find any
appraisal book (English or Chinese) advising appraisers to calculate rent based on this
formula. Courts in Taiwan started to use this formula since a Supreme Court
precedent in 1972. To date, this formula has become the guiding post for this type of
unjust enrichment cases because of the precedential authority and its ease for judges
10 Judges over-award in terms of yield rates, not in terms of compensation.

Chang, Chen, Lin & Liu
5
to operationalize.11 Assessing market value of land through the comparable sale
approach should be highly technical and hard for career judges without appraisal
training, but judges in Taiwan avert the difficulty by putting “pre-determined” land
value into the aforementioned formula.
There are, however, three types of pre-determined land value: Declared Land
Value (DLV), Publicly Announced Land Value (PALV), and Assessed Current Land
Value (ACLV) (in the order of frequency used in our database). Every three years,
local governments in Taiwan assign a PALV to each land parcel. Landowners are then
allowed to report a self-assessed DLV to replace the PALV, as long as the DLV is
between 80% and 120% of the PALV. The self-assessed value is the tax base for
property taxes (Chang 2012a). The default tax rule is that if private landowners do not
declare a DLV, it will be presumed to be 80% of the PALV (without any adverse
effect). As a result, most landowners do not bother to take any action. In short, for
privately owned land, DLV=0.8*PALV.12 As for the ACLV, every year local
governments in Taiwan assign an ACLV to each land parcel. It is used as the
benchmark for levying land value increment tax.13 Both the PALV and the ACLV are
below government-assessed market value. This is common sense in Taiwan. The
central government publicizes the ratios of the PALV to government-assessed market
value and the ratios of the ACLV to government-assessed market value on the official
website of the Department of Land Administration Ministry of the Interior.14 In 2013,
the PALV is on average 20% of government-assessed market value, whereas the
ACLV is on average 85% of government-assessed market value. Given the
relationship of DLV and PALV, the DLV of private land would be on average 16%
(=20%*80%) of the government-assessed market value.
As for YIELD_RATE, Article 97 of the Land Act of 1946 stipulates a 10%
ceiling. Article 97 is intended to regulate the yield rate of urban residential land and
buildings only, but most judges apply the cap to urban non-residential land and
11 This formula is not used in every case. When the two parties had a lease before the unlawful possession happens, courts often use the rent stipulated in the expired lease to calculate the compensation due to the plaintiff. This type of cases account for most court cases that are sampled but not coded, as no yield rate was determined. 12 For public land, DLV=PALV. 13 For an introduction of the PALV and the ACLV, see Chang (2009; 2013a). 14 Data available at http://www.land.moi.gov.tw/chhtml/content.asp?cid=14&mcid=194.

Chang, Chen, Lin & Liu
6
buildings and rural land and buildings as well.15 Arable land is an exception, as
Article 110 of the Land Act imposes an 8% cap for it. Another important constraint is
the civil-procedural doctrine that inhibits courts from awarding a judicial yield rate
that is higher than the plaintiff’s claimed yield rate.16 That is, the former can only be
smaller than or equal to the latter. As a result, the court in Taiwan has discretion to
determine the judicial yield rate, as long as it is within the statutory cap of 10% or 8%
and no larger than the plaintiff’s claimed rate.17
It should also be worth noting that most judges follow a Supreme Court
precedent declaring that the statute of limitation for recovering rent-equivalent
compensation is a shorter 5 years (rather than the standard 15 years), because the
statute of limitation for claiming bargained-for market rent is 5 years.18
III. HYPOTHESIS AND METHODOLOGY
A. Research Questions
1. Mimicking the Market
Our first research interest is to ascertain whether the court-adjudicated rent
approximates market rent. Court judgments themselves, however, offer little help in
revealing judges’ true motivation, as judges at most draw on a judgment template,
decorate it with a few facts from the case, and dish out a judicial yield rate. Our
hypothesis is that judges manipulate judicial yield rates to render a market rent to the
plaintiff. As explained in the previous sections, the ACLV and the PALV, not to
mention the DLV, is below market value (Chang 2012a; 2013a). The gaps between
these three values and the market value in each county/city widely differ. The
15 In about a dozen cases, courts consider the 10% cap to be non-applicable. Nonetheless, in only two cases, the awarded judicial yield rate is above 10% (30% and 15%). These two cases are omitted from our analysis. 16 As Hans and Reyna (2011: 145) point out, this external cap may also operate as anchors. 17 Note that the judicial yield rate (YIELD_RATE) is a rental yield rate for real estate, not a “prejudgment interest rate” (Knoll 1996) or “judicial interest rate” (Acciarri and Garoupa 2013). Probably because lawyers and courts in Taiwan confuse judicial yield rates with prejudgment interest rates (the Chinese terms for them are the same!), no plaintiff asks for awarding of prejudgment interests. 18 This issue does not arise in all cases. In 93% of the observations in which the court takes an explicit stand, the court follows the five-year rule.

Chang, Chen, Lin & Liu
7
existence of this gap is common knowledge in Taiwan, and ratios19 of the PALV
(ACLV) divided by government-assessed market value in 2004, 2007, and 2010
(2004–2012 each year) are publicly available, as noted above. Thus, judges are
reasonably assumed to be aware of the fact that the DLV (as well as PALV and ACLV)
under-assesses market value. Judges, however, are constrained by what their fellow
judges and judges in higher courts do, and are compelled to apply the DLV (in rare
cases, PALV and ACLV) in the computation of rent. Nonetheless, judges have room to
adjust judicial yield rates to make up for the gap between the DLV and market value.
If our conjecture is correct, the judicial yield rate will approximate what we call
“adjusted yield rate,” which equals [(government-assessed market value / DLV) *
market yield rate].20
For our purpose, we will compute the ratio of court-adjudicated rent to estimated
market rent21 (hereinafter “rent ratio”). A rent ratio of 1 suggests that courts have
mimicked the market, while a ratio of >1 (<1) indicates that judges over-
(under-)assessed rent.
2. Affected by Parties’ Anchor
If judges do not adjust judicial yield rates to award market rent to the plaintiff,
we would explore the underlying reasons. We are particularly interested in teasing out
the “anchoring effect” caused by the plaintiff’s claimed yield rate. The anchoring
effect describes the phenomenon that people’s estimate of an unknown quantity stays
close to the number that people considered—be it the last four digit of their social
security number or phone number (Ariely 2008: 25–48; Kahneman 2011: 119–128).
Considering the anchoring effect in this context is appropriate for the following
reasons. First, unlike in most lawsuits, the plaintiff in an unjust enrichment lawsuit
before a judge in Taiwan does not have to “prove” how she comes up with the
claimed yield rate, nor does she need to provide evidence of market rental yield rates
19 These ratios are average numbers. That is, the ratios of PALV to government-assessed market value may vary within a jurisdiction. Also, as noted above, government-assessed market value does not always accurately reflect real market value. Thus, we cannot use government-assessed market value and the ratios to reverse-engineer the real market value. 20 Replace ACLV or PALV in the formula if it is the judicial land value. 21 Regarding estimating market rent, see Part III.C.

Chang, Chen, Lin & Liu
8
or market value of her land.22 Most plaintiffs at most vaguely claim that their land is
located at a thriving neighborhood, but the association of their arguments with the
specific claimed yield rate is ambiguous. The same pattern applies for defendants and
courts. As a result, there is a large room of discretion for courts to determine the
amount of judicial yield rates within the two caps mentioned above. The discretion
opens up the opportunities for judges to be influenced by anchors.
Some may contend that the plaintiff knows about market rental yield rate better
than the judge, and thus the plaintiff’s claimed rate may contain useful information;
consequently, it is not surprising and normatively unproblematic for the court to be
affected by the plaintiff’s claim. We respectfully disagree. As shown in Figure 2, most
plaintiffs claim 5% and 10%, probably because the statutory prejudgment interest rate
is 5% and the statutory cap for judicial yield rate is 10%. It is highly unlikely that
market rental yield rates simply bounce between 5% and 10%. Indeed, plaintiff’s
claimed rate is only weakly correlated with our estimated market yield rate (r=0.174)
or with adjusted yield rate (r=0.199), as shown in Table 1.23 Finally, if the plaintiff’s
claim does reflect the real market yield rate, it is rational for them to present evidence
to support their claim. Nonetheless, in the nearly one thousand cases we code, we
never observe such a practice. In short, plaintiff’s claimed rate may not be an entirely
meaningless anchors (as the last four digit of one’s social security number), but it is
not very meaningful or informative, either.24 Rather, it is more like the plaintiff’s
wishful thinking. As elaborated below, in order to tease out the unreasonable of
plaintiff’s claim, we use “plaintiff’s claimed rate minus market yield rate” as the
predictive variable.
22 Market value and yield rate of land can only be ascertained (to a certain extent) by professional appraisers. But their services are not obtained in the cases we study. 23 Interestingly, if only observations in 2012 are included (as we uses market data in 2012 to estimate market yield rates), the correlation coefficients reduce to 0.04 and 0.04. 24 For meaningful anchors, such as asking price of a house, see Epleya and Gilovich (2010: 22).

Chang, Chen, Lin & Liu
9
Table 1 Correlation of market yield rate, adjusted yield rate, plaintiff’s claimed rate and judicial yield rate Market yield rate Adjusted yield rate† Plaintiff’s claimed rate 0.1740
<0.001 616
0.1987 <0.001 614
Judicial yield rate 0.0873 0.02 719
0.1379 <0.001 717
First row: correlation coefficient; second row: p-value; third row: N.
† Adjusted yield rate is the rate that, multiplied by the self-assessed value, will give
the plaintiff market rent as compensation.
Second, variances in whether defendants provide counteracting anchors enable
us to test whether the anchoring effect is weakened when both parties quarrel with the
right judicial yield rate. Defendants make specific counter-claim in yield rates in less
than 11% of the cases (see Table 5). 16% of the defendants only contend that the
plaintiff’s rate is too high, and about three-fourth of the defendants do not challenge
plaintiff’s yield rates at all, as their litigation strategy is often to dismiss the case
altogether. Our hypothesis is that the plaintiff’s claimed yield rate serves as a
powerful anchor for judges who do not know how to set judicial yield rates. To be
more exact, the difference of “plaintiff’s claimed yield rate minus market yield rate”
(at least when it is positive) is positively correlated with the difference of “judicial
yield rate minus market yield rate,” other things being equal. When defendant
counters with an interest rate of his own, we conjecture that the aforementioned
anchoring effect would be weakened.
Finally, we also examine whether the power of anchors will be weakened if
multiple judges deliberate before setting the judicial yield rate. There are two
countering forces at work here: on the one hand, in the deliberation process,
counter-evidence to the plaintiff’s claimed rental yield rate is more likely to be raised.
Thus, judicial yield rates will be less influenced by the plaintiff’s claimed rate. On the
other hand, the “group polarization theory” (Sunstein et al. 2002: 57–61) suggests that
a panel of three judges are more likely to render extreme decisions than a single judge.

Chang, Chen, Lin & Liu
10
Given the anchoring effect, a three-judge panel might be seduced by the anchors more.
The judicial procedural rules in Taiwan enable us to test whether the rental yields
determined by a single judge or a panel of three judges are different. In principle, a
single judge handles cases in the court of the first instance in Taiwan. Nonetheless, if
a case is (randomly) assigned to a junior judge (one with less than 2 years of
experience on the bench), two senior colleagues will join her to form a panel (this
happens in 7.6% of our observations; see Table 5). By adding a stand-alone variable
“three-judge panel” and an interaction term of three-judge panel and the difference of
“plaintiff’s claimed rate minus market yield rate,” we can examine whether the
anchoring is attenuated or aggravated in a three-judge panel.
B. Structure Models on Judicial Yield Rate
1. Model Specifications
To test the above hypotheses, we run regressions with robust standard errors and clusters by cases (as one case may produce multiple observations). Notice that the market yield rates (rm) can be evaluated by plaintiffs, defendants and judges based on the publically observed land characteristics. In a fair judgment procedure, the judicial yield rates (R) should not systematically deviate from the market yield rate, unless a judge observes extra information from the plaintiff that justifies adjustment of judicial yield rates from rm. We reasonably posit that (1) a plaintiff who owns private information that could increase her compensation will reveal it to the court (and the defendant); (2) the court can only take the information into account when the defendant has an opportunity to present counter evidence; and (3) the court will discuss the information in the written judgments. When reading the hundreds of written judgments, we observe no such evidence or discussion at all. Therefore, we assume no private information is contained in plaintiff’s claim. As a result, any difference between plaintiff’s claim and market yield rate that affects deviation of judicial yield rate from market yield rate is considered the anchoring effect.
Specifically, to explore the relationship between these two deviations, we first estimated the market rental yield rate by the observed land characteristics (see Sub-section C for the estimation method). Then, we calculate the deviations of plaintiff’s rate and judicial rate from market yield rate,25 (b–rm) and (R–rm), and run
25 In 41 cases, the estimated market yield rates are higher than 10%, the legal cap. We treat these market yield rates as 10%, as both the plaintiff and the court cannot and do not go over 10%.

Chang, Chen, Lin & Liu
11
regressions to capture the effects. However, given the fact that Article 97 of the Land Act imposes a 10% ceiling and the fact that a judicial yield rate cannot exceed the plaintiff's claimed yield rate, the judicial yield rates are bounded by the plaintiff’s claimed yield rates in our data set. In statistics, it is common to use a Tobit-type model to handle the regressions with upper limits. Thus, our analysis is based on the following regression model:26
iiimiimi
iiimi
iiimiimi
XrbrR
bRasrbbRasrR
rR
ε)(
,,,,
*
*
++−=−
=−<−
=−
bγ
where R–rm is the observed deviation of a judicial yield rate (R) from the market yield rate (rm) under the upper limit, R*–rm is the latent counterpart capturing the judges’ true deviation without upper limit, (b–rm) is the difference between plaintiff's claimed rate and market yield rate,27 X is a vector of other independent variables, and β is the coefficient vector of the X. When γ=0, no averaged anchoring effect exists; and when γ=1, we have complete anchoring and R=b. Moreover, we also estimate the anchoring effects (γ) when plaintiffs’ claims exceed or fall below the market yield rates. The independent variables (in X) capture information or factors that could also explain the deviation of judicial yield rates from market yield rates. More specifically, these variables control for the characteristics of the two litigating parties, the characteristics and claims of the plaintiff and the defendant (PT), the size, value, length of encroachment, and usage of the land, nature and extent of the land encroachment (LD), and the defendants’ claims (IN). Dummy variables to capture time (YR), the strata of location (ST), and zoning (Z) fixed effects are also included.28
PT includes natural log of the numbers of plaintiffs and defendants; dummies on
whether the plaintiff and the defendant are a corporation or a government agency; and
26 Here, we assume that εi ~N(0, σ2) is independently and identically distributed. The model can be
estimated by maximum likelihood using the following Tobit-type likelihood: ii I
iimiimiI
iimiimiN
im
XrbrbXrbrRrRL
−−−−
Φ−
−−−−
∏=−−
= σbγ
σbγϕ
σσγb )(1)()(1),,;(
)1(
1
where ϕ and Φ are respectively the standard normal cumulative and probability density functions, and dummy variable 1 0iI = if i iR b∗ < and 1 otherwise. 27 Note that 15% of the plaintiff’s claims are missing. 28 We coded but did not include the variable on the culpability of the defendants. In 819 observations, in only two cases do courts explicitly consider the culpability (in one, the defendant is intentional, and in the other, the defendant is no-fault). As the law does not impose on the plaintiff the obligation to act sooner, and unjust enrichment is not a fault-based system, it is not surprisingly that the court never mentions anything related to the plaintiff’s culpability.

Chang, Chen, Lin & Liu
12
dummies on whether the plaintiff and the defendant are represented by attorneys.29
Besides, a dummy variable captures whether the plaintiff is the landowner or holds a
lesser property interests. A series of dummy variables controls in what way the
defendant is a holder of real property interests, including; “defendant is a usufructuary
of nearby land or building”; “defendant was simply an unlawful possessor”;
“defendant owns an unregistered building nearby”; “defendant was a tenant”;
“defendant built an unregistered building on the land in question”; and “defendant
type unknown. The baseline variable is “defendant is a (co-)owner of nearby land or
building.”
LD includes natural log of the area of land that the defendant has encroached on.
Also included is natural log of the “pre-determined land value ($/m2) adopted by the
court” (hereinafter “judicial land value”30). LD also includes a continuous variable
that represents the ratio of the judicial land value to government-assessed market
value.31 This variable enables us to test whether courts have adjusted the judicial
yield rate to provide the plaintiff with the market rent. There is also a dummy variable
that controls whether the land is arable (the interest rate of which is statutorily capped
at 8%). Finally, the regression models also control for the length of trespass. Not all
judicial decisions provide accurate information regarding the length of time. In 40%
of the observations, only minimum length of time is known, as most courts interpreted
the law to confer only five years of compensation, and thus from the judgment it is
only clear that the encroachment had lasted for at least five years.32 In order not to
lose so many observations, we presume that the minimum length is the actual
length.33 A variable that represents the natural log of the number of plots involved is
29 We have also tried the natural log of the number of attorneys representing the plaintiff and that of attorneys representing the defendant. The result is essentially the same. 30 As said, it could be DLV, PALV, or ACLV. For public land, DLV=PALV. For private land, the DLV almost always equals to 80% of the PALV. Indeed, DLV=0.8*PALV in all of the cases in our database. Nevertheless, in 4 (12) observations involving private land, the court uses the PALV (ACLV), instead of the DLV, to calculate the rent. The land value captured by this variable is the land value used by the court to calculate the rent. That is, in all but 16 cases, this variable reflects the DLV (which may or may not equal the PALV, depending on whether the land is state-owned). In the 16 exceptions, this variable reflects the PALV and ACLV, which are higher than the DLV. The few cases that draw on market value or rent stipulated in a prior lease are excluded from the regression models. 31 The Ministry of the Interior publicizes the ratio of the PALV to government-assessed market value and the ratio of ACLV to government-assessed market value. I use them to compute the ratios used there. 32 In some cases, courts are just obscure about the exact length of trespass. 33 We have run the regressions with only observations that contain accurate length information, and we have run the regressions without the time variable. The results are essentially the same.

Chang, Chen, Lin & Liu
13
included. Finally, a dummy variable that indicates whether the unlawful use of the
land is commercial is contained.
IN contains several yield rate-related variables. Defendant’s exact claimed yield
rate is available in only 11% of the observations. In 16% of the observations,
defendants assert that plaintiff’s claimed yield rate is too high.34 In the rest of the
observations, defendants do not claim any yield rate. We use two dummy variables to
control for the three scenarios above. Defendant’s explicit claimed yield rates are
captured by a continuous variable. 35 We then calculate the deviations of the
defendant’s explicit claimed yield rates from the market yield rate (d–Rm). To
measure the effect of the counteracting anchor, added is an interaction term, a dummy
variable that equals one if the defendant makes an explicit counter claimed rate,
multiplied by the variable that capture the positive difference of plaintiff’s claimed
yield rate from the market yield rate. There is also a dummy variable for a three-judge
panel and an interaction term of three-judge panel and plaintiff’s deviation.
TY represents a number of dummy variables that capture the nature of the
trespass. The category of cases include “constructing building”36; “land used as
storage”37; “tenant continuing to use land after lease expires”; “tenant continues to use
land after lease is vacated”; “co-tenant using land without permission from other
co-tenants”; “borrower continuing to use land after contract expires”; “land used as
parking lot”; “land used to grow crops”; “access to landlocked land”; “buying
building right in auction without acquiring right to use land” and “miscellaneous.”
The baseline variable is “boundary encroachment.”38
YR is a series of dummies (one for each year) that controls the timing of the
judgment. Z are 6 zoning dummies that capture 7 types of zonings: non-urban
(residential), urban (industrial), urban (residential), urban (business), urban
(agricultural), and urban (other). The baseline variable is non-urban (agricultural). As
for ST, following Hou et al. (2008), we categorize the 309 towns and boroughs (under
34 This is understandable. The court is bound to determine the interest rate between the interest rates claimed by the two parties. Thus, for the defendant, claiming any interest rate above zero could have nudged the judges toward awarding a higher judicial yield rate. 35 The values of observations in which the information is missing are coded as 0. 36 The defendant built a construction entirely on the plaintiff’s land. 37 The defendant put lumber, steel, concrete, etc. on the plaintiff’s land. 38 The defendant’s building, mainly situated on a neighboring plot owned by the defendant, encroaches over the land boundary.

Chang, Chen, Lin & Liu
14
counties and cities, respectively) in Taiwan into seven tiers based on
socio-demographic variables (including age, education, industrial structure,
occupation, and personal income). Stratum 1 is the most developed, while stratum 7 is
the least. Our current data have few observations in strata 6 and 7, so we combine
them and use it as the baseline. Five other dummy variables capture strata 1, 2, 3, 4,
and 5 which represent central business district, industrial and business districts,
growing towns, towns with traditional industries, and lowly developed towns,
respectively.
2. Reported Models
We run four sets of structure models, and each set contains two regression
models. The first model of each set39 uses one deviation variable for the plaintiff and
one for the defendant. The value of these two variables could be positive or negative,
as market yield rates could be higher than or lower than the parties’ claimed rates. The
second model of each set40 uses two deviation variables for the plaintiff and two for
the defendant: one that captures positive and zero deviation, whereas the other
captures negative deviation. The first set of models (Models 1–2) only includes
independent variables related to the claims by the two parties and the
three-judge-panel variables. The second set of models (Models 3–4) adds several
variables that are later shown to be most relevant to the determination of judicial yield
rates. The fourth set of models (Models 7–8) use as many control variables as we can.
The third set of models (Models 5–6) uses the same variables as the fourth set,
but excludes observations in which the judicial yield rate is 5%. Five percent is the
discount rate of future tort damages and the default prejudgment interest rate for
contract disputes in Taiwan. Judges who are clueless of how to set the right judicial
yield rate might pick 5%. The necessity of excluding these 5% cases in these
regression model can be illustrated in the following way. Assume that in two different
cases, one plaintiff claims an yield rate of 5% and the other 10% (when the market
yield rate is 3%), and in both cases the judges set the judicial yield rate at 5% because 39 Models 1, 3, 5, and 7. 40 Models 2, 4, 6, and 8.

Chang, Chen, Lin & Liu
15
of its familiarity (thus, in this sense, 5% here is like an anchor). In the former case, the
judicial decision might be interpreted as suffering from the anchoring effect, while in
the latter case, the anchoring effect appears to be weak. In fact, the plaintiff’s claim
produces no anchoring effect at all. To screen out the confounding effect, observations
in which courts settle on 5% are thus excluded. Granted, not all cases of 5% judicial
yield rates involve judges’ single-minded affinity towards 5%, but some may, and we
have no way to sort them out. No other rates can embody such a strong, potential
anchoring effect, so no other observations are excluded.41
C. Hedonic Regression Models on Market Rental Yield Rate
Identifying market rental yield rates is critical to our examination of whether courts in Taiwan mimic the market. Ideally, we will run hedonic regression models on rental yield rate, and then use the coefficients to estimate the rental yield rate of the land in question. Nevertheless, no comprehensive, reliable, available data on market sale prices and market lease rents of real estate are available before 2012. The available data after August 2012 enable us to estimate the market value and lease rent of the land parcels in our litigation database in December 2012 (the last month of our research period, and the month with the most numerous observations of transactions). The estimated market value is used as an independent variable in unreported regression models. The division of lease rent to market value—yield rate—is used in all regression models.
We run two ordinary least square (OLS) hedonic regression models with robust
standard errors, one for leases and one for sales. The dependent variable is the sale
price or lease rent. The independent variables control for the land size, zoning,
transaction month, and the number of plots involved. Only simple land sales and
leases are included. That is, transactions involving buildings are omitted, as the
judicial cases we sample also are limited to simple land disputes. The models take the
following form:
41 One counter argument to our exclusion practice is as follows: There are 409 different judges/judge panels in our dataset. Among them, 12 judges have produced more than 5 observations over three or more years. None of these dozen judges always awards the same judicial yield rate, nor do they adopt the same ratio of judicial yield rate to plaintiff’s claimed rate. Repeat judges are not numerous enough for us to tell whether 5% is a popular and/or strong anchor. Perhaps some judges are subject to three anchors: plaintiff’s claim rate, defendant’s claim rate, and 5%. This would be too complicated for us to model. At least, this concern justify our running models without including the 5% judgments.
Chang, Chen, Lin & Liu
16
P= α+ βA +θN + δZ + ηM + γS+ ε
where P is natural log of prices; A is natural log of land area; N is natural log of the
number of land plots involved; Z are 9 zoning dummies that capture 10 types of
zonings:42 non-urban (agricultural—not prime), non-urban (agricultural—prime),
non-urban (industrial), non-urban (preserved), non-urban (residential), urban
(industrial), urban (residential), urban (business), urban (agricultural), and urban
(other); M are dummy variables indicating the month of the transaction. S are a series
of dummies representing the strata of the town/city in which the land in question is
located. The coefficients to be estimated are α, β, δ, θ, η, γ; ε is an error term.
IV. DATA
A. Market Rental Yield Rate
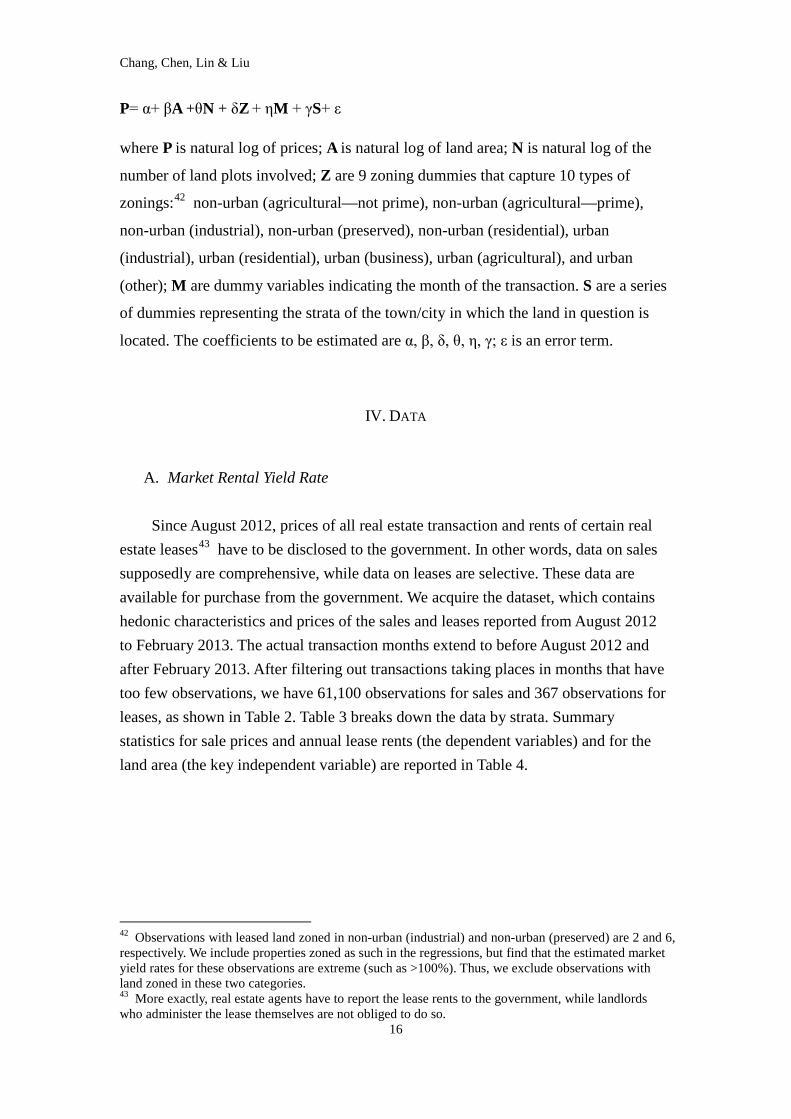
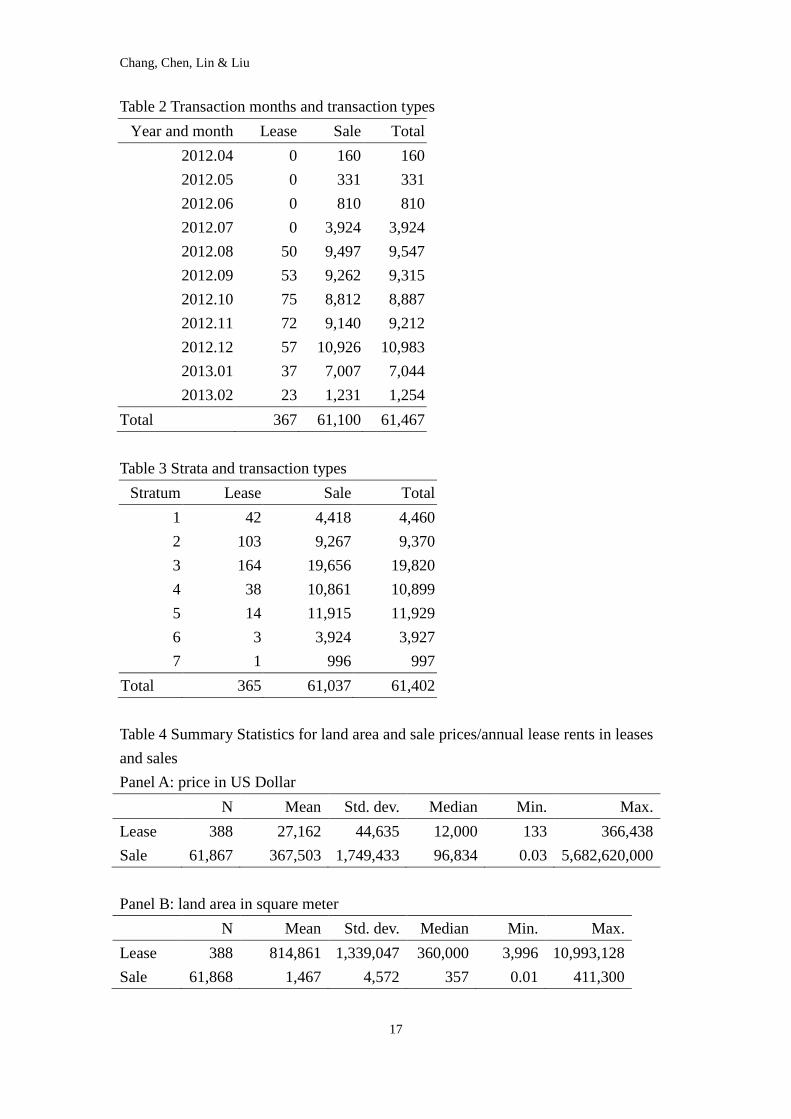
Since August 2012, prices of all real estate transaction and rents of certain real estate leases43 have to be disclosed to the government. In other words, data on sales supposedly are comprehensive, while data on leases are selective. These data are available for purchase from the government. We acquire the dataset, which contains hedonic characteristics and prices of the sales and leases reported from August 2012 to February 2013. The actual transaction months extend to before August 2012 and after February 2013. After filtering out transactions taking places in months that have too few observations, we have 61,100 observations for sales and 367 observations for leases, as shown in Table 2. Table 3 breaks down the data by strata. Summary statistics for sale prices and annual lease rents (the dependent variables) and for the land area (the key independent variable) are reported in Table 4.
42 Observations with leased land zoned in non-urban (industrial) and non-urban (preserved) are 2 and 6, respectively. We include properties zoned as such in the regressions, but find that the estimated market yield rates for these observations are extreme (such as >100%). Thus, we exclude observations with land zoned in these two categories. 43 More exactly, real estate agents have to report the lease rents to the government, while landlords who administer the lease themselves are not obliged to do so.
Chang, Chen, Lin & Liu
17
Table 2 Transaction months and transaction types Year and month Lease Sale Total
2012.04 0 160 160 2012.05 0 331 331 2012.06 0 810 810 2012.07 0 3,924 3,924 2012.08 50 9,497 9,547 2012.09 53 9,262 9,315 2012.10 75 8,812 8,887 2012.11 72 9,140 9,212 2012.12 57 10,926 10,983 2013.01 37 7,007 7,044 2013.02 23 1,231 1,254
Total 367 61,100 61,467
Table 3 Strata and transaction types Stratum Lease Sale Total
1 42 4,418 4,460 2 103 9,267 9,370 3 164 19,656 19,820 4 38 10,861 10,899 5 14 11,915 11,929 6 3 3,924 3,927 7 1 996 997
Total 365 61,037 61,402 Table 4 Summary Statistics for land area and sale prices/annual lease rents in leases and sales
Panel A: price in US Dollar N Mean Std. dev. Median Min. Max. Lease 388 27,162 44,635 12,000 133 366,438 Sale 61,867 367,503 1,749,433 96,834 0.03 5,682,620,000 Panel B: land area in square meter N Mean Std. dev. Median Min. Max. Lease 388 814,861 1,339,047 360,000 3,996 10,993,128 Sale 61,868 1,467 4,572 357 0.01 411,300

Chang, Chen, Lin & Liu
18
B. Judicial Cases
Using carefully chosen keywords, we are able to limit the cases showing up in our search to one specific factual pattern: unlawful possession of others’ land. Unlawful possession of others’ building, among others, is thus excluded, because building and land are two separate real estates in Taiwan (and in Japan and China),44 and data on official value and market value of buildings and their gap are difficult to acquire or unavailable. Also, cases in which the plaintiff requests returns of unjust enrichment but loses the case entirely are filtered out in the initial search. Small-claim and simple-proceeding cases are excluded because the judgments in these cases usually do not contain enough information about the cases. We limit our search to the cases rendered between January 1, 2004, and December 31, 2012. There are three waves of major reform in the Book of Things in the Taiwan Civil Code in 2007, 2009, and 2010. The research period is chosen so that our database includes cases as early as three years before the reform and those rendered as late as about three years after the reform. Finally, we focus on decisions by the court of first instance. As emphasized by Guthrie, Rachlinski, and Wistrich (2007: 4) and Eisenberg and Heise (2013), we study decisions by district/trial courts because most cases are handled by them and many of these decisions are final. In all, 2956 cases show up in our search. We randomly sample 34% of the cases in each of the 21 district courts in Taiwan, in order to have about 1000 cases in our dataset. After excluding small-claim and simple-proceeding cases that somehow show up in our search and excluding cases in which the judges do not determine a judicial yield rate (as judges may rely on market rent or contract rent), we have 698 cases, producing 818 observations.
As Figure 1 shows, 41% of the judicial yield rate is 5%. A 9% judicial yield rate is even more unpopular than a 1% judicial yield rate. Other judicial yield rates take up at most 12% of the observations. The mean judicial yield rate is 0.057. Figure 2 shows that 59% of the plaintiff claims an interest rate of 10%, whereas 24% (11%) of them request 5% (8%). Summary statistics of the variables used in the regression models are shown in Table 5. Notably, the ratio of judicial land value to market value ranges from 8.3% to 84.9%, demonstrating its variance and the great divide between the two values.45 The median area of land possessed by the defendant is 105 square meter (1130 square feet).
44 That is, a land parcel and the house upon it can be and are often owned by different persons. 45 All the ratios above 40% are from cases in which the court equates official land value with the higher ACLV. We have run regressions without these observations. The results are, again, essentially the same.

Chang, Chen, Lin & Liu
19
Table 5 Summary Statistics of Variables Used in the Regression Models
Panel A: Continuous variables
Variable types and names N Mean Median St. Dev. Min. Max. Characteristics of parties plaintiff number 819 1.7 1 2.7 1 35 defendant number 819 2.7 1 5.3 1 63 Land characteristics land area (square feet) 814 22838 1126 186536 0.4 5115598 unit judicial land value (US dollar per square feet)
801 8287 2008 77364 0.4 2173883
Ratio of judicial land value to market value (%)
816 21 17.8 10 8.3 84.9
Estimated market sale price (US dollar) 798 586232 128766 4980605 111 135097456
estimated encroached time (year) 775 10.4 5 12.9 0.2 100 Number of plots involved 818 1.6 1 1.7 1 27 Yield rates Judicial yield rate (%) 819 0.06 0.05 0.02 0.01 0.1 Defendant’s claimed yield rate (%) 91 0.04 0.05 0.02 0.01 0.1 Plaintiff’s claimed yield rate (%) 701 0.08 0.1 0.02 0.015 0.1 Market yield rate (%) 720 0.46 0.04 0.31 0.006 0.35
Panel B: categorical variables
Variable types and names Percentage Corporate plaintiff 11 Corporate defendant 10 Plaintiff is a government agency 38 Defendant is a government agency 3 Plaintiff with attorneys 80 Defendant with attorneys 41 Arable land 9 Land used for business purpose 5 Three-judge panel 8 Defendant claiming types 100 Defendant counters with an explicit rate 11 Defendant counters that the plaintiff’s claimed yield rate is too high 16

Chang, Chen, Lin & Liu
20
Defendants do not claim any yield rate 73 Plaintiff types 100 Plaintiff is the landowner 99 Plaintiff holds a lesser property interest 1 Defendant types 100 Defendant is a (co-)owner of nearby land or building 27.2 Defendant has a right (not ownership)to use nearby land or building 4.0 Defendant was simply an unlawful possessor 42.1 Defendant owns an unregistered building nearby 6.4 Defendant was a tenant of the land in question 13.7 Defendant built an unregistered building on the land in question 6.4 Defendant type unknown 1.1 Case types 100 Building encroachment 4.5 Constructing building 64.5 Land used as storage 2.7 Tenant continuing to use land after lease expires 8.7
Tenant continuing to use land after lease vacated 5.0 Co-tenant using land without permission from other co-tenants 3.8 Borrower continuing to use land after contract expires 3.2 Land used as parking lot 0.5 Access to landlocked land 0.5 Land used to grow crops 1.7 Buying building right in auction without acquiring right to use land 0.7 Other case types 4.3 Zoning (N=725) 100 Non-urban (agricultural—not prime) 1.8 Non-urban (agricultural—prime) 7.9 Non-urban (residential) 3.0 Urban (industrial) 3.3 Urban (residential) 47.5 Urban (business) 13.8 Urban (agricultural) 4.0 Urban (other) 18.8 Strata 100 1 central business district 26 2 industrial and business districts 30 3 growing towns 21

Chang, Chen, Lin & Liu
21
N=818, except noted otherwise. Figure 1 The distribution of judicial yield rates (the dependent variable)
N=819.
010
2030
40%
of o
bser
vatio
ns
0 .02 .04 .06 .08 .1judicial yield rate
4 towns with traditional industries 8 5 lowly developed towns 9 6+7 least developed towns 6 Year 100 2004 6.1 2005 7.9 2006 10.3 2007 13.2 2008 8.9 2009 11.8 2010 12.5 2011 13.8 2012 15.5

Chang, Chen, Lin & Liu
22
Figure 2 The distribution of the plaintiff’s claimed yield rates
N=701.
020
4060
% o
f cas
es
0 .02 .04 .06 .08 .1plaintiff's claimed yield rate

Chang, Chen, Lin & Liu
23
Figure 3 The distribution of the ratio of judicial land value to market value
N=816. Observations with >60% ratios are those in which the court uses the ACLV to compute rent.
V. FINDINGS AND DISCUSSIONS
A. Mimicking the Market?
As Table 6 shows, our hedonic regression models capture market sale prices and lease rents quite well, as the R-square is 0.73 and 0.56, respectively. Not surprisingly, the land size is highly statistically significant at the 0.001 level. The sign, relative size, and statistical significance of the five stratum dummies show that, again not surprisingly, land parcels in better economically developed region are rented and sold at a higher price. The regression coefficients enable us to estimate the market value and lease rent (and thus the yield rate) of the land parcels under disputes.
Feeding these estimates into the dataset of judicial cases allows us to test whether the judicial interest rates approximate the market yield rate (see the distribution of which in Figure 4), and we find the answer to be negative. First, judicial interest rates barely correlate with market yield rates (correlation coefficient=0.087; see Table 1). Because judges are aware of the fact that DLV is
05
1015
% o
f obs
erva
tions
0 20 40 60 80ratio of judicial land value to market value

Chang, Chen, Lin & Liu
24
much lower than market value, one would posit that judges may adjust upward the yield rate to make the final judicial award approximate market rent. To test this possibility, we calculate the “adjusted yield rates.” As Figure 5 shows, if courts aimed to mimic the market in setting judicial interest rates, most rates should be >10%, while courts only award <=10% (see also Figure 7). Put differently, judges in Taiwan tend to award below market rent to the plaintiff. More exactly, only 78 of the 700 observations (11%) have rent ratios >1, indicating that court-adjudicated rent is above market rent, while 604 of the 700 observations (86%) have a ratio <0.8 (Figure 6). Notably, as Figure 7 demonstrates, adjusted yield rates in cases in which courts adopt the ACLV (rather than the DLV or PALV) as the judicial land value all tend to approximate market yield rates. Moreover, there is no apparent pattern between market yield rate (or adjusted yield rate) and judicial yield rate (Table 1; Figure 7).46 Regression models on judicial yield rate provide a more nuanced picture. The variable that captures the gap between judicial land value and government-assessed market value always has negative signs and are (marginally) statistically significant (see Table 7). This finding suggests that judges appear to be on the right track—awarding higher premium above market yield rates when the available statistics pointing out that the official land value is more distant from the government-assessed market value. Nonetheless, judges’ adjustment falls short, and judicially adjudicated rents are still much below estimated market rents. In short, Taiwanese courts’ decisions on judicial yield rates can hardly be regarded as efficiency-enhancing or market-mimicking.
46 One may contend that our finding is due to omitted variable bias. The land in question has been occupied and used by a trespasser for a few years before its owner finds out and sues. This suggests that the owner has no plan to use the land anyway—perhaps a sign that the land can hardly be used for reasons not captured in our calculation. We acknowledge this possibility. But given that the detailed judgments do not mention this factor, and the trespasser apparently finds the land useful, the land may not be that “un-rentable” anyway. That being said, perhaps the true market rental yield rates for the plots in question may be a little bit below our point estimate market rental yield rates.

Chang, Chen, Lin & Liu
25
Table 6 Regression results for estimating market price and market rent (1) (2) Lease Sale
Dependent variable: ln of total rent or price =1 if stratum 1 1.771*** 2.765*** (0.485) (0.025) =1 if stratum 2 1.572*** 2.046*** (0.464) (0.021) =1 if stratum 3 1.406** 1.568*** (0.459) (0.018) =1 if stratum 4 1.215** 1.419*** (0.461) (0.018) =1 if stratum 5 0.525 0.452*** (0.516) (0.018) Ln of land area 0.584*** 0.855*** (0.048) (0.003) Ln of number of plot -0.032 0.057*** Zoning dummies Yes Yes Month dummies Yes Yes Constant 7.778*** 8.264*** (0.568) (0.043) Observations 364 60,538 R-squared 0.563 0.728
Robust standard errors in parentheses *** p<0.001, ** p<0.01, * p<0.05, + p<0.1

Chang, Chen, Lin & Liu
26
Figure 4 The distribution of market yield rate
N=714. For clarity purposes, observations with market yield rate>0.15 are omitted
from this figure.
05
1015
20%
of o
bser
vatio
ns
0 .05 .1 .15market yield rate

Chang, Chen, Lin & Liu
27
Figure 5 The distribution of adjusted yield rate
N=718. For clarity purposes, observations with adjusted yield rate>1 are omitted from
this figure.
02
46
810
% o
f obs
erva
tions
0 .2 .4 .6 .8 1adjusted market yield rate

Chang, Chen, Lin & Liu
28
Figure 6 Ratios of court-adjudicated rent to estimated market rent
N=677. For clarity of this figure, observations with (rent) ratio>2 have been omitted. Ratio=court-adjudicated rent / estimated market rent.
05
1015
2025
% o
f obs
erva
tions
0 .5 1 1.5 2rent ratio

Chang, Chen, Lin & Liu
29
Figure 7 Adjusted yield rate versus judicial yield rate
N=718. The dots or Xs to the right of the X=Y dotted line represent observations in which court-adjudicated rent<(government-assessed market value* market yield rate). This huge and prevalent gap is mainly due to the gap between the judicial land value and the government-assessed market value, and partly due to the differences between judicial yield rate and market yield rate.
B. Anchoring Effects
In the first three sets of models, the coefficients of the variable “plaintiff’s claimed rate minus market yield rate” have positive signs and are statistically significant at the 0.001 level (see Figure 8 for the visualization of the relationship between this variable and the dependent variable). To be more exact, in Models 2, 4, and 6, where the aforementioned variable is divided into two variables (one with positive or zero value and the other with negative values), only the variables that capture plaintiff’s over-claiming are statistically significant. In Models 7 and 8, these variables become statistically insignificant. As the only difference between Models 7–8 and Models 5–6 is the inclusion of observations in which the judicial yield rates are 5%, our theory is that, as noted above, the 5% rate as anchor has produced a much weaker, even negative, anchoring effect, such that the average effect becomes indistinguishable from zero (in more than 200 observations, judicial yield rate=5%).
0.0
2.0
4.0
6.0
8.1
judi
cial
yie
ld ra
te
0 .2 .4 .6 .8 1adjusted yield rate
fitted line X=YDLV or PALV cases ACLV cases

Chang, Chen, Lin & Liu
30
In all, the empirical results are substantial evidence for the existence of anchoring effect in real litigation.
Our explanation is that the anchoring effects exist due to “insufficient adjustment”
(Kahneman 2011: 120–122). In a typical case, a Taiwanese judge first learns of the
plaintiff’s claimed yield rate, gathers more information from the two parties, and
finally makes a trip to the land in question to observe the neighborhood. We posit that
judges who know the 10% legal cap would tend to award 10% to the highest-yielding
parcels and 1% or 2% to the lower-yielding parcels. Plaintiff’s (over-)claims enter
into judges’ minds as anchors, and then judges adjust downward, depending on the
land yielding capacity. Judges, however, may often adjust insufficiently, and thus
gives the plaintiff a judicial yield rate that is too high. Note, however, that the magnitude of the coefficient of “difference between
plaintiff’s claim and market yield rate” tends to decrease when more independent variables are added to the regression models. This suggests that the judicial decision-making is influenced by other factors as well, such as land size and length of trespass. Not controlling for these factors would lead to over-estimation of the anchoring effect.
In all eight regression models, the variables “three-judge panel” and the
interaction term “difference of plaintiff’s claimed rate minus market yield rate *
three-judge panel” do not exhibit statistically significant results. We offer two theories.
First, the group polarization effect is neutralized by the deliberation effect. Second, a
three-judge panel is still a one-man show. Wang and Wei (2012), in their empirical
studies of deliberation process of three-judge panels at the district court level in
Taiwan, show that in some cases, the responsible judge in the panel drafts the
decisions and thus naturally dictates the final outcome. Nevertheless, in some cases,
the chief judge in the panel, because of his/her seniority, has the final say in the
outcome. Judicial yield rates are not a legal issue that could arouse strong emotion or
stark legal debate. Thus, we posit that the either the responsible judge or the chief
judge may give a number, and others do not object. As a result, a three-judge panel
does not make a difference in determining judicial yield rates.
The psychology literature has found that keeping counter evidence in mind
weakens, or even neutralizes, the anchoring effect (Mussweiler, Strack, and Pfeiffer
2000; Galinsky and Mussweiler 2001). In our study, the defendant’s claimed rental
yield rate serves as the anchor-inconsistent knowledge. When two numbers—one high,

Chang, Chen, Lin & Liu
31
one low—are before the judges, and both can be informative or self-serving, judges
may be more conscious of their decisions on judicial yield rates. In our model, we use
two variables to test this hypothesis. The interaction term (“plaintiff’s claimed yield
rate minus market yield rate” * a dummy on whether the defendant raises an explicit
counter yield rate) has negative coefficients and are statistically significant in 6 of the
8 models. The variable that captures the difference of defendant’s explicit claimed
yield rate minus market yield rate” has positive coefficients and are (marginally)
statistically significant in 6 of the 8 models. This suggests that defendants’ claim
weakens the anchoring effect of plaintiff’s claim, and the lower the defendant
over-claims (perhaps by mistake or for other reasons), the lower the judges
over-award. The empirical evidence is thus consistent with the psychological thesis.
Figure 8 The effect of plaintiff’s deviation from market yield rate on the deviation of judicial yield rate from market yield rate
N=580. Jitter effect is applied in this figure to make the overlapping dots more visible.
-.1-.0
50
.05
.1J
rate
- m
arke
t yie
ld ra
te
-.1 -.05 0 .05 .1P claim – market yield rate
1 observation fitted liney=x, y=0, and x=0

Chang, Chen, Lin & Liu
32
VI. CONCLUSION
In this article, we empirically study the unjust enrichment cases involving
unlawful possession of land in Taiwan. Doctrinally, the compensation paid by the
trespasser to the landowner should be equivalent to rent. District courts in Taiwan,
however, award less than market rent. Moreover, courts are strongly influenced by the
plaintiff’s claim. Our efforts in estimating market rental yield rate partly explains why
courts suffer from the anchoring effect—there were no data to count on or counter the
claimed yield rate advocated by the plaintiff. Hence, while the prior literature has
found that judges in Taiwan have tended to make efficient decisions in certain private
law contexts, in unjust enrichment cases, judges in Taiwan have not been mimicking
the market.

Chang, Chen, Lin & Liu
33
Table 7 Regression results for estimating judicial yield rate Dependent variable: judicial yield rate minus market yield rate
(1) (2) (3) (4) (5) (6) (7) (8)
Coeff. Ste Coeff. Ste Coeff. Ste Coeff. Ste Coeff. Ste Coeff. Ste Coeff. Ste Coeff. Ste
Interest rates
Plaintiff's Claimed minus Market Yield Rates (Diff) 0.506 (0.060)*** 0.325 (0.071)*** 0.371 (0.104)*** -0.076 (0.076)
Diff as Diff>=0 0.482 (0.074)*** 0.336 (0.081)*** 0.418 (0.115)*** -0.087 (0.083)
Diff as Diff<0 0.062 (0.332) 0.247 (0.348) 0.803 (0.293)** 0.377 (0.252)
=1 if Diff>=0 0.011 (0.007) 0 (0.008) -0.012 (0.008) -0.008 (0.006)
=1 if Three-judge Panel 0.005 (0.010) 0.005 (0.010) 0.009 (0.010) 0.009 (0.010) -0.011 (0.011) -0.012 (0.011) -0.002 (0.009) -0.003 (0.009)
Diff X Three-judge Panel 0.146 (0.199) 0.136 (0.202) 0.123 (0.191) 0.12 (0.194) 0.304 (0.214) 0.277 (0.211) 0.231 (0.204) 0.231 (0.194)
=1 if Defendant Do Not Counter with an Explicit Rate -0.033 (0.009)*** -0.026 (0.012)* -0.023 (0.010)* -0.013 (0.014) -0.021 (0.012)+ 0.005 (0.019) -0.021 (0.010)* -0.007 (0.013)
=1 if Defendant Counters that Plaintiff’s Rate Too High -0.042 (0.010)*** -0.034 (0.013)** -0.035 (0.011)** -0.026 (0.014)+ -0.028 (0.013)* -0.002 (0.020) -0.031 (0.011)** -0.017 (0.014)
Defendant's Explicit Claimed Minus Market Rates
(Diff_d) 0.783 (0.186)*** 0.571 (0.198)** 0.36 (0.225) 0.4 (0.208)+
Diff_d as Diff_d>=0 1.398 (0.391)*** 1.345 (0.399)*** 0.411 (0.437) 0.704 (0.396)+
Diff_d as Diff_d<0 0.522 (0.321) 0.243 (0.329) -0.213 (0.3510 0.046 (0.302)
=1 if Diff_d>=0 -0.005 (0.011) -0.006 (0.011) 0.025 (0.014)+ 0.006 (0.011)
Diff_d X Diff as Diff>=0 -0.695 (0.183)*** -0.657 (0.192)*** -0.573 (0.200)** -0.521 (0.205)* -0.413 (0.260) -0.256 (0.285) -0.484 (0.200)* -0.386 (0.203)+
Land characteristics
=1 if Commercial Use 0.01 (0.007) 0.009 (0.007) 0.01 (0.007) 0.008 (0.007) 0.012 (0.007)+ 0.01 (0.007)
Land Area (Logarithm) 0.007 (0.001)*** 0.008 (0.001)*** 0.006 (0.002)*** 0.006 (0.002)*** 0.01 (0.001)*** 0.01 (0.001)***
Unit Declared Land Value (Logarithm) 0.009 (0.002)*** 0.009 (0.002)*** 0.003 (0.002) 0.003 (0.002) 0.002 (0.002) 0.002 (0.002)

Chang, Chen, Lin & Liu
34
Ratio of Judicial Land Value to Market Value
(Logarithm) -0.009 (0.006) -0.009 (0.006) -0.013 (0.006)* -0.012 (0.006)+ -0.012 (0.005)* -0.012 (0.005)*
=1 if Arable Land 0.004 (0.008) 0.005 (0.008) -0.014 (0.010) -0.016 (0.009)+ -0.013 (0.007)+ -0.014 (0.007)*
Estimated Encroachment Time (Logarithm) -0.002 (0.001)+ -0.002 (0.001)+ -0.005 (0.002)* -0.004 (0.002)* -0.003 (0.001)** -0.003 (0.001)**
Characteristics of parties
Plaintiff Number (Logarithm) 0.001 (0.003) 0.001 (0.003) -0.002 (0.002) -0.002 (0.002)
Defendant Number (Logarithm) -0.008 (0.003)** -0.008 (0.003)** -0.004 (0.002)* -0.004 (0.002)*
=1 if Corporate Plaintiff 0.006 (0.006) 0.007 (0.006) 0.003 (0.004) 0.004 (0.004)
=1 if Corporate Defendant -0.011 (0.006)+ -0.013 (0.006)* -0.006 (0.005) -0.006 (0.005)
=1 if Plaintiff is a Gov’t Agency -0.01 (0.007) -0.009 (0.007) -0.001 (0.004) 0.000 (0.004)
=1 if Defendant is a Gov’t Agency -0.013 (0.010) -0.014 (0.010) -0.003 (0.007) -0.004 (0.007)
=1 if Plaintiff with Attorneys -0.001 (0.006) -0.002 (0.006) -0.005 (0.004) -0.005 (0.004)
=1 if Defendant with Attorneys 0.004 (0.004) 0.005 (0.004) 0.003 (0.003) 0.003 (0.003)
Number of Plots (Logarithm) 0.005 (0.004) 0.004 (0.004) 0.004 (0.003) 0.003 (0.003)
Party Type (co-owner of nearby land or building as
reference) (all dummies)
Defendant is Usufructuary of Nearby Land or Building 0.001 (0.013) -0.001 (0.013) 0.002 (0.008) 0.002 (0.008)
Defendant is Simply an Unlawful Possessor 0.009 (0.006)+ 0.009 (0.006) 0.002 (0.004) 0.002 (0.004)
Defendant owns an Unregistered Building Nearby 0.001 (0.008) -0.001 (0.009) 0.003 (0.006) 0.002 (0.006)
Defendant was a Tenant 0.037 (0.016)* 0.039 (0.016)* 0.017 (0.009)* 0.018 (0.009)*
Defendant Builds Unregistered Building on Land in
Question 0.015 (0.008)+ 0.015 (0.008)+ 0.011 (0.007)+ 0.011 (0.007)+
Other Types of Defendant 0.002 (0.024) -0.003 (0.0230) 0.013 (0.019) 0.01 (0.018)
Plaintiff is a Lesser Property Interest Holder -0.004 (0.015) 0.002 (0.0190) 0.005 (0.008) 0.005 (0.009)

Chang, Chen, Lin & Liu
35
Case Type (Building encroachment as reference) (all
dummies)
Constructing Building -0.012 (0.009) -0.011 (0.009) -0.005 (0.008) -0.004 (0.007)
Land used as Storage -0.053 (0.013)*** -0.052 (0.013)*** -0.034 (0.010)*** -0.034 (0.010)***
Tenant continues to use Land after Lease Expires -0.03 (0.017)+ -0.034 (0.017)+ -0.013 (0.011) -0.014 (0.011)
Borrower continues to use Land after Contract Expires -0.005 (0.016) -0.004 (0.016) -0.004 (0.011) -0.005 (0.010)
Buying Building right in Auction without Acquiring right
to use Land -0.001 (0.018) 0.009 (0.016) 0.016 (0.017) 0.021 (0.015)
Land used as Parking Lot 0.015 (0.020) 0.014 (0.019) 0.034 (0.014)* 0.034 (0.014)*
Land used to Grow Crops 0.022 (0.018) 0.02 (0.018) -0.005 (0.016 -0.007 (0.016)
Co-owner uses Land without Other Co-tenants’ Consent 0.007 (0.012) 0.007 (0.012) 0.014 (0.010) 0.014 (0.010)
Access to Landlocked Land Collinearity Collinearity 0.008 (0.011) 0.008 (0.011)
Tenant continues to use Land after Lease is Vacated -0.044 (0.020)* -0.044 (0.021)* -0.031 (0.012)* -0.03 (0.013)*
Other types -0.008 (0.012) -0.005 (0.012) -0.007 (0.010) -0.006 (0.010)
Constant 0.037 (0.009)*** 0.02 -0.013 -0.047 (0.020)* -0.059 (0.022)** -0.015 (0.030) -0.04 (0.034) -0.02 (0.023) -0.029 (0.024)
Sigma 0.034 (0.002)*** 0.034 (0.002)*** 0.032 (0.001)*** 0.031 (0.001)*** 0.027 (0.002)*** 0.026 (0.002)*** 0.025 (0.001)*** 0.025 (0.001)***
Year fixed effects No No No No Yes Yes Yes Yes
Zoning fixed effects No No No No Yes Yes Yes Yes
Strata fixed effects No No No No Yes Yes Yes Yes
Note: Robust standard errors are in parentheses. *** p<0.001, ** p<0.01, * p<0.05, + p<0.1

Chang, Chen, Lin & Liu
36
References Acciarri, Hugo, and Nuno Garoupa. 2013. On the Judicial Interest Rate: Towards a
Law and Economics Theory. Journal of European Tort Law forthcoming. Ariely, Dan. 2008. Predictably Irrational: The Hidden Forces That Shape Our
Decisions. New York, NY: Harper. Arruñada, Benito, and Veneta Andonova. 2008a. Common Law and Civil Laws as
Pro-Market Adaptations. Washington University Journal of Law & Policy 26:81–130.
———. 2008b. Judges' Cognition and Market Order. Review of Law & Economics 4 (2):665–692.
Chang, Yun-chien. 2009. Empire Building and Fiscal Illusion? An Empirical Study of Government Official Behaviors in Takings. Journal of Empirical Legal Studies 6:541–584.
———. 2011. An Empirical Study of Court-Adjudicated Takings Compensation in New York City: 1990-2003 Journal of Empirical Legal Studies 8 (2):384–412.
———. 2012a. Self-Assessment of Takings Compensation: An Empirical Study. Journal of Law, Economics & Organization 28.
———. 2012b. Tenancy in “Anticommons”?: A Theoretical and Empirical Analysis of Co-ownership. Journal of Legal Analysis 4:515–553.
———. 2013a. Private Property and Takings Compensation: Theoretical Framework and Empirical Analysis. Northampton, Mass.: Edward Elgar.
———. 2013b. To Tear or Not to Tear? An Empirical Study of Boundary Encroachment Cases in Taiwan.
Dannemann, Gerhard. 2009. The German Law of Unjustified Enrichment and Restitution: A Comparative Introduction. Oxford: Oxford University Press.
English, Birte, and Thomas Mussweiler. 2001. Sentencing Under Uncertainty: Anchoring Effects in the Courtroom. Journal of Applied Social Psychology 31 (7):1535–1551.
Epleya, Nicholas, and Thomas Gilovich. 2010. Anchoring Unbound. Journal of Consumer Psychology 20:20–24.
Galinsky, Adam D., and Thomas Mussweiler. 2001. First Offers as Anchors: The Role of Perspective-Taking and Negotiator Focus. Journal of Personality and Social Psychology 81 (4):657–669.
Guthrie, Chris, Jeffrey J. Rachlinski, and Andrew J. Wistrich. 2000. Inside the Judicial Mind. Cornell Law Review 86:777–830.
———. 2007. Blinking on the Bench: How Judges Decide Cases. Cornell Law Review 93:1–43.
Hans, Valerie P., and Valerie F. Reyna. 2011. To Dollars from Sense: Qualitative to

Chang, Chen, Lin & Liu
37
Quantitative Translation in Jury Damage Awards. Journal of Empirical Legal Studies 8 (S1):120–147.
Heller, Michael A. 2008. The Gridlock Economy: How Too Much Ownership Wrecks Markets, Stops Innovation, and Costs Lives. N.Y., NY: Basic Books.
Hou, Pei-chun, Su-Hao Tu, Pei-shan Laio, Yung-Tai Hung, and Ying-Hwa Chang. 2008. The Typology of Townships in Taiwan: The Analysis of Sampling Stratification of the 2005–2006 "Taiwan Social Change Survey". Survey Research—Method and Application 23:7–32.
Huber, Walt, Levin P. Messick, and William Pivar. 2006. Real Estate Appraisal: Principles and Procedures. 3 ed. Covina, California: Educational Textbook Company.
Kahneman, Daniel. 2011. Thinking, Fast and Slow. New York, NY: Farrar, Straus and Giroux.
Knoll, Michael S. 1996. A Primer on Prejudgment Interest. Texas Law Review 75:293–374.
Krebs, Thomas. 2004. Unrequested Benefits in German Law. In Understanding Unjust Enrichment 247–262, edited by Jason W. Neyers, Mitchell McInnes and Stephen G.A. Pitel. Portland, Oregon: Hart.
Mussweiler, Thomas, Fritz Strack, and Tim Pfeiffer. 2000. Overcoming the Inevitable Anchoring Effect: Considering the Opposite Compensates for Selective Accessibility. Personality and Social Psychology Bulletin 26 (9):1142–1150.
Niblett, Anthony, Richard A. Posner, and Andrei Shleifer. 2010. The Evolution of a Legal Rule. The Journal of Legal Studies 39 (2):325–358.
Posner, Richard A. 1973. Economic Analysis of Law. Boston: Little, Brown. ———. 1998. Economic Analysis of Law. 5 ed. New York: Aspen. Priest, George L. 1977. The Common Law Process and the Selection of Efficient
Rules. The Journal of Legal Studies 6:65–82. Rachlinski, Jeffrey J., Chris Guthrie, and Andrew J. Wistrich. 2007. Heuristics and
Biases in Bankruptcy Judges. Journal of Institutional and Theoretical Economics 163 (1):167–186.
Rubin, Paul H. 1977. Why Is the Common Law Efficient? The Journal of Legal Studies 6 (1):51–63.
Sunstein, Cass R., Reid Hastie, John W. Payne, David A. Schkade, and Kip W. Viscusi. 2002. Punitive Damages: How Juries Decide. Chicago, IL: University of Chicago Press.
Wistrich, Andrew J., Chris Guthrie, and Jeffrey J. Rachlinski. 2005. Can Judges Ignore Inadmissible Information? The Difficulty of Deliberately Disregarding. University of Pennsylvania Law Review:1251–1345.

Chang, Chen, Lin & Liu
38
German literature
Buck-Heeb, Petra. 2011. Ungerechtfertigte Bereicherung - Unerlaubte Handlungen. In
Erman Bürgerliches Gesetzbuch 3485–3576. Edited by Harm Peter Westermann. 13
ed. Köln: Dr. Otto Schmidt.
Sprau, Hartwig. 2013. Werkvertrag und ähnlich Verträge - Unerlaubte Handlugen. In
Palandt Bürgerliches Gesetzbuch 967–1438. Edited by Otto Palandt. 72 ed. Munich:
C.H. Beck.
Chinese literature
Wang, Chin-Shou, and Hung-Ru Wei. 2012. An Empirical Study of Judicial Deliberation in District Courts in Taiwan. Taiwan: A Radical Quarterly in Social Studies 88: 127–169
Top Related
Copyright © 2022 FDOKUMEN

