


Bahasa
Halaman
Hukum


PT Bank Mandiri (Persero) Tbk1Q 2017Results Presentation
April 25, 2017

Share Information
∆ from: IPO Dec 31, 2016
BMRI 1,662.05% 1.08%
JCI 961.22% 5.12%
-200%
0%
200%
400%
600%
800%
1000%
1200%
1400%
1600%
1800%
Sep
-03
Mar
-04
Sep
-04
Mar
-05
Sep
-05
Mar
-06
Sep
-06
Mar
-07
Sep
-07
Mar
-08
Sep
-08
Mar
-09
Sep
-09
Mar
-10
Sep
-10
Mar
-11
Sep
-11
Mar
-12
Sep
-12
Mar
-13
Sep
-13
Mar
-14
Sep
-14
Mar
-15
Sep
-15
Mar
-16
Sep
-16
Mar
-17
BMRI
JCI
No. of Investor % No. of shares %
I DOMESTIC
1. Government of RI 1 0.01% 14,000,000,000 60.00%
2. Retail 10,487 74.02% 187,122,880 0.80%
3. Employees 1,714 12.10% 10,437,918 0.04%
4. Cooperatives 4 0.03% 363,600 0.00%
5. Foundation 23 0.16% 15,184,145 0.07%
6. Pension Funds 120 0.85% 146,080,764 0.63%
7. Insurance 74 0.52% 524,892,085 2.25%
8. Banks 1 0.01% 150,000 0.00%
9. Corporations 68 0.48% 306,893,169 1.32%
10. Mutual Funds 244 1.72% 501,154,973 2.15%
Total 12,736 89.90% 15,692,279,534 67.25%
II INTERNATIONAL
1. Retail 96 0.68% 1,075,298 0.00%
2. Institutional 1,335 9.42% 7,639,978,501 32.74%
Total 1,431 10.10% 7,641,053,799 32.75%
No. DescriptionBy 31 March 2017
III TOTAL 14,167 100.00% 23,333,333,333 100.00%

2
Table of Contents
Results Overview Page #
Corporate Strategy 3 – 4
Indonesia’s Economic Condition 5
Key Indicators + Financial Highlights 6 – 7
SBU Performance Highlights 8
Bank’s Performance 9 – 11
Loan Performance 12 – 13
ROE, Forex Loan & NIM 14 – 16
Fee-Based & CIR 17 – 18
Wholesale Business 19 – 21
Retail Business 22 – 28
Non-Performing Loan & Restructured Loan 29 – 32
Subsidiaries 33 – 34
Corporate Guidance 35
Additional Information
Operating Performance Highlights
Supporting Materials

Corporate Plan – Realigning Our 2020 Initiatives
Accelerate in Growth Segments
Integrate The GroupDeepen Client Relationship
Indonesia’s Top Financial Institution:Grow above the market, portfolio quality focused, employer of choice in Indonesia
• Become the first choice in consumer
banking, especially in the middle-
income class
• Focus on micro fixed income earners
and asset-backed consumer lending
• Selectively grow SME segment and
productive micro by focusing on asset
quality
Drive subsidiaries’ performance by
increasing synergies within the
Mandiri Group.
Increase distribution network
productivity
Strengthen presence in ASEAN
countries
• Strengthen Bank Mandiri’s position as
the No. 1 Corporate Bank
• Grow in-line with the market in the
Commercial Banking segment
• Offering sector specific solution and
integrated product packages.
Current Achievements (1Q 2017)
Consumer Loans Rp87.3Tn (+18.8% YoY)
Micro Loans Rp52.2Tn (+18.0% YoY)
SME Loans Rp57.5Tn (+2.5% YoY)
Current Achievements (1Q 2017) Current Achievements (1Q 2017)
Corporate Loans Rp235.4Tn (+26.3% YoY)
Wholesale Fee Income Rp2.0Tn (28.1% of wholesale income)
Total income from subsidiaries Rp544Bn (13.3% of EAT)
Average CASA per branch grew by 7.9%
Obtained Singapore Capital Market License
3

2016-2020 Bank Mandiri Corporate Plan– How We Plan To Get There
Focus on Core Business▪ Grow corporate lending above the market growth rate and
deepen relationships with existing clients▪ Increase fee based income & wholesale current accounts
Expanding into Underpenerated Low-Risk Segments
▪ Accelerate consumer lending growth: mortgages, auto loan and salary based loans
▪ Push retail CASA growth through Bank@Work▪ Defend market share in SME
Strengthen The Foundation
▪ Lower cost to income ratio through digitalization and productivity enhancements
▪ Reduce NPL ratio by improving the loan underwriting process▪ Increase utilization and sophistication of data analytics to
enhance insights and cross-selling.
Strategic Initiatives Description
4

5
Inflation Starts to Pick Up
Source : CEIC, Bloomberg
Decreasing inflation gave room to monetary policy easing
Current account balance in 4Q16 was quite stable
4Q16 GDP Growth
3.61
4.75
2
3
4
5
6
7
8
9
10
Mar-1
0
Mar-1
1
Mar-1
2
Mar-1
3
Mar-1
4
Mar-1
5
Mar-1
6
Mar-1
7
Headline inflation (% YoY)
Core inflation (% YoY)
BI Rate
7 Days RR
(10)
(5)
-
5
10
15
(15)
(10)
(5)
-
5
10
15
20
1Q10
2Q10
3Q10
4Q10
1Q11
2Q11
3Q11
4Q11
1Q12
2Q12
3Q12
4Q12
1Q13
2Q13
3Q13
4Q13
1Q14
2Q14
3Q14
4Q14
1Q15
2Q15
3Q15
4Q15
1Q16
2Q16
3Q16
4Q16
Capital and Financial AccountCurrent Account (CA)
BoP
4.5
5
5.5
6
6.5
7
4Q
09
2Q
10
4Q
10
2Q
11
4Q
11
2Q
12
4Q
12
2Q
13
4Q
13
2Q
14
4Q
14
2Q
15
4Q
15
2Q
16
4Q
16
5.57
3.30
4.94
6.50
6
Fee Income & Cost Savings Support 11.9% PPOP Growth
22
.10
%
24
.40
%
22
.00
%
22
.55
%
22
.23
%
20
.95
%
18
.33
%
9.6
6%
12
.64
%
10
.56
%
20
09
20
10
20
11
20
12
20
13
20
14
20
15
20
16
1Q
16
1Q
17
Return on Equity (%)
Total CASA (Rp Bn) Non Performing Loan (%)
18
6,4
92
20
1,9
58
25
6,3
95
31
6,1
27
35
9,9
57
38
0,5
12
44
3,8
74
48
9,3
80
40
6,5
25
46
5,6
43
20
09
20
10
20
11
20
12
20
13
20
14
20
15
20
16
1Q
16
1Q
17
2.7
9%
2.4
2%
2.2
1%
1.8
7%
1.9
0%
2.1
5%
2.6
0%
4.0
0%
3.1
8%
3.9
8%
20
09
20
10
20
11
20
12
20
13
20
14
20
15
20
16
1Q
16
1Q
17
7,1
55
9,2
18
12
,24
6
15
,50
4
18
,20
4
19
,87
2
20
,33
5
13
,80
7
3,8
17
4,0
79
20
09
20
10
20
11
20
12
20
13
20
14
20
15
20
16
1Q
16
1Q
17
Earning After Tax (Rp Bn)
12
,43
0
16
,69
3
19
,23
4
23
,01
8
28
,40
8
31
,50
7
38
,38
1
43
,25
8
9,6
67
10
,82
2
20
09
20
10
20
11
20
12
20
13
20
14
20
15
20
16
1Q
16
1Q
17
PPOP (Rp Bn)
Net Interest Margin (%)
5.0
4%
5.2
8%
5.1
1%
5.4
6%
5.7
4%
5.9
7%
6.0
8%
6.4
4%
6.4
2%
5.9
0%
20
09
20
10
20
11
20
12
20
13
20
14
20
15
20
16
1Q
16
1Q
17
YoY11.9%
YoY 6.9%
YoY(16.5%)
YoY14.5%
YoY25.1%
YoY(8.1%)

1Q 2016 1Q 2017 %
Loans Rp 574.7Tn Rp 656.2Tn 14.18%
Gross NPL RatioNet NPL Ratio
3.18%1.16%
3.98%1.33%
25.12%14.46%
Low Cost Funds Ratio[Low Cost Funds (Rp)]
62.1%Rp 406.5 Tn
63.7%Rp 465.6Tn
2.63%14.54%
NIM 6.42% 5.90% (8.13)%
Efficiency Ratio 44.46% 42.68% 3.99%
PPOP Rp 9,667Bn Rp 10,822Bn 11.9%
Earnings After Tax Rp 3,817 Bn Rp 4,079Bn 6.86%
7
Key Financial Highlights
Bank Mandiri’s 1Q 2017 performance showing improvements:

8
Balanced Earnings from All Business Units
519
1,222
194
373
766
603
1,296
253
621
1,117
Micro & Business Banking
Consumer
Commercial
Corporate
Treasury & Markets
1Q '17 1Q '16
Net Interest Income Analysis 1Q 2017 (YTD)
(Rp Bn)
Fee Based Income 1Q 2017 (YTD)
(Rp Bn)
1,1
10
1,1
15
1,1
61 7
31
1Q'17 1Q'16
1,0
24
1,1
36
51
1
47
4
1Q'17 1Q'16
1,0
28
97
2
3,2
24
2,2
92
1Q'17 1Q'16
1,6
13
1,7
08
1,9
94
1,4
66
1Q'17 1Q'16
2,271
1,846
1,5361,610
4,253
3,264
3,607
3,174
Treasury & Markets
Corporate Banking
Commercial Banking
Consumer Banking
Micro & Business Banking
*) Excluding AXA Dividend Rp 612 Bn
*
1,0
94
87
8
18
4
89
1Q'17 1Q'16
1,279
967
Deposits by Product – Consolidated(Rp Tn)
Loans by SBU + Subsidiaries(Rp Tn)
97
.1
12
1.9
15
1.8
18
6.9
21
4.7
20
1.9
20
3.0
20
8.0
22
7.7
20
7.3
21
1.0
21
8.1
24
3.7
22
4.1
24
7.9
24
7.2
27
2.0
25
9.0
9.711.6
12.0
15.3
20.722.1 23.2 22.3
24.723.3 25.4 29.4
28.024.7
25.7 27.030.3
28.5
53
.9
46
.2
67
.3
77
.9
73
.4
67
.2
74
.2
79
.6
78
.9 83
.4
91
.7
90
.7
10
1.2 9
5.4
10
0.2
10
1.2
12
4.4
11
7.6
18.822.2
25.3
36.1
51.143.5 45.0
52.049.1
58.175.8 77.6
70.9
62.4
65.6 61.8
62.7
60.5
10
8.4
14
7.8
14
8.1
15
0.7
17
6.2
17
6.9
19
0.0
20
1.6
22
2.3
22
6.2
22
0.5
21
2.1
20
6.3 2
24
.4
22
7.8
22
9.6
24
2.1
23
8.5
15.1
12.5
17.8
16.1
20.120.0
20.5
27.5
33.7 30.530.5 26.6
26.224.2
24.2 23.6
31.1
26.9
020406080
100120140160180200220240260280300320340360380400420440460480500520540560580600620640660680700720740760780800
4Q
'09
4Q
'10
4Q
'11
4Q
'12
4Q
'13
1Q
'14
2Q
'14
3Q
'14
4Q
'14
1Q
'15
2Q
'15
3Q
'15
4Q
'15
1Q
'16
2Q
'16
3Q
'16
4Q
'16
1Q
'17
FX Time Rp Time
FX Demand Rp Demand
FX Savings Rp Savings
69
.8
93
.1
11
0.9
13
0.2
16
7.9
17
5.8
17
4.5
18
0.6
18
5.0
19
8.8
18
5.2
20
5.0
21
1.4
23
0.3
23
4.7
4.51.4
1.41.8
2.0 1.3 0.8 1.0 0.91.4
1.31.2 1.1
1.1 0.8
49
.1
63
.8
80
.7
10
2.7
11
6.9
14
2.8
14
5.1
14
8.9
14
9.4
16
0.6
15
3.7
15
8.5
16
2.6
16
5.2
15
2.7
23.6
30.7
39.0
47.7
56.6
64.7 65.767.7 69.5
72.373.4
76.178.9
84.8 87.2
17.1
22.7
30.2
38.4
46.5
56.0 55.3 57.9 57.9
60.5
56.1
60.059.8
60.857.5
5.4
7.3
11.8
19.0
27.0
34.6 37.239.7
40.0
42.5
44.2
46.0 46.7
50.652.2
18.8
27.2
40.5
48.9
55.5
54.7 54.357.0 57.9
59.4
60.9
63.9
64.869.3 71.2
020406080
100120140160180200220240260280300320340360380400420440460480500520540560580600620640660680700
4Q
'09
4Q
'10
4Q
'11
4Q
'12
4Q
'13
4Q
'14
1Q
'15
2Q
'15
3Q
'15
4Q
'15
1Q
'16
2Q
'16
3Q
'16
4Q
'16
1Q
'17
Subsidiaries Micro
Small Cons
Comm Int'l
Corp + SAM
Maintaining Momentum for Growth
Y-o-Y
11.4%
6.3%
(3.0%)
23.3%
15.6%
Y-o-Y
2.5%
(0.6%)
26.8%
(39.3%)15.7%
14.2%656.2 Tn
Total Total
655.1 Tn
731.1 Tn
11.6%
16.9%
9
574.7 Tn
18.8%
18.0%

10
Strong and Liquid Balance Sheet
Assets 1Q 2017 1Q 2016 Liabilities 1Q 2017 1Q 2016
Cash 21,213 18,440 Current Account 178,124 157,769
Current Acc w/ BI & Other Banks 62,665 57,414 Savings 287,519 248,757
Placement w/ BI & Other Banks 73,767 58,048 Time Deposits 265,471 248,538
Advances (Other) 30,376 26,542
Marketable Securities 58,695 45,787 Total Deposits 731,115 655,063
Government Bonds 102,537 98,607
Loans (Gross) 656,211 574,704 Securities Issued 9,026 2,396
Provisions of Loans (34,755) (24,099) Deposits from other banks 33,893 26,332
Net Loans 621,457 550,605 Subordinated Debt 195 3,712
Reverse Repo 2,309 16,339 Borrowings 34,536 33,945
Other Provisions (1,723) (2,312) Other Int. Bearing Liabilities 15,783 14,102
Deferred Tax Assets 5,514 4,318 Non Int. Bearing Liabilities 57,935 53,142
Other Assets 57,499 32,952 Equity incl. Minority Interest 151,824 118,047
Total 1,034,307 906,739 Total 1,034,307 906,739

11
Revenue Growth Driven by Strong Fee Income
Summary P&L (Rp Bn) 1Q 2017 1Q 2016Y-o-Y (%)
4Q 2016Q-o-Q
(%)
Interest Income 19,443 18,308 6.2% 19,825 -1.9%
Interest Expense 6,627 5,976 10.9% 6,656 -0.4%
Net Interest Income 12,816 12,331 3.9% 13,168 -2.7%
Net Premium Income 614 706 -13.1% 357 72.0%
Net Interest Income & Premium Income 13,430 13,037 3.0% 13,525 -0.7%
Other Non Interest Income
* Other Fees and Commissions 2,996 2,531 18.4% 3,202 -6.4%
* Foreign Exchange Gains - Net 653 417 56.7% 631 3.6%
* Gain fr. sale & Incr. in Val & Sale of Bonds 262 203 29.0% 90 192.0%
* Others 1,345 1,052 27.9% 1,899 -29.2%
Total Non Interest Income 5,256 4,203 25.1% 5,822 -9.7%
Total Operating Income 18,686 17,240 8.4% 19,347 -3.4%
Provisions, Net (5,401) (4,596) 17.5% (8,734) -38.2%
Personnel Expenses (3,498) (3,406) 2.7% (3,435) 1.8%
G&A Expenses (3,401) (3,305) 2.9% (3,517) -3.3%
Loss from decr. in value of Sec & Gov Bonds - - -
Other Expenses (965) (862) 12.0% (1,011) -4.5%
Total Expense (7,864) (7,572) 3.9% (7,963) -1.2%
Profit from Operations 5,421 5,071 6.9% 2,651 104.5%
Non Operating Income (24) (5) 391.4% (17) 39.4%
Net Income Before Tax 5,397 5,066 6.5% 2,634 104.9%
Net Income After Tax 4,079 3,817 6.9% 1,793 127.4%
12
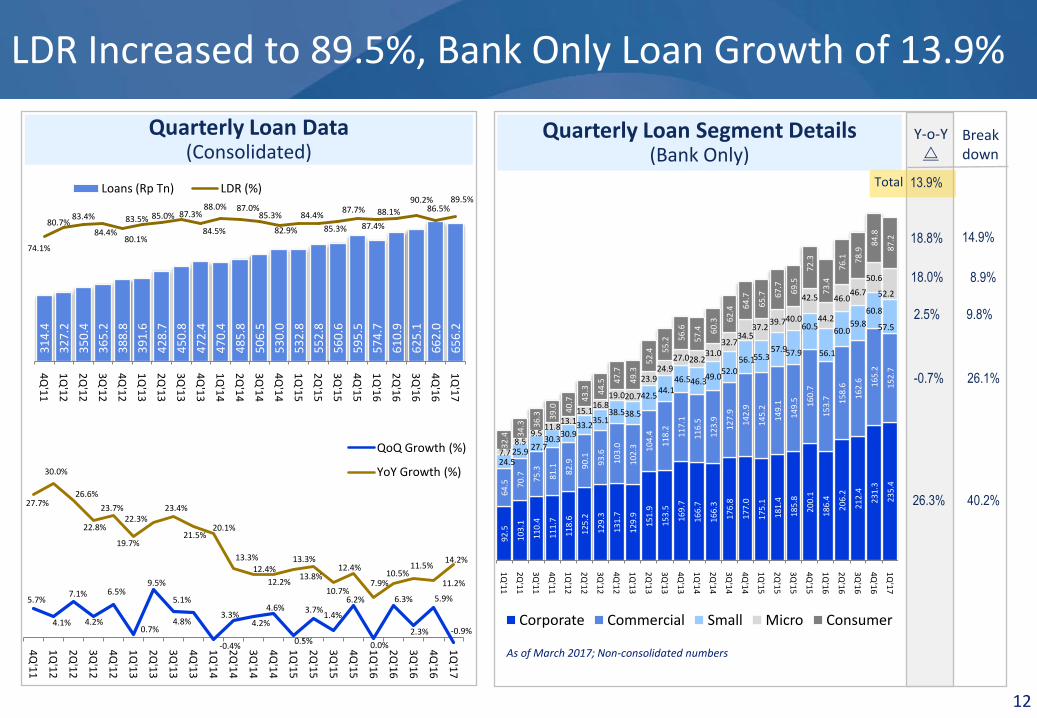
LDR Increased to 89.5%, Bank Only Loan Growth of 13.9%
92.
5
103.
1
110
.4
111
.7
118.
6
125.
2
12
9.3
13
1.7
129.
9
15
1.9
153.
5
16
9.7
16
6.7
166.
3
176.
8
177.
0
175
.1
18
1.4
185.
8
200
.1
186.
4
206.
2
212.
4
231.
3
23
5.4
64
.5 70.7 75
.3
81.1
82.9 90
.1
93.6
103
.0
102.
3 10
4.4
118.
2
117
.1
116
.5
123.
9
127
.9
14
2.9
14
5.2
149.
1
149.
5 16
0.7
153.
7 158.
6
162
.6 16
5.2
15
2.7
24.525.9
27.730.3
30.933.2
35.138.538.5
42.544.1
46.546.349.0
52.056.155.3
57.957.9
60.5
56.1
60.059.8
60.8
57.5
7.78.5
9.511.8
13.115.1
16.819.020.7
23.924.9
27.028.231.0
32.734.5
37.239.740.0
42.5
44.2
46.046.7
50.6
52.2
32.
4 34
.3 36.3 39.
0
40.7 4
3.3
44.
5 47.7
49.3
52.4 55
.2 56.
6
57
.4 60.
3 62.
4 64
.7
65.
7 67.
7
69
.5
72.
3
73
.4
76
.1 78.
9
84
.8
87.
2
1Q'1
1
2Q'1
1
3Q'1
1
4Q'1
1
1Q'1
2
2Q'1
2
3Q'1
2
4Q'1
2
1Q'1
3
2Q'1
3
3Q'1
3
4Q'1
3
1Q'1
4
2Q'1
4
3Q'1
4
4Q'1
4
1Q'1
5
2Q'1
5
3Q'1
5
4Q'1
5
1Q'1
6
2Q'1
6
3Q'1
6
4Q'16
1Q'17
Corporate Commercial Small Micro Consumer
Quarterly Loan Segment Details(Bank Only)
Y-o-Y
18.8%
18.0%
2.5%
-0.7%
26.3%
13.9%Total
14.9%
8.9%
9.8%
26.1%
40.2%
Breakdown
As of March 2017; Non-consolidated numbers
31
4.4
32
7.2
35
0.4
36
5.2
38
8.8
39
1.6
42
8.7
45
0.8
47
2.4
47
0.4
48
5.8
50
6.5
53
0.0
53
2.8
55
2.8
56
0.6
59
5.5
57
4.7
61
0.9
62
5.1
66
2.0
65
6.2
74.1%
80.7%83.4%
84.4%80.1%
83.5% 85.0% 87.3%
84.5%
88.0% 87.0%85.3%
82.9%
84.4%
85.3%
87.7%
87.4%
88.1%
90.2%86.5%
89.5%
4Q
'11
1Q
'12
2Q
'12
3Q
'12
4Q
'12
1Q
'13
2Q
'13
3Q
'13
4Q
'13
1Q
'14
2Q
'14
3Q
'14
4Q
'14
1Q
'15
2Q
'15
3Q
'15
4Q
'15
1Q
'16
2Q
'16
3Q
'16
4Q
'16
1Q
'17
Loans (Rp Tn) LDR (%)
5.7%
4.1%
7.1%
4.2%
6.5%
0.7%
9.5%
5.1%
4.8%
-0.4%
3.3%4.2%
4.6%
0.5%
3.7%1.4%
6.2%
0.0%
6.3%
2.3%
5.9%
-0.9%
27.7%
30.0%
26.6%
22.8%
23.7%
19.7%
22.3%23.4%
21.5%20.1%
13.3%
12.4%
12.2%
13.3%
13.8%
10.7%
12.4%
7.9%10.5%
11.5%
11.2%
14.2%
4Q
'11
1Q
'12
2Q
'12
3Q
'12
4Q
'12
1Q
'13
2Q
'13
3Q
'13
4Q
'13
1Q
'14
2Q
'14
3Q
'14
4Q
'14
1Q
'15
2Q
'15
3Q
'15
4Q
'15
1Q
'16
2Q
'16
3Q
'16
4Q
'16
1Q
'17
QoQ Growth (%)
YoY Growth (%)
Quarterly Loan Data(Consolidated)

13
Rp 164.12 Tn in Loans Disbursed in 1Q 2017
592.67
164.12123.87
32.90 10.870.87 3.22
585.05
4Q'16 Disburs. Install. Payment Pay-off FX Impact Write-Offs
1Q '17
Loan Movement– 1Q 2017 Bank-OnlyRp Tn
Loan Disbursement by Segment – 1Q 2017 Bank-OnlyRp Tn
129.67
13.21
6.119.12
6.02
164.12
Corporate Commercial Small Micro Consumer Total
14
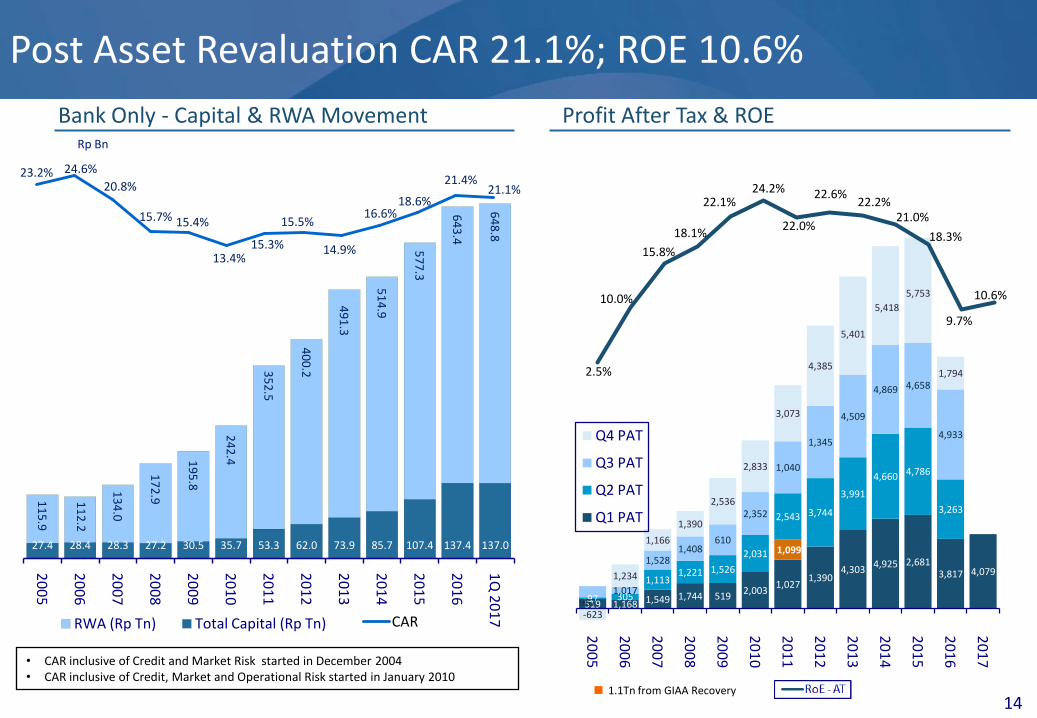
Post Asset Revaluation CAR 21.1%; ROE 10.6%
11
5.9
11
2.2
13
4.0
17
2.9
19
5.8
24
2.4
35
2.5
40
0.2
49
1.3
51
4.9
57
7.3
64
3.4
64
8.8
27.4 28.4 28.3 27.2 30.5 35.7 53.3 62.0 73.9 85.7 107.4 137.4 137.0
20
05
20
06
20
07
20
08
20
09
20
10
20
11
20
12
20
13
20
14
20
15
20
16
1Q
20
17
RWA (Rp Tn) Total Capital (Rp Tn)
Rp Bn
Bank Only - Capital & RWA Movement Profit After Tax & ROE
• CAR inclusive of Credit and Market Risk started in December 2004• CAR inclusive of Credit, Market and Operational Risk started in January 2010
1.1Tn from GIAA Recovery
23.2% 24.6%
20.8%
15.7% 15.4%
13.4%15.3%
15.5%
14.9%
16.6%18.6%
21.4%21.1%
CAR519 1,168 1,549 1,744 519
2,0031,027
1,390 4,303
4,925 2,681 3,817 4,079
1,099
97 305
1,1131,221 1,526
2,031
2,543 3,744
3,991
4,660 4,786
3,263
967 1,017
1,528 1,408
610
2,352
1,040
1,345
4,509
4,869 4,658
4,933
-623
1,234
1,166
1,390
2,536
2,833
3,073
4,385
5,401
5,418
5,753
1,794
20
05
20
06
20
07
20
08
20
09
20
10
20
11
20
12
20
13
20
14
20
15
20
16
20
17
Q4 PAT
Q3 PAT
Q2 PAT
Q1 PAT
2.5%
10.0%
15.8%
18.1%
22.1%24.2%
22.0%
22.6%22.2%
21.0%
18.3%
9.7%
10.6%

38
.60
41
.87
44
.44
40
.35
41
.88
45
.47
45
.73
49
.62
48
.17
53
.29
59
.79
67
.75
62
.22
62
.95
72
.24
75
.38
73
.52
76
.90
78
.52
87
.79
83
.85
86
.55
77
.72
87
.85
89
.14
82.9%
91.5%
89.0%
75.8%
76.0%
76.2%75.4%
76.4%
68.0%
65.1% 64.3%
69.0%
72.0%
71.3%
74.2%73.2%
66.8%
61.1%61.0%
73.1%
80.3% 79.2%
72.6%
74.3%
80.8%
50%
55%
60%
65%
70%
75%
80%
85%
90%
95%
100%
Mar 1
1
Jun
e 11
Sep 1
1
Dec 1
1
Mar 1
2
Jun
12
Sep 1
2
Dec 1
2
Mar 1
3
Jun
13
Sep 1
3
Dec 1
3
Mar 1
4
Jun
e 14
Sep 1
4
Dec 1
4
Mar 1
5
Jun
15
Sep 1
5
Dec 1
5
Mar 1
6
Jun
16
Sep 1
6
Dec 1
6
Mar 1
7
20
30
40
50
60
70
80
90
100
Loan FX LDR FX
Prudent Management of FX Balance Sheet
USD Bn
Rp TnBreakdown of FX lending (Bank-Only)1Q ’17 (Total USD 6.69 Bn)
0.03
0.03
0.13
0.15
0.31
0.41
0.58
0.77
0.77
1.26
2.25
Oth
Constr
Utilities
Bus Serv
Trans
Agri
Trading
Mining
Soc Serv
Oil & Gas
Mfg
% (YoY)
23%
34%
1%
0%
-12%
-36%
-1%
-33%
307%
-56%
-71%
FX Loans & LDR (Bank-Only)
15

16
Q1 Consolidated NIM of 5.9%
5.3
3%
5.8
4%
5.4
4%
5.1
9%
5.5
4%
5.8
4%
5.6
7%
5.5
0%
5.3
4%
5.7
1%
6.0
8%
5.9
4%
5.9
0%
5.8
4%
5.9
2%
5.4
1%
5.7
9%
5.7
4%
6.7
4%
6.2
8%
6.0
0%
7.0
6%
6.0
3%
5.6
9%
4Q
'09
4Q
'10
4Q
'11
1Q
'12
2Q
'12
3Q
'12
4Q
'12
1Q
'13
2Q
'13
3Q
'13
4Q
'13
1Q
'14
2Q
'14
3Q
'14
4Q
'14
*
1Q
'15
2Q
'15
3Q
'15
4Q
'15
**
1Q
'16
2Q
'16
3Q
'16
**
4Q
'16
1Q
'17
NIM
9.49.6
8.78.2 8.1
8.4
8.2 8.1 7.8
8.39.0 9.1 9.2 9.6 9.6
9.1 9.2 9.2 9.8 9.3 9.110.0
9.0
8.6
4.33.8
3.4
3.22.8 2.7 2.7 2.8 2.6
2.8 3.1 3.3
3.53.9 3.8 3.9
3.6 3.73.3
3.2
3.3
3.1 3.0 2.9
Yield on Assets (%)Cost of Funds (%)
6.47.2
5.3
4.9 5.1
4.4
4.5 4.5
6.6
4.2 4.3 4.4
6.4
4.64.6
13.3
3.84.3
1.50.7
0.60.7 0.7 0.8 0.7 0.7 0.9 1.1 0.8 0.7 0.7 1.0 1.0 1.2 1.3 1.3
0.0
2.0
4.0
6.0
8.0
10.0
12.0
14.0
4Q
'09
4Q
'10
4Q
'11
4Q
'12
4Q
'13
1Q
'14
2Q
'14
3Q
'14
4Q
'14
1Q
'15
2Q
'15
3Q
'15
4Q
'15
1Q
'16
2Q
'16
3Q
'16
4Q
'16
1Q
'17
12.6 12.5 12.5
11.3 11.8 11.8
12.012.4 12.2
12.1
12.2 12.2
12.1 11.911.3
11.3 11.3 10.8
6.7 6.5
4.1 4.0
5.3 5.45.9 5.7 6.0
6.4 6.4 6.7 6.9 7.06.6 6.7 6.8
6.6
4.74.2 3.9
3.03.7 3.9
4.14.6 4.4 4.5
4.3 4.33.8 3.7 3.6
3.5 3.4 3.3
0.0
2.0
4.0
6.0
8.0
10.0
12.0
Avg Loan Yield Avg Bond Yield Avg COF
* Starting on 4Q2014, we back out the LPS premium from the interest expense** 4Q 15 / 3Q16, If we adjust the interest income from RGM, NIM would be 6.5% / 6.0% , YoA would be 9.5% / 8.9%, Average FX Loan Yield 4.2% / 4.2%
17
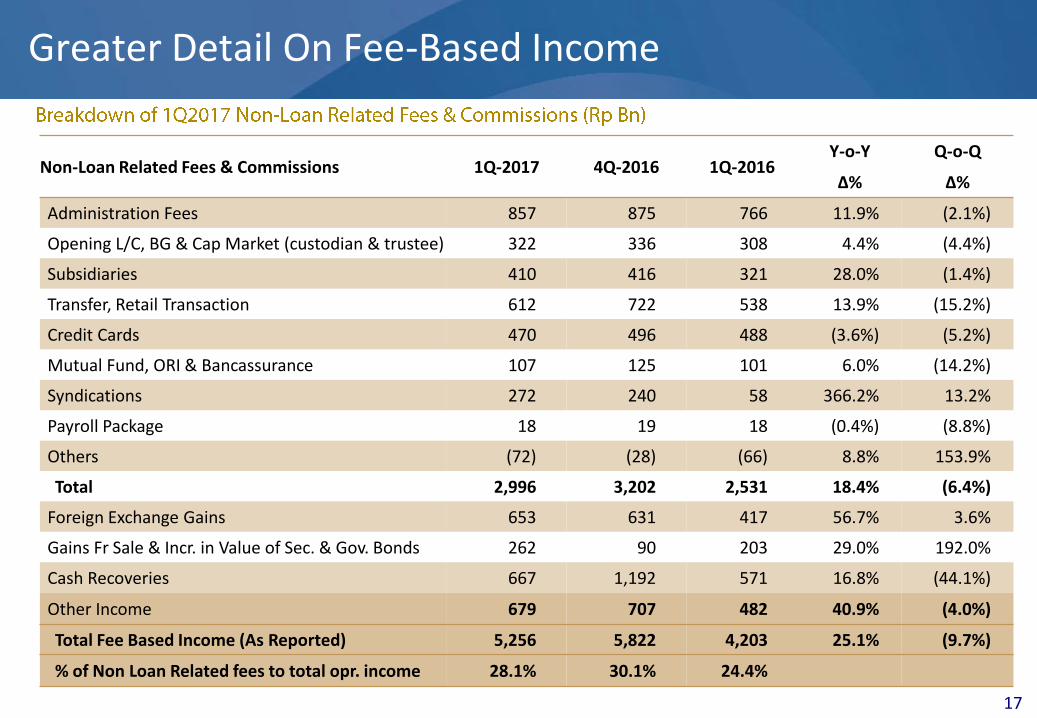
Greater Detail On Fee-Based Income
Non-Loan Related Fees & Commissions 1Q-2017 4Q-2016 1Q-2016Y-o-Y Q-o-Q
Δ% Δ%
Administration Fees 857 875 766 11.9% (2.1%)
Opening L/C, BG & Cap Market (custodian & trustee) 322 336 308 4.4% (4.4%)
Subsidiaries 410 416 321 28.0% (1.4%)
Transfer, Retail Transaction 612 722 538 13.9% (15.2%)
Credit Cards 470 496 488 (3.6%) (5.2%)
Mutual Fund, ORI & Bancassurance 107 125 101 6.0% (14.2%)
Syndications 272 240 58 366.2% 13.2%
Payroll Package 18 19 18 (0.4%) (8.8%)
Others (72) (28) (66) 8.8% 153.9%
Total 2,996 3,202 2,531 18.4% (6.4%)
Foreign Exchange Gains 653 631 417 56.7% 3.6%
Gains Fr Sale & Incr. in Value of Sec. & Gov. Bonds 262 90 203 29.0% 192.0%
Cash Recoveries 667 1,192 571 16.8% (44.1%)
Other Income 679 707 482 40.9% (4.0%)
Total Fee Based Income (As Reported) 5,256 5,822 4,203 25.1% (9.7%)
% of Non Loan Related fees to total opr. income 28.1% 30.1% 24.4%

18
1Q 17 Cost to Income Ratio of 42.7%
1,5
24
1,5
10
1,8
83
2,1
07
1,6
14
2,0
04
2,0
71
2,5
65
2,0
34
2,3
22
2,3
75
3,1
67
2,3
09
2,6
93
2,9
58
3,4
88
2,5
74
3,1
73
3,3
22
3,7
30
3,3
05
3,6
40
3,4
97
3,5
17
3,4
01
1,5
47
1,6
31
1,6
71
1,9
03
1,8
65
1,9
39
1,8
69
2,3
72
2,0
42
2,3
36
2,6
79
2,3
74
2,6
26
2,6
62
2,7
52
2,8
07
2,9
20
3,1
09
2,9
03
3,4
44
3,4
06
3,4
88
3,2
90
3,4
35
3,4
98
1Q
'11
2Q
'11
3Q
'11
4Q
'11
1Q
'12
2Q
'12
3Q
'12
4Q
'12
1Q
'13
2Q
'13
3Q
'13
4Q
'13
1Q
'14
2Q
'14
3Q
'14
4Q
'14
1Q
'15
2Q
'15
3Q
'15
4Q
'15
1Q
'16
2Q
'16
3Q
'16
4Q
'16
1Q
'17
G&A Expenses Personnel Expenses
Breakdown of 1Q 2017 Operating ExpensesQuarterly Consolidated Operating Expenses & CIR
(Rp Bn) (Rp Bn)
32.4%
37.3%
39.0%41.6%
44.0%43.2%
42.7%
51.3%
41.1%
43.1%
42.5%
48.4%
41.8%
43.2%46.6%
44.4%
44.4% 45.2%
40.1%
42.7%44.5%
46.0%
38.5%41.3%
42.7%
CIR (%)
Q1 2017 Q4 2016 Q1 2016Growth
QoQ YoY
Personnel Expenses
Base Salary 934 882 879 5.9% 6.3%
Other Allowances 1,618 1,542 1,635 4.9% (1.1%)
Post Empl. Benefits 83 54 96 55.7% (13.6%)
Training 60 177 81 (66.0%) (25.8%)
Subsidiaries 802 780 714 2.9% 12.3%
Total Personnel Expenses 3,498 3,435 3,406 1.8% 2.7%
G&A Expenses
IT & telecoms 585 573 540 2.1% 8.3%
Occupancy Related 663 839 595 (20.9%) 11.4%
Promo & Sponsor 235 386 293 (39.2%) (19.7%)
Transport & Travel 152 189 150 (19.7%) 1.2%
Goods, Prof. Svcs. & Oth. 453 668 437 (32.2%) 3.7%
Employee Related 605 622 579 (2.8%) 4.5%
Subsidiaries 709 240 711 195.6% (0.3%)
Total G&A Expenses 3,401 3,517 3,305 (3.3%) 2.9%
Other Expenses 965 1,011 862 (4.5%) 12.0%
Total Operating Expenses 7,864 7,963 7,572 (1.2%) 3.9%

19
Top 10 Industries in Corporate Lending Expansion1Q ’17 – 1Q’16 (Total Rp49.09 Tn)
Rp Bn2,365
2,859
3,161
3,461
4,611
4,806
5,004
6,630
8,450
12,659
Mfg-NonM
Mfg-Chem
Mining-Metal Ore
Bus Serv
Mining-Oil & Gas
Trad-Exp
Roads & Bridge
Trad-Ret
Mfg-F&B
Electricity
%
110%
44%
169%
94%
215%
43%
28%
52%
20%
89%Rp Bn
Top 10 Industries in Commercial Lending Contraction1Q ’17 – 1Q ’16 (Total –Rp1.02 Tn)
-324
-428
-509
-650
-690
-734
-941
-1,167
-1,294
-2,885
Mfg-Wood
SocServ-Health
Mfg-Text
Mining-Oil & Gas
Trad-Exp
Mining-Coal
Plantations
Trad-Distr
Mfg-P&P
4 Wheels-Vehicles
%
-62%
-26%
-6%
-6%
-16%
-27%
-17%
-7%
-39%
-16%
Diversifying our Strength in Wholesale Lending…

20
Wholesale Transactions Driving CASA
74
52
,41
44
,06
66
,15
37
,78
41
0,9
43
11
,89
91
2,9
32
13
,62
91
3,8
73
14
,10
51
4,3
97
14
,67
61
5,1
01
15
,56
51
6,2
00
16
,85
31
7,5
92
18
,53
1
20
06
20
07
20
08
20
09
20
10
20
11
20
12
20
13
3Q
14
4Q
14
1Q
15
2Q
15
3Q
15
4Q
15
1Q
16
2Q
16
3Q
16
4Q
16
1Q
17
Cash Management Users
24
86
77
1,1
78
2,2
01
2,6
57
3,5
98
3,9
89
4,4
84
4,8
32
5,1
23
5,2
66
5,3
84
5,7
04
7,0
85
7,3
92
7,5
63
8,4
39
4Q
10
4Q
11
4Q
12
4Q
13
1Q
14
2Q
14
3Q
14
4Q
14
1Q
15
2Q
15
3Q
15
4Q
15
1Q
16
2Q
16
3Q
16
4Q
16
1Q
17
Average # of Cash Management Tx(000), total 25.3 Mn transactions in
1Q 2017*
*) Excluding Mandiri Transaction System
Wholesale CASA Deposits(Rp Bn)
58
,05
5
62
,25
7
61
,69
1
53
,60
4
74
,11
6
89
,95
9
74
,33
4
73
,19
2
14
0,2
78
14
9,3
51
12
6,4
30
14
2,4
87
-
20,000
40,000
60,000
80,000
100,000
120,000
140,000
160,000
180,000
20
07
20
08
20
09
20
10
20
11
20
12
20
13
20
14
20
15
20
16
1Q
16
1Q
17
12.7% YoY Growth

21
Strong Pickup in Forex, As Trade Transactions Remain Slow
Forex
34
42
63
61
56
41
46
11 14
281,153
310,512322,795
399,500 379,730
348,436
433,929
106,291114,186
-
50,000
100,000
150,000
200,000
250,000
300,000
350,000
400,000
450,000
500,000
-
10.0
20.0
30.0
40.0
50.0
60.0
70.0
80.0
90.0
Dec 10 Dec 11 Dec 12 Dec 13 Dec 14 Dec 15 Dec 16 Mar 16 Mar 17
Value (USD Bn) # of Trx
Wholesale Remittance
70
94
12
1
13
5
14
6
12
6
90
22 28
435,866 448,219
599,909 651,241
739,046 730,011
399,585
125,510 137,920
-
100,000
200,000
300,000
400,000
500,000
600,000
700,000
800,000
-
20.0
40.0
60.0
80.0
100.0
120.0
140.0
160.0
180.0
Dec 10 Dec 11 Dec 12 Dec 13 Dec 14 Dec 15 Dec 16 Mar 16 Mar 17
Value (USD Mn) # of Trx
*) Excluding Mandiri Transaction System
Mandiri Cash Management*
54
9
81
8
1,5
19
2,2
31
3,1
20
3,7
78
4,5
49
91
4
1,3
04
2,503 7,668
13,676 24,543
44,184
61,599
82,075
17,869
25,316
(25,000)
(5,000)
15,000
35,000
55,000
75,000
95,000
-
500.0
1,000.0
1,500.0
2,000.0
2,500.0
3,000.0
3,500.0
4,000.0
4,500.0
5,000.0
Dec 10 Dec 11 Dec 12 Dec 13 Dec 14 Dec 15 Dec 16 Mar 16 Mar 17
Value (Rp Tn) # of Trx (000)
Trade Transactions : Export, Import, Domestic
85
11
0
12
5
13
3
13
7
12
7
10
7
23
31
495,813 510,916 517,251 520,948
509,207 468,870
406,669
101,017 105,974
-
100,000
200,000
300,000
400,000
500,000
600,000
-
20.0
40.0
60.0
80.0
100.0
120.0
140.0
160.0
Dec 10 Dec 11 Dec 12 Dec 13 Dec 14 Dec 15 Dec 16 Mar 16 Mar 17
Value (USD Bn) # of Trx

22
Retail Deposits Increased by 13.4% Year on Year
13
2.7
14
0.6
14
6.1
16
5.0
15
7.5
16
6.8
17
6.3
19
0.9
17
9.0
18
0.8
18
4.7
20
2.6
18
2.5
18
6.0
18
8.0
20
9.8
19
3.0
21
4.8
21
2.1
23
3.5
22
0.5
12.712.813.0
13.714.715.6
18.420.7
21.022.021.8
24.0
22.223.224.3
23.121.1
21.723.1
26.024.5
14.615.416.1
18.617.0
16.7
28.6
33.029.733.634.4
40.2
33.536.425.0
31.9
29.0
29.930.5
36.532.9
4.3 4.3
10.711.4
12.111.913.1
13.0
12.814.4
7.8
7.6
6.9
6.5 6.8
9.0
9.3
71.670.3
71.5
71.472.1
70.7
80.2
84.588.4
100.1108.3
120.0
119.2116.0
110.0
110.3
112.2
115.5116.9
120.0
119.5
5.05.0 5.1
5.04.7
4.6
6.4
7.06.3
7.07.2
9.5
9.0 7.8
7.7
7.4
6.9
6.8 7.0
10.711.7
0
20
40
60
80
100
120
140
160
180
200
220
240
260
280
300
320
340
360
380
400
420
440
460
480
1Q
'12
2Q
'12
3Q
'12
4Q
'12
1Q
'13
2Q
'13
3Q
'13
4Q
'13
1Q
'14
2Q
'14
3Q
'14
4Q
'14
1Q
'15
2Q
'15
3Q
'15
4Q
'15
1Q
'16
2Q
'16
3Q
'16
4Q
'16
1Q
'17
Rp Savings Deposits FX Savings Deposits Rp Demand Deposits
FX Demand Deposits Rp Time Deposits FX Time Deposits
Retail Deposit Analysis – Bank Only
2.2%1.7%
2.0% 2.0% 2.0% 2.0% 2.1% 1.9% 2.1% 2.1% 2.1% 2.0% 1.8% 1.9% 2.1%2.3%
2.1%1.5% 1.5% 1.6% 1.5% 1.5% 1.4% 1.3% 1.2% 1.2% 1.2% 1.3% 1.1% 1.1% 1.1% 1.1%
6.3%
5.1%
6.6%7.0%
7.3%
8.3%7.9% 7.8%
7.4% 7.5% 7.2%6.9% 6.7% 6.6% 6.4% 6.2%
0%
5%
10%
4Q
'11
4Q
'12
4Q
'13
1Q
'14
2Q
'14
3Q
'14
4Q
'14
1Q
'15
2Q
'15
3Q
'15
4Q
'15
1Q
'16
2Q
'16
3Q
'16
4Q
'16
1Q
'17
Rp DD
Rp Savings
Rp TD
Average Quarterly Deposit Costs (%)
0.1% 0.2% 0.3% 0.3% 0.3% 0.3% 0.3% 0.3% 0.3%0.4%
0.2%
0.3%
0.6%0.7% 0.8%
0.7%0.8%
0.6%0.8%
1.2% 1.2% 1.1%1.3%
1.8%
1.2%
0.8%
0.6% 0.5%
0.5% 0.6% 0.6%0.7%
0.0%
0.5%
1.0%
1.5%
2.0%
4Q
'11
4Q
'12
4Q
'13
1Q
'14
2Q
'14
3Q
'14
4Q
'14
1Q
'15
2Q
'15
3Q
'15
4Q
'15
1Q
'16
2Q
'16
3Q
'16
4Q
'16
1Q
'17
FX DD FX TD
66.5%69.6%
70.1%
72.5%
71.6%
73.0% 73.7% 71.9%69.9%
68.8%
68.4%66.2%
67.7% 67.6%
69.8%
67.7%
69.1%
68.8%
70.0%
68.6%
CASA as % of total deposits

44,21052,195
7,985
1Q2016 Growth 1Q2017
23
63
,32
3
66
,85
1
73
,32
4
81
,04
6
84
,67
5
91
,50
4
96
,26
8
10
5,1
92
10
8,4
34
11
8,7
88
12
3,8
33
13
0,1
58
13
1,8
57
14
0,1
89
14
6,7
44
15
5,3
38
15
8,1
73
16
5,3
04
16
7,4
29
17
5,2
11
17
3,7
39
18
2,1
90
18
5,3
35
19
6,1
94
19
6,9
09
28.6%
27.6%28.3%
29.6%
29.8%
30.2%30.9%
31.8% 31.7%
31.3% 31.2%
31.8%
32.6% 32.7%33.1% 33.3%
32.7%
33.8%33.1% 33.1%
33.7%
20%
22%
24%
26%
28%
30%
32%
34%
30,00040,00050,00060,00070,00080,00090,000
100,000110,000120,000130,000140,000150,000160,000170,000180,000190,000200,000210,000220,000230,000
1Q
20
11
2Q
20
11
3Q
20
11
4Q
20
11
1Q
20
12
2Q
20
12
3Q
20
12
4Q
20
12
1Q
20
13
2Q
20
13
3Q
20
13
4Q
20
13
1Q
20
14
2Q
20
14
3Q
20
14
4Q
20
14
1Q
20
15
2Q
20
15
3Q
20
15
4Q
20
15
1Q
20
16
2Q
20
16
3Q
20
16
4Q
20
16
1Q
20
17
Retail to Total Loans
Consumer and Micro Are Key Retail Growth Drivers
Retail to Total Loans
Micro Credit Business Banking Consumer
(Rp Bn)
Business Banking
56,108 57,508
1,401
1Q2016 Growth 1Q2017
YoY2.5%
(Rp Bn)
Micro Credit
YoY18.1%
(Rp Bn)
73,41387,206
13,794
1Q2016 Growth 1Q2017
YoY18.8%
Consumer

Strong Microfinance Growth
24
20
0
30
0
50
2
68
7
89
8
99
4
1,0
84
1,0
85
60
0
80
0
80
0
87
8
92
8
1,0
27
1,1
27
1,4
27
1,7
18
1,7
17
10
15
2
48
0
71
0
76
0
75
1
70
6
65
3
61
2
61
1 6
10 10
20
08
20
09
20
10
20
11
20
12
20
13
20
14
20
15
20
16
1Q
17
Branch Unit Kiosk Cash Outlet
Customers (000)Network # Of New Customers
73
,56
6
79
,50
0
76
,32
5
94
,85
5
74
,03
7
11
0,0
00
1
21
,00
7
14
6,3
59
1
26
,50
9
14
0,0
64
1
31
,71
5
14
7,8
25
1
38
,74
7
16
0,6
20
1
36
,19
6
16
2,1
81
1
40
,88
6
16
7,1
45
1
58
,90
9
16
2,7
38
1
34
,50
1
13
8,5
00
9
7,1
64
1
27
,82
8
13
0,2
27
1
46
,32
3
11
7,5
65
1
17
,97
1
11
6,4
40
1Q
'10
2Q
'10
3Q
'10
4Q
'10
1Q
'11
2Q
'11
3Q
'11
4Q
'11
1Q
'12
2Q
'12
3Q
'12
4Q
'12
1Q
'13
2Q
'13
3Q
'13
4Q
'13
1Q
'14
2Q
'14
3Q
'14
4Q
'14
1Q
'15
2Q
'15
3Q
'15
4Q
'15
1Q
'16
2Q
'16
3Q
'16
4Q
1'6
1Q
1'7
271
430
562
694
815
889
1,009
1,112
1,2081,195
20
08
20
09
20
10
20
11
20
12
20
13
20
14
20
15
20
16
1Q
17

25
…as well as Consumer Lending, which Rose 18.8% Y-o-Y as Mortgages Grew 12.3%
14
,26
8
15
,52
3
16
,46
6
17
,77
9
18
,76
4
20
,11
3
20
,91
9
22
,81
8
24
,09
2
26
,13
5
27
,35
7
26
,99
5
26
,69
0
26
,50
5
26
,34
7
26
,49
5
26
,20
7
26
,34
0
26
,36
9
26
,83
2
26
,86
9
27
,65
1
28
,00
1
29
,99
4
30
,17
2
3,9
64
3,9
79
3,9
49
3,8
87
3,7
77
3,6
79
3,5
71
3,4
71
3,3
65
3,3
12
3,2
40
3,1
81
3,1
72
3,1
98
3,2
40
3,3
10
3,3
26
3,4
32
3,5
34
3,7
39
3,8
92
4,3
13
4,9
14
5,8
81
6,2
46
6,3
98
6,7
08
6,8
61
6,9
95
7,1
43
7,4
12
7,7
53
8,2
06
8,3
86
8,9
58
9,3
74
9,7
81
10
,03
0
10
,64
2
11
,25
3
11
,88
0
12
,20
1
12
,83
8
13
,40
8
14
,10
3
14
,49
7
15
,27
9
16
,16
0
17
,44
1
17
,98
6
3,5
75
3,7
61
3,9
10
4,2
96
4,2
45
4,4
92
4,5
90
5,0
35
5,0
25
5,1
95
5,3
03
5,6
20
5,5
57
6,8
55
7,5
68
8,2
88
8,3
43
8,7
51
8,6
83
8,9
70
8,7
68
8,7
61
8,6
74
9,1
28
9,0
48
3,4
54
3,4
92
4,2
00
5,1
15
5,8
29
6,5
93
6,6
09
7,2
09
7,4
86
7,9
05
9,0
13
10
,21
8
11
,08
3
12
,26
0
13
,27
1
13
,98
3
14
,89
0
15
,63
0
16
,64
1
17
,60
8
18
,34
4
18
,98
1
20
,00
1
21
,12
4
22
,55
5
698 791
873 928
964 1,016
1,037
1,010 966 927
904 809 840
805 765
750 683 733
892 998 1,043
1,091 1,133
1,194 1,199
0
5,000
10,000
15,000
20,000
25,000
30,000
35,000
40,000
45,000
50,000
55,000
60,000
65,000
70,000
75,000
80,000
85,000
90,000
95,000
100,000
1Q
'11
2Q
'11
3Q
'11
4Q
'11
1Q
'12
2Q
'12
3Q
'12
4Q
'12
1Q
'13
2Q
'13
3Q
'13
4Q
'13
1Q
'14
2Q
'14
3Q
'14
4Q
'14
1Q
'15
2Q
'15
3Q
'15
4Q
'15
1Q
'16
2Q
'16
3Q
'16
4Q
'16
1Q
'17
Other
Auto
Credit Cards
Payroll Loans
Home Equity Loans
Mortgages
Loan TypeGrowth (%)
Y-o-Y Q-o-Q
Other 14.97% 0.47%
Auto Loans 22.96% 6.77%
Credit Cards 3.20% -0.88%
Payroll Loans 24.07% 3.12%
Home Equity Loans 60.49% 6.21%
Mortgages 12.29% 0.59%
Total Consumer 18.79% 2.88%
Quarterly Consumer Lending Balances by Type Consumer Lending Growth by Type
Rp 87.2 Tn
*Auto & Motorcycle Loans channeled or executed through finance companies = Rp 10.1 Tn in our Commercial Portfolio

26
Transaction Capabilities Growth Driven By Mobile Banking Transaction Volume
Quarterly Transaction Value (Rp Tn) Quarterly Users (Mn)
95.5
122.2
147.7 153.8
170.0
179.3
191.2 192.6
208.1 210.0
241.5
245.0
236.8
252.7
238.0
248.3
271.2
2.1 3.5 4.1 5.0 6.6 8.3 10.5
17.6 28.3 35.7
38.9 53.0 55.3
68.9
67.8
84.0 85.2
7.1 14.0
18.1 23.5 26.8
29.4 33.3 33.3
34.5 46.7
32.6
36.1
36.5
35.5
40.0 37.3
0
20
40
60
80
100
120
140
160
180
200
220
240
260
280
4Q
'09
4Q
'10
1Q
'11
2Q
'11
3Q
'11
4Q
'11
1Q
'12
2Q
'12
3Q
'12
4Q
'12
1Q
'13
2Q
'13
3Q
'13
4Q
'13
1Q
'14
2Q
'14
3Q
'14
4Q
'14
1Q
'15
2Q
'15
3Q
'15
4Q
'15
1Q
'16
2Q
'16
3Q
'16
4Q
'16
1Q
'17
ATM
Mobile Banking
Internet Banking
7.7
8.6 8.2
9.2
10.0
10.6
11.1 11.6
11.8 12.4
12.6
12.6
13.6 13.8
14.1 14.4
3.2
4.7 4.9 5.3
5.6 5.8
6.1 6.3
6.5 6.7 6.8 6.9 7.0 7.1 7.3 7.4
1.2 1.0 1.1 1.2 1.3 1.4 1.5 1.6 1.7
1.8 1.9 2.0 2.1
2.1 2.2
0
2
4
6
8
10
12
14
4Q
'09
4Q
'10
1Q
'11
2Q
'11
3Q
'11
4Q
'11
1Q
'12
2Q
'12
3Q
'12
4Q
'12
1Q
'13
2Q
'13
3Q
'13
4Q
'13
1Q
'14
2Q
'14
3Q
'14
4Q
'14
1Q
'15
2Q
'15
3Q
'15
4Q
'15
1Q
'16
2Q
'16
3Q
'16
4Q
'16
1Q
'17
Debit Cards
Mobile Banking
Internet Banking
Quarterly Transaction Volume (Mn)
142
157
184
189
212 218
233 235
246 249
268
293 295
287
309
291
306 313
39
36 44
41 43 41 39 44
51
53
47 48
50
46
49
45
48
46
12 18
23 26 32 31 34
57
70
113
172
196
190
254 258
295
311
17
42
55
78 85
67 76
81 89
117
102
117
131
138 149
156
154
0
25
50
75
100
125
150
175
200
225
250
275
300
325
4Q
'09
4Q
'10
1Q
'11
2Q
'11
3Q
'11
4Q
'11
1Q
'12
2Q
'12
3Q
'12
4Q
'12
1Q
'13
2Q
'13
3Q
'13
4Q
'13
1Q
'14
2Q
'14
3
Q '1
44
Q '1
41
Q '1
52
Q '1
53
Q '1
54
Q '1
51
Q '1
62
Q '1
63
Q '1
64
Q '1
61
Q '1
7
ATM
Branch
Mobile Banking
Internet Banking

27
Retail Payment System Gaining Traction
Fee Income from e-channel Tx (Rp Bn)
200.3 258.2 315.2 347.6 414.7 604.3 711.7 758.2
196.5 285.7
318.6 382.0
490.3
663.4
765.2
249.3
313.9361.8
437.5
489.2
683.3
742.7
268.5
312.8
464.4
512.9
664.8
771.0
862.6
20
10
20
11
20
12
20
13
20
14
20
15
20
16
20
17
Q4 Q3 Q2 Q1
6.5% YoY
Growth
Numbers of EDC
23,690 27,611
33,732
47,127
92,903
180,532
230,352
270,352
286,861
236,711
239,312
20
07
20
08
20
09
20
10
20
11
20
12
20
13
20
14
20
15
20
16
1Q
17
Volume Mandiri BusinessSaving Account (Rp Tn)
17.7
34.7
59.4
85.8
102.3
108.5
120.6
93.1
110.8
20
10
20
11
20
12
20
13
20
14
20
15
20
16
1Q
'16
1Q
'17
19.0%YoY
Growth

18
,52
8
25
,85
7
32
,27
3
42
,58
2
47
,30
4
53
,12
4
57
,44
7
73
,66
6
79
,97
0
88
,01
3
79
,17
3
89
,38
9
89
,90
6
11
8,3
89
10
5,7
81
12
6,8
57
12
6,5
45
11,535
13,542 15,312 15,971
17,802
18,216 22,570
24,676 26,441
28,122 27,591
29,040 29,967
40,285
34,251 37,059
39,025
1Q '13
2Q '13
3Q '13
4Q '13
1Q '14
2Q '14
3Q '14
4Q '14
1Q '15
2Q '15
3Q '15
4Q '15
1Q '16
2Q '16
3Q '16
4Q '16
1Q '17
Transaction Value (Rp Bn) # of Active Users
28
Making Inroads into SME and Retail Payments
Fiesta Point Program
A program to get points based on savings average balance and # of transactions through e-channel or branch, so that customer has the opportunity to earn immediate prizes.
Mandiri Belanja Untung Program
Prizes for buyers who do the transactions in the merchant (as a participants), or using Mandiri EDC. For sellers, they have the opportunity to be included into the national lucky draw.
Belanja Hoki/ Dagang Hoki Program
Co-promotion with the ITC Group for the merchants and the buyers who transact in ITC using Mandiri Debit and also a reward program for the building management.
# MTB Transaction & Volume
20
1,1
06
21
2,8
44
26
1,9
35
26
5,4
23
27
2,2
12
29
0,0
19
30
6,8
31
34
9,8
68
29
9,4
17
32
2,5
87
30
8,8
32
34
8,0
59
26
7,1
95
33
4,9
12
32
2,3
77
38
2,1
04
34
0,2
88
9,235
10,601
11,385
12,616
12,773
14,068
14,508
16,052
15,996 17,444
17,101
18,373 20,186 20,187
18,974
20,357 20,329
-
3,000
6,000
9,000
12,000
15,000
18,000
21,000
-
50,000
100,000
150,000
200,000
250,000
300,000
350,000
400,000
450,000
1Q
'13
2Q
'13
3Q
'13
4Q
'13
1Q
'14
2Q
'14
3Q
'14
4Q
'14
1Q
'15
2Q
'15
3Q
'15
4Q
'15
1Q
'16
2Q
'16
3Q
'16
4Q
'16
1Q
'17
# of Volume # of Transactions (000)
# MIB Transaction Value & Users
# SME Business w/ Mandiri Acc
543,972
643,334
789,300 845,073 851,069 853,539
2012 2013 2014 2015 2016 1Q17
29
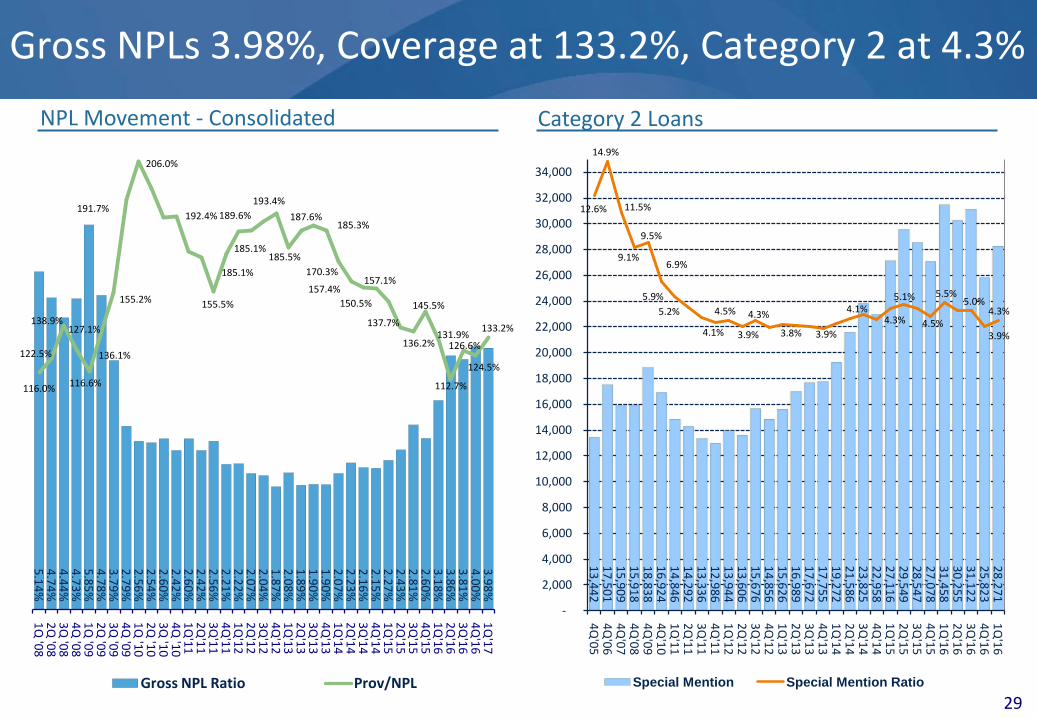
Gross NPLs 3.98%, Coverage at 133.2%, Category 2 at 4.3%
13
,44
2
17
,50
1
15
,90
9
15
,91
8
18
,83
8
16
,92
4
14
,84
6
14
,29
2
13
,33
6
12
,98
6
13
,94
4
13
,60
6
15
,67
6
14
,85
6
15
,62
6
16
,98
9
17
,67
2
17
,75
5
19
,27
2
21
,58
6
23
,82
5
22
,95
8
27
,11
6
29
,54
9
28
,54
7
27
,07
8
31
,45
8
30
,25
5
31
,12
2
25
,82
3
28
,27
1
12.6%
14.9%
11.5%
9.1%
9.5%
6.9%
5.9%
5.2% 4.5%
4.1%
4.3%
3.9% 3.8% 3.9%
4.1%4.3%
5.1%
4.5%
5.5%5.0%
3.9%
4.3%
-
2,000
4,000
6,000
8,000
10,000
12,000
14,000
16,000
18,000
20,000
22,000
24,000
26,000
28,000
30,000
32,000
34,000
4Q
'05
4Q
'06
4Q
'07
4Q
'08
4Q
'09
4Q
'10
1Q
'11
2Q
'11
3Q
'11
4Q
'11
1Q
'12
2Q
'12
3Q
'12
4Q
'12
1Q
'13
2Q
'13
3Q
'13
4Q
'13
1Q
'14
2Q
'14
3Q
'14
4Q
'14
1Q
'15
2Q
'15
3Q
'15
4Q
'15
1Q
'16
2Q
'16
3Q
'16
4Q
'16
1Q
'16
Special Mention Special Mention Ratio
NPL Movement - Consolidated
5.1
4%
4.7
4%
4.4
4%
4.7
3%
5.8
5%
4.7
8%
3.7
9%
2.7
9%
2.5
6%
2.5
4%
2.6
0%
2.4
2%
2.6
0%
2.4
2%
2.5
6%
2.2
1%
2.2
2%
2.0
7%
2.0
4%
1.8
7%
2.0
8%
1.8
9%
1.9
0%
1.9
0%
2.0
7%
2.2
3%
2.1
6%
2.1
5%
2.2
7%
2.4
3%
2.8
1%
2.6
0%
3.1
8%
3.8
6%
3.8
1%
4.0
0%
3.9
8%
116.0%
122.5%
138.9%127.1%
116.6%
136.1%
155.2%
206.0%
191.7%192.4%
155.5%
185.1%
185.1%
189.6%
193.4%
185.5%
187.6%185.3%
170.3%
157.4%157.1%
150.5%
137.7%
136.2%
145.5%
131.9%
112.7%
126.6%
124.5%
133.2%
1Q
'08
2Q
'08
3Q
'08
4Q
'08
1Q
'09
2Q
'09
3Q
'09
4Q
'09
1Q
'10
2Q
'10
3Q
'10
4Q
'10
1Q
'11
2Q
'11
3Q
'11
4Q
'11
1Q
'12
2Q
'12
3Q
'12
4Q
'12
1Q
'13
2Q
'13
3Q
'13
4Q
'13
1Q
'14
2Q
'14
3Q
'14
4Q
'14
1Q
'15
2Q
'15
3Q
'15
4Q
'15
1Q
'16
2Q
'16
3Q
'16
4Q
'16
1Q
'17
Gross NPL Ratio Prov/NPL
Category 2 Loans
30
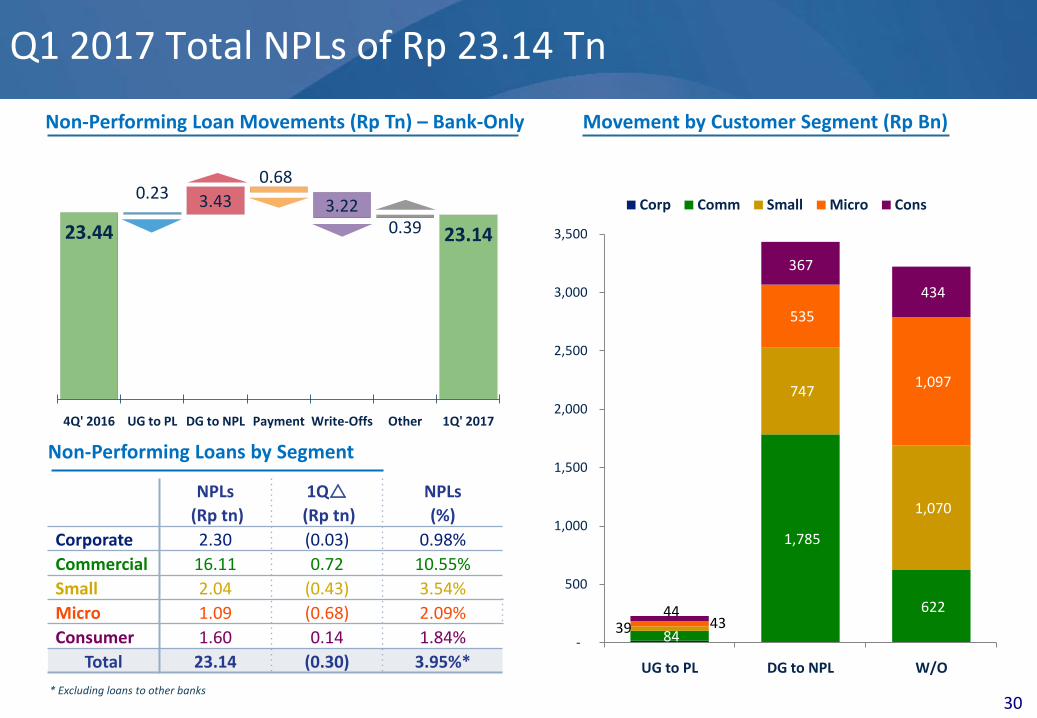
Non-Performing Loans by Segment
Movement by Customer Segment (Rp Bn)Non-Performing Loan Movements (Rp Tn) – Bank-Only
* Excluding loans to other banks
Q1 2017 Total NPLs of Rp 23.14 Tn
23.44
0.23 3.43
0.68
3.220.39 23.14
4Q' 2016 UG to PL DG to NPL Payment Write-Offs Other 1Q' 2017
84
1,785
622
39
747
1,070
43
535
1,097
44
367
434
-
500
1,000
1,500
2,000
2,500
3,000
3,500
UG to PL DG to NPL W/O
Corp Comm Small Micro Cons
NPLs 1Q NPLs
(Rp tn) (Rp tn) (%)
Corporate 2.30 (0.03) 0.98%
Commercial 16.11 0.72 10.55%
Small 2.04 (0.43) 3.54%
Micro 1.09 (0.68) 2.09%
Consumer 1.60 0.14 1.84%
Total 23.14 (0.30) 3.95%*

31
Total Loans originated since 2005
Net Upgrades(%)/Downgrades(%)# 1Q 2016 Details
LoanBackground
1Q’17Balance(Rp Bn)
1Q2015
2Q2015
3Q2015
4Q2015
1Q2016
2Q2016
3Q2016
4Q2016
1Q2017
DG to NPL%
UG toPL%
Corporate 229,872 - 0.11 0.38 0.24 0.13 0.24 - 0.32 0.14 - 0.14
Commercial 148,210 0.13 0.95 0.83 0.77 1.97 3.02 0.16 3.87 1.13 1.18 0.06
Small 55,178 1.29 1.17 1.24 0.54 1.31 1.50 1.36 0.63 1.20 1.26 0.07
Micro 52,175 1.25 1.37 1.50 1.08 1.37 1.45 1.35 0.84 0.94 1.03 0.08
Consumer 87,070 0.28 0.23 0.25 0.17 0.32 0.21 0.30 0.17 0.37 0.42 0.05
Total 572,505 0.33 0.60 0.68 0.31 0.94 1.28 0.35 1.36 0.49 0.59 0.09
1Q17 Net Downgrades of 0.49% On Loans Originated since 2005
# % downgrades and upgrades are quarterly % figures
32
Restructured Loans
17
.1
14
.3
13
.1
13
.6
13
.5
13
.5
14
.2
13
.9
14
.0
11
.7
11
.7
12
.0
12
.5
12
.7
11
.2
11
.5
10
.2
11
.8
14
.4
20
.9
26
.4
28
.9
28
.3
34
.1
39
.3
47
.2
47
.3
0.0
5.0
10.0
15.0
20.0
25.0
30.0
35.0
40.0
45.0
50.0
4Q
'09
4Q
'10
1Q
'11
2Q
'11
3Q
'11
4Q
'11
1Q
'12
2Q
'12
3Q
'12
4Q
'12
1Q
'13
2Q
'13
3Q
'13
4Q
'13
1Q
'14
2Q
'14
3Q
'14
4Q
'14
1Q
'15
2Q
'15
3Q
'15
4Q
'15
1Q
'16
2Q
'16
3Q
'16
4Q
'16
1Q
'17
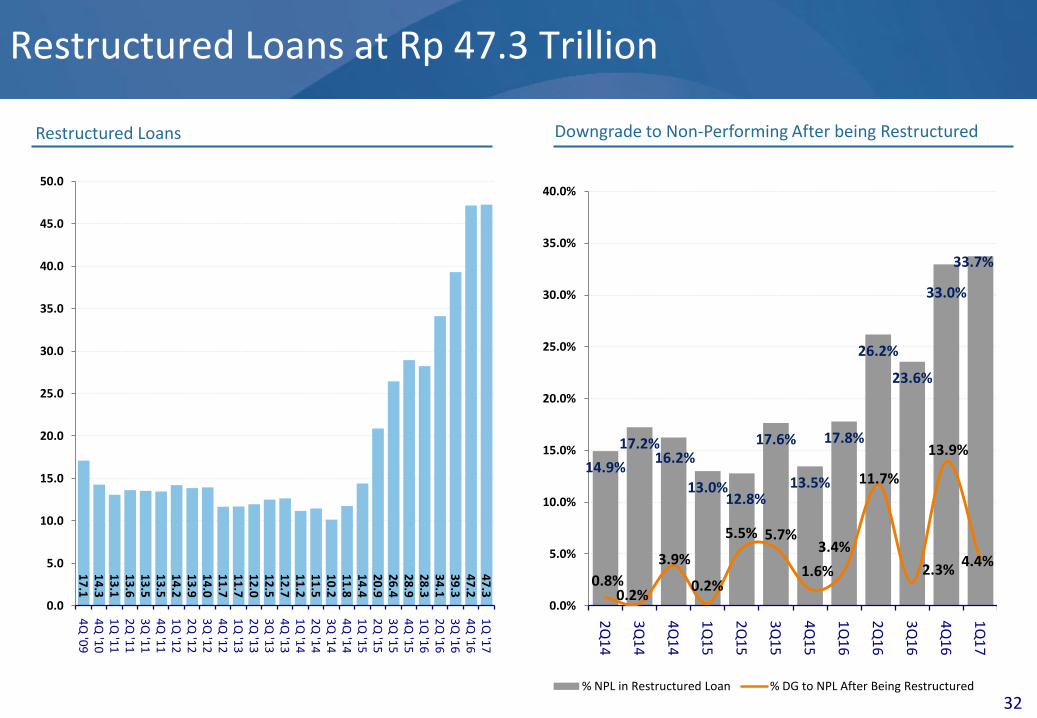
Restructured Loans at Rp 47.3 Trillion
Downgrade to Non-Performing After being Restructured
14.9%
17.2%16.2%
13.0%12.8%
17.6%
13.5%
17.8%
26.2%
23.6%
33.0%
33.7%
0.8%0.2%
3.9%
0.2%
5.5% 5.7%
1.6%
3.4%
11.7%
2.3%
13.9%
4.4%
0.0%
5.0%
10.0%
15.0%
20.0%
25.0%
30.0%
35.0%
40.0%
2Q
14
3Q
14
4Q
14
1Q
15
2Q
15
3Q
15
4Q
15
1Q
16
2Q
16
3Q
16
4Q
16
1Q
17
% NPL in Restructured Loan % DG to NPL After Being Restructured

33
Enhancing Synergies & Value from Subsidiaries
Total Assets
Rp80.0Tn
Bond Trading Volume
Rp18.1Tn
Total Assets
Rp26.3Tn
Total Loans
Rp6.2Tn
Total Financing
Rp4.6Tn
Total Financing
Rp55.4Tn
Equity & FI Underwriting
Rp2.7Tn
Annual FYP
Rp0.8Tn
Net Interest Margin
6.6%
Net Interest Margin
2.9%
Total Deposits
Rp71.0Tn
Equity Trading Volume
Rp42.9Tn
ROA
4.7%
ROA
2.1%
ROA
2.6%
ROE
5.8%
ROE
7.4%
ROE
56.6%
ROE
11.1%
ROE
14.0%
• Remains the leader in syariah financing
• Capital injection program over 3 years
• Cross-selling syariahproducts to Mandiri customers
• Expansion of business to fully utilize current capital base
• Cross-sell capital market services to broad range of Mandiri customers
• Refocus business toward higher fee income
• Providing end-to-end bank assurance business
• Continue to build cross-sell opportunities in various segments
• Bancassurance products to complete our suite of consumer offerings
• Enhancing operating model
• Improving risk management systems and IT
• Improving productivity
• Penetrate Bank Mandiri’s network and customer base to develop the multifinance segment with a strong focus on new 4 wheel vehicles.
Investment BankingSyariah Banking Insurance Niche Banking Multi-Finance

AXA Mandiri Financial Services Performance
34
17
1
18
3
23
7
25
5
25
8
23
4
26
2
25
9
29
8
27
0
26
9
25
6
34
8
29
7
31
6
30
8
36
0
27
4
24
7
38
7
33
1
28
0
26
2
43
4
30
0
1Q
'11
2Q
'11
3Q
'11
4Q
'11
1Q
'12
2Q
'12
3Q
'12
4Q
'12
1Q
'13
2Q
'13
3Q
'13
4Q
'13
1Q
'14
2Q
'14
3Q
'14
4Q
'14
1Q
'15
2Q
'15
3Q
'15
4Q
'15
1Q
'16
2Q
'16
3Q
'16
4Q
'16
1Q
'17
Net Profit After Tax (Rp Bn)Annual First Year Premium (AFYP) (Rp Bn) # of Policy Holders (‘000)
82
0
74
2
76
9
94
6
79
6
89
2
71
2
66
7
69
5
85
0
72
6
77
4
61
1
83
2
87
4
64
8
64
8
81
6
71
9
89
3
76
0
66
8
59
1
1,0
46
7
56
1Q
'11
2Q
'11
3Q
'11
4Q
'11
1Q
'12
2Q
'12
3Q
'12
4Q
'12
1Q
'13
2Q
'13
3Q
'13
4Q
'13
1Q
'14
2Q
'14
3Q
'14
4Q
'14
1Q
'15
2Q
'15
3Q
'15
4Q
'15
1Q
'16
2Q
'16
3Q
'16
4Q
'16
1Q
'17
1,6
03
1
,63
9
1,6
95
1
,74
4
1,7
91
1
,85
9
1,8
78
1
,91
9
1,9
67
2
,03
3
2,1
23
2
,21
7
2,3
54
2
,47
9
2,6
57
2
,96
2
3,1
62
3
,36
0
3,4
65
3
,71
0
3,8
32
3
,96
1
3,9
39
4
,10
1
3,9
30
1Q
'11
2Q
'11
3Q
'11
4Q
'11
1Q
'12
2Q
'12
3Q
'12
4Q
'12
1Q
'13
2Q
'13
3Q
'13
4Q
'13
1Q
'14
2Q
'14
3Q
'14
4Q
'14
1Q
'15
2Q
'15
3Q
'15
4Q
'15
1Q
'16
2Q
'16
3Q
'16
4Q
'16
1Q
'17
(0.5%) YoYGrowth
(9.3%) YoYGrowth
2.6% YoYGrowth

35
Bank Mandiri’s 2017 Corporate Guidance
2017 Target 2017 Realization
Gross Loan Growth (YoY) 11.0% - 13.0% 14.2%
Low Cost Deposits Rp 537.0 Tn Rp 465.6 Tn
Net Interest Margins 5.7% - 5.8% 5.9%
Efficiency Ratio 43.0% 42.7%
Gross NPLs 3.5% - 4.0% 3.98%
Cost of Credit 2.5% - 2.7% 3.32%
# of New ATMs 197 233
# of New EDCs 10,000 2,601
# of New Micro Network 34 (1)
# of New Conventional Branches 16 2

37
Corporate Banking:Generating Strong Asset Spread
Performance to Date: 1Q2017 (Rp Bn) Strategies for 2017
1. Focusing on Anchor Clients and penetrating through using of Transaction Banking
2. Account Plan implementation for top 76 Corporate Banking Customers.
3. Provide ‘one stop service’ solutions for customer’s transactions and create new business process to accelerate the execution of Account Plan including effective and responsive Complaint Handling.
4. Strengthen business alliance with Mandiri InHealth & Mandiri DPLK to ease corporate customers to manage their needs in health insurance & pension fund / severance
1,110
1,161
621 177
2,71556
2,771

38
InHealth – Opportunity to Increase Fee Income and Contribute to the Insurance Portfolio
Leveraging our institutional, corporate, & commercial customers
Providing solutions through our banking products to InHealth healthcare provider
Cross-selling Mandiri products to InHealth members
We have over 700 institutional, 300 corporate, and 1,700commercial customers with the potential to become membersof InHealth
• InHealth has 6,870 healthcare providers and recorded overRp 297 Bn in claims year to date 2017
• Bank Mandiri will leverage the hospital network as InHealth’spartner to increase transactions through enhanced cashmanagement products
• Bank Mandiri also will provide retail packaged products forall the doctors as InHealth’s partner
InHealth earned premium payments of Rp 398 Bn in 2017 yearto date from clients. Going forward, Bank Mandiri willencourage the use of cash management products throughBank Mandiri’s distribution channels and cross sell otherproducts to over 1.4 Mn InHealth members.
69
2,8
31
1,0
23
,22
8
1,1
75
,24
0
1,1
18
,20
6
1,1
41
,89
6
1,0
87
,31
3
94
0,6
96
1,2
47
,33
4
1,3
55
,22
9
5,501 6,242 6,314 6,262 6,094
6,189
7,072 7,018 6,870
-
2,000
4,000
6,000
8,000
-
200,000
400,000
600,000
800,000
1,000,000
1,200,000
1,400,000
1,600,000
2009 2010 2011 2012 2013 2014 2015 2016 1Q17
Total Member # of Providers
36 78 47 107 120 203 155 163 42 52
203
811
1,073 1,203
1,410 1,400 1,432
1,620
323 453
0
50
100
150
200
250
-
200
400
600
800
1,000
1,200
1,400
1,600
1,800
2009 2010 2011 2012 2013 2014 2015 2016 1Q16 1Q17
Profit (Rp Bn) GWP (Rp Bn)
39
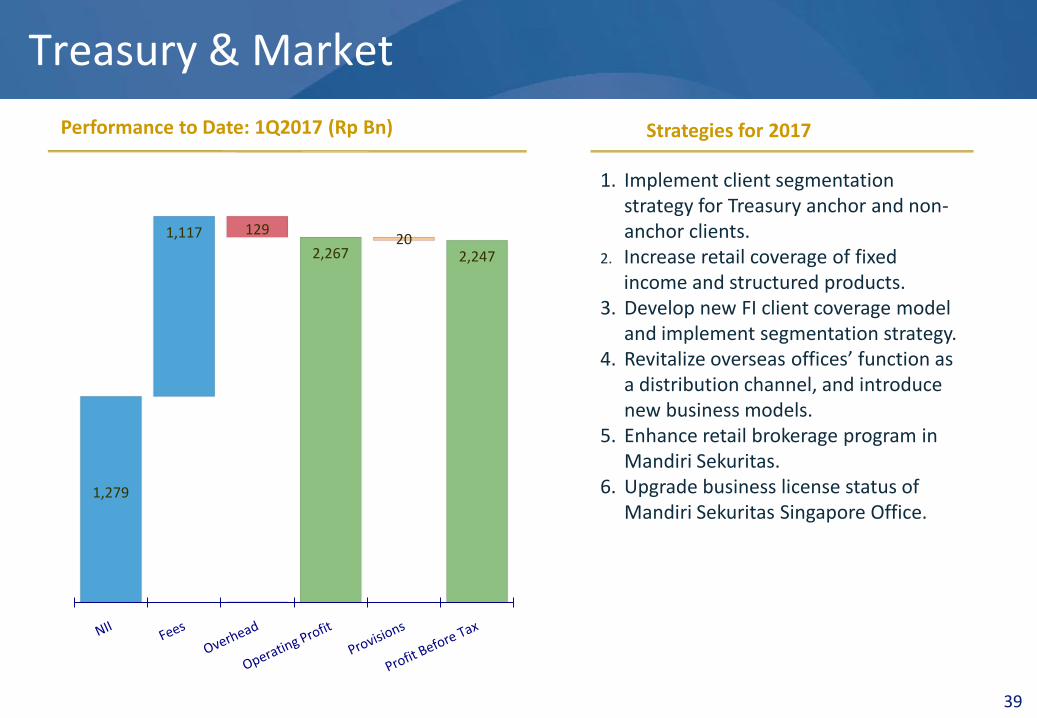
1. Implement client segmentation strategy for Treasury anchor and non-anchor clients.
2. Increase retail coverage of fixed income and structured products.
3. Develop new FI client coverage model and implement segmentation strategy.
4. Revitalize overseas offices’ function as a distribution channel, and introduce new business models.
5. Enhance retail brokerage program in Mandiri Sekuritas.
6. Upgrade business license status of Mandiri Sekuritas Singapore Office.
Treasury & Market
Performance to Date: 1Q2017 (Rp Bn) Strategies for 2017
1,279
1,117 129
2,26720
2,247

Mandiri Sekuritas’ financial performance
(Rp Bn)
40
Q1 2017 Q1 2016Y-o-Y
(%)
Revenues 185 154 20%
• Investment Banking 18 28 -37%
• Capital Market 70 64 9%
• Proprietary 10 17 -44%
• Investment Mgt 87 44 97%
Operating Expenses 161 117 38%
Earnings After Tax 19 26 -26%
Equity Transactions – bn 42,904 25,864 66%
SUN Transactions – bn 18,057 19,934 -9%
Equity & Bonds Underwriting– bn 2,663 1,537 73%
ROA 6.2% 6.9% -0.7%
ROE 7.0% 10.2% -3.2%

Commercial Banking:Strong revenues from Assets
41
1.Support Bank Mandiri’s Wholesale Banking vision as an Integrated Wholesale Bank through sophisticated, customized and complete services leading to increased revenue through Wholesale Deposit generation and Fee Income.
2.Increasing profit and market share through increasing existing customer’s share of wallet, increasing revenue from new customer’s and managing NPL’s.
3.Provide the best total business solutions for commercial customers by developing products and services including quality bundling of products, quick service and competitive pricing.
4.Effective Alliance in units based on customer base in Commercial segment, especially in developing value chain business.
Performance to Date: 1Q2017 (Rp Bn) Strategies for 2017
1,024
511
253 125
1,664
1,844
-180

42
Commercial Banking :Stronger Platform & Improved Distribution Capability
* Business Savings Product
Expanding Scope of Distribution, 1Q 2017Solid & Stable Source of
Low Cost Funds
Product1Q
2017
1Q
2016
Growth YoY
Demand Deposit
30.88 34.48 -11.66%
Rupiah 21.87 18.66 14.69%
FX 9.00 15.82 - 75.67%
Saving Deposit*
8.16 6.90 15.32%
Total CASA 39.03 41.38 -6.02%
Total Funding 56.86 57.67 -1.43%
CASA Ratio = 68.65%Funding from Java & Bali = 72% of total funding
SumateraLoans = Rp 26.1 tnFunds = Rp 9.7 tn
KalimantanLoans = Rp 7.9 tn Funds = Rp 3.9 tn
EasternLoans = Rp 4.9 tnFunds = Rp 2.5 tn
Java and BaliLoans = Rp 113.8 tnFunds = Rp 40.8 tn
CBC = 25 Unit, 2 Dept
Floor = 23 Unit

43
1. Remapping the featured products2. Strengthening the collateral policy3. Offering the effective rate to the
customers4. Deposit collateral loan program5. Super deal of non-revolving
investment and working capital loan6. Cash back program for the utilized
revolving working capital loan7. Special rate for deposit collateral loan
Micro & Business Banking:Rapidly growing our high margin business
Performance to Date: 1Q2017 (Rp Bn) Strategies for 2017
1,613
1,994
603811
3,333
1,613
1,720

44
Business Banking :
* Numbers are restated after Resegmentation in Jul 2015
Medan
Makassar
Banjarmasin
Surabaya
Semarang
Denpasar
Bandung
Pekanbaru
Palembang
B.Lampung
Pontianak
Samarinda
Manado
Palu Jayapura
Balikpapan
Batam
Jambi
Pematang siantar
Padang
BekasiJakarta
Solo
Tangerang
Bogor
Branch Models that covered SME Customers
M-1 Branch : 79
M-2 Branch : 68
M-3 Branch : 165
Expanding Scope of Distribution, 1Q 2017Solid & Stable Source of
Low Cost Funds*
Product1Q
2017
1Q
2016
GrowthYoY
Demand Deposit
39.3 33.1 18.7%
Saving Deposit
72.2 65.5 10.2%
Total CASA 111.5 98.6 13.1%
Total Funding
132.1 121.7 8.5%
Rp Tn
CASA Ratio = 87.4%Funding from Java & Bali = 76.5% of total funding
SumateraLoans = Rp 12.99tnFunds = Rp 17.3 tn
KalimantanLoans = Rp 8.6 tn
Funds = Rp 6.03 tn
EasternLoans = Rp 7.2 tnFunds = Rp 7.6 tn
Java and BaliLoans = Rp 28.7 tnFunds = Rp 101 tn
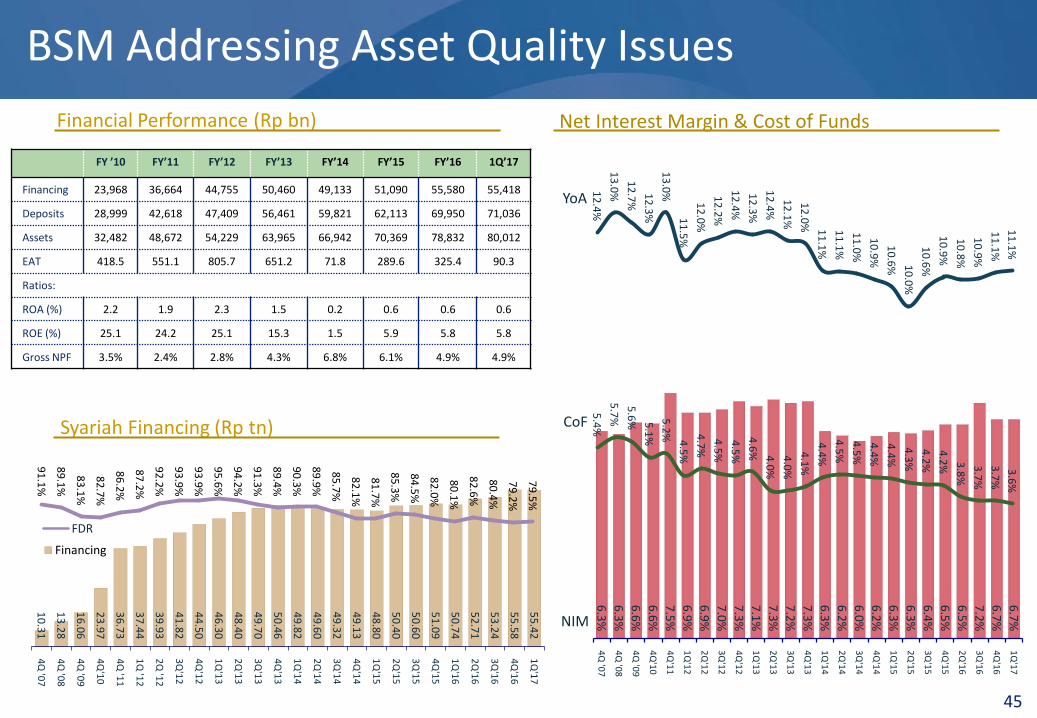
45
10
.31
13
.28
16
.06
23
.97
36
.73
37
.44
39
.93
41
.82
44
.50
46
.30
48
.40
49
.70
50
.46
49
.82
49
.60
49
.32
49
.13
48
.80
50
.40
50
.60
51
.09
50
.74
52
.71
53
.24
55
.58
55
.42
4Q
'07
4Q
'08
4Q
'09
4Q
'10
4Q
'11
1Q
'12
2Q
'12
3Q
'12
4Q
'12
1Q
'13
2Q
'13
3Q
'13
4Q
'13
1Q
'14
2Q
'14
3Q
'14
4Q
'14
1Q
'15
2Q
'15
3Q
'15
4Q
'15
1Q
'16
2Q
'16
3Q
'16
4Q
'16
1Q
'17
Financing
91
.1%
89
.1%
83
.1%
82
.7%
86
.2%
87
.2%
92
.2%
93
.9%
93
.9%
95
.6%
94
.2%
91
.3%
89
.4%
90
.3%
89
.9%
85
.7%
82
.1%
81
.7%
85
.3%
84
.5%
82
.0%
80
.1%
82
.6%
80
.4%
79
.2%
79
.5%
FDR
BSM Addressing Asset Quality Issues
Syariah Financing (Rp tn)
Financial Performance (Rp bn)
FY ’10 FY’11 FY’12 FY’13 FY’14 FY’15 FY’16 1Q’17
Financing 23,968 36,664 44,755 50,460 49,133 51,090 55,580 55,418
Deposits 28,999 42,618 47,409 56,461 59,821 62,113 69,950 71,036
Assets 32,482 48,672 54,229 63,965 66,942 70,369 78,832 80,012
EAT 418.5 551.1 805.7 651.2 71.8 289.6 325.4 90.3
Ratios:
ROA (%) 2.2 1.9 2.3 1.5 0.2 0.6 0.6 0.6
ROE (%) 25.1 24.2 25.1 15.3 1.5 5.9 5.8 5.8
Gross NPF 3.5% 2.4% 2.8% 4.3% 6.8% 6.1% 4.9% 4.9%
Net Interest Margin & Cost of Funds
YoA
CoF
NIM
6.3
%
6.3
%
6.6
%
6.6
%
7.5
%
6.9
%
6.9
%
7.0
%
7.3
%
7.1
%
7.3
%
7.2
%
7.3
%
6.3
%
6.2
%
6.0
%
6.2
%
6.3
%
6.3
%
6.4
%
6.5
%
6.5
%
7.2
%
6.7
%
6.7
%
4Q
'07
4Q
'08
4Q
'09
4Q
'10
4Q
'11
1Q
'12
2Q
'12
3Q
'12
4Q
'12
1Q
'13
2Q
'13
3Q
'13
4Q
'13
1Q
'14
2Q
'14
3Q
'14
4Q
'14
1Q
'15
2Q
'15
3Q
'15
4Q
'15
2Q
'16
3Q
'16
4Q
'16
1Q
'17
12
.4%
13
.0%
12
.7%
12
.3%
13
.0%
11
.5%
12
.0%
12
.2%
12
.4%
12
.3%
12
.4%
12
.1%
12
.0% 1
1.1
%
11
.1%
11
.0%
10
.9%
10
.6% 10
.0%
10
.6%
10
.9%
10
.8%
10
.9%
11
.1%
11
.1%
5.4
%
5.7
%
5.6
% 5.1
%
5.2
%
4.5
%
4.7
%
4.5
%
4.5
%
4.6
% 4.0
%
4.0
%
4.1
%
4.4
%
4.5
%
4.5
%
4.4
%
4.4
%
4.3
%
4.2
%
4.2
% 3.8
%
3.7
%
3.7
%
3.6
%

46
Consumer Banking:Significant growth in spread and fee income
1. Mortgage package2. Mortgage priority3. Mortgage for depositors4. Instant approval for mortgage5. Selco Xtra payroll loan6. SOE synergy for payroll loan7. Regular top up for payroll loan8. Cross-sell payroll loan9. Regular auto loan through branch referral10. Improving the quality of new card holders
acquisition11. Raise the limit of credit card12. Usage program with strategic partner13. Mandiri Bonus Untung program14. Regional marketing program for savings15. Special program for drop fund depositors16. Bundling program17. Internal branch contest for saving
Performance to Date: 1Q2017 (Rp Bn) Strategies for 2017
4,253
1,296 325
5,224 667
4,557

Mandiri Tunas Finance: Total Financing YTD of Rp4.6Tn
47
Total Disbursement and the Breakdown for Joint Financing and Non JF Breakdown of Financing 1Q 2017 Performance
1,0
54
1,1
10
1,0
16
52
3
1,5
06
1,1
99
1,4
09
1,6
00
1,4
54
1,9
09
1,0
20
2,2
17
1,8
58
1,9
08
1,2
61
1,6
94
1,8
49
1,4
78
1,7
28
2,2
24 2,4
56
2,0
56
2,4
08
2,2
06
2,3
91 2
,23
6
1,9
36
3,0
94
2,9
75 3
,01
2
2,9
09
2,4
14
2,0
57
2,7
23
Q1
'13
Q2
'13
Q3
'13
Q4
'13
Q1
'14
Q2
'14
Q3
'14
Q4
'14
Q1
'15
Q2
'15
Q3
'15
Q4
'15
Q1
'16
Q2
'16
Q3
'16
Q4
'16
Q1
'17
JF
Non JF
2,1
05
2,4
16
2,8
71
2,6
78
3,2
90
3,3
74
3,3
98
3,8
24
3,5
49
3,7
32
3,9
75
5,0
62
4,7
61
4,7
27
3,6
36
5,2
16
4,4
67
37
2
34
5
28
9 23
2
20
8
16
2
14
9
10
8
96
71
82
73 6
7 70
36
43
99
56
76
80
70
64 70 68
60
45 41
57
56
41 19
5
8
6
Q1
'13
Q2
'13
Q3
'13
Q4
'13
Q1
'14
Q2
'14
Q3
'14
Q4
'14
Q1
'15
Q2
'15
Q3
'15
Q4
'15
Q1
'16
Q2
'16
Q3
'16
Q4
'16
Q1
'17
Motorcycle
Used Car
New Car
1Q2017
1Q 2016
Change
Loans (Rp Bn) 31,874 28,466 12.0%
Net Income (Rp Bn) 52.5 90.5 -42.0%
Approval Rate (%) 84.4 86.8 -2.7%
Disbursement (Rp Bn) 4,572 4,870 -6.1%
NIM (%) 2.9 3.5 -18.1%
ROA (%) 2.6 5.0 -48.3%
ROE (%) 14.0 29.9 -53.2%
CER (%) 47.1 39.8 18.5%
NPL (%) 1.2 1.1 12.7%

49
2016-2020 Bank Mandiri Corporate Plan – Accelerate In The Growth Segments
Loan Growth Engine
Mortgage
Auto Loan
1
2
Funding Engine
Dominate payroll segment using Bank@Work for corporate and commercial customers
Improve transaction banking offering to tap cash management for anchor clients’ value chain
1
2
Product Focus
1. Improve processing speed
2. Tapping higher ticket size
3. Target developer relationships
Key initiatives
1. Streamline segment split between MTF and MUF
2. Utilize existing Mandiri branch network for growth
Personal Loan & Micro KSM3
1. Combine consumer personal loans and micro salary-based loans
2. Leverage on micro’s distribution footprint
3. Tap into our payroll customer base

50
Our Portfolio Mix Would Be More Retail-Focused
40% 36%
26%24%
10%
10%
9%10%
15%20%
1Q2017 2020
Consumer
Micro
Business Banking
Assets Composition Mix 1)
Commercial
Corporate
66% 70%
35% 30%
1Q 2017 2020
Time Deposits
Liabilities Composition Mix
CASA
1) Excluding TSM and Wholesale Credit RecoveryBank only figures

Cash Management• 18,531 Customers • 25.3Mn Trx in
2016 (2)
51
Bank Mandiri Remains on Track to Become Indonesia’s Most Admired Financial Institution
Retail Loans (1)
• Rp 196.9 Tn • 33.7% of Loans• High yield loan amounting Rp 139.4 Tn
Subsidiary Income• Total Rp 544 Bn• Sum of income from 11 subsidiaries (13.3% of EAT)
Alliances• Bank Guarantee: Rp7.94 Tn• ForEx: USD3.98 Bn• Trade: USD1.80 Bn
e-Channel Tx• 777.6Mn Trx YTD• 28.1% YoY Growth
# of Cards Issued• Credit 4.49 Mn• Debit 14.43 Mn• Prepaid 9.23 Mn
(1) Small Business, Micro and Consumers(2) Excluding Mandiri Transaction System(3) Incl. KSM Centre, MMU Cash outlet and MobilMU
# of Accounts• Deposit 18.78 Mn • Loan 1.71 Mnincluding mortgage accounts of 153,518
# of new Accounts (YTD)• Deposit 1.15 Mn• Loan 170,977
# of Outlets2,601 Branches3,423 Micro Outlets (3)
17,694 ATMs
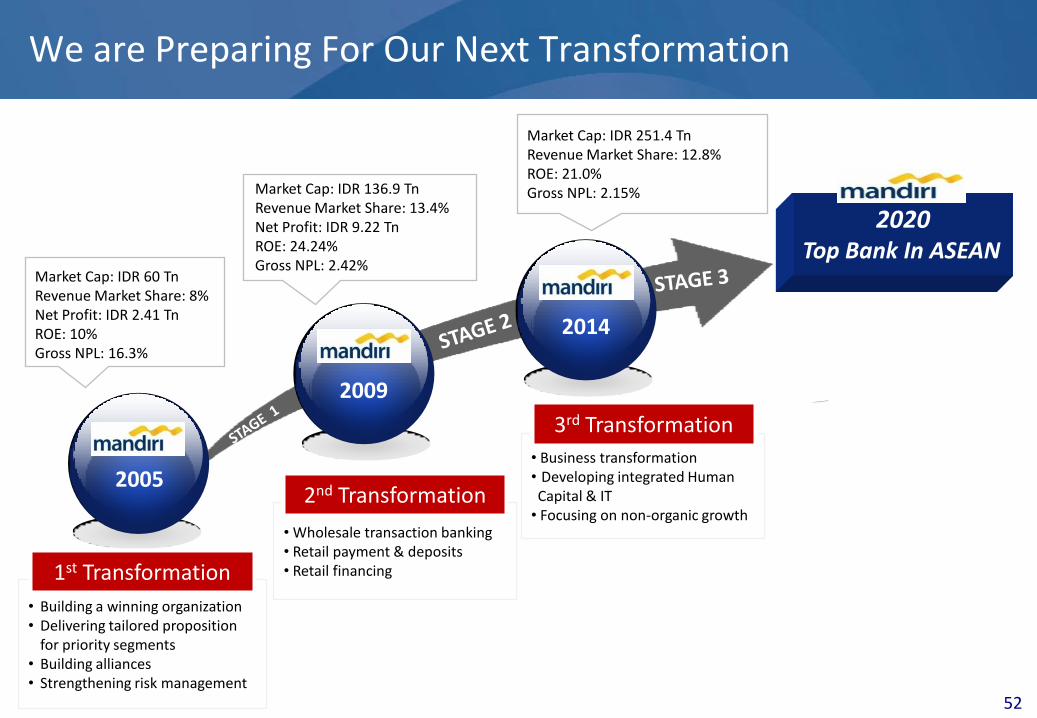
We are Preparing For Our Next Transformation
2009
2005
Market Cap: IDR 60 TnRevenue Market Share: 8%Net Profit: IDR 2.41 TnROE: 10%Gross NPL: 16.3%
Market Cap: IDR 136.9 Tn Revenue Market Share: 13.4%Net Profit: IDR 9.22 TnROE: 24.24%Gross NPL: 2.42%
2020Top Bank In ASEAN
Market Cap: IDR 251.4 Tn Revenue Market Share: 12.8%ROE: 21.0%Gross NPL: 2.15%
52
2014
• Building a winning organization• Delivering tailored proposition
for priority segments• Building alliances• Strengthening risk management
• Wholesale transaction banking• Retail payment & deposits• Retail financing
• Business transformation• Developing integrated Human Capital & IT
• Focusing on non-organic growth
1st Transformation
2nd Transformation
3rd Transformation

…But We Need to Consider Growing Beyond the Bank
• Revenue YTD (Whole Group): Rp17.0Tn (16% YoY)
• Profit from Subsidiaries: Rp0.54Tn (13.3% of EAT)
• 1Q Revenue Wholesale vsRetail : Rp 7.1Tn vs Rp 9.8Tn
Our Deal size has continued to move higher
• BSHB Rp 40bn (2008)
• MTF Rp250 bn (2009)
• Inhealth Rp 1.3 tn (2013)
Bank & Group
Finding Business Partners
M & A
• JV with AXA (AMFS). Gross Written Premiums Rp1.5tn. +27% YoY
• JV with Tunas Ridean (MTF). Total Financing Rp4.1tn. 15% YoY
• InHealth partner BPJS
53
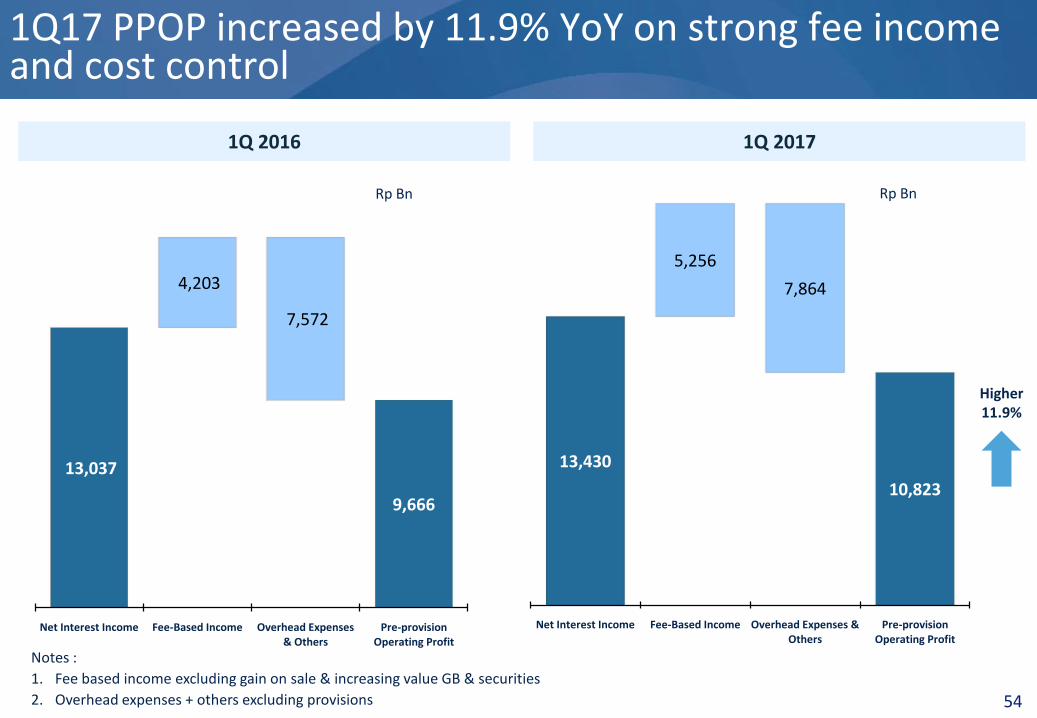
54
13,430
5,256
7,864
10,823
Net Interest Income Fee-Based Income Overhead Expenses & Others
Pre-provision Operating Profit
1Q17 PPOP increased by 11.9% YoY on strong fee income and cost control
1Q 2017
Notes :
1. Fee based income excluding gain on sale & increasing value GB & securities
2. Overhead expenses + others excluding provisions
1Q 2016
Higher11.9%
13,037
4,203
7,572
9,666
Net Interest Income Fee-Based Income Overhead Expenses & Others
Pre-provision Operating Profit
Rp Bn Rp Bn

Committed to Improving Shareholder Value
Reduce Cost of Funds
Improve Assets Yield
Diversify into Fee Income
Reduce Provision/Loan
Improve Cost Efficiency
Leverage on cash generator (wholesale) to accelerate growth
Diversity into fee income
Competitive.
sustainable
returns. with
above-average
rates of growth
Business Strategy
Strategic Alliances
Support Strategy
55

…and Offer Innovative Payment Solutions
56
E-Money is the re-branding of prepaid Mandiri cards launched in October 2012.
Can be used for Toll-road Transactions(Jabodatabek). Parking (ISS Parking). Bus (Trans Solo & Trans Jogja). Fuel (Pertamina Gas Stations). Retail Shops (Indomaret. Alfamart. Alfamidi. Lawson. Superindo). Restaurants (Solaria. Excelso. Es Teller 77).
Can be owned by all customers & non customers with a maximum balance of Rp 1 million. Recharge available at MandiriATM. ATM Bersama. E-money machines. and E-money merchants.
Pre-Paid Card Volume (000s)
7751,748
4,0155,282
5,275
7,891
9,578
13,662
16,802
18,012
24,163
27,455
36,018
35,923
11,680
20,211
21,75222,741
21,15620,679
19,46020,502
22,079
23,864
24,644
27,260
30,05830,698
33,826
39,691
36,457
214 209161 136 131 415321 484 456
455 447426381
19 272 1,502
2,231
6,421
8,332
14,874
20,981
22,777
24,508 27,205
30,466
36,704
44,169
41,450
1Q
'12
2Q
'12
3Q
'12
4Q
'12
1Q
'13
2Q
'13
3Q
'13
4Q
'13
1Q
'14
2Q
'14
3Q
'14
4Q
'14
1Q
'15
2Q
'15
3Q
'15
4Q
'15
1Q
'16
2Q
'16
3Q
'16
4Q
'16
1Q
'17
Indomaret
e-Toll
Gaz
e-Money
Pre-Paid Transaction Volume (000s)*
*volume for quarter
846
981
1,093
1,4121,564 1,663
1,7521,829
1,9762,112
2,249
2,478
2,693
2,892
3,080
3,255
3,428
3,650
3,879
693
1,0981,226
1,3121,409
1,5331,5641,633
1,960
2,012
2,1102,202
2,338
2,489
2,6342,776
2,850
4950 58 59
59
6464
84
84
8484 84 85
85
8585
85 85
489
152 392
644
890
1,124
1,240 1,382
1,5591,785
1,992
2,163
2,270
Mar-1
2Ju
n-1
2Sep
-12
Dec-1
2M
ar-13
Jun
-13
Sep-1
3D
ec-13
Mar-1
4Ju
n-1
4Sep
-14
Dec-1
4M
ar-15
Jun
-15
Sep-1
5D
ec-15
Mar-1
6Ju
n-1
6Sep
-16
Dec-1
6M
ar-17
Indomaret
e-Toll
Gaz
e-Money

Strong Microfinance Growth
57
Outstanding – Rp Tn
*based on OJK publication market data (micro small medium business/ UMKM)
2,1
95
4,2
08
5,7
64
5,1
36
7,0
57
5,1
87
6,8
77
5,6
89
8,5
27
7,0
39
7,7
32
5,9
74
5,9
45
4,0
05
6,3
37
6,1
53
6,3
79
8,4
97
12
,53
4
10
,08
9
4Q
'10
4Q
'11
4Q
'12
1Q
'13
2Q
'13
3Q
'13
4Q
'13
1Q
'14
2Q
'14
3Q
'14
4Q
'14
1Q
'15
2Q
'15
3Q
'15
4Q
'15
1Q
'16
2Q
'16
3Q
'16
4Q
'16
1Q
'17
Booking
Booking Volume – Rp Bn
16.9%
21.0%
18.7%
14.4%14.3%14.0%14.2%
13.2%13.2%13.2%13.2%
11.0%11.3%10.8%10.6%
9.9%9.0%
8.5%9.2%
6.8%
Asset Spreads(%)
4.4 5.4 7.311.8
19.0
27.1
36.0
42.5
50.6 52.2
2.02%2.29%
2.76%
3.91%
6.25%
9.77%
11.00%
11.95% 11.94%12.01%
0.00%
0.50%
1.00%
1.50%
2.00%
2.50%
3.00%
3.50%
4.00%
4.50%
5.00%
5.50%
6.00%
6.50%
7.00%
7.50%
8.00%
8.50%
9.00%
9.50%
10.00%
10.50%
11.00%
11.50%
12.00%
12.50%
13.00%
1
2
3
4
5
6
7
8
9
10
11
12
13
14
15
16
17
18
19
20
21
22
23
24
25
26
27
28
29
30
31
32
33
34
35
36
37
38
39
40
41
42
43
44
45
46
47
48
49
50
51
52
53
54
55
20
08
20
09
20
10
20
11
20
12
20
13
20
14
20
15
20
16
1Q
17
Mandiri Microfinance Outstanding
Mandiri Market Share

2005 2009 CAGR2005-2009
2010 2014CAGR
2010-2014 2015 2016YoY
Growth
Assets 263,383 394,617 10.6% 449,775 855,040 17.4% 910,063 1,038,706 14.1%
Loans 106,853 198,547 16.8% 246,201 529,973 21.1% 595,458 662,013 11.2%
Deposits 206,290 319,550 11.6% 362,212 636,382 15.1% 676,387 762,501 12.7%
Revenues 10,835 22,261 19.7% 28,504 56,501 18.7% 66,879 73,764 10.3%
ROE 2.52% 22.06% 72.0% 24.24% 20.95% (3.6%) 18.33% 9.66% -47.3%
Gross NPL Ratio 25.20% 2.79% (5.60%) 2.42% 2.15% (2.9%) 2.60% 4.00% 53.8%
Net NPL Ratio 15.34% 0.42% (3.73%) 0.62% 0.81% 6.9% 0.90% 1.53% 70.0%
LDR 51.72% 61.36% 2.41% 67.58% 82.86% 5.2% 87.68% 86.54% -1.3%
EAT 603 7,155 85.6% 9,218 19,872 21.2% 20,335 13,807 -32.1%
Subsidiary EAT N/A 434 22.2% *) 994 1,086 2.2% 2,085 2,288 9.7%
Rp Billion
Our Growth Remains On Track
*) CAGR based on EAT 2006 Rp. 238.28 bn
58

Building a Strong Savings Deposit Franchise…
Savings Deposit Growth Transaction channel growth
12
1.5
13
9.2
14
7.6
16
3.8
16
3.9
17
3.4
18
0.2
20
2.2
19
5.7
20
6.6
21
7.7
23
6.6
22
4.0
22
6.2
23
0.2
22
9.5
20
8.3
21
4.1
22
4.0
24
6.3
21
4.3
24
8.6
24
7.8
27
3.8
25
8.8
37.3%
38.4%
39.2%
38.8%
40.6%41.5%
41.8%41.9%
41.9%
41.1%
42.3%
42.5%42.1%
40.7%
39.0%39.8%
36.6%
36.0%37.7%
40.2%
36.3%
39.8%
39.9%39.8%
39.6%
17.3%
16.9%
16.9%
16.6%
16.7%
16.7%
16.5%
17.0%
16.8%
17.5%
17.4%
17.7%17.5%
17.6%
17.3%
17.9%
17.3%
17.6%
18.0%17.6%
16.2%
17.5%
17.3%
17.6%
1Q
'11
2Q
'11
3Q
'11
4Q
'11
1Q
'12
2Q
'12
3Q
'12
4Q
'12
1Q
'13
2Q
'13
3Q
'13
4Q
'13
1Q
'14
2Q
'14
3Q
'14
4Q
'14
1Q
'15
2Q
'15
3Q
'15
4Q
'15
1Q
'16
2Q
'16
3Q
'16
4Q
'16
1Q
'17
Savings Deposits (Rp tn)
As % of Total Deposits
National Share of Savings Deposits (%)
1,9
54
1,9
54
2,0
21
2,0
45
1,9
96
2,0
96
2,0
96
2,1
29
2,1
41
2,2
91
2,4
32
2,4
21
2,4
05
2,6
29
2,4
50
2,5
07
2,4
85
279.4 283.0 285.4299.3 296.4
314.2 306.5 315.9339.4
356.3364.6 391.2
388.6
414.5
384.0477.3 384.9
139.6 136.4151.4 145.4 143.2
138.1 140.1 143.4 141.1133.2
179.9 150.9 162.9
136.2
123.4112.5 164.0
74.0 70.6 74.8 79.3 78.3
86.9 91.7 94.2 100.4
112.2
144.3 184.1 133.7
150.8
144.0 153.9
402.8
Others Payment
Transfer Withdrawal / Inquiry
Avg ATM Daily Vol (000)
7.5
01
9.6
23
11
.05
7
12
.86
8
13
.62
5
74
,68
9
70
,03
4
10
0,1
49
13
3,9
70
16
8,3
30
17
1,6
59
19
6,0
00
18
9,6
00
25
3,6
49
25
7,9
52
29
4,6
28
31
0,9
55
3,2033,2233,1813,1193,047
3,2113,185
3,266
2,907
2,9272,794
2,6782,290
2,1201,928
2,0592,236
1Q
'13
2Q
'13
3Q
'13
4Q
'13
1Q
'14
2Q
'14
3Q
'14
4Q
'14
1Q
'15
2Q
'15
3Q
'15
4Q
'15
1Q
'16
2Q
'16
3Q
'16
4Q
'16
1Q
'17
Quarterly Call Center Trans. (000)
Quarterly Mobile Trans. (000)
59

Regulation Summary: Capital Based on Risk Profile. Business Activity & Branch Networking
Risk Profile CAR Min
1 – Low 8%
2 – Low to Moderate 9% - < 10%
3 – Moderate 10% - < 11%
4 – Moderate to High & 5 - High 11% - 14%
Bank Mandiri is under the “LOW to MODERATE” risk profile
“BUKU” Tier 1 Capital
1 < Rp 1 Trillion
2 Rp 1 Trillion - < Rp 5 Trillion
3 Rp 5 Trillion - < Rp 30 Trillion
4 ≥ Rp 30 Trillion
Bank Mandiri is under “BUKU 4”. Minimum 70% loans and financing to the productive sector required to be met at the end of June 2016.
Branch Sub Branch Cash Office Total
Zone 1 21 347 88 456
Zone 2 42 1,040 60 1,142
Zone 3 15 200 16 231
Zone 4 30 319 16 365
Zone 5 18 229 8 255
Zone 6 13 130 9 152
Total 139 2,265 197 2,601
Branch Networking by Zone*
Bank Mandiri’s Capital Requirement Based on our Risk Profile Bank Mandiri Capital Requirment
*At October 31. 2012
60

Continuous End to End Improvement in the Micro Business
• Scorecard Refinement
•Training & Capacity Development of Managers
•MKA Revitalization (focus on credit analysis & verification)
•Loan Factory for Fixed Income Loan
•FIN-1 Collection System
•Change in Organization
•Crash Program for NPL debtors settlement
Origination & Targeting
Maintenance & Review
Collection
Operational Risk
Building New Business
•1,444 MKS/MMC/Back Office/Other Position and 247 Managers
•Biweekly RTTA (Risk. Threshold. Trigger & Action Plan) Review Forum
•Mobile Sales and Maintenance System for MKS
•Incentive Scheme Refinement
•Post Transaction Control (Welcome Call)
•Savings
•Pension Loans
•Joint Cooperation with Mandiri AXA General Insurance (MAGI)
•Joint Cooperation with Bank Syariah Mandiri (BSM) – for Gold Pawning
•3,720 EDC (hand held) rolled out
•Early Warning System Development
61

62
4.50 Million Cards Drove Rp 9.05 Tn in Transaction
Mandiri Visa & Mastercards and EOQ Receivables
3,5
75
3,7
61
3,9
10
4,2
96
4,2
45
4,4
92
4,5
90
5,0
35
5,0
25
5,1
95
5,3
03
5,6
20
5,5
57
6,8
55
7,5
66
8,2
88
8,3
44
8,7
51
8,6
83
8,9
70
8,7
68
8,7
61
8,6
74
9,1
28
9,0
48
2,081
2,1562,358
2,4462,570
2,6852,972
3,032
3,083
3,155
3,275
3,435
3,602
3,665
3,727
3,817
3,890
3,969
4,036
4,128
4,2564,364
4,498
1Q
'11
2Q
'11
3Q
'11
4Q
'11
1Q
'12
2Q
'12
3Q
'12
4Q
'12
1Q
'13
2Q
'13
3Q
'13
4Q
'13
1Q
'14
2Q
'14
3Q
'14
4Q
'14
1Q
'15
2Q
'15
3Q
'15
4Q
'15
1Q
'16
2Q
'16
3Q
'16
4Q
'16
1Q
'17
Receivables (Rp tn)
Cards (000s)
3,0
32
3,4
21
3,6
69
4,0
80
3,7
82
4,1
67
4,4
62
5,0
53
4,8
32
5,1
66
5,2
66
5,3
15
5,1
74
6,7
49
7,2
30
7,5
30
6,9
49
7,2
29
7,0
76
7,3
94
7,0
47
7,2
21
6,7
63
7,6
19
7,2
05
53
5356
5554
5353
5960
63 66 6976
125
171
302
303295
276
291
278257
247
271
298
1Q
'11
2Q
'11
3Q
'11
4Q
'11
1Q
'12
2Q
'12
3Q
'12
4Q
'12
1Q
'13
2Q
'13
3Q
'13
4Q
'13
1Q
'14
2Q
'14
3Q
'14
4Q
'14
1Q
'15
2Q
'15
3Q
'15
4Q
'15
1Q
'16
2Q
'16
3Q
'16
4Q
'16
1Q
'17
Transfer Balance
Cash Advance
Retail
Total Card Quarterly Sales by Type of Transaction (Rp Bn)

63
Strengthening Risk Management & Monitoring System
Corporate Customer by Rating Summary of Risk Management Initiatives
Credit
Market
Operational
• ORM implementation in all unit. incl. overseas offices & subsidiaries
• Bring Op. Risk top issues into Management• Review Op. Risk on new procedures & new products
• Development of risk measurement system for derivative & structured product (Summit)
• Implement Market Risk Internal Model• Intraday Limit Monitoring• Enhance Policy & Procedure for Treasury & ALM • Enhance FTP (Fund Transfer Pricing) method• Develop liquidity stress test & safety level• Develop measurement of capital for IRBB
• Wholesale Transaction: Optimize credit decision process by focusing on quantitative factors of analysis. redefining clear role of risk team . and aligning RM Organization into business expansion
• High Yield Business: Assign dedicated team. set up loan factory. enhanced business process (incl. tools. monitoring & collection system. policy )
• Optimize capital by implementing ERM & VBA• Consolidate risk management of subsidiaries
High Risk (Rating C- G)
Medium Risk (Rating BBB – B)
Low Risk (Rating AAA – A)
51%
64%68%
60%69%
91%84% 80% 81%
72%67% 70%
34%
24%21%
25%
24%
7%13%
16% 16%
24%
23% 20%
15% 12% 11%15%
7%2% 3% 4% 3% 4%
10% 10%
0%
20%
40%
60%
80%
100%
2006 2007 2008 2009 2010 2011 2012 2013 2014 2015 2016 2017

64
Key Quarterly Balance Sheet Items & Financial Ratios
* Bank Only
IDR billion / % (Cons) 1Q 2017 FY 2016 1Q 2016 YoY
Gross Loans 656,211 662,013 574,704 14.18%
Government Bonds 102,537 98,933 98,607 3.99%
Total Assets 1,034,307 1,038,706 906,739 14.07%
Customer Deposits 731,115 762,501 655,063 11.61%
Total Equity 151,824 153,370 118,047 28.61%
RoA – before tax (p.a.) 2.10% 1.96% 2.27% (7.49%)
RoE – after tax (p.a.) 10.56% 9.66% 12.64% (16.46%)
Cost to Income Ratio 42.68% 42.39% 44.46% (4.00%)
NIM (p.a.) 5.90% 6.44% 6.42% (8.10%)
LDR 89.52% 86.54% 87.42% 2.40%
Gross NPL / Total Loans 3.98% 4.00% 3.18% 25.16%
Provisions / NPLs 133.16% 124.46% 131.87% 0.98%
Tier 1 CAR * 20.04% 20.26% 15.70% 27.64%
Total CAR incl. Credit, Opr & Market Risk* 21.11% 21.38% 18.48% 14.23%
EPS (Rp) 175 592 164 6.90%
Book Value/Share (Rp) 6,507 6,573 5,059 28.62%

65
17
6.9
15
3.5
14
8.8
12
2.9
93
.1
92
.1
90
.6
89
.5
88
.3
88
.4
88
.2
88
.4
89
.1
86
.8
83
.5
82
.2
78
.1
78
.2
77
.9
78
.1
78
.5
78
.4
80
.4
77
.9
78
.9
79
.2
79
.6
82
.2
82
.2
90
.6
89
.0
87
.6
86
.2
10
0.1
10
0.1
10
1.1
10
3.9
98
.1
99
.1
10
2.4
98
.9
10
2.5
43
.0
48
.3
65
.4
65
.4
75
.9
10
6.9
11
7.7
13
8.5
17
4.5
17
5.2
18
1.6
18
8.3
19
8.5
20
1.9
21
8.0
23
1.9
24
6.2
25
1.8
27
6.7
29
7.5
31
4.4
32
7.2
35
0.4
36
5.2
38
8.8
39
1.6
42
8.7
45
0.8
47
2.4
47
0.4
48
5.8
50
6.5
53
0.0
53
2.8
55
2.8
56
0.6
59
5.5
57
4.7
61
0.9
62
5.1
66
2.0
65
6.2
27
.0 33
.46
0.5
36
.1
50
.6 64
.5
59
.2
91
.1
95
.7
84
.1
89
.0
89
.8
10
6.9
11
0.6
10
0.6
95
.3
12
5.5
13
6.1
12
0.3
12
6.4
15
9.1
14
1.3
14
0.9
14
5.3
16
7.9
16
9.7
16
3.9
16
7.1
17
8.4
16
8.4
19
0.1
20
4.1
23
8.9
23
5.4
26
1.2
24
4.1
21
0.7
23
4.0
26
1.5
24
7.6
27
7.8
27
5.6
0
100
200
300
400
500
600
700
800
900
1000
1100
1200
4Q
'00
4Q
'01
4Q
'02
4Q
'03
4Q
'04
4Q
'05
4Q
'06
4Q
'07
4Q
'08
1Q
'09
2Q
'09
3Q
'09
4Q
'09
1Q
'10
2Q
'10
3Q
'10
4Q
'10
1Q
'11
2Q
'11
3Q
'11
4Q
'11
1Q
'12
2Q
'12
3Q
'12
4Q
'12
1Q
'13
2Q
'13
3Q
'13
4Q
'13
1Q
'14
2Q
'14
3Q
'14
4Q
'14
1Q
'15
2Q
'15
3Q
'15
4Q
'15
1Q
'16
2Q
'16
3Q
'16
4Q
'16
1Q
'17
Government Bonds Loans Other Assets
75.4%75.4%
74.1%
60.6%
40.9%
47.1%
34.8%
13.4%11.2%
8.5%
6.1%
7.3%
7.2%
6.0%
6.5%
7.3%
7.7%
8.5%
8.0%
7.1%
6.9%7.7%
7.5%
7.4%
7.3%
7.6%
6.2%
6.6% 6.8%
19.0%19.0%
34.1%46.9%
50.1%52.2%
56.8%
57.2%
63.6% 68.3%
76.0%
71.7%
76.5%
75.5%79.5%
90.9%
83.4%
88.6%
87.9% 89.1%
88.6%84.6%
87.3%87.4%
85.5%
85.8%
86.1%85.3%
88.7%
86.3%85.3%
Int. from Bonds Int. from Loans
Total Assets Grew 14.1% Y-o-Y to Rp 1,034.31 TnTo
tal A
sset
s (R
pTn
)
Consolidated

66
Additional Factors
Aggregate of Rp 51.682 Tn (US$ 3.878 Bn) in written-off loans as of end-of March 2017, with significant recoveries and write back on-going:
2001: Rp 2.0 Tn 2002: Rp 1.1 Tn 2003: Rp 1.2 Tn 2004: Rp 1.08 Tn 2005: Rp 0.818 Tn (US$ 83.2m) 2006: Rp 3.408 Tn (US$ 378.5m)* 2007: Rp 1.531 Tn (US$ 249.3m) 2008: Rp 2.309 Tn (US$ 211.8m)
Q4 ‘09: Rp 0.775 Tn (US$ 82.5m) Q1 ‘10: Rp 0.287 Tn (US$ 31.6m) Q2 ‘10: Rp 0.662 Tn (US$ 73.0m) Q3 ‘10: Rp 0.363 Tn (US$ 40.7m)** Q4 ’10: Rp 1.349 Tn (US$149.7m) Q1 ‘11: Rp 0.468 Tn (US$53.8m) Q2 ‘11: Rp 0.446 Tn (US$51.9m) Q3 ‘11: Rp 0.508 Tn (US$57.8m) Q4 ‘11: Rp 0.78 Tn (US$86.1m) Q1’12: Rp 1.647 Tn (US$180.1m) Q2’12: Rp 0.721 Tn (US$76.8m) Q3’12: Rp 0.489 Tn (US$51.1m) Q4’12: Rp 0.885 Tn (US$91.8m)
Recoveries of Written off
Loans
Q1’13: Rp 0.918 Tn (US$94.5m) Q2’13: Rp 0.683 Tn (US$68.8m) Q3’13: Rp 0.630 Tn (US$54.4m) Q4’13: Rp 0.845 Tn (US$69.4m) Q1’14: Rp 0.552 Tn (US$48.7m) Q2’14: Rp 0.765 Tn (US$64.5m) Q3’14: Rp 0.566 Tn (US$46.4m) Q4’14: Rp 0.803 Tn (US$64.8m) Q1’15: Rp 0.553 Tn (US$42.4m) Q2’15: Rp 0.646 Tn (US$48.5m) Q3’15: Rp 0.751 Tn (US$51.3m) Q4’15 Rp 1.089 Tn (US$79.0m) Q1’16 Rp 0.570 Tn (US$43.0m) Q2’16 Rp 0.645 Tn (US$48.9m) Q3’16 Rp 0.833 Tn (US$63.8m) Q4’16 Rp 1.145 Tn (US$85.0m) Q1’17 Rp 0.686 Tn (US$51.5m)
* including the write-back of RGM loans totaling Rp 2.336 Tn** Including the write back of Kharisma Arya Paksi loans totaling Rp 0.124 Tn and Gde Kadek Rp 0.59Tn.

67
Summary Quarterly Balance Sheet 1Q 2017 – 1Q 2016
Summary BS1Q ’17 4Q ’16 3Q ’16 2Q ’16 1Q’16 Y-o-Y
Rp (tn) Rp (tn) Rp (tn) Rp (tn) Rp (tn) % Total Assets 1,034.31 1,038.71 975.16 971.44 906.74 14.1%
Cash 21.21 22.91 20.13 23.55 18.44 15.0%
Current Acc w/ BI & other banks 62.67 62.85 57.71 59.77 57.41 9.1%
Placement w/ BI & other banks 73.77 73.70 58.32 66.87 58.05 27.1%
Securities Net 58.63 56.55 55.42 49.14 45.55 28.7%
Government Bonds 102.54 98.93 102.43 99.09 98.61 4.0%
- Trading 3.07 2.43 3.52 2.71 2.46 25.0%
- AFS 89.99 80.33 79.25 76.85 75.04 19.9%
- HTM 9.47 16.17 19.66 19.53 21.11 (55.1%)
Loans 656.21 662.01 625.12 610.89 574.70 14.2%
- Performing Loans 630.10 635.54 601.34 587.30 556.42 13.2%
- Non-Performing Loans 26.11 26.48 23.78 23.58 18.29 42.8%
Allowances (34.76) (32.95) (30.09) (26.58) (24.10) 44.2%
Loans – Net 621.46 629.07 595.03 584.31 550.61 12.9%
Total Deposits – Non Bank 731.12 762.50 690.51 691.36 655.06 11.6%
- Demand Deposits 178.12 187.05 163.06 165.82 157.77 12.9%
- Savings Deposits 287.52 302.33 274.24 273.58 248.76 15.6%
- Time Deposits 265.47 273.12 253.22 251.96 248.54 6.8%
Shareholders’ Equity* 151.82 153.37 152.79 147.09 118.05 28.6%

68
Summary Quarterly P&L 1Q 2017 – 1Q 2016
Summary P&L
1Q 2017 1Q 2016 Y-o-Y 4Q 2016 Q-o-Q
Rp (Bn)% of
Rp (Bn)% of
(%) Rp (Bn)% of
(%)Av.Assets* Av.Assets* Av.Assets*
Interest Income 19,443 7.5% 18,308 8.1% 6.2% 19,825 7.6% (1.9%)
Interest Expense 6,627 2.6% 5,976 2.6% 10.9% 6,656 2.6% (0.4%)
Net Interest Income 12,816 5.0% 12,331 5.4% 3.9% 13,168 5.1% (2.7%)
Net Premium Income 614 0.2% 706 0.3% (13.1%) 357 0.1% 72.0%
Net Interest Income & Premium Income 13,430 5.2% 13,037 5.8% 3.0% 13,525 5.2% (0.7%)
Other Non Interest Income
*Other Fees and Commissions 2,996 1.2% 2,531 1.1% 18.4% 3,202 1.2% (6.4%)
*Foreign Exchange Gains – Net 653 0.3% 417 0.2% 56.7% 631 0.2% 3.6%
*Gain from Incr. in value of sec & sale of Gov.Bonds 262 0.0% 203 0.1% 29.0% 90 0.0% 192.0%
*Others 1,345 0.5% 1,052 0.5% 27.9% 1,899 0.7% (29.2%)
Total Non Interest Income 5,256 2.0% 4,203 1.9% 25.1% 5,822 2.2% (9.7%)
Total Operating Income 18,686 7.2% 17,240 7.6% 8.4% 19,347 7.5% (3.4%)
Provisions, Net (5,401) (2.1%) (4,596) (2.0%) 17.5% (8,734) (3.4%) (38.2%)
Personnel Expense (3,498) (1.4%) (3,406) (1.5%) 2.7% (3,435) (1.3%) 1.8%
G&A Expenses (3,401) (1.3%) (3,305) (1.5%) 2.9% (3,517) (1.4%) (3.3%)
Loss from decr in value of sec & Gov Bonds - - - - - - -
Other Expenses (965) (0.4%) (862) (0.4%) 12.0% (1,011) (0.4%) (4.5%)
Total Expense (7,864) (3.0%) (7,572) (3.3%) 3.9% (7,963) (3.1%) (1.2%)
Profit from Operations 5,421 2.1% 5,071 2.2% 6.9% 2,651 1.0% (104.5%)
Non Operating Income (24) 0.0% (5) 0.0% 391.4% (17) 0.0% 39.4%
Net Income Before Tax 5,397 2.1% 5,066 2.2% 6.5% 2,634 1.0% 104.9%
Net Income After Tax 4,079 1.6% 3,817 1.7% 6.9% 1,793 0.7% 127.4%

69
Breakdown of Interest Income & Interest Expense
Interest Income1Q ’17 1Q ’16 YoY 4Q ’16 QoQ
Rp (Bn) Rp (Bn) (%) Rp (Bn) (%)
Loans 14,561.94 14,018.79 3.9% 15,046 -3.2%
Government bonds 1,321.63 1,330.33 -0.7% 1,307 1.1%
Marketable Securities 591.24 507.09 16.6% 456 29.6%
Consumer financing 567.34 466.33 21.7% 542 4.7%
Placement at BI and other banks 380.00 269.59 41.0% 389 -2.3%
Others 570.67 383.71 48.7% 569 0.3%
Syariah Income 1,450.22 1,331.92 8.9% 1,517 -4.4%
Total 19,443.04 18,307.76 6.2% 19,825 -1.9%
Interest Expense1Q ’17 1Q ’16 YoY 4Q ’16 QoQ
Rp (Bn) Rp (Bn) (%) Rp (Bn) (%)
Time Deposits 3,920.06 3,907.48 0.3% 3,946 -0.7%
Savings 789.72 762.66 3.5% 765 3.3%
Current Account 803.56 497.98 61.4% 702 14.5%
Borrowings 463.09 425.59 8.8% 455 1.9%
Securities issued 245.99 103.45 137.8% 258 -4.5%
Subordinated loan 0.68 105.79 -99.4% 83 -99.2%
Others 403.74 173.51 132.7% 449 -10.1%
Total 6,626.84 5,976.46 10.9% 6,657 -0.4%
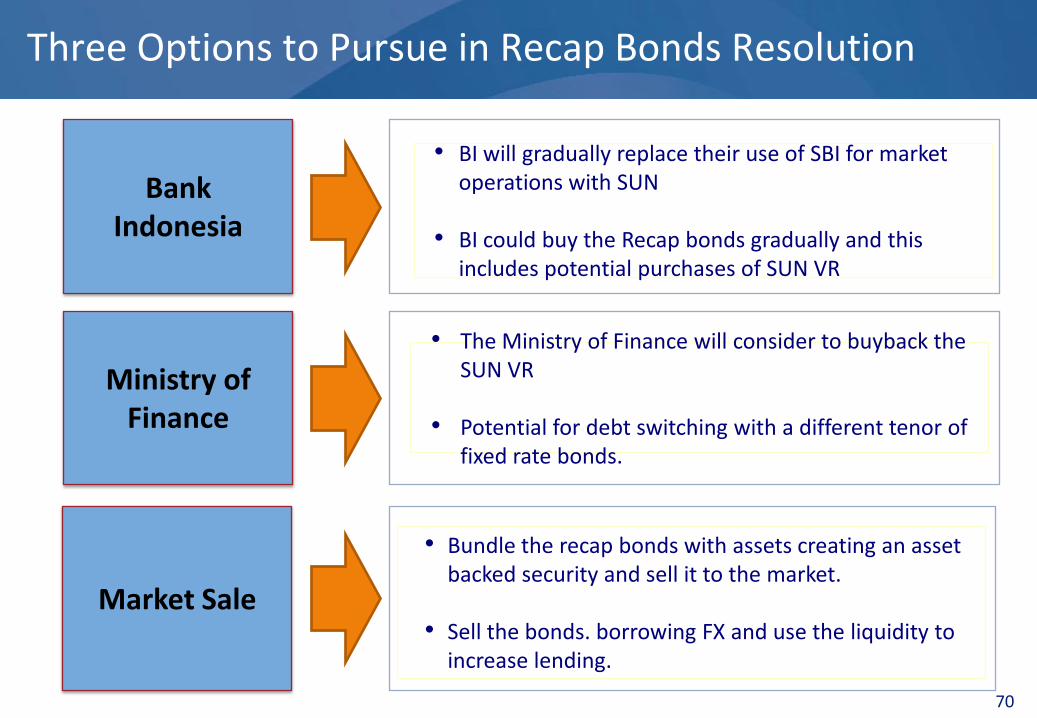
Ministry of Finance
Market Sale
Bank Indonesia
• BI will gradually replace their use of SBI for market operations with SUN
• BI could buy the Recap bonds gradually and this includes potential purchases of SUN VR
Three Options to Pursue in Recap Bonds Resolution
• The Ministry of Finance will consider to buyback the SUN VR
• Potential for debt switching with a different tenor of fixed rate bonds.
• Bundle the recap bonds with assets creating an asset backed security and sell it to the market.
• Sell the bonds. borrowing FX and use the liquidity to increase lending.
70

71
Government Bond Portfolio
Government Bond Portfolio by Type and Maturity (Rp 102,537 Bn)
1Q’17 Government Bond Gains/(Losses) (Rp Bn)
* Mark to Market impacts Profit# Mark to Market impacts Equity^ Nominal value
30.98
1.153.07
59.01
8.33
0102030405060708090
100
Trading* AFS# HTM^
Fixed Rate
Variable Rate
Bonds by Rate Type & Portfolio as of December (Rp 102,537 Bn)
1Q’16 2Q’16 3Q’16 4Q’16 1Q’17
Realized Gains/Losses
on Bonds
136.03 136.96 211.82 171.88 167.34
Unrealized Gains/Losses
on Bonds
-37.87 89.42 13.90 -53.15 70.78
Total 98.16 226.38 225.72 118.73 238.12
Maturity/Rp Bn
Trading Portfolio Available for Sale Held to MaturityNominal MTM Nominal MTM
Fixed Rate Bonds
< 1 year 236 236 8,012 8,067 2,721
1 - 5 year 452 473 23,082 24,376 4,008
5 - 10 year 1,124 1,176 17,663 18,661 1,270
> 10 year 1,162 1,188 7,490 7,901 330
Sub Total 2,973 3,074 56,247 59,006 8,329
Variable Rate Bonds
< 1 year - - 1,445 1,437 1,145
1 - 5 year - - 29,832 29,547 -
5 - 10 year - - - - -
> 10 year - - - - -
Sub Total - - 31,276 30,984 1,145
T o t a l 2,973 3,074 87,523 89,989 9,474

72
Ex-Recap Bond Portfolio. March 2017 – Bank Only
(Stated in Rp Millions)

73
Bank Mandiri Credit Ratings
Moody’s (February 2017) Fitch Rating (August 2016)
Outlook POSITIVE Issuer Default Rating BBB-
Bank Deposit Baa3/P-3 National LT Rating AAA(idn)
Baseline Credit Assessment Baa3 National ST Rating F1+(idn)
Adj. Baseline Credit Assessment Baa3 Viability Rating bb+
Counterparty Risk Assessment Baa2(cr)/P-2(cr) Support Rating Floor BBB-
Pefindo (June 2016) Standard & Poor’s (December 2015)
Outlook STABLE Outlook STABLE
LT General Obligation idAAA LT Foreign Issuer Credit BB+
Subordinated Debt idAA+ LT Local Issuer Credit BB+
ST Foreign Issuer Credit B
ST Local Issuer Credit B

74
Corporate Actions
DividendPayment
Net Profit for the financial year of 2016 of Rp13,806,565,442,570.80was distributed as follows:
• 45% or Rp6,212,954,449,156.86 for the annual dividend• Total Dividend Payment of Rp266.26948 per share
Schedule :a. Cum Date:
Regular and Negotiated Market: March 21, 2017Cash Market: March 24, 2017
b. Ex Date: Regular and Negotiated Market: March 22, 2017Cash Market: March 27, 2017
c. Recording Date: March 24, 2017d. Payment Date: April 13, 2017
Net Profit for the financial year of 2015 of Rp20,334,967,510,904.70was distributed as follows:
• 30% or Rp6,100,490,253,271.41 for the annual dividend• Total Dividend Payment of Rp261.44958 per share

75
1Q 2017 Movement in Category 1 and 2 Loans
54
8,2
08
8,058
2,088
91
33
2,620 894
53
8,6
66
Beg. Bal. D/G to 2 U/G from 2
D/G to NPL
U/G from NPL
Net Collection
FX Impact End Bal.
Category 1 Loan Movements (Rp Bn) – Bank Only Category 2 Loan Movements (Rp Bn) – Bank Only
21
,02
0
8,058
2,088
3,343
194
56332
23
,24
6
Beg. Bal. Cat. 1 D/G
U/G to 1 D/G to NPL
NPL U/G Net Collection
FX Impact End Bal.

76
1Q 2017 Loan Detail: Collectability by Segment
Loan Profile: 1Q Collectability (%) by SegmentBank Only
98.0%
84.1%91.0% 92.6% 90.5%
1.1%
5.4%
5.5%5.3% 7.6%
4.5%
0.5%0.6% 0.4%
0.7%
5.3%2.1% 0.7% 0.9%
Corp Comm Small Micro Cons
5
4
3
2
1
230,676
128,378
52,308 48,345
78,959
2,475
8,206
3,162 2,759
6,644
6,846
1,706
8,036
1,222 354
757
0
25,000
50,000
75,000
100,000
125,000
150,000
175,000
200,000
225,000
250,000
Corp Comm Small Micro Cons
Loan Profile: 1Q Collectability (Rp bn) by SegmentBank Only

77
NPL Loan Detail*: Quarterly by Days Past Due
0%
10%
20%
30%
40%
50%
60%
70%
Current (%)
<30 Days OD (%)
Quarterly D/G to NPL & Interest DPD - Bank Only
85
1
61
7
45
4
55
2
1,2
84
35
7
60
5
50
3
55
3
64
9
37
9
54
5
79
6
35
3
56
2
52
4
72
9
49
9
43
9
1,5
29
88
9
2,2
91
2,6
40
2,0
45
3,8
84
6,5
54
1,6
40
7,7
44
2,5
23
0
1,000
2,000
3,000
4,000
5,000
6,000
7,000
8,000
9,000
Q1
'10
Q2
'10
Q3
'10
Q4
'10
Q1
'11
Q2
'11
Q3
'11
Q4
'11
Q1
'12
Q2
'12
Q3
'12
Q4
'12
Q1
'13
Q2
'13
Q3
'13
Q4
'13
Q1
'14
Q2
'14
Q3
'14
Q4
'14
Q1
'15
Q2
'15
Q3
'15
Q4
'15
Q1
'16
Q2
'16
Q3
'16
Q4
'16
Q1
'17
Rp Bn Value
Quarterly NPL Stock & Interest DPD - Bank Only
3,5
89
3,6
68
3,9
85
3,9
29
4,3
01
4,2
61
4,9
83
4,8
05
4,9
27
4,6
43
4,6
44
4,4
96
4,8
12
4,8
63
5,0
06
4,9
65
5,2
94
5,3
51
5,2
66
5,5
98
6,0
77
7,2
83
9,2
73
9,4
71
11
,72
5
17
,12
4
17
,16
6
20
,19
9
20
,44
7
0
5,000
10,000
15,000
20,000
25,000
Q1
'10
Q2
'10
Q3
'10
Q4
'10
Q1
'11
Q2
'11
Q3
'11
Q4
'11
Q1
'12
Q2
'12
Q3
'12
Q4
'12
Q1
'13
Q2
'13
Q3
'13
Q4
'13
Q1
'14
Q2
'14
Q3
'14
Q4
'14
Q1
'15
Q2
'15
Q3
'15
Q4
'15
Q1
'16
Q2
'16
Q3
'16
Q4
'16
Q1
'17
Rp Bn Value
* Excluding Micro & Consumer Loans
0%
5%
10%
15%
20%
25%
30%
35%
40%
45%Current (%)
<30 Days OD (%)

78
19
,42
7
20
,91
4
20
,64
5
16
,56
0
17
,10
4
16
,04
6
14
,13
1
13
,50
8
11
,67
1
12
,43
7
13
,01
0
25
,54
8
31
,00
0
35
,84
6
42
,14
5
42
,97
9
2005
Add
Deduct
2006
Add
Deduct
2007
Add
Deduct
2008
Add
Deduct
2009
Add
Deduct
2010
Add
Deduct
2011
Add
Deduct
2012
Add
Deduct
2013
Add
Deduct
2014
Add
Deduct
2015
Add
Deduct
Q1'16
Add
Deduct
Q2'16
Add
Deduct
Q3'16
Add
Deduct
Q4'16
Add
Deduct
Q1'17
Others#
Write-Offs
Repayments
Restructuring
Balance
Rp4,150bn in Loans were Restructured in 1Q ‘17
IDR bn
Others# includes partial payments, FX impacts, and fluctuation in Working Capital facilities
Loans by Restructuring Type in 1Q 2017
Maturity extension;
96.7%Maturity extension
w/reduced rates; 1.2%
Maturity extension w/other restr'g*;
2.0%
*Other Restructuring includes reduction of interest rates, rescheduling of unpaid interest & extension of repayment period for unpaid interest
Restructured Loan Movement 2005 - 1Q2017
(Rp billions) Q3 ’15 Q4 ’15 Q1 ’16 Q2 ’16 Q3 ’16 Q4 ’16 Q1 ’17
Loans Restructured
4,850 2,781 6,352 6,139 7,997 9,671 4,150
NPLCollections
128 104 102 150 163 211 399

79
Improving Asset Quality and Portfolio Management
Reorganize SAM Group
Transfering Problem Loans
Resetting Risk Assessment
Criteria
Increase Monitoring Frequency
Intensify Cash Recovery
Key Areas Remarks
• Restructuring Unit
• Recovery Unit
Focus on preventing increasing NPLs. To solve temporary problems in business’s and take the necessary steps for loan restructuring.
• Transfering Problem Loans
Transfering problem loans from business units toSAM group to be handled more effectively. We willcontinue to review for more loans to transfer.
• Update Risk Assessment Criteria
Help to reset risk assessment criteria to supportbusiness units in improving the loan originationprocess.
• Loan Monitoring
• Early Warning System
• Incentives for Loan Repayment
• Auction Frequency• Asset Marketing Unit
• Achieve higher cash recovery than last year• Accelerate loan repayment by writing off interest
and penalty• Identify targeted buyers for specific assets
Preventiative actions to improve asset quality byincreasing standardized process and upgrading risktools

80
Business Services9%
Trading5%
Plantations
Manufacturing
Business Services
F&B Manufacturing
Chemical Manufacturing
Distribution Trading
Retail Trading
Others
Electricity
Trading
Construction
Transportation
Oil&Gas Mining
Raw Material Manufacture
Social Services
Loan Portfolio Sector Analysis, 1Q 2017
(1) Non-consolidated numbers* Each sector < 3%
* Excluding Micro & Consumer Loans Only

81
Credit Card Portfolio Showed Modest Decrease in 1Q ‘17
Mandiri Credit Card Delinquency Rates (%)
75.60
87.50
61.34 45.90
69.95
95.84
111.79
137.08
129.94
130.32
128.46
152.42
178.54
288.20
329.13
313.89
295.88295.04
292.91266.97
32.6
37.4
63.8
93.0
138.1
177.3
212.6212.9
197.8189.5
180.0
194.6
162.5
6.913.8
30.9
15.023.4
29.3 28.4
30.2
35.943.1
59.2
58.2
70.3
69.6
78.7
74.5
4Q
'05
4Q
'06
4Q
'07
4Q
'08
4Q
'09
4Q
'10
4Q
'11
4Q
'12
1Q
'13
2Q
'13
3Q
'13
4Q
'13
1Q
'14
2Q
'14
3Q
'14
4Q
'14
1Q
'15
2Q
'15
3Q
'15
4Q
'15
1Q
'16
2Q
'16
3Q
'16
4Q
'16
1Q
'17
NPLs (90+DPD)
Write-Offs
Recoveries
Quarterly Charge-offs, NPLs & Recoveries (Rp Bn)
10.2%
11.7%
6.0%
4.8% 4.7%5.2%
4.7%5.1% 4.9%
6.8% 6.7%6.4% 6.5%
6.2%
6.2%
5.7%
6.3%
5.3%
3.2%
2.3% 2.3%
2.7% 2.5%
2.6%2.4%
3.5%
3.8% 3.6%
3.3%
3.6%3.4% 3.4%
2.9%
3.0%
5.0%3.8%
2.2% 2.2%2.2%
2.2%
2.5% 2.4%
2.8% 2.9% 2.6%
2.4%2.4%2.0%
1.1% 1.1% 1.1% 1.2%1.3% 1.2%
1.6% 1.6% 1.5%
1.4% 1.3%
1.3%
1.4%
4Q
'05
4Q
'06
4Q
'07
4Q
'08
4Q
'09
4Q
'10
4Q
'11
4Q
'12
1Q
'13
2Q
'13
3Q
'13
4Q
'13
1Q
'14
2Q
'14
3Q
'14
4Q
'14
1Q
'15
2Q
'15
3Q
'15
4Q
'15
1Q
'16
2Q
'16
3Q
'16
4Q
'16
1Q
'17
30 DPD - Rp
90 DPD - Rp
30 DPD - Cards
90 DPD - Cards

82
Staffing and Distribution Network Growth
22
,90
9
25
,23
6
27
,90
7
30
,76
2
33
,98
2
34
,69
6
36
,73
7
37
,17
3
37
,76
0
38
,37
6
38
,94
0
38
,70
6
20
09
20
10
20
11
20
12
20
13
20
14
20
15
1Q
'16
2Q
'16
3Q
'16
4Q
'16
1Q
'17
1,0
95
1,3
70
1,5
37
1,8
10
2,0
50
2,3
12
2,4
57
2,4
60
2,4
72
2,5
05
2,5
99
2,6
01
20
09
20
10
20
11
20
12
20
13
20
14
20
15
1Q
'16
2Q
'16
3Q
'16
4Q
'16
1Q
'17
Employees
Domestic Branch Network
ATM Network
ATM-Link Network
4,9
96
6,4
96
8,9
96
10
,98
5
11
,51
4
15
,34
4
17
,38
8
17
,45
2
17
,46
1
17
,46
1
17
,46
1
17
,69
4
20
09
20
10
20
11
20
12
20
13
20
14
20
15
1Q
'16
2Q
'16
3Q
'16
4Q
'16
1Q
'17
12
,66
6
18
,32
1
22
,79
4
35
,30
0
39
,85
4
47
,32
7
53
,95
7
58
,13
2
58
,60
2
59
,42
5
60
,50
8
60
,74
0
20
09
20
10
20
11
20
12
20
13
20
14
20
15
1Q
'16
2Q
'16
3Q
'16
4Q
'16
1Q
'17

83
1Q 2017 Loan Detail*: Downgrades to NPL
3
4
5
Current
31-60 Days
61-90 Days
>90 Days
Mfg-Chem
Trad-Retail
Mfg-Metal
Trad-Distr
Others
EntertaimentOil & GasTrad-Dom
ConstrTrans
FX
RP
Invest
Program
WC
Corporate
Commercial
SmallBusiness
0%
10%
20%
30%
40%
50%
60%
70%
80%
90%
100%
Collect. Int. Aging Sector Currency Purpose Segment
Loan Profile: 1Q NPL Downgrades Only (Rp 2,523 Bn) Bank OnlyCorporate, Commercial & Small
Business loans downgraded to NPL in
1Q totaled Rp 2,523 Bn. Of these loans:
30.1% were more than 90 days overdue on interest payments
70.4% came from our Commercial Portfolio
Largest downgrades by sector:
Chemicals Manufacturing
Retail Trading
Metal Manufacturing
90.8% were IDR loans
71.2% were Working Capital loans, 28.1% were Investment Loans
* Excluding Micro & Consumer Loans Only

84
1Q 2017 Loan Detail*: Non-Performing Loans
3
4
5
Current
<30 Days
31-60 Days
61-90 Days
>90 Days
Trad-Distr
Mfg-F&B
Mfg-Chem
Mfg-Text
Trad-Ret
Mfg
MiningOil & Gas
Mass Trans
Others
Mfg-P&PConstrTrading
Agri
FX
RP
Consumer
Invest
Syndication
WC
Corporate
Commercial
SmallBusiness
0%
10%
20%
30%
40%
50%
60%
70%
80%
90%
100%
Collect. Int. Aging Sector Currency Purpose Segment
Loan Profile: 1Q Non-Performing Loans Only (Rp 20,447 Bn) Bank Only
25.3% remain current on interest payments and an additional 23.5% are less than 90 days overdue
78.8% are to Commercial customers
70.4% are Working Capital loans and 26.8% are Investment loans
Primary sectors are: Trading Distributions Food & Beverages
Manufacturing Chemicals Manufacturing
86.0% are Rp loans
37.7% are Cat. 3 & 8.7% are Cat. 4
Corporate, Commercial & Small Business
NPLs totaled Rp 20,447 Bn in 1Q.
Of these NPLs in 1Q:
* Excluding Micro & Consumer Loans Only

85
1Q 2017 Loan Detail*: Downgrades to Cat. 2
Commercial
SmallBusiness
Current
1 Day
<30 Days
31-60 Days
61+ Days
Trad-Distr
Trad-Ret
Mfg-RawM
Mfg-Chem
Mass Trans
Mfg-Text
Others
Soc Serv
Constr
MfgBus ServTrading
FX
RP
Export
Invest
WC
2000-2004
>2004
0%
10%
20%
30%
40%
50%
60%
70%
80%
90%
100%
Segment Days Aging Sector Currency Purpose Origin Year
Loan Profile: 1Q Downgrades to Cat. 2 Only (Rp 4,646 Bn) Bank OnlyRp 4,646 Bn in Corporate, Commercial &
Small Business loans were downgraded
to Category 2 in 1Q. Of the Special
Mention Loans downgraded:
61.3% are for Commercial & 38.7% are to Small Business customers
29.4% are current & 50.4% are less than 30 days overdue in interest payments
Primary sectors downgraded are: Trading Distribution Retail Trading Raw Material Manufacturing
99.0% are RP loans
78.3% are Working Capital loans
* Excluding Micro & Consumer Loans Only

86
1Q 2017 Loan Detail*: Category 2 LoansLoan Profile: 1Q Category 2 Loans Only (Rp 13,842 Bn) Bank Only
Rp 13,842 Bn in Corporate, Commercial
& Small Business loans were in
Category 2 in 1Q. Of these Special
Mention loans:
59.3% are to Commercial customers
61.2% are current or 1 day overdue, with an additional 22.4% less than 30 days overdue
Primary sectors in Category 2 are: Raw Materials Manufacturing Chemicals Manufacturing Trading Distribution
82.2% are Rp loans
71.5% are Working Capital loans
59.3% were Category 2 in 1Q ‘17
* Excluding Micro & Consumer Loans Only
Corporate
Commercial
SmallBusiness
Current
1 Day
<30 Days
31-60 Days
61- 90 Days
Mfg-RawM
Mfg-Chem
Trad-Distr
Mfg-Metal
Trad-Ret
Others
Mfg-Text
Mass Trans
Plantations
ConstrMining
FX
RP
Export
Invest
WC
2000-2004
>2004
0%
10%
20%
30%
40%
50%
60%
70%
80%
90%
100%
Segment Days Aging Sector Currency Purpose Origin Year

87
1Q 2017 Loan Detail*: Upgrades to PL
1
2
Commercial
Corporate
SmallBusiness
MfgTextile
Mass Trans
Trad-RetTradingSoc Serv
RPInvest
WC
>2004
2000-2004
0%
10%
20%
30%
40%
50%
60%
70%
80%
90%
100%
Collect. Segment Sector Currency Purpose Origin Year
Loan Profile: 1Q Upgrades to PL (Rp 451.6 Bn) Bank OnlyCorporate, Commercial & Small
Business loans upgraded to PL in 1Q
totaled Rp 451.6 Bn. Of these loans:
72.7% are to Corporate customers
96.1% upgraded loans originated later than 2004
Largest upgrades by sector:
Plantations
Mass Transportation
Retail Trading
100.0% are Rp loans
7.6% are Working Capital loans; 92.4% were Investment loans
* Excluding Micro & Consumer Loans Only

88
1Q 2017 Loan Detail*: Performing Loans
1
2
Corporate
Commercial
SmallBusiness
Mfg
Plantations
Bus Serv
Mfg-F&B
Mfg-Chem
Trad-Ret
Others
Trad-Distr
Electricity
Trading
Constr
Trans
Mining-Oil & Gas
Soc Serv
FX
RP
ConsumerExport
Invest
Program
Syndication
WC
2000-2004
>2004
0%
10%
20%
30%
40%
50%
60%
70%
80%
90%
100%
Collect. Segment Sector Currency Purpose Origin Year
Loan Profile: 1Q Performing Loans Only (Rp 425,204 Bn) Bank OnlyRp 425,204 Bn in Corporate, Commercial
& Small Business loans were performing
in 1Q. Of these performing loans:
54.8% are to Corporate customers & 32.1% are to Commercial customers
97.2% originated since 2005
Primary sectors are:
Manufacturing
Plantations
Business Services
79.7% are Rupiah loans
47.4% are Working Capital loans; 35.8% are Investment loans
* Excluding Micro & Consumer Loans Only

1
2
3
4
5
Current
<30 Days
31-60 Days
61-90 Days
>90 Days
Plantations
Mfg-Chem
Trad-Distr
Mfg-RawM
Bus Serv
Mass Trans
Others
Trad-Oth
Mfg-Metal
Mfg-F&B
MiningOil & Gas
Mining-Coal
Mfg-Text
Rp
Fx
WC
Invest
Commercial
SmallBusiness
Corporate
0%
10%
20%
30%
40%
50%
60%
70%
80%
90%
100%
Collect. Int Aging Sector Currency Purpose Segment89
1Q 2017 Loan Detail*: Restructured LoansLoan Profile: 4Q Restructured Loans Only (Rp42,979 Bn) Bank Only
Of the remaining Rp 42,979 billion in restructured wholesale loans in 1Q :
65.6% are Performing
73.0% of Restructured Loans are current in interest payments
Primary sectors are:
Plantations
Chemical Manufacturing
Distribution Trading
79.2% are Rp loans
49.9% are Working Capital loans
65.9% are to Commercial customers
* Wholesale Loans Only

90
1Q 2017 Loan Detail: Corporate Loans
99.1% are performing loans, with 1.1% in Category 2
93.4% Category 2 loans are current in interest payments
Primary sectors in Corporate are: Plantations Food & Beverages
Manufacturing Electricity
69.4% are Rupiah loans
40.7% are Investment loans; 35.7% are Working Capital loans
Loan Profile: 1Q Corporate Loans Only (Rp 235,447 Bn) Bank OnlyRp 235,447 billion in loans were in the Corporate portfolio in 1Q. Of the Corporate Loans in 1Q :
1
25
Current
31-60 Days
Plantations
Mfg-F&B
Electricity
Bus Serv
Mfg
Mfg-Chem
MiningOil & Gas
Others
Trading
Mining Oil & Gas
Mining
Trad-Ret
Roads&Bridge
FX
RP
Export
Invest
Syndication
WC
2000-2004
>2004
0%
10%
20%
30%
40%
50%
60%
70%
80%
90%
100%
Collect. Cat. 2 Int. Aging Sector Currency Purpose Origin Year

91
1Q 2017 Loan Detail: Commercial Loans
1
2
345
Current
61+ Days
Trad-Distr
Bus Serv
Mfg
Plantations
Mfg-Chem
Trading
Mass Trans
Others
Mfg-RawM
Mfg-F&B
Mfg-Metal
Mining
Constr
FX
RP
ConsumerExport
Invest
Syndication
WC
2000-2004
>2004
0%
10%
20%
30%
40%
50%
60%
70%
80%
90%
100%
Collect. Cat. 2 Int. Aging Sector Currency Purpose Origin Year
89.0% are performing loans, with 5.4% in Category 2
67.2% of Category 2 loans are current in interest payments
Primary sectors in Commercial are: Trading Distribution Business Services Manufacturing
89.3% are Rupiah loans
60.5% are Working Capital loans, 34.1% are Investment loans
Loan Profile: 1Q Commercial Loans Only (Rp 152,695 Bn) Bank OnlyRp152,695 Billion in loans were in the Commercial portfolio in 1Q. Of the Commercial Loans in 1Q:

92
1Q 2017 Loan Detail: Small Business Loans
1
245
Current
<30 Days
61+ Days
Trad-Ret
Trad-Distr
Household Equip.
Plantations
Mfg
Others
Bus Serv
Trad-Dom
ConstrSoc Serv
FX
RP
Consumer
Export
Invest
Program
WC
2000-2004
>2004
0%
10%
20%
30%
40%
50%
60%
70%
80%
90%
100%
Collect. Cat. 2 Int. Aging Sector Currency Purpose Origin Year
96.5% are performing loans, with 5.5% in Category 2
20.3% of Category 2 loans are current in interest payments
Primary sectors in Small Business are: Retail Trading Distribution Trading Household Equipment
98.9% are Rupiah loans
68.9% are Working Capital loans
Loan Profile: 1Q Small Business Loans Only (Rp 57,509 Bn) Bank OnlyRp 57,509 Bn in loans were in the Small Business portfolio in 1Q of the Small Business Loans in 1Q:

93
1Q 2017 Loan Detail*: Rupiah Loans
1
235
Current
31-60 Days61+ Days
Plantations
Mfg
Bus Serv
Trad-Ret
Trad-Distr
Mfg-F&B
Others
Mfg-Chem
Constr
Electricity
Trans
Trading
Corporate
Commercial
SmallBusiness
ConsumerExport
Invest
Syndication
WC
2000-2004
>2004
0%
10%
20%
30%
40%
50%
60%
70%
80%
90%
100%
Collect. Cat. 2 Int. Aging Sector Segment Purpose Origin Year
95.1% are performing loans, with 3.2% in Category 2
52.8% of Category 2 loans are current in interest payments
Primary sectors in Rupiah loans are: Plantations Manufacturing Business Services
45.8% are Corporate loans
54.8% are Working Capital loans, 34.0% Investment loans
Loan Profile: 1Q Rupiah Loans Only (Rp 356,507 Bn) Bank OnlyRp 356,507 billion in loans were Rupiah denominated in 1Q Of the Rupiah Loans in 1Q:
* Excluding Micro & Consumer Loans Only

94
1Q 2017 Loan Detail*: FX Loans
1
235
Current
<30 Days
MiningOil & Gas
Soc Serv
MiningMetal Ore
Mfg-Chem
Trading
Mfg-F&B
MiningMetal Ore
Mfg-RawM
Mfg
Plantations
Mass Trans
Mfg-Metal
Corporate
Commercial
SmallBusiness
Export
Invest
Syndication
WC
2000-2004
>2004
0%
10%
20%
30%
40%
50%
60%
70%
80%
90%
100%
Collect. Cat. 2 Int. Aging Sector Segment Purpose Origin Year
96.8% are performing loans
100.0% of Category 2 loans are current in interest payments
Primary sectors in FX loans are: Oil & Gas Mining Social Services Metal Ore Mining
80.9% are Corporate loans
40.6% are Investment loans; 23.4% are Working Capital loans
Loan Profile:1Q FX Loans Only (Rp89,145 Bn) Bank OnlyRp 89,145 Bn in loans were FX denominated in 1Q. Of the FX Loans in 1Q:
* Excluding Micro & Consumer Loans Only

95
Loan growth, Quality & Provisioning Relative to Peers Bank Only, As of December 2016
22
9%
17
0%
14
6%
13
1%
12
2%
11
3%
10
1%
86
%
52
%
45
%
BC
A
BR
I
BN
I
Man
diri
Perm
ata
CIM
B N
iaga
Dan
amo
n
Pan
in
Mayb
ank
BTN
Ratio of Provisions to NPL(%)
63
5,3
04
59
2,6
69
41
6,2
79
37
2,6
21
17
4,8
06
16
4,4
46
12
2,3
00
10
9,8
86
10
4,6
21
95
,91
5
BR
I
Man
diri
BC
A
BN
I
CIM
B N
iaga
BTN
Pan
in
Mayb
ank
Perm
ata
Dan
amo
n
Total Loans(Rp bn)
Loan Growth (%)
0.3
%
0.4
%
0.7
%
1.1
%
1.4
%
1.9
%
2.0
%
2.2
%
2.2
%
2.4
%
BC
A
BN
I
Pan
in
BR
I
Man
diri
BTN
Dan
amo
n
CIM
B N
iaga
Perm
ata
Mayb
ank
NPL Ratio (Net)(%)
10
2.7
%
95
.4%
91
.0%
90
.4%
90
.1%
88
.9%
87
.8%
85
.9%
80
.5%
77
.1%
BTN
CIM
B N
iaga
Dan
amo
n
BN
I
Pan
in
Mayb
ank
BR
I
Man
diri
Perm
ata
BC
A
Loan to Deposit Ratio(%)
1.3
%
2.0
%
2.8
%
2.9
%
3.0
%
3.5
%
3.6
%
3.9
%
4.0
%
8.8
%
BC
A
BR
I
BTN
Pan
in
BN
I
Dan
amo
n
Mayb
ank
CIM
B N
iaga
Man
diri
Perm
ata
NPL Ratio (Gross)(%)
Average
20
.9%
18
.3%
13
.8%
10
.6%
7.3
%
6.2
%
6.0
%
1.7
%
-6.7
%
-17
.9%
BN
I
BTN
BR
I
Man
diri
BC
A
Mayb
ank
Pan
in
CIM
B N
iaga
Dan
amo
n
Perm
ata

96
Asset and Liability Mix Relative to PeersBank Only, As of December 2016
1.9
%
3.0
%
3.1
%
3.4
%
4.3
%
4.7
%
5.5
%
5.6
%
6.0
%
6.1
%
BC
A
BN
I
Man
diri
BR
I
Dan
amo
n
CIM
B N
iaga
Mayb
ank
Pan
in
BTN
Perm
ata
79
.6%
78
.7%
75
.4%
72
.2%
71
.9%
71
.2%
70
.6%
69
.8%
66
.9%
66
.5%
BTN
CIM
B N
iaga
Mayb
ank
BN
I
Pan
in
Dan
amo
n
Man
diri
BR
I
BC
A
Perm
ata
77
.0%
66
.0%
65
.5%
60
.6%
52
.9%
51
.0%
46
.6%
44
.5%
40
.6%
39
.1%
BC
A
Man
diri
BN
I
BR
I
BTN
CIM
B N
iaga
Dan
amo
n
Perm
ata
Mayb
ank
Pan
in
96
4,0
01
91
8,1
82
66
2,5
95
56
4,8
45
23
6,9
52
21
4,1
68
18
3,7
15
16
5,2
40
15
5,0
11
14
9,4
35
BR
I
Man
diri
BC
A
BN
I
CIM
B N
iaga
BTN
Pan
in
Perm
ata
Mayb
ank
Dan
amo
n
Loans to Total Earning Assets(%)
Cost of Funds (p.a.)(%)
Total Assets(Rp bn)
Low Cost Deposit Ratio(%)
10
.6%
10
.2%
9.6
%
9.5
%
9.1
%
8.9
%
8.9
%
8.6
%
8.5
%
8.1
%
BR
I
Dan
amo
n
Pan
in
BTN
CIM
B N
iaga
Mayb
ank
Perm
ata
BN
I
Man
diri
BC
A
Yield on Assets (p.a.)(%)
72
3,8
45
68
7,9
50
53
0,1
65
41
2,1
48
17
0,0
32
14
7,9
92
13
5,7
70
11
7,1
32
10
8,4
16
10
1,5
67
BR
I
Man
diri
BC
A
BN
I
CIM
B N
iaga
BTN
Pan
in
Perm
ata
Mayb
ank
Dan
amo
n
Total Deposits(Rp tn)
Average
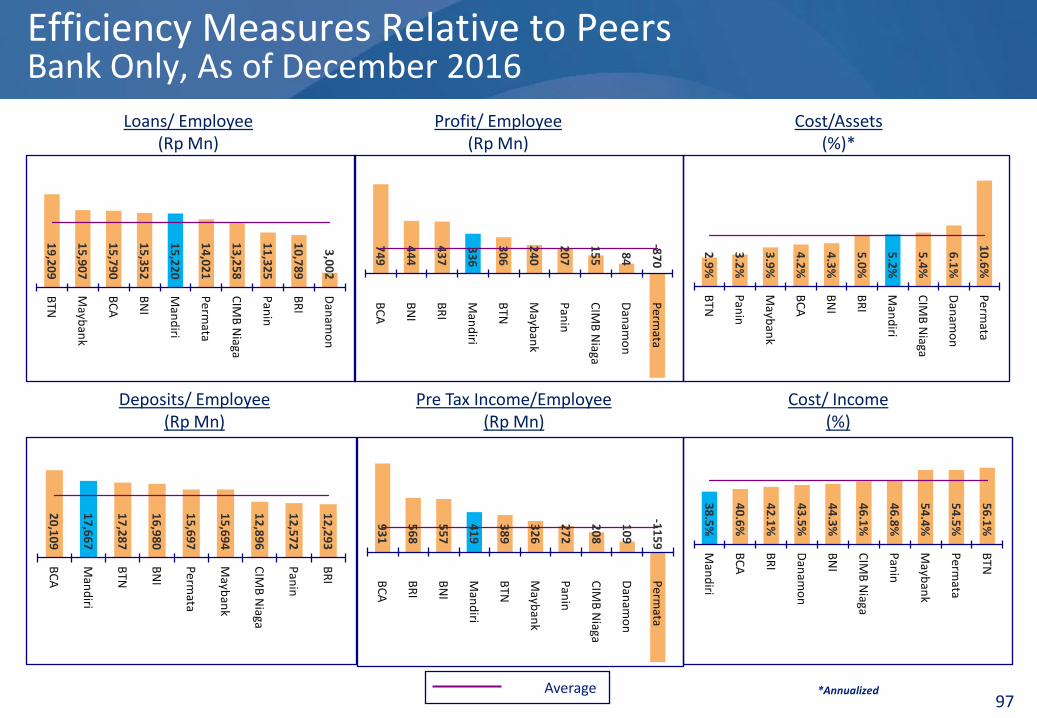
97
Efficiency Measures Relative to PeersBank Only, As of December 2016
38
.5%
40
.6%
42
.1%
43
.5%
44
.3%
46
.1%
46
.8%
54
.4%
54
.5%
56
.1%
Man
diri
BC
A
BR
I
Dan
amo
n
BN
I
CIM
B N
iaga
Pan
in
Mayb
ank
Perm
ata
BTN
74
9
44
4
43
7
33
6
30
6
24
0
20
7
15
5
84
-87
0
BC
A
BN
I
BR
I
Man
diri
BTN
Mayb
ank
Pan
in
CIM
B N
iaga
Dan
amo
n
Perm
ata
20
,10
9
17
,66
7
17
,28
7
16
,98
0
15
,69
7
15
,69
4
12
,89
6
12
,57
2
12
,29
3
BC
A
Man
diri
BTN
BN
I
Perm
ata
Mayb
ank
CIM
B N
iaga
Pan
in
BR
I
19
,20
9
15
,90
7
15
,79
0
15
,35
2
15
,22
0
14
,02
1
13
,25
8
11
,32
5
10
,78
9
3,0
02
BTN
Mayb
ank
BC
A
BN
I
Man
diri
Perm
ata
CIM
B N
iaga
Pan
in
BR
I
Dan
amo
n
Profit/ Employee(Rp Mn)
Cost/ Income(%)
Loans/ Employee(Rp Mn)
Deposits/ Employee(Rp Mn)
93
1
56
8
55
7
41
9
38
9
32
6
27
2
20
8
10
9
-11
59
BC
A
BR
I
BN
I
Man
diri
BTN
Mayb
ank
Pan
in
CIM
B N
iaga
Dan
amo
n
Perm
ata
Pre Tax Income/Employee(Rp Mn)
2.9
%
3.2
%
3.9
%
4.2
%
4.3
%
5.0
%
5.2
%
5.4
%
6.1
%
10
.6%
BTN
Pan
in
Mayb
ank
BC
A
BN
I
BR
I
Man
diri
CIM
B N
iaga
Dan
amo
n
Perm
ata
Cost/Assets(%)*
*AnnualizedAverage

98
Measures of Scale and Returns Relative to PeersBank Only, As of December 2016
23
.1%
20
.5%
18
.4%
15
.5%
11
.8%
11
.1%
8.6
%
7.9
%
6.9
%
-38
.3%
BR
I
BC
A
BTN
BN
I
Mayb
ank
Man
diri
Pan
in
Dan
amo
n
CIM
B N
iaga
Perm
ata
2,5
99
2,0
60
1,8
14
1,2
35
1,2
11
89
0
57
5
56
5
42
8
33
1
Man
diri
BR
I
BN
I
Dan
amo
n
BC
A
BTN
CIM
B N
iaga
Pan
in
Mayb
ank
Perm
ata
8.3
%
7.2
%
6.8
%
6.3
%
6.2
%
5.5
%
5.0
%
4.9
%
4.6
%
3.9
%
BR
I
Dan
amo
n
BC
A
Man
diri
BN
I
CIM
B N
iaga
BTN
Pan
in
Mayb
ank
Perm
ata
58
,88
5
38
,94
0
31
,95
0
26
,36
4
24
,27
2
13
,18
5
10
,79
9
8,5
61
7,4
62
6,9
08
BR
I
Man
diri
Dan
amo
n
BC
A
BN
I
CIM
B N
iaga
Pan
in
BTN
Perm
ata
Mayb
ank
Branches
Return on Equity (After Tax)(%)
Employees
Net Interest Margins(%)
4.0
%
3.8
%
2.7
%
2.3
%
2.0
%
1.8
%
1.7
%
1.5
%
1.2
%
-4.9
%
BC
A
BR
I
BN
I
Dan
amo
n
Man
diri
BTN
Pan
in
Mayb
ank
CIM
B N
iaga
Perm
ata
Return on Assets (Before Tax)(%)
24
,49
2
17
,46
1
17
,20
7
17
,05
6
3,7
04
1,9
00
1,6
33
1,5
24
1,0
12
99
9
BR
I
Man
diri
BC
A
BN
I
CIM
B N
iaga
BTN
Mayb
ank
Dan
amo
n
Perm
ata
Pan
in
ATMs
Average

Notes
…………………………………………………………………………………………..
…………………………………………………………………………………………..
…………………………………………………………………………………………..
…………………………………………………………………………………………..
…………………………………………………………………………………………..
…………………………………………………………………………………………..
…………………………………………………………………………………………..
…………………………………………………………………………………………..
…………………………………………………………………………………………..
…………………………………………………………………………………………..
99

Notes
…………………………………………………………………………………………..
…………………………………………………………………………………………..
…………………………………………………………………………………………..
…………………………………………………………………………………………..
…………………………………………………………………………………………..
…………………………………………………………………………………………..
…………………………………………………………………………………………..
…………………………………………………………………………………………..
…………………………………………………………………………………………..
…………………………………………………………………………………………..
100

Notes
…………………………………………………………………………………………..
…………………………………………………………………………………………..
…………………………………………………………………………………………..
…………………………………………………………………………………………..
…………………………………………………………………………………………..
…………………………………………………………………………………………..
…………………………………………………………………………………………..
…………………………………………………………………………………………..
…………………………………………………………………………………………..
…………………………………………………………………………………………..
101

The analysts listed above actively follow Bank Mandiri, but not all have issued research reports or formally initiated coverage.
Equity Research Contact Details
BROKERAGE ANALYST TELEPHONE E-MAIL
BAHANA SECURITIES Henry Wibowo 62 21 250 5081 ext. 3622 [email protected]
BANK OF AMERICA-MERRILL LYNCH Anand Swaminathan 65 6678 0419 [email protected]
BCA SEKURITAS Igor Nyoman Putra 62 21 2358 7222 [email protected]
CIMB SECURITIES Jovent Giovanny 62 21 515 1330 ext. 262 [email protected]
CITI INVESTMENT RESEARCH Salman Ali 62 21 2924 9219 [email protected]
CLSA LIMITED Sarina Lesmina 62 21 2554 8820 [email protected]
CREDIT SUISSE Sanjay Jain 852 2101 6088 [email protected]
DANAREKSA SEKURITAS Adriana Indrajatri 62 21 2955 5777 [email protected]
DBS VICKERS SECURITIES Lim Sue Lin 603 2711 0971 [email protected]
DEUTSCHE VERDHANA SECURITIES Raymond Kosasih 62 21 2964 4525 [email protected]
GOLDMAN SACHS (ASIA) Ben Koo 65 6889 2483 [email protected]
HSBC LTD Loo KarWeng 65 6239 0654 [email protected]
INDO PREMIER SECURITIES Stephan Hasjim 62 21 5793 1168 [email protected]
J.P. MORGAN ASIA Harsh Modi 65 6882 2450 [email protected]
KIM ENG SECURITIES Rahmi Marina 62 21 2557 1188 [email protected]
MACQUARIE CAPITAL SECURITIES INDONESIA Jayden Vantarakis 62 21 2598 8310 [email protected]
MIRAE ASSET SEKURITAS Taye Shim 62 21 515 3281 [email protected]
MORGAN STANLEY Mulya Chandra 62 21 3048 8125 [email protected]
SANFORD C. BERNSTEIN Kevin Kwek 65 6230 4650 [email protected]
UBS Joshua Tanja 62 21 574 0111 [email protected]
UOB KAY HIAN Alexander Margaronis 62 21 2993 3876 [email protected]

PT Bank Mandiri (Persero) Tbk
PLAZA MANDIRIJl. Jend. Gatot Subroto Kav.36-38Jakarta 12190, IndonesiaTel: 62-21 526 5045Fax: 62-21 527 4477, 527 5577Call Center: 14000www.bankmandiri.co.id
Contact Information:Investor Relations
Tel: +62 21 524 5085Fax: +62 21 5290 4249
E-mail: [email protected]://ir.bankmandiri.co.id
Corporate SecretaryTel: +62 21 524 5740
Fax:: +62 21 526 8246
Top Related
Copyright © 2022 FDOKUMEN

